Article

Synthesis and Characterization of Polymeric (PMMA-PVA) Hybrid Thin Films Doped with TiO2 Nanoparticles Using Dip-Coating Technique

1
Department of Physical Sciences, Jordan University of Science & Technology, P.O. Box 3030, Irbid 22110, Jordan
2
Department of Physics, Yarmouk University, Irbid 21163, Jordan
3
Department of Physics, Khalifa University of Science and Technology, Abu Dhabi 127788, UAE
*
Author to whom correspondence should be addressed.
Crystals 2021, 11(2), 99; https://doi.org/10.3390/cryst11020099
Submission received: 11 January 2021 / Revised: 18 January 2021 / Accepted: 20 January 2021 / Published: 24 January 2021
(This article belongs to the Special Issue Sol-Gel Method Applied to Crystalline Materials)

Abstract

:
We report the synthesis of hybrid thin films based on Poly(MethylMethAcrylate) (PMMA) and Poly(VinylAlcohol) (PVA), doped with different concentrations of titanium dioxide nanoparticles (TiO2 NPs). As-prepared thin films of (PMMA-PVA) doped by TiO2 NPs (wt.% = 2%, 4%, 8%, and 16%) are deposited on glass substrate. Transmittance (T%), reflectance (R%), absorption coefficient (α), optical constants (n and k), and optical dielectric functions (ε1 and ε2) are deduced using the experimental transmittance and reflectance spectra. Furthermore, a combination of classical models such as Tauc, Urbach, Spitzer-Fan, and Drude models are applied to calculate the optical and optoelectronic parameters and the energy gaps of the prepared nanocomposite thin films. The optical bandgap energy of PMMA-PVA thin film is found to be 4.101 eV. Incorporation of TiO2 NPs into PMMA-PVA polymeric thin films leads to a decrease in the optical bandgap and thus bandgap engineering is possible. Fourier-transform infrared spectroscopy (FTIR) transmittance spectra of thin films are measured and interpreted to identify the vibrational modes. To elucidate the chemical stability, thermogravimetric (TGA) curves are measured. We found that (PMMA-PVA)/TiO2 NPs polymeric thin films are thermally stable below 110 °C enable them to be attractive for a wide range of optical and optoelectronic applications.

1. Introduction

Hybrid Polymeric nanocomposite thin films have gained much attention owing to their unusual physical, chemical, and optical properties. Merging metal nanoparticles with polymers boosts the optical properties and modifies the mechanical behavior of the polymer composite [1]. The architected polymeric wave guides require a minor adjustment of the refractive index to accomplish total reflectance and henceforward effective wave guiding. Nevertheless, the discrepancy in the values of refractive index between the polymeric matrix and the semiconductor host results in Fresnel losses. This could be compensated by using polymeric material of a high refractive index [2]. The advancement of polymeric composite thin films is basically determined by the selection of ionic fillers and optimum filler loads. Consequently, a nanocomposite thin film of enhanced refractive index is obtained. For high refractive index-polymer to operate effectively, it should also often exhibit higher optical transparency [3,4,5]. Unfortunately, insertion of fillers frequently increases the transparency losses [6]. Additionally, high refractive index polymers are key candidates for organic light emitting diode devices [7], lithography [8], advanced display devices [9], and micro lens components [10].
Poly (Vinyl Alcohol) (PVA) was used during the second half of the 20th century. PVA is an artificial polymer with band gap of 5.1 eV, refractive index of 1.48, and dielectric constant of 2.44 [11]. PVA has been applied in the industrial, commercial, medical, and food sectors. It has been used to produce surgical threads, paper products, and food packaging materials. PVA has attracted considerable attention due to its attractive film-forming, good processability, biocompatibility, and good chemical resistance [12,13]. This polymer is widely used for blending with other polymer compounds such as, biopolymers and other polymers with hydrophilic properties. The addition of an inorganic material to the polymeric matrix is advantageous to further enhance the chemical, structural and physical properties [12]. PVA has Hydro oxide (OH) groups arranged regularly from one side of the plane to the other, thus providing interchain hydrogen bond networks. This may induce high optical clarity and polarization response in the resulting hybrid polymerized thin films. Consequently, PVA polymers can be utilized in photovoltaic and optoelectronic devices [1]. PMMA is one of the amorphous polymers that has been discovered in the early of the 1930. PMMA is among the polymers that have high resistance to sunshine exposure. It has been known to withstand temperatures between 70 up to 100 °C. Additionally, it possesses very good optical properties with refractive index ranging between 1.3 and 1.7 [14]. Owing to its high impact strength, lightweight, and shatter resistance, the colorless PMMA is one of the best organic optical materials and it is widely used as a substitute for inorganic glass [15]. The PMMA polymer is selected for this study owing to several properties such as, its safety and chemical inertness. Additionally, it has been reported to be suitable for numerous imaging and non-imaging microelectronics and sensors [16]. Titanium Dioxide nanoparticles (TiO2-NPs) are bright white solid inorganic compounds. The bulk material of TiO2 exhibits three main phases: Rutile, Anatase, and Brookite. TiO2-NPs exist mostly as Rutile and Anatase phases. Rutile is a high-temperature stable phase with an optical energy bandgap of 3.0 eV. Whereas Anatase is formed at a lower temperature with an optical energy band gap of 3.2 eV and a refractive index of 2.3. The high refractive index and large band gap promote its applications for industrial purposes [17]. TiO2-NPs are chosen in this work based on their excellent electrical and optical properties, safety, high chemical stability, and relatively high photocatalytic activity. Moreover, TiO2-NPs thin films are employed in applications involving capacitors, sensors, design of computer disks, optical filters, solar cells, and optoelectronics [17,18].
The aim of this study is two-fold. First, we synthesize thin films of PMMA and PVA mixture doped with different concentrations of TiO2-NPs using dip coating technique. The dip coating technique is employed for the synthesis of thin films by self-assembly and the sol-gel technique. Self-assembly usually gives film thicknesses of exactly one mono layer. Dip coating applications include: multilayer sensor coatings, implant functionalist, hydro gels, sol-gel nano particle coatings, self-assembled mono layers, and layer-by-layer nano particle assemblies. Secondly, we characterize and interpret optical properties of the synthesized nanocomposite thin films including transmittance (T%), reflectance (R%), absorption coefficient (α), optical constants (index of refractive (n), extinction coefficient(k)), and optical dielectric functions (ɛ′, ɛ″), which are investigated and interpreted by measuring and analyzing UV–Vis spectrometry measurements. Furthermore, a combination of classical models such as Tauc, Urbach, Spitzer-Fan, and Drude models are applied to calculate the bandgap energy   ( E g ) and optoelectronic parameters of the (PMMA-PVA)/TiO2 nanocomposites thin films.

2. Experimental Details

2.1. Materials

Titanium (IV) tetraisopropoxide (Ti(OCH(CH3)2)4) with molecular weight of 284.22 g/mol, Poly(methyl methacrylate) (PMMA) with molecular weight of 100.12 g/mol, Polyvinyl alcohol (PVA) with molecular weight of 44.05 g/mol, 2-propanol with molecular weight of 60.1 g/mol, Chloroform with molecular weight of 119.38 g/mol were obtained from Sigma–Aldrich.

2.2. Preparation of Titanium Dioxide Nanoparticles (TiO2 NPs)

To prepare the TiO2-NPs using the sol-gel method, we dissolved 5 mL of Titanium (IV) tetraisopropoxide (Ti (OCH (CH3)2)4) with 15 mL of 2-propanol in (beaker A). Beaker A is subsequently placed on a magnetic stirrer for 30 min at room temperature. Next, we dissolve 100 mL distilled water (pH = 8) with 150 mL of 2-propanol in (beaker B) and placed on a magnetic stirrer for 30 min at room temperature. When the solutions in the beaker are ready, we added (beaker A) to (beaker B) and the mixture is left on a stirrer for 15 min to get a homogeneous solution of TiO2. The solution should be was centrifuged for 15 min. The as-prepared precipitate is then washed by ethanol three times, centrifuged, and heated at temperatures ranging from 60 to 70 °C for 24 h to obtain TiO2-NPs in the powder form. Finally, having obtained TiO2-NPs in the powder form, they are then placed in the furnace, and the temperature is gradually raised to anneal the powder at a temperature of 400 °C for 2 h [17].

2.3. (PMMA-PVA) Polymeric Thin Films Doped by TiO2 NPs

The glass substrates are cleaned with warm tap-water, then rinsed with ionized acidic water of (pH = 3.5) to remove the surface oxidized layer and greases, and then dipped in acetone. The substrates are then bathed in the ultrasonic path of distilled water for five minutes and dried with cold air. Then, 1 g of PMMA (mw = 100.12 g/mol) and 1 g of PVA (mw = 86.09 g/mol) are dissolved separately in 200 mL of Chloroform (CHCl₃). (PMMA-PVA) solution is obtained by mixing (PMMA and PVA) solutions in a 1:1 volume ratio using a magnetic stirrer for 24 h to enhance the homogeneity. PMMA-PVA solution is then filtered using 0.45 μm millipore filter before dip coating on the glass substrates. The films are synthesized at room temperature of 27 °C under atmospheric pressure [19]. The PVA polymers prevent the aggregation of the TiO2-NPs by the organic surface modification and keep the TiO2-NPs dispersed in PVA matrix at the nano scale. The final solutions are filtered by paper-filter (0.45 μm in dimension). The viscosity of sol-gel solutions ranges between 1.2079 and 2.8935 Cp. The (PMMA-PVA)/TiO2 nanocomposite solutions were prepared by adding TiO2-NPs into PMMA-PVA solution directly under magnetic stirring for 4 h. The (PMMA-PVA)/TiO2 nanocomposite solutions are deposited as a thin layer on glass substrate using dip-coating technique by immersing the substrate in the solution for 2 h, forming nanocomposite thin films with average thickness of 500 nm with a maximum standard deviation of 7.5%. The thickness of thin films is confirmed by Scanning Electron Spectroscopy (SEM). The nanocomposite thin films are obtained by allowing the solvent to evaporate for 15 min at 70 °C to evaporate the solvent and organic residues. The withdrawal speed ranged from 10–80 cm min−1. The multilayers of (PMMA-PVA)/TiO2 nanocomposites thin films are then analysed and interpreted [19].

2.4. Characterization

The average thickness of the as-grown (PMMA-PVA)/TiO2 nanocomposite thin films is measured to be 500 nm using Scanning Electron Microscopy (SEM, Quanta FEG 450) images obtained at our nanotechnology facility. The room-temperature transmittance and reflectance are obtained using a Double-Beam UV–vis Spectrophotometer (U-3900H). Chemical properties were determined using Fourier Transform Infrared Spectroscopy (FTIR) by KBr technique.

3. Results and Discussion

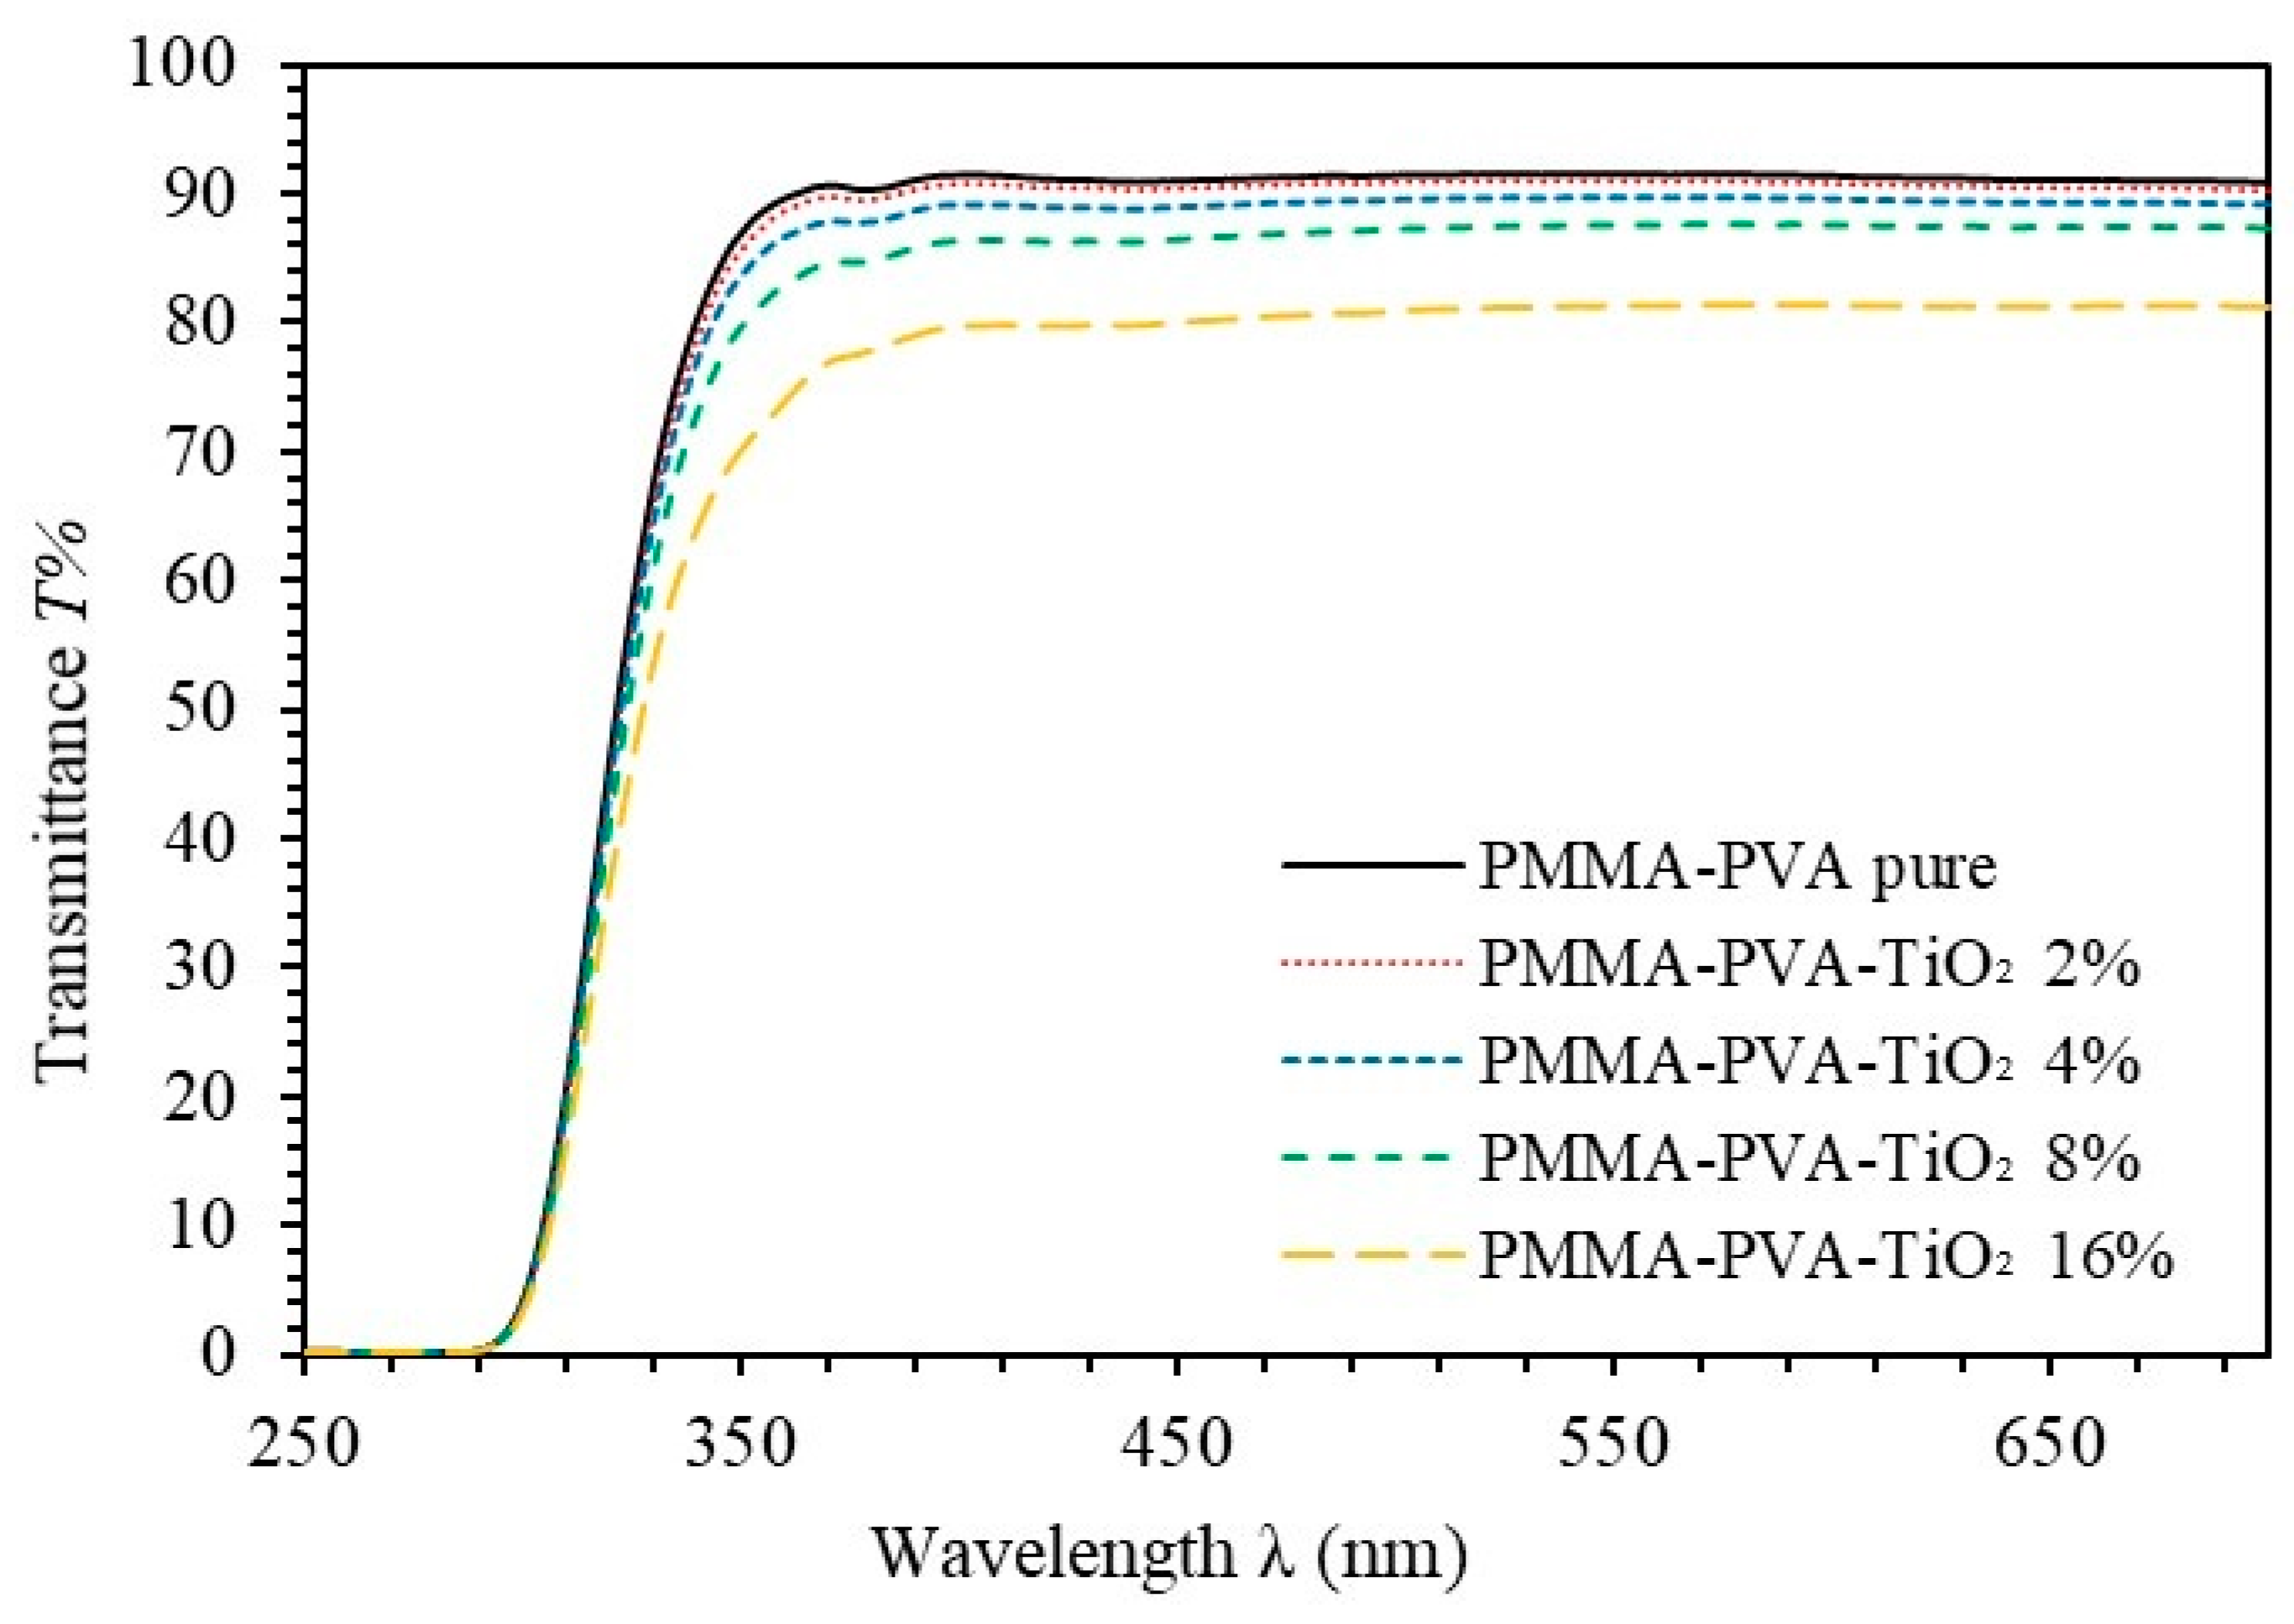
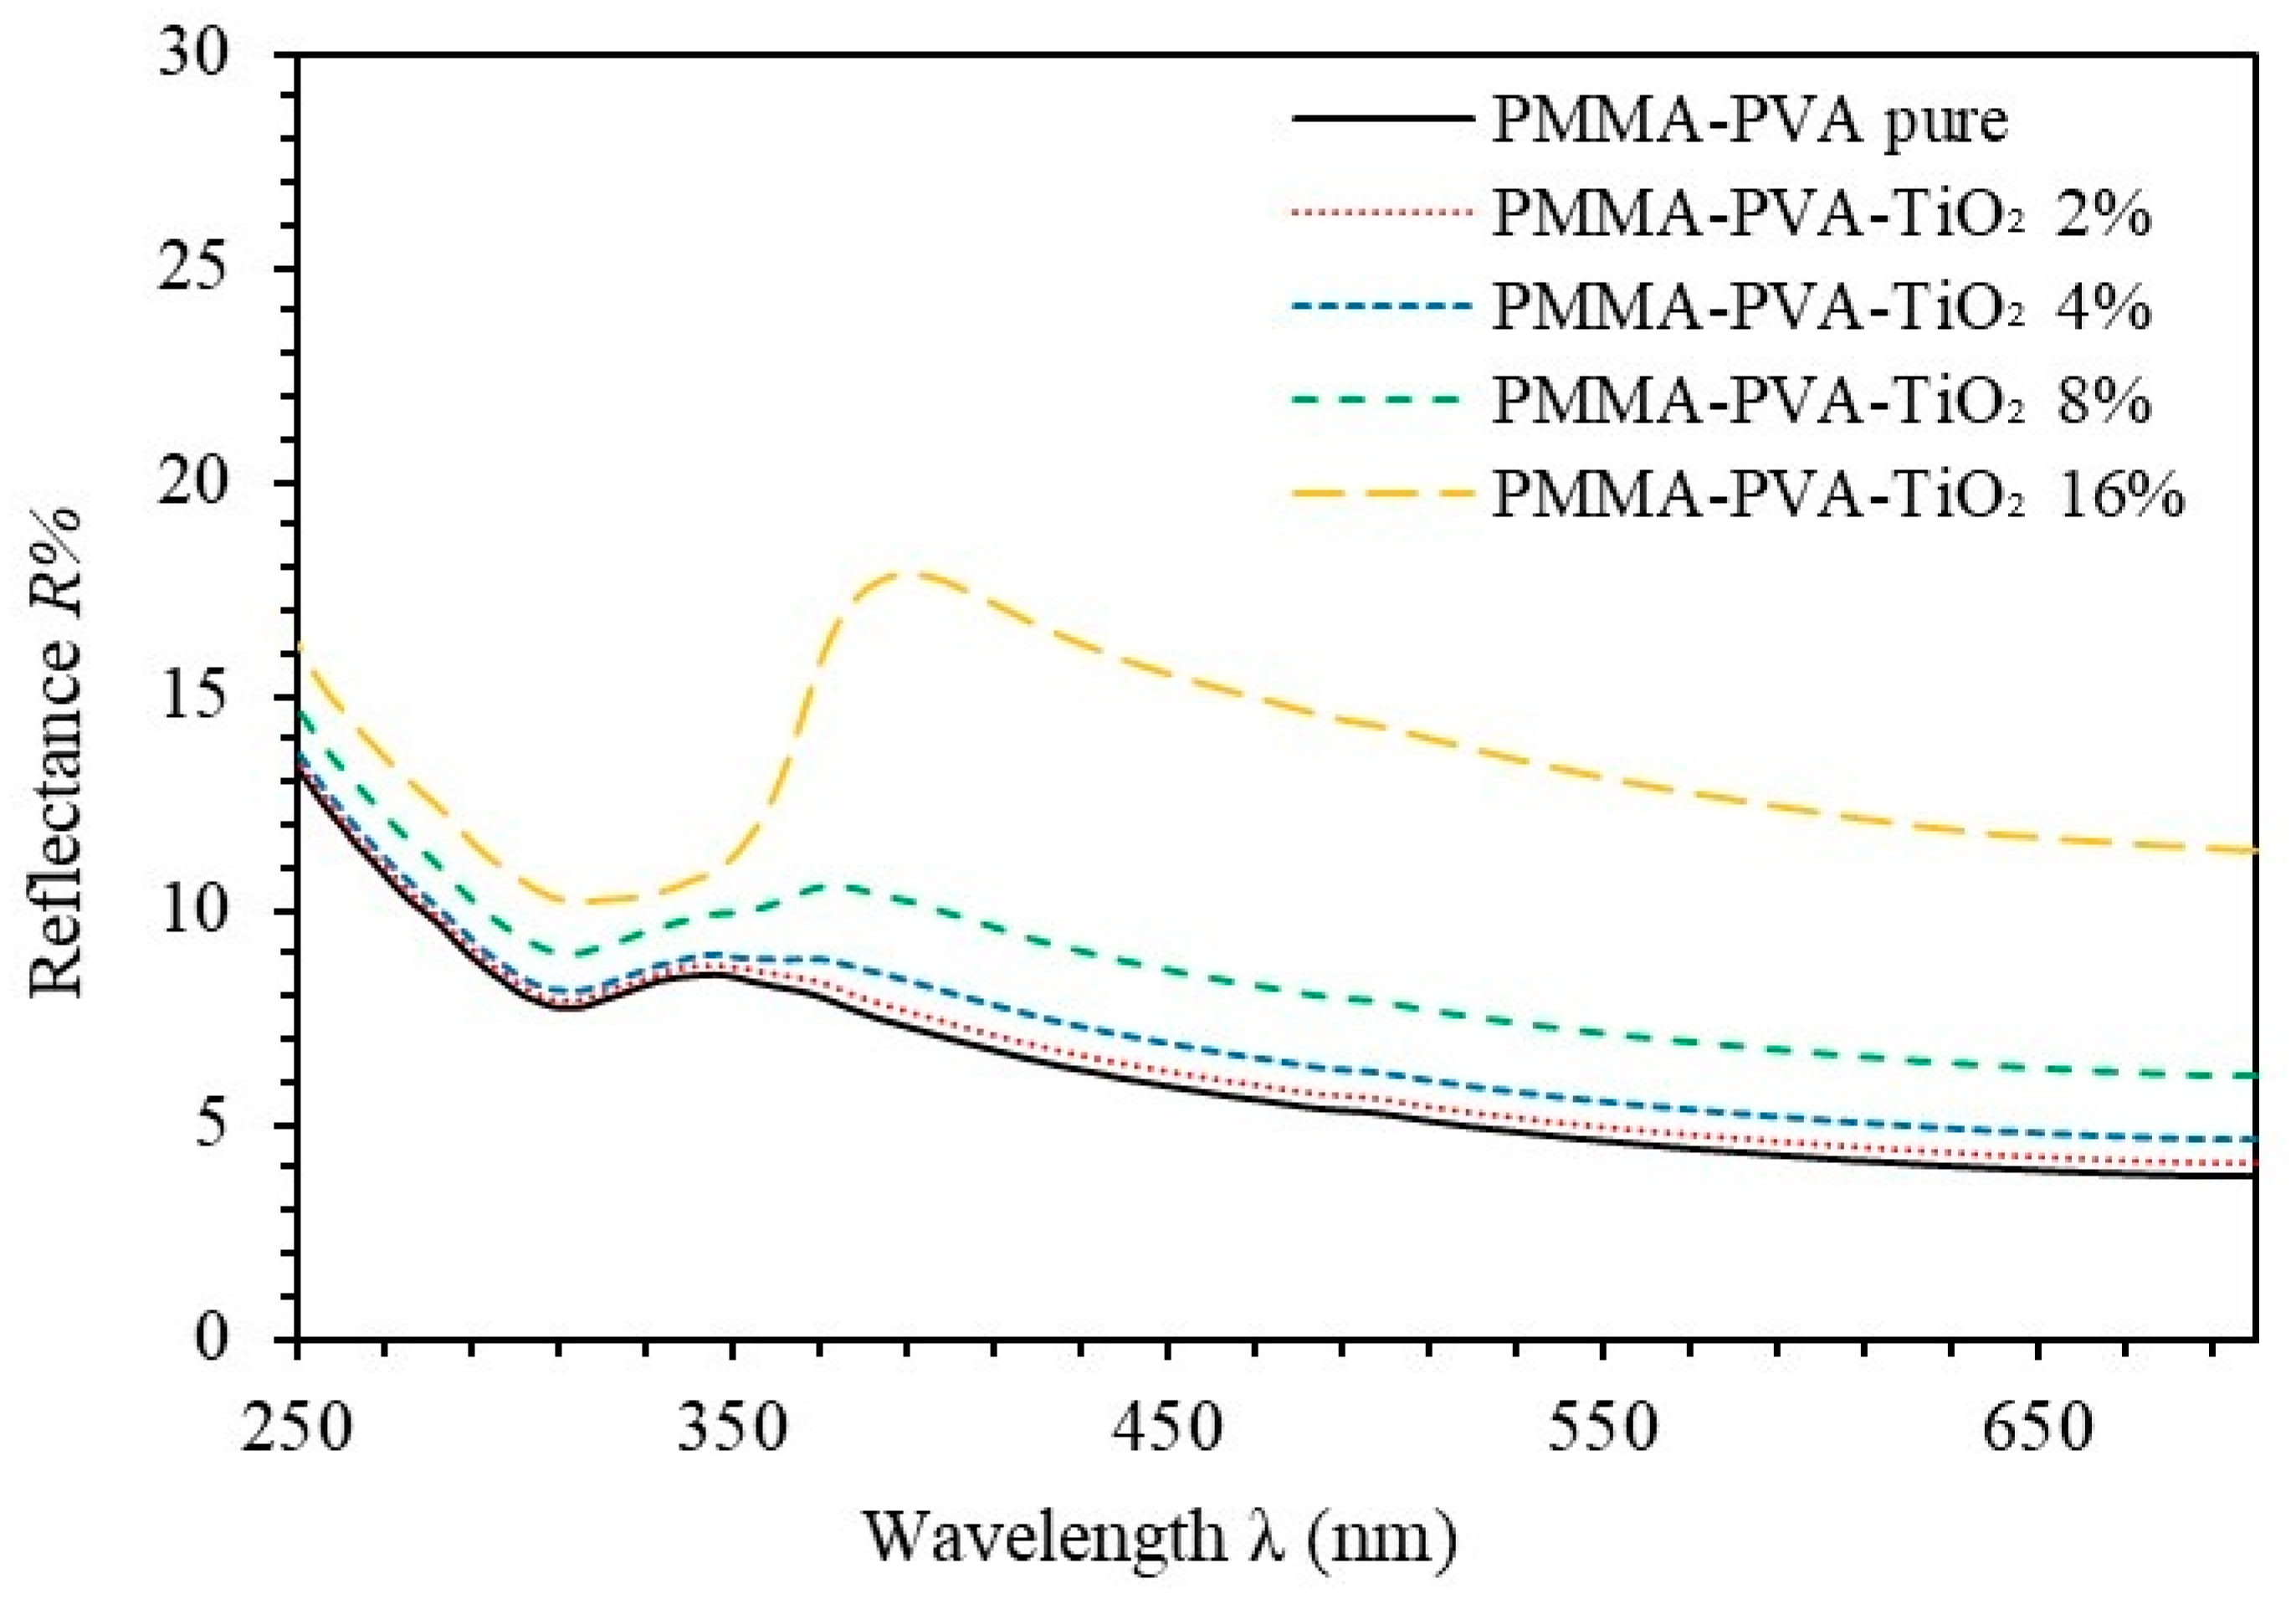
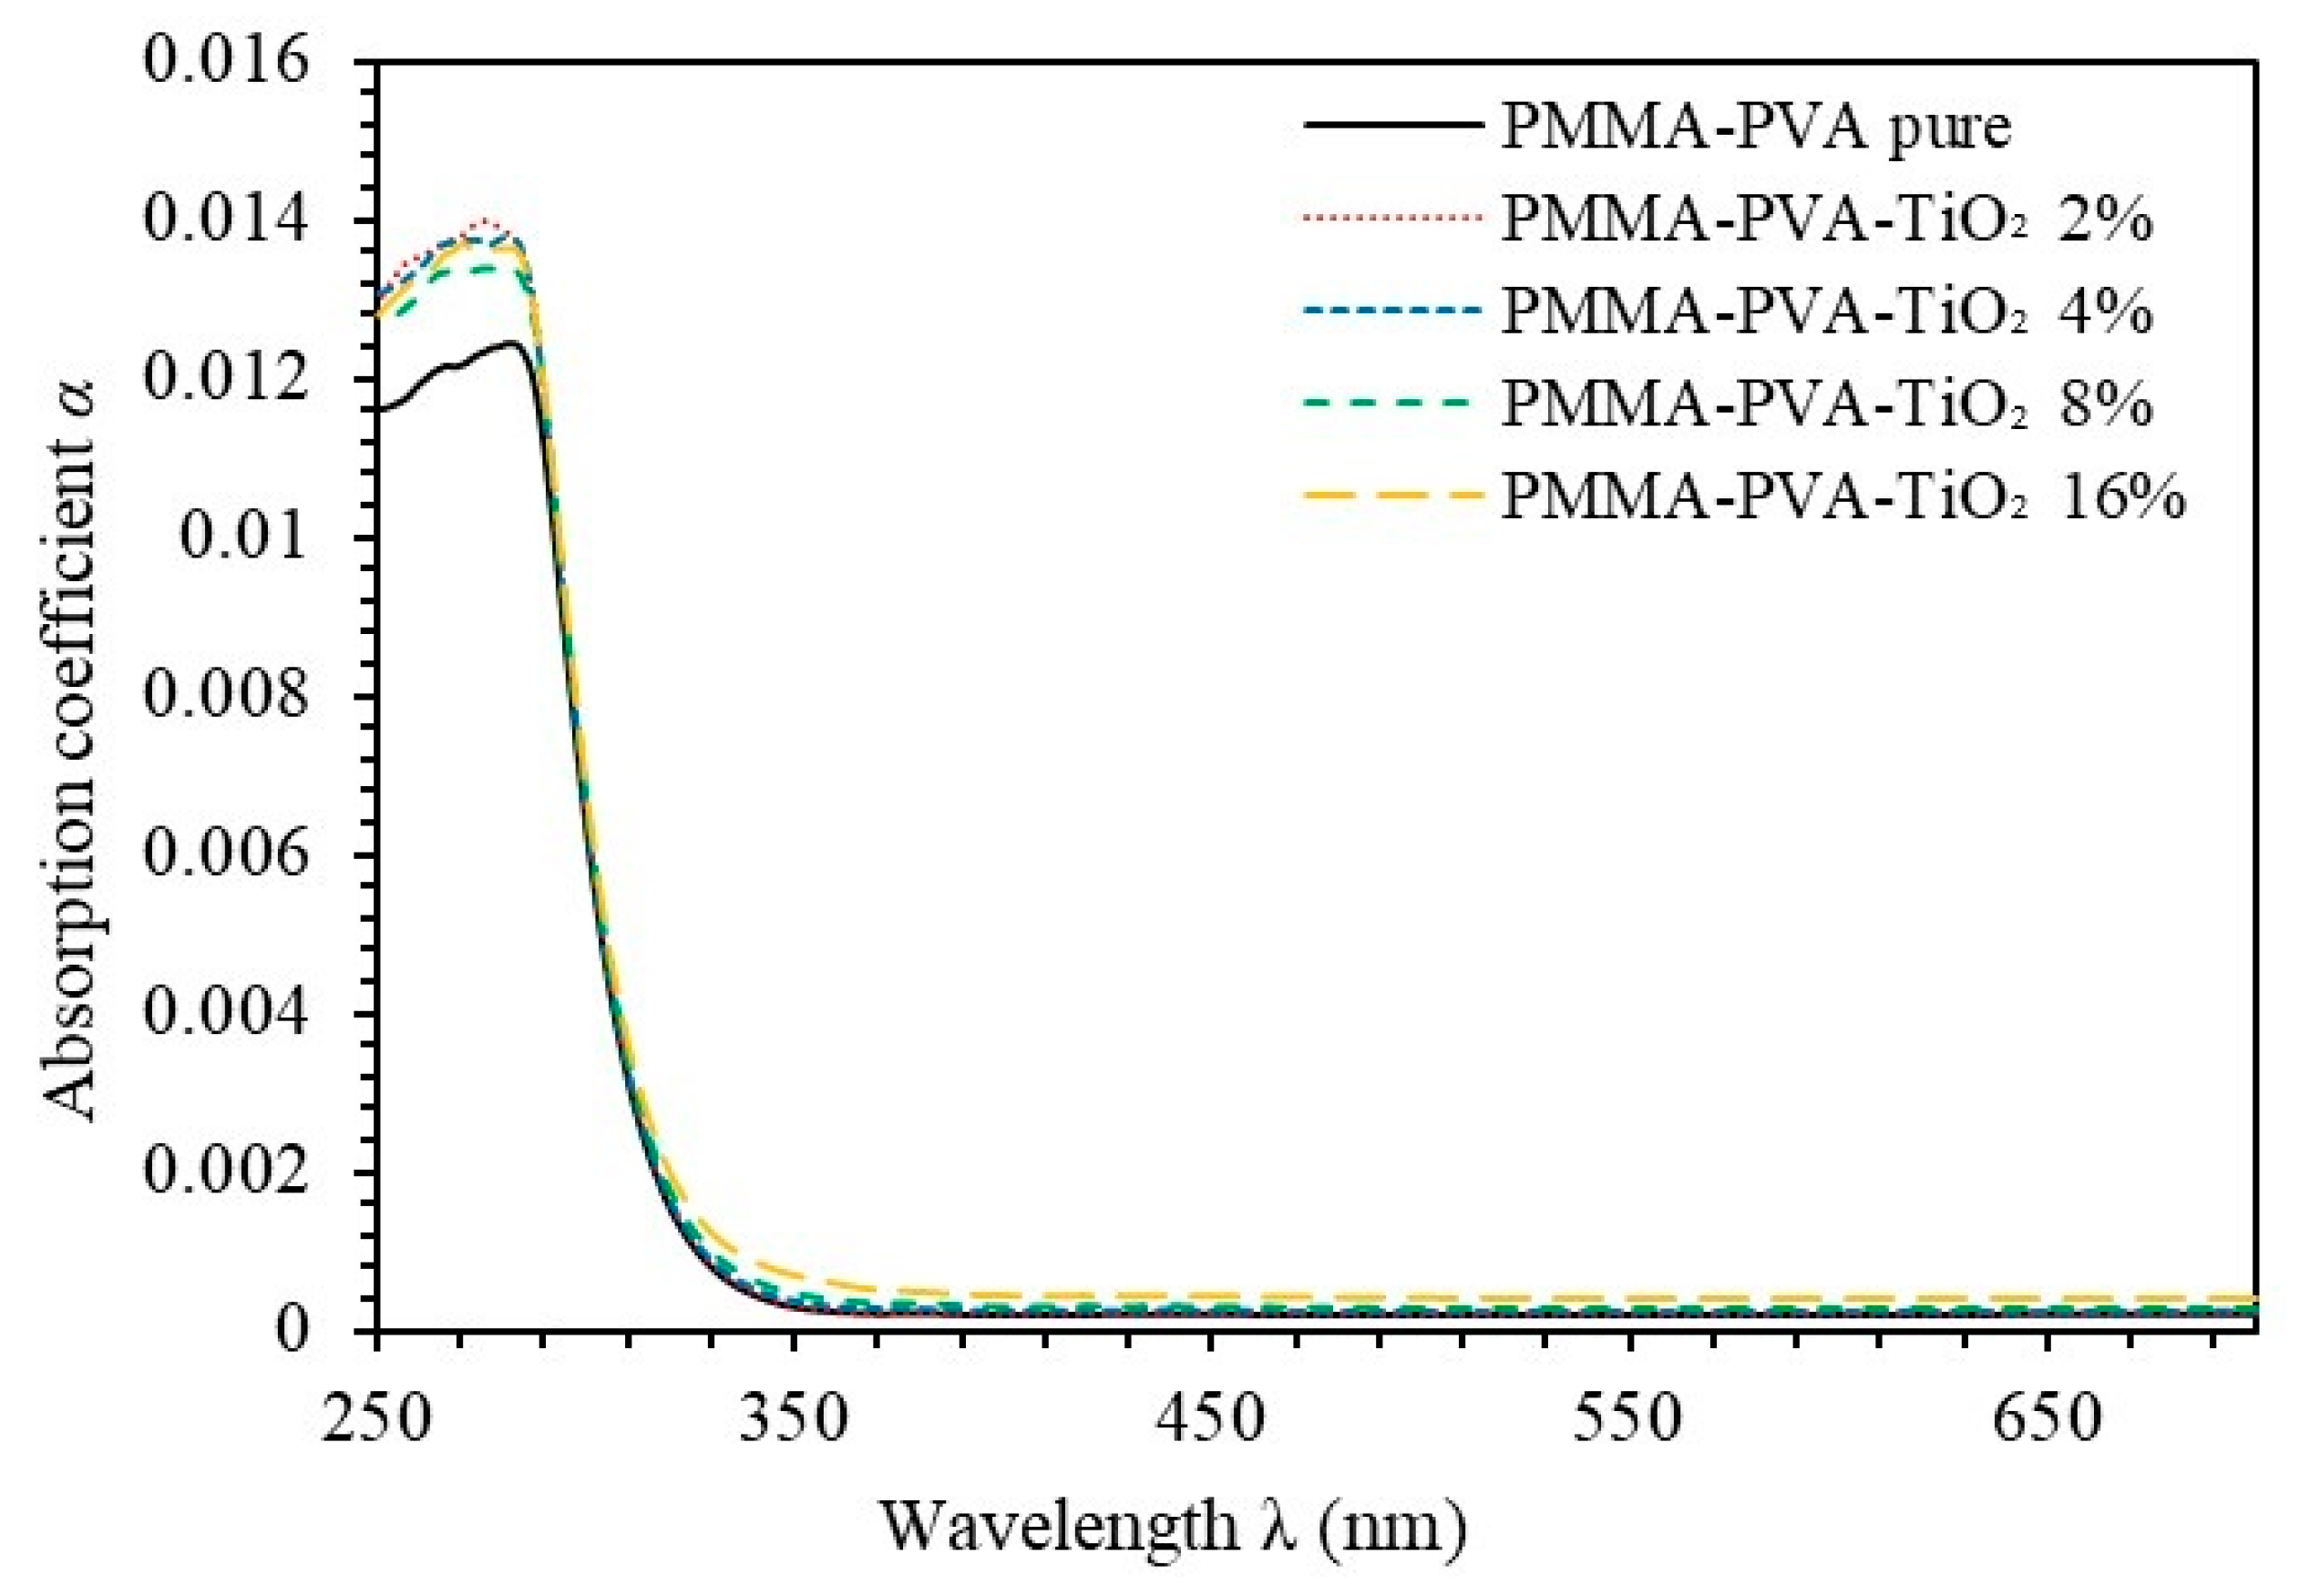
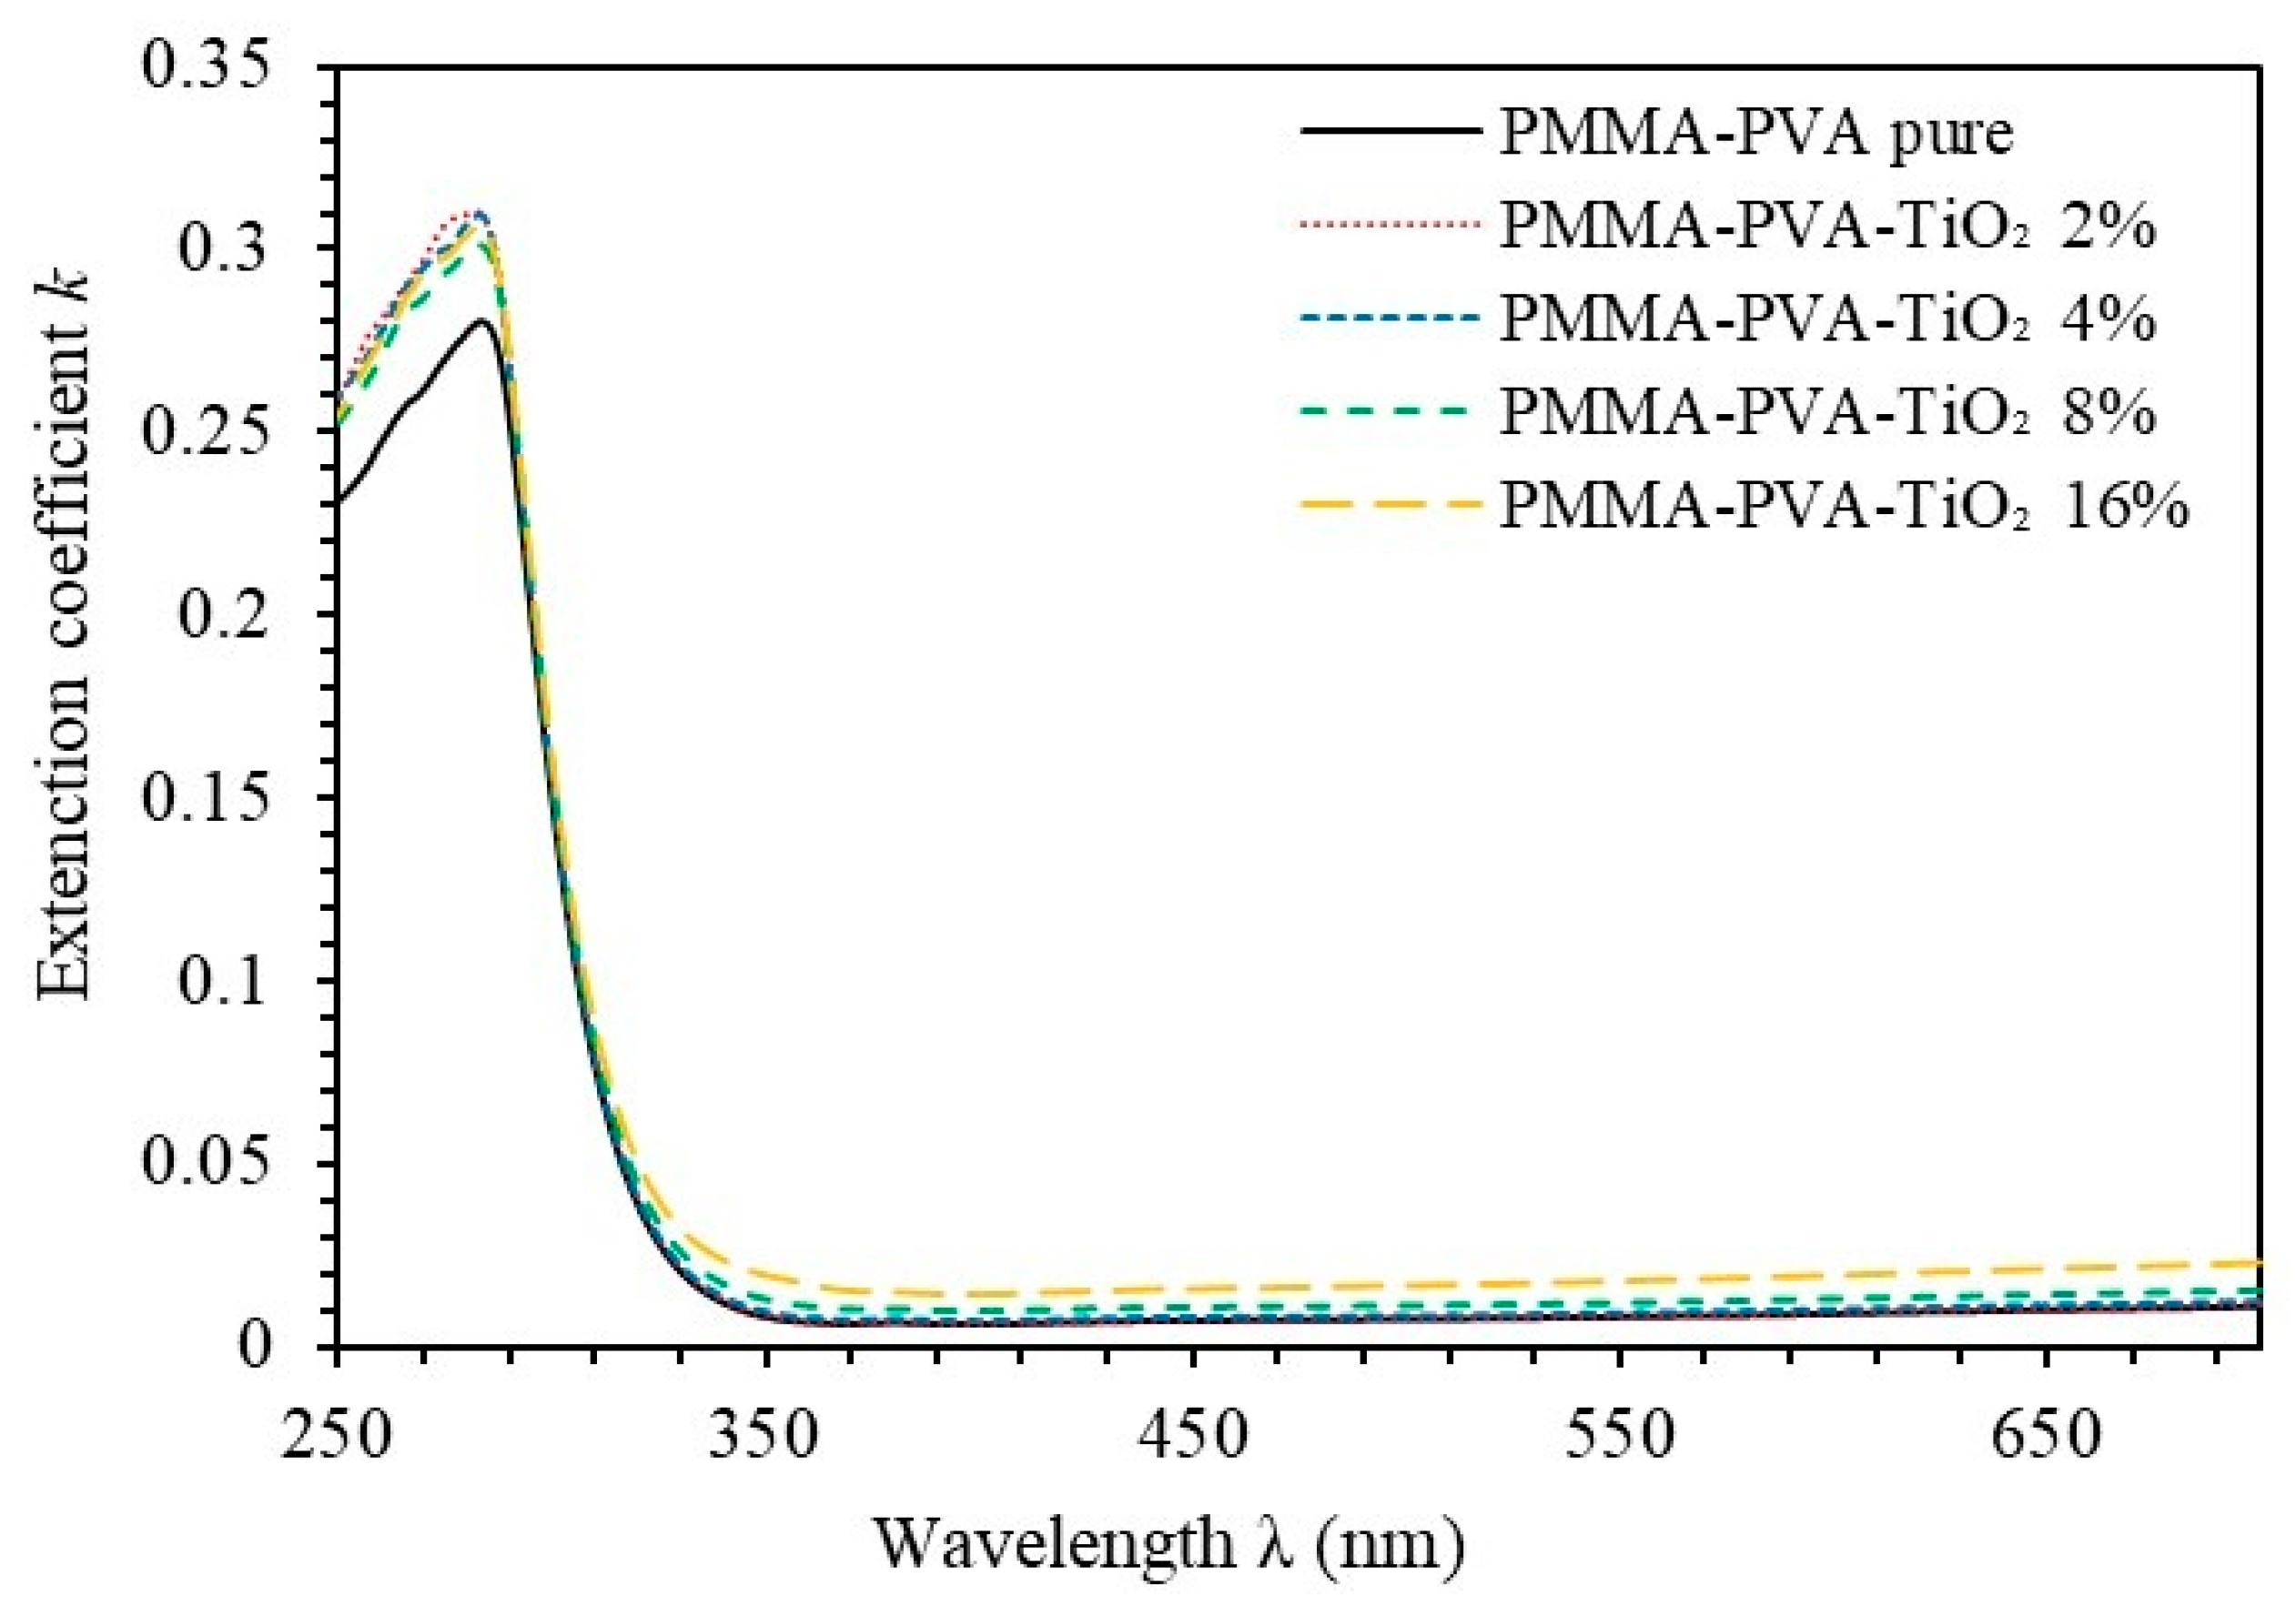
3.1. UV–Vis Spectroscopy

A UV–Vis spectrophotometer is employed to investigate the optical properties of the (PMMA-PVA)/TiO2 nanocomposite thin films with various contents of TiO2-NPs. Particularly, we investigate the spectral behavior of transmittance and reflectance. Optical parameters such as absorption coefficient, optical bandgap energy, Urbach energy, optical constants, and optical dielectric functions are measured, analyzed, and interpreted. Moreover, using TGA analysis, we investigate the thermal stability. In addition, FTIR measurements are performed to investigate the vibrational bands. The FTIR results reveal some sorts of interaction between the constituents of nanocomposite thin films as indicated by the induced changes in the vibration modes and the band position. Figure 1 shows the transmittance spectra of (PMMA-PVA)/TiO2 nanocomposite thin films for various TiO2-NPs contents as a function of incident light wavelength. The figure shows a sort of ion transfer mechanism between (PMMA-PVA) polymer composite and TiO2-NPs. The transmittance values of undoped (PMMA-PVA) polymeric thin film in the visible region (visible region, λ   ≥ 350 nm) is found to be about 91.6%. This behavior indicates an excellent excitation that leads to a sharp electron transition from the valance band to the conduction band. Interestingly, the effect of introducing TiO2-NPs contents in (PMMA-PVA) polymeric thin films leads to a decrease in transmittance values in the visible region. This decrease is gradual and nonlinear. Our results indicate that (PMMA-PVA)/TiO2 nanocomposite thin films (wt.% = 2 and 4%) exhibit transmittance values at λ   = 550 nm to 89.8 and 89.6%, respectively. Moreover, increasing the concentration (wt.% = 8 and 16%) of TiO2-NPs in (PMMA-PVA) polymeric thin films leads to a further decrease in the transmittance values at λ   = 550 nm to 87.6 and 81.3%, respectively. The loss of transparency is attributed to the reflectance and scattering of incident photons by TiO2-NPs [6]. Figure 2 shows the reflectance spectra of (PMMA-PVA)/TiO2 nanocomposite thin films for various TiO2-NPs contents as a function of incident light wavelength. At   λ   350 nm, reflectance values decrease slightly as the wavelength is increased. The reflectance values of undoped (PMMA-PVA) polymeric thin film lies in a range of 4.6 up to 8.9 as the wavelength decreases from 700 up to 350 nm. Interestingly, the effect of introducing TiO2-NPs contents in (PMMA-PVA) polymeric thin films leads to an increase in reflectance values. As predicted, the reflectance spectrum shows an opposite behavior to those in the transmission spectrum. Our results indicate that (PMMAPVA)/TiO2 nanocomposite thin films (wt.% = 2 and 4%) exhibit reflectance values at λ   = 550 nm about 5.5 and 5.6%, respectively. Moreover, increasing (wt.% = 8 and 16%) of TiO2-NPs in (PMMA-PVA) polymeric thin films leads to an increase in the reflectance values at λ   = 550 nm to 7 and 13%, respectively. The average of the sum of the transmittance and the reflectance is of the order of unity [15], Therefore, we can neglect the loss of light due to the presence of scattering or absorption of the incident light confirming that the surfaces of the deposited thin films are of good quality and their surfaces are extremely smooth.
Optical absorption measurements provide a straightforward scheme for accurate calculation of optical band gap ( E g ). The measurement of absorption coefficient spectra ( α ) for any polymer, hybrid material, and semiconducting thin films is usually performed in two distinct spectral regions. Mainly, the high energy region, in which α spectrum is associated with the electronic states and the lower energy zone, in which α spectrum is associated with atomic vibrations [20,21]. In this respect, α   is calculated as a function of wavelength as, α = ( 1 / d ) ln ( 1 / T ) , where d is the film thickness which is measured to be about 500 nm [19,20,21,22,23]. Figure 3 shows α of (PMMA-PVA)/TiO2 nanocomposite thin films as a function of wavelength. Clearly, all thin film samples exhibit higher α in the UV region (UV region, λ   350 nm). Introducing TiO2-NPs contents in (PMMA-PVA) polymeric thin films leads to a slight increase in absorption coefficient values. The increase in α values is attributed to the absorption decrease in the interband transition [23]. Interestingly, the accurate determination of α is crucial for the determination of several optical parameters. Typically, the (PMMA-PVA)/TiO2 nanocomposite thin films have strong absorption in the UV region and strong transmittance in the visible region. Consequently, these films may act as key candidate potential materials for optoelectronic devices operating in the UV spectral region [17].
Extinction coefficient (k) indicates the quantity of absorption loss when the electromagnetic wave transmits through the material. k is a crucial parameter for the determination of several related optical parameters, primarily those related to the absorption of light waves in the medium. k value measures the fraction of light lost by scattering and absorption per unit distance of the penetrated medium [24]. The extinction coefficient, k, can be expressed as, k   = α λ /   4 π [23]. Figure 4 shows extinction coefficient spectra of (PMMA-PVA)/TiO2 nanocomposite thin films as a function of wavelength for various TiO2-NPs concentrations. k exhibits high values in the UV region, whereas it adopts very low values in the visible region. Moreover, our results indicate that k is directly proportional to the absorption coefficient α . The observed low value of k in the visible range is a strong indication of no light loss due to scattering and as-prepared nanocomposite thin films have excellent optical transparency in this spectral region [23].
Refractive index ( n ) is closely related to the electronic polarization of ions and the local field inside optical materials. Accurate calculation of n is crucial for optical application of semi-transparent and transparent polymers, e.g. switches, sensors, filters and modulation, etc. [25]. Therefore, it is of crucial importance to reveal the behavior of n. Several optical parameters are closely correlated to   n . It can be calculated as,   n = ( 1 + R / 1 R ) + ( 4 R / ( 1 R ) 2 ) k 2 [23]. Figure 5 shows n spectra of (PMMA-PVA)/TiO2 nanocomposite thin films as a function of wavelength for various TiO2-NPs concentrations. In highly absorption region ( λ < 350   nm), the incident photon frequency becomes approximately equal to the plasma frequency leading to anomalous dispersion. For   λ 350   nm, n decreases slightly as the wavelength is increased. We found that n of (PMMA-PVA) polymeric thin film lies in a range of 1.5 to 1.85, as the wavelength decreases from 700 up to 350 nm. Interestingly, increasing TiO2-NPs contents in (PMMA-PVA) polymeric thin films results in an increase in n values. The effect of introducing wt.% of (2, 4, 8, and 16%) TiO2-NPs into (PMMA-PVA) polymeric thin films on n is found to be nonlinear. The increase in refractive index makes the films denser. Thus, propagation velocity of light traveling through (PMMA-PVA)/TiO2 nanocomposite thin films decreases considerably [15]. We found that (PMMA-PVA)/TiO2 nanocomposite thin film containing 2 and 4% of NPs exhibit n values of 1.618 and 1.62 at λ   = 550 nm, respectively. Increasing TiO2-NPs concentration in (PMMA-PVA) polymeric thin films up to 8 and 16% leads to a further increase in n values at 550 nm to 1.73 and 2.14, respectively. The increase in n values of (PMMA-PVA)/TiO2 nanocomposite thin films may be attributed to the condensation of smaller nanoparticles into larger clusters [26]. The obtained high n values of the investigated nanocomposite thin films are promising and represent a strong potential indication that the thin films can be used for strong optical confinement and enhance the optical intensities of nonlinear interactions [17,18]. High refractive index values of (PMMA-PVA)/TiO2 nanocomposite thin films nanocomposite thin films have attracted considerable attention because of their potential applications in advanced optoelectronic devices such as organic light emitting diode devices [7], photoresists for 193-nm immersion lithography [8], high performance substrates for advanced display devices [9], antireflective coatings for advanced optical applications [27] and micro lens components for charge coupled devices or complementary metal oxide semiconductor [10,28].
The optical dielectric constant (ɛ′) is responsible for the suppression of the speed of light in the medium [29]. The optical dielectric loss (ɛ″) is associated with the absorption of energy from the electric field due to dipole motion [23]. The complex dielectric function (ɛ) can be decomposed as,   ɛ   =   ɛ +   i ɛ ,   with ɛ expressed as ,     ɛ = n 2 + k 2 and ( ɛ ) is expressed as, ɛ = 2 n k   [23]. Figure 6 shows the optical dielectric constant spectra of (PMMA-PVA)/TiO2 nanocomposite thin films as a function of wavelength for various TiO2-NPs concentrations. The value of ɛ of undoped (PMMA-PVA) polymeric thin film is found to be 2.2 to 3.3 as the wavelength is decreased from 700 up to 350 nm. Increasing TiO2-NPs concentration in (PMMA-PVA) polymeric thin films up to 8 and 16% results in a further noticeable increase in (ɛ′) values to 3 and 4.6 at λ = 550 nm, respectively. Remarkably, the (ɛ′) of (PMMA-PVA)/TiO2 nanocomposite thin films show an increase as TiO2-NPs contents in (PMMA-PVA)/TiO2 polymeric thin films are increased. This indicates a decrease in the speed of propagation of light in (PMMA-PVA)/TiO2 nanocomposite thin films. Figure 7 shows ɛ spectra of (PMMA-PVA)/TiO2 nanocomposite thin films as a function of wavelength for various TiO2-NPs concentrations. ɛ is found to adopt very low values in the visible range of the spectrum. The observed low value of ɛ in the visible ranges indicates less dissipation of absorption energy from the electric field due to frozen molecular dipoles motion indicating that no light loss due to scattering and polarization [30]. Furthermore, increasing TiO2-NPs contents in (PMMA-PVA) polymeric thin films leads to an increase slightly of ɛ values in the visible region. The large polarizability of covalent bonds such as C–H, C–C, and C=O, polymeric based thin films demonstrate high dielectric constants [29]. Surprisingly, the values of the real part are relatively larger than those of an imaginary part (ɛ′ ≫ ɛ″) suggesting that (PMMA-PVA)/TiO2 nanocomposite thin films exhibit exceptionally small energy dissipation and higher speed of light as light propagates through thin films.
The Tauc plot is commonly used to estimate the optical band gap energy ( E g ) of semiconductors. The E g values are obtained by extrapolating the linear part of the relationship of   ( α h υ ) 2 versus h υ to the incident photon energy at which E g equals the incident photon energy ( h υ ). Tauc plot is based on relating the absorption coefficient with the incident photon energy in eV against   ( α h υ ) 2 as ( α h v ) 2 = β ( h v E g ) [20,31], where β is constant called band tailing parameter, E g is the band gap energy [17]. Figure 8 indicates that E g of undoped (PMMA-PVA) polymeric thin film is 4.101 eV. As 2 and 4%, of TiO2-NPs are introduced into (PMMA-PVA) polymeric thin films, the value of E g decreases slightly to 4.075 and 4.072 eV, respectively. Injection of 8 and 16% of TiO2-NPs into (PMMA-PVA) polymeric thin film leads to a further slight decrease in E g to 4.069 and 4.050 eV, respectively. This may be attributed to the tendency to enhance the ion transfer between the constituents of (PMMA-PVA)/TiO2 nanocomposite thin films [32,33]. Furthermore, some sub-bands are created due to the formation of defect levels leading to the bridge overpass of electrons from valence band maximum (VBM) and conduction band minimum (CBM) [15,17,20,34]. The high transmittance, wide band gap energy, and high refractive index of (PMMA-PVA)/TiO2 nanocomposite thin films entitle them to be employed in optoelectronic devices applications [3,6].
Urbach energy ( E U ) is a result of the structural disorder in an amorphous and low-crystalline materials [35]. E U is a measure of the localized density of states extended into the band gap primarily due to presence of defects, impurities, and non-crystallinity energy [18,20]. The relation between E U , α , and h υ , is given by the formula   α = α 0 exp ( h v / E U ) , where   α 0   is a constant [20]. E U is calculated by plotting ln α   vs   h v . The reciprocal of the slopes of the linear portion, below the optical band gap, gives the value of E U that is defined as the width of the tail of localized states in the band gap and believed to be a function of the structural disorder [35]. Figure 9 shows the variation of Urbach energy of (PMMA-PVA)/TiO2 nanocomposite thin films as a function TiO2-NPs content in films. E U   of undoped (PMMA-PVA) polymeric thin film is found to be 190.7 meV. Insertion of (wt.% = 2, 4, 8, and 16%) of TiO2-NPs into (PMMA-PVA)/TiO2 polymeric thin films increases E U   to 191.3, 192.5, 192.86, and 200 meV, respectively. In addition, E U tail is closely related to the disorder in the film network. The increase in the values of E U   as TiO2-NPs contents in (PMMA-PVA)/TiO2 polymeric thin films is increased indicates the presence of defects, impurities [18]. Accordingly, it can be easily noticed that the lowering of band gap energy is due to the presence of localized defect states in the band gap energy window [20,35]. Figure 10 shows the relationship between   E g   and E U   of (PMMA-PVA)/TiO2 nanocomposite thin films for different concentrations of TiO2-NPs. Clearly, E U and the band edges of samples exhibit reverse trend. It can be easily noticed that the lowering of band gap in (PMMA-PVA)/TiO2 nanocomposite thin films is due to the presence of localized defect states in the E g   of (PMMA-PVA)/TiO2 NPs near the VBM and CBM [20]. This decrease leads to a redistribution of states from band to tail, thus permitting a higher number of potential band-to-tail and tail-to-tail transitions [35]. Since Urbach tail parameter is a function of structural disorder and conductivity, the decrease in E U value confirms the alteration of state structure [35].

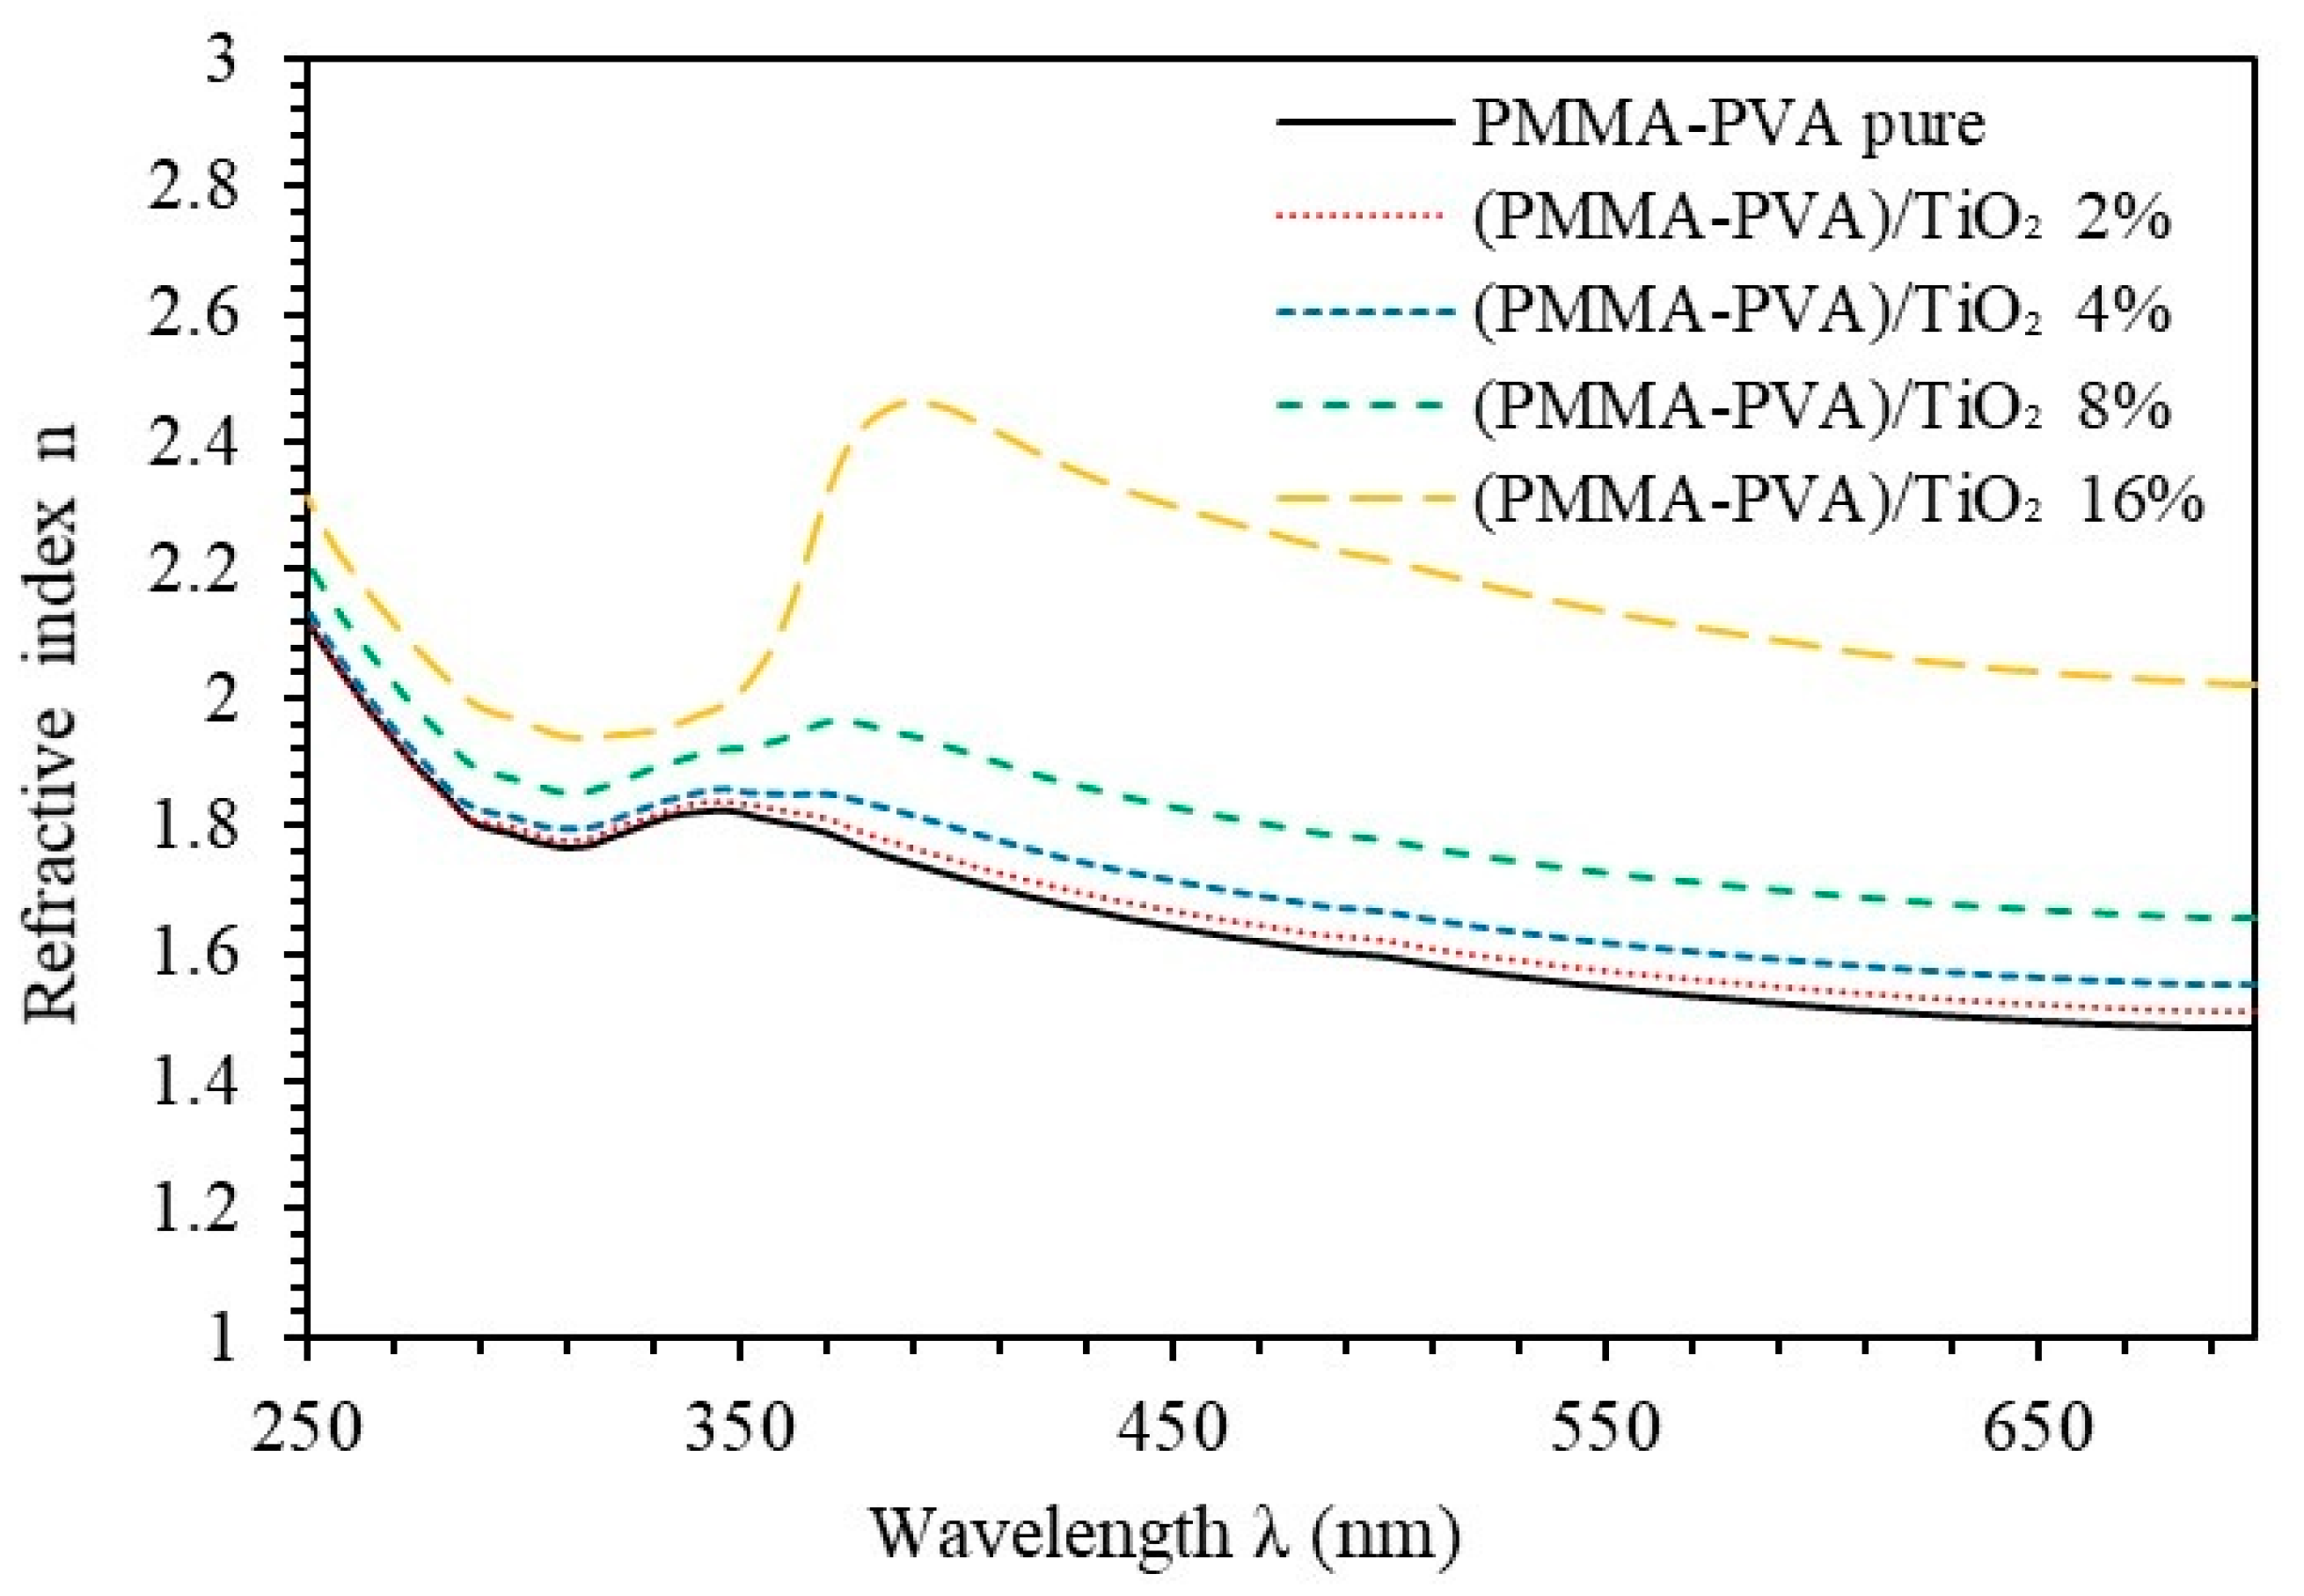
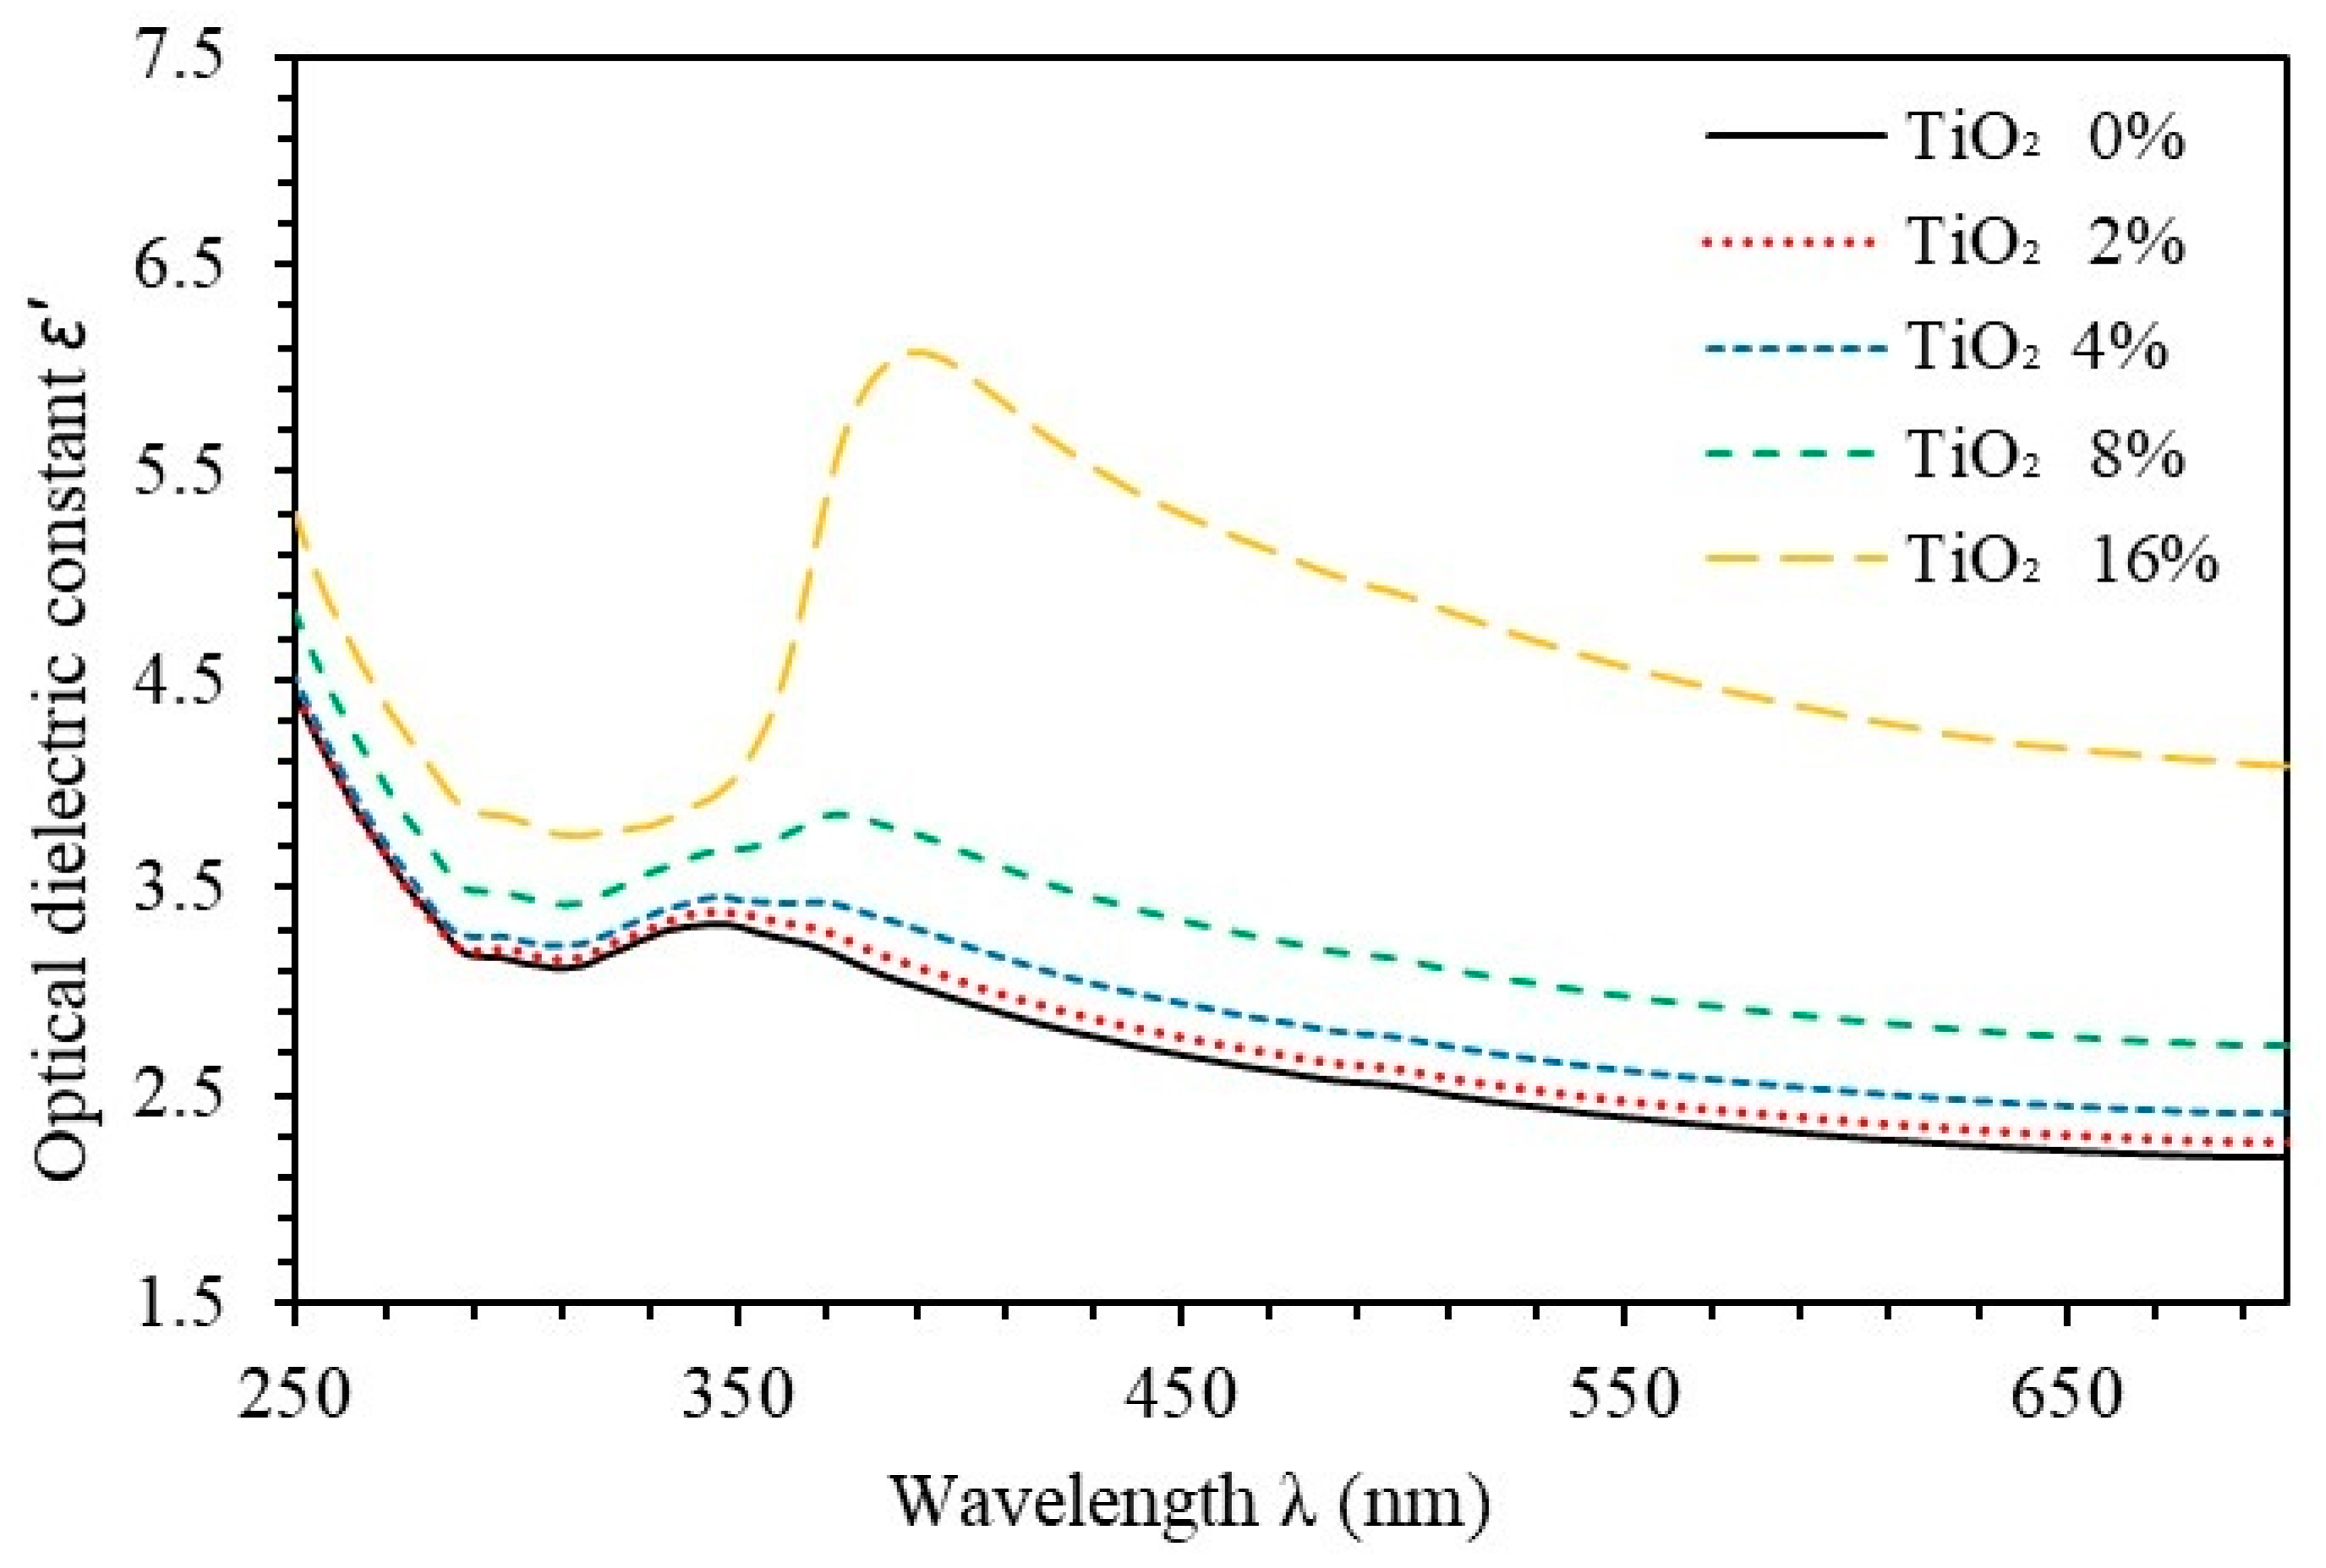
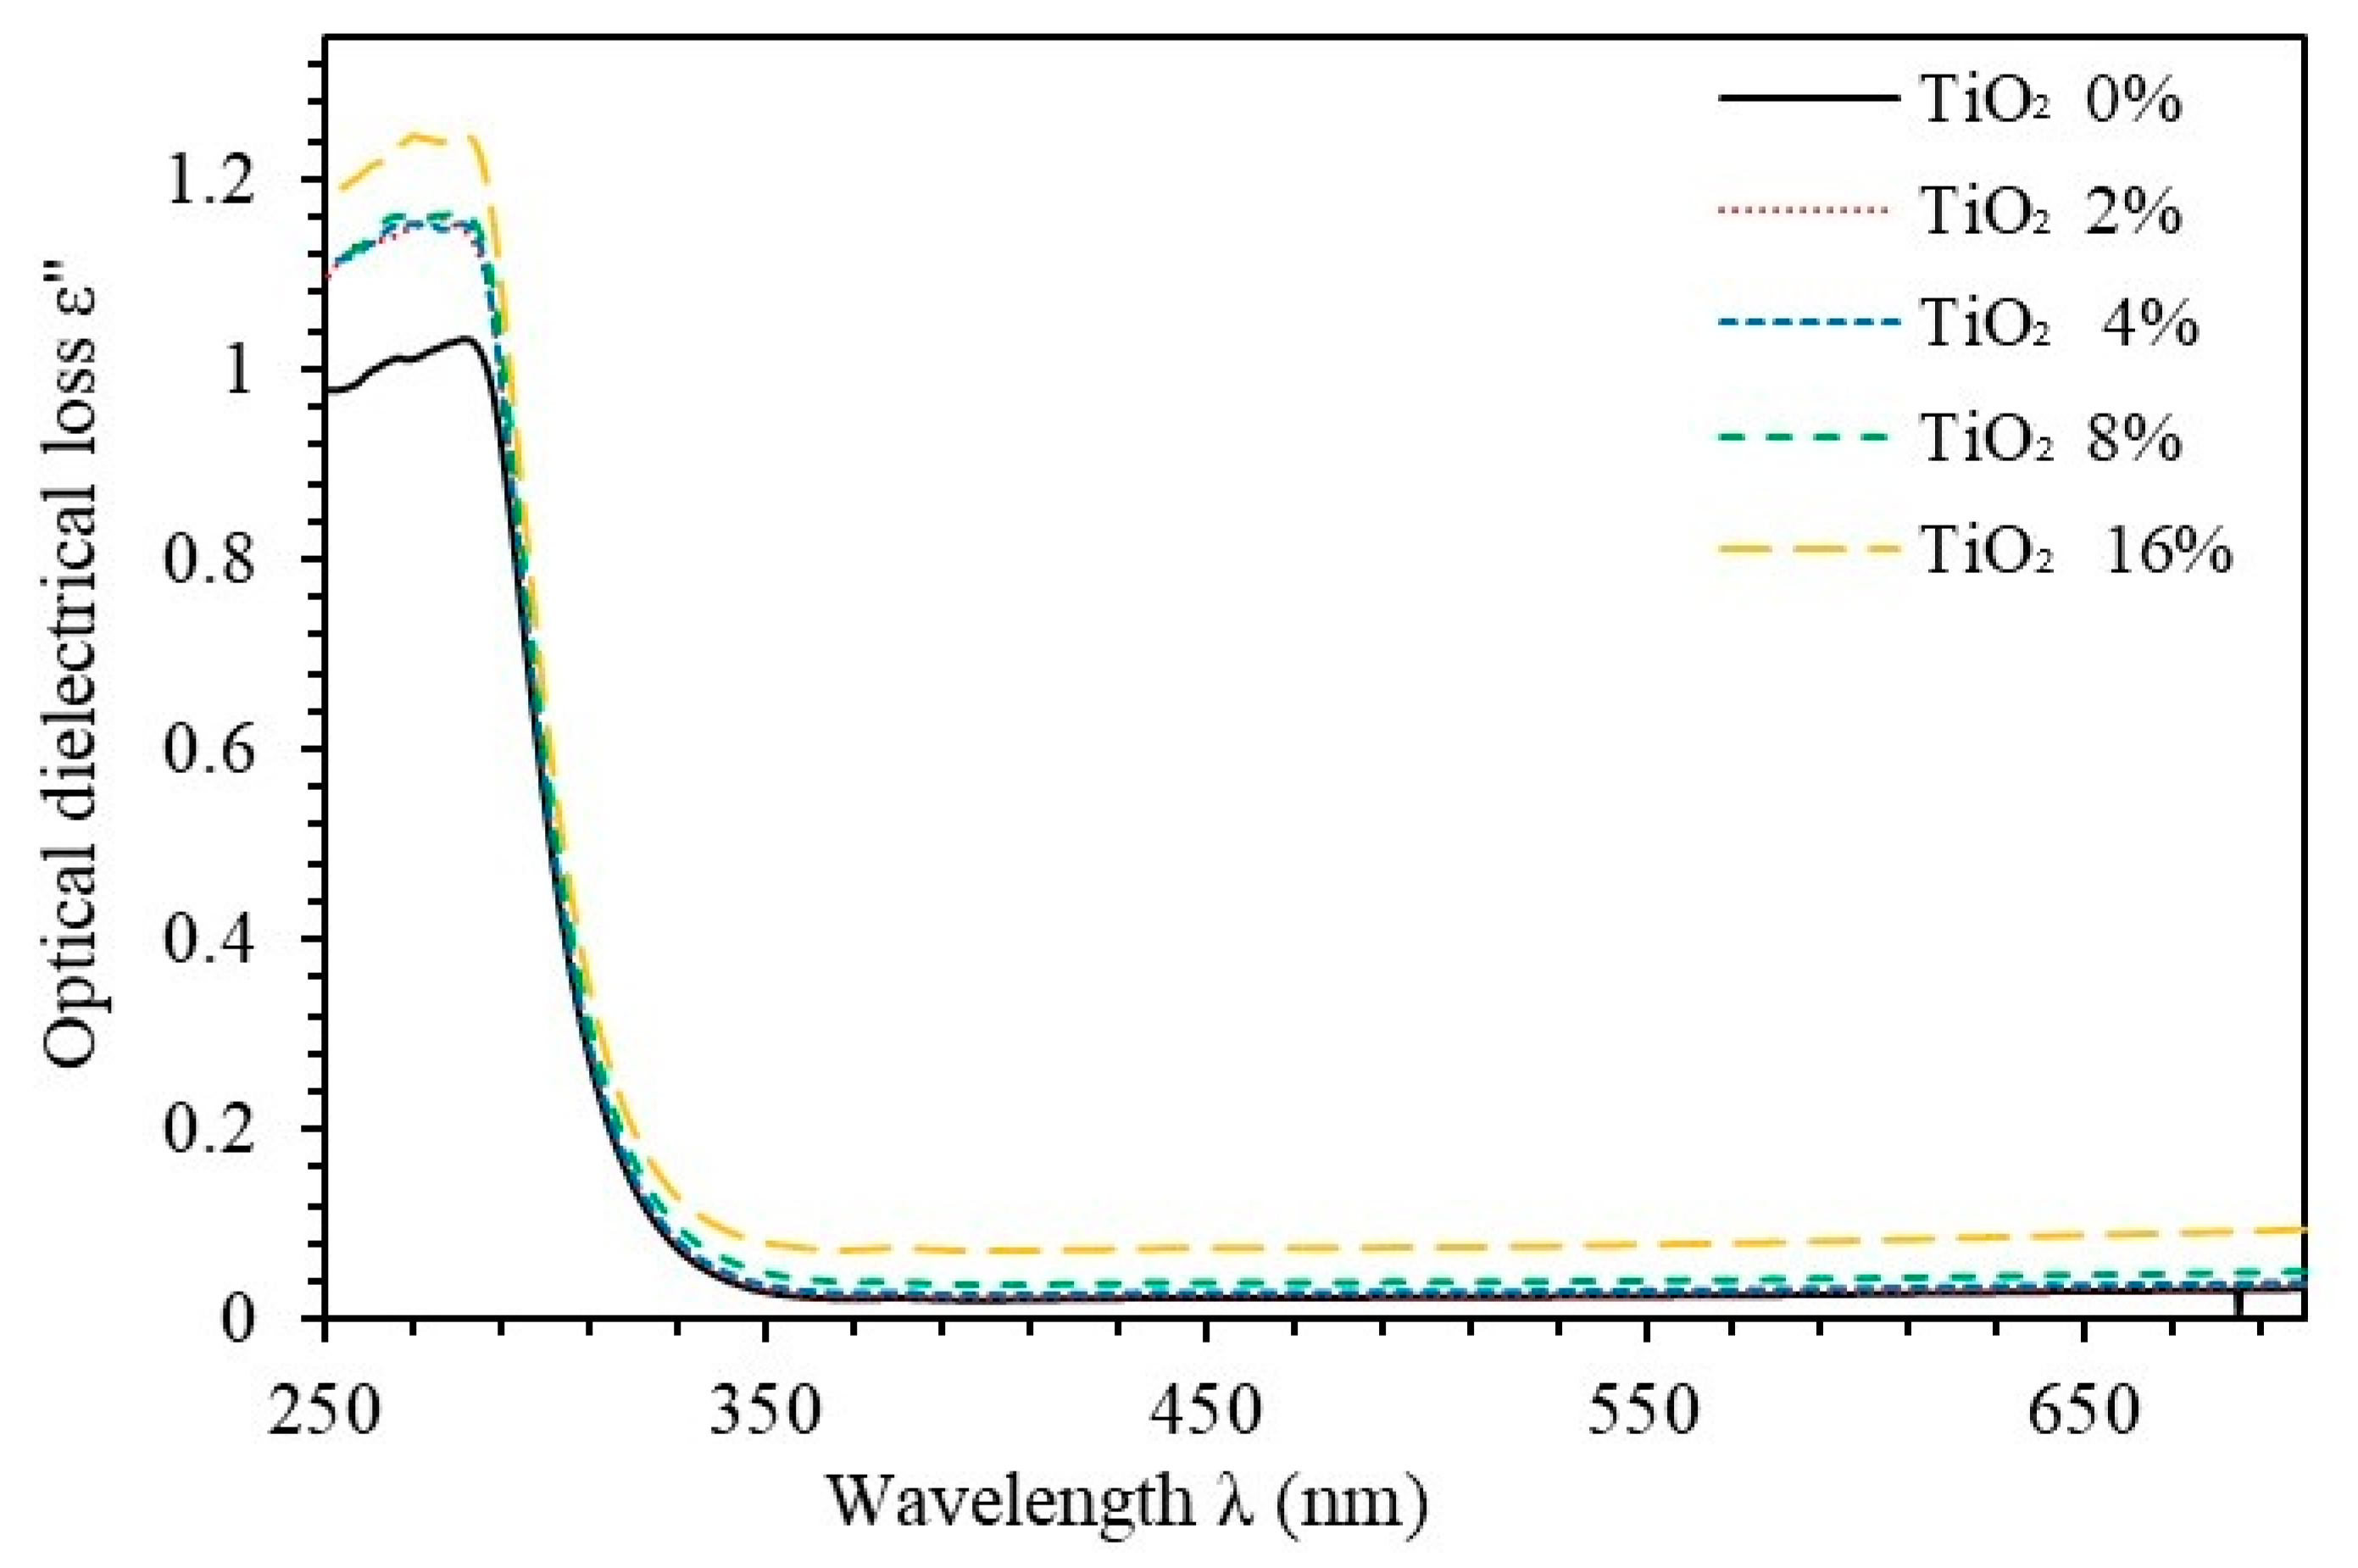
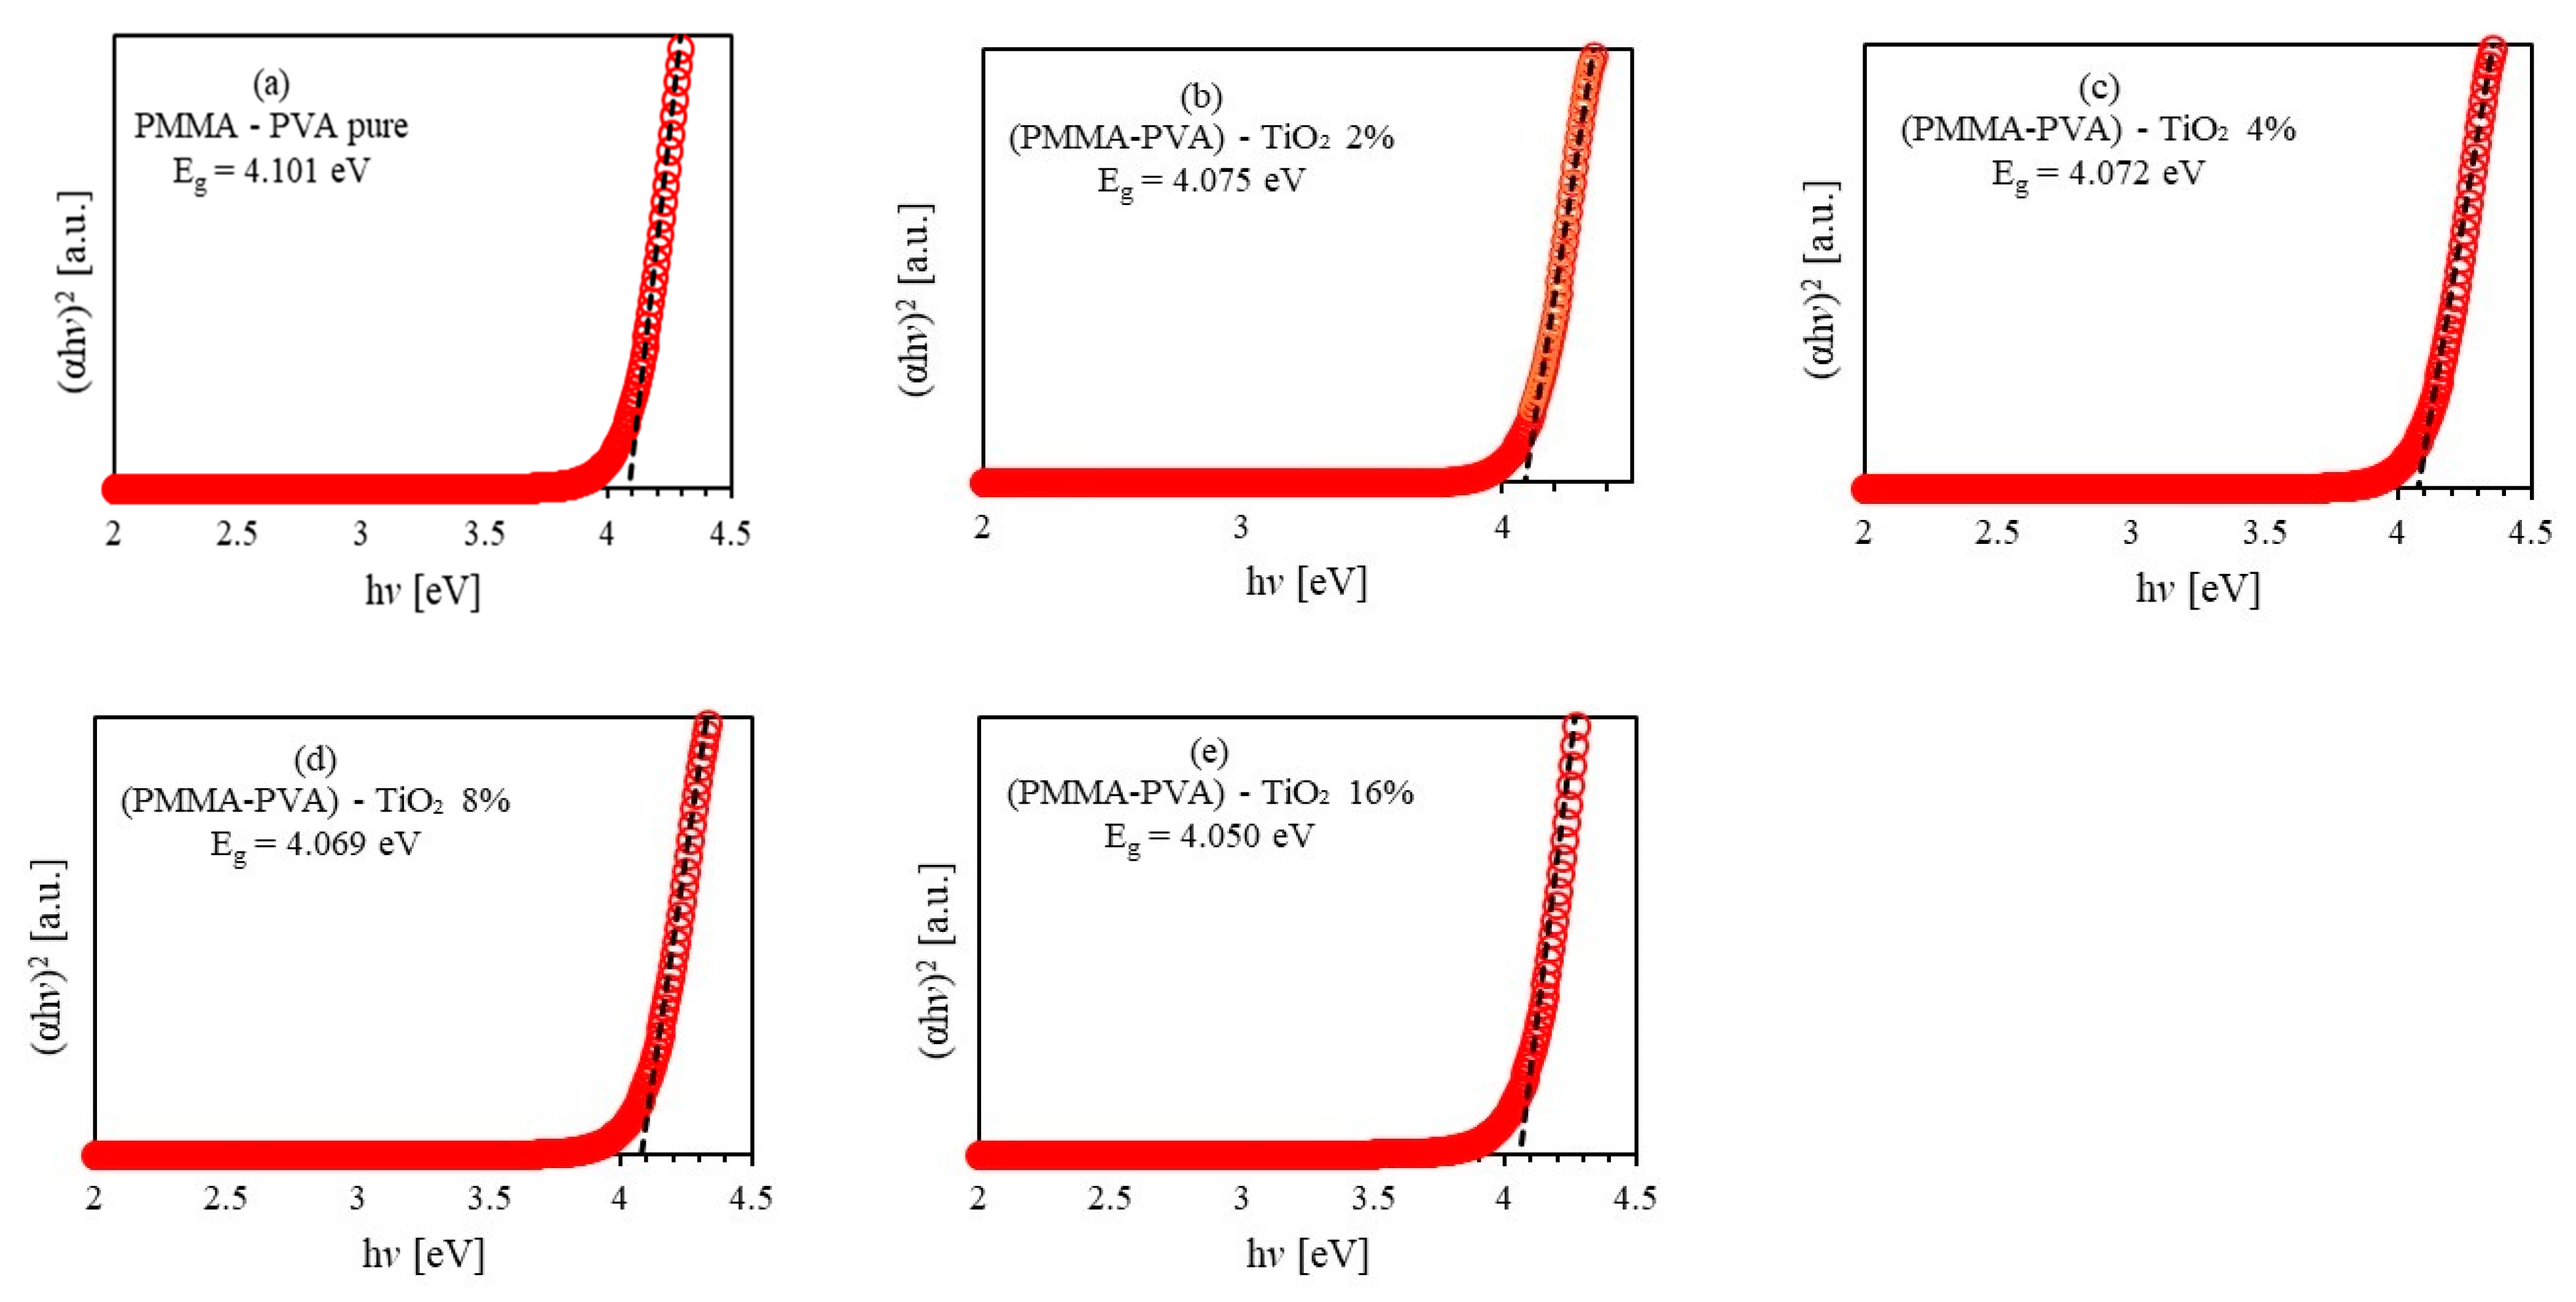
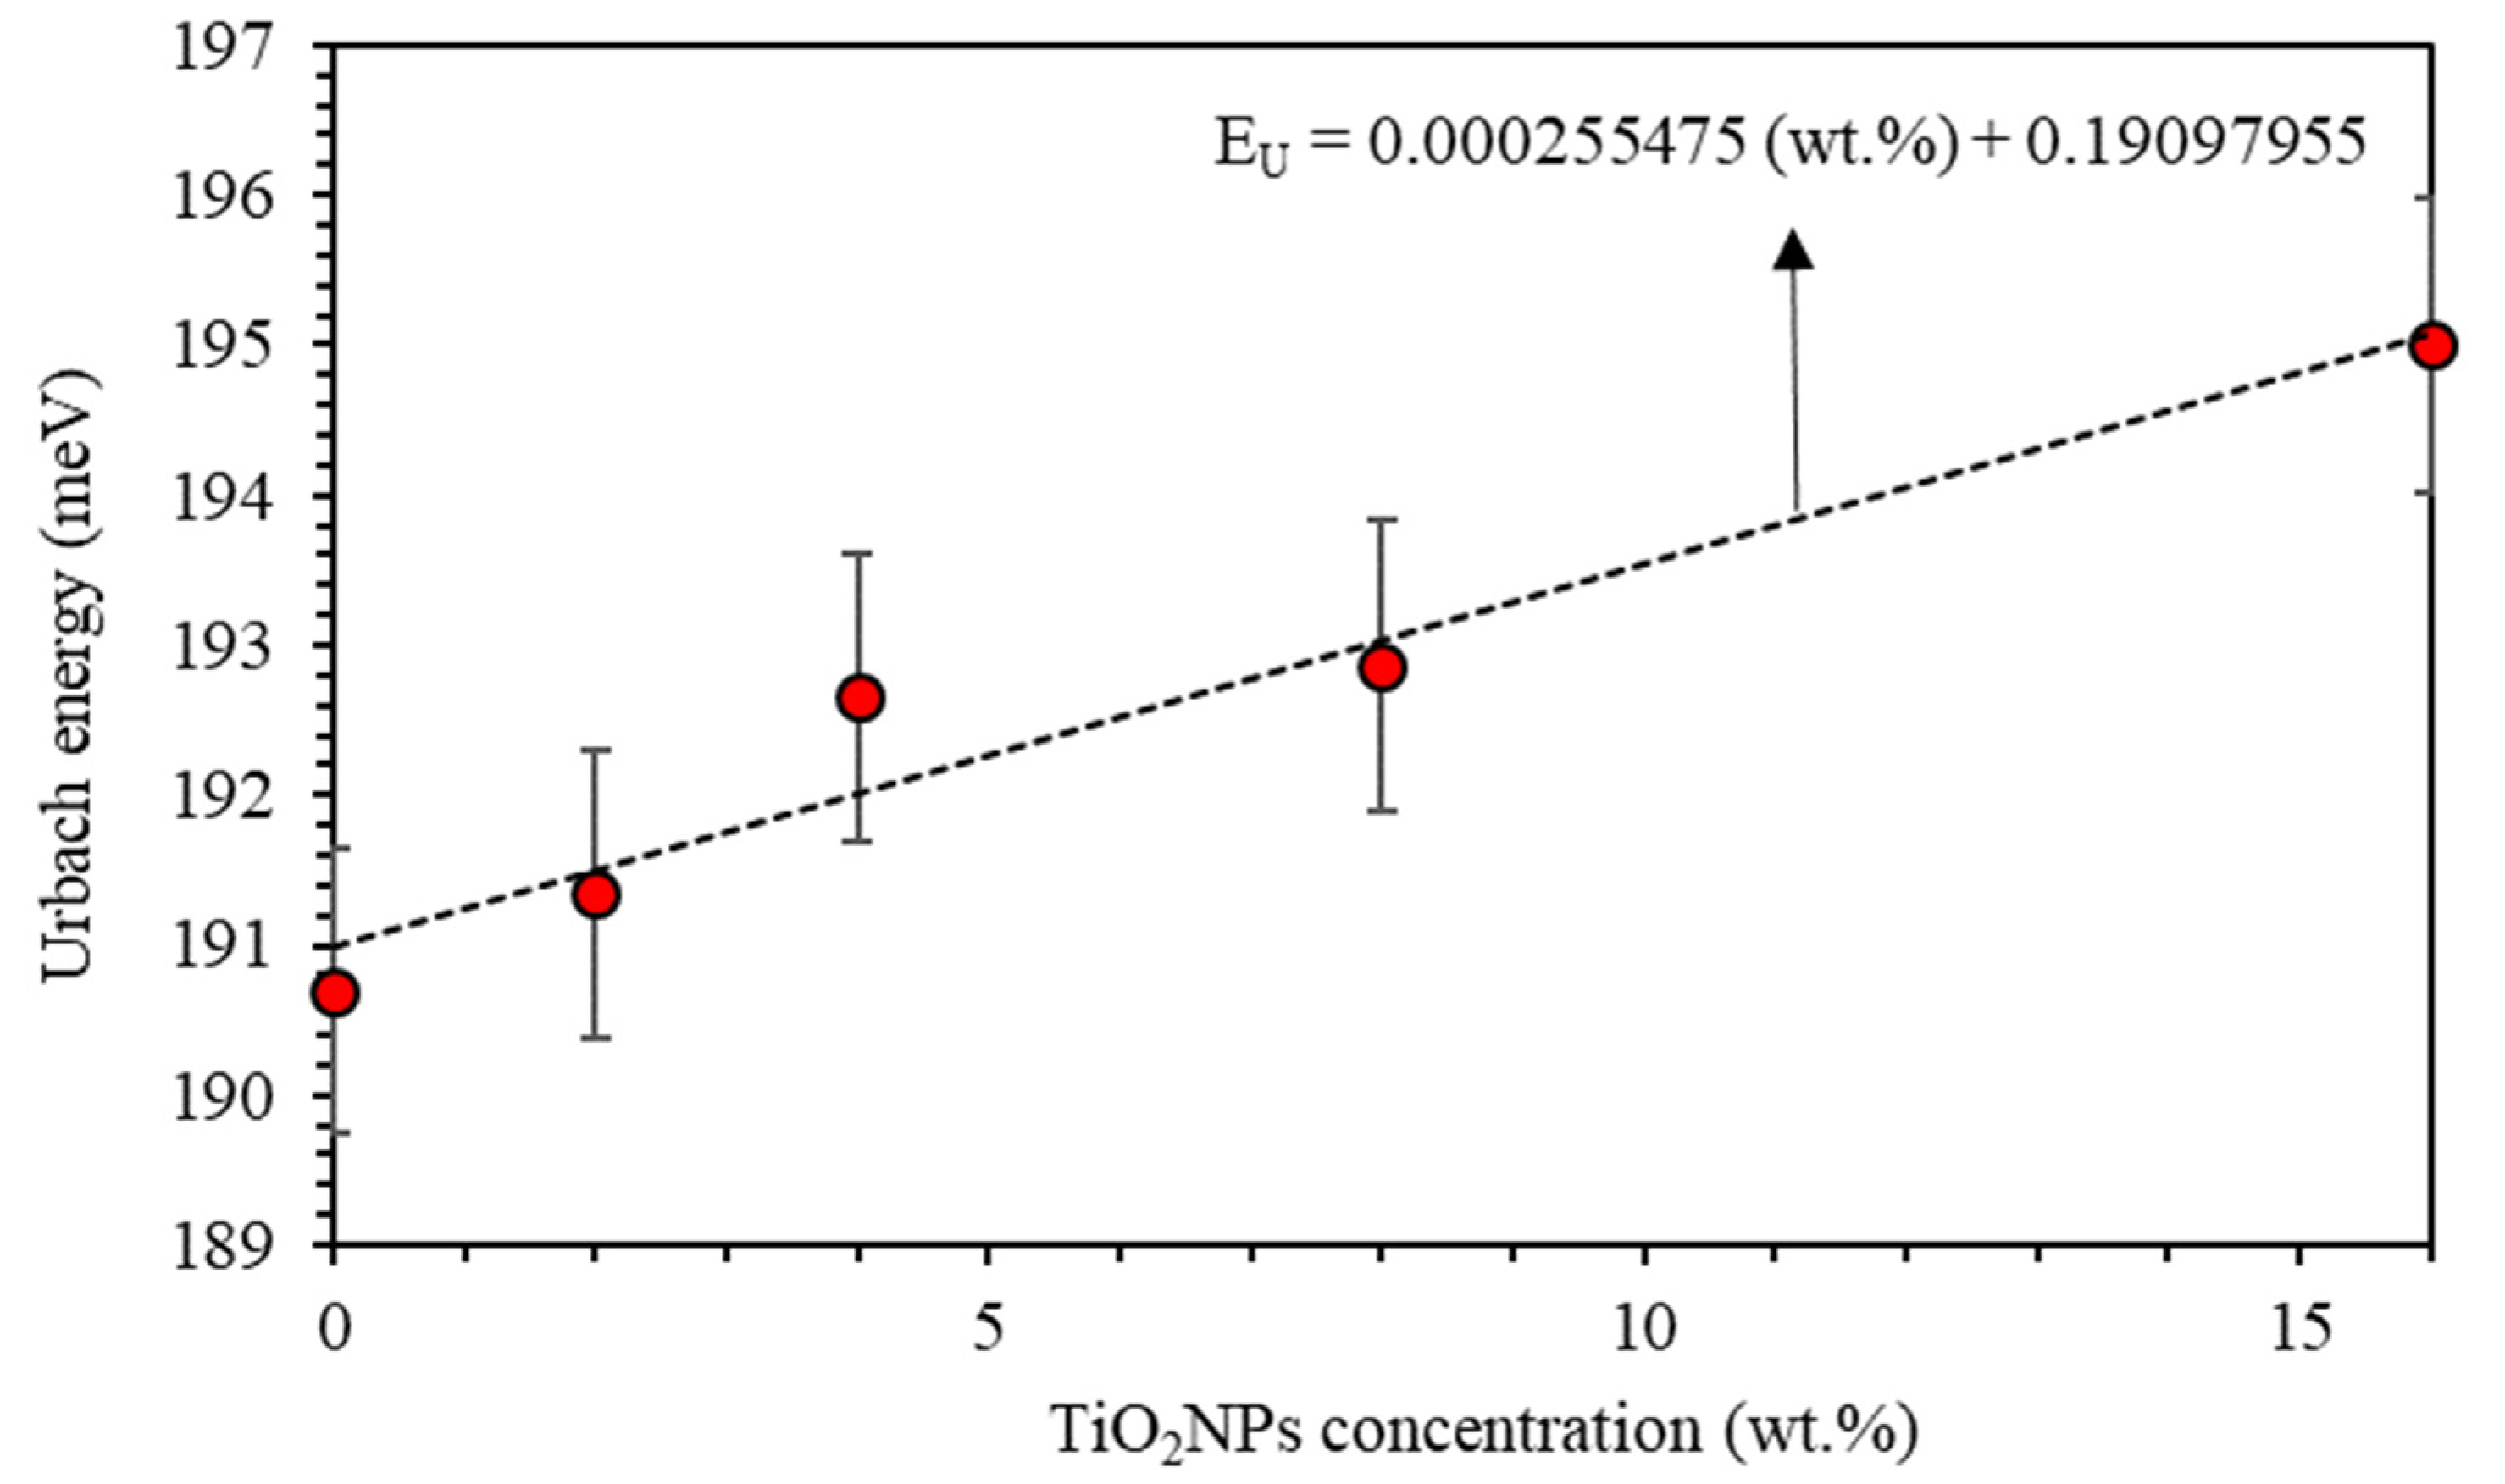
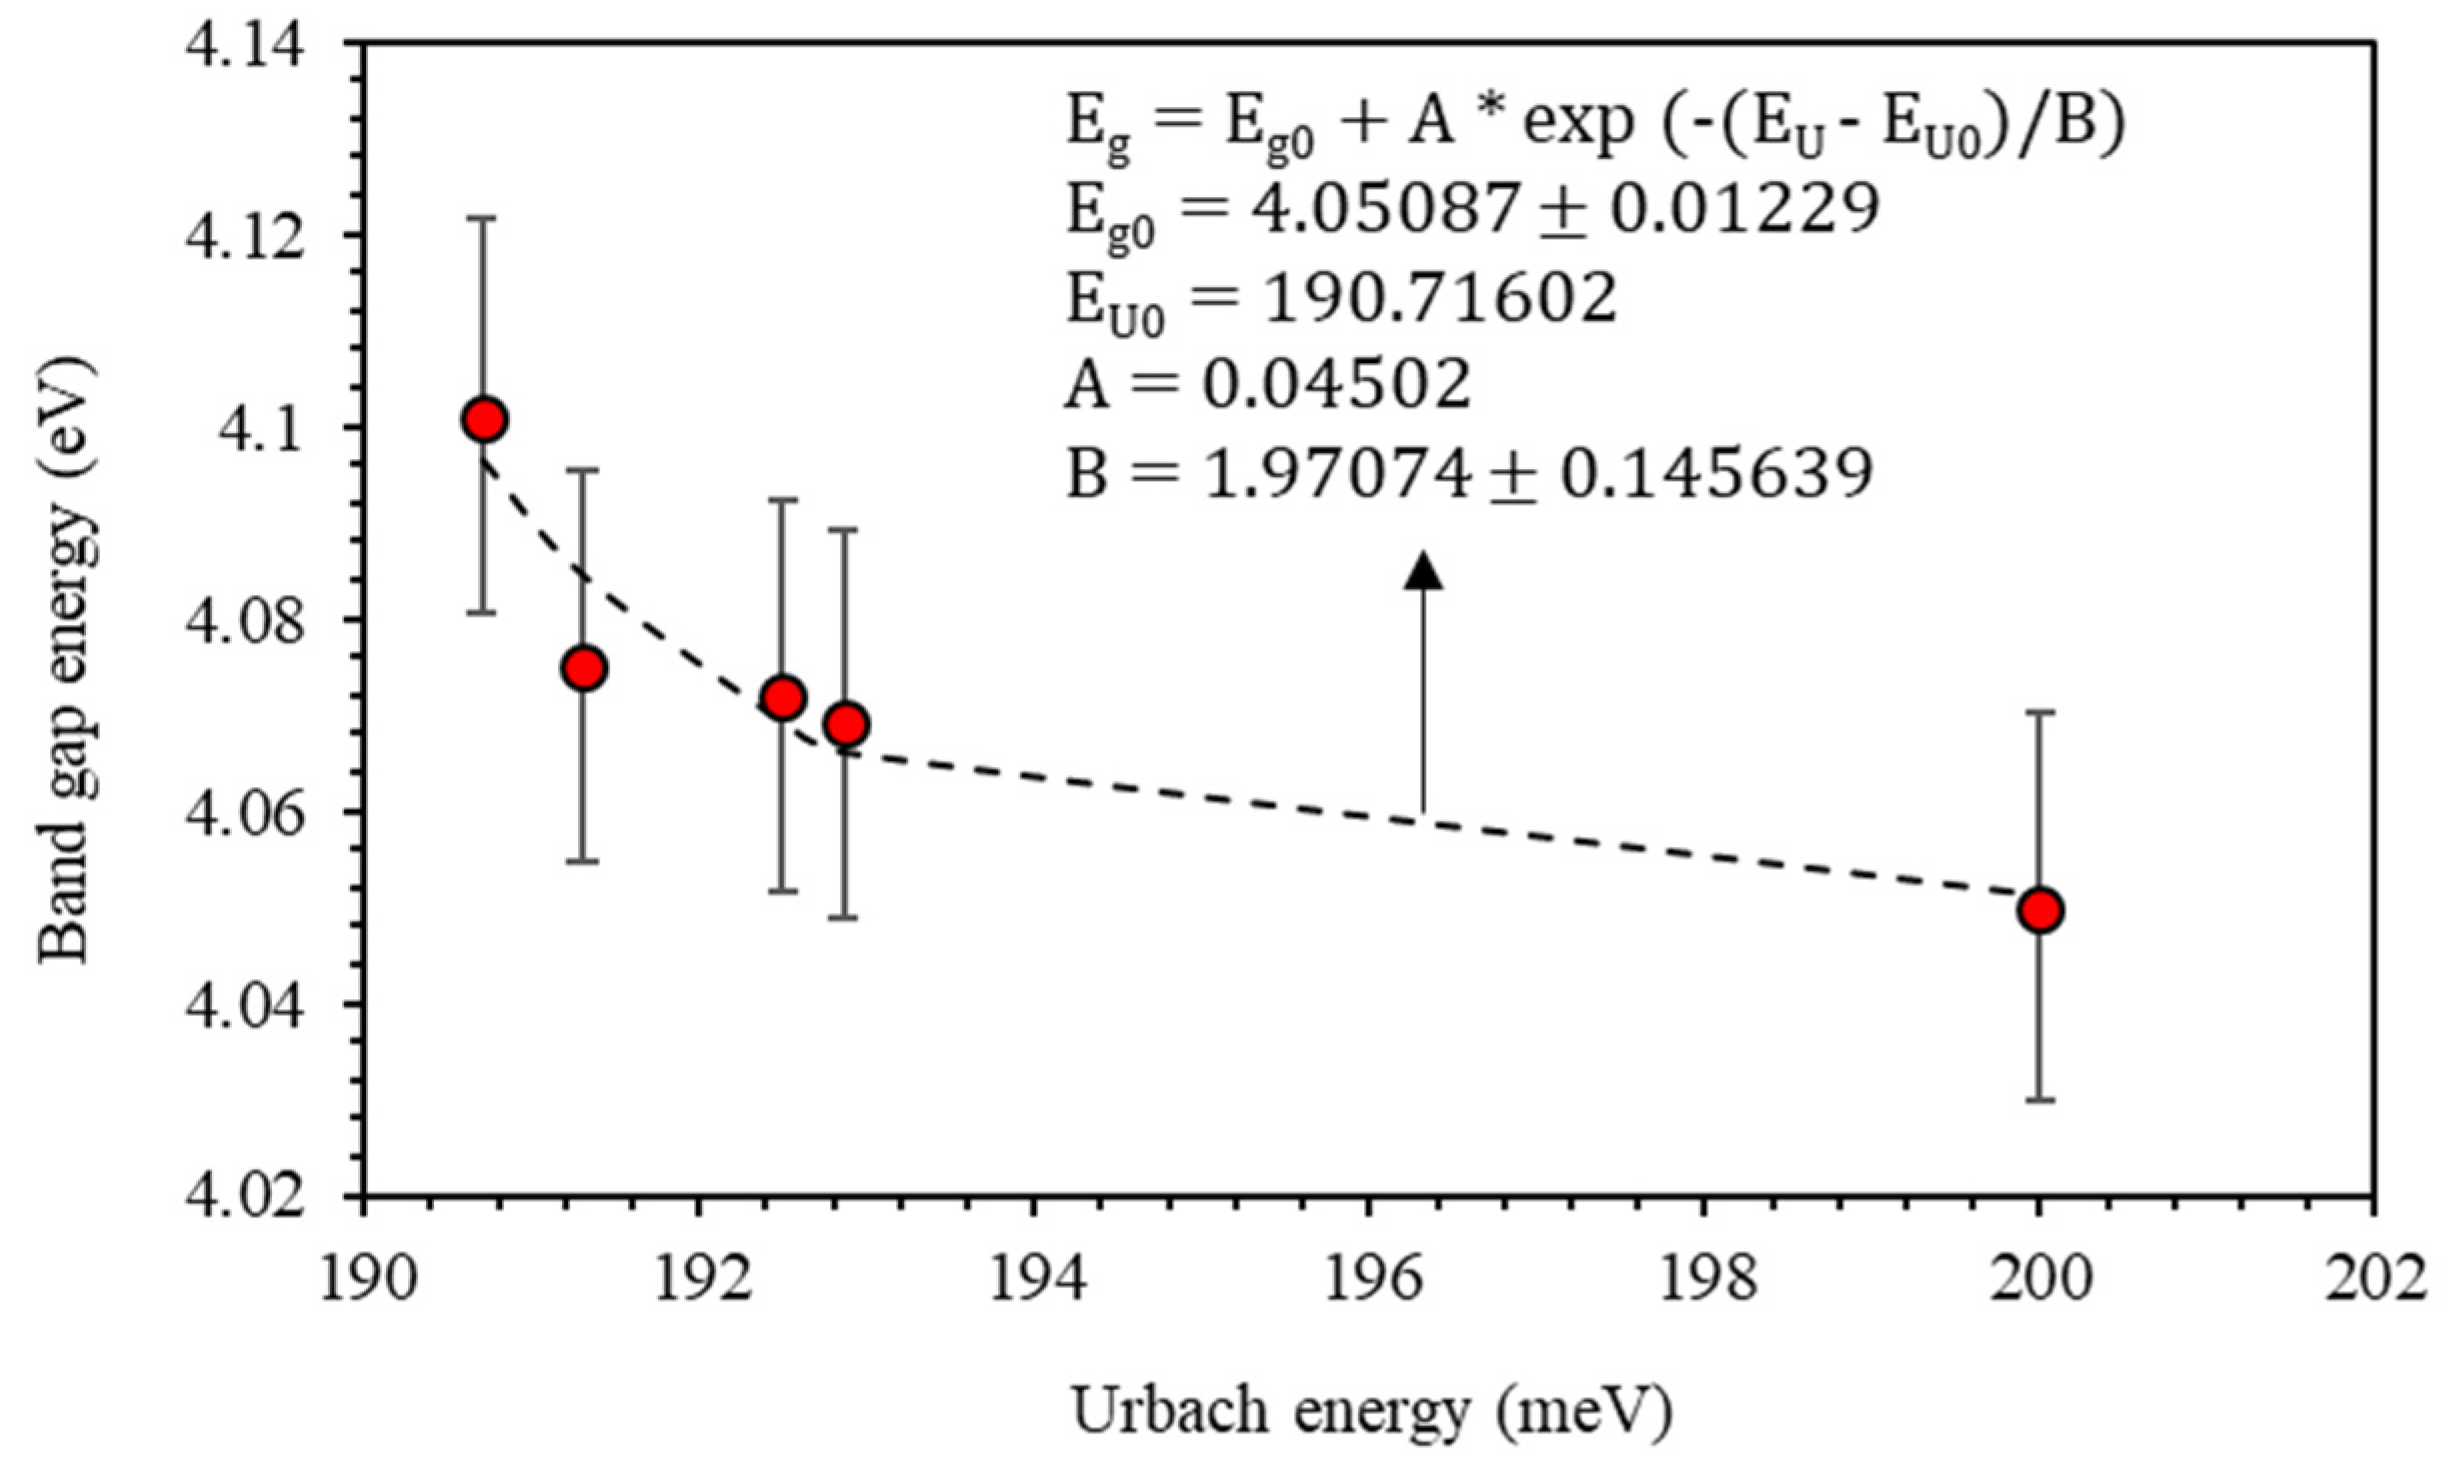
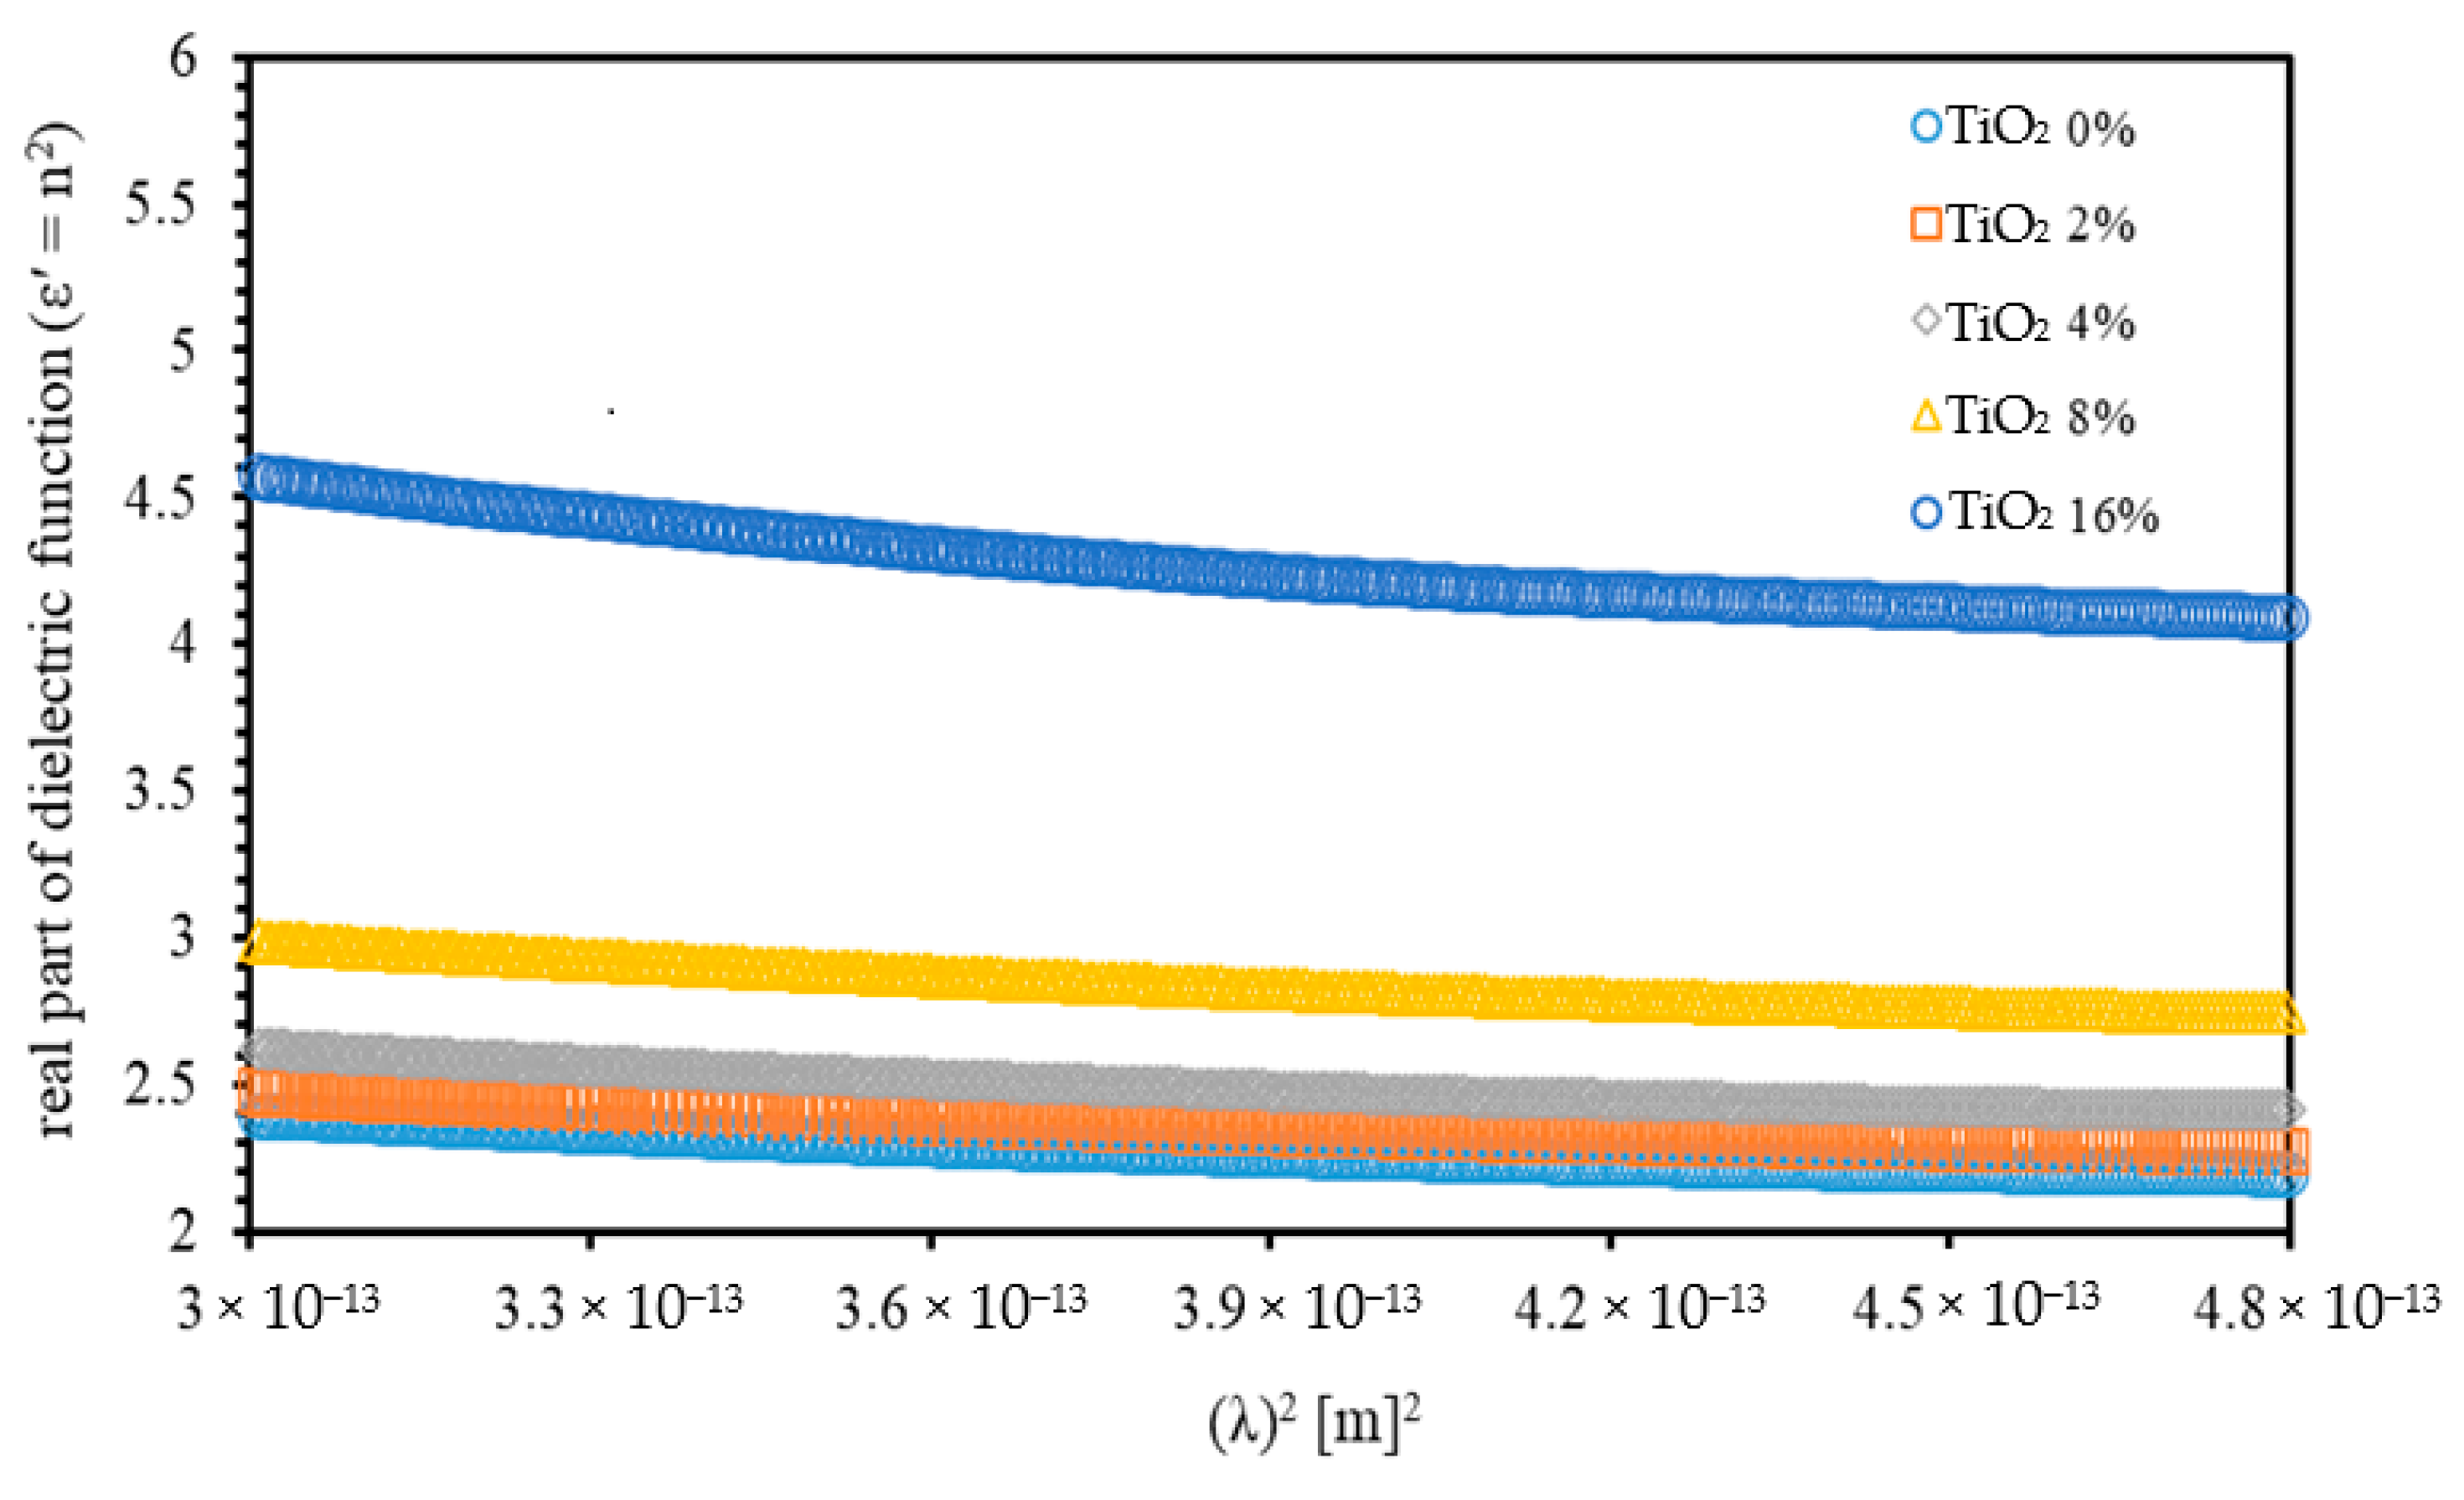
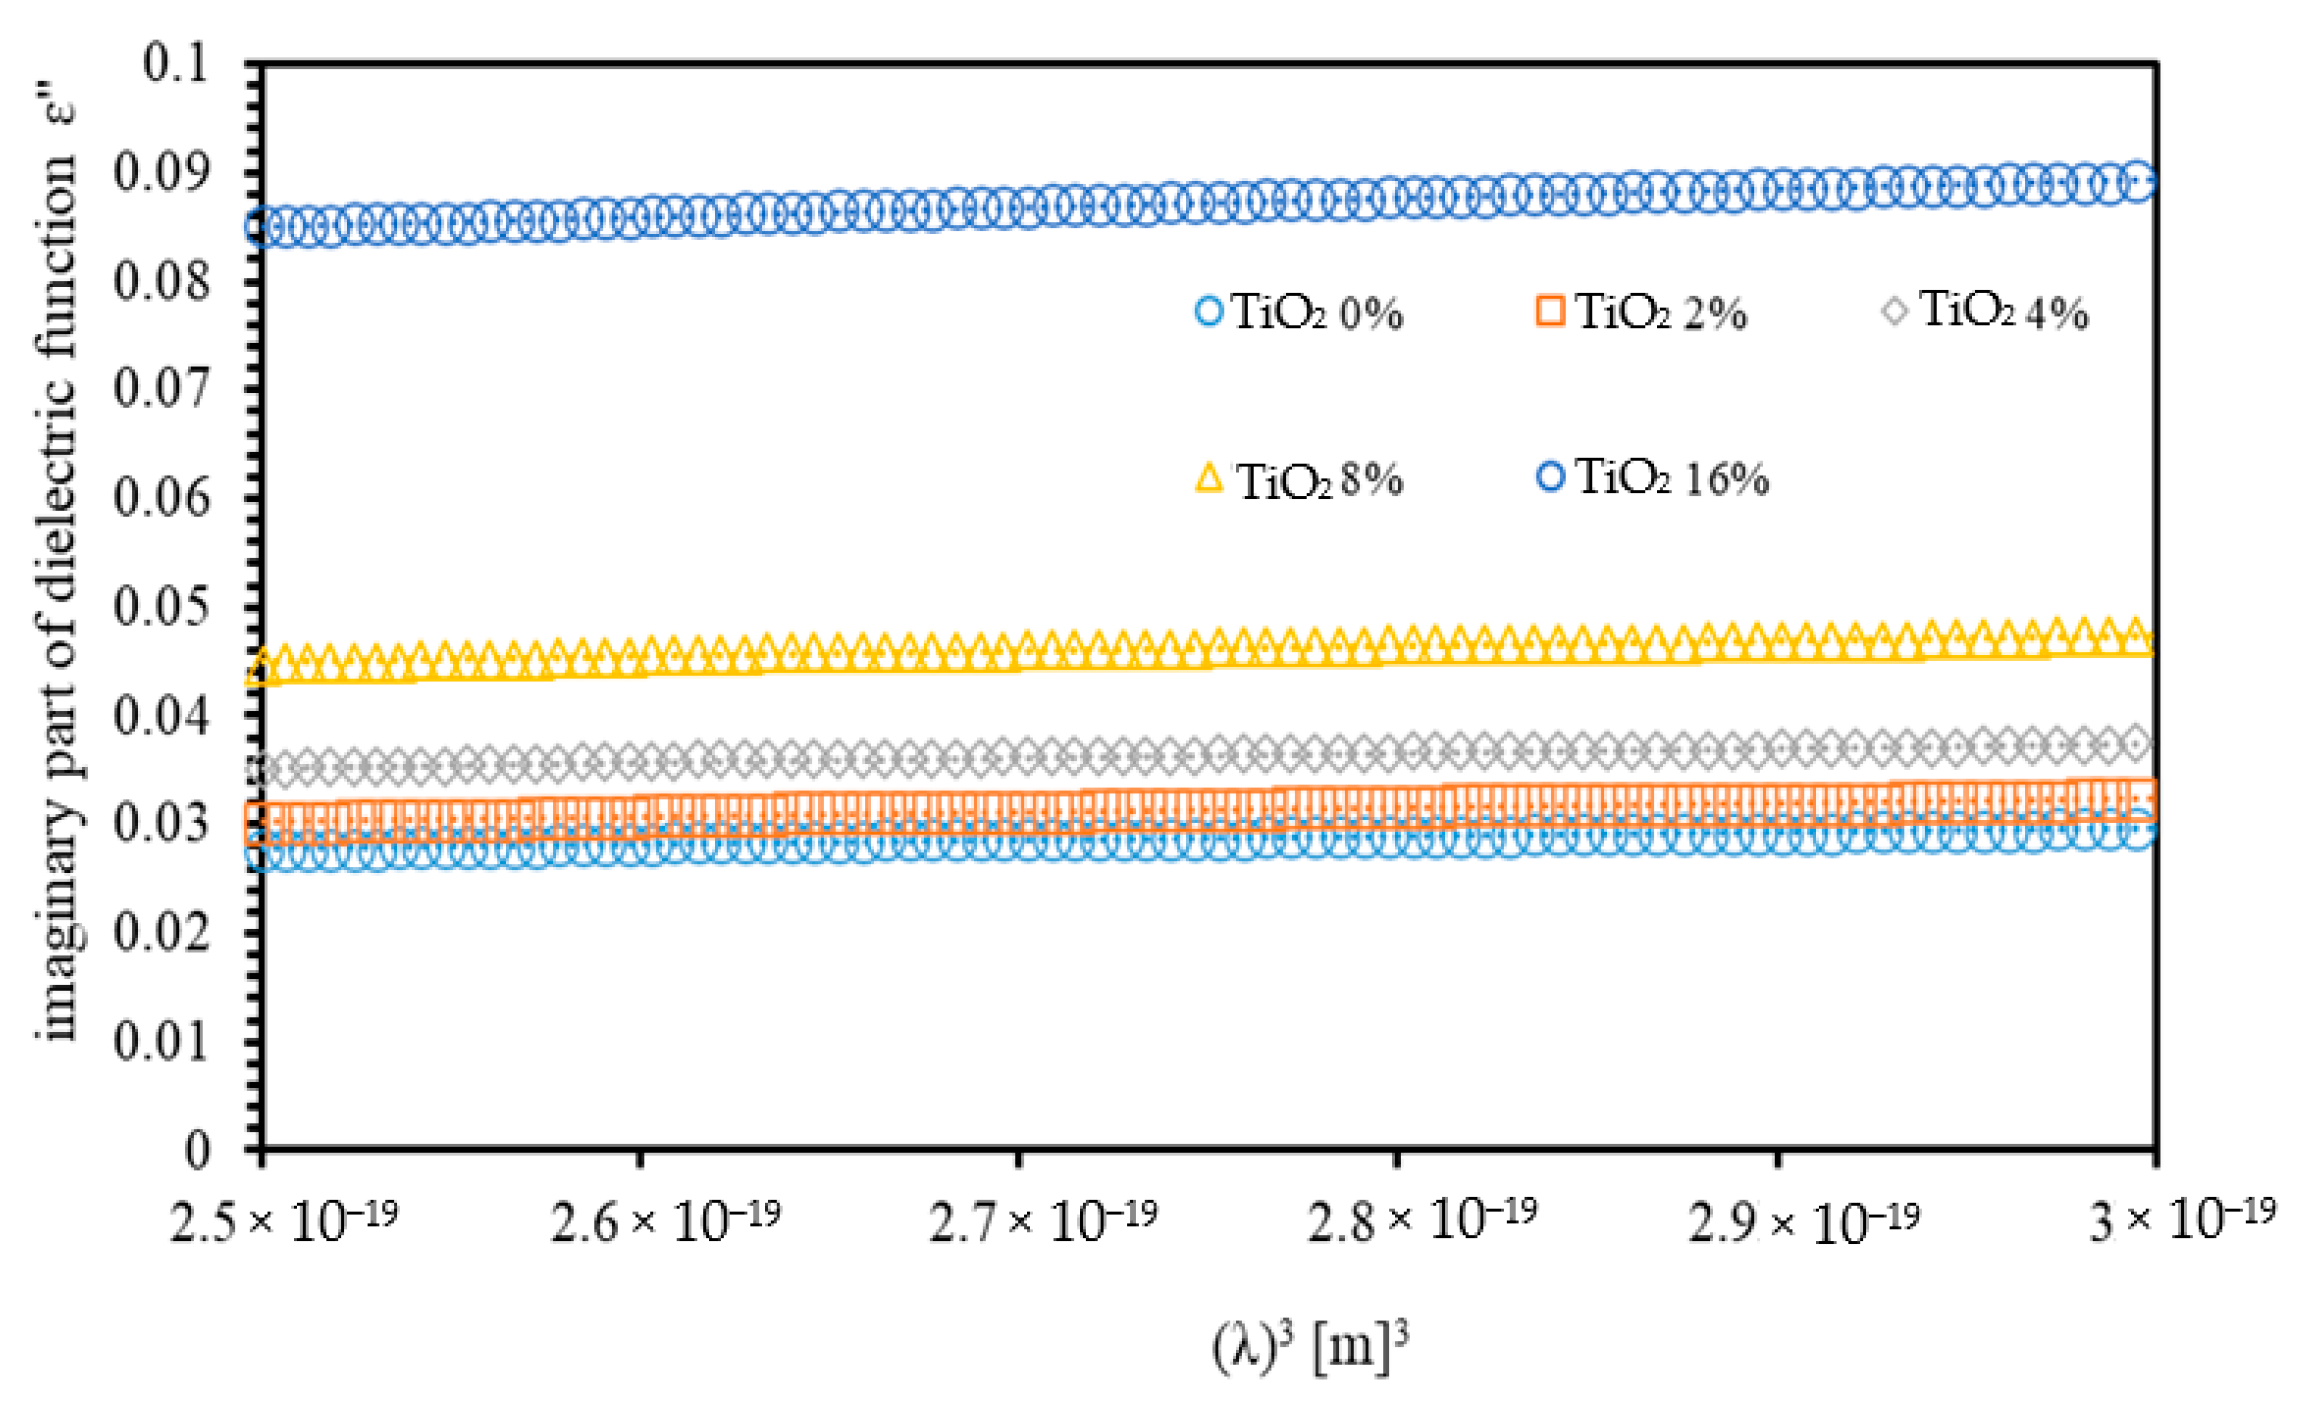
3.2. Optoelectronic Parameters

Optoelectronic parameters of thin films should be accurately measured and appropriately characterized to employ thin films in optoelectronic systems. Refractive index is closely related to both the electronic polarization of ions and the local field inside the optical materials. Remarkably, the refractive index has a normal dispersion in the lower part of the energy spectrum of the incident photons. However, refractive index exhibits an anomalous dispersion in the high energy region. The refractive index dispersion can be used to obtain the ratio of the density of states (ratio of free carrier concentrations to the effective mass ( N c / m * ) and the high frequency dielectric constant ( ε ). The two optoelectronic parameters are given by the formulation of Spitzer-Fan [36]:
n 2 = ε = ε 1 4 π 2 ε 0 ( e 2 c 2 ) ( N c m * ) λ 2
Where e is the electronic charge, c is the light speed, N c is the charge carrier density, m * is the effective mass of the carrier, and ε   is the high frequency dielectric constant. Figure 11 shows the variation of the real part of the dielectric function (   ε = n 2 ) as a function of the square wavelength for (PMMA-PVA)/TiO2 nanocomposite thin films to get the high frequency dielectric constant ( ε ) and density of states ( N c / m * ). The ε value of undoped (PMMA-PVA) polymeric thin film is found to be 2.623. Insertion of (wt.% = 2, 4, 8, and 16%) of TiO2-NPs in (PMMA-PVA) polymeric thin films leads to an increase in the value of ε   to 2.775, 2.935, 3.353, and 5.268, respectively. The obtained ε values are found to be greater than the refractive index indicating that, the existence of the free charge carriers in (PMMA-PVA)/TiO2 nanocomposite thin films are strongly contributing to the polarization process [36]. The N c / m * of (PMMA-PVA)/TiO2 nanocomposite thin films with TiO2-NPs (wt.% = 0, 2, 4, 8, and 16%) is found to increase to 4.273, 5.299, 5.589, 6.440, and 12.525 × 10 + 27 atoms/m3, respectively.
The relaxation time   ( τ ) measures the time that is required by charge carriers in the semiconducting materials to become neutralized during the conduction process. The value of this time is infinitesimal in the case of metals, but it is small in semiconductors and large for insulators. Drude free electron model demonstrates that both, the real part and imaginary parts of the dielectric function are functions of wavelength of the incident photon according to Equation (1) and the relation [36].
ε = 1 4 π 3 ϵ 0 ( e 2 c 3 ) ( N c m * ) ( 1 τ ) λ 3
The imaginary part of the dielectric function ( ε )   as a function of the cubic wavelength ( λ 3 )   of the incident photon can be analyzed to determine τ as proposed by the Drude model. The N c / m * ratio can be calculated from equation (1). Moreover, Q. Shen et. al. formulates the relationship of m * and m e . This relation gives m * = 0.44   m e   [36]. Consequently, free carrier concentrations ( N c ) can be evaluated. Figure 12 shows the variation of the ε as a function of the λ 3 for (PMMA-PVA)/TiO2 nanocomposite thin films. The plot can be utilized to determine τ . The τ constant can be determined from the slope of the plot of ε versus λ 3 and from the density of states calculated previously from the equation (1). τ of (PMMA-PVA)/TiO2 nanocomposite thin films at (wt.% = 0, 2, 4, 8, and 16%) was found to increase to 2.49, 2.70, 2.76, 2.84, and 3.17 × 10 14   (s), respectively, compared to that of un-doped thin films.
Finally, from the determination of the τ , the optical mobility ( μ o p t ) and the optical resistivity ( ρ o p t ) of thin films can be calculated accordingly as [36],
μ o p t = e τ m *
ρ o p t = 1 e μ o p t N c
The calculated values of N c / m * ,   N c ,   τ , μ o p t , and ρ o p t   are listed in Table 1.

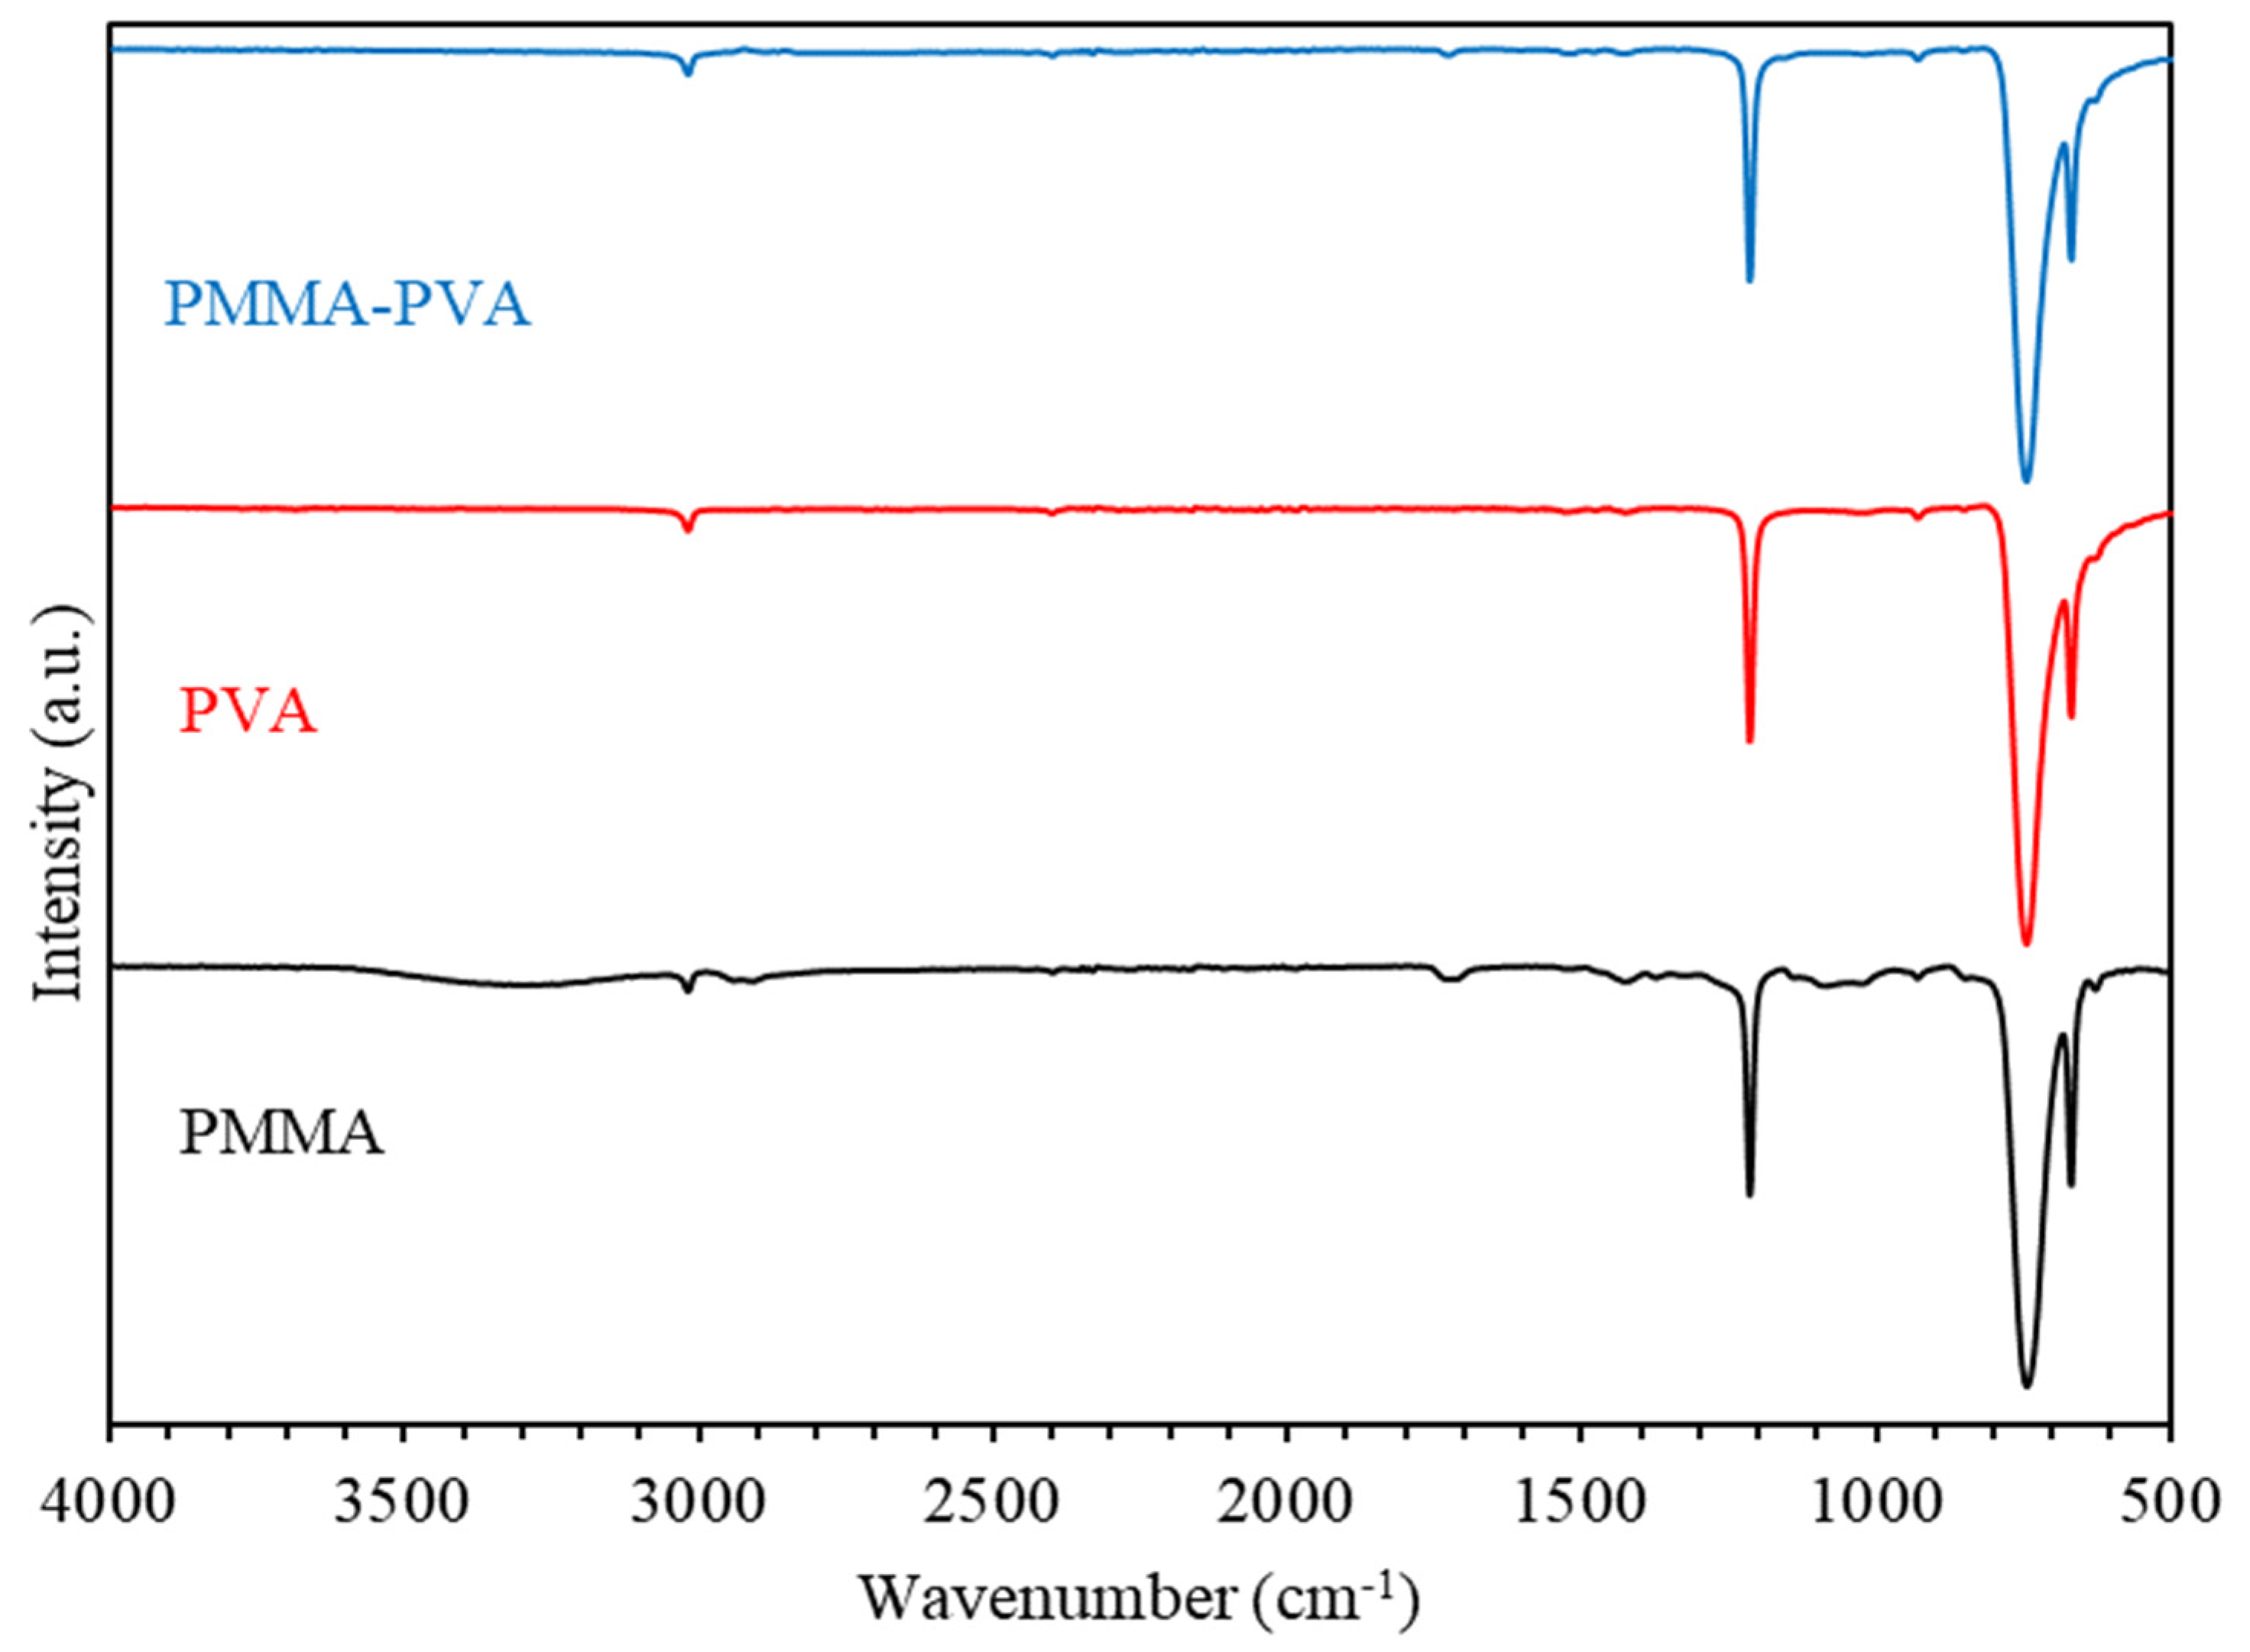
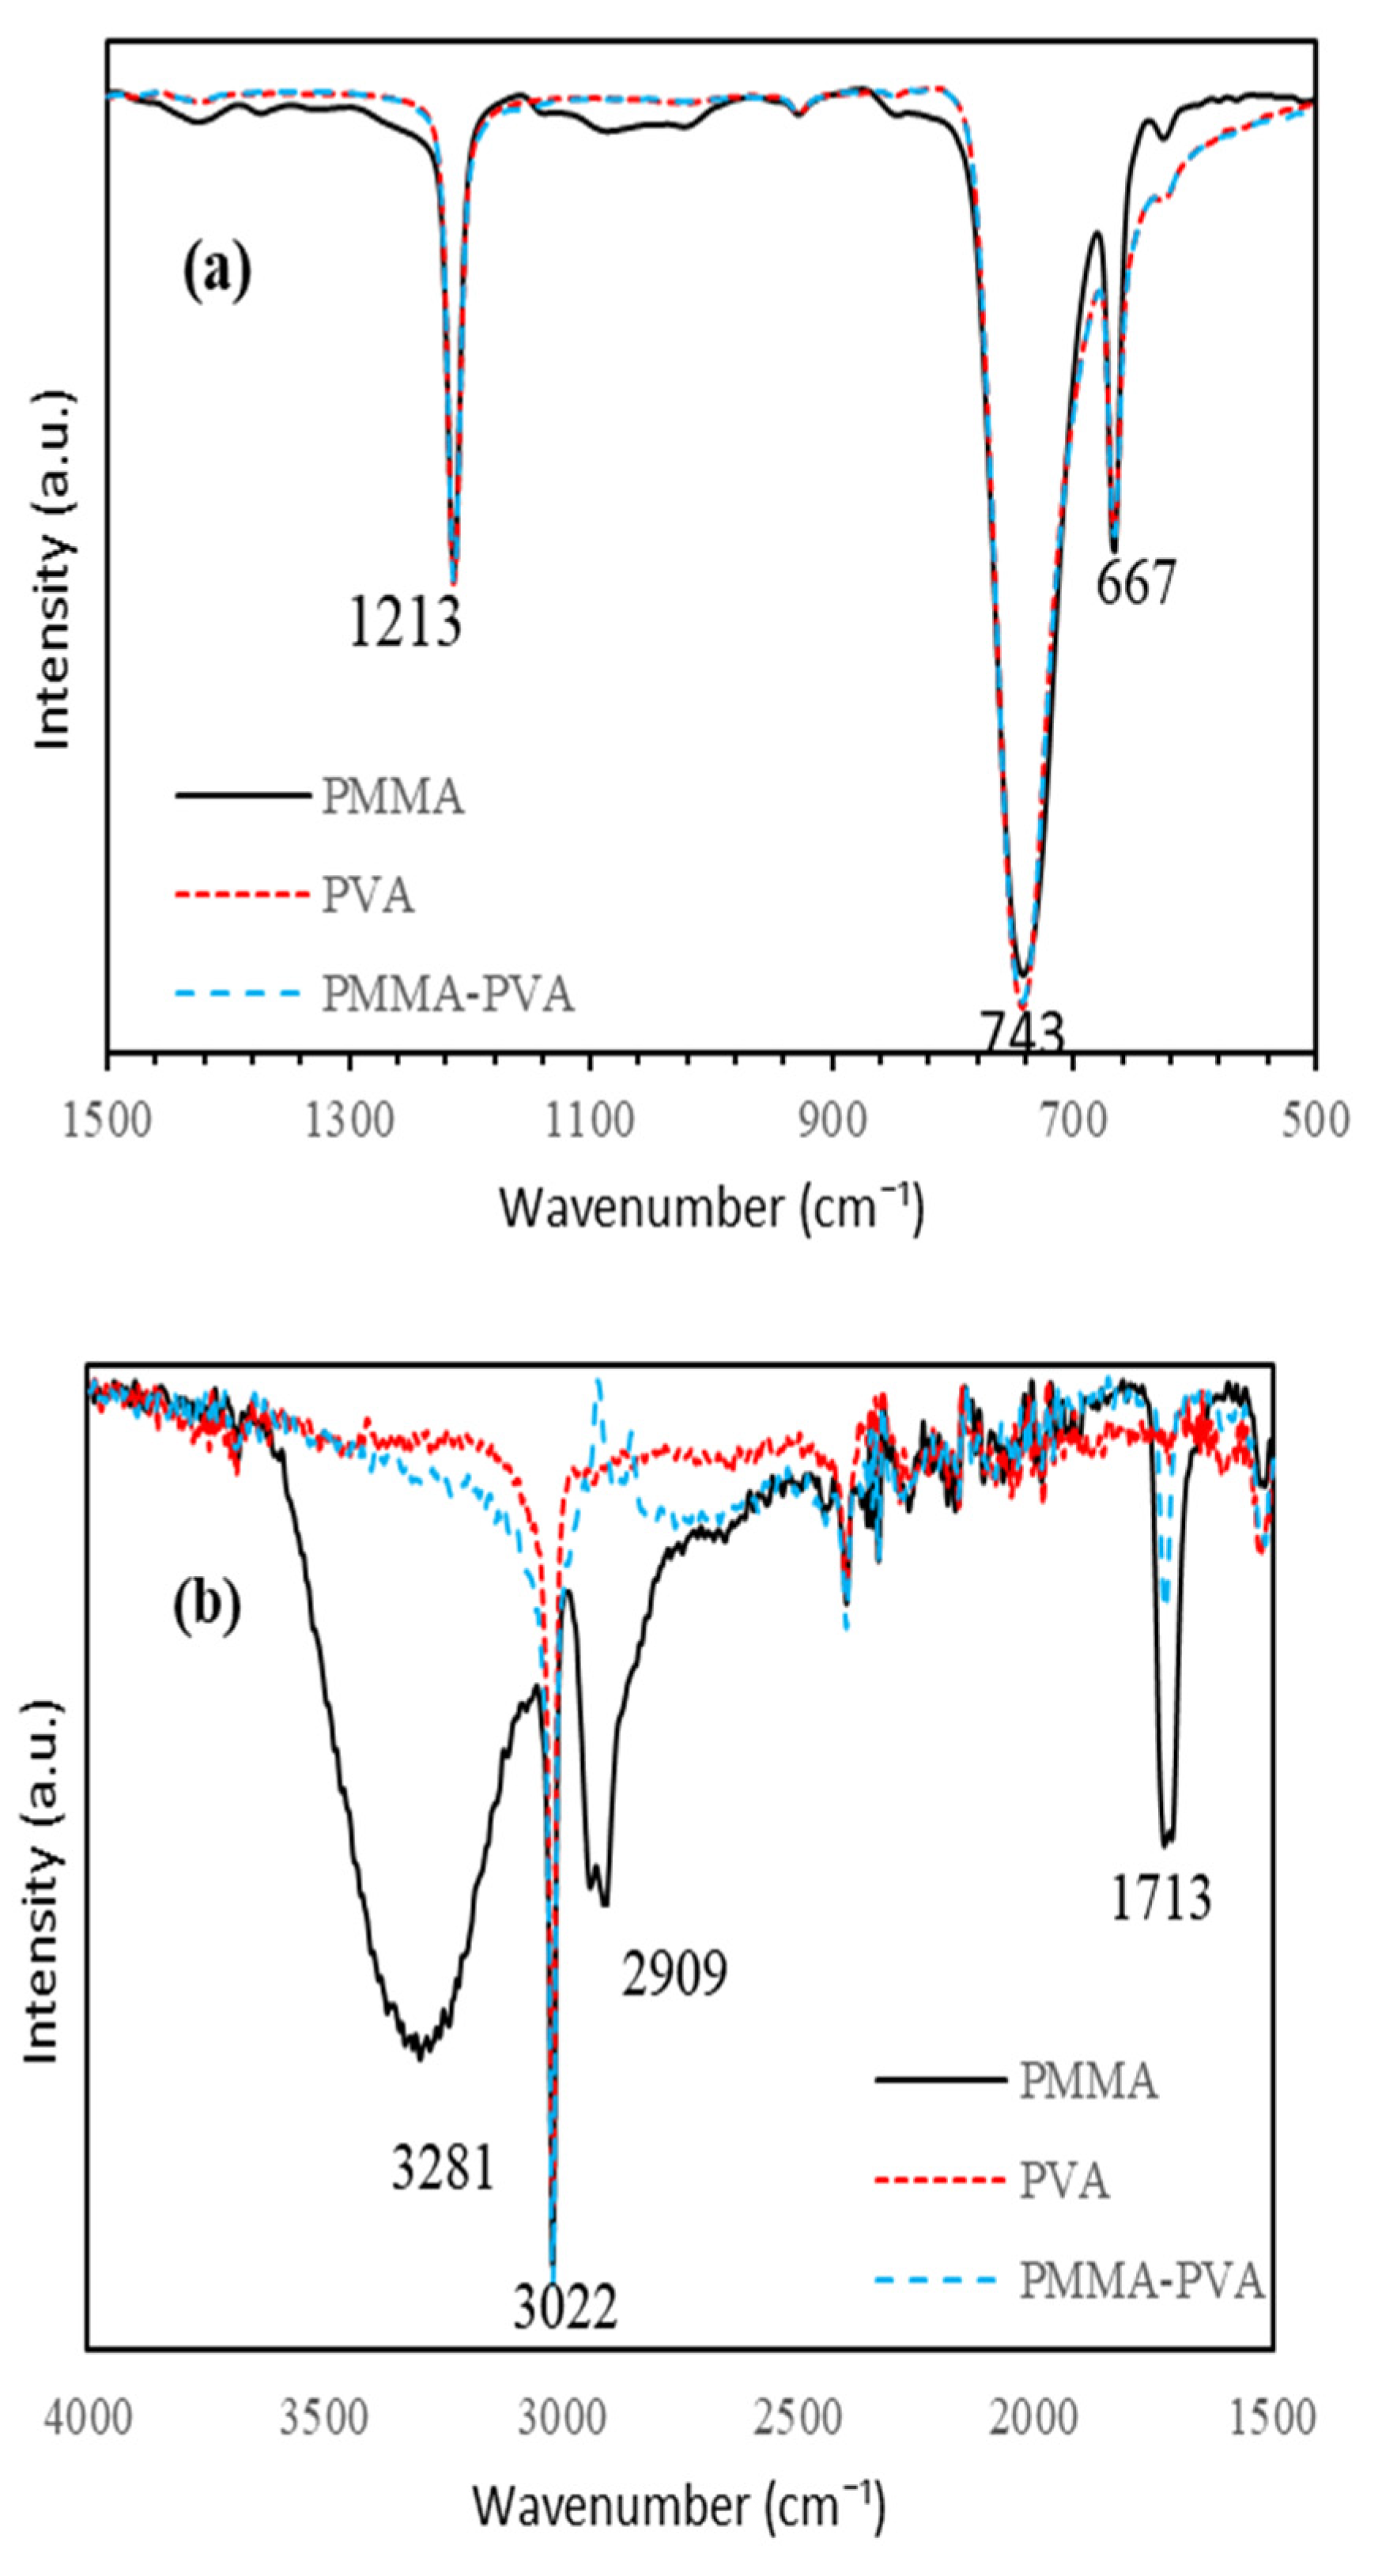
3.3. The FTIR Spectra of (PMMA-PVA) Polymeric Thin Films

Figure 13 shows Fourier Transform Infrared spectroscopy (FTIR) spectra of (PMMA-PVA) polymeric thin films as a function of wavenumber in the range (500–4000 cm−1). Figure 14 shows FTIR spectra of (PMMA-PVA) polymeric thin films measured in the range (500–1500) and (1500–2500) cm−1. Our results indicate that vibrational frequencies of (PMMA-PVA) polymeric thin films coincide exactly with several vibrational frequencies observed for pure PVA polymer thin films. This observation is attributed to the fact that PVA thin film has dense molecular packing in the polymeric nanocomposite and stronger intermolecular hydrogen bonds in comparison with the PMMA component. The weak intermolecular hydrogen bonds of PMMA is responsible for the disappearance of functional groups of PMMA in the polymer blend [37]. Furthermore, the obtained FTIR spectrum demonstrates shifts of some band positions and changes in the intensities of some other bands compared with pure PMMA and PVA polymeric thin films. These shifts and the increase in intensities of some bands are attributed to the strong intramolecular interactions in (PVA-PMMA) blends. For (PMMA-PVA) polymeric thin films, vibrational band at 667 cm–1 could be ascribed to the (C–O) bending vibration. Whereas the vibrational band located at 743 cm–1 could be attributed to the bending vibration mode of (C–H) bond. Additionally, the vibrational band positioned at 1213 cm–1 may be credited to the (C–O) bond stretching. Moreover, vibrational bands at 1713 cm–1 could be assigned to the stretching modes of carbonyl (C=O) groups [37]. Lastly, The broad band at 3020 cm−1 indicates the presence of the (C–H) and (O–H) stretching vibration. The increase and decrease in the peak intensities of the whole FTIR spectra of (PMMA-PVA) polymeric thin films is mainly due to the intermolecular bonding between the PMMA and PVA.

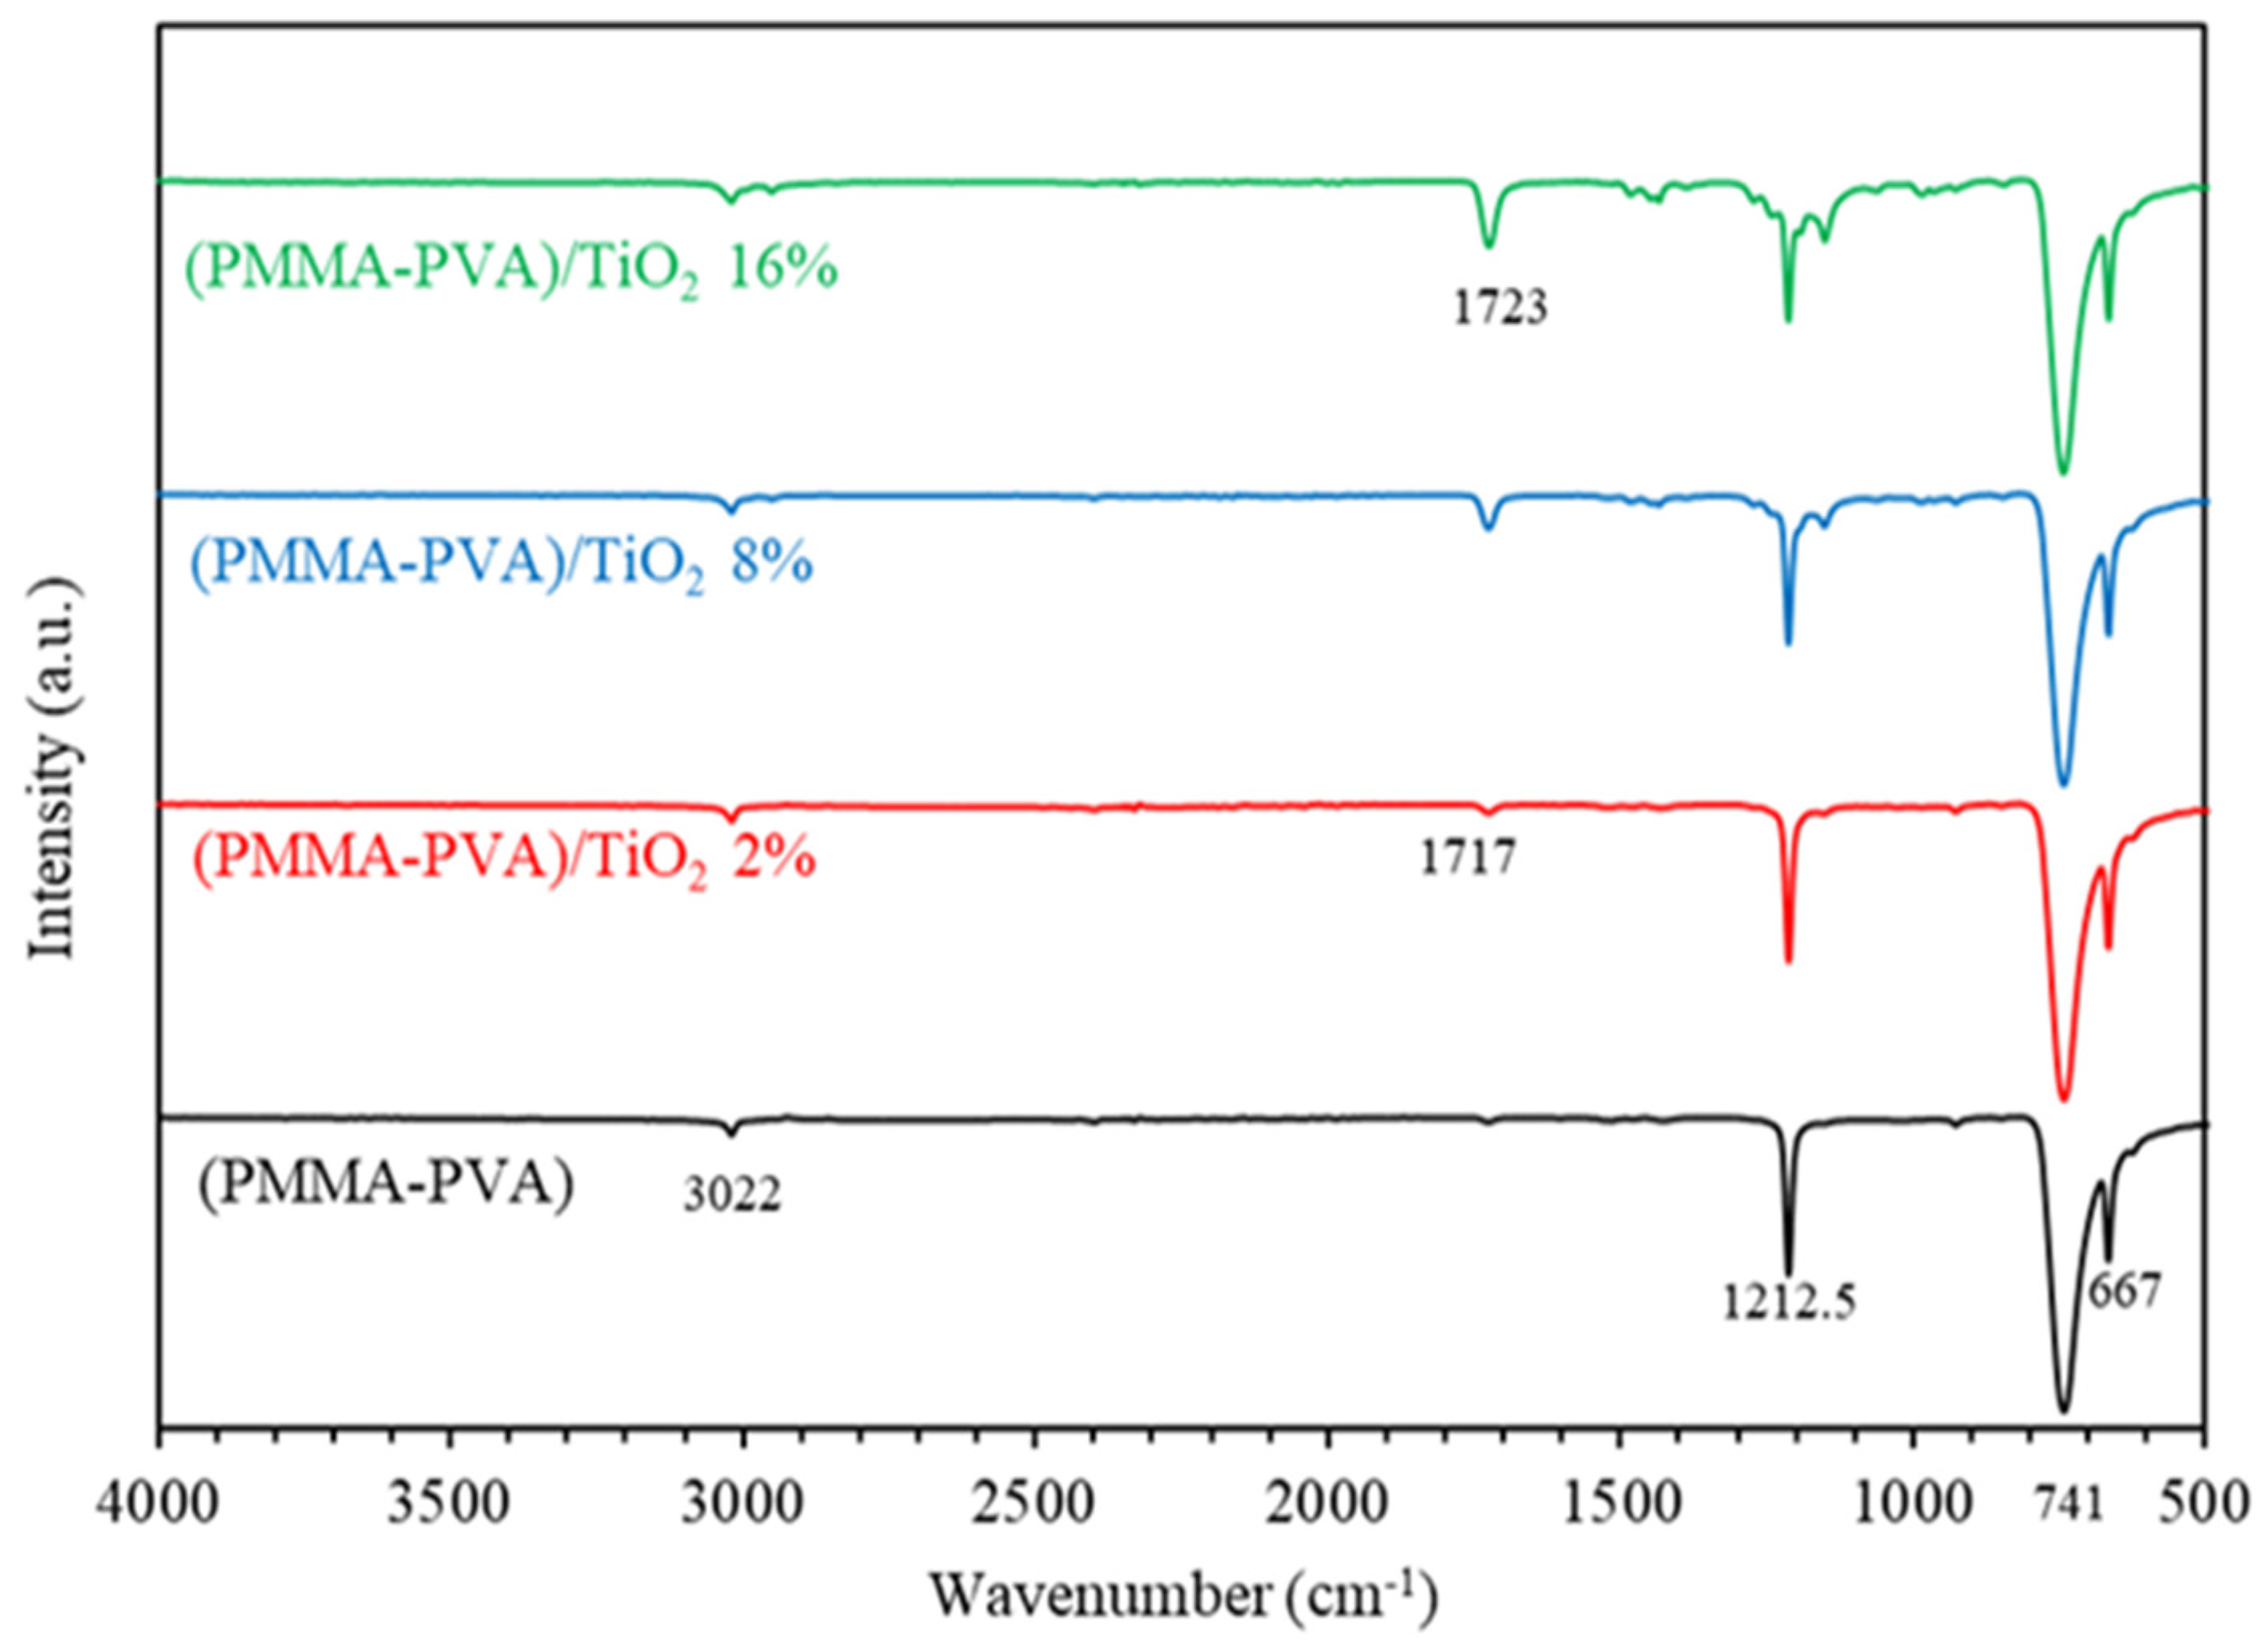
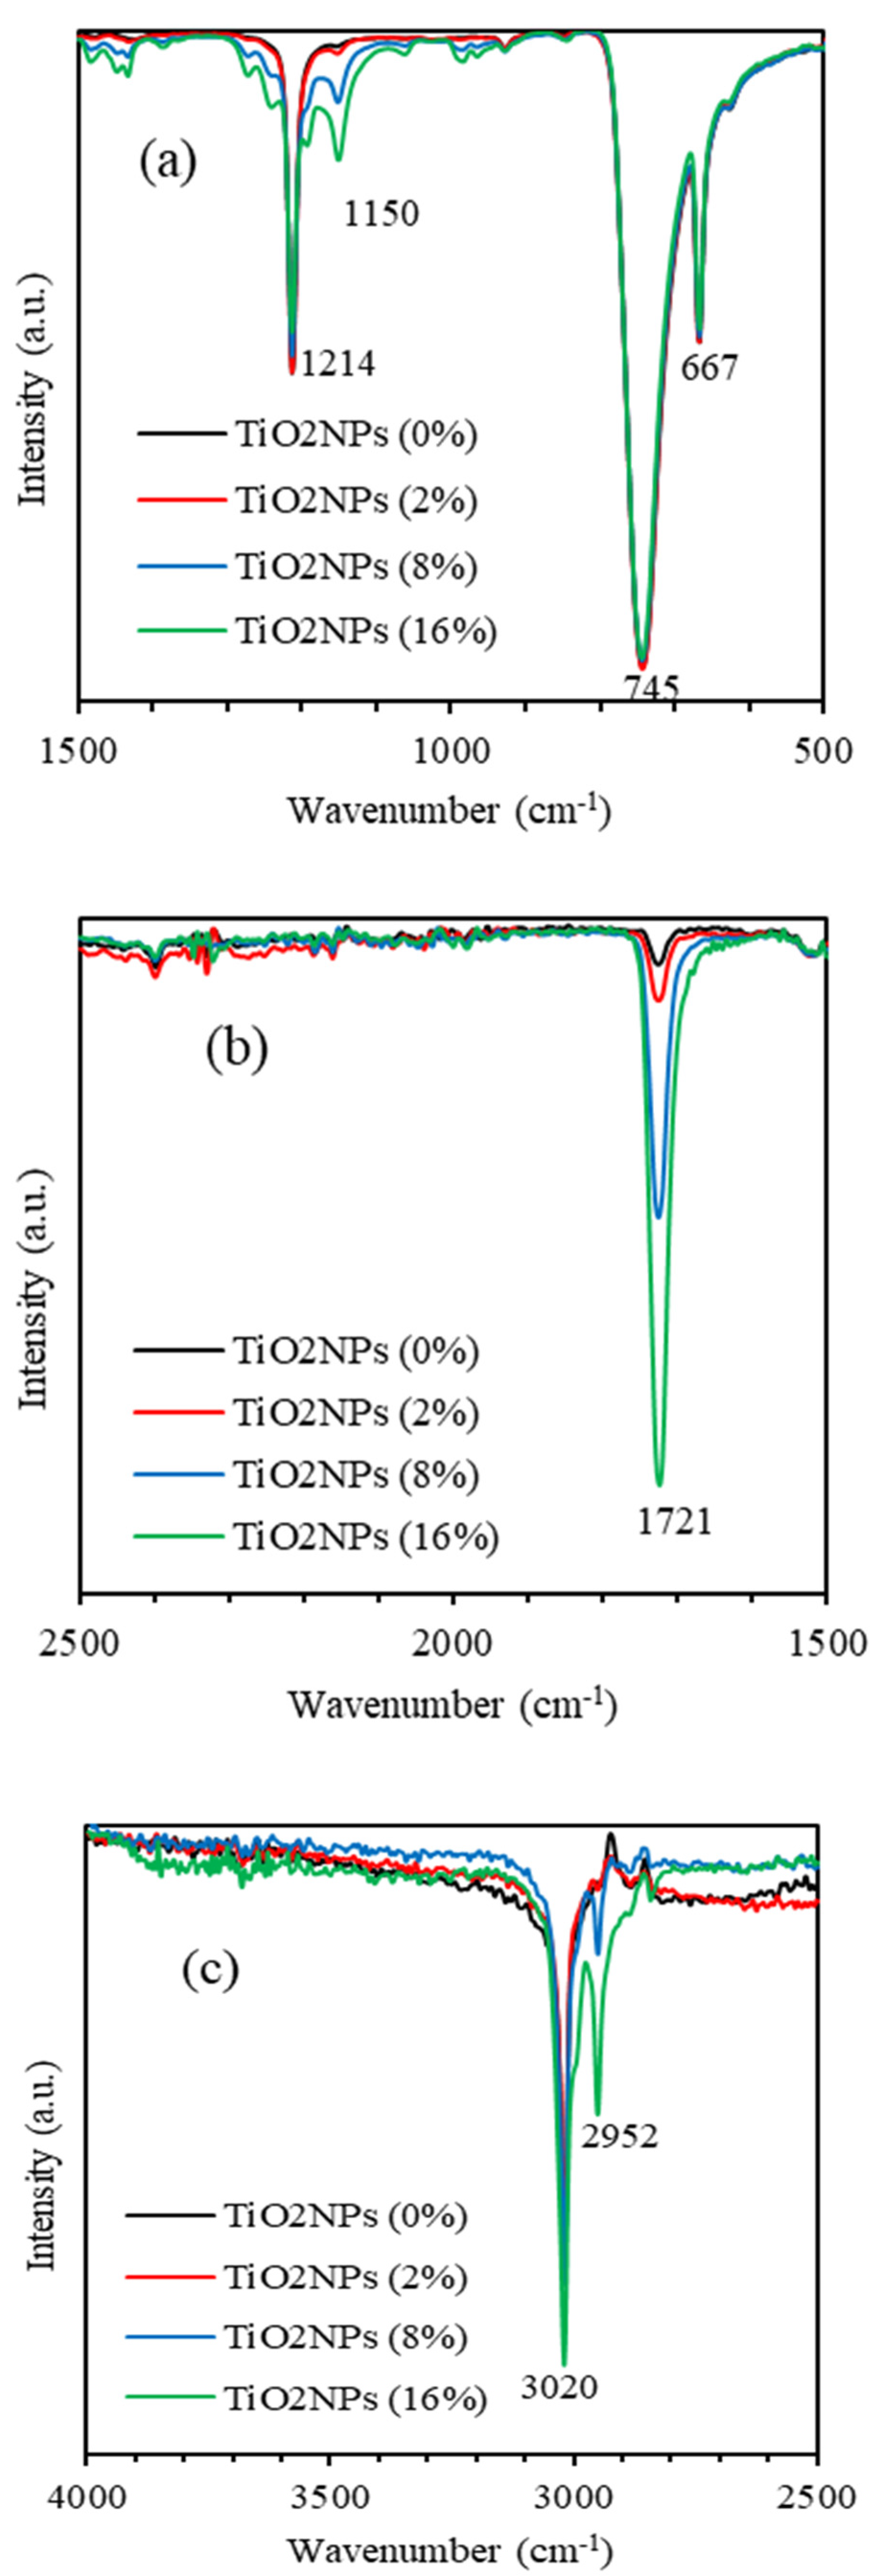
3.4. FTIR Spectra of (PMMA-PVA)/TiO2 Nanocomposite Thin Films

FTIR is performed to investigate the vibrational bands of polymerized thin films. The positions of the peaks of the FTIR patterns are found to shift due to the incorporation of TiO2-NPs into (PMMA-PVA) polymeric thin films. Figure 15 shows FTIR spectra of (PMMA-PVA)/TiO2 nanocomposite thin films with (wt.% = 0, 2, 4, 8, and 16%) of TiO2-NPs incorporated for a wavenumber range (500–4000 cm–1). Figure 16a shows FTIR spectra of (PMMA-PVA)/TiO2 nanocomposite thin films for a wavenumber range (500–1500 cm−1). Clearly, the FTIR spectra have three peaks at 1214, 745, and 667 cm−1. The band at 667 cm−1 is assigned to the bending vibration mode of (C–O) bending [23]. Additionally, the band at 745 cm−1 corresponds to the vibration mode of (C–H) bond [23]. Furthermore, the band at 1214 cm−1 is associated with the strong stretch bending vibration mode of the (C–O) bond [38]. The striking observation of FTIR spectra of all (PMMA-PVA)/TiO2 nanocomposite thin films is the broadness and shifting to a higher wavenumber as TiO2-NPs contents in (PMMA-PVA) polymeric thin films are increased. The new bound of (PMMA-PVA)/TiO2 nanocomposite thin films located at 1150 cm−1 is due to stretching and symmetric bending vibration that may be assigned to the Ti–O bond. Figure 16b shows FTIR spectra of (PMMA-PVA)/TiO2 nanocomposite thin films for a wavenumber range (1500–2500 cm−1). Clearly, the FTIR spectra has one peak at 1725 cm−1. The broad band at 1725 cm−1 is attributed to the stretching modes of carbonyl (C=O) group [6,23]. Figure 16c shows FTIR spectra of (PMMA-PVA)/TiO2 nanocomposite thin films for a wavenumber range (2500–4000 cm−1). Clearly, the FTIR spectra has two peaks at 3020 and 2952 cm−1. The broad band at 3020 cm−1 indicates the presence of the free hydroxyl (OH) groups and the stretching vibration of (C–H) [23]. Therefore, disturbance of the bonds and the formation of new bonds leads to the broadening and shifting of the peaks. Theoretically it has been predicted that oxygen vacancies in rutile TiO2 causes lattice deformation and effectively narrows down the band gap [34]. Furthermore, the new band at 2952 cm−1 is associated with the strong stretching mode of the (C–H) binding [6,23,38]. The intensity of the peaks at 1725 and 2952 cm−1 are observed to decrease upon increasing TiO2-NPs contents. The reduction of the intensities of the peaks in the entire FTIR spectra is expected and it is attributed to the intermolecular bonding between the constituents of (PMMA-PVA)/TiO2 nanocomposite thin films.

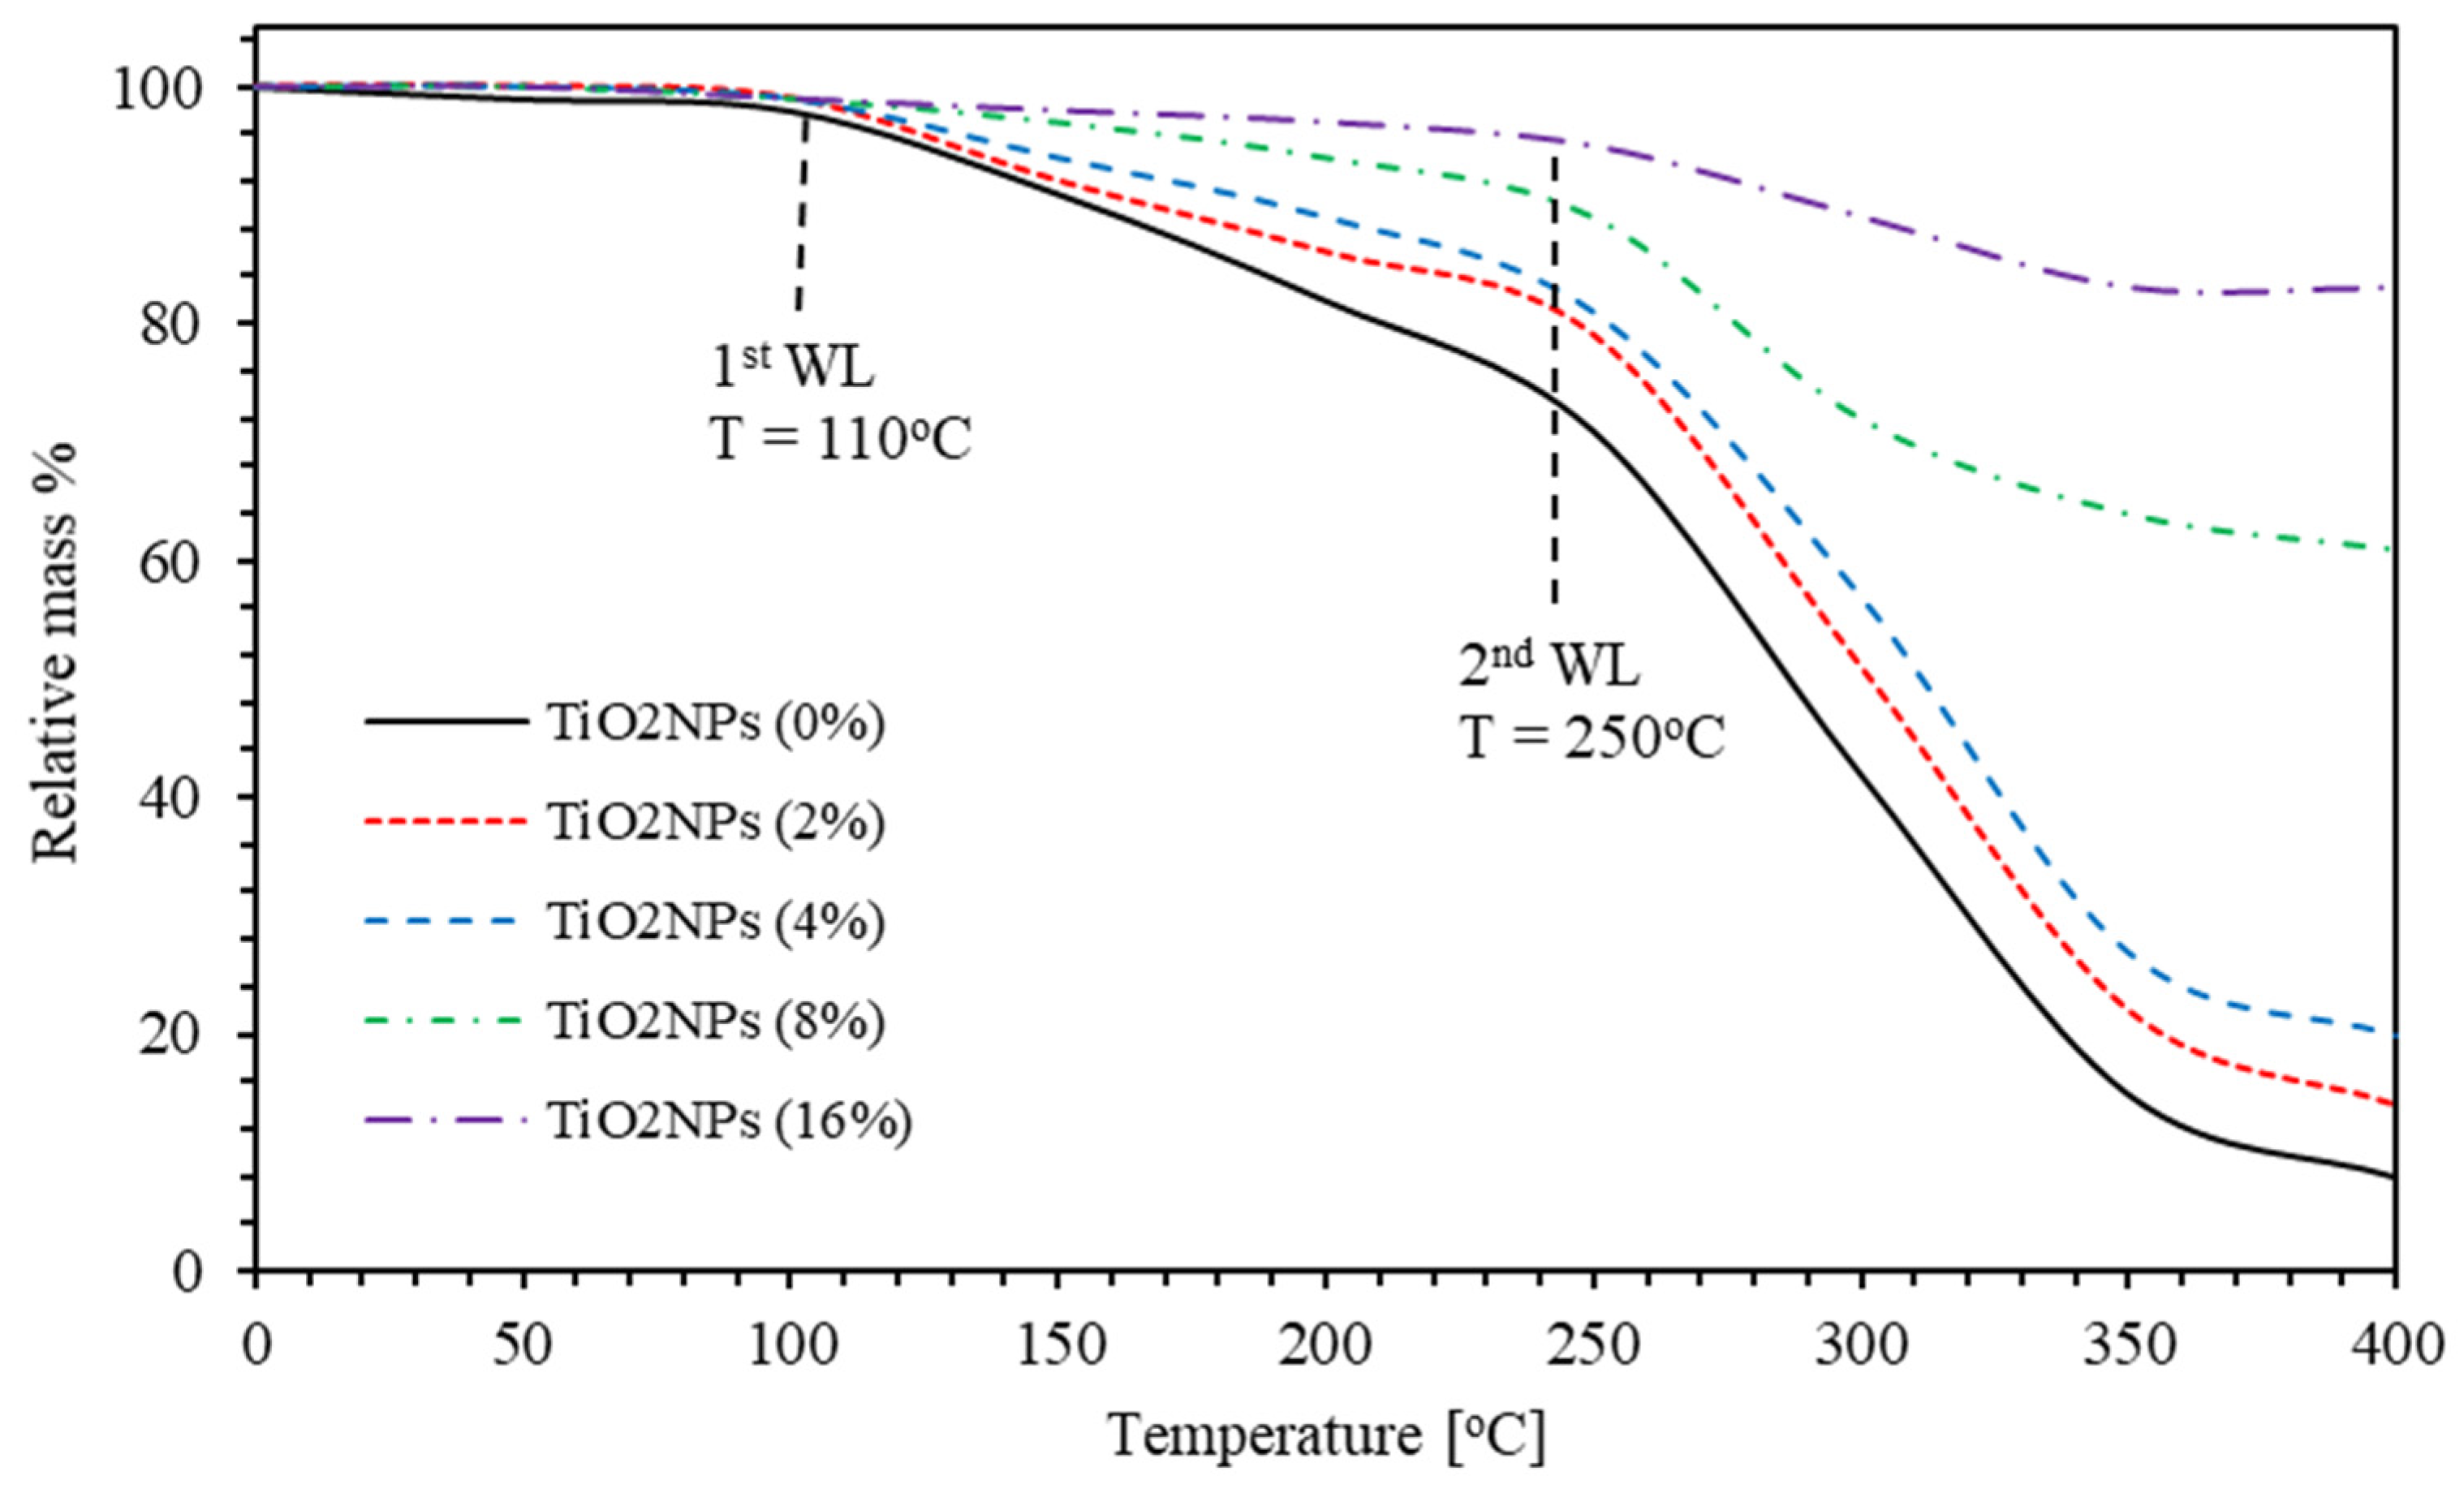
3.5. Thermogravimetric (TGA) Analysis of (PMMA-PVA)/TiO2 Nanocomposite Thin Films

Figure 17 shows the thermogravimetric thermograms of (PMMA-PVA)/TiO2 nanocomposites with different concentrations of TiO2-NPs. Thermal stability is investigated by employing TGA analysis at temperatures up to 400 °C. The TGA curves of (PMMA-PVA)/TiO2 nanocomposites thin films show weight loss (WL) steps at different temperatures. The TGA profiles of nanocomposite has two WL steps at 110 and 250 °C regardless of the degree of incorporation of TiO2-NPs. First and second WL are insignificantly shifted toward lower and higher temperatures indicating the influence of the change of intermolecular and intramolecular bonding. Clearly, the weight loss of pure (PMMA-PVA) polymeric thin films is observed to be about 92% at 400 °C. This value decreases as TiO2-NPs contents in polymeric matrix is increased. It attains a minimum value of 17% as TiO2-NPs concetration in the polymeric thin film is increased to 16%. The WL of the nanocomposites is inversely proportional to their wt.% of TiO2-NPs content. Conveniently, (PMMAPVA)/TiO2 nanocomposite materials are found to be thermally stable at temperatures below 110 °C. In spite of the slight and negligible slope in TGA curve below 110 °C which is mostly due to water or solvent adsorption and can be easily tackled, most of the practical optical applications can be performed below this temperature. Blending of PVA and PMMA reduces the thermal stabilities of both polymers. However, the presence of TiO2 nanoparticles improves their thermal stabilities. Moreover, TiO2-NPs also influence the volatilization of the degradation products from the blend, acted as degradation catalyst and retarded the escape of volatile degradation products [39].

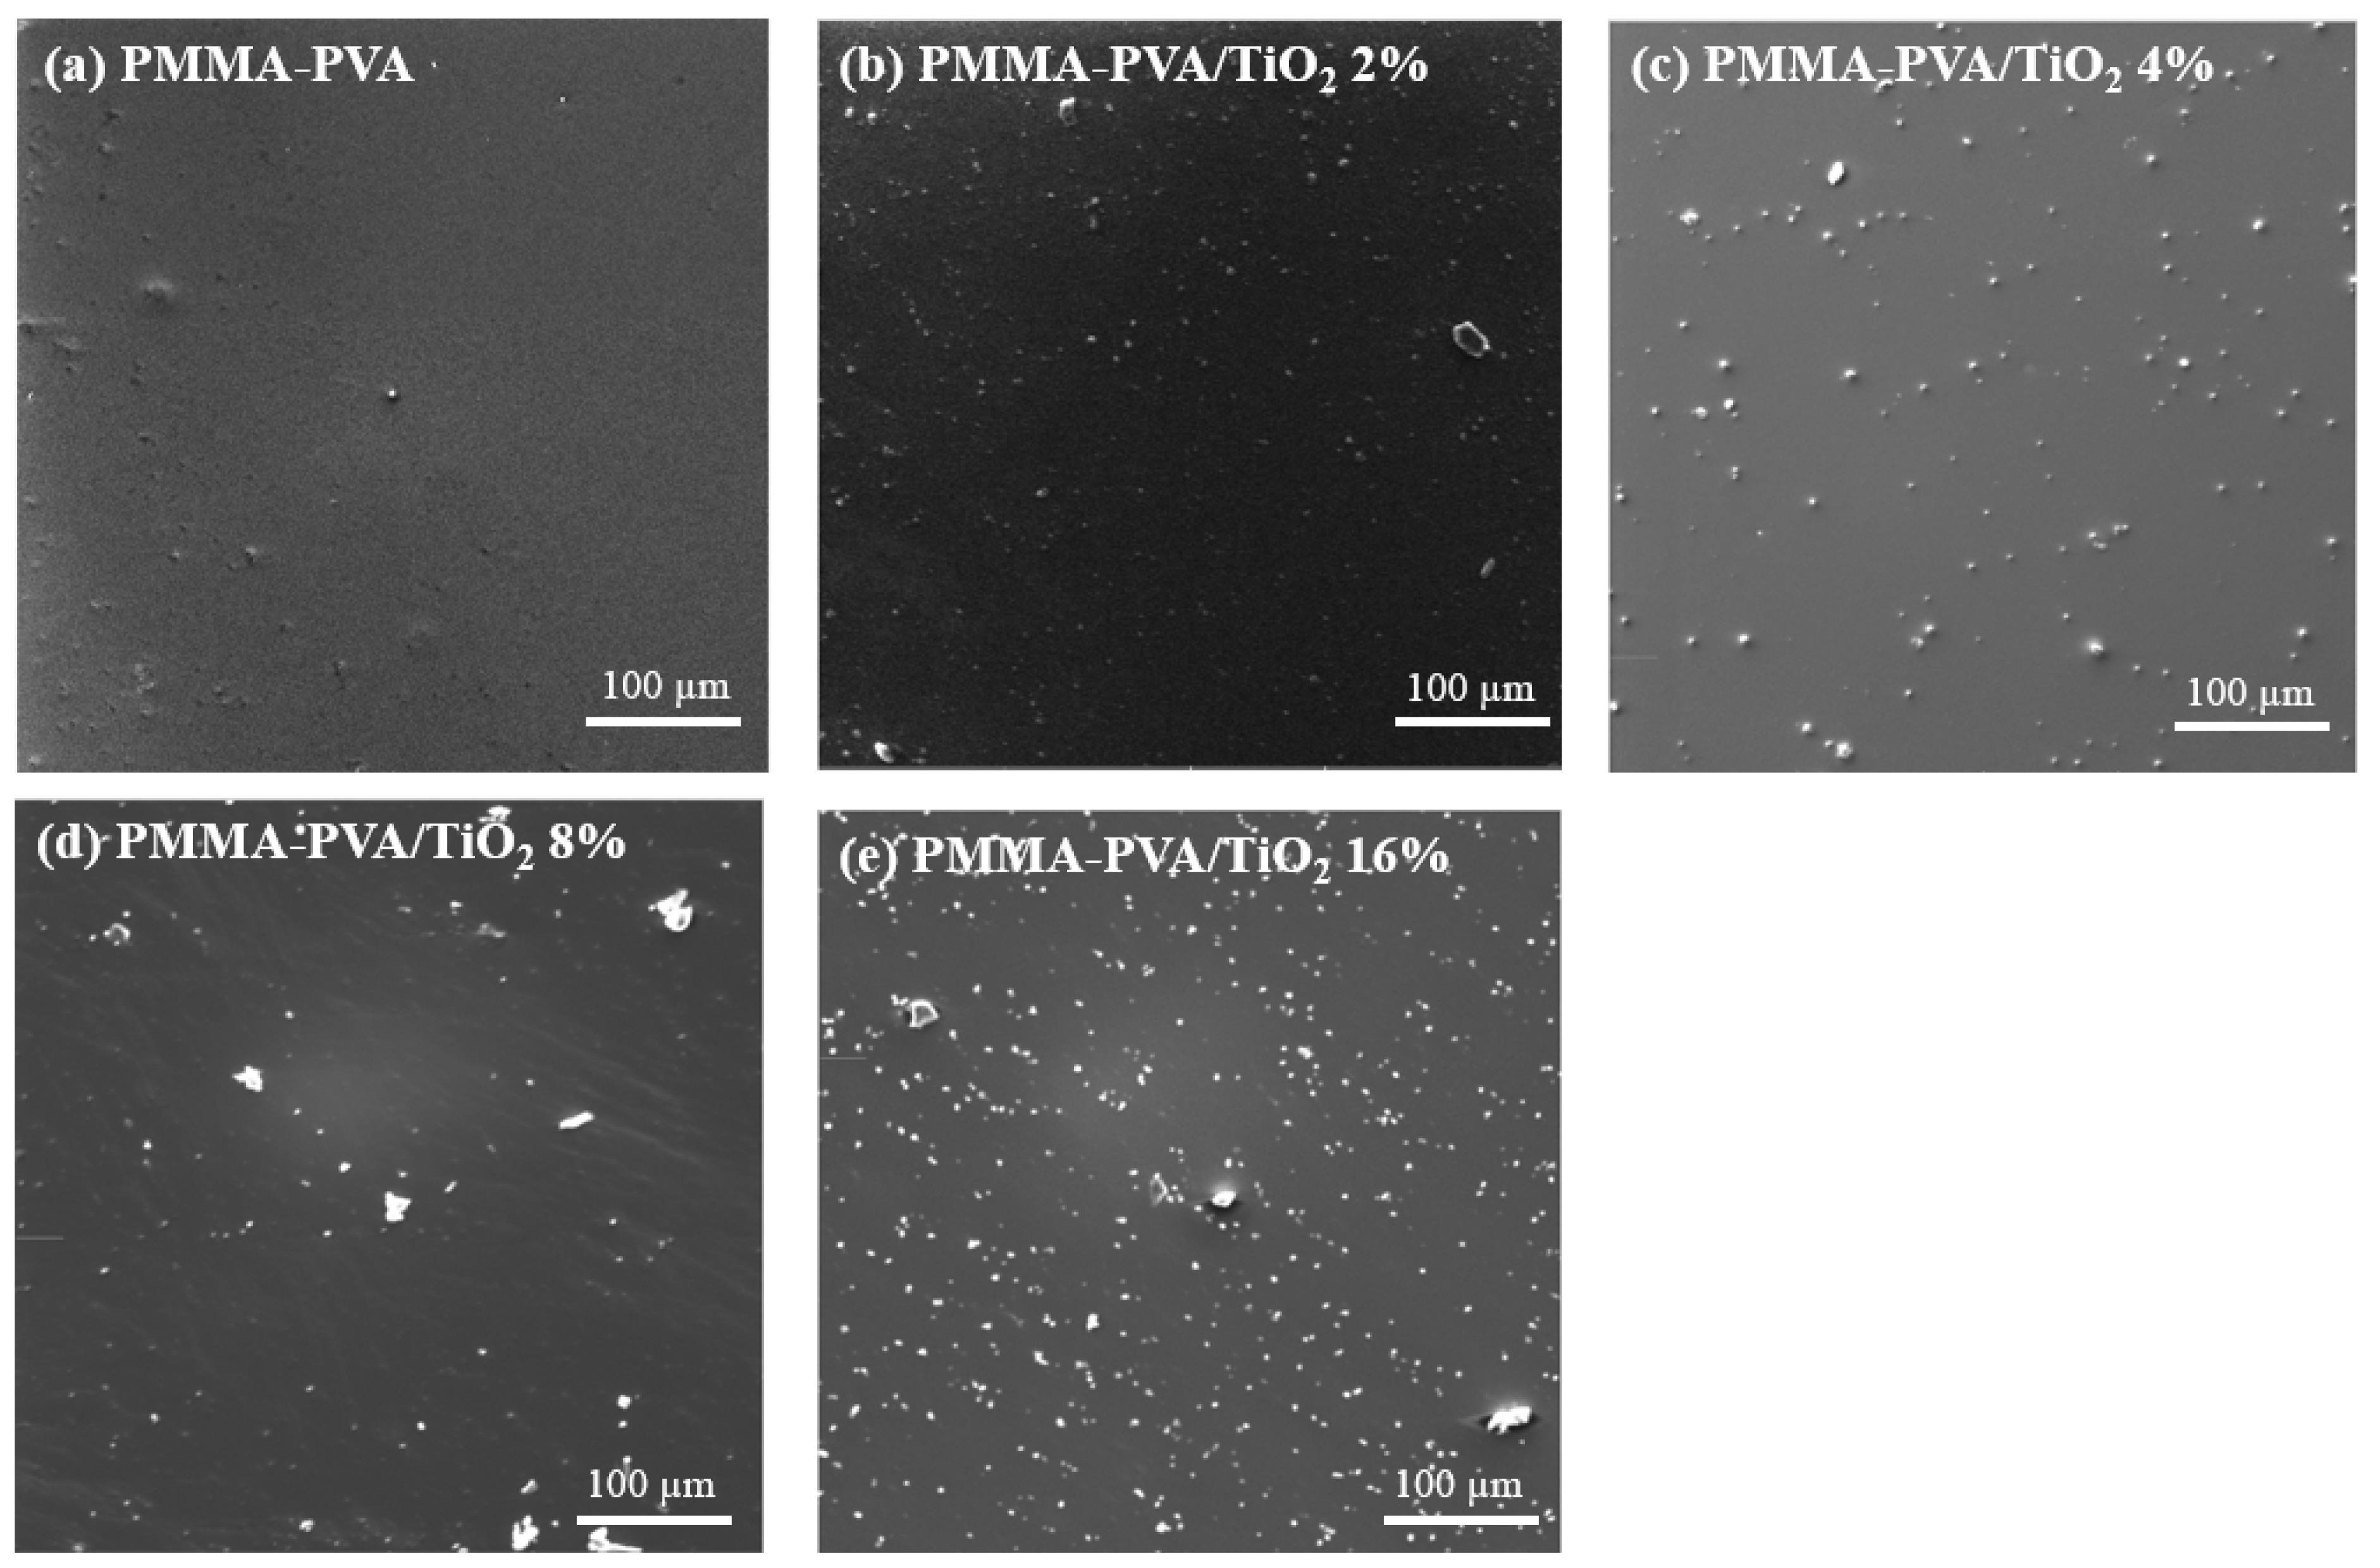
3.6. Scanning Electron Microscope (SEM)

The surface morphology of thin films is inspected using Scanning Electron Microscopy (SEM). Surface morphology of (PMMA-PVA)/TiO2 nanocomposite thin films at different concentrations of TiO2-NPs at a 100-μm magnification are presented in Figure 18. Figure 18a shows that the nanocomposite thin films of PMMA-PVA exhibit an amorphous nature with a smooth surface. Figure 18b–e show the TiO2-NPs immersed homogenously on the surface of the thin film matrix. The observed TiO2-NPs dimension is within the average particle size between (100–500) nm in diameter. Furthermore, SEM was used to examine the morphology and dispersion of TiO2-NPs on the surface of PMMA-PVA films. The SEM images indicate a good dispersion of TiO2-NPs on the surface of the PMMA-PVA polymeric matrix. This provides substantial evidence of the validity of our synthesis process of obtaining TiO2-NPs.

4. Conclusions

In summary, (PMMA-PVA)/TiO2 nanocomposite thin films doped with different concentrations of TiO2-NPs and ranging from 0 to 16% are synthesized and deposited on glass substrates via a dip-coating technique. As-grown thin films are investigated to elucidate the spectral behavior of key optical parameters such as transmittance, reflectance, absorption coefficient, optical constants, and optical dielectric functions. Furthermore, a combination of classical models such as Tauc, Urbach, Spitzer-Fan, and Drude models are applied to calculate the optical band gap energy and optoelectronic parameters of the doped polymerized thin films. The transmittance decreases dramatically in the high-absorption region (UV region, λ ≤ 350 nm). The transmittance values of undoped (PMMA-PVA) polymeric thin film at λ = 550 nm is found to be about 91.6%. Insertion (wt.% = 2, 4, 8, and 16%) of TiO2-NPs lead to a decrease in transmittance values to 90, 89, 87, and 81% at λ = 550 nm, respectively. Therefore, (PMMA-PVA)/TiO2 exhibit good optical transparency in the visible region. Furthermore, the calculated refractive index of pure (PMMA-PVA) polymeric thin film is found to exhibit values ranging between 1.5 and 1.85. Interestingly, increasing TiO2-NPs contents in PMMA-PVA polymeric thin films lead to the increase in refractive index values. The obtained high refractive indices of both as-grown thin films indicate that they could be key candidates for strong optical confinement applications and enhance the optical intensities of nonlinear interactions in optical components of modern devices. Moreover, the optical band gap energy of undoped (PMMA-PVA) polymeric thin film is found to be 4.101 eV. It slightly decreases as (TiO2-NPs) doping levels introduced in (PMMA-PVA) polymeric thin films are increased. The high transmittance, wide bandgap energy, and high refractive index indicate that these films could be employed in the fabrication of a wide range of optoelectronic devices. The thermal stability of both as-prepared thin films is investigated by measuring the TGA thermograms. Providentially, the nanocomposite thin films are thermally stable at temperatures below 110 °C. Most of the optical applications involving thin films can be performed at temperatures close to 110°C. Our detailed and comprehensive investigations of the optical, lattice dynamical, and thermal properties of (PMMAPVA)/TiO2 nanocomposite thin films reveal that they could be utilized in manufacturing realistic scaled optoelectronic and photonic devices. To elucidate a deeper understanding of the vibrational modes of (PMMA-PVA)/TiO2 nanocomposite thin films, we carry out FTIR measurements. We identify and interpret all vibrational bands associated with formation, rotation, and twisting of different bonds involved in the investigated polymerized thin films.

Author Contributions

Conceptualization, A.A. (Ahmad Alsaad) and Q.A.-B.; methodology, A.A. (Ahmad Alsaad), A.R.A.D., A.A. (Ahmad Ahmad), I.A.Q., S.A.F. and Q.A.-B.; software, A.A. (Ahmad Alsaad), A.R.A.D., A.A. (Ahmad Ahmad), I.A.Q., S.A.F. and Q.A.-B.; validation, A.A. (Ahmad Alsaad) and Q.A.-B.; formal analysis, A.A. (Ahmad Alsaad), Q.A.-B. and S.A.F.; investigation, A.A. (Ahmad Alsaad), A.R.A.D., A.A. (Ahmad Ahmad), I.A.Q., S.A.F. and Q.A.-B.; resources, A.A. (Ahmad Alsaad), A.R.A.D., A.A. (Ahmad Ahmad), I.A.Q., S.A.F. and Q.A.-B.; data curation, A.A. (Ahmad Alsaad) and Q.A.-B.; writing—original draft preparation, A.A. (Ahmad Alsaad), S.A.F. and Q.A.-B.; writing—review and editing, A.A. (Ahmad Alsaad), S.A.F. and Q.A.-B.; visualization, A.A. (Ahmad Alsaad), S.A.F. and Q.A.-B.; supervision, A.A. (Ahmad Alsaad) and Q.A.-B.; project administration; funding acquisition, A.A. (Ahmad Alsaad), S.A.F. and Q.A.-B. All authors have read and agreed to the published version of the manuscript

Funding

This research is funded by Jordan University of Science and Technology, grant number 350-2020.

Institutional Review Board Statement

Not applicable.

Informed Consent Statement

Not applicable.

Data Availability Statement

Not applicable.

Acknowledgments

The authors would like to thank Jordan University of Science and Technology in Jordan for the support provided by the Deanship of Scientific Research grant number 350-2020. The authors would like to thank Borhan Albiss and M-Ali Al-Akhras for their help in using the facilities of the Center of Nanotechnology and the Lab. of Biomedical Physics.

Conflicts of Interest

The authors declare no conflict of interest.

References

  1. Al-Gunaid, M.Q.; Saeed, A.M.; Subramani, N.K.; Madhukar, B. Optical parameters, electrical permittivity and I–V characteristics of PVA/Cs2 CuO2 nanocomposite films for opto-electronic applications. J. Mater. Sci. Mater. Electron. 2017, 28, 8074–8086. [Google Scholar] [CrossRef]
  2. Kickelbick, G. The search of a homogeneously dispersed material—The art of handling the organic polymer/metal oxide interface. J. Sol. Gel Sci. Technol. 2008, 46, 281–290. [Google Scholar] [CrossRef]
  3. Liu, J.-G.; Ueda, M. High refractive index polymers: Fundamental research and practical applications. J. Mater. Chem. 2009, 19, 8907–8919. [Google Scholar] [CrossRef]
  4. Hassan, M.; Reddy, K.R.; Haque, E.; Minett, A.I.; Gomes, V.G. High-yield aqueous phase exfoliation of graphene for facile nanocomposite synthesis via emulsion polymerization. J. Colloid. Interface Sci. 2013, 410, 43–51. [Google Scholar] [CrossRef]
  5. Reddy, K.R.; Sin, B.C.; Ryu, K.S.; Kim, J.-C.; Chung, H.; Lee, Y. Conducting polymer functionalized multi-walled carbon nanotubes with noble metal nanoparticles: Synthesis, morphological characteristics and electrical properties. Synth. Met. 2009, 159, 595–603. [Google Scholar] [CrossRef]
  6. Tao, P.; Li, Y.; Rungta, A.; Viswanath, A.; Gao, J.; Benicewicz, B.C.; Siegel, R.W.; Schadler, L.S. TiO2 nanocomposites with high refractive index and transparency. J. Mater. Chem. 2011, 21, 18623–18629. [Google Scholar] [CrossRef]
  7. Mosley, D.W.; Auld, K.; Conner, D.; Gregory, J.; Liu, X.-Q.; Pedicini, A.; Thorsen, D.; Wills, M.; Khanarian, G.; Simon, E.S. High performance encapsulants for ultra high-brightness LEDs[C]//Light-Emitting Diodes: Research, Manufacturing, and Applications XII. Int. Soc. Opt. Photonics. 2008, 6910, 691017. [Google Scholar]
  8. Allen, R.D.; Wallraff, G.M.; Hofer, D.C.; Kunz, R.R. Photoresists for 193-nm lithography. IBM. J. Res. Dev. 1997, 41, 95–104. [Google Scholar] [CrossRef]
  9. Nakamura, T.; Fujii, H.; Juni, N.; Tsutsumi, N. Enhanced coupling of light from organic electroluminescent device using diffusive particle dispersed high refractive index resin substrate. Opt. Rev. 2006, 13, 104–110. [Google Scholar] [CrossRef]
  10. Regolini, J.; Benoit, D.; Morin, P. Passivation issues in active pixel CMOS image sensors. Microelectron. Reliab. 2007, 47, 739–742. [Google Scholar] [CrossRef]
  11. Ghanipour, M.; Dorranian, D. Effect of Ag-nanoparticles doped in polyvinyl alcohol on the structural and optical properties of PVA films. J. Nanomater. 2013, 2013. [Google Scholar] [CrossRef]
  12. Etefagh, R.; Rozati, S.; Azhir, E.; Shahtahmasebi, N.; Hosseini, A. Synthesis and antimicrobial properties of ZnO/PVA, CuO/PVA, and TiO2/PVA nanocomposites. Sci. Iran. 2017, 24, 1717–1723. [Google Scholar] [CrossRef] [Green Version]
  13. DeMerlis, C.; Schoneker, D. Review of the oral toxicity of polyvinyl alcohol (PVA). Food Chem. Toxicol. 2003, 41, 319–326. [Google Scholar] [CrossRef]
  14. Maeda, S.; Fujita, M.; Idota, N.; Matsukawa, K.; Sugahara, Y. Preparation of transparent bulk TiO2/PMMA hybrids with improved refractive indices via an in situ polymerization process using TiO2 nanoparticles bearing PMMA chains grown by surface-initiated atom transfer radical polymerization. ACS Appl. Mater. Interfaces 2016, 8, 34762–34769. [Google Scholar] [CrossRef]
  15. Almusawe, A.; Kadhum, R.; Hassen, T.; Abd Alrasheed, N. Study of Gamma Irradiation Effect on the Optical Properties of Bromocresol Green Dye Doped Poly Methyl Methacrylate Thin Films. Results. Phys. 2017, 7, 807–809. [Google Scholar]
  16. Demir, M.M.; Memesa, M.; Castignolles, P.; Wegner, G. PMMA/zinc oxide nanocomposites prepared by in-situ bulk polymerization. Macromol. Rapid. Commun. 2006, 27, 763–770. [Google Scholar] [CrossRef] [Green Version]
  17. Khan, M.; Bhatti, K.; Qindeel, R.; Althobaiti, H.S.; Alonizan, N. Structural, electrical and optical properties of multilayer TiO2 thin films deposited by sol–gel spin coating. Results Phys. 2017, 7, 1437–1439. [Google Scholar] [CrossRef]
  18. Pal, M.; Pal, U.; Jiménez, J.M.G.Y.; Pérez-Rodríguez, F. Effects of crystallization and dopant concentration on the emission behavior of TiO2: Eu nanophosphors. Nanoscale Res. Lett. 2012, 7, 1–12. [Google Scholar] [CrossRef] [Green Version]
  19. Sonawane, R.; Hegde, S.; Dongare, M. Preparation of titanium (IV) oxide thin film photocatalyst by sol–Gel dip coating. Mater. Chem. Phys. 2003, 77, 744–750. [Google Scholar] [CrossRef]
  20. El-Hagary, M.; Emam-Ismail, M.; Shaaban, E.; El-Taher, A. Effect of γ-irradiation exposure on optical properties of chalcogenide glasses Se70S30−xSbx thin films. Radiat. Phys. Chem. 2012, 81, 1572–1577. [Google Scholar] [CrossRef]
  21. Brouder, C.; Cabaret, D.; Juhin, A.; Sainctavit, P. Effect of atomic vibrations on the x-ray absorption spectra at the K edge of Al in α-Al2O3 and of Ti in TiO2 rutile. Phys. Rev. B 2010, 81, 115125. [Google Scholar] [CrossRef] [Green Version]
  22. Wypych, A.; Bobowska, I.; Tracz, M.; Opasinska, A.; Kadlubowski, S.; Krzywania-Kaliszewska, A.; Grobelny, J.; Wojciechowski, P. Dielectric properties and characterisation of titanium dioxide obtained by different chemistry methods. J. Nanomater. 2014, 2014, 124814. [Google Scholar] [CrossRef]
  23. Shehap, A.; Akil, D.S. Structural and optical properties of TiO₂ nanoparticles/PVA for different composites thin films. Int. J. Nanoelectron. Mater. 2016, 9, 17–36. [Google Scholar]
  24. Aziz, S.B.; Ahmed, H.M.; Hussein, A.M.; Fathulla, A.B.; Wsw, R.M.; Hussein, R.T. Tuning the absorption of ultraviolet spectra and optical parameters of aluminum doped PVA based solid polymer composites. J. Mater. Sci. Mater. Electron. 2015, 26, 8022–8028. [Google Scholar] [CrossRef]
  25. Duerloo, K.-A.N.; Ong, M.T.; Reed, E.J. Intrinsic piezoelectricity in two-dimensional materials. J. Phys. Chem. Lett. 2012, 3, 2871–2876. [Google Scholar] [CrossRef]
  26. Oubaha, M.; Elmaghrum, S.; Copperwhite, R.; Corcoran, B.; McDonagh, C.; Gorin, A. Optical properties of high refractive index thin films processed at low-temperature. Opt. Mater. 2012, 34, 1366–1370. [Google Scholar] [CrossRef] [Green Version]
  27. Krogman, K.C.; Druffel, T.; Sunkara, M.K. Anti-reflective optical coatings incorporating nanoparticles. Nanotechnol. 2005, 16, S338. [Google Scholar] [CrossRef]
  28. Thiele, S.; Arzenbacher, K.; Gissibl, T.; Giessen, H.; Herkommer, A.M. 3D-printed eagle eye: Compound microlens system for foveated imaging. Sci. Adv. 2017, 3, e1602655. [Google Scholar] [CrossRef] [Green Version]
  29. Mol, B.; James, J.; Anoop, K.; Sulaniya, I.; Joseph, C.; Anantharaman, M.; Bushiri, J. Radio frequency plasma polymerized thin film based on eucalyptus oil as low dielectric permittivity, visible and near-infrared (NIR) photoluminescent material. J. Mater. Sci. Mater. Electron. 2019, 30, 12603–12611. [Google Scholar] [CrossRef]
  30. Stuerga, D. Microwave-material interactions and dielectric properties, key ingredients for mastery of chemical microwave processes. Microw. Org. Synth. 2006, 2, 1–59. [Google Scholar]
  31. Tauc, J. Amorphous and Liquid Semiconductors; Springer Science & Business Media: Berlin, Germany, 2012. [Google Scholar]
  32. Ansari, S.A.; Cho, M.H. Highly visible light responsive, narrow band gap TiO2 nanoparticles modified by elemental red phosphorus for photocatalysis and photoelectrochemical applications. Sci. Rep. 2016, 6, 1–10. [Google Scholar] [CrossRef] [PubMed]
  33. Ravidhas, C.; Anitha, B.; Raj, A.M.E.; Ravichandran, K.; Girisun, T.S.; Mahalakshmi, K.; Saravanakumar, K.; Sanjeeviraja, C. Effect of nitrogen doped titanium dioxide (N-TiO2) thin films by jet nebulizer spray technique suitable for photoconductive study. J. Mater. Sci. Mater. Electron. 2015, 26, 3573–3582. [Google Scholar] [CrossRef]
  34. Melsheimer, J.; Ziegler, D. Band gap energy and Urbach tail studies of amorphous, partially crystalline and polycrystalline tin dioxide. Thin Solid Film. 1985, 129, 35–47. [Google Scholar] [CrossRef]
  35. Hassanien, A.S. Studies on dielectric properties, opto-electrical parameters and electronic polarizability of thermally evaporated amorphous Cd50S50−xSex thin films. J. Alloys Compd. 2016, 671, 566–578. [Google Scholar] [CrossRef]
  36. Kaur, S.; Samra, K.S. Study of Optical and Structural Properties of PVA/PMMA Blend. Ph.D. Thesis, Lovely Professional University, Punjab, India, 2017. [Google Scholar]
  37. Rajagopal, S. The Forensic Analysis of Skin-Safe. Stamp Pad Inks. Master’s Thesis, John Jay College of Criminal Justice, New York, NY, USA, 2019. [Google Scholar]
  38. Nair, R.V.; Gayathri, P.; Gummaluri, V.S.; Nambissan, P.; Vijayan, C. Large bandgap narrowing in rutile TiO2 aimed towards visible light applications and its correlation with vacancy-type defects history and transformation. J. Phys. D Appl. Phys. 2018, 51, 045107. [Google Scholar] [CrossRef]
  39. Mofokeng, J.; Luyt, A. Morphology and thermal degradation studies of melt-mixed poly (lactic acid)(PLA)/poly (ε-caprolactone)(PCL) biodegradable polymer blend nanocomposites with TiO2 as filler. Polym. Test. 2015, 45, 93–100. [Google Scholar] [CrossRef]
Figure 1. Transmittance spectra of (PMMA-PVA)/TiO2 nanocomposite thin films as a function of wavelength for various TiO2-NPs concentrations.
Crystals 11 00099 g001
Figure 2. Reflectance spectra of (PMMA-PVA)/TiO2 nanocomposite thin films as a function of wavelength for various TiO2-NPs concentrations.
Crystals 11 00099 g002
Figure 3. Absorbance coefficient spectra of (PMMA-PVA)/TiO2 nanocomposite thin films as a function of wavelength for various TiO2-NPs concentrations.
Crystals 11 00099 g003
Figure 4. Extinction coefficient spectra of (PMMA-PVA)/TiO2 nanocomposite thin films as a function of wavelength for various TiO2-NPs concentrations.
Crystals 11 00099 g004
Figure 5. Reflectance index spectra of (PMMA-PVA)/TiO2 nanocomposite thin films as a function of wavelength for various TiO2-NPs concentrations.
Crystals 11 00099 g005
Figure 6. Optical dielectric constant (ɛ′) spectra of (PMMA-PVA)/TiO2 nanocomposite thin films as a function of wavelength for various TiO2 concentrations.
Crystals 11 00099 g006
Figure 7. Optical dielectric loss (ɛ″) spectra of (PMMA-PVA)/TiO2 nanocomposite thin films as function of wavelength for various TiO2 concentrations.
Crystals 11 00099 g007
Figure 8. The Tauc plot for optical bandgap energy of (PMMA-PVA)/TiO2 nanocomposite thin films for various TiO2-NPs concentrations. (a)Un-doped PMMA-PVA thin films, (b) (PMMA-PVA)/TiO2 2% thin films, (c) (PMMA-PVA)/TiO2 4% thin films, (d) (PMMA-PVA)/TiO2 8% thin films, (e) (PMMA-PVA)/TiO2 16% thin films.
Crystals 11 00099 g008
Figure 9. A plot of Urbach energy versus different concentration of (PMMA-PVA)/TiO2 nanocomposite thin films.
Crystals 11 00099 g009
Figure 10. Relationship between the optical energy gap and the Urbach energy of the (PMMAPVA)/TiO2 nanocomposite thin films.
Crystals 11 00099 g010
Figure 11. The variation of the optical dielectric constant for (PMMA-PVA)/TiO2 nanocomposite thin films as a function of (λ2) for various TiO2-NPs concentrations.
Crystals 11 00099 g011
Figure 12. The variation of the optical dielectric loss for (PMMA-PVA)/TiO2 nanocomposite thin films as a function of (λ3) for various TiO2-NPs concentrations.
Crystals 11 00099 g012
Figure 13. The FTIR spectra of (PMMA-PVA) polymeric thin films as a function of wavenumber.
Crystals 11 00099 g013
Figure 14. The FTIR spectra of (PMMA-PVA) polymeric thin films in the spectral range (a) 500–1500 cm−1, (b) 1500–4000 cm−1.
Crystals 11 00099 g014
Figure 15. The FTIR spectra of doped and un-doped of (PMMA-PVA)/TiO2 nanocomposite thin films.
Crystals 11 00099 g015
Figure 16. The FTIR spectra of (PMMA-PVA)/TiO2 nanocomposite thin films in the spectra range (a) 500–1500 cm−1, (b) 1500–2500 cm−1, and (c) 2500–4000 cm−1.
Crystals 11 00099 g016
Figure 17. The Thermogravimetric (TGA) thermograms of (PMMA-PVA)/TiO2 nanocomposite thin films at different temperature for various TiO2-NPs concentrations.
Crystals 11 00099 g017
Figure 18. The SEM micrographs of (PMMA-PVA)/TiO2 nanocomposite thin films at different concentration of TiO2-NPs. (a) Un-doped PMMA-PVA thin films, (b) (PMMA-PVA)/TiO2 2% thin films, (c) (PMMA-PVA)/TiO2 4% thin films, (d) (PMMA-PVA)/TiO2 8% thin films, (e) (PMMA-PVA)/TiO2 16% thin films.
Crystals 11 00099 g018
Table 1. Estimation of some essential optical parameters of (PMMA-PVA)/TiO2 nanocomposite thin films for various TiO2 concentrations.
ParameterTiO2 0%TiO2 2%TiO2 4%TiO2 8%TiO2 16%
Density of states,
N c / m *   10 + 57
( m 3 . Kg 1 )
1.0661.3221.3951.6103.125
Charge carrier density,
N c   10 + 27
( m 3 )
4.2735.2995.5896.44012.525
High - frequency   dielectric   constant ,   ε 2.6232.7752.9353.3535.268
Relaxation time,
τ 10 14
(s)
2.4932.7032.7652.8443.175
Optical mobility,
μ o p t 10 3
(m2/(V⋅s))
9.95110.79111.03811.35212.675
Optical resistivity,
ρ o p t   10 6
( Ω . cm )
1.4701.0931.0130.8540.394
Publisher’s Note: MDPI stays neutral with regard to jurisdictional claims in published maps and institutional affiliations.

