
The N-Terminal Domain of Bfa1 Coordinates Mitotic Exit Independent of GAP Activity in Saccharomyces cerevisiae

Department of Biochemistry, College of Life Science and Biotechnology, Yonsei University, Seoul 03722, Korea
*
Author to whom correspondence should be addressed.
Cells 2022, 11(14), 2179; https://doi.org/10.3390/cells11142179
Submission received: 18 April 2022
/
Revised: 6 July 2022
/
Accepted: 7 July 2022
/
Published: 12 July 2022
(This article belongs to the Section Cell Signaling)
Abstract
:The spindle position checkpoint (SPOC) of budding yeast delays mitotic exit in response to misaligned spindles to ensure cell survival and the maintenance of genomic stability. The GTPase-activating protein (GAP) complex Bfa1–Bub2, a key SPOC component, inhibits the GTPase Tem1 to induce mitotic arrest in response to DNA and spindle damage, as well as spindle misorientation. However, previous results strongly suggest that Bfa1 exerts a GAP-independent function in blocking mitotic exit in response to misaligned spindles. Thus, the molecular mechanism by which Bfa1 controls mitotic exit in response to misaligned spindles remains unclear. Here, we observed that overexpression of the N-terminal domain of Bfa1 (Bfa1-D16), which lacks GAP activity and cannot localize to the spindle pole body (SPB), induced cell cycle arrest along with hyper-elongation of astral microtubules (aMTs) as Bfa1 overexpression in Δbub2. We found that Δbub2 cells overexpressing Bfa1 or Bfa1-D16 inhibited activation of Mob1, which is responsible for mitotic exit. In anaphase-arrested cells, Bfa1-D16 overexpression inhibited Tem1 binding to the SPB as well as Bfa1 overexpression. Additionally, endogenous levels of Bfa1-D16 showed minor SPOC activity that was not regulated by Kin4. These results suggested that Bfa1-D16 may block mitotic exit through inhibiting Tem1 activity outside of SPBs. Alternatively, Bfa1-D16 dispersed out of SPBs may block Tem1 binding to SPBs by physically interacting with Tem1 as previously reported. Moreover, we observed hyper-elongated aMTs in tem1-3, cdc15-2, and dbf2-2 mutants that induce anaphase arrest and cannot undergo mitotic exit at restrictive temperatures, suggesting that aMT dynamics are closely related to the regulation of mitotic exit. Altogether, these observations suggest that Bfa1 can control the SPOC independent of its GAP activity and SPB localization.
1. Introduction
In the budding yeast Saccharomyces cerevisiae, the mitotic spindle must be correctly aligned along the mother bud polarity axis to ensure genomic stability. Chromosome segregation during mitosis is closely related to spindle position, which is guided by two important mechanisms: the Kar9 and dynein pathways. In the early phase of the cell cycle, Kar9 connects astral microtubules (aMTs) to actin cables at the cortex along with the MT-binding protein Bim1 (EB1 ortholog) and the type V myosin motor protein Myo2 to move the spindle to the bud neck [1,2,3]. A cortex-anchored motor dynein then continuously walks toward the minus end of aMTs and pulls aMTs to the bud cortex [4,5]. These pathways regulate the binding of the cortex and aMTs to guide the bud-directed spindle pole body (SPB: functional equivalent of the centrosome) through the bud neck and correctly orient the spindle. Mitotic exit occurs after chromosomes are properly segregated between the mother and the bud.
In late anaphase, components of the mitotic exit network (MEN) become active at the SPBs and release a key phosphatase, Cdc14, from the nucleolus to trigger mitotic exit in cells with properly aligned spindles [6,7]. The GTPase Tem1, a major component of the MEN, asymmetrically localizes to the bud-directed daughter SPB (dSPB) from early anaphase, which contributes to the recruitment of the Hippo-like kinase Cdc15 at the dSPB [8,9]. Active Cdc15 then localizes at both SPBs and phosphorylates the scaffold protein Nud1 to create a phospho-docking site for the large tumor suppressor (LATS)-related kinase Dbf2 and its coactivator Mob1 on the scaffold protein Nud1 [10,11]. Consequently, active Dbf2–Mob1 promotes the release of Cdc14 from the nucleolus [6,7], which dephosphorylates mitotic cyclin-dependent kinases (CDKs) and their substrates to induce mitotic exit [12,13]. However, some studies suggest that MEN activation is insufficient to trigger mitotic exit. Fusion of Tem1 or Cdc15 to SPB induces MEN activation in the early stage but does not trigger premature mitotic exit [14]. Additionally, the timing of mitotic exit in cells overexpressing Cdc15 is the same as that in wild-type cells, although Cdc15 overexpression can promote mitotic exit in Tem1-defective cells in response to spindle misorientation [14,15].
A surveillance mechanism called the spindle position checkpoint (SPOC) delays mitotic exit in response to spindle misorientation to ensure cell survival and maintenance of genomic stability. In cells with misaligned spindles, the cortical kinase Kin4 in the mother cell localizes to both SPBs within the mother cell cytoplasm to activate the GTPase-activating protein (GAP) Bfa1–Bub2 complex [16,17,18]. As a result, the two-component GAP complex Bfa1–Bub2 inhibits GTPase Tem1 and MEN activities to induce mitotic arrest [19]. However, previous results showed that Bfa1 plays a GAP-independent role in blocking mitotic exit in response to misaligned spindles [20,21]. Ro et al. [21] reported that Bfa1 overexpression arrests the cell cycle in Δbub2 cells and that the interaction between Tem1 and Cdc15 increased in the absence of Bfa1. Additionally, Kim et al. [22] showed that the overexpressed N-terminal domain of Bfa1, which cannot bind to Bub2, induces anaphase arrest similar to wild-type Bfa1. Moreover, the GAP-defective mutant BFA1W422A showed SPOC activity in Δbim1 cells with misoriented spindles [20]. Thus, the molecular mechanism by which Bfa1 controls mitotic exit in response to misaligned spindles remains unclear.
Bfa1–Bub2 GAP activity and MEN activation are mainly regulated by the Polo-like kinase Cdc5, the guanine nucleotide exchange factor (GEF) Lte1, and the Kin4 kinase [17,18]. In cells with an accurate spindle position, the GEF Lte1 localized in the bud cortex directly activates the GTPase Tem1 and prevents entry of Kin4 to the bud compartment [23]. Cdc5 asymmetrically localizes at the dSPB of cells with correctly aligned spindles and phosphorylates Bfa1 to inhibit Bfa1–Bub2 GAP activity at the dSPB, thereby causing mitotic exit [24]. In the case of spindle misorientation, Kin4 phosphorylates Bfa1 at two serine sites (S150 and S180), thereby enhancing the exclusion of Bfa1–Bub2 from the SPBs to prevent mitotic exit [16,17,18,25,26]. However, the precise mechanism by which the misaligned spindle is sensed and transmitted to Kin4 to activate the SPOC remains uncertain.
In this study, we investigated whether and how Bfa1 regulates mitotic exit in the SPOC independent of its GAP activity and SPB localization in budding yeast.
2. Materials and Methods
2.1. Yeast Strains and Culture
The S. cerevisiae strains used in the present study are listed in Table 1. Genes were tagged or deleted using PCR-based homologous recombination [27,28,29]. TUB1-GFP-URA3 (pAFs125) was digested with the Stu I restriction enzyme (Takara Bio Inc., Shiga, Japan), pRS304-BFA1-3HA or pRS304-BFA1-D16-3HA was digested with EcoR V (Takara Bio Inc.), and pRS306-mCherry-TUB1 was digested with Apa I (Takara Bio Inc.), followed by integration into the chromosomal DNA of the designated yeast strains.
Cells were incubated in YPAD medium (1% yeast extract, 2% bacto-peptone, 100 mg/mL adenine, and 2% dextrose) or in synthetic complete (SC) drop-out medium containing yeast nitrogen base and the necessary supplements [22]. Overexpression of genes was induced by the GAL10-1 promoter with 2% galactose, as described by Kim et al. [22].
2.2. Plasmid Construct
The plasmids used in this study are listed in Table 2. DNA cloning was performed as previously described [30]. BUB2, the BFA1 domains, KIN4, SNU13, 3HA-tagged BFA1 containing the BFA1 promoter, and 3HA-tagged BFA1-D16 containing the BFA1 promoter were amplified by PCR using chromosomal DNA of the w303 strain as a template and the primers described in Table 3. The amplified PCR products were subcloned into pMW(L)20-pGAL, pMW(U)20-pGAL, pMW(U)20-pGAL-GFP, or pRS304, respectively. The restriction sites (all enzymes from Takara Bio Inc.) used for DNA cloning are listed in Table 3. PMW(L)20-pGAL-BFA12A and PMW(L)20-pGAL-BFA1-D162A mutants were constructed by PCR-based site-directed mutagenesis using PMW(L)20-pGAL-BFA1 and PMW(L)20-pGAL-BFA1-D16 as PCR templates and the primers shown in Table 3. pMW20(U) -pGAL, pMW20(U)-pGAL-GFP, and pMW(L)20-pGAL were CEN-based vectors with the GAL10-1 promoter.
2.3. Spotting Assay
Cells were incubated to mid-log phase and serially diluted 10-fold onto plates containing glucose or galactose. The assay was performed by incubating cells at 25 °C or 30 °C for 2 to 4 days after spotting the cells.
2.4. Bimolecular Fluorescence Complementation (BiFC) Analysis
The targeted genes were C-terminally tagged using PCR-based homologous recombination [29]. Cells co-expressing VN-tagged Bik1 and VC-tagged Kip2 or VN-tagged Bfa1 and VC-tagged Bim1 were visualized using a Zeiss LSM880 (Carl Zeiss, Jena, Germany) confocal microscope and ZEN software (Carl Zeiss) with a 100× oil objective.
2.5. Fluorescence Microscopy and Image Quantification
To observe nuclear positions and anaphase cells, cells were mounted in 4′,6-diamidino-2-phenylindole (DAPI)-containing medium (VECTASHIELD, Vector Laboratories, Burlingame, CA, USA) after fixation and sonication, and 2 μL of stained cells was loaded onto a glass slide. To monitor live cells with fluorescent signals, 2 μL of log-phase cells was loaded onto a glass slide, and images were taken immediately. The images (Figures 2F and 3A, Figure S4A–E) were visualized using a Zeiss LSM880 (Carl Zeiss) confocal microscope and ZEN software (Carl Zeiss) with a 100× oil objective. Other images were visualized using an Axioplan2 (Carl Zeiss) microscope with a 100× objective. Images were captured using an Axiocam CCD camera (Carl Zeiss) and AxioVision software (Carl Zeiss).
All image data were quantified using Fiji ImageJ (ImageJ 2.3.0/1.53q developed byWayne Rasband et al., National Institutes of Health, USA; download from https://imagej.net/ on 18 April 2022). For measurement of aMT and spindle length, a segmented line in Fiji ImageJ was used. For quantification of fluorescent signal intensity, the images for each experiment were captured by the same fluorescence exposure time. The background of images was corrected using the BaSiC plugin in Fiji ImageJ, and automatic regularization was applied to dark-field and flat-field correction using predefined shading profiles as described [31]. The intensity of Mob1-GFP and Tem1-RFP at the SPB was quantified by measuring the maximum intensity value in a segmented region containing a dot-like signal colocalized with the SPB. To measure the fluorescent signal dispersed out of SPBs, the mean intensity of a segmented area with a fixed size (2.37 μm2) per cell was detected.
2.6. Co-Immunoprecipitation (Co-IP) and Western Blot
Cells were grown to the log phase and lysed in lysis buffer using a bead beater (Biospec, Bartlesville, OK, USA). The lysis buffer contained 50 mM Tris-HCl (pH 7.5), 150 mM NaCl, 1% Nonidet P-40, 2 mM EDTA, 5 mM MgSO4, 50 mM NaF, 100 mM β-glycerophosphate, 1 mM Na3VO4, 1 mM dithiothreitol, 1 mM phenylmethylsulfonyl fluoride, and protease-inhibitor cocktail (Roche, Basel, Switzerland). To precipitate HA-tagged Bim1, total lysates (5 mg in lysis buffer) were incubated with an anti-HA antibody at 4 °C for 2 h, followed by incubation with protein A agarose beads (Invitrogen, Carlsbad, CA, USA) at 4 °C for 2 h. Lysates were then boiled with sodium dodecyl sulfate (SDS) sample buffer [60 mM Tris-HCl (pH 6.8), 10% SDS, 5% 2-mercaptoethanol, 25% glycerol, and 0.1% bromophenol blue]. To detect HA-tagged Bim1 and Myc-tagged Kar9 and Kip2, the anti-HA antibody (1:3000; Santa Cruz Biotechnology, CA, USA) and anti-MYC antibody (1:5000; Cell Signaling Technology, Danvers, MA, USA) were used for Western blot analyses.
2.7. Statistical Analysis
Statistical analysis was performed with the Student’s t-test using GraphPad Prism (GraphPad Software, Inc., La Jolla, CA, USA). * p < 0.05, ** p < 0.01, *** p < 0.001, and **** p < 0.0001 indicate statistical significance, and ns (p > 0.05) indicates non-significance.
3. Results
3.1. Overexpression of Bfa1 Induces Growth Arrest with Hyper-Elongated aMTs
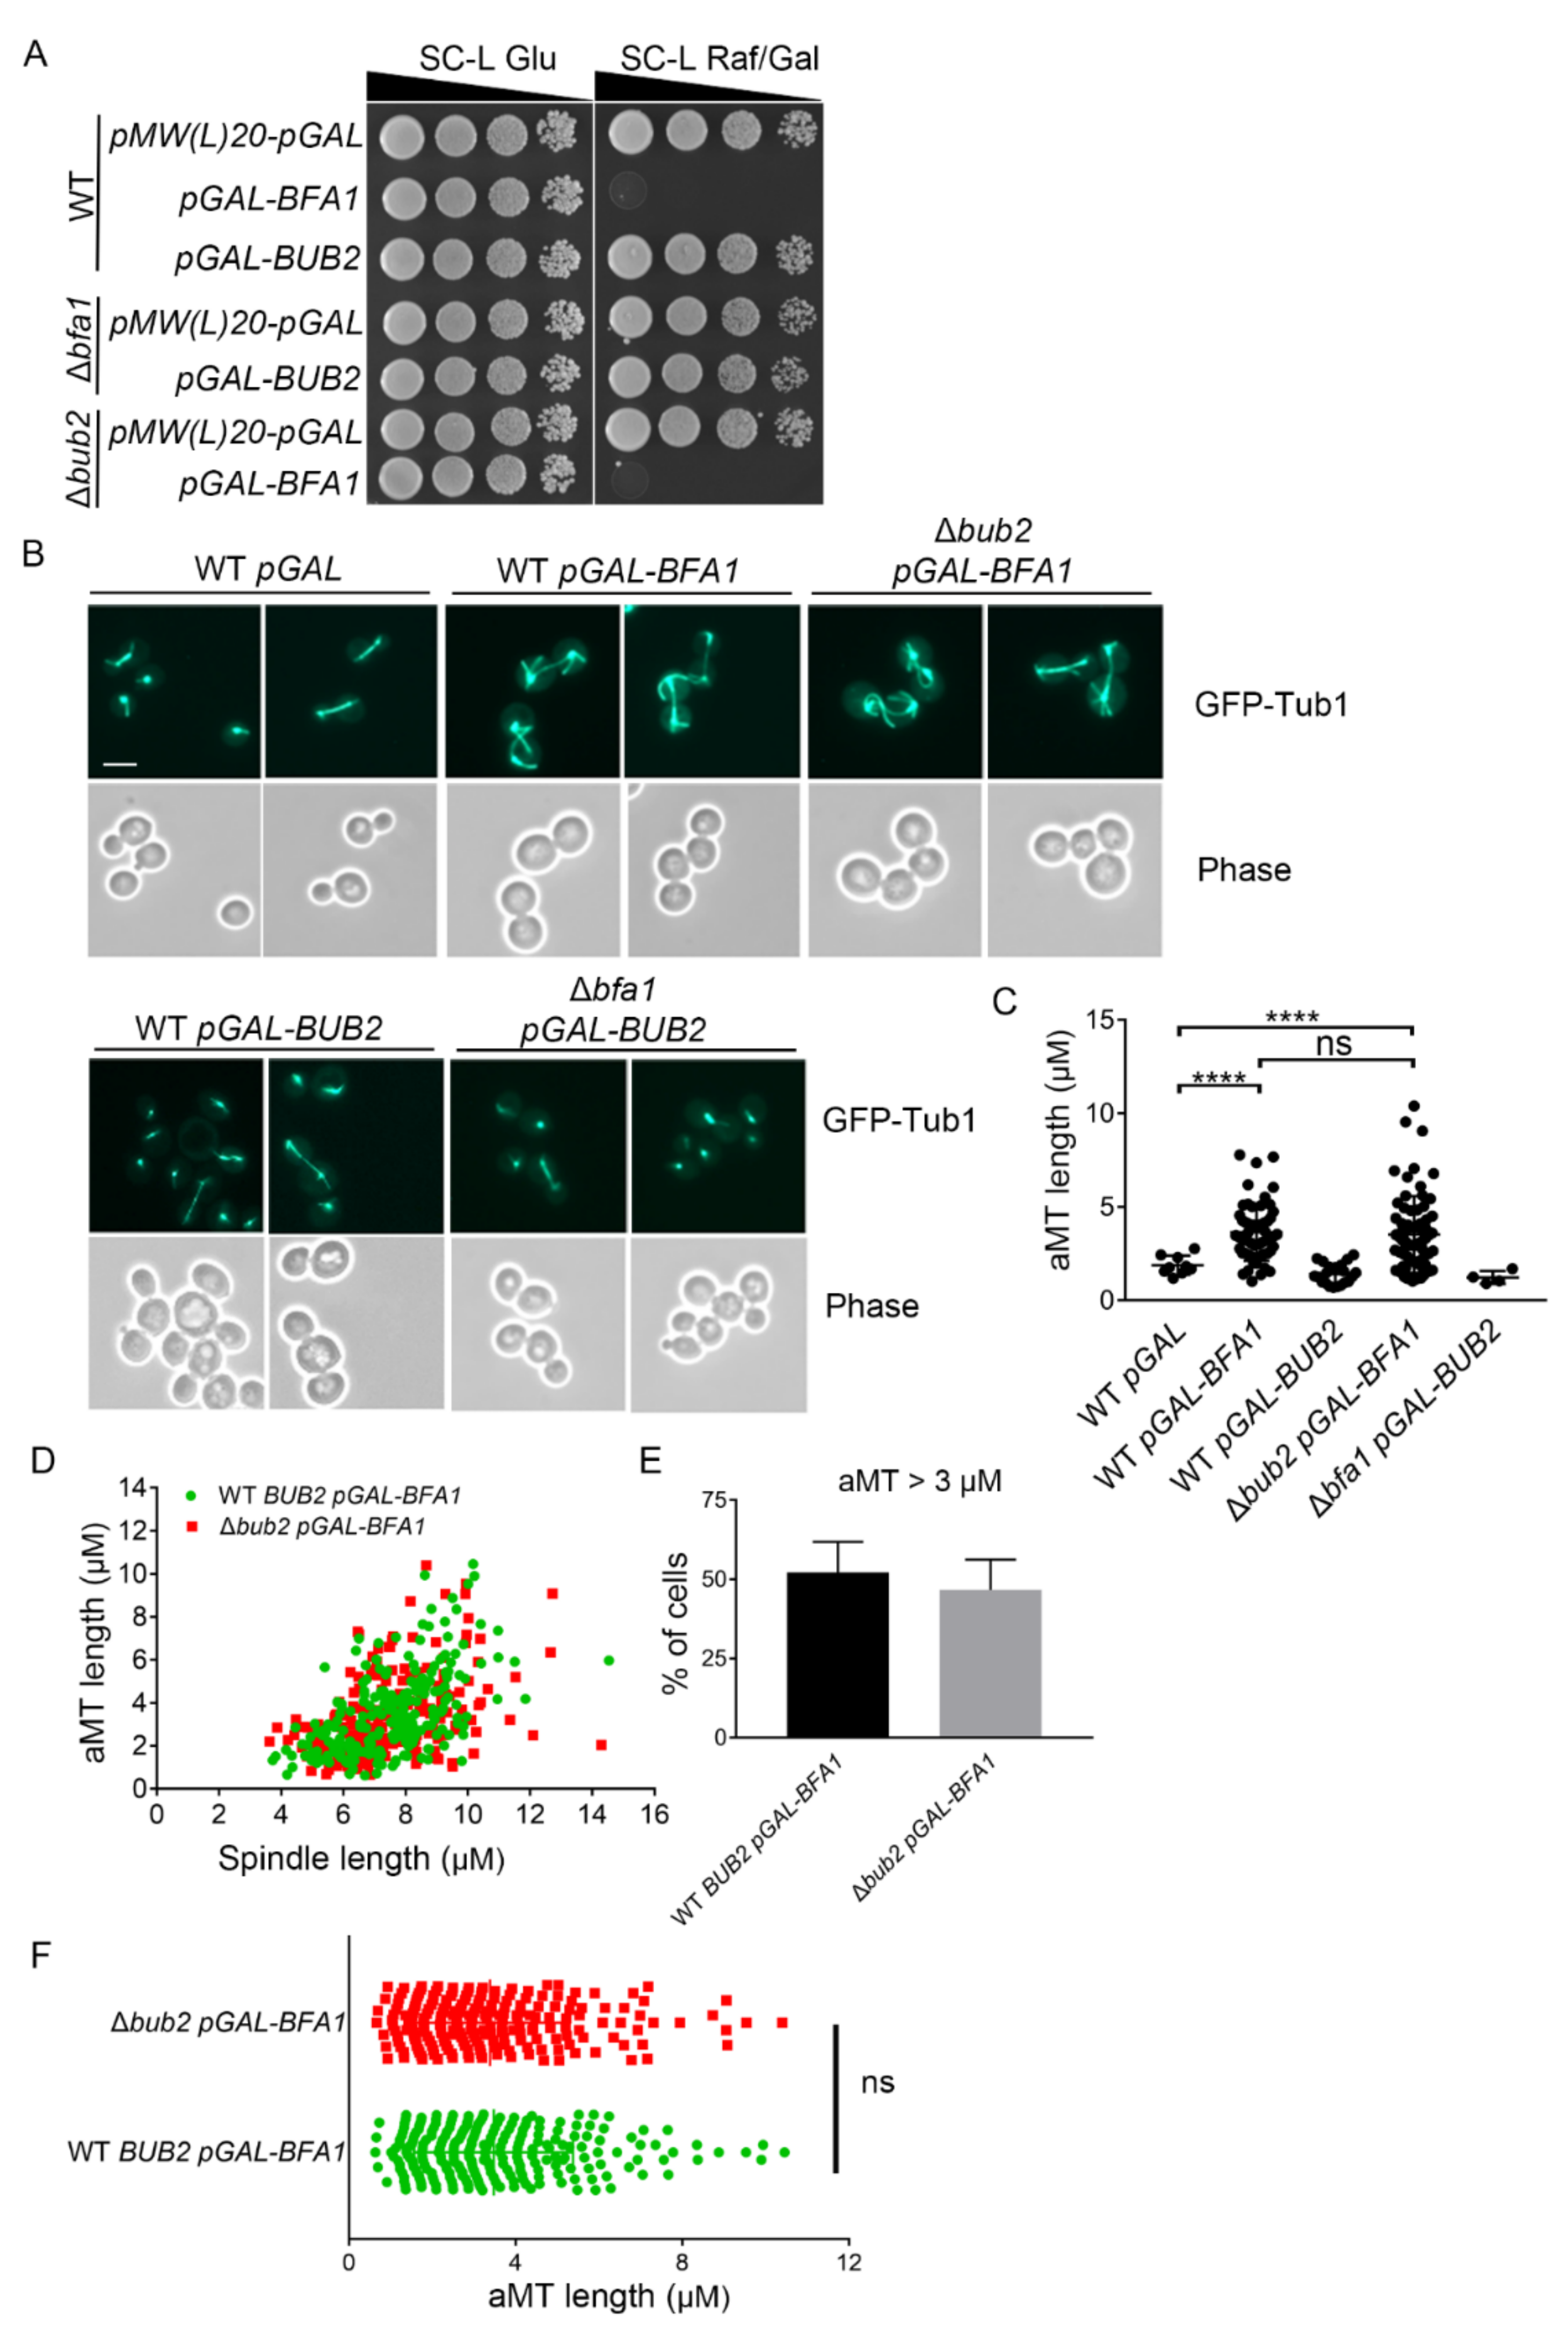
Previous studies reported that Bfa1 overexpression causes growth defects due to cell cycle arrest at anaphase and that this overexpression phenotype can be induced in cells depleted of BUB2 [21,22]. First, we overexpressed BFA1 or BUB2 under the control of the GAL10-1 promoter to confirm cell cycle arrest by spotting assays. Consistently, Bfa1 overexpression caused growth defects in Δbub2 cells, as well as in wild-type cells (Figure 1A). However, BUB2 overexpression in Δbfa1 cells and wild-type cells did not result in any growth defects (Figure 1A).
Bub2 comprises GAP activity along with Bfa1 to inhibit MEN activity and induce mitotic arrest, but Bfa1 overexpression leads to growth defects independent of Bub2 as shown in Figure 1A. Thus, we examined the phenotype associated with Bfa1-overexpressing cells to identify a novel mechanism by which Bfa1 blocks mitotic exit. Monitoring of MTs via GFP-Tub1 revealed that Bfa1 overexpression induced hyper-elongated astral MTs (aMTs) and that this phenotype was not eliminated in Δbub2 cells (Figure 1B,C). We determined the length of mitotic spindles and the longest aMT per cell for each genotype. The length of mitotic spindles was considered around 3 μm for cells entering early anaphase and its length could be enriched to 8–10 μm at late anaphase [16,32]. We found that the aMTs in vector control or Bub2 overexpressed cells with anaphase spindles shorter than 3 μm (Figure 1C). However, about 50% of the wild-type (WT; 52.14 ± 9.66%) and Δbub2 (46.44 ± 9.30%) cells overexpressing Bfa1 showed that the length of aMTs was longer than 3 μm when the cells had anaphase spindles (Figure 1D,E). The results also showed that there was no significant difference in aMT length between the WT and Δbub2 cells overexpressing Bfa1 (Figure 1F). These results suggested that hyper-elongated aMTs induced by Bfa1 overexpression originated independently of Bfa1 GAP activity. Moreover, Bub2 overexpression neither suppressed mitotic exit nor induced the elongated aMT phenotypes observed in Bfa1-overexpressing cells (Figure 1A–C). These observations suggested that Bfa1 overexpression can induce cell cycle arrest and hyper-elongated aMT phenotypes independent of GAP.
3.2. Overexpression of the N-Terminal Domain of Bfa1 Induces Growth Arrest with Hyper-Elongated aMTs
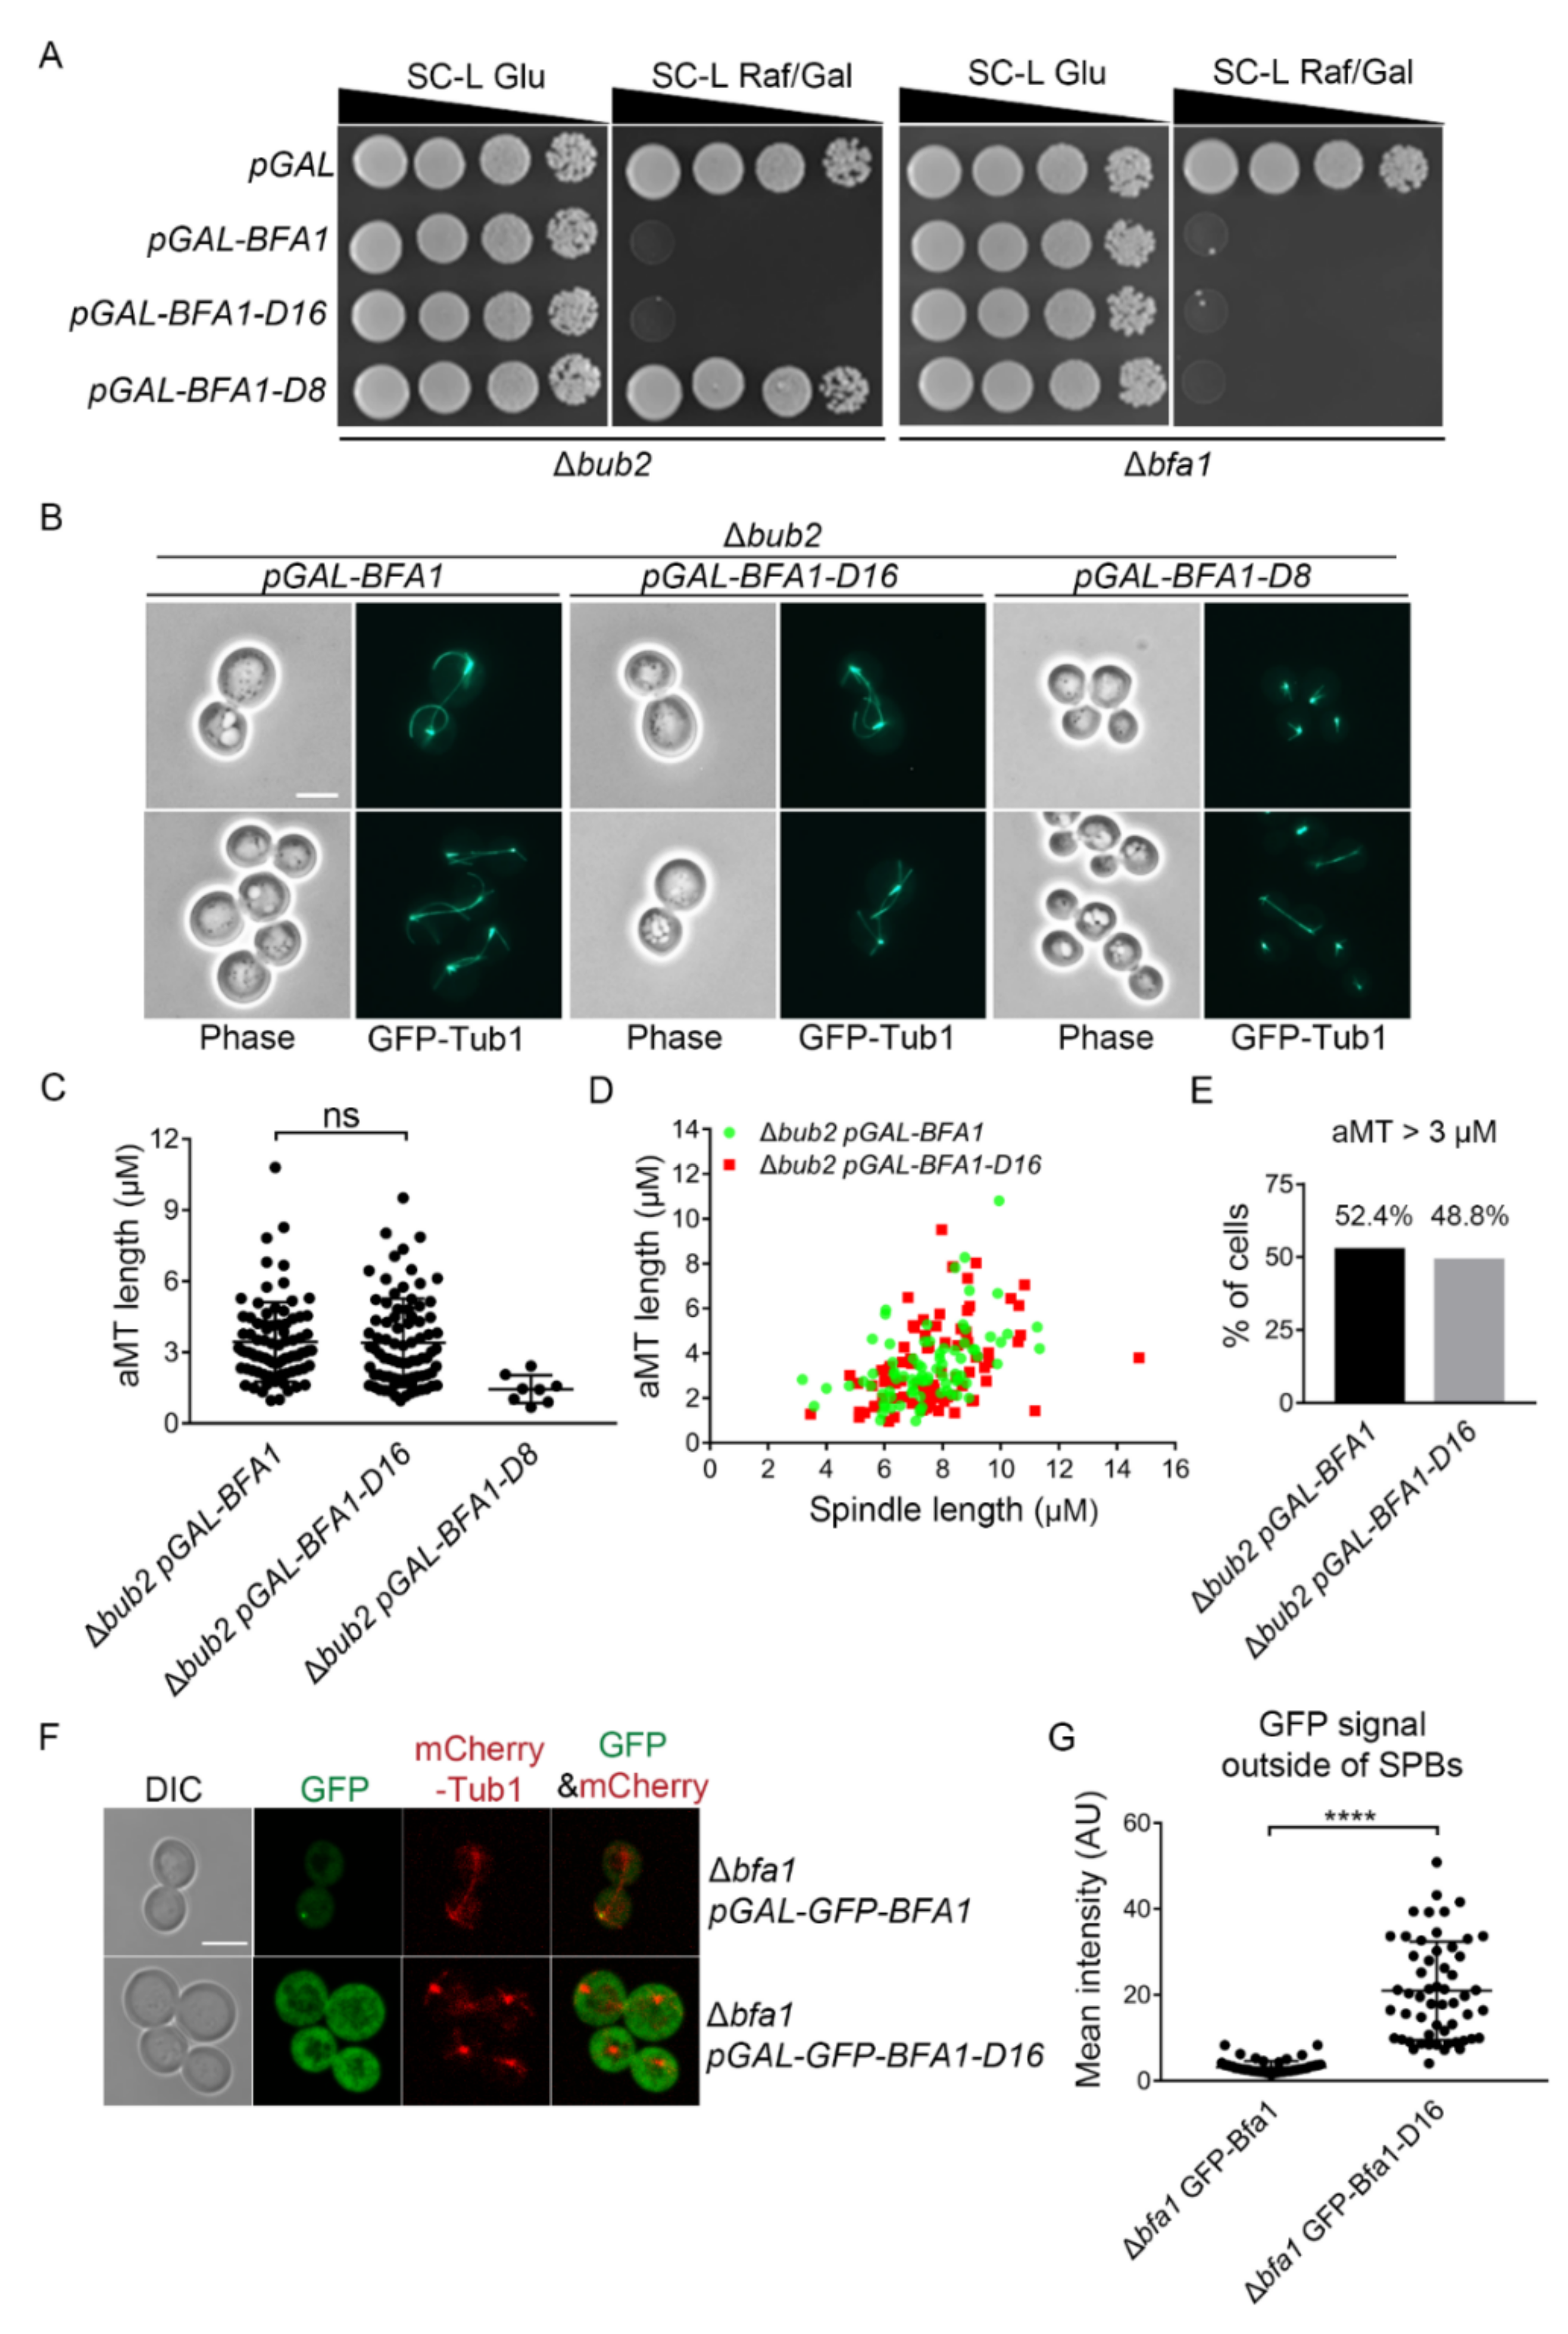
We previously reported that overexpression of the N-terminal domain of Bfa1 (Bfa1-D16; 1–376 amino acids) induces anaphase arrest, even though it is defective in Bub2 binding and SPB localization (Figure S1A) [22]. To further evaluate the GAP-independent control of mitotic exit by Bfa1, we examined Bfa1-D16 in cells without Bub2. We observed that Bfa1-D16 expression under the control of the GAL promoter showed growth defects and hyper-elongated aMTs in Δbub2 cells, demonstrating a block of mitotic exit (Figure 2A–E). 48.8% of Δbub2 cells overexpressing Bfa1-D16 and having anaphase spindles carried aMTs longer than 3 μm, as observed in Δbub2 cells overexpressing Bfa1 (Figure 1E and Figure 2C–E). By contrast, overexpression of the C-terminal domain of Bfa1 (Bfa1-D8; 391–574 amino acids), which functions as a GAP with Bub2 and localizes at SPBs (Figure S1A) [19,22], did not induce growth arrest and hyper-elongated aMTs (aMT length > 3 μm in cells with anaphase spindles) in Δbub2 cells, even though it could induce growth arrest in the presence of Bub2 (Figure 2A–C). A previous report showed that neither wild-type Bfa1 without Bub2 nor Bfa1-D16 with Bub2 binds to SPBs [22,33]. Consistently, both Bfa1 and Bfa1-D16 were not detected at SPBs in Δbub2 cells, whereas Bfa1 localized to SPBs in the presence of Bub2 (Figure 2F and Figure S1B). In Δbfa1 cells, the intensity of GFP-Bfa1-D16 outside of SPBs was stronger than that of GFP-Bfa1 outside of SPBs (Figure 2F,G). Taken together, these results demonstrated that both Bfa1 and Bfa1-D16 in Δbub2 cells induced mitotic arrest with hyper-elongated aMTs, despite their cytoplasmic localization, and suggested that their mitotic arrest did not rely on their GAP activity or SPB localization.
Bfa1 binds to the SPB component Spc72 and is phosphorylated by Cdc5 and Kin4 [26]. In Δspc72 cells, SPB localization of Bfa1 was decreased [26]. To further confirm that Bfa1-D16 overexpression could induce mitotic arrest with cytoplasmic localization, we observed the localization of overexpressed Bfa1-D16 under the GAL-promoter in the Δspc72 strain. Overexpressed Bfa1-D16, which lacks SPB localization, continued to arrest cells with large buds and resulted in growth defects in Δspc72 cells (Figure S1C). These observations confirmed the ability of Bfa1-D16 dispersed out of SPBs to induce mitotic arrest.
3.3. Overexpressed Bfa1-D16 Inhibits MEN Activity Independent of GAP
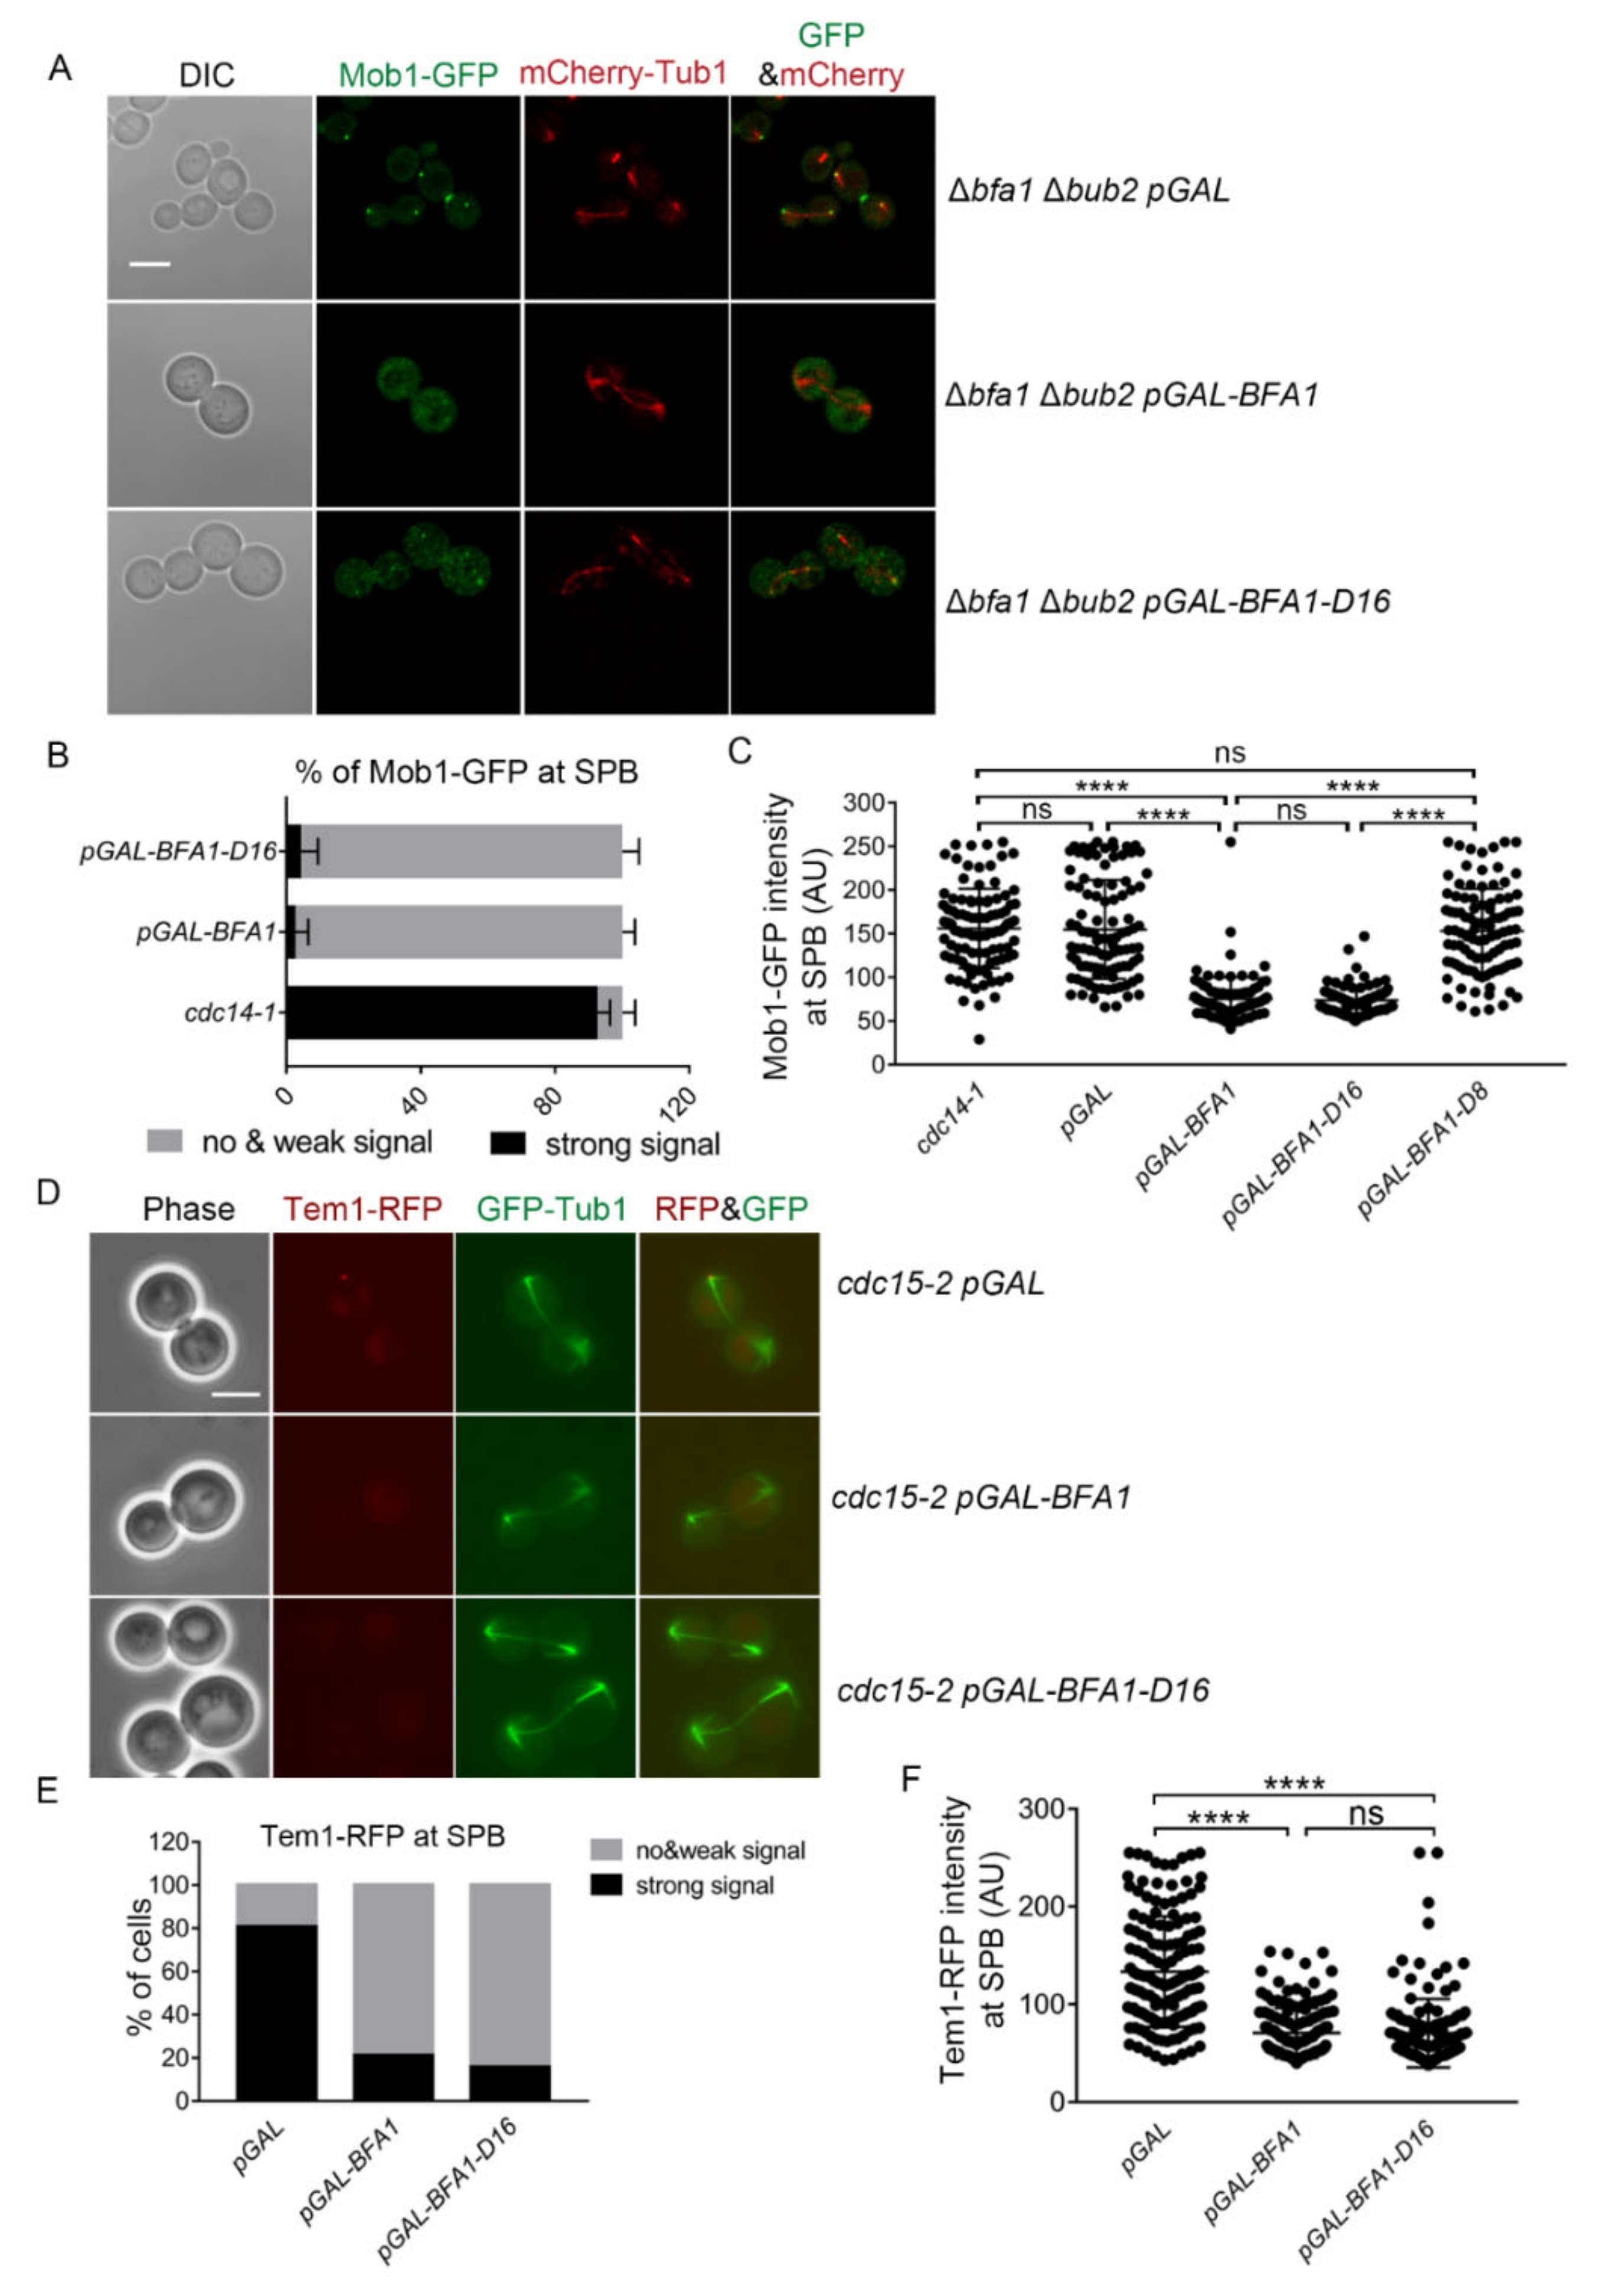
Recruiting Mob1 at the SPB is required for activation of the MEN pathway [10]. To determine whether Bfa1-D16 arrests mitotic exit via the known MEN pathway, we monitored Mob1-GFP localization in Bfa1-D16-overexpressed Δbub2 cells. Mob1-GFP localized to both SPBs of cdc14-1 cells arrested in anaphase at a restrictive temperature when the upstream regulator of Mob1 in the MEN pathway was not inhibited (Figure S2A). In the absence of both BFA1 and BUB2 (Δbfa1Δbub2 cells harboring vectors), strong Mob1-GFP signals were detected at both SPBs and the bud neck, and these cells were able to undergo mitotic exit and cytokinesis (Figure 3A,C and Figure S2A). Δbfa1 Δbub2 cells overexpressing the C-terminal Bfa1-D8 showed strong Mob1-GFP signals at both SPBs and the bud neck with no growth defects, given that these cells proceeded to mitotic exit and cytokinesis (Figure 2A, Figure 3C and Figure S2A). By contrast, overexpression of wild-type Bfa1 and Bfa1-D16 prevented the recruitment of Mob1-GFP to both SPBs in Δbfa1 Δbub2 cells, in which mitotic exit was blocked with growth defects (Figure 2A, Figure 3A–C and Figure S2A). Compared to cdc14-1 cells, most Δbfa1 Δbub2 anaphase cells overexpressing either Bfa1 or Bfa1-D16 showed weak or no signals of Mob1-GFP at SPBs (Figure 3B). In addition, the Mob-GFP intensity at the SPBs in cells overexpressing Bfa1 or Bfa1-D16 was weaker than that in cdc14-1 cells and in Δbfa1 Δbub2 cells overexpressing Bfa1-D8 or the vector control (Figure 3A–C and Figure S2A). Conversely, the Mob1-GFP intensity at a region outside of SPBs was stronger in Bfa1- or Bfa1-D16-overexpressing cells compared to that in cdc14-1 cells (Figure S2B). These results strongly suggested that Bfa1-D16, devoid of GAP activity, controlled mitotic exit by blocking the activation of the MEN pathway in its downstream.
Then, how does Bfa1-D16 localized outside of SPBs inhibit Mob1 activity? Ro et al. [21] demonstrated that Bfa1 inhibits the interaction between Tem1 and Cdc15 in Δbub2 cells, whereas Bfa1 cannot localize to SPBs [33]. Bfa1-D16 physically interacts with Tem1, although it does not bind to Bub2 and SPBs [22]. Bfa1-D16 dispersed out of SPBs may also inhibit the upstream activity related to Mob1, such as binding Tem1 to sequester it outside of SPBs. Therefore, we monitored the localization of Tem1-RFP at anaphase in cdc15-2 cells either overexpressing Bfa1 or Bfa1-D16 at a restrictive temperature. A strong Tem1-RFP signal was asymmetrically localized to SPBs in the cdc15-2 anaphase cells harboring the vector only (Figure 3D–F). However, Tem1-RFP showed no or weak signals at SPBs of cdc15-2 cells overexpressing Bfa1 or Bfa1-D16 (Figure 3D–F). These results demonstrated that the Bfa1-D16 blocks mitotic exit through inhibiting Tem1 localized outside of SPBs. It is possible that binding of Bfa1-D16 to Tem1 in the cytoplasm blocks Tem1 binding to SPBs, thereby inhibiting MEN activation.
Recently, de los Santos-Vela’zquez et al. [34] demonstrated that deletion of the small nucleolar ribonucleoprotein particle (snoRNP) assembly factor induces nucleolar hyper-condensation, leading to defects in Cdc14 release from the nucleolus and mitotic exit [34]. Additionally, they reported that Δbfa1 suppresses the synthetic lethality of Δlte1 with the deletion of RSA1 (or HIT1), which is a box C/D snoRNP assembly factor [34]. Therefore, we questioned whether the full-length Bfa1 or Bfa1-D16 could block mitotic exit by inhibiting snoRNP independent of its GAP function. We examined whether the overexpression of Snu13, a component of box C/D snoRNP, could suppress the growth defects caused by Bfa1 overexpression in Δbub2 cells using spotting assays. The results showed that the growth defect caused by Bfa1 or Bfa1-D16 overexpression in Δbfa1 Δbub2 cells was not inhibited by Snu13 overexpression (Figure S2C,D). This result suggested that the mitotic arrest of Bfa1- or Bfa1-D16-overexpressing cells was not caused by inhibition of the snoRNP component.
3.4. Bfa1-D16 Exhibits SPOC Function in a Bub2-Independent Manner
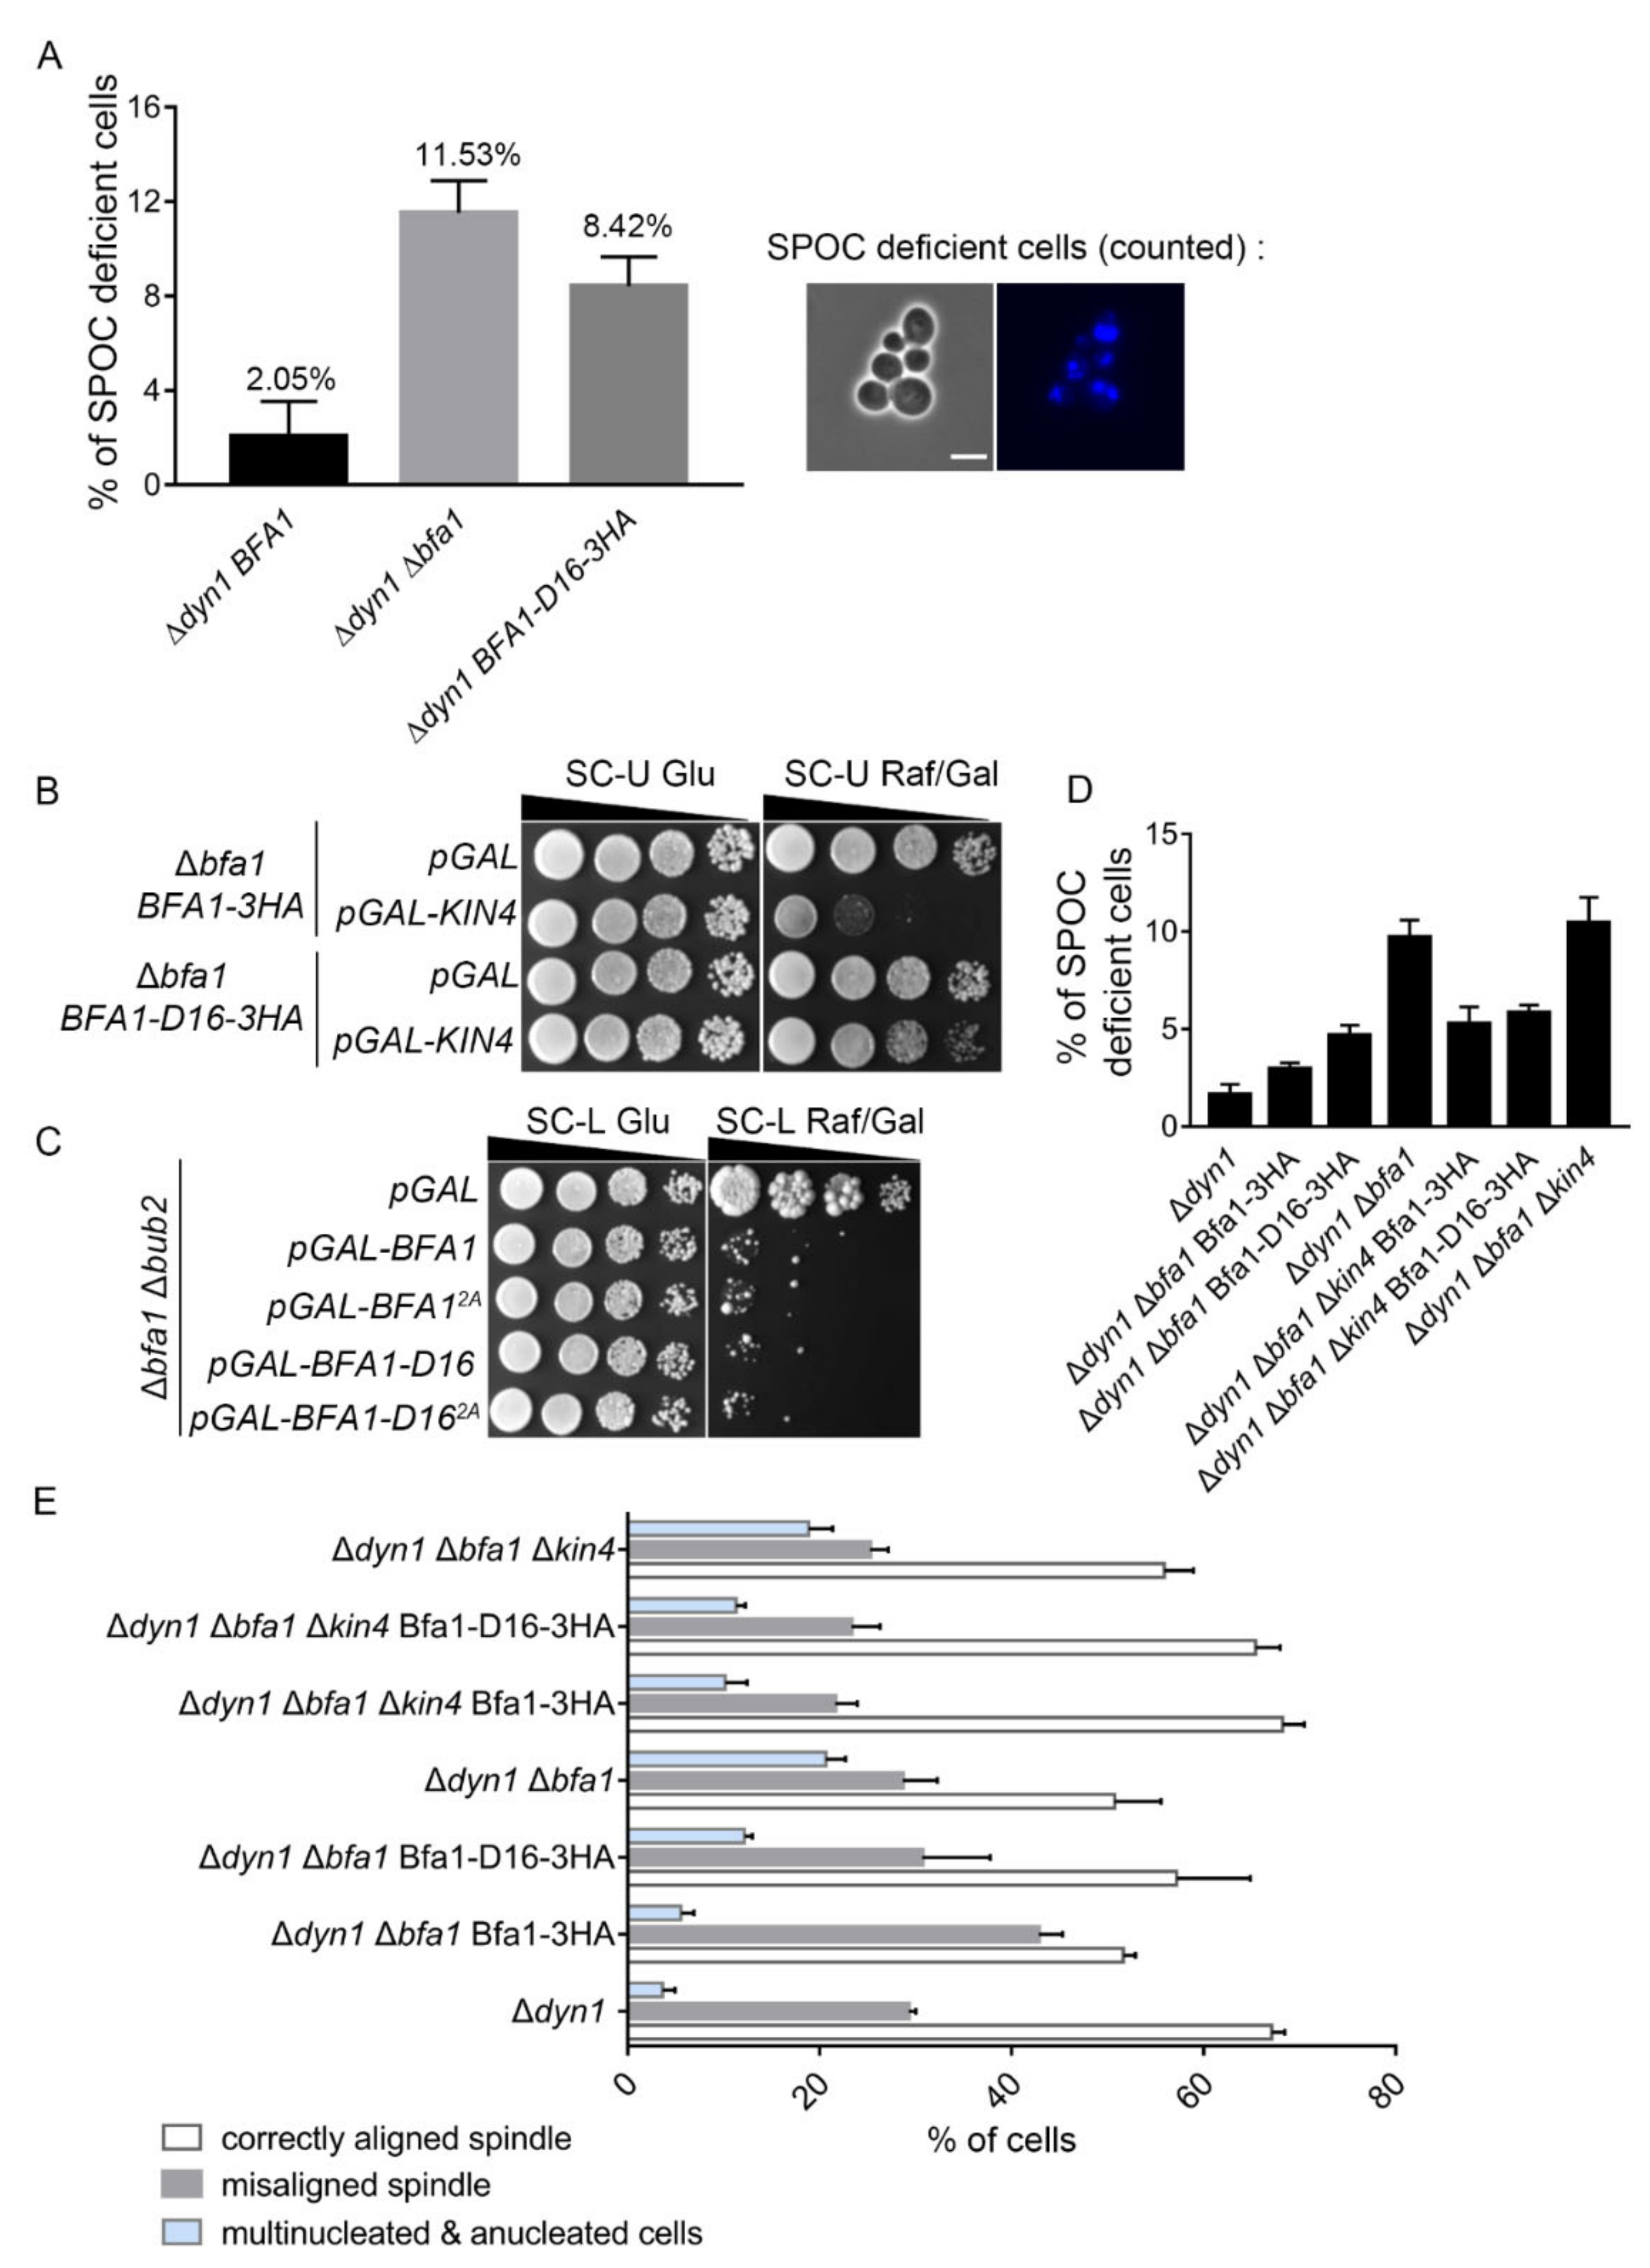
We previously reported that the GAP activity of Bfa1 is required to block mitotic exit in response to DNA damage and spindle damage, but that the SPOC function of Bfa1 does not rely on GAP [20]. Thus, we investigated whether endogenously expressed Bfa1-D16 exerts SPOC activity in Δdyn1 cells with misoriented spindles. To express endogenous Bfa1-D16 under the BFA1 promoter, we replaced the C-terminal domain of BFA1 with 3HA epitopes in the chromosomal BFA1 locus of Δdyn1 cells (YSK3421). Cells with the absence of the DYN1 gene, which is a cytoplasmic dynein heavy chain required for spindle orientation, induce misaligned spindles [4,35]. The SPOC-deficient Δdyn1 cells undergo mitotic exit despite misaligned spindle sand become multinucleated or anucleated [9]. We counted the anucleated and multinucleated cells as SPOC-deficient cells in YSK3421 after DAPI staining and the percentage of SPOC-deficient cells calculated as the number of anucleated and multinucleated cells relative to the total number of cells. The proportion of SPOC-deficient cells among Bfa1-D16-expressing Δdyn1 cells was lower than that among Δdyn1 Δbfa1 double-knockout cells, even though Δdyn1 cells expressing only endogenous Bfa1-D16 showed more defects in SPOC function as compared with Δdyn1 cells expressing wild-type Bfa1 (Figure 4A). This result suggested that endogenous levels of Bfa1-D16 showed weak SPOC activity in Δdyn1 cells.
Kin4 activates Bfa1 by phosphorylating two serine sites (S150 and S180) in the N-terminal domain of Bfa1 (Bfa1-D16) in response to spindle misorientation [16,26]. To determine whether activation of the N-terminal domain of Bfa1 by Kin4 is necessary for the anaphase arrest induced by Bfa1 or Bfa1-D16 overexpression, we constructed strains endogenously expressing wild-type Bfa1 (YSK3422) and Bfa1-D16 (YSK3423) by integrating BFA1 and BFA1-D16 under the BFA1 promoter in Δbfa1 cells and induced Kin4 overexpression in these strains. A previous report showed that Kin4 overexpression arrests cells expressing wild-type Bfa1 during anaphase [18]. Consistent with the former result, we found that Kin4 overexpression under the GAL promoter induced growth defects in cells endogenously expressing wild-type Bfa1 (Figure 4B). However, we found that cells overexpressing Kin4 grew well with expressing endogenous Bfa1-D16, although Bfa1-D16 contains the phosphorylation sites for Kin4 (Figure 4B). Moreover, we mutated the two phosphorylation target sites by Kin4 from serine to alanine (S150A, S180A) in wild-type BFA1 (BFA12A) and BFA1-D16 (BFA1-D162A). The previous result reported that Kin4 phosphorylation is blocked in the Bfa12A mutant and that Kin4 overexpression did not induce any growth toxicity in cells expressing Bfa12A [16]. We thus examined the mitotic arrest by overexpression of Bfa12A or Bfa1-D162A in Δbub2 cells and found that these cells still showed growth defects similar to those observed in Bfa1- or Bfa1-D16-overexpressing cells (Figure 4C). This result demonstrated that Bub2-independent mitotic arrest induced by Bfa1 or Bfa1-D16 is not regulated by Kin4.
To further examine whether Kin4 regulates Bfa1-D16 for mitotic arrest, we observed the SPOC of Bfa1-D16 in Δdyn1 Δkin4 cells. We constructed the strains whose chromosomal DNA of Δdyn1 Δkin4 Δbfa1 or Δdyn1 Δbfa1 cells were integrated with BFA1-3HA or BFA1-D16-3HA under the BFA1 promoter. The percentage of SPOC-deficient cells was calculated as the number of anucleated and multinucleated cells relative to the total number of cells (Figure 4D) or the total number of anaphase cells (Figure 4E). Consistent with the result shown in Figure 4A, Bfa1-D16 conserved SPOC activity when compared to Δdyn1 Δbfa1, although its SPOC activity was weaker than that of the cells expressing endogenous Bfa1 or Bfa1-3HA. SPOC activity was also conserved in Δdyn1 Δkin4 Δbfa1 cells expressing Bfa1-3HA under BFA1 promoter, compared to Δdyn1 Δkin4 Δbfa1 cells (Figure 4D,E). Interestingly, Δdyn1 Δkin4 Δbfa1 cells expressing Bfa1-D16-3HA under BFA1 promoter did not show as severe SPOC defects as Δdyn1 Δkin4 Δbfa1 cells, and the SPOC activity was similar to that of KIN4 knockout cells with the wild-type Bfa1 (Figure 4D,E). Consistent with our observations, Δdyn1 Δkin4 cells did not lose the full SPOC activity in the previous report [36]. These results suggested that Kin4-independent SPOC activity of Bfa1 is conserved in Bfa1-D16, and supported that Bfa1-D16 is not regulated by Kin4.
3.5. Hyper-Elongated aMTs Are Conserved in the Cells of Late Mitotic Arrest
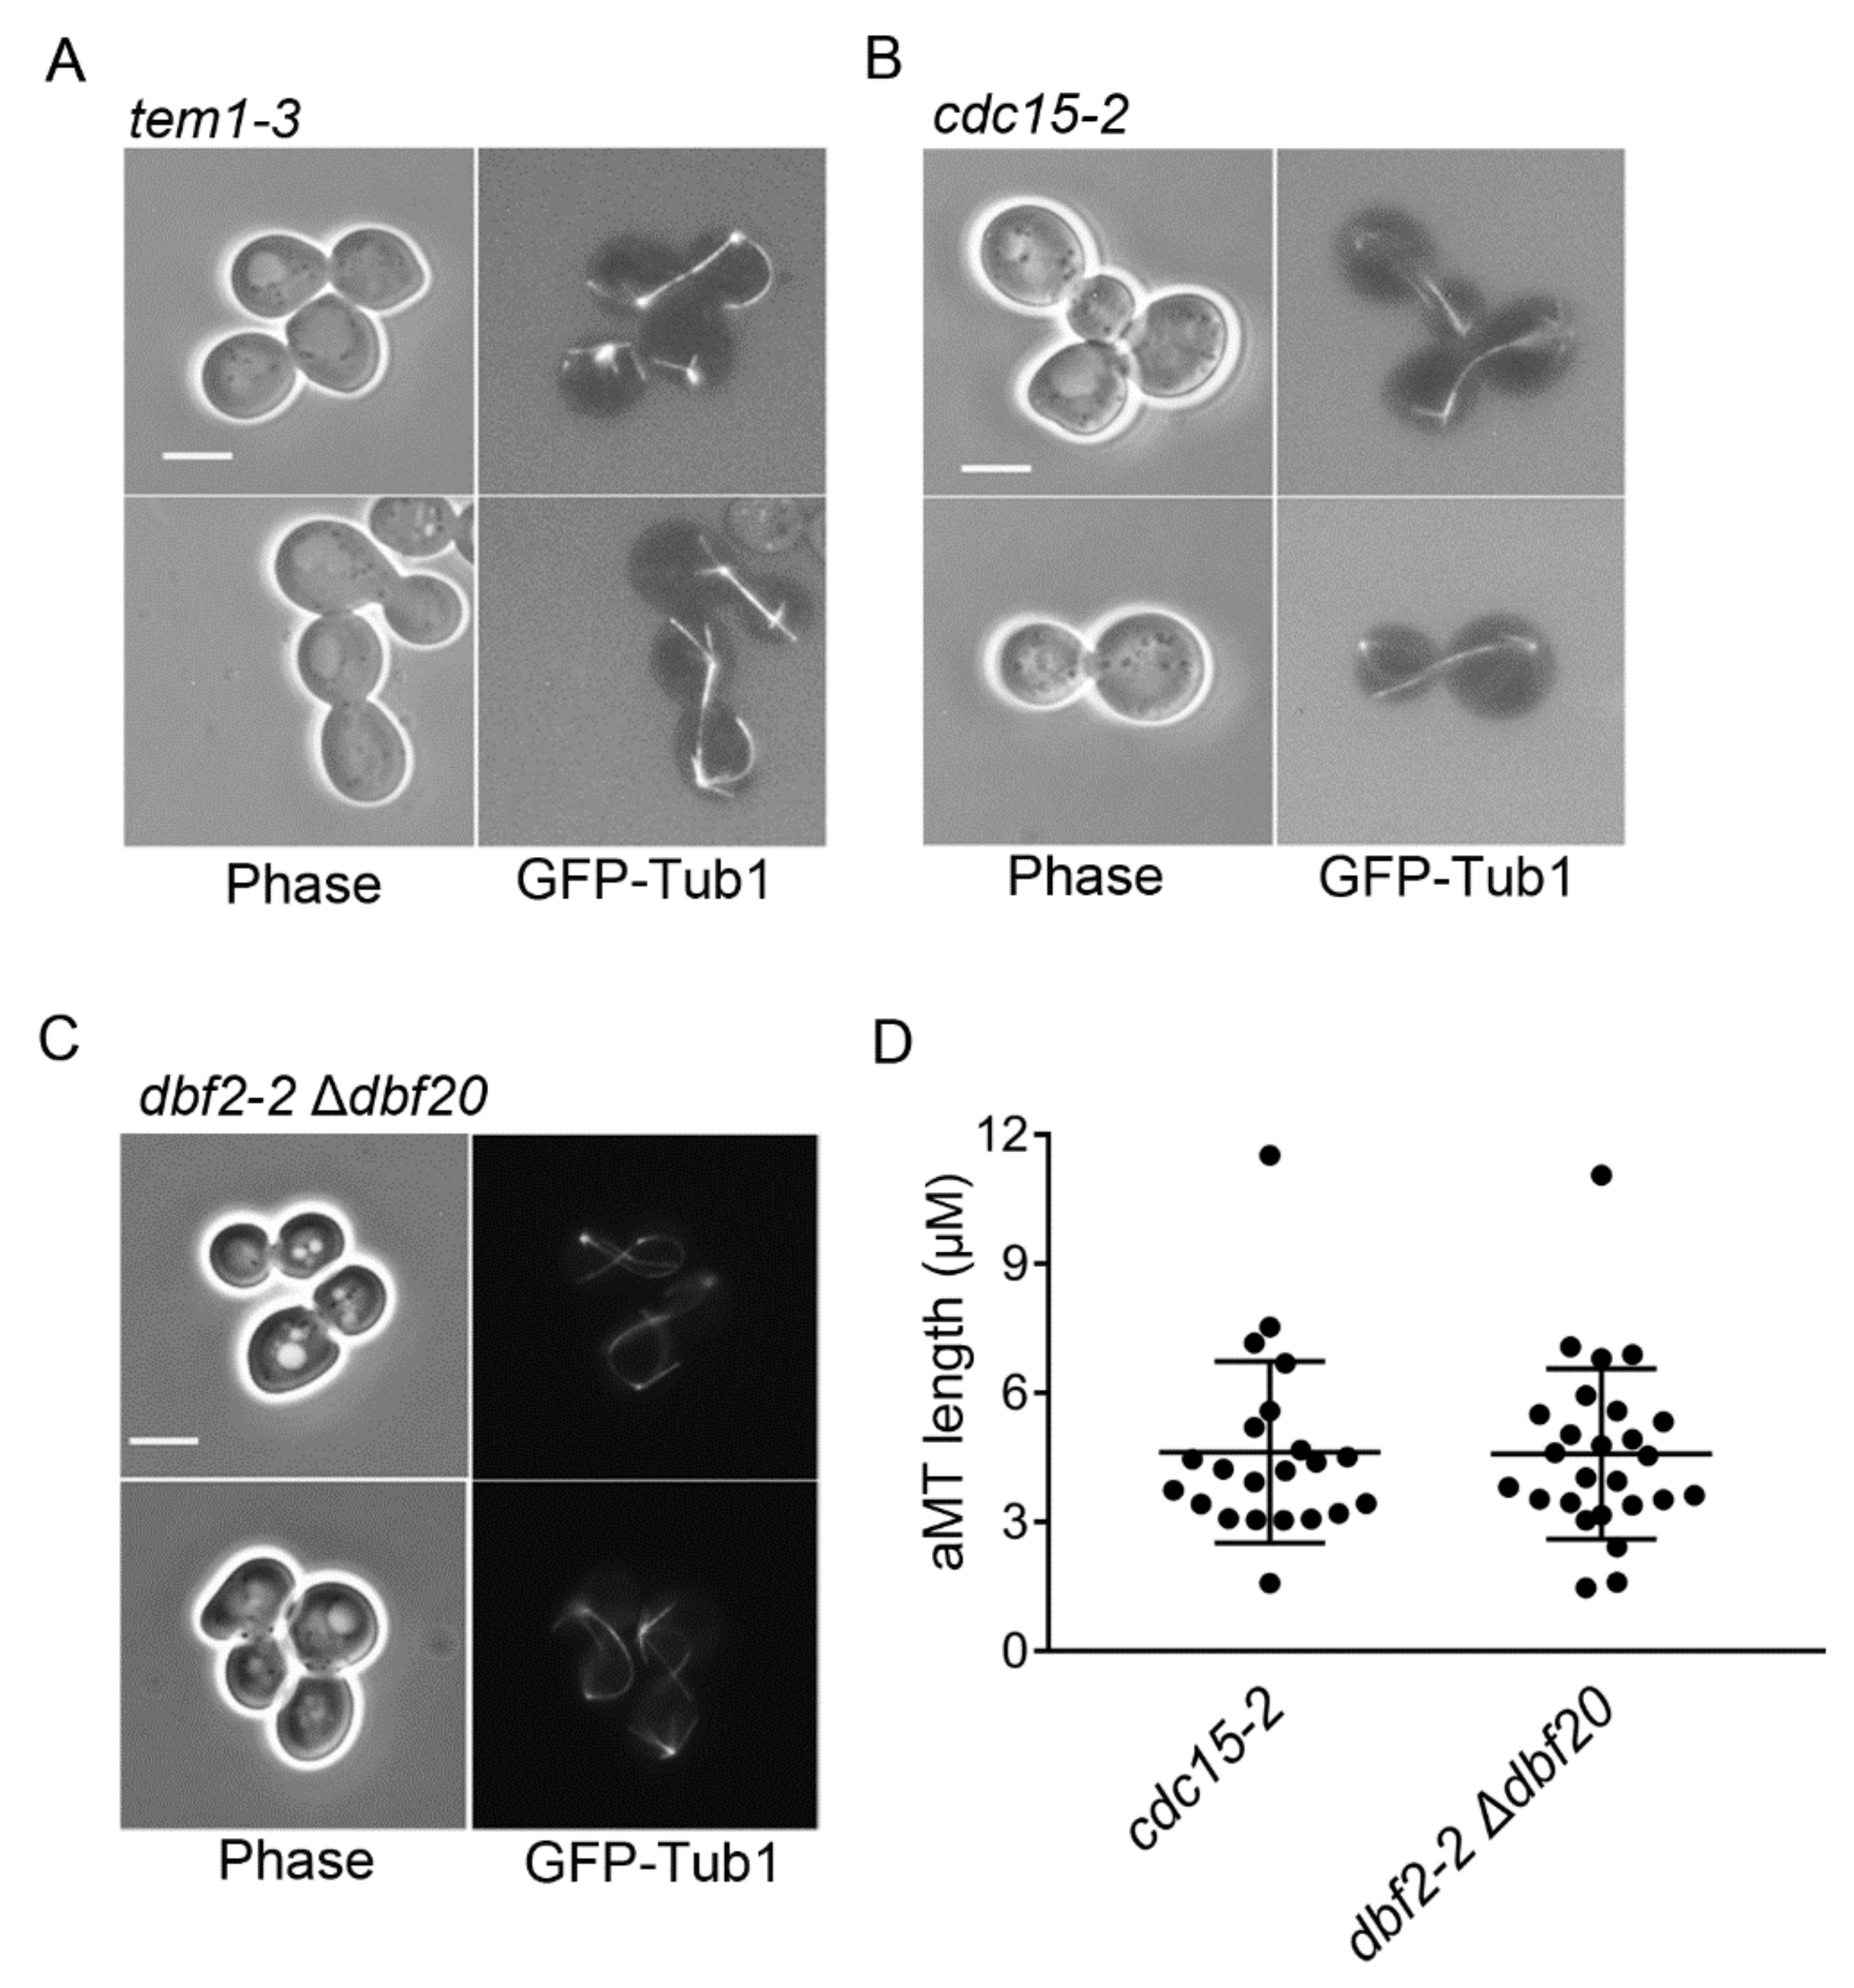
Because we consistently observed hyper-elongated aMTs in cells arrested in late mitosis by Bfa1 and Bfa1-D16 overexpression (Figure 1 and Figure 2), we questioned whether hyper-elongated aMTs are the cause or the result of late mitotic arrest. Thus, we investigated whether the hyper-elongated aMTs observed in Bfa1- and Bfa1-D16-overexpressing cells were the general phenotypes of cells in late mitotic arrest or specific to Bfa1-overexpressing cells. Specifically, we observed the aMT phenotypes associated with tem1-3, cdc15-2, and dbf2-2 mutants at a restrictive temperature, where the MEN was inactivated, and cells were arrested at late mitosis. The result showed the presence of hyper-elongated aMT phenotypes (most cells showed an aMT length > 3 μm) in cdc15-2 and dbf2-2 mutants (Figure 5A–D).
To confirm that the hyper-elongated aMTs are not a cause of mitotic arrest, we determined whether the deletion of microtubule-associated proteins (MAPs) blocks mitotic arrest caused by Bfa1 overexpression or cdc15-2 cells. The observation of GFP-Tub1 in Δkip2 and wild-type cells overexpressing Bfa1 revealed the disappearance of the hyper-elongated aMTs as a consequence of defective MT function due to the lack of KIP2 but the arrest of the cells at anaphase (Figure S3A–C). Notably, the removal of Kip2 as well as other MAPs regulating MT dynamics did not rescue the growth arrest induced by Bfa1 overexpression (Figure S3C–E). These results suggested that late mitotic arrest caused by Bfa1 overexpression was not mediated by the hyper-elongated aMT phenotype. Furthermore, when we observed the aMTs in a cdc15-2 Δkip2 double mutant at the restrictive temperature for cdc15-2, deletion of KIP2 did not suppress the anaphase arrest induced by cdc15-2 mutation (Figure S3F–H). These cells showed defects in aMT elongation but phenotypes similar to Bfa1 overexpression in Δkip2 cells. These results demonstrated that hyper-elongated aMTs represent conserved phenotypes of the block of mitotic exit and are the result of mitotic arrest induced by Bfa1 and Bfa1-D16 overexpression.
3.6. Overexpression of Hyper-Elongated aMTs by Bfa1 or Bfa1-D16 Is Not Mediated by Their Interaction with MAPs
Notably, we routinely observed hyper-elongated aMTs with anaphase spindles in cells overexpressing Bfa1 and Bfa1-D16 (Figure 1 and Figure 2), and aMTs were directly responsible for mitotic spindle orientation. In addition, BFA1 has genetic interactions with several genes encoding MT-associated proteins (MAPs), such as BIM1, BIK1, KAR9, and KAR3, according to a synthetic genetic array [37]. Thus, to determine whether the hyper-elongated aMTs were directly associated with Bfa1- and Bfa1-D16, we used BiFC analysis to examine the interaction between Bfa1 and several MAPs. The BiFC assay is a reliable method for studying protein–protein interactions in yeast cells [29]. We first confirmed whether the BiFC assay could visualize the Kip2–Bik1 interaction (well-known interacting MAPs in yeast cells) (Figure S4A). We subsequently found that Bfa1 interacted with the MT-binding protein Bim1 according to the BiFC assay (Figure S4B). The Bfa1–Bim1 interaction was observed in one of the SPBs in WT cells but not visible in Δbub2 cells (Figure S4B–E).
Kar9 via its interaction with Bim1 mediates the capture of aMTs in the cortex [2,3]. Additionally, Scarfone et al. [36] reported that Bfa1 binding to SPBs via the Spc72–Bfa1 fusion protein affects the asymmetric distribution of Kar9. Because the hyper-elongated aMTs observed in Bfa1-overexpressing cells may be due to the disturbance of the connection between aMTs and the cell cortex, we evaluated whether Bfa1 overexpression inhibits the Kar9 interaction with Bim1 to affect aMT–cortex attachment. We detected the physical interaction between Kar9 and Bim1 in Bfa1-overexpressing cells by co-immunoprecipitation (Co-IP) assay and found that their interaction was not diminished in Bfa1-overexpressing cells compared to the vector control (Figure S4F). This result showed that Bfa1 overexpression likely did not block Kar9 binding to MTs.
Kip2 mediates MT stabilization by interacting with Bik1 (human CLIP-170 ortholog) and Bim1 [38]. Additionally, Chen et al. [39] reported that Δbfa1 affects Kip2 asymmetric loading onto bud-directed SPBs. Moreover, overexpression of Kip2 kinesin under the control of the GAL promoter resulted in hyper-elongated MTs [40], similar to that observed in Bfa1- and Bfa1-D16-overexpressing cells in the present study. Given the identified Bfa1–Bim1 interaction shown in Figure S4B, we examined whether Bfa1 overexpression enhances the binding of Kip2 and Bim1 to induce hyper-elongated MTs. Co-IP assay for Kip2 and Bim1 in Bfa1-overexpressing cells revealed that Kip2–Bim1 interaction was unaltered in Bfa1-overexpressing cells compared with that observed in the vector control (Figure S4G). These observations demonstrated that Bfa1 overexpression does not directly affect the Bim1–Kip2 and Bim1–Kar9 interactions to cause hyper-elongated aMTs, despite Bfa1 interaction with the MT-binding protein Bim1. Because full-length Bfa1 did not show functional connections with MAPs, we did not examine the same possibility for Bfa1-D16.
Given that a previous report showed that Bfa1 affects the asymmetric distribution of MAPs such as Kip2 and Kar9 [36,39] and based on the present results showing that Bfa1 interacts with Bim1, we determined whether Bfa1 regulates spindle position. We observed nuclear migration in Δbfa1 cells compared with that in wild-type cells. The cells synchronized with hydroxyurea were subsequently released into YPAD medium for 20 min and 60 min respectively, and their nuclear positioning was observed by DAPI staining to count the number of cells showing aberrant nuclear migration. We found that aberrant nuclear migration increased slightly (>3%) in Δbfa1 cells compared with that in the WT (Figure S5A,B), suggesting that BFA1 plays a minor role in nuclear migration.
4. Discussion
In cases of spindle misorientation, the surveillance mechanism of budding yeast, SPOC, is activated to arrest the cell cycle until the spindle is properly oriented. This mechanism ensures the equal separation of genetic material into mother and daughter (bud) cells. The Bfa1–Bub2 GAP complex, a key component of SPOC, inhibits the GTPase Tem1 and MEN activities to induce mitotic arrest [19]. However, several previous studies suggested that Bfa1 can block mitotic exit in a GAP-independent manner [20,21]. Therefore, in the present study, we investigated the possible mechanisms by which Bfa1 regulates mitotic exit independent of GAP activity and SPB localization.
To investigate the GAP-independent function of Bfa1 in SPOC, we examined the N-terminal Bfa1-D16 domain. Overexpression of Bfa1-D16, which cannot bind to Bub2 and SPBs, induces anaphase arrest [22]. We showed that overexpressed Bfa1 or Bfa1-D16 in Δbub2 cells was not detectable on SPBs and arrested the cell cycle in late mitosis along with hyper-elongated aMTs (Figure 1 and Figure 2 and Figure S1B), whereas overexpression of Bub2 or the Bub2-dependent Bfa1-D8 domain did not induce cell cycle arrest (Figure 1 and Figure 2). These results suggested that Bfa1 or Bfa1-D16 can induce cell cycle arrest independent of Bub2 with their localization outside of SPBs. Furthermore, overexpression of either Bfa1 or Bfa1-D16-blocked Mob1 and Tem1 binding to SPBs in late mitotic cells (Figure 3). These results suggest that the GAP-independent Bfa1-D16 domain should inhibit MEN activity for arresting mitotic exit in the cytoplasm. We further evaluated the SPOC activity of endogenous Bfa1-D16 in Δdyn1 cells, finding minor SPOC activity by endogenous Bfa1-D16 in cells with misaligned spindles (Figure 4A,D,E). Then, how does Bfa1-D16 localized outside of SPBs inhibit MEN activity? Scarfone et al. [36] reported that Bfa1 binding to SPBs facilitates mitotic exit. Their study also showed that the Spc72–Bfa1 fusion protein recruits MEN components such as Tem1 and Cdc15, and that Δdyn1 cells expressing the fusion protein lack SPOC activity [36]. Additionally, Bfa1-D16 physically interacts with Tem1 by the yeast 2-hybrid, although it does not bind to Bub2 and SPB [22]. Therefore, Bfa1-D16 dispersed out of SPBs may inhibit the upstream activity such as Tem1 in the cytoplasm and (or) not facilitate binding of Tem1 or other MEN components to SPBs, thereby exerting SPOC activity.
The Kin4-phosphorylation sites of Bfa1 are distributed in Bfa1-D16, but we observed no growth arrest following Kin4 overexpression in cells expressing Bfa1-D16 (Figure 4B). Similarly, overexpression of the Kin4-phosphorylation-blocked mutants, Bfa12A and Bfa1-D162A, induced growth arrest to the same degree as that observed in the overexpression of wild-type Bfa1 and Bfa1-D16 (Figure 4C). Furthermore, Bfa1-D16 conserved the SPOC activity in Δdyn1 Δbfa1 cells with the absence of Kin4 as well as in Δdyn1 Δbfa1 cells expressing Kin4 (Figure 4D,E). These data support that the SPOC activity of Bfa1-D16 is not regulated by Kin4. How does Bfa1-D16, which is not regulated by Kin4, conserve SPOC activity? The SPB component Spc72 is a platform for Bfa1 phosphorylation by Cdc5 and Kin4 [16,26]. Kin4 phosphorylates Bfa1 to block its inhibitory phosphorylation by Cdc5. Gryaznova et al. [26] demonstrated that Δspc72 cells retain SPOC activity, despite the inability of Kin4 to phosphorylate Bfa1; the inhibitory phosphorylation of Bfa1 by Cdc5 is diminished in Δspc72 cells. Our previous results showed that the GAP-defective mutant BFA1W422A exhibits SPOC activity in cells with misoriented spindles [20]. BFA1W422A lacks Cdc5 phosphorylation and delays mitotic exit during the unperturbed cell cycle [41]. Thus, the results of the present study and those of previous reports suggest that Bfa1-D16 might not be inhibited by Cdc5 and inhibit Tem1 outside of SPBs to conserve SPOC activity. It is possible that Bfa1 translocated from the SPB to the outside might delay the cell cycle by decreasing the MEN signal loading onto the SPB, or(and) by escaping inhibitory phosphorylation by Cdc5, or (and) by other unknown mechanisms.
Both BFA1-D16 and BFA1W422A mutants are GAP-deficient and arrest the cell cycle following their overexpression, though their endogenous levels resulted in different degrees of SPOC activity. Bfa1W422A showed a similar level of SPOC activity as wild-type Bfa1 [20], whereas Bfa1-D16 showed minor SPOC activity as shown in Figure 4. The difference between the two Bfa1 mutants is in their SPB localization. Bfa1W422A localizes to SPBs and binds Bub2, even though the mutant lacks GAP activity [20]. In this study, we found that Bfa1 interacted with Bim1 in the SPB by using BiFC assay, but this signal was not observed in BUB2-depleted cells (Figure S4). Moreover, asymmetric localization of Bfa1 (or Bub2) to SPBs affects the asymmetric loading of MAPs, such as Kip2, to bud-directed SPBs [39]. Thus, it is likely that Bfa1 localized at SPBs binds not only to Nud1 but also Spc72, thereby increasing the efficient sensing of SPOC signals. These data suggest that the Bfa1 N-terminus (Bfa1-D16) exerts SPOC activity but may not sense spindle misalignment because of a defect in SPB binding.
In this study, we observed hyper-elongated aMTs in Bfa1- and Bfa-D16-overexpressing wild-type or Δbub2 cells arrested in late mitosis (Figure 1 and Figure 2). The deletion of several MAPs did not suppress anaphase arrest in Bfa1-overexpressing cells (Figure S3). These data suggest that the cell cycle arrest induced by Bfa1 overexpression is not mediated by hyper-elongated aMTs. Moreover, we found that the hyper-elongated MTs were conserved in MEN-inhibited cells, suggesting that the hyper-elongated aMTs are correlated with the blocking of mitotic exit (Figure 5). We subsequently determined whether Bfa1 overexpression directly affects MAPs to induce hyper-elongated aMTs. Because Bfa1 interacts with the MT-binding protein Bim1 by BiFC assay (Figure S4B), we investigated whether Bfa1 overexpression affects interactions between Bim1–Kip2 and Bim1–Kar9 to cause hyper-elongated aMTs by affecting MT–cortex attachment. However, Bfa1 overexpression did not affect the Bim1–Kip2 and Bim1–Kar9 interactions (Figure S4F,G). When MEN is inhibited in cells, the release of its downstream regulator, Cdc14, from the nucleus is blocked, thereby sustaining high CDK activity. Thus, MEN inactivation or active CDKs might contribute to the regulation of MAPs that affect MT dynamics and accompany hyper-elongated MTs [38,42,43,44].
Supplementary Materials
The following supporting information can be downloaded at: https://www.mdpi.com/article/10.3390/cells11142179/s1: Figure S1: The summary of Bfa1 functional domains used in this study; Figure S2: Bfa1-D16 overexpression inhibits MEN signalling pathway to induce anaphase arrest; Figure S3: Bfa1 and Bfa1-D16 overexpression promote growth arrest in various MAP deletion mutants; Figure S4: Bfa1 interacts with Bim1 but does not interfere with Bim1 binding to Kar9 or Kip2; Figure S5: The nuclear position in Δbfa1 cells.
Author Contributions
Conceptualization, K.S. and Y.L; investigation, Y.L.; resources, K.S.; writing—original draft preparation, K.S. and Y.L. All authors have read and agreed to the published version of the manuscript.
Funding
This study was supported by the National Research Foundation (NRF; No. NRF2020R1A2C1102153 and NRF2017R1A2B4009785) funded by the Korean Government Ministry of Science and ICT (MSIT). Y.L. was partially supported by the Yonsei University Research Fund (Postdoc. Researcher Supporting Program) of 2021 (project No. 2021-12-0170).
Institutional Review Board Statement
Not applicable.
Informed Consent Statement
Not applicable.
Data Availability Statement
All data are included within the main text and the Supplementary Materials.
Acknowledgments
The authors appreciate D. Liakopoulos (Centre de Recherche de Biochimie Macromoléculaire, CRBM) for generously providing yeast strain YDL3007 dbf2-2 Δdbf20::TRP1 and plasmid pRS306-mCherry-TUB1.
Conflicts of Interest
The authors declare no conflict of interest.
References
- Beach, D.L.; Thibodeaux, J.; Maddox, P.; Yeh, E.; Bloom, K. The role of the proteins Kar9 and Myo2 in orienting the mitotic spindle of budding yeast. Curr. Biol. 2000, 10, 1497–1506. [Google Scholar] [CrossRef] [Green Version]
- Lee, L.; Tirnauer, J.S.; Li, J.; Schuyler, S.C.; Liu, J.Y.; Pellman, D. Positioning of the mitotic spindle by a cortical-microtubule capture mechanism. Science 2000, 287, 2260–2262. [Google Scholar] [CrossRef] [PubMed]
- Liakopoulos, D.; Kusch, J.; Grava, S.; Vogel, J.; Barral, Y. Asymmetric loading of Kar9 onto spindle poles and microtubules ensures proper spindle alignment. Cell 2003, 112, 561–574. [Google Scholar] [CrossRef] [Green Version]
- Carminati, J.L.; Stearns, T. Microtubules orient the mitotic spindle in yeast through dynein-dependent interactions with the cell cortex. J. Cell Biol. 1997, 138, 629–641. [Google Scholar] [CrossRef] [Green Version]
- Heil-Chapdelaine, R.A.; Oberle, J.R.; Cooper, J.A. The cortical protein Num1p is essential for dynein-dependent interactions of microtubules with the cortex. J. Cell Biol. 2000, 151, 1337–1343. [Google Scholar] [CrossRef]
- Mohl, D.A.; Huddleston, M.J.; Collingwood, T.S.; Annan, R.S.; Deshaies, R.J. Dbf2-Mob1 drives relocalization of protein phosphatase Cdc14 to the cytoplasm during exit from mitosis. J. Cell Biol. 2009, 184, 527–539. [Google Scholar] [CrossRef] [Green Version]
- Zhou, X.; Li, W.; Liu, Y.; Amon, A. Cross-compartment signal propagation in the mitotic exit network. Elife 2021, 10, e63645. [Google Scholar] [CrossRef]
- Campbell, I.W.; Zhou, X.X.; Amon, A. Spindle pole bodies function as signal amplifiers in the mitotic exit network. Mol. Biol. Cell 2020, 31, 906–916. [Google Scholar] [CrossRef]
- Bardin, A.J.; Visintin, R.; Amon, A. A mechanism for coupling exit from mitosis to partitioning of the nucleus. Cell 2000, 102, 21–31. [Google Scholar] [CrossRef] [Green Version]
- Rock, J.M.; Lim, D.; Stach, L.; Ogrodowicz, R.W.; Keck, J.M.; Jones, M.H.; Wong, C.C.; Yates, J.R., 3rd; Winey, M.; Smerdon, S.J.; et al. Activation of the yeast Hippo pathway by phosphorylation-dependent assembly of signaling complexes. Science 2013, 340, 871–875. [Google Scholar] [CrossRef]
- Mah, A.S.; Jang, J.; Deshaies, R.J. Protein kinase Cdc15 activates the Dbf2-Mob1 kinase complex. Proc. Natl. Acad. Sci. USA 2001, 98, 7325–7330. [Google Scholar] [CrossRef] [PubMed] [Green Version]
- Campbell, I.W.; Zhou, X.; Amon, A. The mitotic exit network integrates temporal and spatial signals by distributing regulation across multiple components. Elife 2019, 8, e41139. [Google Scholar] [CrossRef] [PubMed]
- Visintin, R.; Craig, K.; Hwang, E.S.; Prinz, S.; Tyers, M.; Amon, A. The phosphatase Cdc14 triggers mitotic exit by reversal of Cdk-dependent phosphorylation. Mol. Cell 1998, 2, 709–718. [Google Scholar] [CrossRef]
- Rock, J.M.; Amon, A. Cdc15 integrates Tem1 GTPase-mediated spatial signals with polo kinase-mediated temporal cues to activate mitotic exit. Genes Dev. 2011, 25, 1943–1954. [Google Scholar] [CrossRef] [Green Version]
- Valerio-Santiago, M.; Monje-Casas, F. Tem1 localization to the spindle pole bodies is essential for mitotic exit and impairs spindle checkpoint function. J. Cell Biol. 2011, 192, 599–614. [Google Scholar] [CrossRef] [Green Version]
- Maekawa, H.; Priest, C.; Lechner, J.; Pereira, G.; Schiebel, E. The yeast centrosome translates the positional information of the anaphase spindle into a cell cycle signal. J. Cell Biol. 2007, 179, 423–436. [Google Scholar] [CrossRef] [Green Version]
- Pereira, G.; Schiebel, E. Kin4 kinase delays mitotic exit in response to spindle alignment defects. Mol. Cell 2005, 19, 209–221. [Google Scholar] [CrossRef]
- D’Aquino, K.E.; Monje-Casas, F.; Paulson, J.; Reiser, V.; Charles, G.M.; Lai, L.; Shokat, K.M.; Amon, A. The protein kinase Kin4 inhibits exit from mitosis in response to spindle position defects. Mol. Cell 2005, 19, 223–234. [Google Scholar] [CrossRef]
- Geymonat, M.; Spanos, A.; Smith, S.J.; Wheatley, E.; Rittinger, K.; Johnston, L.H.; Sedgwick, S.G. Control of mitotic exit in budding yeast. In vitro regulation of Tem1 GTPase by Bub2 andBfa1. J. Biol. Chem. 2002, 277, 28439–28445. [Google Scholar] [CrossRef] [Green Version]
- Kim, J.; Jang, S.S.; Song, K. Different levels of Bfa1/Bub2 GAP activity are required to prevent mitotic exit of budding yeast depending on the type of perturbations. Mol. Biol. Cell 2008, 19, 4328–4340. [Google Scholar] [CrossRef]
- Ro, H.S.; Song, S.; Lee, K.S. Bfa1 can regulate Tem1 function independently of Bub2 in the mitotic exit network of Saccharomyces cerevisiae. Proc. Natl. Acad. Sci. USA 2002, 99, 5436–5441. [Google Scholar] [CrossRef] [PubMed] [Green Version]
- Kim, J.; Jeong, J.; Song, K.W. The C-terminus of Bfa1p in budding yeast is essential to induce mitotic arrest in response to diverse checkpoint-activating signals. Genes Cells 2004, 9, 399–418. [Google Scholar] [CrossRef] [PubMed]
- Bertazzi, D.T.; Kurtulmus, B.; Pereira, G. The cortical protein Lte1 promotes mitotic exit by inhibiting the spindle position checkpoint kinase Kin4. J. Cell Biol. 2011, 193, 1033–1048. [Google Scholar] [CrossRef] [PubMed] [Green Version]
- Geymonat, M.; Spanos, A.; Walker, P.A.; Johnston, L.H.; Sedgwick, S.G. In vitro regulation of budding yeast Bfa1/Bub2 GAP activity by Cdc5. J. Biol. Chem. 2003, 278, 14591–14594. [Google Scholar] [CrossRef] [Green Version]
- Caydasi, A.K.; Pereira, G. Spindle alignment regulates the dynamic association of checkpoint proteins with yeast spindle pole bodies. Dev. Cell 2009, 16, 146–156. [Google Scholar] [CrossRef] [Green Version]
- Gryaznova, Y.; Caydasi, A.K.; Malengo, G.; Sourjik, V.; Pereira, G. A FRET-based study reveals site-specific regulation of spindle position checkpoint proteins at yeast centrosomes. Elife 2016, 5, e14029. [Google Scholar] [CrossRef]
- Longtine, M.S.; McKenzie, A., 3rd; Demarini, D.J.; Shah, N.G.; Wach, A.; Brachat, A.; Philippsen, P.; Pringle, J.R. Additional modules for versatile and economical PCR-based gene deletion and modification in Saccharomyces cerevisiae. Yeast 1998, 14, 953–961. [Google Scholar] [CrossRef]
- Janke, C.; Magiera, M.M.; Rathfelder, N.; Taxis, C.; Reber, S.; Maekawa, H.; Moreno-Borchart, A.; Doenges, G.; Schwob, E.; Schiebel, E.; et al. A versatile toolbox for PCR-based tagging of yeast genes: New fluorescent proteins, more markers and promoter substitution cassettes. Yeast 2004, 21, 947–962. [Google Scholar] [CrossRef]
- Sung, M.K.; Huh, W.K. Bimolecular fluorescence complementation analysis system for in vivo detection of protein-protein interaction in Saccharomyces cerevisiae. Yeast 2007, 24, 767–775. [Google Scholar] [CrossRef]
- Sambrook, J.; Russell, D.W. Molecular Cloning: A Laboratory Manual, 3rd ed.; Cold Spring Harbor Laboratory Press: Long Island, NY, USA, 2001. [Google Scholar]
- Peng, T.; Thorn, K.; Schroeder, T.; Wang, L.; Theis, F.J.; Marr, C.; Navab, N. A BaSiC tool for background and shading correction of optical microscopy images. Nat. Commun. 2017, 8, 14836. [Google Scholar] [CrossRef]
- Konig, C.; Maekawa, H.; Schiebel, E. Mutual regulation of cyclin-dependent kinase and the mitotic exit network. J. Cell Biol. 2010, 188, 351–368. [Google Scholar] [CrossRef] [PubMed] [Green Version]
- Pereira, G.; Hofken, T.; Grindlay, J.; Manson, C.; Schiebel, E. The Bub2p spindle checkpoint links nuclear migration with mitotic exit. Mol. Cell 2000, 6, 1–10. [Google Scholar] [CrossRef]
- de Los Santos-Velazquez, A.I.; de Oya, I.G.; Manzano-Lopez, J.; Monje-Casas, F. Late rDNA condensation ensures timely Cdc14 release and coordination of mitotic exit signaling with nucleolar segregation. Curr. Biol. 2017, 27, 3248–3263. [Google Scholar] [CrossRef] [PubMed]
- Yeh, E.; Skibbens, R.V.; Cheng, J.W.; Salmon, E.D.; Bloom, K. Spindle dynamics and cell cycle regulation of dynein in the budding yeast, Saccharomyces cerevisiae. J. Cell Biol. 1995, 130, 687–700. [Google Scholar] [CrossRef] [Green Version]
- Scarfone, I.; Venturetti, M.; Hotz, M.; Lengefeld, J.; Barral, Y.; Piatti, S. Asymmetry of the budding yeast Tem1 GTPase at spindle poles is required for spindle positioning but not for mitotic exit. PLoS Genet. 2015, 11, e1004938. [Google Scholar] [CrossRef] [Green Version]
- Tong, A.H.; Lesage, G.; Bader, G.D.; Ding, H.; Xu, H.; Xin, X.; Young, J.; Berriz, G.F.; Brost, R.L.; Chang, M.; et al. Global mapping of the yeast genetic interaction network. Science 2004, 303, 808–813. [Google Scholar] [CrossRef] [Green Version]
- Drechsler, H.; Tan, A.N.; Liakopoulos, D. Yeast GSK-3 kinase regulates astral microtubule function through phosphorylation of the microtubule-stabilizing kinesin Kip2. J. Cell Sci. 2015, 128, 3910–3921. [Google Scholar]
- Chen, X.; Widmer, L.A.; Stangier, M.M.; Steinmetz, M.O.; Stelling, J.; Barral, Y. Remote control of microtubule plus-end dynamics and function from the minus-end. Elife 2019, 8, e48627. [Google Scholar] [CrossRef]
- Carvalho, P.; Gupta, M.L., Jr.; Hoyt, M.A.; Pellman, D. Cell cycle control of kinesin-mediated transport of Bik1 (CLIP-170) regulates microtubule stability and dynein activation. Dev. Cell 2004, 6, 815–829. [Google Scholar] [CrossRef] [Green Version]
- Kim, J.; Luo, G.; Bahk, Y.Y.; Song, K. Cdc5-dependent asymmetric localization of Bfa1 fine-tunes timely mitotic exit. PLoS Genet. 2012, 8, e1002450. [Google Scholar] [CrossRef] [Green Version]
- Khmelinskii, A.; Lawrence, C.; Roostalu, J.; Schiebel, E. Cdc14-regulated midzone assembly controls anaphase b. J. Cell Biol. 2007, 177, 981–993. [Google Scholar] [CrossRef] [PubMed]
- Hotz, M.; Leisner, C.; Chen, D.; Manatschal, C.; Wegleiter, T.; Ouellet, J.; Lindstrom, D.; Gottschling, D.E.; Vogel, J.; Barral, Y. Spindle pole bodies exploit the mitotic exit network in metaphase to drive their age-dependent segregation. Cell 2012, 148, 958–972. [Google Scholar] [CrossRef] [PubMed] [Green Version]
- Maekawa, H.; Usui, T.; Knop, M.; Schiebel, E. Yeast Cdk1 translocates to the plus end of cytoplasmic microtubules to regulate bud cortex interactions. EMBO J. 2003, 22, 438–449. [Google Scholar] [CrossRef] [PubMed] [Green Version]
Figure 1.
Bfa1 overexpression induces anaphase arrest along with hyper-elongated aMTs in Δbub2 as well as in wild-type cells. (A,B) Wild-type (YSK3278), Δbub2 (YSK3302), and Δbfa1 (YSK3279) strains whose chromosomes were integrated with GFP-TUB1 were transformed with pMW(L)20-pGAL-BFA1 and pMW(L)20-pGAL-BUB2, with pMW(L)20-pGAL used as vector control. (A) Cells were grown to mid-log phase, serially diluted 10-fold on both SC-L Glu (leucine-depleted SC medium with glucose) and SC-L Raf/Gal (leucine-depleted SC medium containing 2% raffinose and 2% galactose) plates, and further incubated at 30 °C. (B) Cells were incubated in SC-L Raf/Gal at 30 °C for 3 h to induce overexpression of Bfa1 or Bub2. GFP-Tub1 expression in these cells was observed, with images captured by an Axioplan2 fluorescence microscope with a 100× objective (Carl Zeiss). Scale bar, 5 μm. (C–F) The lengths of aMT and(or) the mitotic spindle were(was) detected in the indicated strain by Fiji ImageJ. The longest aMT per cell was measured. (C) The length of aMT per cell is presented as a single plot in the graph. The number of cells (n = 9, 57, 21, 69, and 4 for each indicated genotype) is shown in the graph. (D) The aMT and spindle length per cell are indicated as one dot in Bfa1-overexpressed WT and Δbub2. (E) The percentage (%) of cells containing aMT length > 3 μm in (D) was counted. The data are presented as means ± standard deviation (SD) of three independent experiments. (F) The longest aMT per cell of (D) is presented. (D–F) A Total of 245 cells for WT and 217 cells for Δbub2 were analyzed by three independent experiments. (C,F) **** p < 0.0001 indicates statistically significant, and ns, not significant.

Figure 2.
The N-terminal domain of Bfa1 (Bfa1-D16), which lacks SPB localization, induces anaphase arrest along with hyper-elongated aMTs in a BUB2-independent manner. (A,B) pMW(L)20-pGAL-BFA1, pMW(L)20-pGAL-BFA1-D16, and pMW(L)20-pGAL-BFA1-D8 plasmids were used to transform the Δbub2 strain (YSK3302) and Δbfa1 strain (YSK3279), whose chromosomes were integrated with GFP-TUB1. (A) Serial dilutions of mid-log phase cells with the indicated plasmid were spotted on both SC-L Glu and SC-L Raf/Gal plates and incubated at 30 °C. The Δbub2 and Δbfa1 strains transformed with pMW(L)20-pGAL were used as vector control. (B) GFP-Tub1 was observed in Δbub2 cells transformed with the indicated plasmid following incubation at 30 °C for 3 h in SC-L Raf/Gal medium. Images were captured using an Axioplan2 fluorescence microscope with a 100× objective (Carl Zeiss). Scale bar, 5 μm. (C–E) The length of aMT and(or) the anaphase spindle in the indicated strain were(was) detected by Fiji ImageJ. The cells of Δbub2 pGAL-BFA1 (n = 82), Δbub2 pGAL-BFA1-D16 (n = 82), and Δbub2 pGAL-BFA1-D8 (n = 8) were determined. The longest aMT per cell was measured as aMT length. (C) Quantification of aMT length in the indicated strain. Each plot in the graph presents the length of the longest aMT per cell. (D) The aMT and spindle lengths per cell were indicated as a single plot in the graph. (E) The percentage (%) of cells carrying an aMT length > 3 μm in (D) was counted. (F) Localization of GFP-Bfa1 and GFP-Bfa1-D16 in Δbfa1 cells, respectively. Δbfa1 cells integrated with pRS304-mCherry-Tub1 (YSK2874) and transformed with pMW(U)20-pGAL-GFP-BFA1 or pMW(U)20-pGAL-GFP-BFA1-D16 were grown to mid-log phase and incubated with SC-U medium (uracil-depleted SC) containing 2% galactose to induce the expression of Bfa1 or Bfa1-D16 at 25 °C for 3 h. Images were captured with an LSM 880 confocal microscope with a 100× objective (Carl Zeiss). Scale bar, 5 μm. (G) GFP signal was quantified by measuring the mean intensity of a segmented region (outside of SPBs) of a fixed area (2.37 μm2) per cell by Fiji ImageJ after background correction using the BaSiC plugin. A total number of 55 cells for each genotype are shown in the graph. (C,G) **** p <0.0001 indicates statistically significant, and ns, no significance.

Figure 3.
Bfa1-D16 overexpression prevents recruitment of MEN components to SPBs at late anaphase independent of its GAP activity. (A) Mob1-GFP localization was monitored with mCherry-Tub1 in Bfa1- or Bfa1-D16-overexpressing Δbfa1 Δbub2 cells. The Δbfa1 Δbub2 strain, whose chromosome was integrated with pRS304-mCherry-Tub1 and contained GFP-tagged MOB1 in its C-terminus (YSK3448), was transformed with pMW(L)20-pGAL, pMW(L)20-pGAL-BFA1, and pMW(L)20-pGAL-BFA1-D16 plasmids. The cells were incubated with SC-L Raf/Gal at 25 °C for 3 h. Images were captured with an LSM 880 confocal microscope with a 100× objective (Carl Zeiss). Scale bar, 5 μm. (B,C) The Δbfa1 Δbub2 strain, with a chromosome containing GFP-tagged MOB1 in its C-terminus (YSK3424), was transformed with pMW(L)20-pGAL, pMW(L)20-pGAL-BFA1, pMW(L)20-pGAL-BFA1-D16, and pMW(L)20-pGAL-BFA1-D8 plasmids. The indicated cells were incubated with SC-L Raf/Gal at 25 °C for 3 h. (B) The percentage of cells with Mob1-GFP at SPBs in the pGAL-BFA1- and pGAL-BFA1-D16-expressing cells (n = 312, 412 for each genotype) was measured. The data were presented as means ± SD of three independent experiments. cdc14-1 cells (n = 387) were used as a positive control of its localization to SPBs. cdc14-1 (YSK1610) cells harboring GFP-tagged MOB1 in its C-terminus were grown at 25 °C and then transferred to 37 °C for 3 h before counting the cells of Mob1 at the SPB. Images were captured using an Axioplan2 fluorescence microscope with a 100× objective (Carl Zeiss). (C) Mob1-GFP at SPB was quantified by measuring the maximum intensity in a segmented region of the dot-like signal (colocalized with SPB) after background correction using the BaSiC plugin in Fiji imageJ. A single plot of the graph presents one signal intensity per cell, and 100 cells for each genotype were analyzed. (D–F) Tem1-RFP signal was monitored with GFP-Tub1 in cdc15-2 Δbfa1 cells expressing pGAL-BFA1 or pGAL-BFA1-D16. The cdc15-2 Δbfa1 strain, whose chromosome was integrated with GFP-TUB1 and contained RFP-tagged TEM1 in its C-terminus (YSK3451), was transformed with pMW(L)20-pGAL, pGAL-BFA1, and pGAL-BFA1-D16. Cells transformed with pMW(L)20-pGAL were used as controls of asymmetric localization of Tem1-RFP at SPBs during anaphase. (D) The images were captured using an Axioplan2 fluorescence microscope with a 100× objective (Carl Zeiss). Scale bar, 5 μm. (E) The percentage of cells with Tem1-RFP at the SPB in (D) is shown in the graph. Numbers of 177, 288, and 267 cells were counted for each genotype. (F) Tem1-RFP signal at SPB was quantified by measuring the maximum intensity in a segmented region where SPB was located after background correction of images by the BaSiC plugin in Fiji ImageJ. A total of 147 cells were counted for each genotype. (C,F) **** p < 0.0001 indicates a significant difference, and ns, no significant difference.

Figure 4.
Bfa1-D16 exhibits SPOC functions in a KIN4-independent manner. (A) The SPOC activity of Bfa1-D16 was monitored in Δdyn1 cells. Δdyn1 bar1 cells expressing wild-type BFA1 (YSK3356), BFA1-D16 (YSK3421, the C-terminal domain of BFA1 was replaced with 3HA epitope in the chromosomal BFA1 locus of Δdyn1 cells), and Δdyn1 Δbfa1 bar1 cells (YSK1133) were used. Cells were grown to mid-log phase, synchronized by α-factor at 30 °C for 2–3 h, and transferred to YPDA medium for incubation at 16 °C for 18 h. The anucleated and multinucleated cells were counted after staining with DAPI. The percentage of SPOC-deficient cells was calculated as the number of anucleated and multinucleated cells relative to the total number of cells. The cells of each genotype were counted in four independent experiments (n = 1138, 1046, and 1096 for each indicated genotype), and the results are presented as the mean ± SD of four independent experiments. (B) Δbfa1 cells integrated with BFA1-3HA or BFA1-D16-3HA into the chromosome (YSK3422, YSK3423) were transformed with pMW(U)20-pGAL and pMW(U)20-pGAL-KIN4, respectively. Cells grown to mid-log phase were serially diluted (10-fold), spotted on SC-U Glu and SC-U Raf/Gal plates, and incubated at 25℃. (C) The Δbfa1 Δbub2 cells (YSK1879) transformed with pMW(L)20-pGAL, pMW(L)20-pGAL-BFA1, pMW(L)20-pGAL-BFA1-D16, pMW(L)20-pGAL-BFA12A, and pMW(L)20-pGAL-BFA1-D162A were serially diluted (10-fold), spotted on SC-L and SC-L Raf/Gal plates, and incubated at 25 °C. (D,E) The SPOC of Bfa1-D16 domain in KIN4-deleted cells. pRS304-BFA1-3HA or pRS304-BFA1-D16-3HA were integrated into the chromosome of Δdyn1 Δbfa1 bar1 (YSK1133) and Δdyn1 Δbfa1 Δkin4 bar1 (YSK2115) cells, respectively. The indicated cells (YSK3356, YSK3444, YSK3445, YSK1133, YSK3446, YSK3447, YSK2115) were synchronized by α-factor at 30 °C for 2–3 h. The cells were washed and released into YPAD medium, and further incubated at 16 °C for 18 h. The anucleated and multinucleated cells were counted after DAPI staining. (D) The percentage of SPOC-deficient cells was calculated as the number of anucleated and multinucleated cells relative to the total number of cells. The cells of each genotype were counted in three independent experiments (n = 1204, 846, 1124, 1089, 983, 914, and 1098 cells for each indicated genotype). (E) The percentage of cells with normally aligned spindle, misaligned, or anucleated/multinucleated cells in total anaphase cells (n = 552, 462, 436, 513, 513, 472, 608 for each genotype) of (D) was plotted. (D,E) The results were presented as the mean ± SD of three independent experiments.

Figure 5.
Hyper-elongated aMTs are present in tem1-3, cdc15-2, and dbf2-2 Δdbf20 cells presenting a blocked mitotic exit. (A–D) The MT phenotypes in cells were visualized with GFP-Tub1. GFP-TUB1 was integrated into the chromosomes of tem1-3 (YSK556), cdc15-2 (YSK553), and dbf2-2 Δdbf20 (YSK3254) strains. Cells were grown to the mid-log phase at 25℃ and transferred to 37 °C for 3 h. Images were captured using an Axioplan2 fluorescence microscope with a 100× objective (Carl Zeiss). Scale bar, 5 μm. Cells of (A,B) were observed with YPAD medium and those of (C) were observed with SC medium. (D) The length of aMT in the indicated strain of (B) and (C) with anaphase spindles (spindle length > 3 μm) was detected by Fiji ImageJ, respectively. Cells of cdc15-2 (n = 22), dbf2-2 Δdbf20 (n = 26) were analyzed. The longest aMT per each cell was measured as aMT length. Each plot in the graph presents the length of the longest aMT per cell.


Table 1.
Yeast strains used in this study.
| Strains | Genotype | Source |
|---|---|---|
| W303 | MATa ade2-1 ura3-1 trp1-1 leu2-3,112 his3-11,15 can1-100 | S. Elledge |
| YSK3278 | W303a bar1 GFP-TUB1::URA3 (pAFS125) | This study |
| YSK3279 | W303a bar1 Δbfa1::KanMx6 GFP-TUB1::URA3 (pAFS125) | This study |
| YSK3302 | W303a bar1 Δbub2::KanMx6 -GFP-TUB1::URA3 (pAFS125) | This study |
| YSK556 | W303a tem1-3 GFP-TUB1::URA3 (pAFS125) | Laboratory stock |
| YSK553 | W303a cdc15-2 GFP-TUB1::URA3 (pAFs125) | Laboratory stock |
| YSK3322 | cdc15-2 GFP-TUB1::URA3 (pAFs125) Δkip2::KanMx6 | This study |
| YSK3254 | dbf2-2 Δdbf20::TRP1 GFP-TUB1::URA3 (pAFs125) | This study |
| YSK3283 | W303a bar1 KIP2-VC::TRP1 | This study |
| YSK3284 | W303a bar1 KIP2-VC::TRP1 BIK1-VN::HIS3 | This study |
| YSK3150 | W303a bar1 BFA1-VN::HIS3 | This study |
| YSK3304 | W303a bar1 BIM1-VC::TRP1 BFA1-VN::HIS3 | This study |
| YSK3359 | W303a bar1 BIM1-VC::TRP1 BFA1-VN::HIS3 SPC42-CFP-KAN | This study |
| YSK3360 | W303a bar1 BIM1-VC::TRP1 BFA1-VN::HIS3 pRS306-mCherry-TUB1 | This study |
| YSK3361 | W303a bar1 BIM1-VC::TRP1 BFA1-VN::HIS3 Δbub2::KAN | This study |
| YSK3268 | W303a bar1 Δbfa1::KanMx6 KAR9-9myc::hphNT1 | This study |
| YSK3269 | W303a bar1 Δbfa1::KanMx6 KAR9-9myc::hphNT1 BIM1-3HA::HIS5 | This study |
| YSK3243 | W303a bar1 Δbfa1::KanMx6 KIP2-9myc::hphNT1 | This study |
| YSK3244 | W303a bar1 Δbfa1:: KanMx6 KIP2-9myc-hphNT1 BIM1-3HA::HIS5 | This study |
| YSK3434 | W303a bar1 GFP-TUB1::URA3(pAFs125) Δkip2:: KanMx6 | This study |
| YSK368 | W303a bar1 | A.Amon |
| YSK3344 | W303a bar1 Δkar9::KanMx6 | This study |
| YSK3345 | W303a bar1 Δbim1::KanMx6 | This study |
| YSK3346 | W303a bar1 Δkar3::KanMx6 | This study |
| YSK3347 | W303a bar1 Δcik1::KanMx6 | This study |
| YSK3348 | W303a bar1 Δkip2::KanMx6 | This study |
| YSK3349 | W303a bar1 Δbik1::KanMx6 | This study |
| YSK1610 | cdc14-1 Δbfa1::hphNT1 MOB1-GFP::KAN | Laboratory stock |
| YSK3424 | W303a Δbfa1::HIS3 Δbub2::URA3 MOB1-GFP::KAN | This study |
| YSK3356 | W303a bar1 Δdyn1::LEU2 | This study |
| YSK3421 | W303a bar1 Δdyn1::LEU2 BFA1-D16-3HA::HIS3 | This study |
| YSK1133 | W303a bar1 Δbfa1::KanMx6 Δdyn1::LEU2 | Laboratory stock |
| YSK1879 | W303a Δbfa1::HIS3 Δbub2::KAN | Laboratory stock |
| YSK3270 | W303a bar1 Δbfa1::KanMx6 | This study |
| YSK3435 | BY4741 Δspc72::KanMx6 | Laboratory stock |
| YSK3422 | W303a bar1 Δbfa1::KanMx6 pRS304-BFA1-3HA | This study |
| YSK3423 | W303a bar1 Δ bfa1::KanMx6 pRS304-BFA1-D16-3HA | This study |
| YSK3444 | W303a bar1 Δbfa1::KanMx6 Δdyn1::LEU2 pRS304-BFA1-3HA | This study |
| YSK3445 | W303a bar1 Δbfa1::KanMx6 Δdyn1::LEU2 pRS304-BFA1-D16-3HA | This study |
| YSK2115 | W303a bar1 Δdyn1::LEU2 Δbfa1::KAN Δkin4::hphNT1 | Laboratory stock |
| YSK3446 | W303a bar1 Δdyn1::LEU2 Δbfa1::KAN Δkin4::hphNT1 pRS304-BFA1-3HA | This study |
| YSK3447 | W303a bar1 Δdyn1::LEU2 Δbfa1::KAN Δkin4::hphNT1 pRS304-BFA1-D16-3HA | This study |
| YSK3451 | W303a cdc15-2 Δbfa1::HIS5 TEM1-RFP::KAN GFP-TUB1::URA3 (pAFs125) | This study |
| YSK2874 | W303a bar1 Δbfa1::KAN pRS304-mCherry-TUB1 (pAK010-1) | Laboratory stock |
| YSK3448 | W303a Δbfa1::HIS3 Δbub2::URA3 MOB1-GFP::KAN pRS304-mCherry-TUB1 (pAK010-1) | This study |
Table 2.
Plasmids used in this study.
| Plasmid | Source |
|---|---|
| pMW(L)20- pGAL | Laboratory stock |
| pMW(L)20- pGAL -BFA1 | Laboratory stock |
| pMW(L)20- pGAL -BFA1-D16 | This study |
| pMW(L)20- pGAL -BFA1-D8 | This study |
| GFP-TUB1::URA3 (pAFs125) | Beth Lalonde |
| pMW(L)20- pGAL -BUB2 | This study |
| pMW(U)20-pGAL-GFP | Laboratory stock |
| pMW(U)20-pGAL-GFP-BFA1 | This study |
| pMW(U)20-pGAL-GFP-BFA1-D16 | This study |
| pMW(U)20-pGAL | Laboratory stock |
| pMW(U)20-pGAL-KIN4 | This study |
| pMW(U)20-pGAL-SNU13 | This study |
| pMW(U)20-pGAL-GFP-SNU13 | This study |
| pRS304-BFA1-3HA | This study |
| pRS304-BFA1-D16-3HA | This study |
| pMW(L)20- pGAL -BFA12A | This study |
| pMW(L)20- pGAL -BFA1-D162A | This study |
| pRS306-mCherry-TUB1 | D. Liakopoulos |
| pRS304-mCherry-TUB1 | E. Schiebel |
Table 3.
Primers and enzymes used for plasmid constructions.
| Constructs | Primername | Sequence | Restriction Site |
|---|---|---|---|
| pMW(L)20-pGAL-BFA1-D8 | KS1782 (Forward) | GCAGAGCTCATGAAGCAAAAATATTCTGAT | Sac I |
| KS1783 (Reverse) | CCATGGATCCGCTAAAGGGCTAATCTTTTG | BamH I | |
| pMW(L)20-pGAL-BFA1-D16 | KS1784 (Forward) | TTGAGCTCATGTCAATTAGGCCTCTCAC | Sac I |
| KS1785 (Reverse) | CGCGGATCCCTAAGCTTTCCTGTTTGCGGT | BamH I | |
| pMW(L)20- pGAL-BUB2 | KS1825 (Forward) | GCAGAGCTCATGACCTCAATTGAAGAT | Sac I |
| KS1826 (Reverse) | CGCGCATGCTTACGGTATATATATGTC | Sph I | |
| pMW(U)20-pGAL-SNU13 | KS2132 (Forward) | GATGAGCTCGGATGTCTGCCCCAAACCCAAA GGCT | Sac I |
| KS2133 (Reverse) | GTCGGATCCTTAAATTAATAAAGTTTCAATCTTG | BamH I | |
| pMW(U)20-pGAL-KIN4 | KS1970 (Forward) | GATGAGCTCGGATGGCTTCTGTACCTAAACG | Sac I |
| KS1971 (Reverse) | GTCGGATCCTCAAACCCTCATGCTCCTTC | BamH I | |
| pRS304-BFA1-3HA | KS1337 (Forward) | ACTGGTACCCGGAGCAAGAGATAGTCTGAG | Kpn I |
| KS2140 (Reverse) | CTCACTAGTTCAGCACTGAGCAGCGTAATCT | Spe I | |
| pRS304-BFA1-D16-3HA | KS1337 (Forward) | ACTGGTACCCGGAGCAAGAGATAGTCTGAG | Kpn I |
| KS2140 (Reverse) | CTCACTAGTTCAGCACTGAGCAGCGTAATCT | Spe I | |
| pMW(L)20-pGAL-BFA1S150A(or BFA1-D16 S150A) | KS1568 (Forward) | CCAAGGCTAAAGCAACCTAGAGCAATGATGGAATTGAAACCAAAA | NA |
| KS1569 (Reverse) | TTTTGGTTTCAATTCCATCATTGCTCTAGGTTGCTTTAGCCTTGG | NA | |
| pMW(L)20-pGAL-BFA1S180A(or BFA1-D16 S180A) | KS1570 (Forward) | AATTCTGTAAGATTTAAGAAAGCAATGCCTAACTTAGCTTTAGTT | NA |
| KS1571 (Reverse) | AACTAAAGCTAAGTTAGGCATTGCTTTCTTAAATCTTACAGAATT | NA |
Publisher’s Note: MDPI stays neutral with regard to jurisdictional claims in published maps and institutional affiliations. |
© 2022 by the authors. Licensee MDPI, Basel, Switzerland. This article is an open access article distributed under the terms and conditions of the Creative Commons Attribution (CC BY) license (https://creativecommons.org/licenses/by/4.0/).
Share and Cite
MDPI and ACS Style
Li, Y.; Song, K. The N-Terminal Domain of Bfa1 Coordinates Mitotic Exit Independent of GAP Activity in Saccharomyces cerevisiae. Cells 2022, 11, 2179. https://doi.org/10.3390/cells11142179
AMA Style
Li Y, Song K. The N-Terminal Domain of Bfa1 Coordinates Mitotic Exit Independent of GAP Activity in Saccharomyces cerevisiae. Cells. 2022; 11(14):2179. https://doi.org/10.3390/cells11142179
Chicago/Turabian StyleLi, Yan, and Kiwon Song. 2022. "The N-Terminal Domain of Bfa1 Coordinates Mitotic Exit Independent of GAP Activity in Saccharomyces cerevisiae" Cells 11, no. 14: 2179. https://doi.org/10.3390/cells11142179
Note that from the first issue of 2016, this journal uses article numbers instead of page numbers. See further details here.