
Strategy Based on Two Stages for IR Thermographic Inspections of Photovoltaic Plants


Departamento de Ingeniería Eléctrica, Universidad de Cádiz, Avenida de la Universidad de Cádiz, 10, 11519 Puerto Real, Cádiz, Spain
*
Author to whom correspondence should be addressed.
Appl. Sci. 2022, 12(13), 6331; https://doi.org/10.3390/app12136331
Submission received: 8 June 2022
/
Revised: 16 June 2022
/
Accepted: 20 June 2022
/
Published: 22 June 2022
(This article belongs to the Section Energy Science and Technology)
Abstract
:Aerial infrared (IR) thermography has been implemented in recent years, proving to be a powerful and versatile technique for performing maintenance at photovoltaic (PV) plants. Its application speed and reliability using unmanned aerial vehicles (UAVs) or drones make it extremely interesting at large PV plants, due to the associated savings in time and costs. Ground-level thermographic inspection is slower and more costly to apply, although it does provide higher optical resolution, due to being conducted closer to the PV modules being inspected. Both techniques used in combination can improve the diagnosis. An IR thermography inspection strategy is proposed for PV plants based on two stages. The first stage of the inspection is aerial, enabling thermal faults to be detected and located quickly and reliably. The second stage of the inspection is done on the ground and applied only to the most relevant incidents revealed in the first stage. This inspection strategy was applied to a 100 kW PV plant, with an improved diagnosis verified via this procedure, as the ground-level inspection detects one-off thermal incidents from objects creating shade and from solar reflections. For PV modules with open circuits or open substrings, the use of one technique or another is immaterial.
1. Introduction
The photovoltaic (PV) industry has experienced unprecedented growth in recent years as a consequence of the energy policies applied by many countries to drive the change to renewable energies and the decarbonisation of the economy. Despite the serious impact of the COVID-19 pandemic on the entire world, global accrued solar capacity had increased to 773.2 GW by 2020, representing a year-on-year increase of 22%, confirming the trend of recent years [1]. This growth in the PV sector has been particularly pronounced in the number of PV power plants and their installed capacity [2]. The PV plants constructed are increasingly larger and have increasingly larger installed power capacities. This situation requires specialised and efficient operation and maintenance (O&M) tasks, to ensure peak-performance operational continuity with the maximum energy use of systems to amortise the investments made [3,4].
Large PV power plants are normally monitored and have an alert system for continuous supervision of their operations. The measurement and recording of electrical and atmospheric variables enable the intervention of the maintenance service before incidents and faults appear in the modules [5]. The monitoring systems can report possible failures if the measured amount of energy differs from the expected values [6]. The monitoring system should be adapted to the size of the PV system and user requirements. The largest and most costly photovoltaic systems are generally equipped with more monitoring points and sensors with greater precision than smaller and more economical photovoltaic systems [7].
Conducting infrared (IR) thermographic inspections for PV plant maintenance is an effective and reliable maintenance technique for detecting and locating incidents that are thermal in nature [8,9]. IR imaging of PV modules permit the identification of early faults by non-contact surface temperature measurements [10,11]. The procedures for IR inspections of PV systems are well established in guides and technical specifications [12,13]. The growth in size of PV plants makes manual or ground-level thermographic inspections complex, due to the large areas and time involved in doing them. Further, the manual inspection can turn out to be extremely difficult in plants with trackers or modules with very slight tilt angles due to the height required. The use of unmanned aerial vehicles (UAVs) or drones to conduct these inspections can be done at great speed and reliability, making them a perfect tool for large plants [14,15]. Reducing inspection times entails a significant advantage for costs associated with PV plant operation and maintenance.
Different studies have been executed in recent years to evaluate the potential of aerial IR thermography for inspecting photovoltaic systems. A comprehensive bibliographical review of different issues of aerial IR imaging is done in [16], where the authors conclude that this inspection technique for photovoltaic systems is still in its development phase. The evolution and technological development attained in the sensors and electronic instrumentation employed in aerial thermography has increased the possibilities of this technique [17]. The influence of image resolution on detecting faults in PV modules is studied in [18], with the results for different inspection heights compared. One study [19] on PV modules with hotspots compares thermographic results at the back and at different heights via aerial thermography. A general trend was observed of lower temperature measurements as the flight height increased.
Automated planning of flight routes and fault detection in defective PV modules was studied in [20], proposing an automated algorithm for drone flight routes that eliminates the need to manually control the drones. The evaluation of faults by IR thermography-based orthomosaics is studied in [21,22], facilitating the location of faults. However, long flight times are required to create compound images and there is some spatial distortion. By evaluating three 9.4 MWp PV plants, [23] studies the relationship between the power generated and the faults found with aerial IR thermography, to perform a quantitative estimate of the energy produced. In the reference [24] the authors provide a review of methods reported in the literature to automate different tasks of airborne infrared thermography for the inspection of photovoltaic systems. Studies related to digital image processing, classification and deep learning techniques are reviewed.
However, this significant advantage of aerial IR thermography in application time can lead to specific faults going unnoticed, being misinterpreted or not being assessed correctly. For example, with aerial IR thermography, it is possible that the appearance of an intermediate object—such as vegetation or a perimeter fence post—could hide the thermal fault produced. Another situation is that a one-off thermal anomaly smaller than the PV cell could be detected at a distance with an insufficient resolution, causing a temperature value to be taken that is lower than the real temperature. It is also possible that sunlight reflecting on the surface of the PV modules could be interpreted as a non-factual or unreal thermal incident.
Two-stage thermographic inspection methods have been applied in other areas. In [25] the authors compare aerial thermography and ground-based thermography on the envelope of a traditional wine cellar. Working with UAVs gives great flexibility for the inspection, but the angle of view strongly must be taken into account to avoid disturbances due to specular reflections. In [26] a complete literature review of the use of UAVs in bridge monitoring is carried out and compared with other inspection techniques. The use of hand-held IR cameras allows the validation of results from aerial thermographic inspections.
Applying ground-level thermographic inspection for the PV plant as a whole can prevent the problems set out for aerial inspection. Nonetheless, the time required for inspection and subsequent analysis will increase considerably. The disadvantages posed can be minimised by employing a two-stage thermographic inspection strategy. The first stage is carried out as an aerial thermographic inspection while the second stage is carried out as a thermographic inspection on the ground. The first stage is done quickly to locate relevant incidents. The second stage of the inspection is applied to detect relevant incidents to improve the diagnosis.
2. Materials and Methods
2.1. Materials
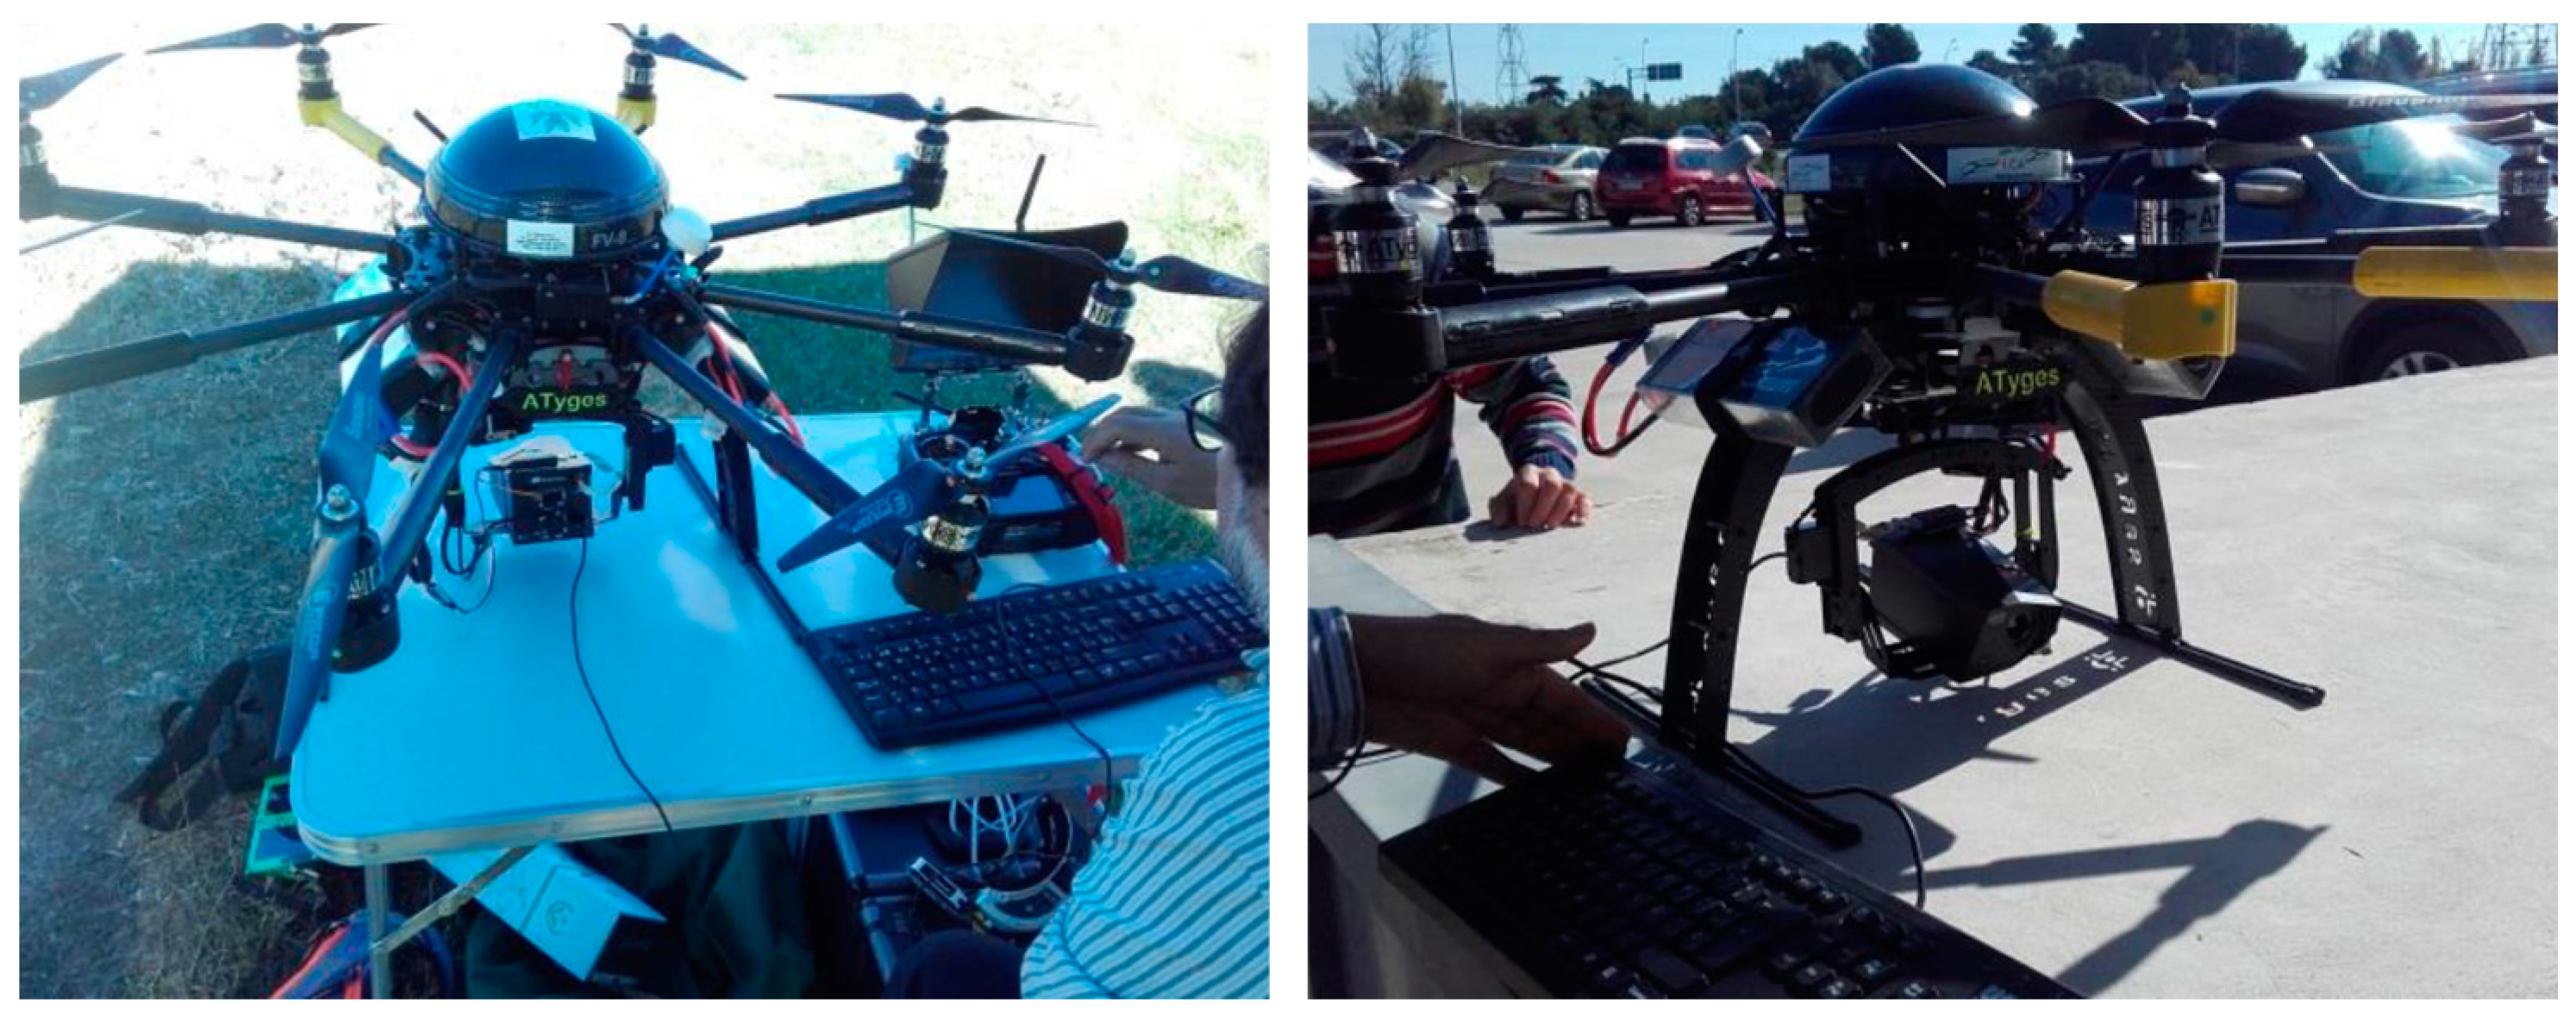
To apply the IR inspection strategy posed in this study, two different thermographic cameras will be used that are suitable for each of the two stages. Stage one of the inspection with aerial IR thermography employs a Workswell WIRIS 2nd-gen 336 camera installed on a drone [27] as shown in Figure 1. This camera with an uncooled microbolometer detector has a spectral range of 7.5–13.5 µm, a resolution of 336 × 256 pixels and weighs less than 400 g. This inspection entails an initial sweep to detect relevant incidents quickly. The drone used was an ATYGES FV8 octocopter. Flight plans were programmed and executed at heights of 15 m, flight speeds from 1 to 2 m/s and a thermographic recording interval of 2, 3 and 5 s. To calculate the maximum inspection height, the thermal imaging camera was equipped with a 45° FOV lens, with a 9 mm focal length and an IFOV of 1.889 mrad. The maximum spatial resolution is 3 cm per pixel, as required in specification IEC-62446-3 [12]. Therefore, IFOV × h (m) = pixel-side size (mm), resulting in a maximum length of 15 metres from the PV modules.
Stage two of the inspection is done by ground-level IR thermography, but only for the most relevant faults. This second sweep was done with a ThermaCam S60 [28]. This camera, equipped with an uncooled microbolometer detector, has a spectral range of 7.5–13 µm, a resolution of 320 × 240 pixels and a weight of 2 kg. The thermographic camera is positioned facing the PV module at an angle that prevents the influence of solar reflection during the test.
2.2. Methods
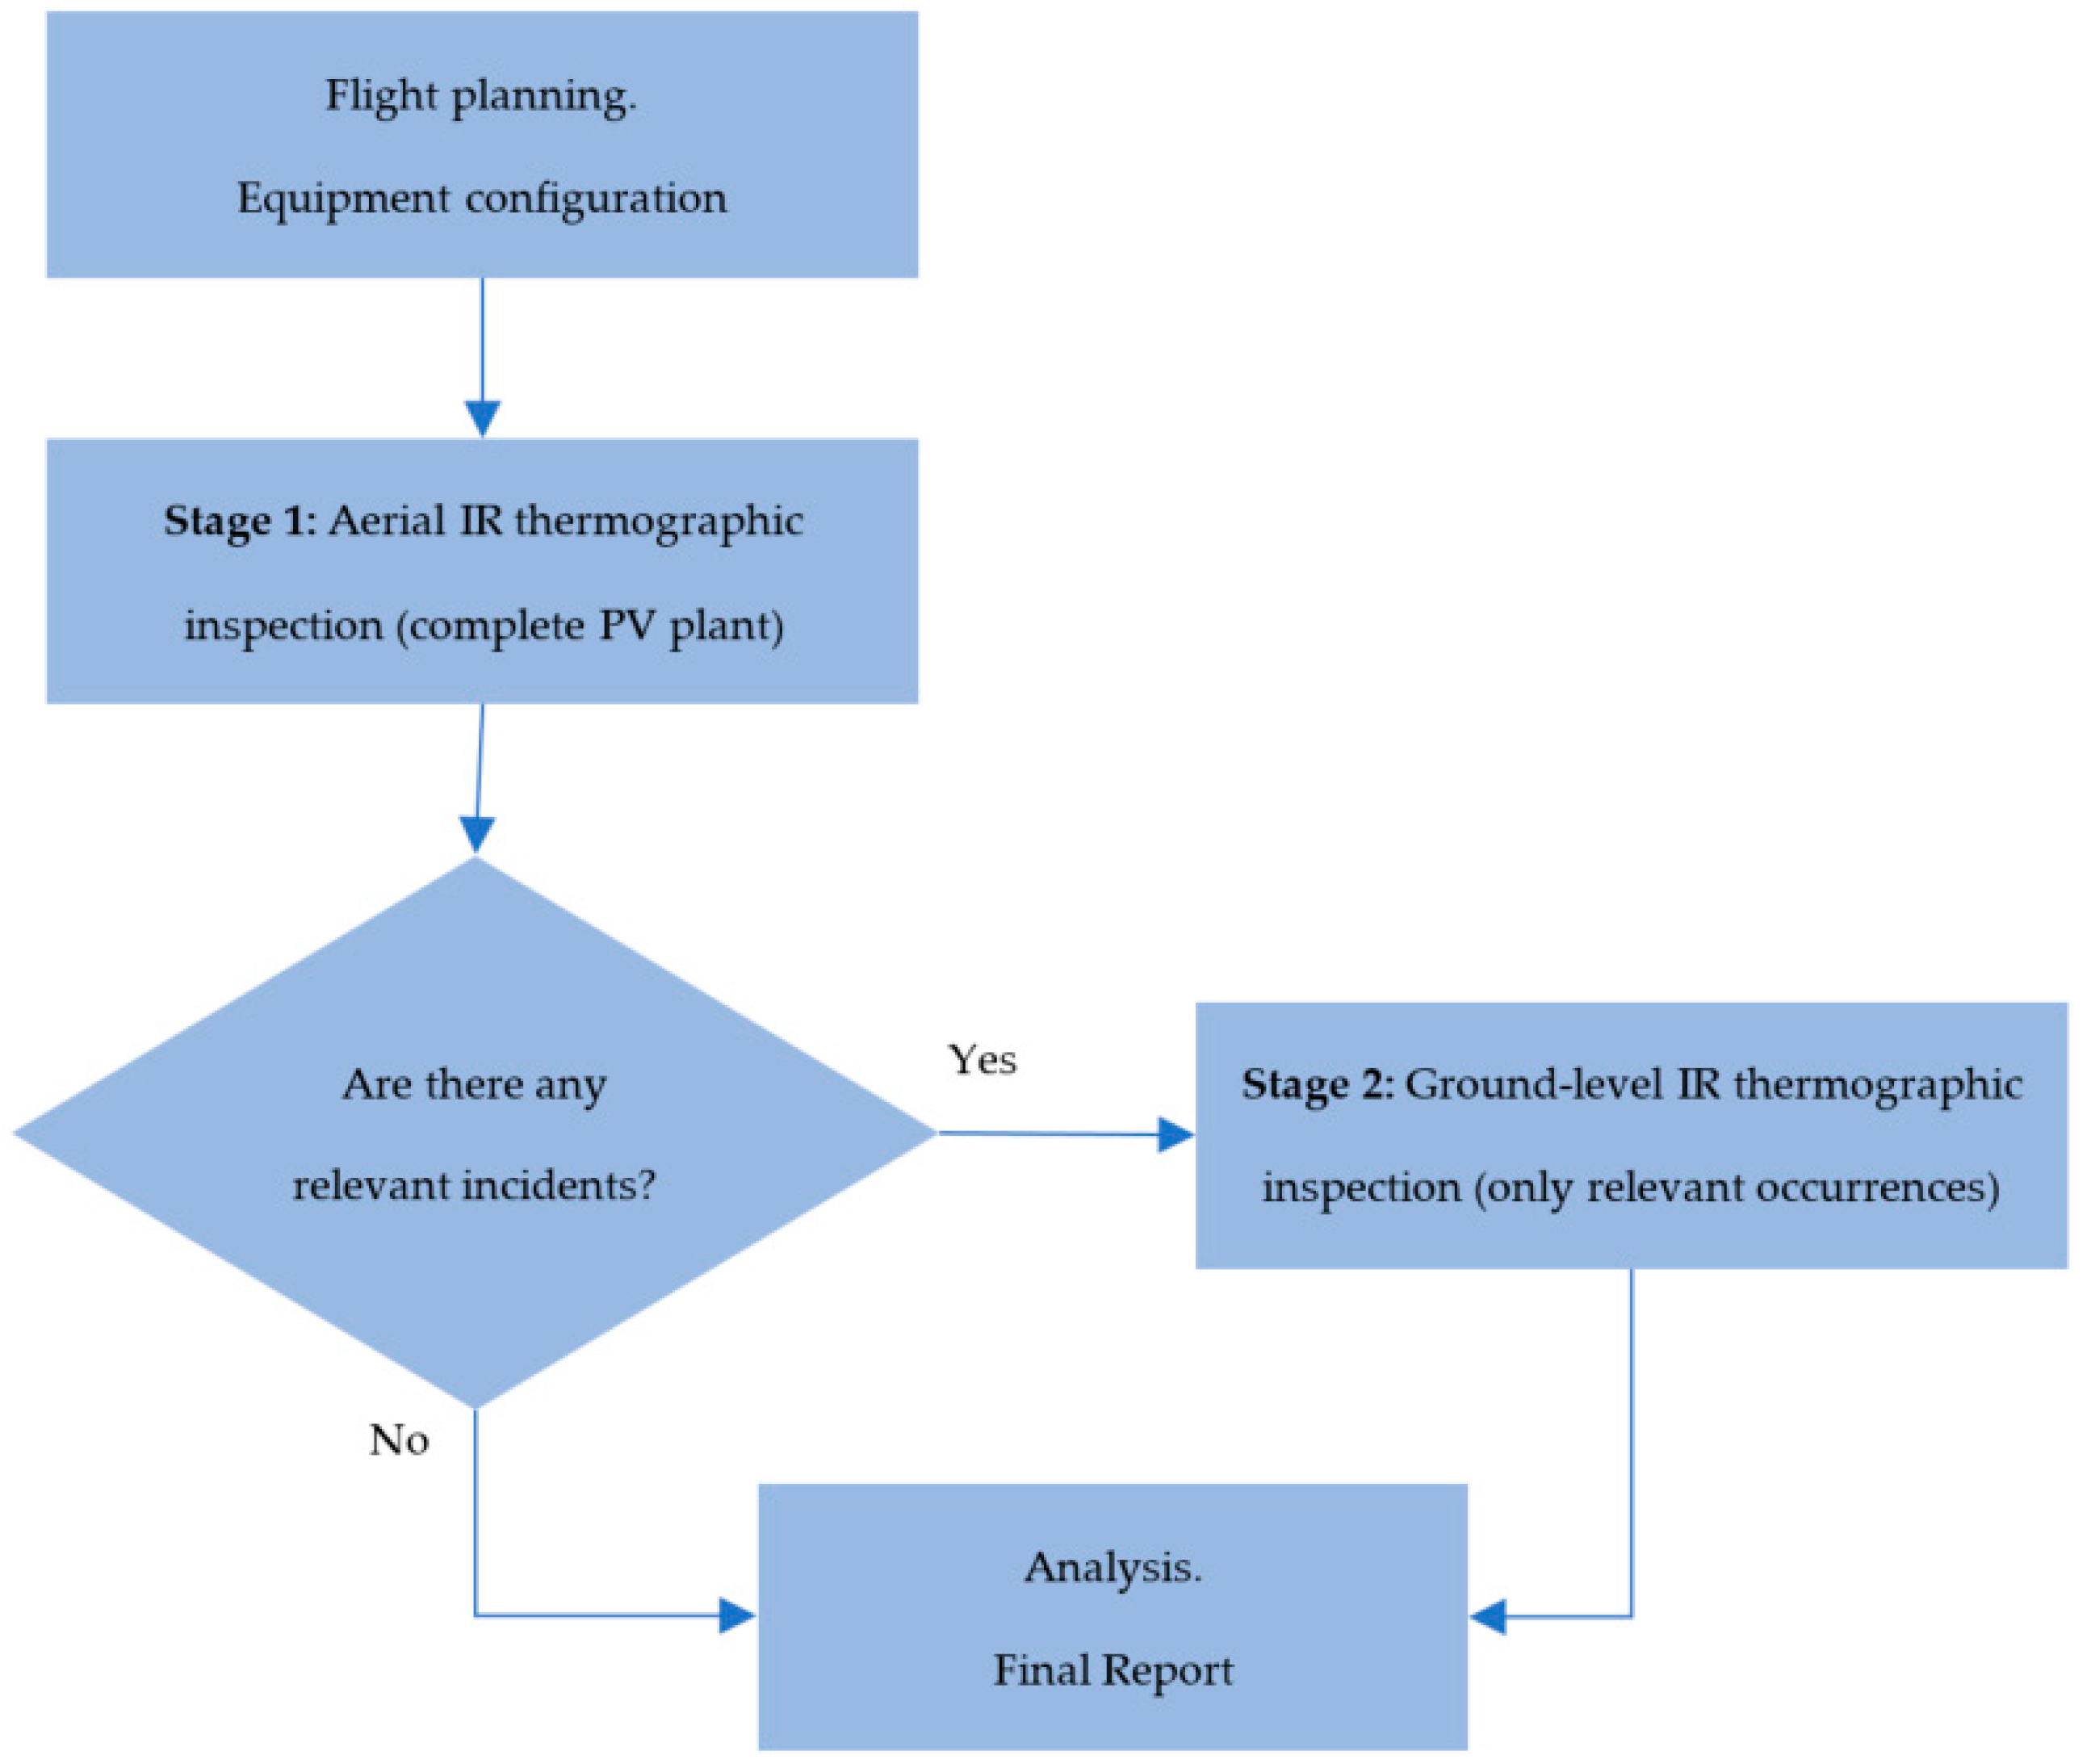
The proposed inspection process aims to make full use of the advantages of aerial IR thermography for speed, and ground-level IR thermography for its resolution and precision. This strategy is based on a mixed thermographic inspection done in two stages. Aerial IR thermographic inspection is done in the first stage, while ground-level IR thermographic inspection is done in the second stage, only for significant incidents detected by the aerial IR thermography. This second stage with greater detail will improve the previous diagnosis conducted in the first aerial inspection. This two-stage thermographic inspection strategy may be suitable for cases in which inadequate maintenance is done, either due to technical reasons or due to excessive time delays in doing it.
For proper IR thermographic inspections of photovoltaic plants, specific configuration and positioning issues for the thermography equipment must be kept in mind [29]. The surface emissivity of the modules and the reflected apparent temperature must be determined experimentally. Both parameters enable the configuration of the thermography equipment. The modules’ surface emissivity can be determined with the help of a contact sensor. Typical emissivity values are 0.85 for glass and 0.95 for the polymer on the back cover [13]. The reflected apparent temperature is required to offset the radiation reflected on the object from the sky. The reflected apparent temperature can be determined by a Lambertian radiator in a horizontal position in the shade so that it is directly exposed to the sky [14,30].
The positioning of the equipment for the inspection must also be borne in mind [29]. The ideal location so that the emissivity value can be considered constant is to inspect with an angle slightly greater than 0° from the perpendicular with the PV module surfaces, to prevent reflection, but without exceeding 40° as the upper limit for doing the inspection. Moreover, the ideal thermographic inspection angle will be that which minimises solar reflection and does not increase reflectivity. A suitable position may be when the thermographic camera is situated with the sun behind it at an inspection angle of less than 45°. Further, to minimise reflections from the sky, the inspection must be done at a specific height, while maintaining the required optical resolution. To obtain high-quality images, taking IR images with high solar radiation is recommended (>600 W/m2), as well as constant environmental conditions (no clouds, low wind speed and stable ambient temperature). Figure 2 shows the flow chart to be considered for the proposed two-step approach.
2.3. Case Study
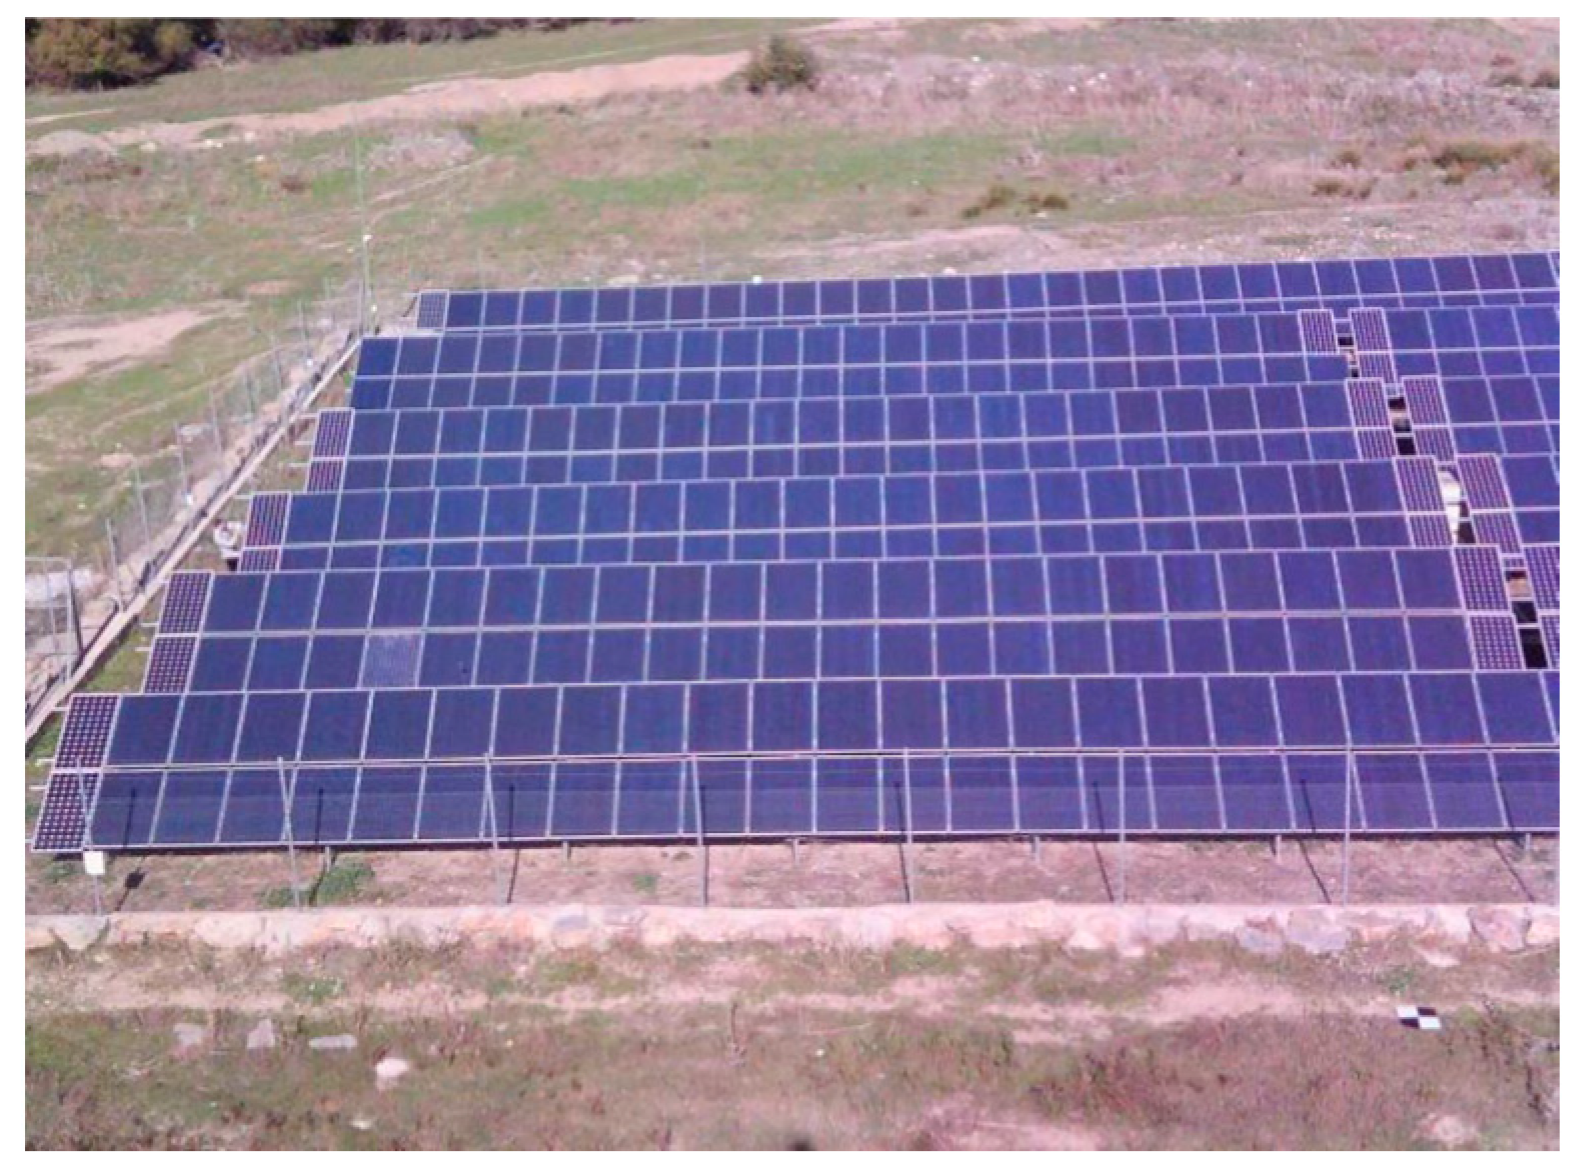
The proposed inspection process was applied to a real PV plant. The PV plant where the inspection was done has a nominal power of 100 kW and is located in southern Spain. It is south facing and its tilt angle from the horizontal is 32°. The solar panels are p-Si type, Scheuten model PS54, although after the initial commissioning other different PV modules were added with different technology of m-Si by LYNX Industries model LYNX175M36. The m-Si solar panels were installed later due to thefts at the power station. The use of PV modules with different technologies leads to different electrical characteristics and thus a technical decision that restricts the energy yields at the PV plant. Figure 3 shows that they are mainly located at the ends of the strings.
Environmental parameters (irradiance, ambient temperature and wind speed) are obtained from the weather station located at the test site. The thermographic inspection is conducted with irradiance conditions over the plane of the modules greater than 700 W/m2, low wind speeds (<1 m/s) and a lack of cloud cover (okta level 0), as specified in IEC 62446-3 [12]. With the aim of having a proper configuration to reduce measurement errors, the surface emissivity and reflected apparent temperature were determined by experiment as detailed in [29]. The front emissivity value determined was 0.88 and the value of the reflected temperature from the sky before and after finishing the test was −30 °C. The IR camera was also positioned at an angle slightly greater than 0° to prevent self-reflection and less than 40° from the perpendicular so that emissivity could be considered constant. To offset atmospheric transmission during the thermographic inspection, average atmospheric temperature, distance and humidity values were logged. These values will be used as configuration parameters by the software in the thermographic equipment as they are radiometric measurements.
3. Results
IR thermographic inspection was done by centring the thermographic log on a time interval starting at noon and ending at 1.30 p.m. In this time range, the sun’s position expressed by solar elevation/azimuth was at the start time: 30.18° N/−18.81° W; and at the end time: 32.42° N/−2.59° W. The results are presented by classifying them by the type of incidents or faults detected, showing aerial IR thermography and ground-level IR thermography. The analysis of results was done by considering this classification of standard incidents:
- Incidents with broken glass in PV module.
- Incidents involving partial shading.
- Incidents involving PV module technology.
- Incidents with open-circuit PV modules.
- Other incidents.
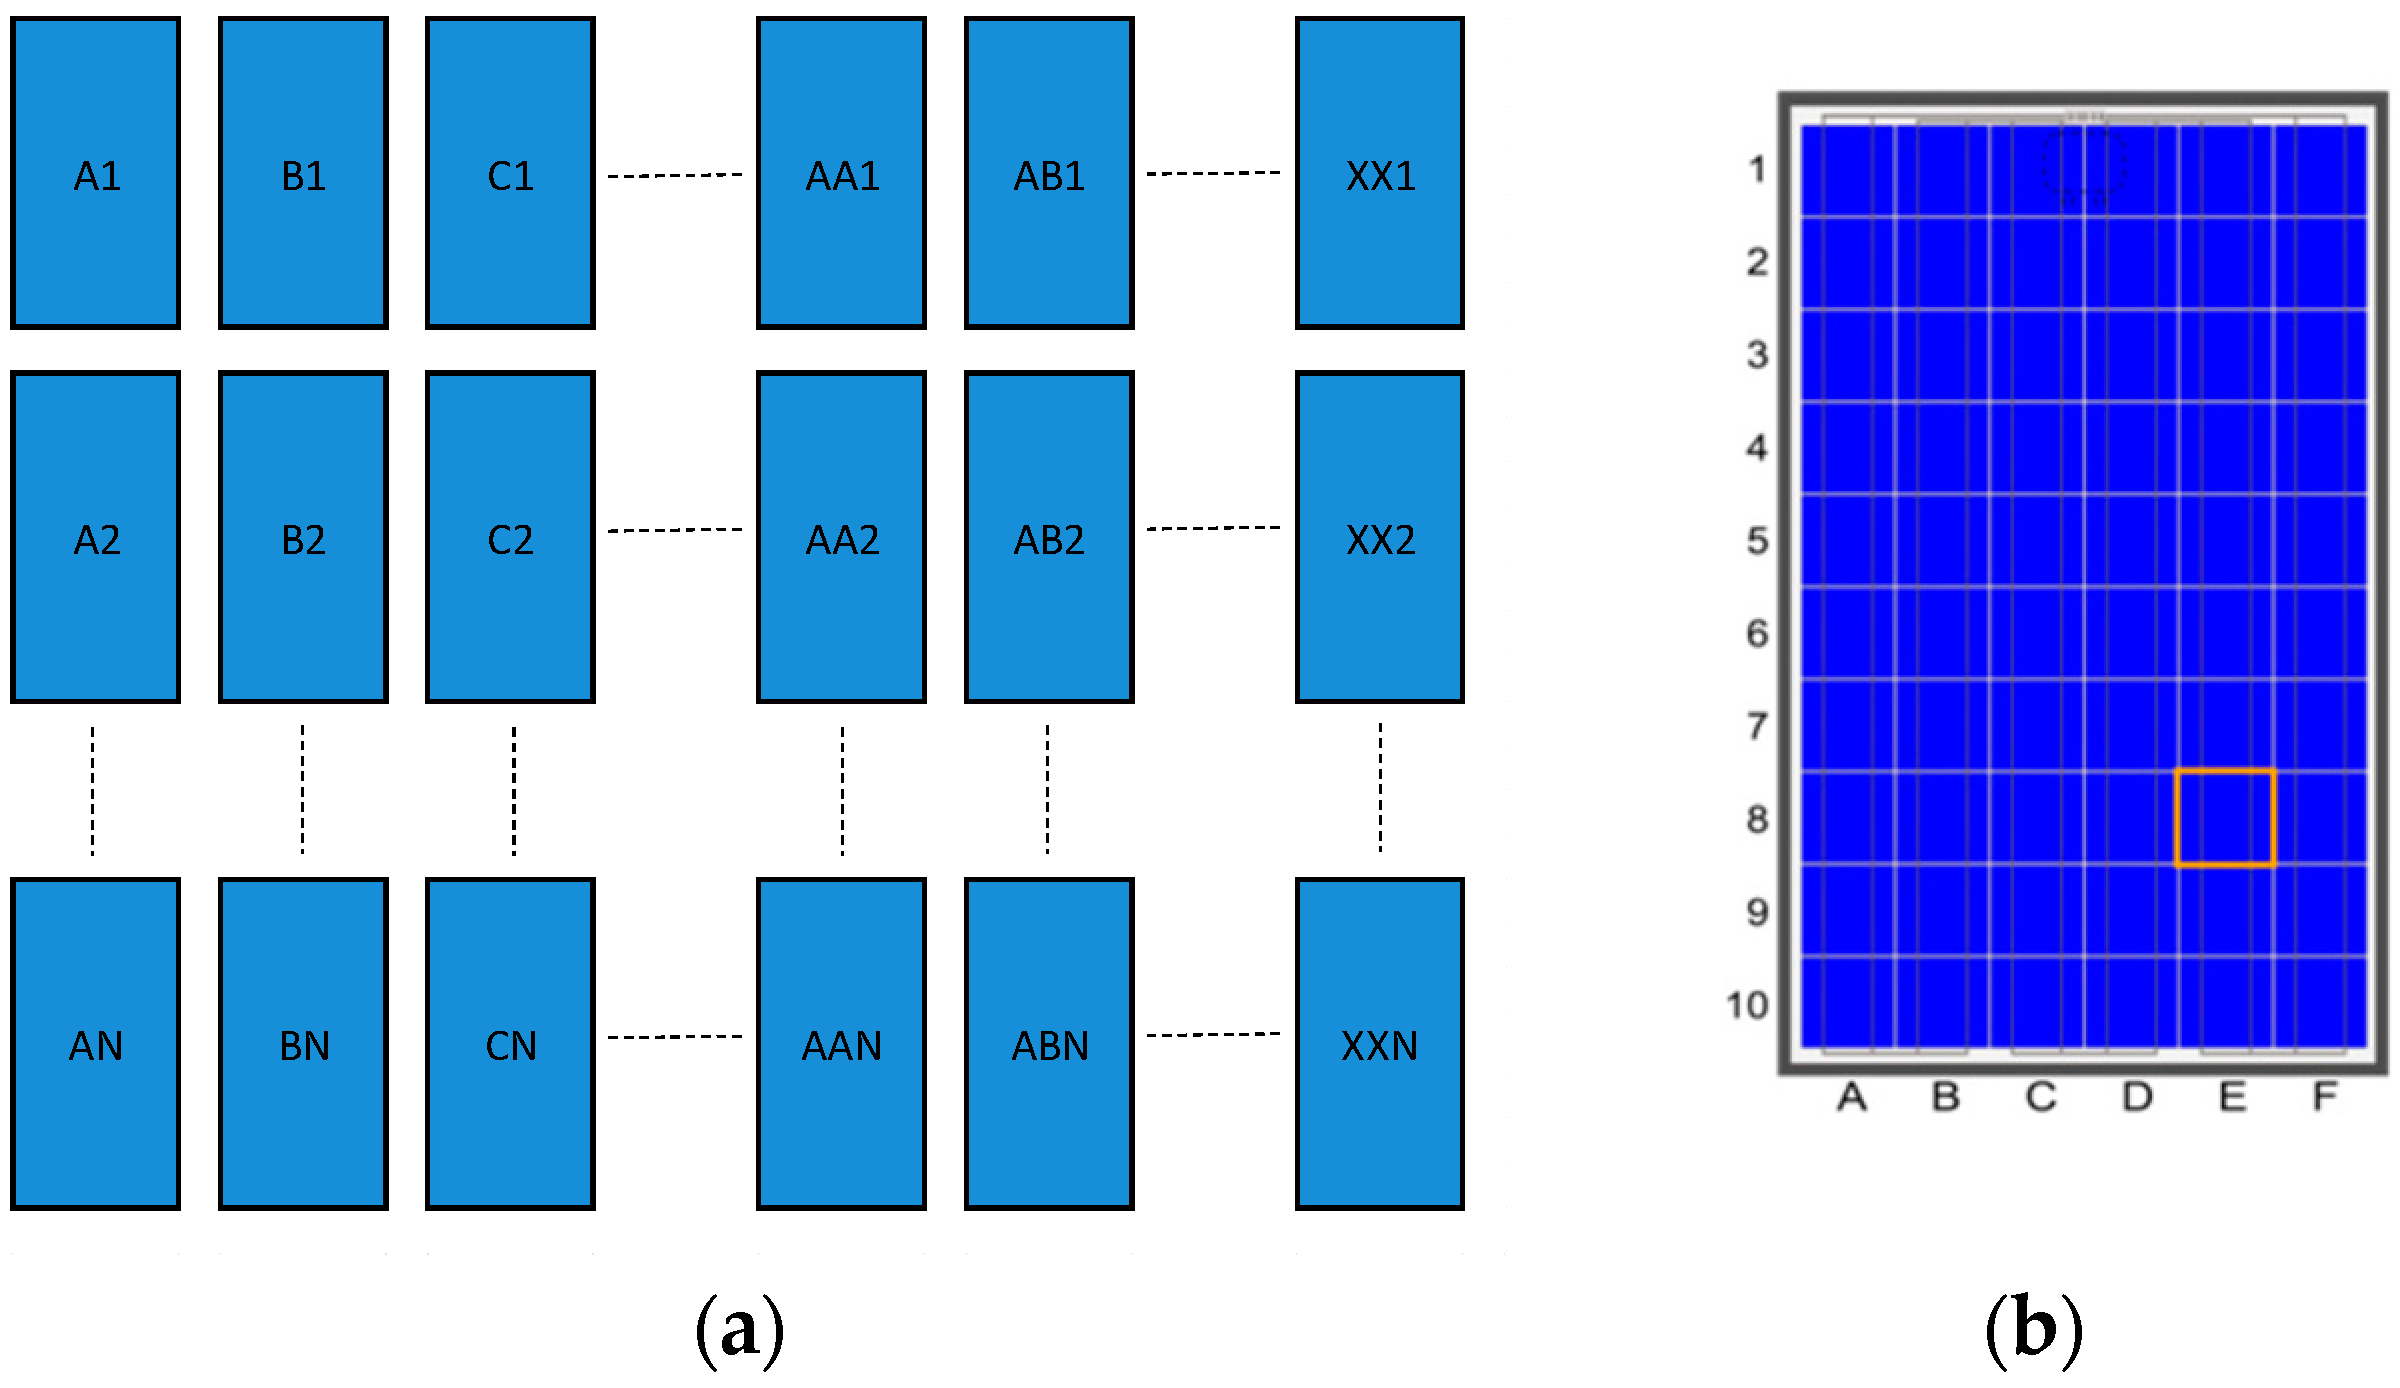
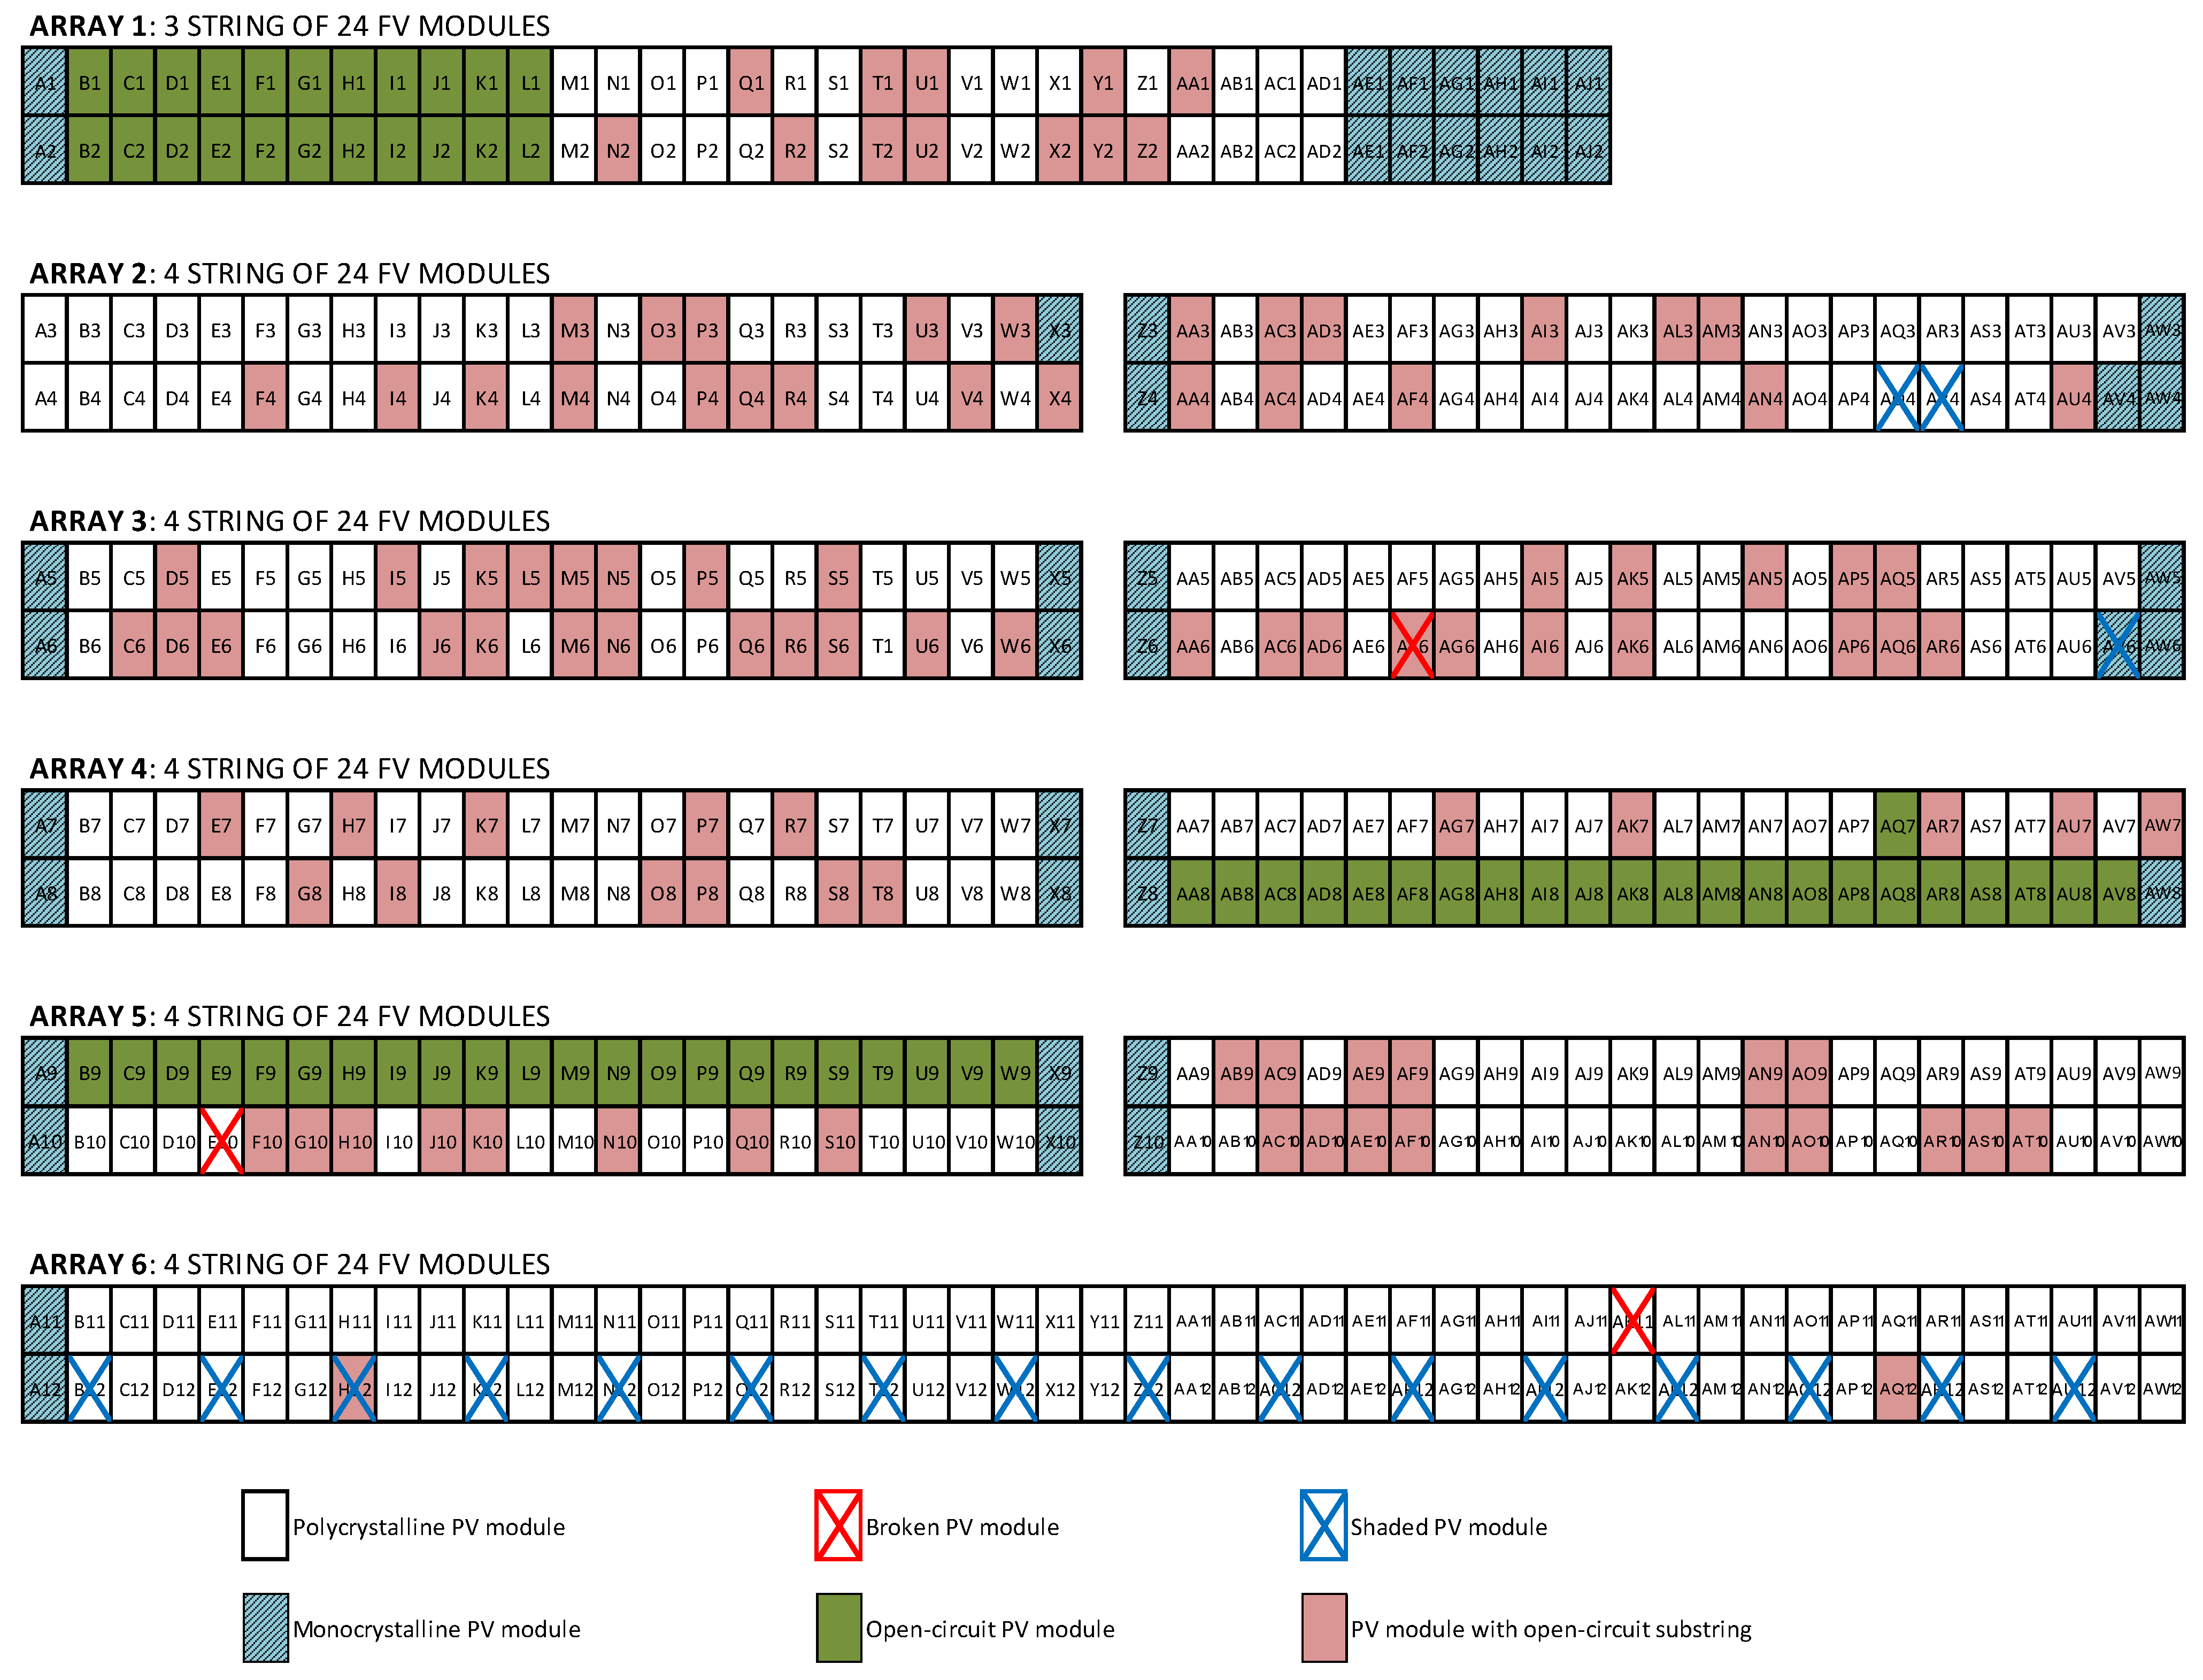
Bear in mind that the previous classification is not strict with regard to the incident type, given that in some thermographic IR images several types of incidents can be seen. The purpose of classification is to organise the information according to the most prominent incidents observed. Then, the results obtained are analysed and presented, considering an identification matrix for the PV modules at the plant where the incident occurred and the individual identification of each cell in each PV module as shown in Figure 4. The identification of the array number is shown in Figure 14.
- Incidents with broken glass in PV module
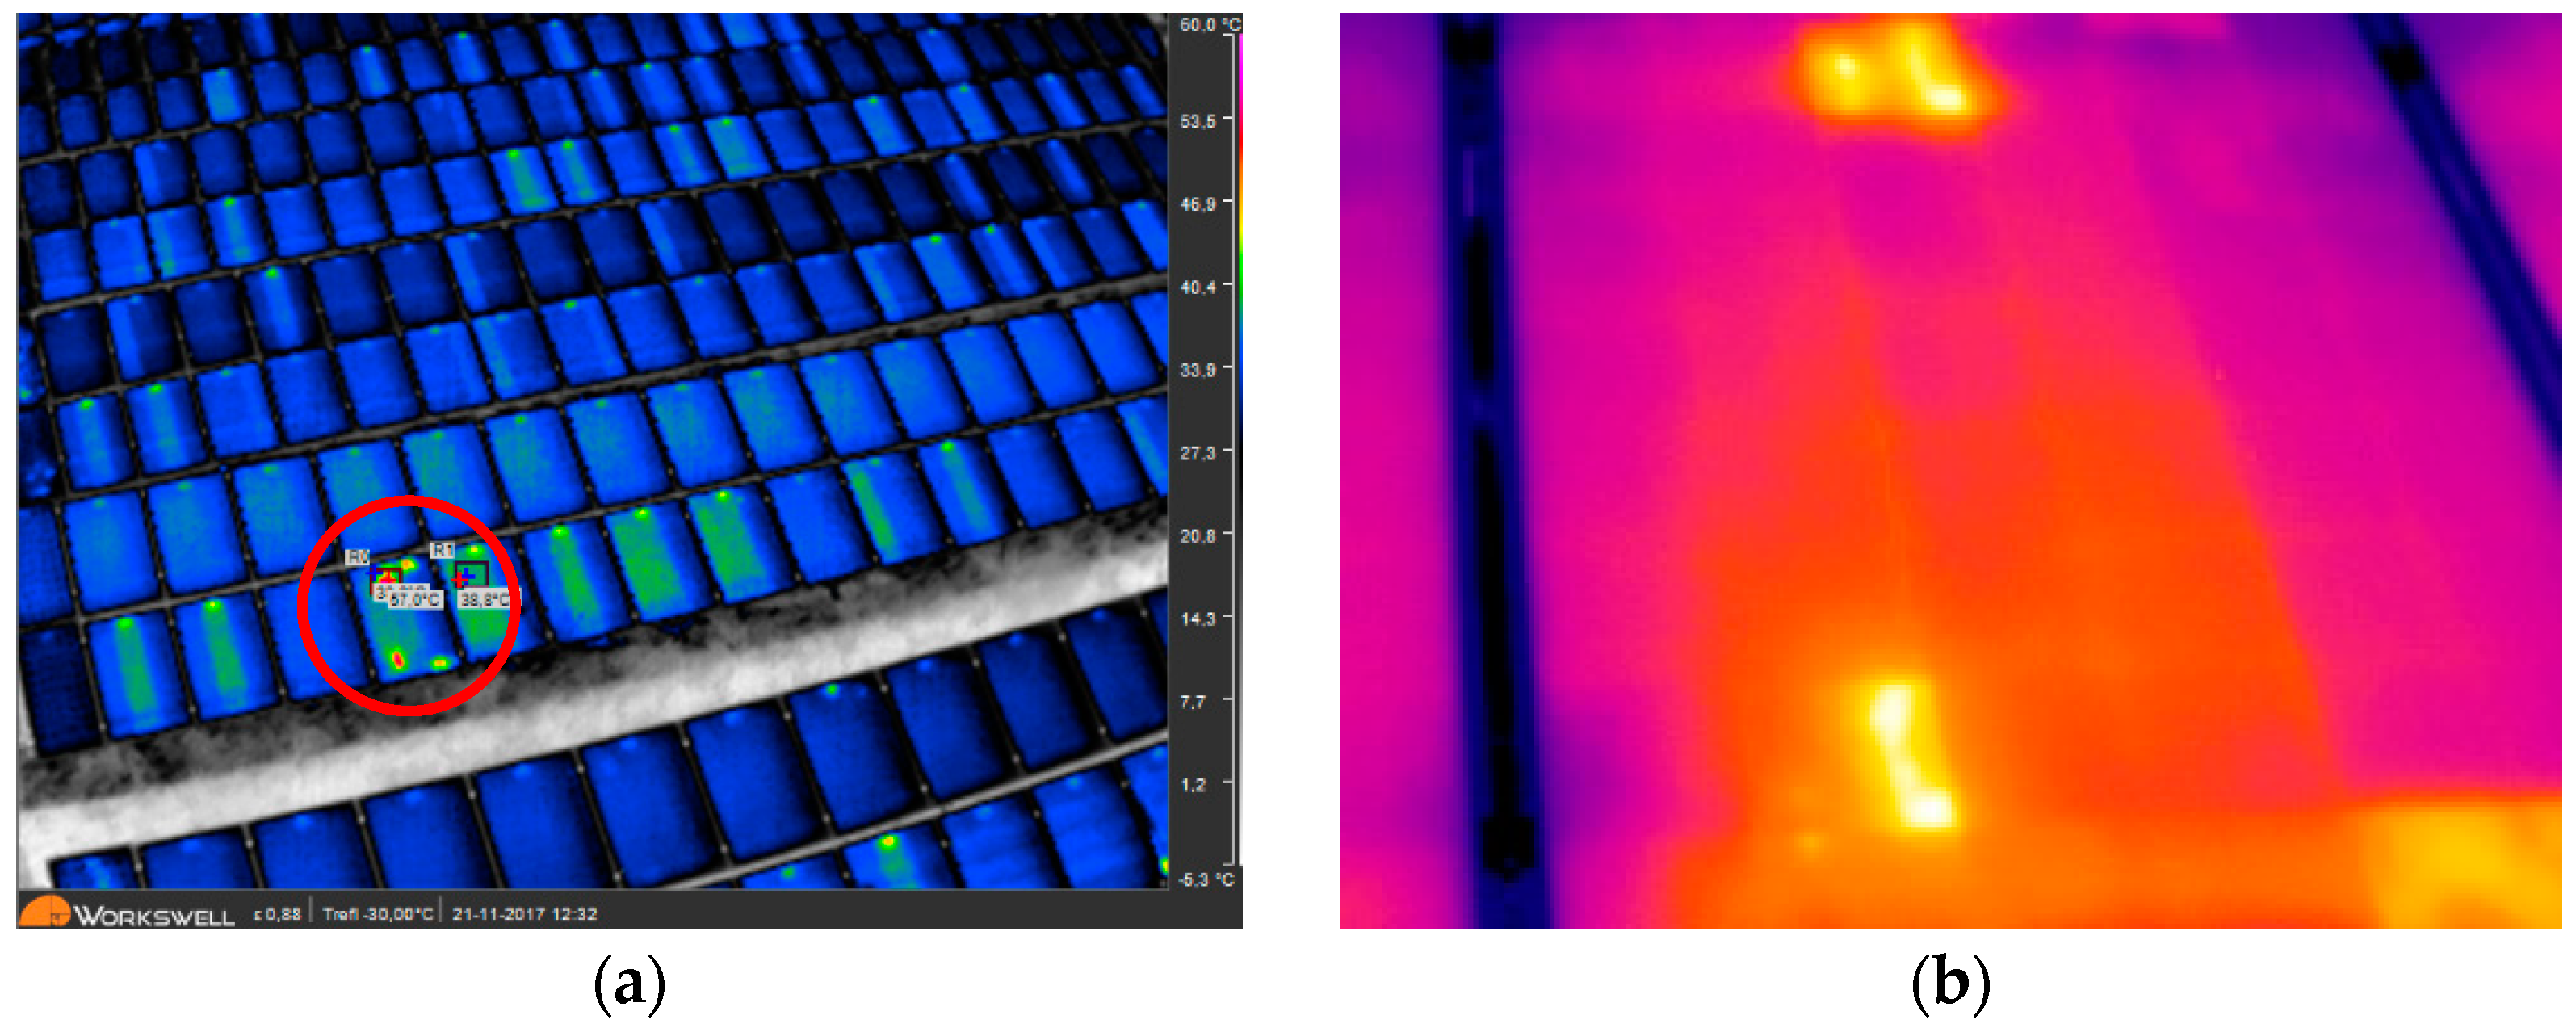
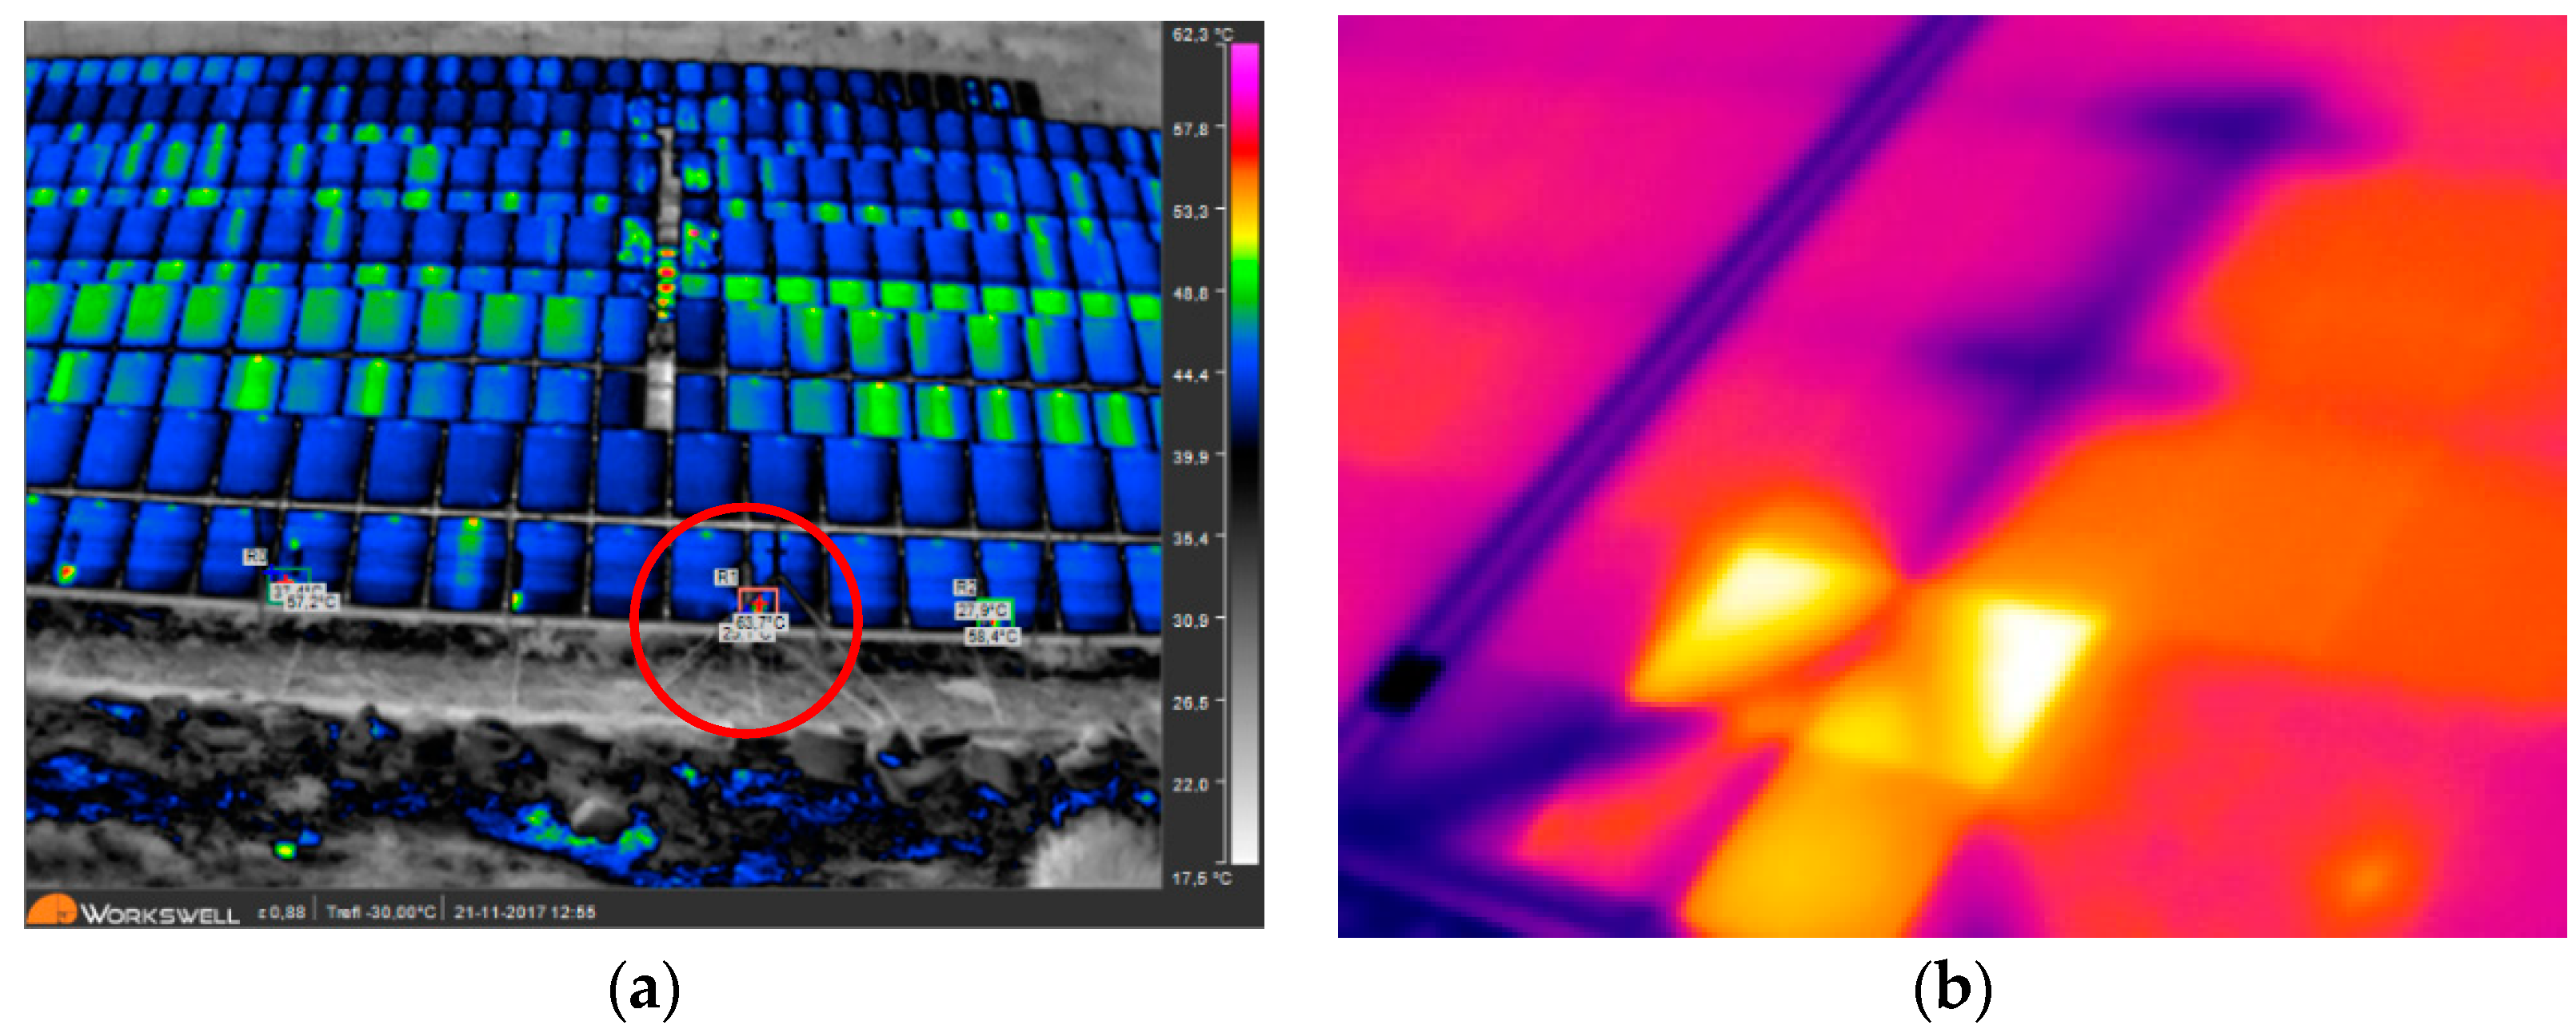
Figure 5a depicts the aerial thermographic analysis of the PV module with a broken front cover (array 5, position E10), which reaches a temperature of 57.0 °C. The temperature difference with respect to the adjacent PV module is around 19 °C. Figure 5b shows the ground-level thermographic analysis for the same module. In this case, the maximum temperature of the PV module at position E10 is 86.6 °C. This abnormality is one-time and is obtained in the cell indicated in the analysis chart. The average temperature of this cell is 63.7 °C. The difference in the results obtained for maximum values is nearly 30 °C between both thermographs. This difference is due to the fact that the abnormality is a one-off with a size smaller than the cell, and thus, the aerial inspection distance provides a spatial resolution that is insufficient for this type of fault.
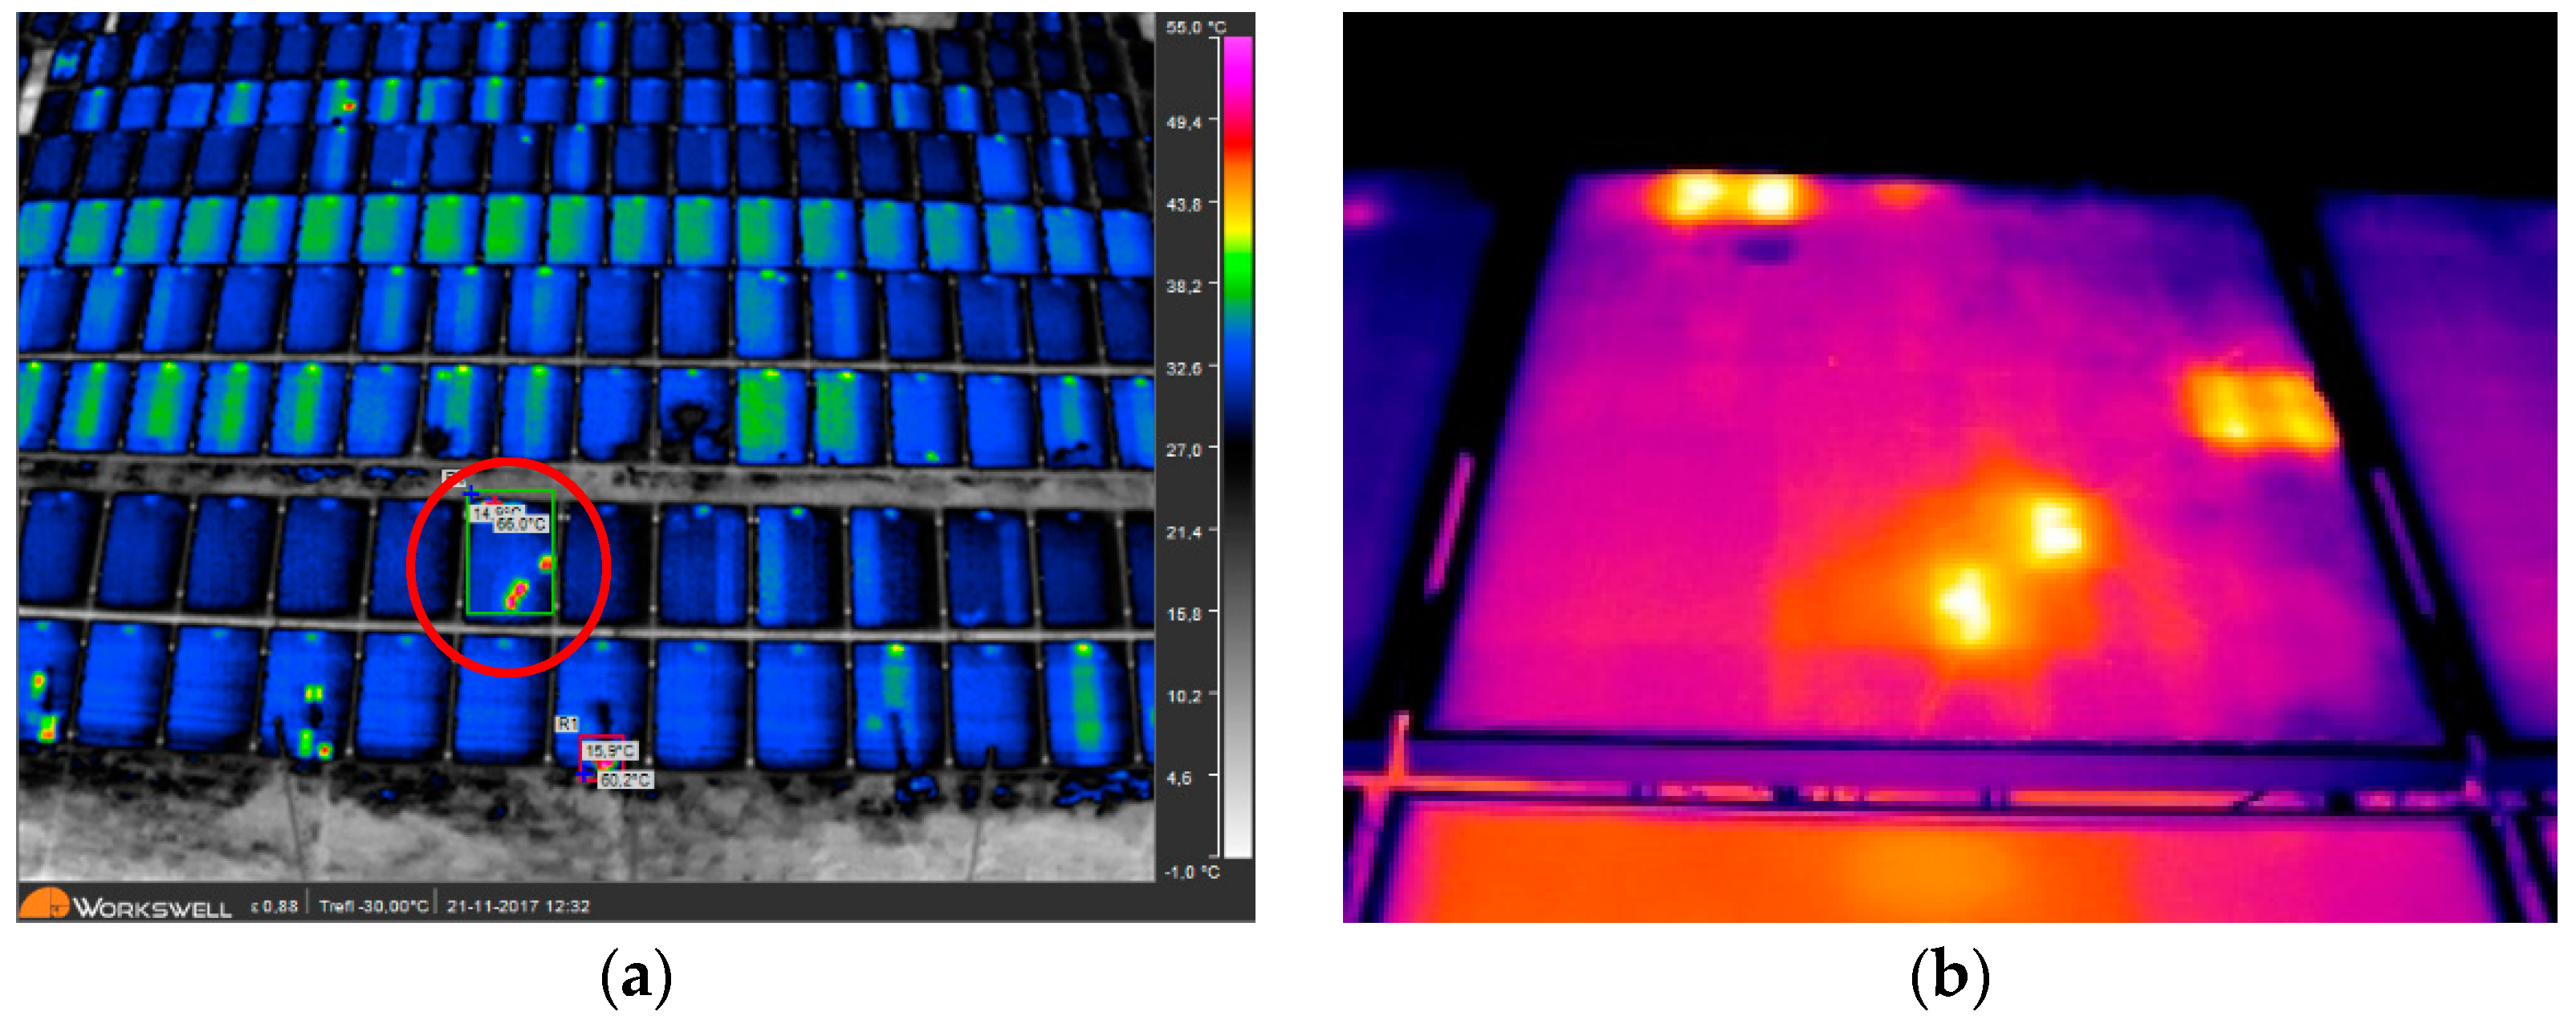
Figure 6a depicts another PV module with a broken front cover (array 6, position AK11), which reaches a temperature of 66.0 °C. Figure 6b shows the ground-level thermographic analysis for the same PV module. The top temperature in the PV module with position AK11 is 89.6 °C and is reached in the indicated cell via an analysis chart as a one-off abnormality. The difference in the results obtained for maximum values is nearly 33 °C between both thermographs. Like in the previous case, this difference is due to the fact that the abnormality is a one-off with a size smaller than the cell, and thus, the aerial inspection distance provides a spatial resolution that is insufficient for this type of fault.
- 2.
- Incidents involving partial shading
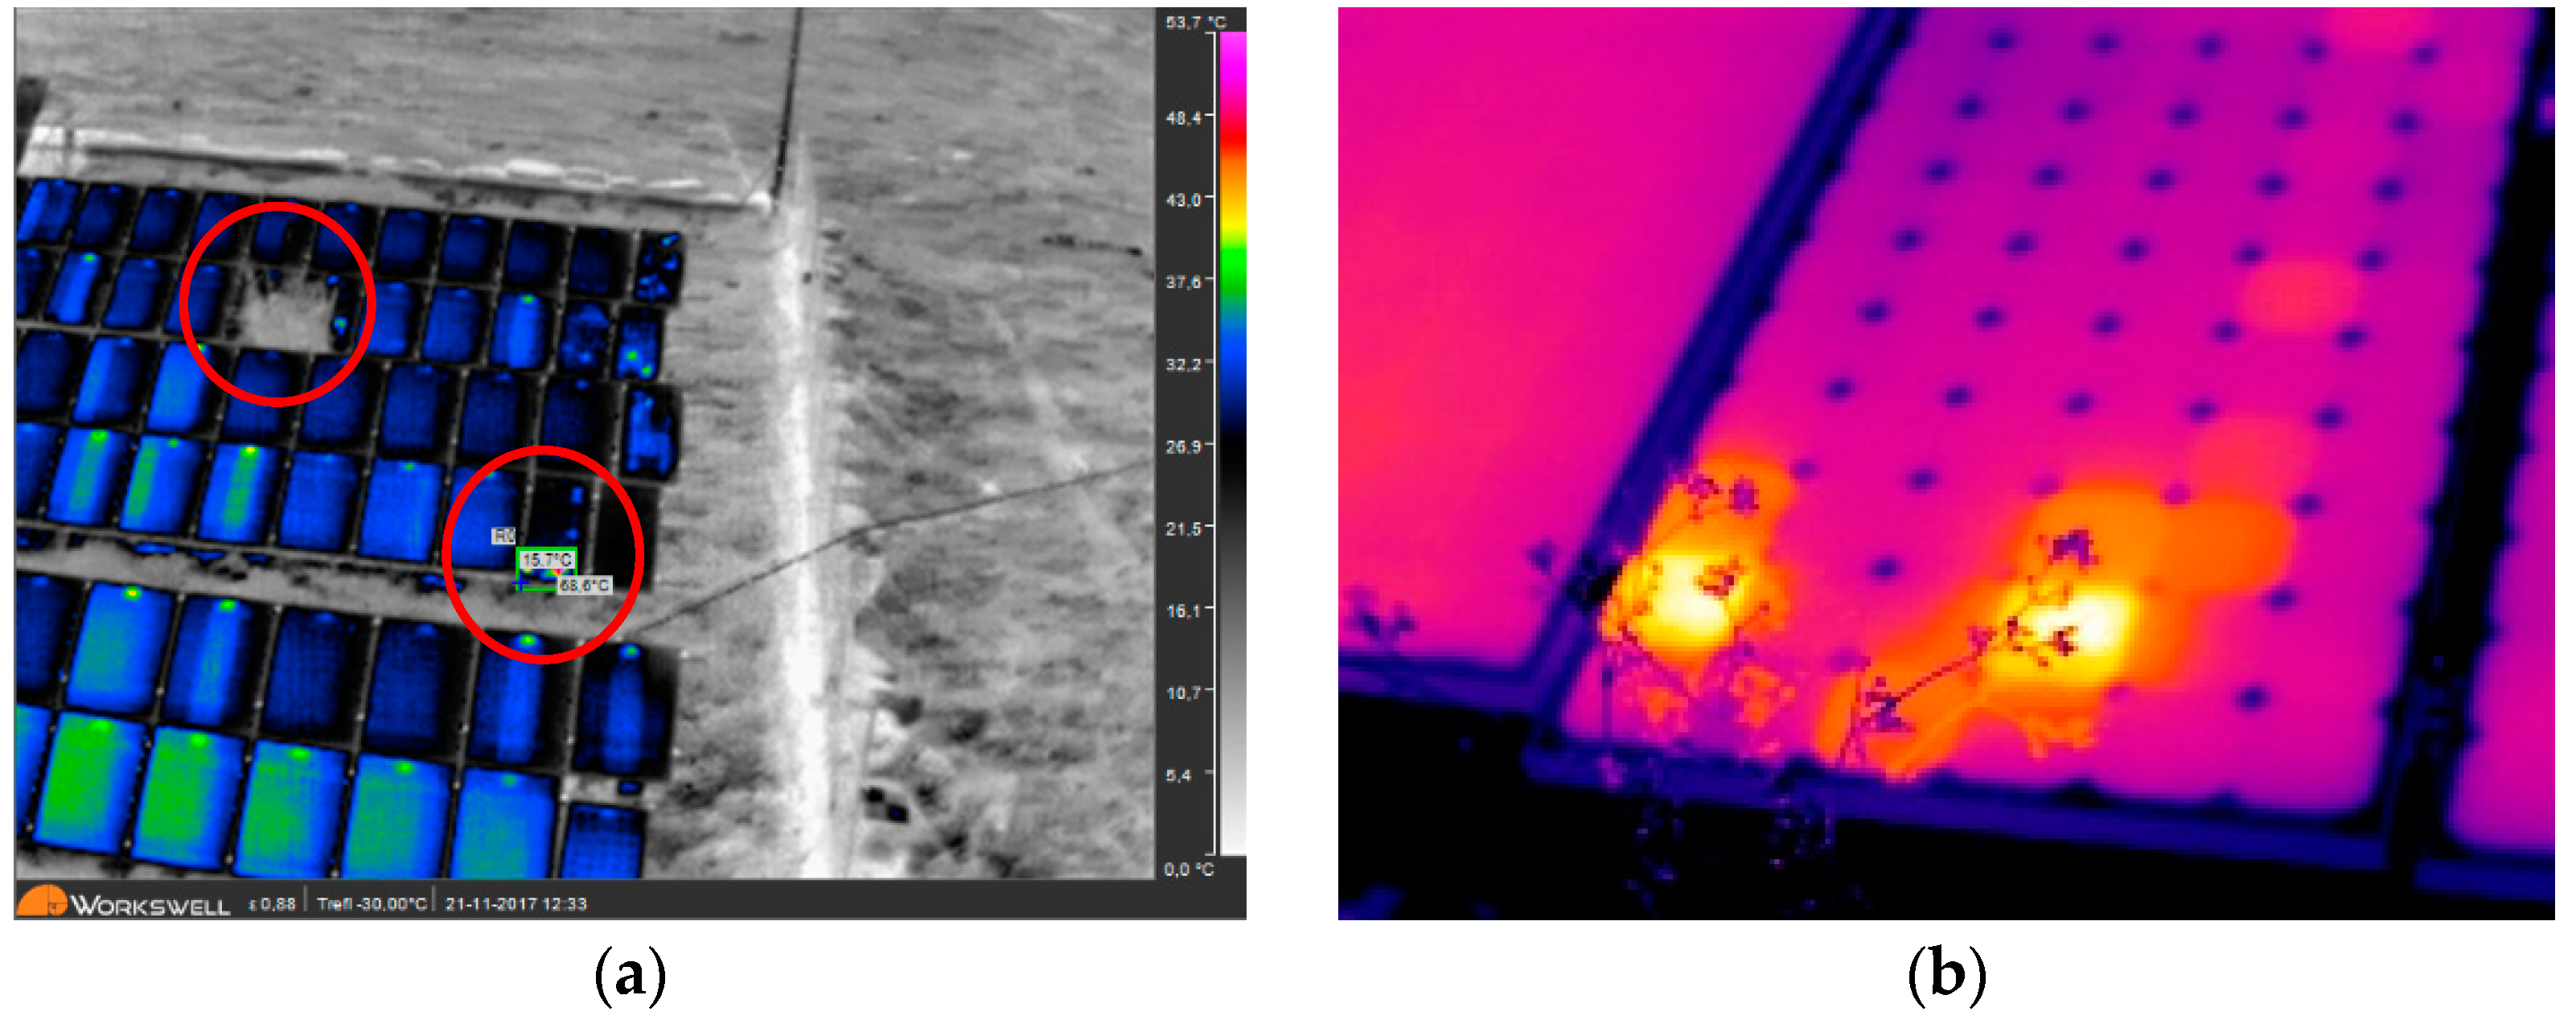
Figure 7a shows the thermographic analysis with incidents due to partial shading in cell AV6 in array 3. A maximum temperature of 68.6 °C was reached in this PV module. Figure 7b shows the ground-level thermographic analysis for the same PV module. The temperature in this PV module (location AV6) for the cell to the right attained values up to 111.8 °C and an average temperature of 88.6 °C. The cell on the left reached values of 108.4 °C and an average temperature of 85.9 °C. The temperature was not homogenous in either shaded cell. The high temperature value may be due to the fact that the vegetation has no appreciable separation over the module, so that the shading effect on the cells is fixed, without influence from the sun’s position.
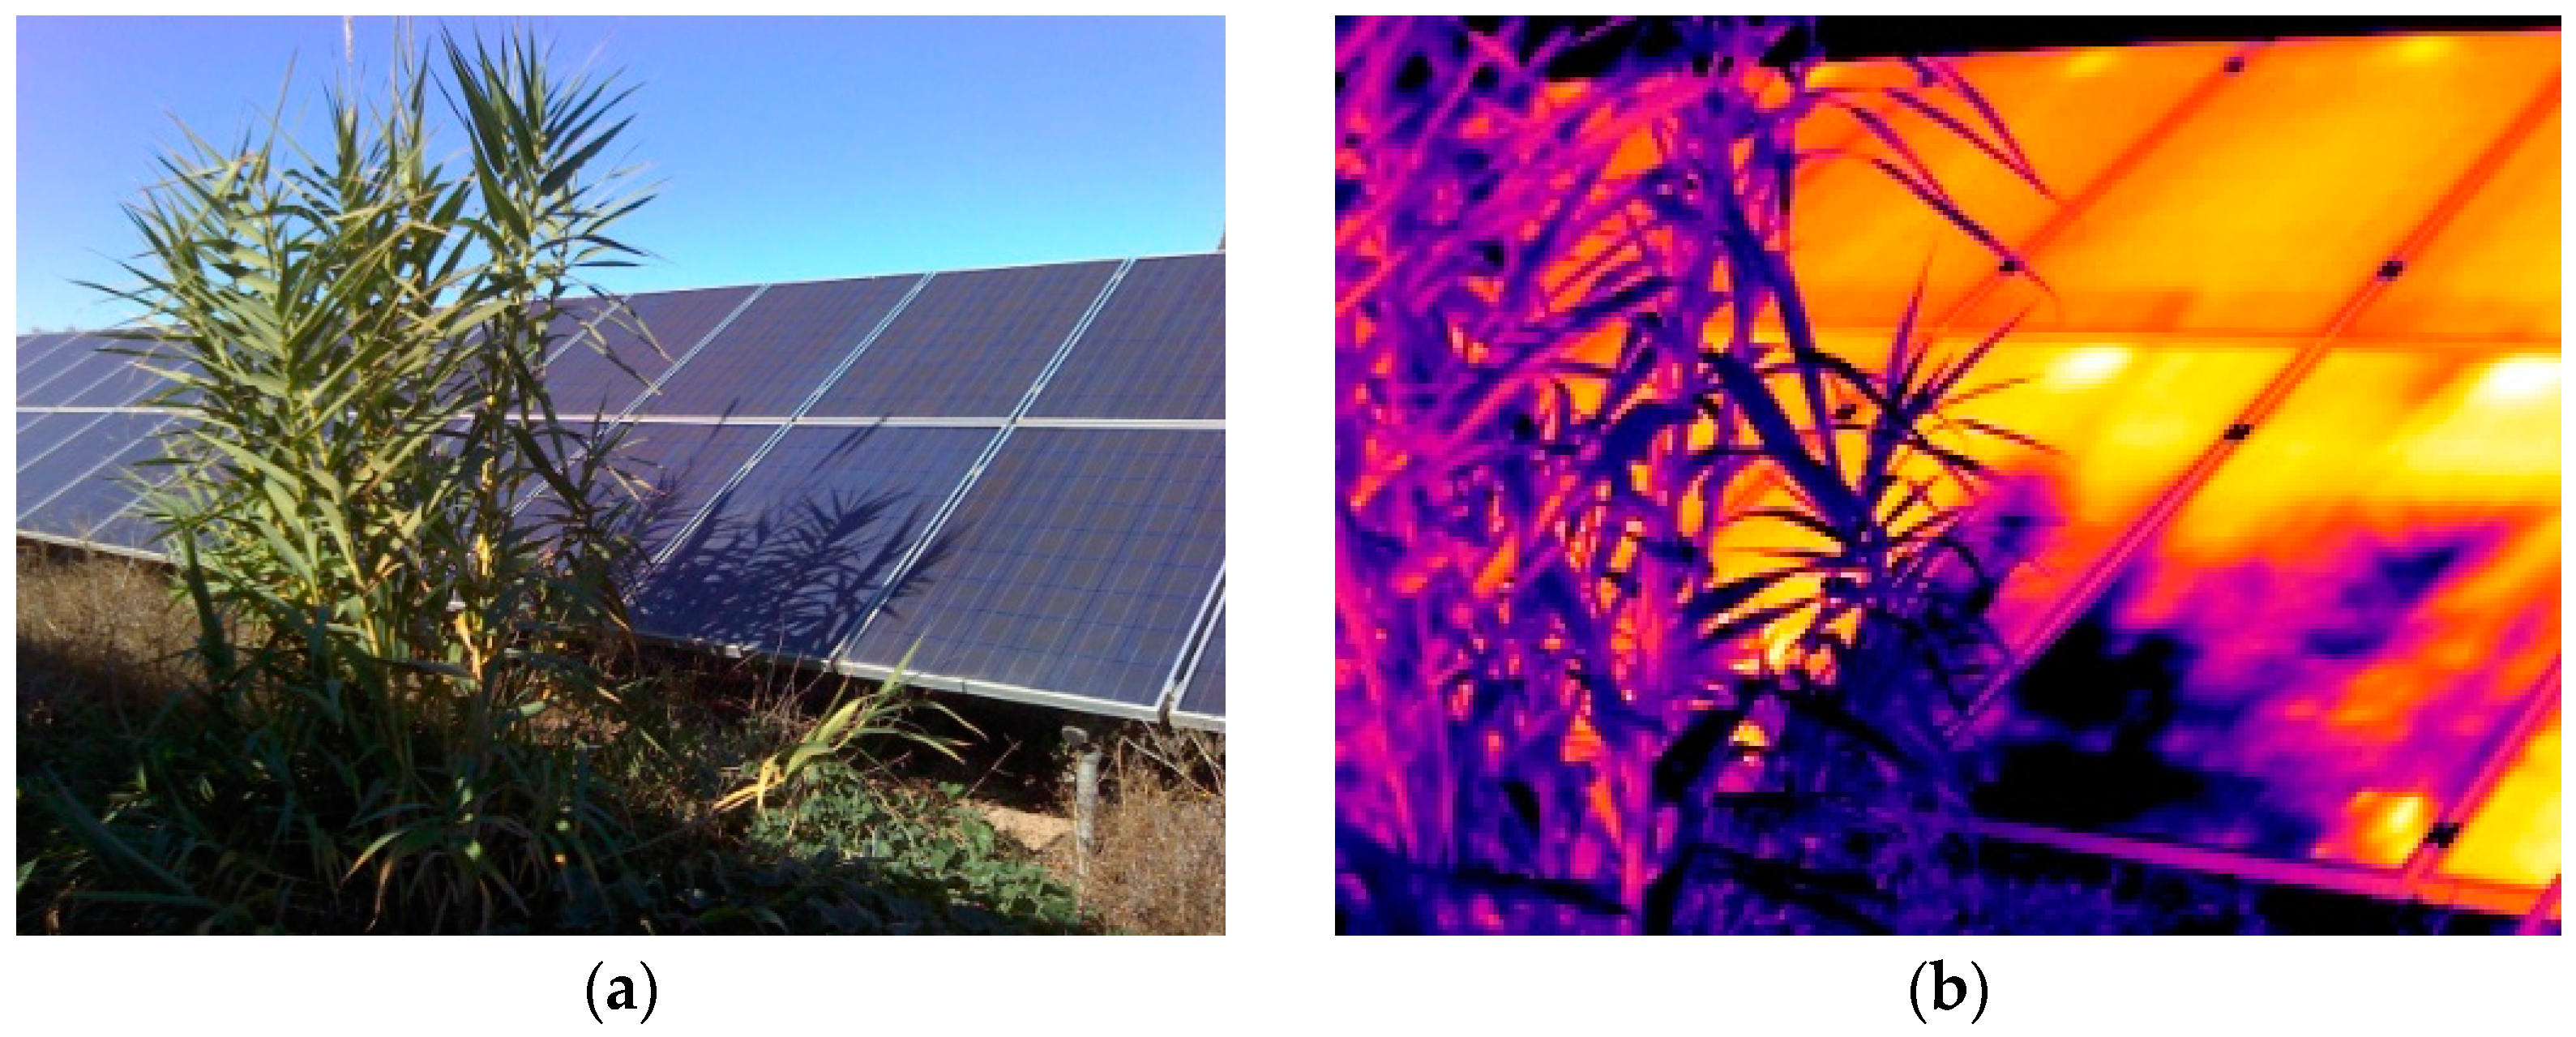
The PV modules at cell positions AQ4 and AR4 (in array 2) in Figure 7a are hidden behind the vegetation, so that no overtemperature of these PV modules is observed due to obstruction by the object. Figure 8 depicts the visual image and ground-level thermographic analysis with incidents in PV modules at positions AQ4 and AR4 (in array 2). The highest temperature in these modules at AQ4 and AR4, which are shaded by vegetation, is 49.6 °C. The top area with the diode case was not considered. The temperature difference compared to the previous case (module AV6) may be due to the separation from the vegetation that caused a moving shadow depending on the sun’s position.
Figure 9a depicts the aerial thermographic analysis of the PV module at position AC12 (array 6), which reached a temperature of 63.7 °C. This overtemperature, or hotspot, was caused by the partial shading from metal fence posts on the perimeter and occurred in other PV modules in the bottom row of array 6 for the same reason. Figure 9b depicts the ground-level thermographic analysis with incidents in the PV module at position AC12 (array 6) that reaches a maximum temperature of 77.5 °C, where the average temperature of the hot cell is 56.2 °C. The difference in the maximum values obtained of nearly 15 °C between both thermographs may be due to the effect of concealment by the post. It could also be due to the fact that the shade moves with the movement of the sun so that the value changes over time.
- 3.
- Incidents involving PV module technology
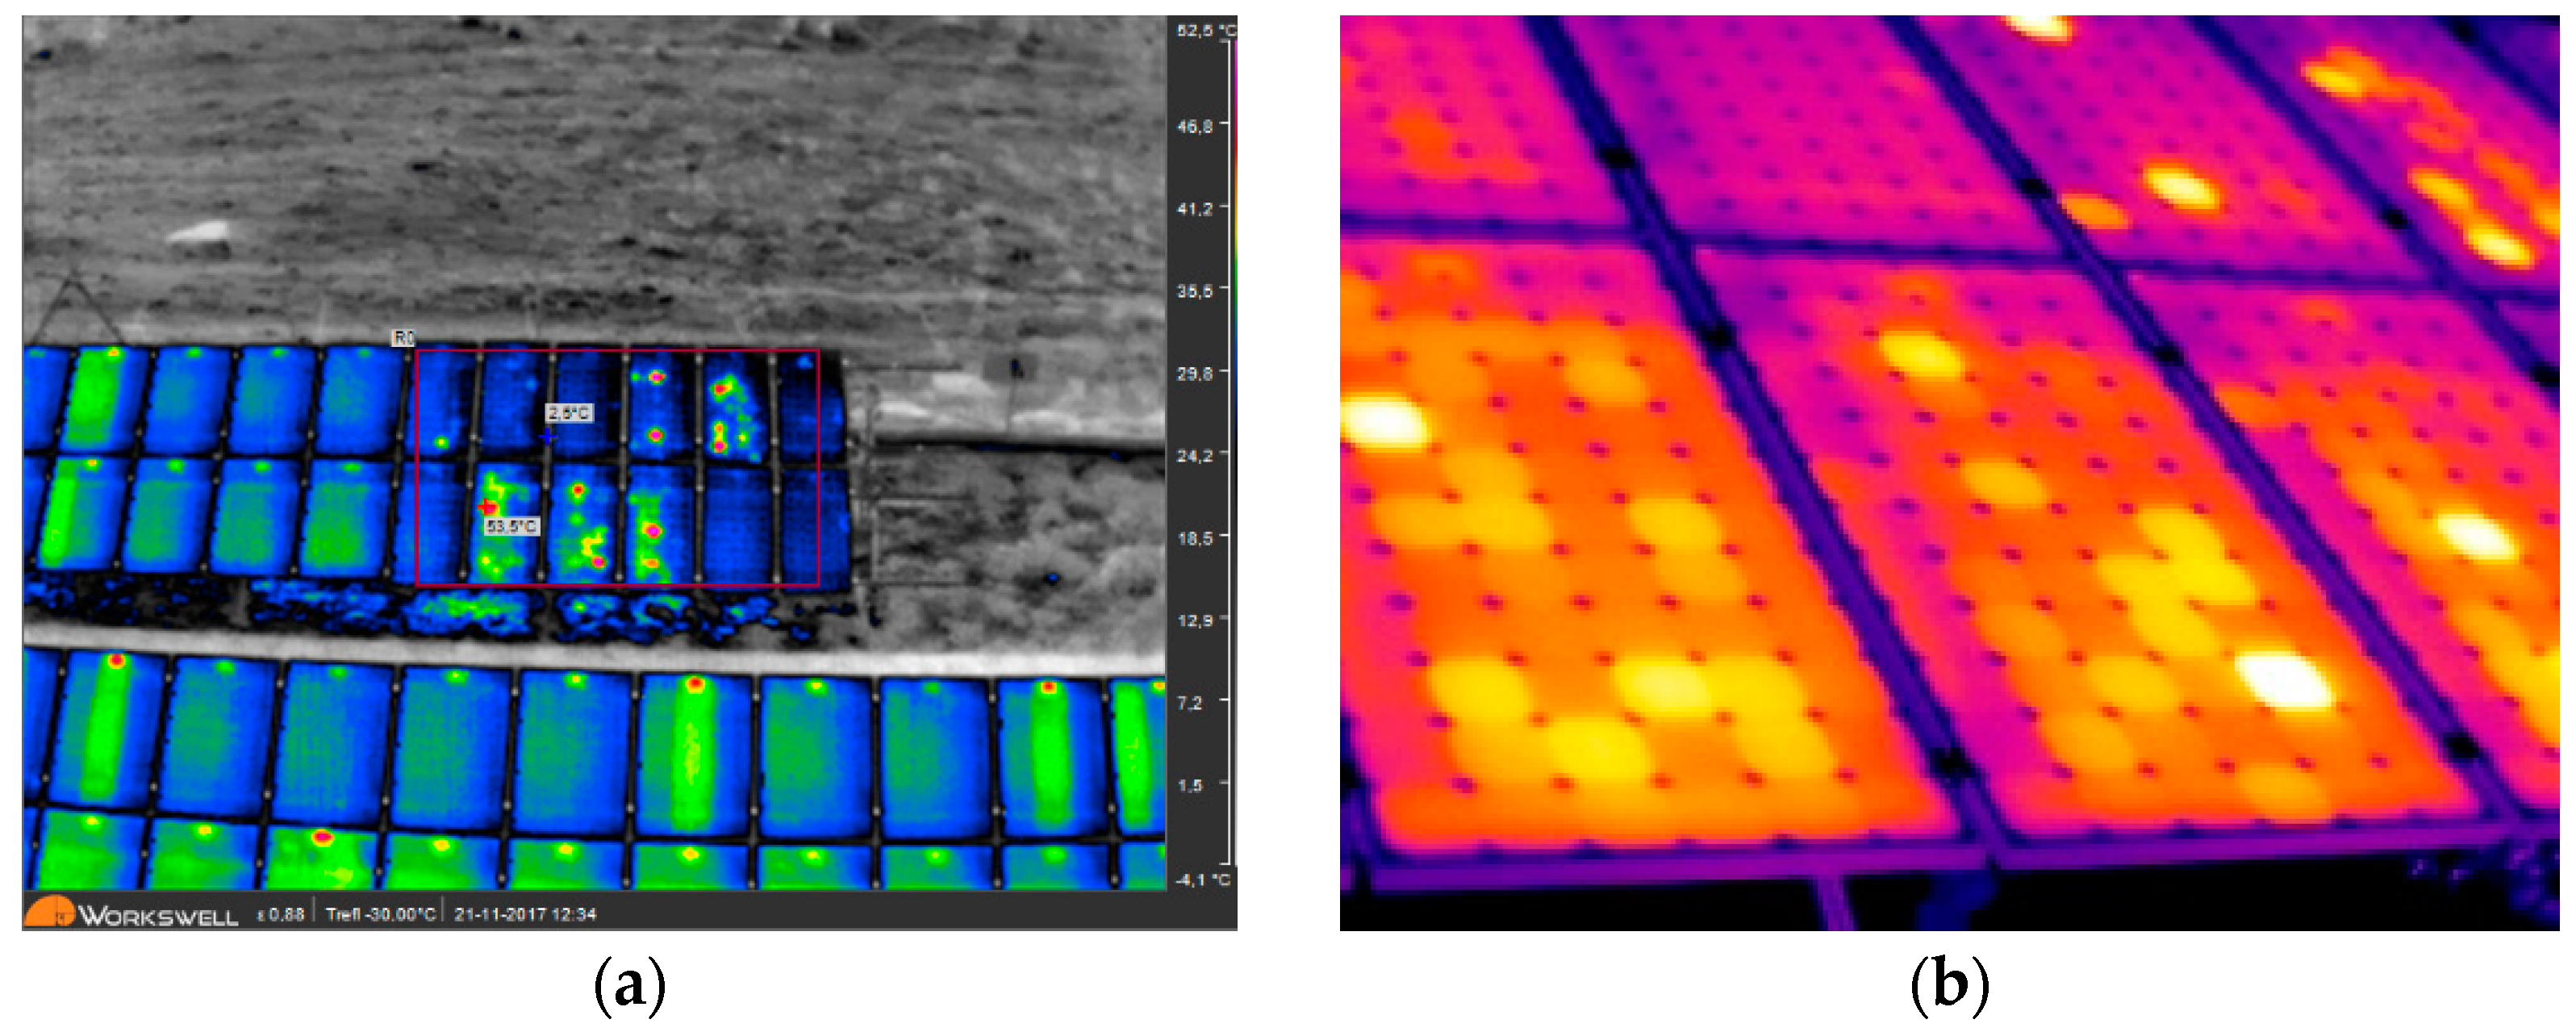
PV modules of type m-Si in array 1 reveal an irregular temperature pattern, reaching values of 53.5 °C, as shown in Figure 10a. This pattern is characteristic of a module in a short circuit according to IEC-62446-3. Remember that for the m-Si type module its Isc = 5.22 A is less than Imp = 7.57 A for the p-Si type module, so the series connection of both modules causes this situation. The heat pattern observed is characterised by a short circuit. The maximum temperature reached is 63.5 °C according to Figure 10b. In this case, the ground-level thermograph lets us see the irregular temperature pattern with higher resolution.
- 4.
- Incidents with open-circuit PV modules
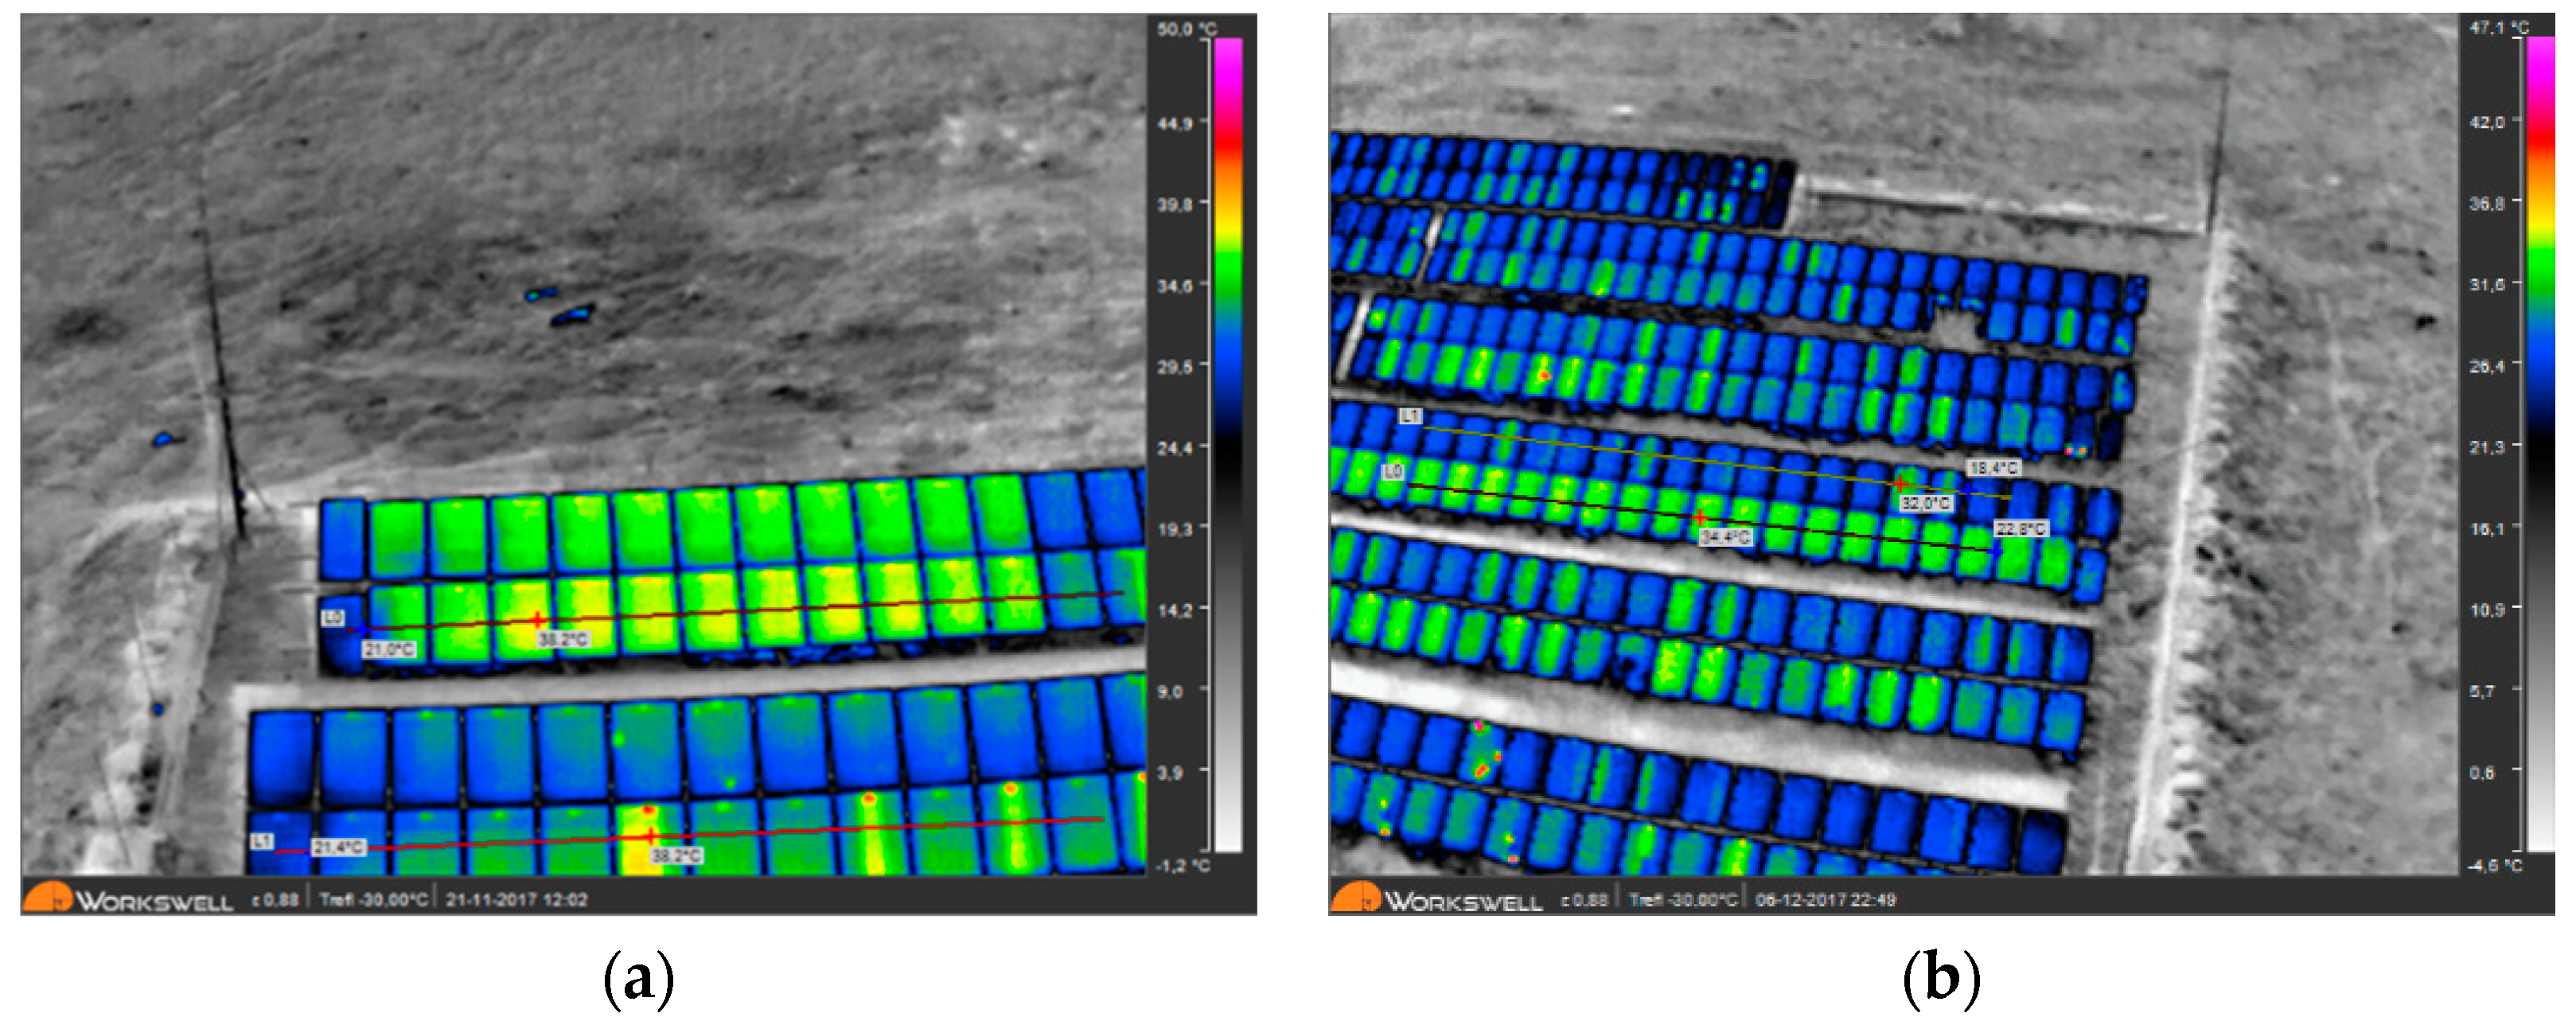
The modules with open circuits do not produce energy. All PV modules in the string that are observed in array 1 are in an open circuit with an overtemperature of some 5 °C with regard to operational PV modules, as depicted in the analysis lines in Figure 11a. All PV modules in the string that are observed in array 4 (bottom part) are also in an open circuit with an overtemperature of some 5 °C with regard to operational PV modules, as depicted in the analysis lines in Figure 10b. In this case, the ground-level thermograph is not necessary, as it does not provide any additional information.
- 5.
- Other incidents
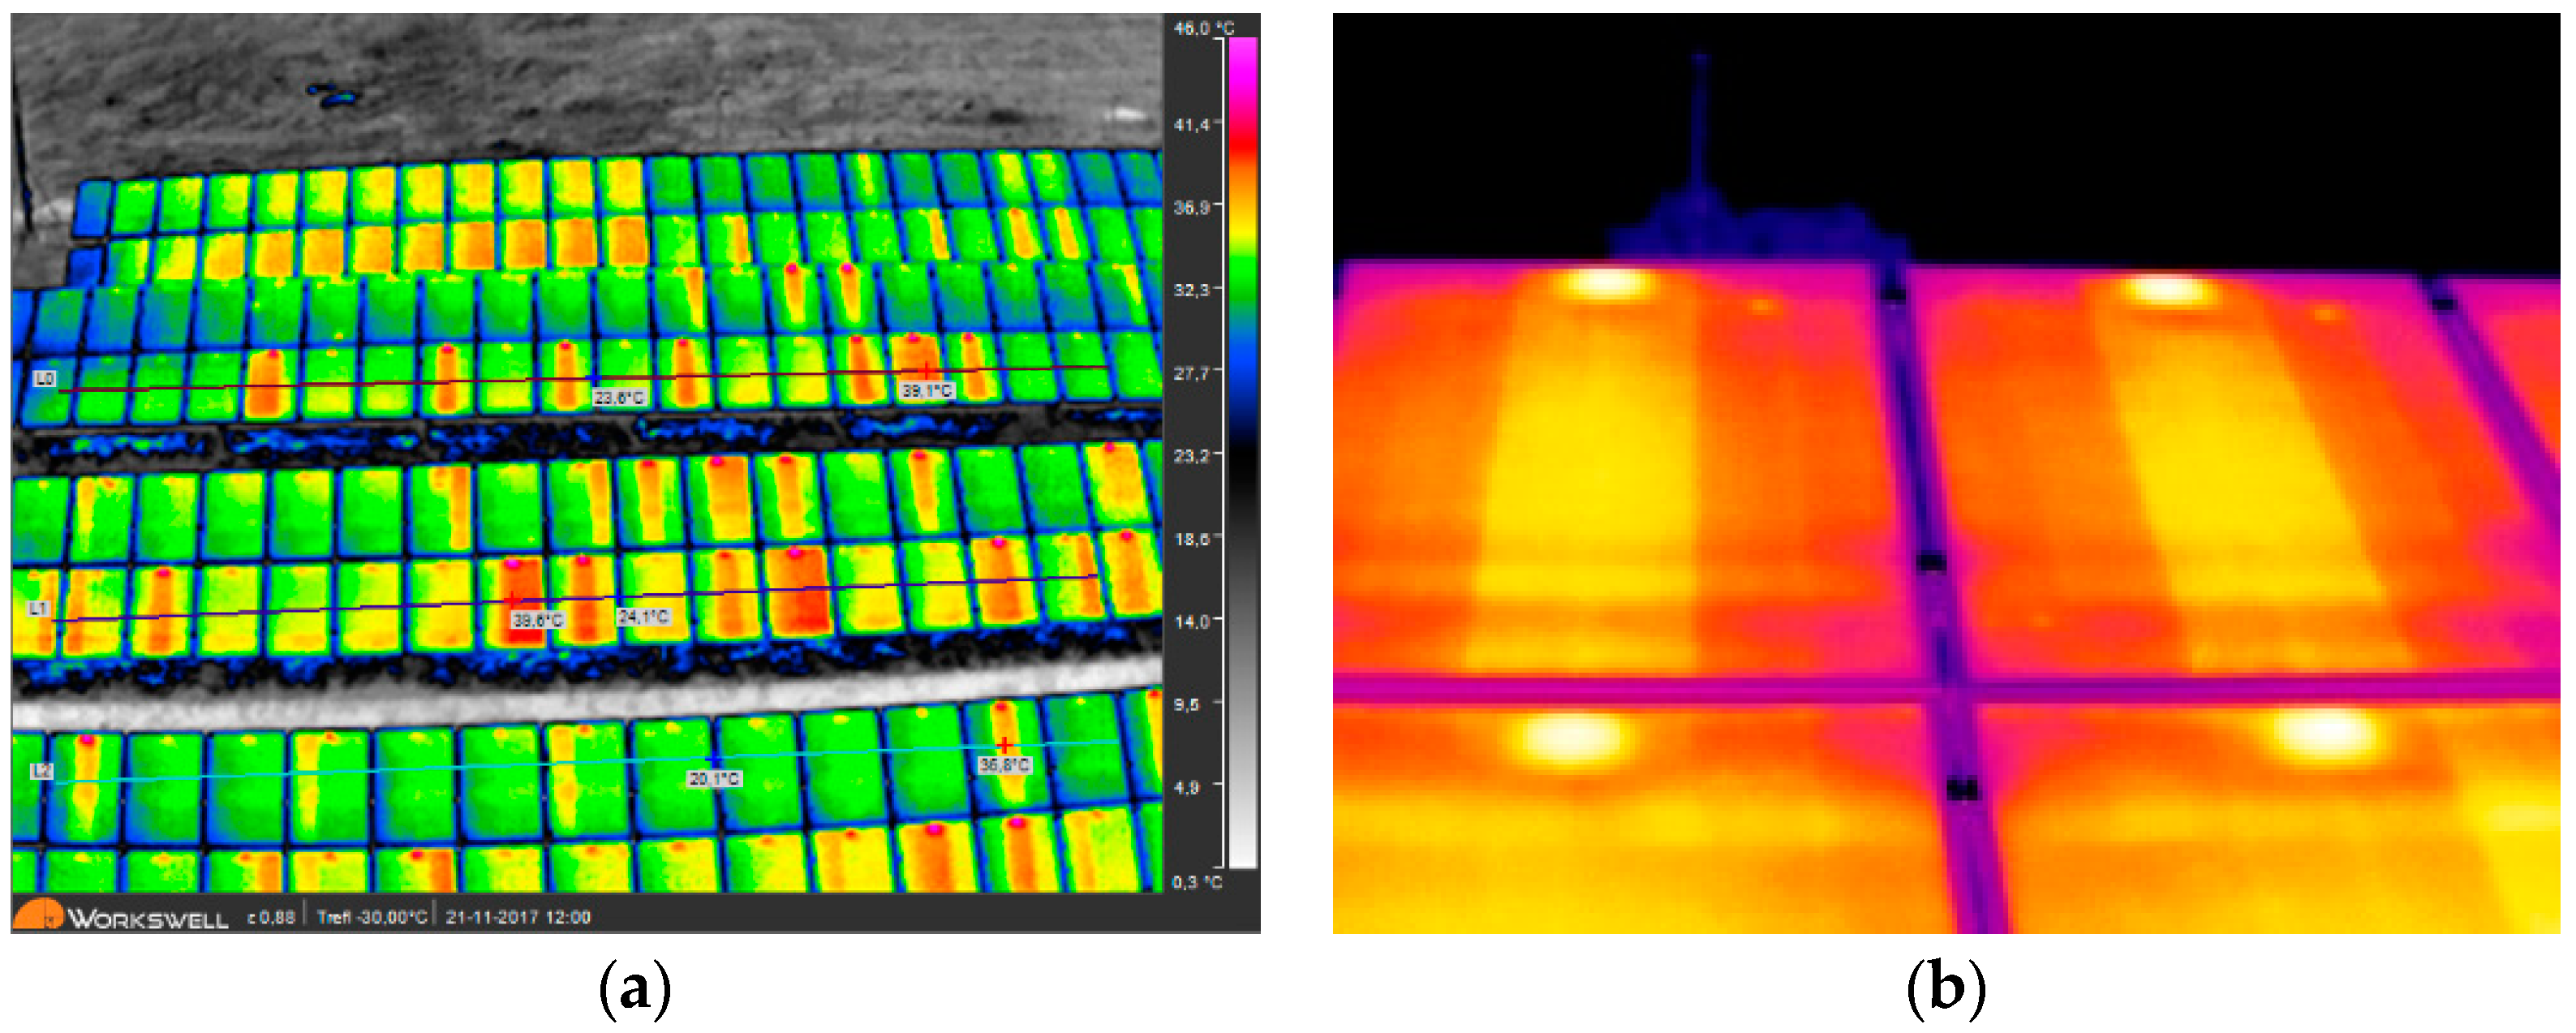
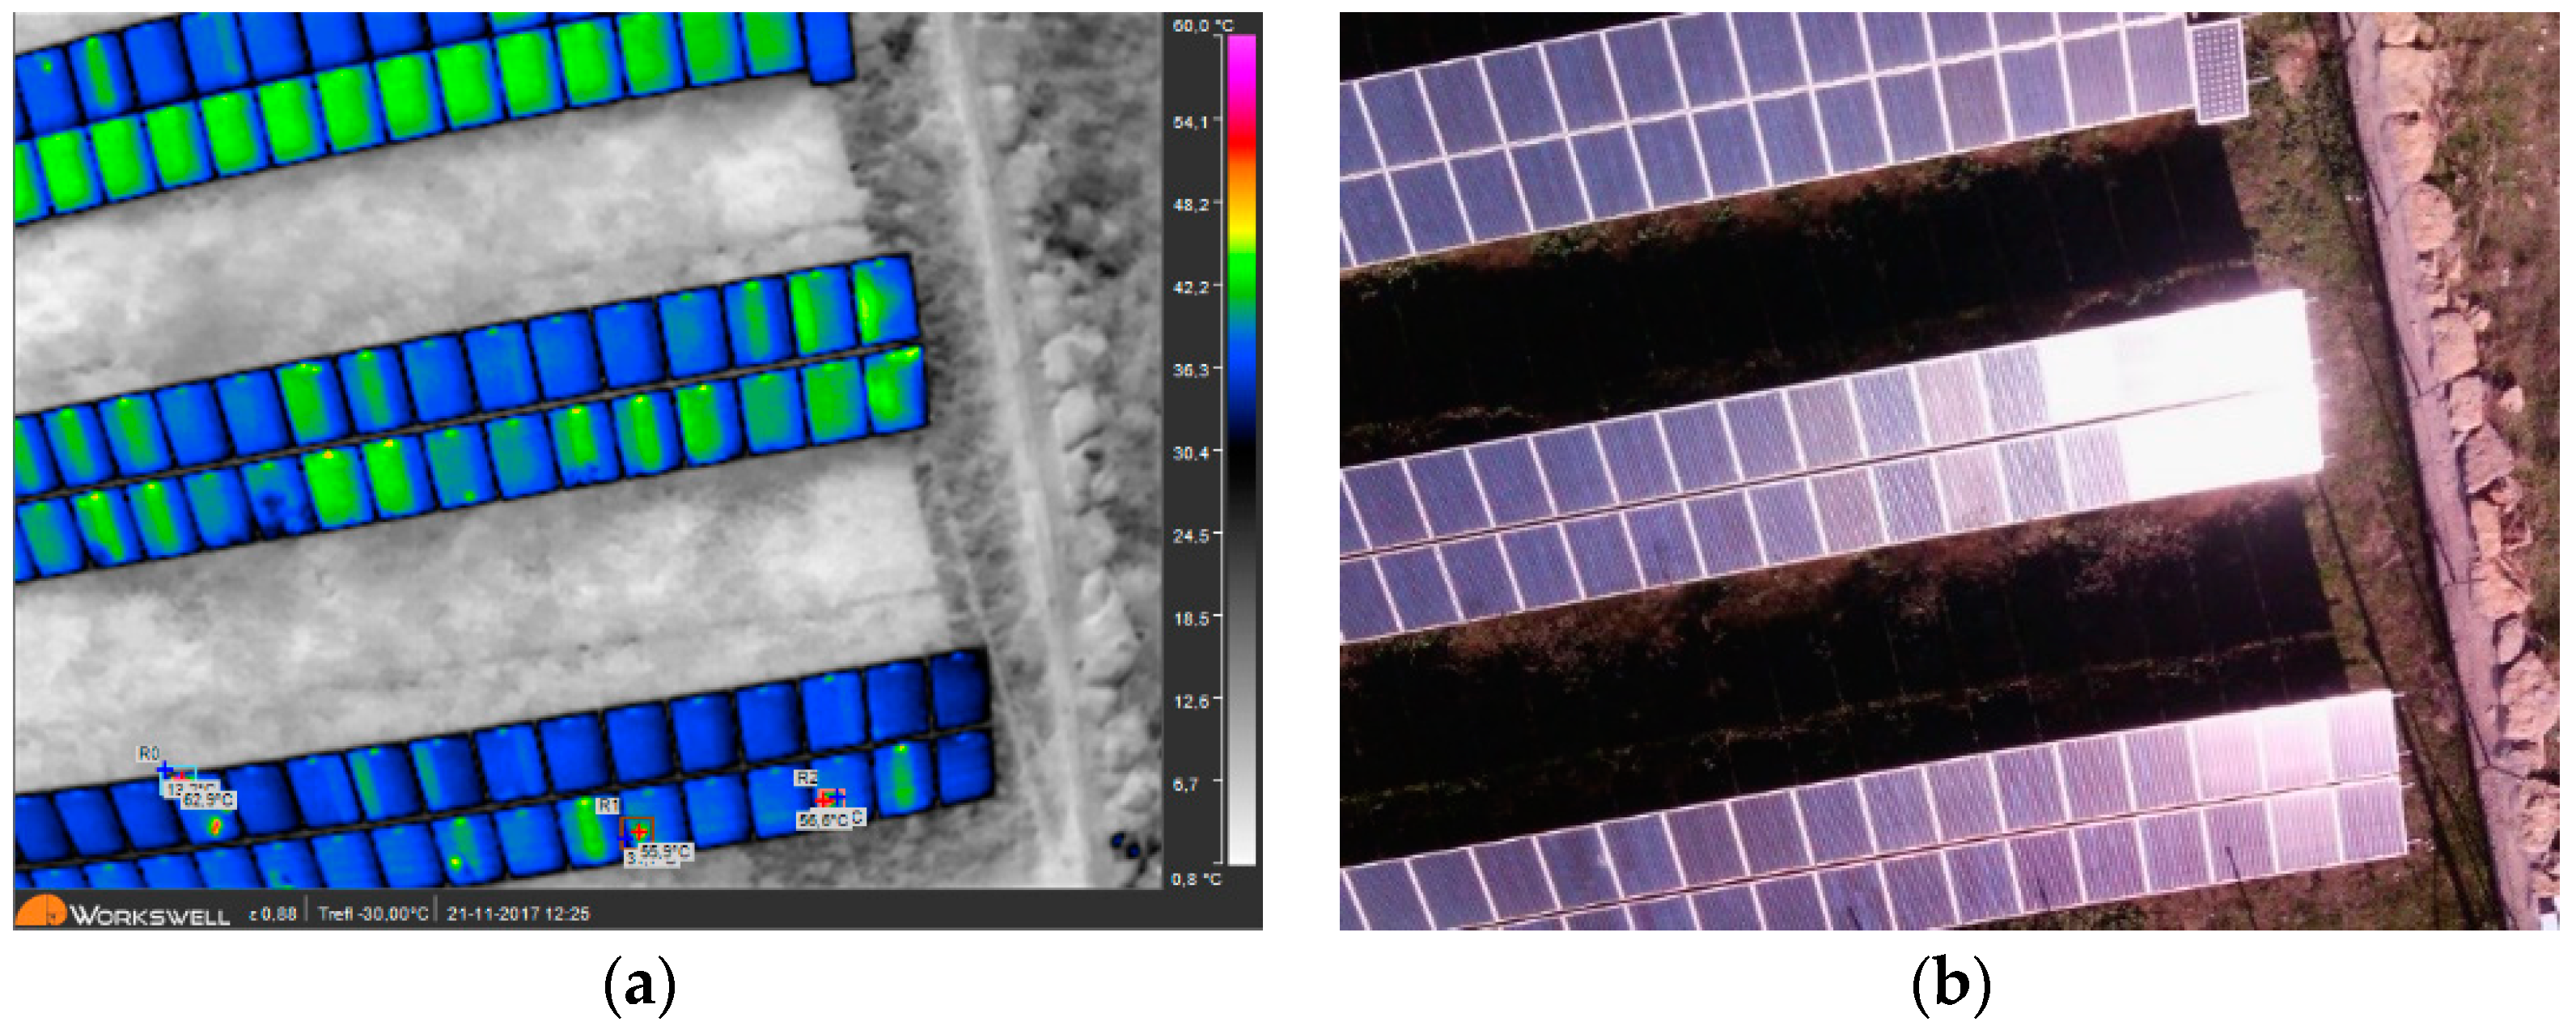
The modules can present open substrings, which limits their power generation. Figure 11a shows the aerial thermographic analysis in which some PV modules have substrings with temperature gradients of up to 5 °C with respect to adjacent substrings in the same module. This is seen in arrays 2, 3 and 4, as indicated by the analysis lines. Figure 12b shows the temperature gradient corresponding to open-circuit substrings from testing with ground-level thermography.
Sunlight reflections due to an improper inspection angle can cause significant reflected glare on the inspection equipment. In Figure 13a, the maximum temperature values reached in the PV modules located at AK11, AR12 and AU12 (array 6) are influenced by solar reflection, as verified in Figure 13b, meaning that they are not real values. The existence of solar reflections is more likely with aerial thermography, as the flight path may lead to some areas being inspected at an unsuitable angle with regard to the sun’s position.
4. Discussion
IR thermographic inspection was conducted with clear skies (okta level 0) and the absence of wind (<1 m/s), which are highly favourable weather conditions for inspection. In general, the PV installation has maintenance deficiencies that affect its performance. The comments below merit mention with regard to two-stage thermographic inspection:
- For one-off incidents due to hotspots, spatial resolution may be insufficient with aerial IR thermography. Ground-level IR thermography enables greater precision for determining thermal behaviour.
- Heat incidents from shading may be totally or partially concealed by the item causing the shadow (vegetation or post) with aerial IR thermography. Ground-level IR thermography prevents any possible blocking.
- PV modules with technology different from m-Si reveal an irregular temperature pattern. This pattern is characteristic of a module in a short circuit. For this reason, all m-Si type PV modules are operating in a state close to a short circuit as a consequence of the intensity values produced by the p-Si type PV modules, which are series connected within each string. This incident is seen indistinctly by both thermography types, although at ground level the behaviour is viewed with greater sharpness and definition.
- For PV modules in open circuit, the thermal behaviour is some 5 to 7 °C higher than temperatures in operational modules. These modules do not produce power. This incident does not depend on the thermography type.
- For PV modules with open-circuit substrings, thermal behaviour is some 5 to 7 °C higher than operational substrings. These PV modules’ power production at the PV plant is very limited. This incident is observed interchangeably in both thermography types.
- In the stage one of the thermographic inspection, it is necessary to determine the specific location of the PV modules with faults and to identify them correctly. This is essential for the success of the stage two and for the documentation of the final report.
- The stage two of thermographic inspection can also be performed aerially, but at a reduced distance to allow for the necessary thermal resolution. This may require the scheduling of two flight plans. The second flight plan would be conditioned by the results of the first flight plan. This will simplify the thermographic equipment to be used and the subsequent analysis. This may be the subject of future research.
Figure 14 summarises the incidents detected after a two-stage thermographic inspection and their locations for the PV plant inspected, considering the identification matrix by module.
The Table 1 summarises the incidents detected during inspection, where the temperature value is extrapolated at STC (1000 W/m2) conditions and calculated according to IEC-62446-3, with a comment on each incident.
5. Conclusions
Aerial IR thermographic inspection of operational PV plants is a powerful and versatile tool for detecting abnormalities that affects its operation. Its application to large PV plants entails a significant saving of time and cost compared to ground-level IR thermographic inspection. However, some incidents may not be observed or may be misinterpreted when the inspection is done in the air. One-off thermal abnormalities of sizes smaller than the cell are determined with greater resolution and precision when the thermographic inspection is at ground level. Further, the problem of obstacles such as vegetation or a perimeter fence can be avoided with ground-level inspections. The existence of solar heat reflections can also be captured more easily from the air.
Applying a two-stage thermographic inspection improves maintenance if the advantages of both techniques are employed. Stage one with aerial IR thermographic inspection will detect incidents and faults, as well as their locations, quickly and reliably. Additionally, stage two with ground-level IR thermographic inspection, applied only to relevant incidents from the previous stage, assures greater precision and resolution in the results. This two-stage thermographic inspection strategy will improve the diagnosis conducted.
The integration of the proposed approach in the flight planning of automatic detection systems can have a significant advantage in the maintenance of large PV plants and in the reduction of the corresponding execution time. This innovative approach may be the subject of future research.
Author Contributions
Conceptualisation, G.Á.-T. and C.G.-L.; methodology, G.Á.-T. and C.G.-L.; validation, G.Á.-T. and C.G.-L.; formal analysis, C.G.-L.; investigation, G.Á.-T. and C.G.-L.; data curation, G.Á.-T. and C.G.-L.; writing—original draft preparation, G.Á.-T.; writing—review and editing, G.Á.-T. and C.G.-L.; visualisation, G.Á.-T. and C.G.-L.; supervision, G.Á.-T. and C.G.-L.; project administration, G.Á.-T. All authors have read and agreed to the published version of the manuscript.
Funding
This research received no external funding.
Institutional Review Board Statement
Not applicable.
Informed Consent Statement
Not applicable.
Conflicts of Interest
The authors declare no conflict of interest.
Abbreviations
The following abbreviations are used in this manuscript:
| IFOV | Instantaneous Field of View |
| IR | Infrared |
| PV | Photovoltaic |
| STC | Standard Test Conditions |
| UAVs | Unmanned Aerial Vehicles |
References
- Solar Power Europe. Global Market Outlook for Solar Power 2021–2025; Solar Power Europe: Brussels, Belgium, 2021; p. 135. [Google Scholar]
- Jäger-Waldau, A. Snapshot of photovoltaics—March 2021. EPJ Photovolt. 2021, 12, 2. [Google Scholar] [CrossRef]
- SolarPower Europe. Operation & Maintenance. Best Practice Guidelines/Version 4.0; SolarPower Europe: Brussels, Belgium, 2019; p. 120. [Google Scholar]
- Hernández-Callejo, L.; Gallardo-Saavedra, S.; Gómez, V.A. A review of photovoltaic systems: Design, operation and maintenance. Sol. Energy 2019, 188, 426–440. [Google Scholar] [CrossRef]
- IEA-PVPS Task 13. Review of Failures of Photovoltaic Modules. Report IEA-PVPS T13-01. 2014. Available online: https://iea-pvps.org/key-topics/review-of-failures-of-photovoltaic-modules-final/ (accessed on 7 June 2022).
- Libra, M.; Daneček, M.; Lešetický, J.; Poulek, V.; Sedláček, J.; Beránek, V. Monitoring of Defects of a Photovoltaic Power Plant Using a Drone. Energies 2019, 12, 795. [Google Scholar] [CrossRef] [Green Version]
- IEC 61724; Photovoltaic System Performance—Part 1: Monitoring. International Electrotechnical Commission (IEC): Geneva, Switzerland, 2017; p. 68.
- Tsanakas, J.A.; Ha, L.; Buerhop, C. Faults and infrared thermographic diagnosis in operating c-Si photovoltaic modules: A review of research and future challenges. Renew. Sustain. Energy Rev. 2016, 62, 695–709. [Google Scholar] [CrossRef]
- Buerhop, C.; Jahn, U.; Hoyer, U.; Lercher, B.; Wittmann, S. Abschlussbericht Machbarkeitsstudie Überprüfung der Qualität von Photovoltaik-Modulen Mittels Infrarot-Aufnahmen. 2007, pp. 1–46. Available online: https://www.sev-bayern.de/wp-content/uploads/2018/12/IR-Handbuch.pdf (accessed on 7 June 2022).
- Buerhop, C.; Schlegel, D.; Niess, M.; Vodermayer, C.; Weißmann, R.; Brabec, C.J. Reliability of IR-imaging of PV-plants under operating conditions. Sol. Energy Mater. Sol. Cells 2012, 107, 154–164. [Google Scholar] [CrossRef]
- Spagnolo, G.S.; Del Vecchio, P.; Makary, G.; Papalillo, D.; Martocchia, A. A review of IR thermography applied to PV systems. In Proceedings of the 11th International Conference on Environment and Electrical Engineering, Venice, Italy, 18–25 May 2012; pp. 879–884. [Google Scholar] [CrossRef]
- IEC TS 62446-3; Photovoltaic (PV) Systems—Requirements for Testing, Documentation and Maintenance—Part 3: Outdoor Infrared Thermography of Photovoltaic Modules and Plants. International Electrotechnical Commission (IEC): Geneva, Switzerland, 2017.
- IEA-Photovoltaic Power Systems Programme. Review on Infrared (IR) and Electroluminescence (EL) Imaging for Photovoltaic Field Applications. Report IEA-PVPS T13-10:2018. 2018, pp. 1–94. Available online: https://iea-pvps.org/wp-content/uploads/2020/01/Review_on_IR_and_EL_Imaging_for_PV_Field_Applications_by_Task_13.pdf (accessed on 7 June 2022).
- Buerhop-Lutz, C.; Weißmann, R.; Scheuerpflug, H.; Auer, R.; Brabec, C. Quality Control of PV-Modules in the Field Using a Remote-Controlled Drone with an Infrared Camera. In Proceedings of the 27th European Photovoltaic Solar Energy Conference and Exhibition (EU PVSEC 2012), Frankfurt, Germany, 24–28 September 2012; pp. 3370–3373. [Google Scholar] [CrossRef]
- Quater, P.B.; Grimaccia, F.; Leva, S.; Mussetta, M.; Aghaei, M. Light Unmanned Aerial Vehicles (UAVs) for Cooperative Inspection of PV Plants. IEEE J. Photovolt. 2014, 4, 1107–1113. [Google Scholar] [CrossRef] [Green Version]
- Rahaman, S.A.; Urmee, T.; Parlevliet, D.A. PV system defects identification using Remotely Piloted Aircraft (RPA) based infrared (IR) imaging: A review. Sol. Energy 2020, 206, 579–595. [Google Scholar] [CrossRef]
- Gallardo-Saavedra, S.; Hernández-Callejo, L.; Duque-Perez, O. Technological review of the instrumentation used in aerial thermographic inspection of photovoltaic plants. Renew. Sustain. Energy Rev. 2018, 93, 566–579. [Google Scholar] [CrossRef]
- Gallardo-Saavedra, S.; Hernandez-Callejo, L.; Duque-Perez, O.; Hermandez, L. Image Resolution Influence in Aerial Thermographic Inspections of Photovoltaic Plants. IEEE Trans. Ind. Inform. 2018, 14, 5678–5686. [Google Scholar] [CrossRef]
- Coello, J.; Perez, L.; Parra, V.; Gomez, R. IR Thermography Inspection of PV modules in large PV Plants with UAV. In Proceedings of the 31st European Photovoltaic Solar Energy Conference and Exhibition, Hamburg, Germany, 14–18 September 2015. [Google Scholar]
- Henry, C.; Poudel, S.; Lee, S.-W.; Jeong, H. Automatic Detection System of Deteriorated PV Modules Using Drone with Thermal Camera. Appl. Sci. 2020, 10, 3802. [Google Scholar] [CrossRef]
- De Oliveira, A.K.V.; Bracht, M.K.; Melo, A.P.; Lamberts, R.; Ruther, R. Evaluation of Faults in a Photovoltaic Power Plant using Orthomosaics based on Aerial Infrared Thermography. In Proceedings of the 2021 IEEE 48th Photovoltaic Specialists Conference (PVSC), Virtual Meeting, 20–25 June 2021; pp. 2604–2610. [Google Scholar] [CrossRef]
- Lee, D.H.; Park, J.H. Developing Inspection Methodology of Solar Energy Plants by Thermal Infrared Sensor on Board Unmanned Aerial Vehicles. Energies 2019, 12, 2928. [Google Scholar] [CrossRef] [Green Version]
- Dalsass, M.; Scheuerpflug, H.; Fecher, F.W.; Buerhop-Lutz, C.; Camus, C.; Brabec, C.J. Correlation between the generated string powers of a photovoltaic: Power plant and module defects detected by aerial thermography. In Proceedings of the 2016 IEEE 43rd Photovoltaic Specialists Conference (PVSC), Portland, OR, USA, 5–10 June 2016; Volume 83, pp. 3113–3118. [Google Scholar] [CrossRef]
- de Oliveira, A.K.V.; Aghaei, M.; Rüther, R. Automatic Inspection of Photovoltaic Power Plants Using Aerial Infrared Thermography: A Review. Energies 2022, 15, 2055. [Google Scholar] [CrossRef]
- Ortiz-Sanz, J.; Gil-Docampo, M.; Arza-García, M.; Cañas-Guerrero, I. IR Thermography from UAVs to Monitor Thermal Anomalies in the Envelopes of Traditional Wine Cellars: Field Test. Remote Sens. 2019, 11, 1424. [Google Scholar] [CrossRef]
- Feroz, S.; Abu Dabous, S. UAV-Based Remote Sensing Applications for Bridge Condition Assessment. Remote Sens. 2021, 13, 1809. [Google Scholar] [CrossRef]
- WIRIS. Workswell 2a Gen. User Manual Revision 2.0; Workswell: Prague, Czech Republic, 2017; pp. 1–8. [Google Scholar]
- FLIR Systems. ThermaCAM TM S60. User Manual Revision a35; FLIR Systems: Danderyd, Sweden, 2004; pp. 1–200. [Google Scholar]
- Álvarez-Tey, G.; Jiménez-Castañeda, R.; Carpio, J. Analysis of the configuration and the location of thermographic equipment for the inspection in photovoltaic systems. Infrared Phys. Technol. 2017, 87, 40–46. [Google Scholar] [CrossRef]
- Krenzinger, A.; de Andrade, A. Accurate outdoor glass thermographic thermometry applied to solar energy devices. Sol. Energy 2007, 81, 1025–1034. [Google Scholar] [CrossRef]
Figure 1.
Images of the drone used for the aerial IR thermographic inspection.

Figure 2.
Flowchart for two-stage strategy.

Figure 3.
Aerial view of 100 kW PV plant in southern Spain. It can be seen that PV modules with different technologies are located at the ends of the arrays.
Figure 3.
Aerial view of 100 kW PV plant in southern Spain. It can be seen that PV modules with different technologies are located at the ends of the arrays.

Figure 4.
Coding system for identification of PV modules and cells. (a) Identification matrix of plant PV modules, and (b) the cells in each PV module from a front view.
Figure 4.
Coding system for identification of PV modules and cells. (a) Identification matrix of plant PV modules, and (b) the cells in each PV module from a front view.

Figure 5.
Thermographic analysis for an incident of broken glass: (a) aerial IR inspection, and (b) ground-level IR inspection. The red circle in (a) identifies the affected PV module.
Figure 5.
Thermographic analysis for an incident of broken glass: (a) aerial IR inspection, and (b) ground-level IR inspection. The red circle in (a) identifies the affected PV module.

Figure 6.
Thermographic analysis for an incident of broken glass: (a) aerial IR inspection, and (b) ground-level IR inspection. The red circle in (a) identifies the affected PV module.
Figure 6.
Thermographic analysis for an incident of broken glass: (a) aerial IR inspection, and (b) ground-level IR inspection. The red circle in (a) identifies the affected PV module.

Figure 7.
Thermographic analysis for an incident of partial shading: (a) aerial IR inspection, and (b) ground-level IR inspection. The red circles in (a) identify the affected PV modules.
Figure 7.
Thermographic analysis for an incident of partial shading: (a) aerial IR inspection, and (b) ground-level IR inspection. The red circles in (a) identify the affected PV modules.

Figure 8.
Ground-level thermographic analysis with an incident involving partial shading: (a) visual image, and (b) ground-level IR inspection.
Figure 8.
Ground-level thermographic analysis with an incident involving partial shading: (a) visual image, and (b) ground-level IR inspection.

Figure 9.
Thermographic analysis with an incident of partial shading: (a) aerial IR inspection, and (b) ground-level IR inspection. The red circle in (a) identifies the affected PV module.
Figure 9.
Thermographic analysis with an incident of partial shading: (a) aerial IR inspection, and (b) ground-level IR inspection. The red circle in (a) identifies the affected PV module.

Figure 10.
Thermographic analysis for an incident involving PV module technology: (a) aerial IR inspection, and (b) ground-level IR inspection.
Figure 10.
Thermographic analysis for an incident involving PV module technology: (a) aerial IR inspection, and (b) ground-level IR inspection.

Figure 11.
Aerial IR thermographic analysis with an incident of open-circuit PV modules: (a) in array 1, and (b) in array 4.
Figure 11.
Aerial IR thermographic analysis with an incident of open-circuit PV modules: (a) in array 1, and (b) in array 4.

Figure 12.
Thermographic analysis with an incident of PV modules with open-circuit substrings: (a) aerial IR inspection, and (b) ground-level IR inspection.
Figure 12.
Thermographic analysis with an incident of PV modules with open-circuit substrings: (a) aerial IR inspection, and (b) ground-level IR inspection.

Figure 13.
Thermographic analysis (a) and image (b) with an incident of PV modules with solar reflection.
Figure 13.
Thermographic analysis (a) and image (b) with an incident of PV modules with solar reflection.

Figure 14.
Location and types of incidents in the PV plant after thermographic inspection, considering the identification matrix of Figure 4a.
Figure 14.
Location and types of incidents in the PV plant after thermographic inspection, considering the identification matrix of Figure 4a.


Table 1.
Summary of incidents detected during inspection.
| Incident Type | Affected PV Modules | Temperature Value (°C) | Irradiance Value (W/m2) | Temperature Value Extrapolated at 1000 W/m2 | Comment |
|---|---|---|---|---|---|
| Broken cover | AF6 | 55.6 | 890 | 61.2 | Required replacement of PV modules |
| E10 | 86.6 | 922 | 94.6 | ||
| AK11 | 89.6 | 940 | 97.9 | ||
| Partial shade | AL12 | 60.2 | 921 | 66.2 | Post |
| AV6 | 111.8 | 941 | 118.5 | Vegetation | |
| AQ4 | 49.6 | 941 | 54.6 | Vegetation | |
| AR4 | 49.6 | 941 | 54.6 | Vegetation | |
| AC12 | 77.5 | 945 | 85.3 | Post | |
| Several array 6 | - | - | - | Post | |
| PV module technology | All m-Si type PV modules | 63.5 | 944 | 69.9 | Measurement of max. temperature |
| Open circuit | String in arrays 1, 4 and 5 | 2 to 7 °C for operational PV modules | 2 to 7 °C for operational PV modules | Electrical verification required | |
| Open-circuit substrings | Many p-Si type PV modules | 2 to 7 °C for adjacent substring | - | 2 to 7 °C for adjacent substring | Electrical verification required |
Publisher’s Note: MDPI stays neutral with regard to jurisdictional claims in published maps and institutional affiliations. |
© 2022 by the authors. Licensee MDPI, Basel, Switzerland. This article is an open access article distributed under the terms and conditions of the Creative Commons Attribution (CC BY) license (https://creativecommons.org/licenses/by/4.0/).
Share and Cite
MDPI and ACS Style
Álvarez-Tey, G.; García-López, C. Strategy Based on Two Stages for IR Thermographic Inspections of Photovoltaic Plants. Appl. Sci. 2022, 12, 6331. https://doi.org/10.3390/app12136331
AMA Style
Álvarez-Tey G, García-López C. Strategy Based on Two Stages for IR Thermographic Inspections of Photovoltaic Plants. Applied Sciences. 2022; 12(13):6331. https://doi.org/10.3390/app12136331
Chicago/Turabian StyleÁlvarez-Tey, Germán, and Carmen García-López. 2022. "Strategy Based on Two Stages for IR Thermographic Inspections of Photovoltaic Plants" Applied Sciences 12, no. 13: 6331. https://doi.org/10.3390/app12136331
Note that from the first issue of 2016, this journal uses article numbers instead of page numbers. See further details here.