
A Review on the Commonly Used Methods for Analysis of Physical Properties of Food Materials

 ,
,  , ,
, ,  ,
,  and
and 
Abstract
:1. Introduction
2. Importance of Physical Analysis Methods in the Food Industry
3. Techniques for Non-Destructive Physical Methods
3.1. Ultrasonic Wave-Based Analysis
3.2. Young’s Modulus and Poisson’s Ratio
3.3. Compressibility Analysis through High-Pressure Processing (HPP)
4. Techniques for Mechanical Impact Assessment
4.1. Hertz Contact and Impact Measurement Parameters
4.2. Vibration Study and Mechanical Impact Based Method
5. Techniques for Texture Profile Analysis (TPA)
TPA Performance
6. Novel Techniques for Viscosity Analysis
6.1. Tomographic Velocity Profiling
6.2. Mass-Detecting Capillary Viscometer (MDCV)
6.3. Ultrasonic Doppler Velocimetry (UDV)
6.4. Reflectance Sensor
6.5. Ultrasonic Wave Propagation-Based Sensors
7. Emerging Techniques of Measurement of Firmness
7.1. Non-Destructive Impact-Based Measurements
7.2. Non-Destructive Microdeformation-Based Sensors
7.3. Vibration-Based Technique
7.4. Image-Analysis-Based Methods
7.5. Near-Infrared Spectroscopy (NIR)
7.6. Ultrasonic Wave Propagation Methods
7.7. Time-Resolved Diffuse Spectroscopy (TRS)
7.8. Nuclear Magnetic Resonance (NMR) Spectroscopy and Magnetic Resonance Imaging (MRI)
8. Techniques for Crispness Measurement
8.1. Mechanical Measurement of Crispness
8.2. Acoustic Measurement of Crispness
8.3. Ultrasonic Measurement of Crispness
9. Woolliness and Mealiness Measurement
9.1. Impact Response-Based Techniques
9.2. Detection Method Based on Quantity of Free Juice
9.3. Techniques Based on Imaging
9.4. Time-Resolved Reflectance Spectroscopy (TRS)
9.5. The Use of Modeling for Predicting Mealiness
9.6. Methods Based on Chlorophyll Fluorescence
10. X-ray Computed Tomography (CT)
11. MRI Technique

| Physical Property | Significance in Food Industry | Unit | Interpretation of Measured Data | Measurement Technique | Principle | Measured Property | Objective of Analysis | Reference |
|---|---|---|---|---|---|---|---|---|
| Water Activity (WA) | Assessment of internal structure of the food, effect on food texture and shelf-life assessment. | - | WA > 0.90 growth of bacteria; WA < 0.70 growth of molds inhibit; WA < 0.60 growth of most of the microorganisms inhibit | Water activity meter. | Ratio of the vapour pressure (VP) of the water in food and the VP of the pure water. | Equillibrium relative humidity | Quality characteristic measurement for Sugar and sugar replacers, Starch powders, Agar gels. | [1,112] |
| Hygroscopicity | Assessment of a food’s ability to absorb moisture. | - | Powdered food with high hygroscopicity likely to be clump formation with simultaneous increase in texture hardening | Hygrometers | Works on the concept of evaporative cooling. | Amount of moisture uptake by a specific fod material | Moisture sorption isotherm modeling for starch and wheat gluten, Corn starch, pepper | [113] |
| Mass | Measure for inertia and heaviness of a body. | kg/g/mg | - | Weighing balance. | A counteracting force is created to be compared to the unknown mass. | Quantity of matter | To meet product formulation standards and manufacturing specifications | [1] |
| Density | Mass per unit volume. | kg/m3 | >1 kg/m3 (at STP) food material will sink in water | Hydrometer | Displacement of its own weight within a fluid. | Mass and volume | Alcohol concentration of drinks; Solids in sugar syrups; Density, specific gravity and absorption of fine aggregate; Specific gravity of pigments. | |
| Specific Gravity | Ratio of the absolute density of a food material to the density of a reference material | - | Determines whether the solid food materials will sink or float in liquid medium | Specific gravity bottle | Liquid densities are measured by measuring the weight difference between an empty and filled bottle and dividing by an equal volume of water. | Density of food materials and water | ||
| Bulk Density | Density of powders like food materials which contain hollow spaces or voids filled with gas, normally air. | g/mL | High bulk density is desirable in terms of food transportation and packaging | - | By measuring the volume of a known mass of powder sample that may have been passed through a sieve into a graduated cylinder. | Determination of powdered food characteristics especially for grinding and spray drying process | ||
| Particle Size | Particles with a regular shape are characterized by their linear dimensions (lengths) along their principal axes. | m/cm/mm | Affect the flowability, solubility and reactivity, and the shelf life, processing condition, organoleptic properties and texture of the final product (e.g., sieving considered for >63 micron particles; sedimentation hindered when size <10 nm) | Particle Size Analyzer | The angle of incidence light scattering is inversely proportional to particle size. | Diameter | Texture and organoleptic characterisation of chocolate, fibres of grain, powdered food, and sizing of protein nano-fibres. | [114,115,116] |
| Specific Surface Area (S.A) | Quantification of internal surface area or size of individual particles within a disperse system | m2/kg or m2/g | Materials with 500–3000 m2/g S.A suitable for solute and gas absorption; 200 m2/g S.A suitable for catalyst | Brunauer-Emmett-Teller (BET) surface area analysis | Surface area | Mass and heat transfer calculation, gas and moisture permiability through packaging materials | ||
| Sphericity | Compactness compared with a perfect sphere of same dimension. | - | Sphericity value ≈ 1 (sphere), ≈0.00271 (cube), ≈0.00155 (cylinder) | Ratio of the surface area of an equal-volume sphere to the actual surface area of the particle. | Surface area and volume | Analysis and design of food process equipment | ||
| Sauter Diameter (SD) | Diameter of a hypothetical sphere with the same specific surface as the irregular shaped particle. | m/cm/mm/μm | Coarse particle (SD > 10 mm); fine particle ≈ 1 mm, ultrafine particle < 0.1 mm | Diameter gauge | Ratio of surface area and volume of particle | Surface area and volume | Grinding characteristics measurement for wheat grain and size reduction characterisation | |
| Uniaxial Stress | It is caused by a force pushing or pulling the body in a direction perpendicular to the surface of the solid body upon which the force is acting. | Pa | - | Strain gauge hole-drilling method | Deformation around the hole | Deformed area | Alginate gel: stress strain behavior and viscoelasticity. Fruit and vegetable puree products: rheological properties. Ketchup: hydrocolloids and flow behaviour. Powders: flow properties, nonflow problems. Wheat flour: rheological properties using farinograph, extensograph, valorigraph, alveograph device. | [117,118,119,120,121,122] |
| Young’s Modulus | It is the slope of the linear part of the stress-strain curve for a material under tension or compression. | - | Addition fat reduces the young’s modulus i.e., the decrease in rigidity. The harder is the food material the higher is the young’s modulus | Oscillating rod | Estimated with the help of stress-strain curve. | Alteration in length, and uniaxial stress | ||
| Bulk Modulus | The relative change in the volume of a body produced by a unit compressive or tensile stress acting uniformly over its surface. | Pa | - | The measure of the ability of a substance to withstand changes in volume when under compression on all sides. It is equal to the quotient of the applied pressure divided by the relative deformation. | Pressure and volume | |||
| Shear Modulus | It is the resulting stress When a force is acting parallel to a surface. | Pa | The higher the shear modulus the higher is the rigidity of the food material | - | - | Pressure and strain | ||
| Newtonian Flow | linear relationship between shear stress (SS) and resulting shear rate (SR). | - | Reynolds no (NR) <2000; visosity not change with applied force | Ball viscometer | Elapsed time for the ball to fall under gravity | Flow behaviour of liquid food materials for process design, quality measure and flexible container design | ||
| Non-Newtonian Flow | non-linear relationship between SS and SR. | - | NR >2000; visosity change with applied force | Brookfield viscometer | Torque | |||
| Interfacial Surface Tension (IST) | It is the force of attraction between the molecules at the interface of two fluids. | N/m | Emulsion stability increases with the IST | Force tensiometer | Du Noüy ring method; Wilhelmy plate method | Force and length | Foam stability of ice-cream; Physical properties of chocolate | [123] |
| Permeability | Quantification of the relative ease with which a transporting substance can pass through the material. | m2/s-Pa | Lower the permeability of the packaging material lower will be the shelf life of the food product | Helium Permeability Meter | Pressure, mass | Undertanding the moisture transfer phenomenon during drying of fruits; mass tranfer phenomenon in lactose crystallization, Whey-protein-coated plastic films; design of pulse electric and ohmic heat process. | [124,125,126,127] | |
| Conductivity | It can be defined as a measure of electrical conduction. | Siemens per meter (S/m) | Efficiency of pulsed electric and ohmic heat proces is depend on conductivity of food materials | conductivity meter | It is the ability of a material to conduct electric current. | Resistivity | ||
| Resistance | It is a measure of the opposition to current flow in an electrical circuit. | Ohm (Ω) | Juiciness and tenderness of meat products are correlated with the resistance | Ohmmeter | Deflection of pointer to left or right side in ohmmeter due to current passing through it indicate low/high resistance. | |||
| Heat capacity (HC) | Thermal property that indicates the ability of the material to hold and store heat. | Joule per Kelvin(J/K) | Food materials with high HC have more energy and take higher cooking time | Differential scanning calorimeter | The difference in the amount of heat required to increase the temperature of a sample and reference are measured as a function of temperature. | change in temperature, heat flow/unit time | Characterization and understanding of thermo physical properties for meat; modelling thermal properties for cheddar cheese; prediction of thermal properties during freezing and thawing for meat and dough; thermal conductivity and heat capacity for shrimp; investigation for thermal properties of ice-cream and heat conductivity of food materials | [128,129,130] |
| Thermal conductivity | Heat transfer ability of food | Watts per meter-Kelvin (W/(m⋅K) | It dictates how quickly heat may be evenly distributed throughout the food mass, affecting the quality of the end product. | Thermal conductivity meter (The two types of thermal conductivity meter are steady-state and non-steady-state, also called transient, conductivity meters) | Steady state (when the temperature of the substance being measured remains constant over time), frequency (sensor and hot-wire based method), and time domain (During the heating up phase, transient approaches take measurements) techniques. | Amount of heat transfer, change in temperature, surface area of food material | ||
| Thermal diffusivity (TD) | It is the thermal conductivity divided by density and specific heat capacity at constant pressure. | Square metres per second (m2 s−1) | Most of the food materials lies within the range of 1.05 × 10⁷ m2 s−1 (apple juice) to 1.82 × 10⁷ m2 s−1 (peas). Higher the TD the lower time will require to cool or heat the product | Discovery Flash Diffusivity instruments | - | Density, specific heat capacity, thermal conductivity | ||
| Calorific value (CV) | Heat generated due to complete combustion of specified quantity at constant pressure under normal conditions. | kJ/kg | 4 kcal/g for carbohydrate and protein and 9 kcal/g for fat, higher the CV higher is the energy content of the food | Bomb Calorimeter | Energy released by burning a representative sample in a high- pressure oxygen atmosphere within a metal pressure vessel or “bomb” absorbed within the calorimeter and the resulting temperature change within the absorbing medium is noted. | Increase in temperature | ||
| Capacitance | capacity of a component to collect and store energy in the form of an electrical charge. | Farad (F) | capacitance meter | The capacitance meter works based on the directly proportional relationship between capacitance and a time constant. | Voltage | Fish quality measurement using electrical properties and Monitoring microbial growth | [131,132,133] | |
| Inductance | Ability of an inductor to store energy. | Henry (H) | LCR meter | - | Cross sectional area, length and current | |||
| Paramagnetism | Weakly attachment towards magnetic fields. | - | If the total number of electrons in a molecule is 10 and 16, or odd, the molecule is paramagnetic. | - | - | Electron configuration | On-line water content during cooking for rice; NMR imaging during drying process of noodles; meat muscle characterization, water binding, freezing by NMR for meat | [134] |
| Diamagnetism | Magnetic property assesment | - | If the total number of electrons in a molecule is even except 10 and 16 the molecule is paramagnetic. | - | Change in the motion of electrons upon application of magnetic field | Electron configuration | ||
| Ferromagnetism | Strong attachment towards magnetic fields. | - | - | - | Electron configuration | |||
| Electric polarization | Separation of centre of positive charge and the centre of negative charge in a material with help of high-electric field. | Coulomb per square metre (C·m−2) | It influence the dielectric heating of food materials | Polarimeter | - | Dipole moment | Sequential treatment of drinking water with UV and ozone; combined treatment of pulsed light and to inactivate microorganism;pulsed UV treatment of milk; gelling temperature investigation of gelling gels, rheologic and dielectric properties; analytical fingerprinting with spectroscopic techniques for butter and margarine; identifying coffee arabica, robusta and blends by NIRS. | [135,136,137,138,139] |
| Refractive index | Ratio of the velocity of light in a vacuum to the velocity of light in a material. | - | Higher refractive index refers to higher total soluble solid content | Refractometer | The concentration of a particular substance within a given solution is measured. It operates based on the principle of refraction. When rays of light pass from one medium into another, they are bent either toward or away from a normal line between the two media. | Angle of refraction | Measure for concentration and purity of food materials | |
| Colour | Sensory attribute | TCU (True Color Unit) | L = 0 (black), = 100 (white); a = +ve (red) = −ve (green); b = +ve (yellow), = −ve (blue) | Colorimeter | It is based on Beer-Lambert’s law, according to which the absorption of light transmitted through the medium is directly proportional to the medium concentration. | Concentration or intensity of colour | standardising and checking of ingredient colour allows them to maintain control over the colour of their final goods and analyse colour changes during manufacturing, transit, and preservation. |
| Food System | Techniques | Key Feature | Quality Attribute | Application | Reference |
|---|---|---|---|---|---|
| Fruits and Vegetables | Computer vision system | Non-invasive and rapid method | Shape, size, mass, volume, colour, texture, external damages, calyxes. | Indian gooseberry, Mushroom | [65,140,141,142,143] |
| Air pycnometer | Boyle- Mariotte law; Time consuming process | Volume | Grape | [144] | |
| Optical ring sensor | Light-blocking-based system (LBB) | Size | Potato | [145,146] | |
| Volume | Zucchinis, cucumbers | [147,148] | |||
| Orthonormal imaging | Orthonormal algorithms | Volume | Carrot | [149] | |
| Imaging | 3D surface modeling | Mass and volume | Tomatoes, carrot, apple | [150] | |
| Volume intersection | Irregular shape determination, cost effective | Volume, surface area | Tomatoes, apples | [151] | |
| Machine vision system artificial retina, photo sensor | Digital image analysis is not required | Volume | Eggplant, orange | [152] | |
| Radiometer | Adequate for prolate fruits | Size | Jalapeño | [149] | |
| Hyperspectral imaging | Weight | Pepper | [153] | ||
| Hydrometer | Cost effective | Specific gravity | Potato | [154] | |
| NIR spectroscopy | Non-destructive | Specific gravity | Pinus taeda | [155] | |
| Particle size analyzer | Diffraction angle-based measurement | Particle size | |||
| Propeller driven | Conventional method | Stickiness | Mango, coffee, tomato soup powder, | [156] | |
| Glass transition temperature | Indirect method | Stickiness | Coffee, food powder | [157,158] | |
| Texture analyzers | Stress-to-strain ratio | Texture profile, hardness, cohesiveness, adhesiveness, etc. | Asparagus | [159] | |
| Vibration measurements | Probe driven by electromagnetic energy and microphone-based technique | Firmness | Tomato | [160] | |
| Acoustic measure | 0–50 Hz, >1000 Hz frequency analysis | Texture profile | Cucumber | [161] | |
| Impact response | Low-mass impact sensor, capturing of impact signal | Firmness | Tomato | [153] | |
| Micro deformation sensors | Force deformation curve, compression deformation | Firmness | Tomato | [162] | |
| Ultrasonic wave propagation | Continuous-touch ultrasonic system | Firmness | Tomato, apple | [163,164] | |
| Nuclear magnetic resonance | Cost extensive | Morphological, physical parameters, thickness | |||
| X-ray computed tomography | Non-destructive, microstructure analysis is possible, online inspection friendly | Overall quality, maturity | Sweet potato | [165] | |
| Fluorescence | Rapid, reliable, non-destructive | Texture, colour | Broccoli | [166] | |
| Time-resolved diffuse reflectance spectroscopy | Non-destructive | Texture | Tomato | [167] | |
| Laser-scattering imaging | Non-destructive | Firmness | Tomato | [168] | |
| Friction force microscope, atomic force microscopy, tribometer, contact profilometry, surface force apparatus | Surface contacting techniques | Surface texture | Potato | [169] | |
| Confocal laser scanning microscopy, fiber-optic reflectometer, gloss meter, surface glistening points method, angle-resolved light scattering | Non surface contacting techniques | Surface texture (average roughness, root-mean square roughness, average slope of surface asperities, peak to valley height) | Tomato pulp | [170] | |
| Near infrared (IR) technique | Hyperspectral imaging technique | Scattering and absorbance properties | Zucchini squash, tomatoes, cucumbers | [171] | |
| Resonant cavity method | Important for modelling of Microwave drying | Loss factor, dielectric constant | Garlic | [172] | |
| Thermistor-based method | Traditional method | Thermal conductivity | Potato | [173] | |
| CT meter | Easy operate | Thermal Diffusivity, thermal conductivity | Onion powder | [174] | |
| High-speed IR camera | Rapid, non-destructive | Thermal Diffusivity, thermal conductivity | Onion | [175] | |
| Cereal Product | Numerical methods (NM) | Better insight to predict anomalies that are difficult to predict using analytical approaches since it can only answer a few (2 to 3) unknown variables, whereas NM can do much more. | The grain-to-wall friction coefficient, internal friction angle, specific weight | Silo design | [176] |
| Triaxial test, uniaxial compression test | Modulus of elasticity | Cereal grain | [177] | ||
| Acoustic method | Estimation of acoustic shear wave | Modulus of elasticity | Cereal grain | [178] | |
| Computed tomography (CT), ultrasound, electrical tomography (ET), MRI | Non-destructive technique | Perimeter, Elongation, Area, compactness, maximum width, maximum length, | Barley, rice | [179] | |
| Scanning electron microscopy (SEM), confocal laser scanning microscopy | Stereospecific vision, higher magnification and resolution | Microstructure | Rice, wheat | [180] | |
| Manometric, gravimetic, hygrometric | Manual process, frequent calibration is required, not work properly at frost point | Equilibrium moisture content, moisture sorption isotherms (MSI) | Rice, grain, barley | [181] | |
| Dynamic vapour sorption | Gravimetric technique, water vapour and organic solvent can be used | Equilibrium moisture content | Mushroom | [182] | |
| Gravimetric method | Time consuming, the ion to be investigated should be fully precipitated. It must be a pure chemical that forms the precipitate. Filtration of the precipitate should be simple. The precipitate should have a low solubility and a high purity. | Water diffusivity | Cereal grain | [183,184] | |
| MRI, Diffusion-weighted imaging | Noninvasive | Water diffusivity | Cereal grain | [185] | |
| Farinograph, mixograph | Torque measurement, mixing property | Development time, Water absorption, Degree of softening, Stability | Dough | ||
| Consistograph | Pressure measurement, mixing property | Stability | Dough | ||
| Extensigraph | Uniaxial resistance to extension, Deformation Behavior | Energy, extensibility ratio, tenacity | Dough | ||
| Alveograph | Biaxial resistance to extension, Deformation Behavior | Extensibility Ratio, Work of deformation Tenacity, | Dough | ||
| Amylograph, Viscograph, Falling number, Rapid Visco-analyser, Mixolab | Apparent viscosity, Pasting Properties | Gelatinization properties, Amilase activity | Dough | ||
| Continuous progressive compression | At a constant amplitude of vibration, the sample was gradually compressed. On the compression curve, the compression force at the instant when the plunger distorted the grain was continually recorded. | Hardness, stickiness | Rice, wheat, noodles and bread | [186,187] | |
| Jet impingement, microwave-jet impingement, microwave-infrared, SEM, liquid extrusion porosimetry, volume displacement, pycnometry | Fraction of closed, total porosity, pore size distributions, blind and flow-through pores | Bread | [188] | ||
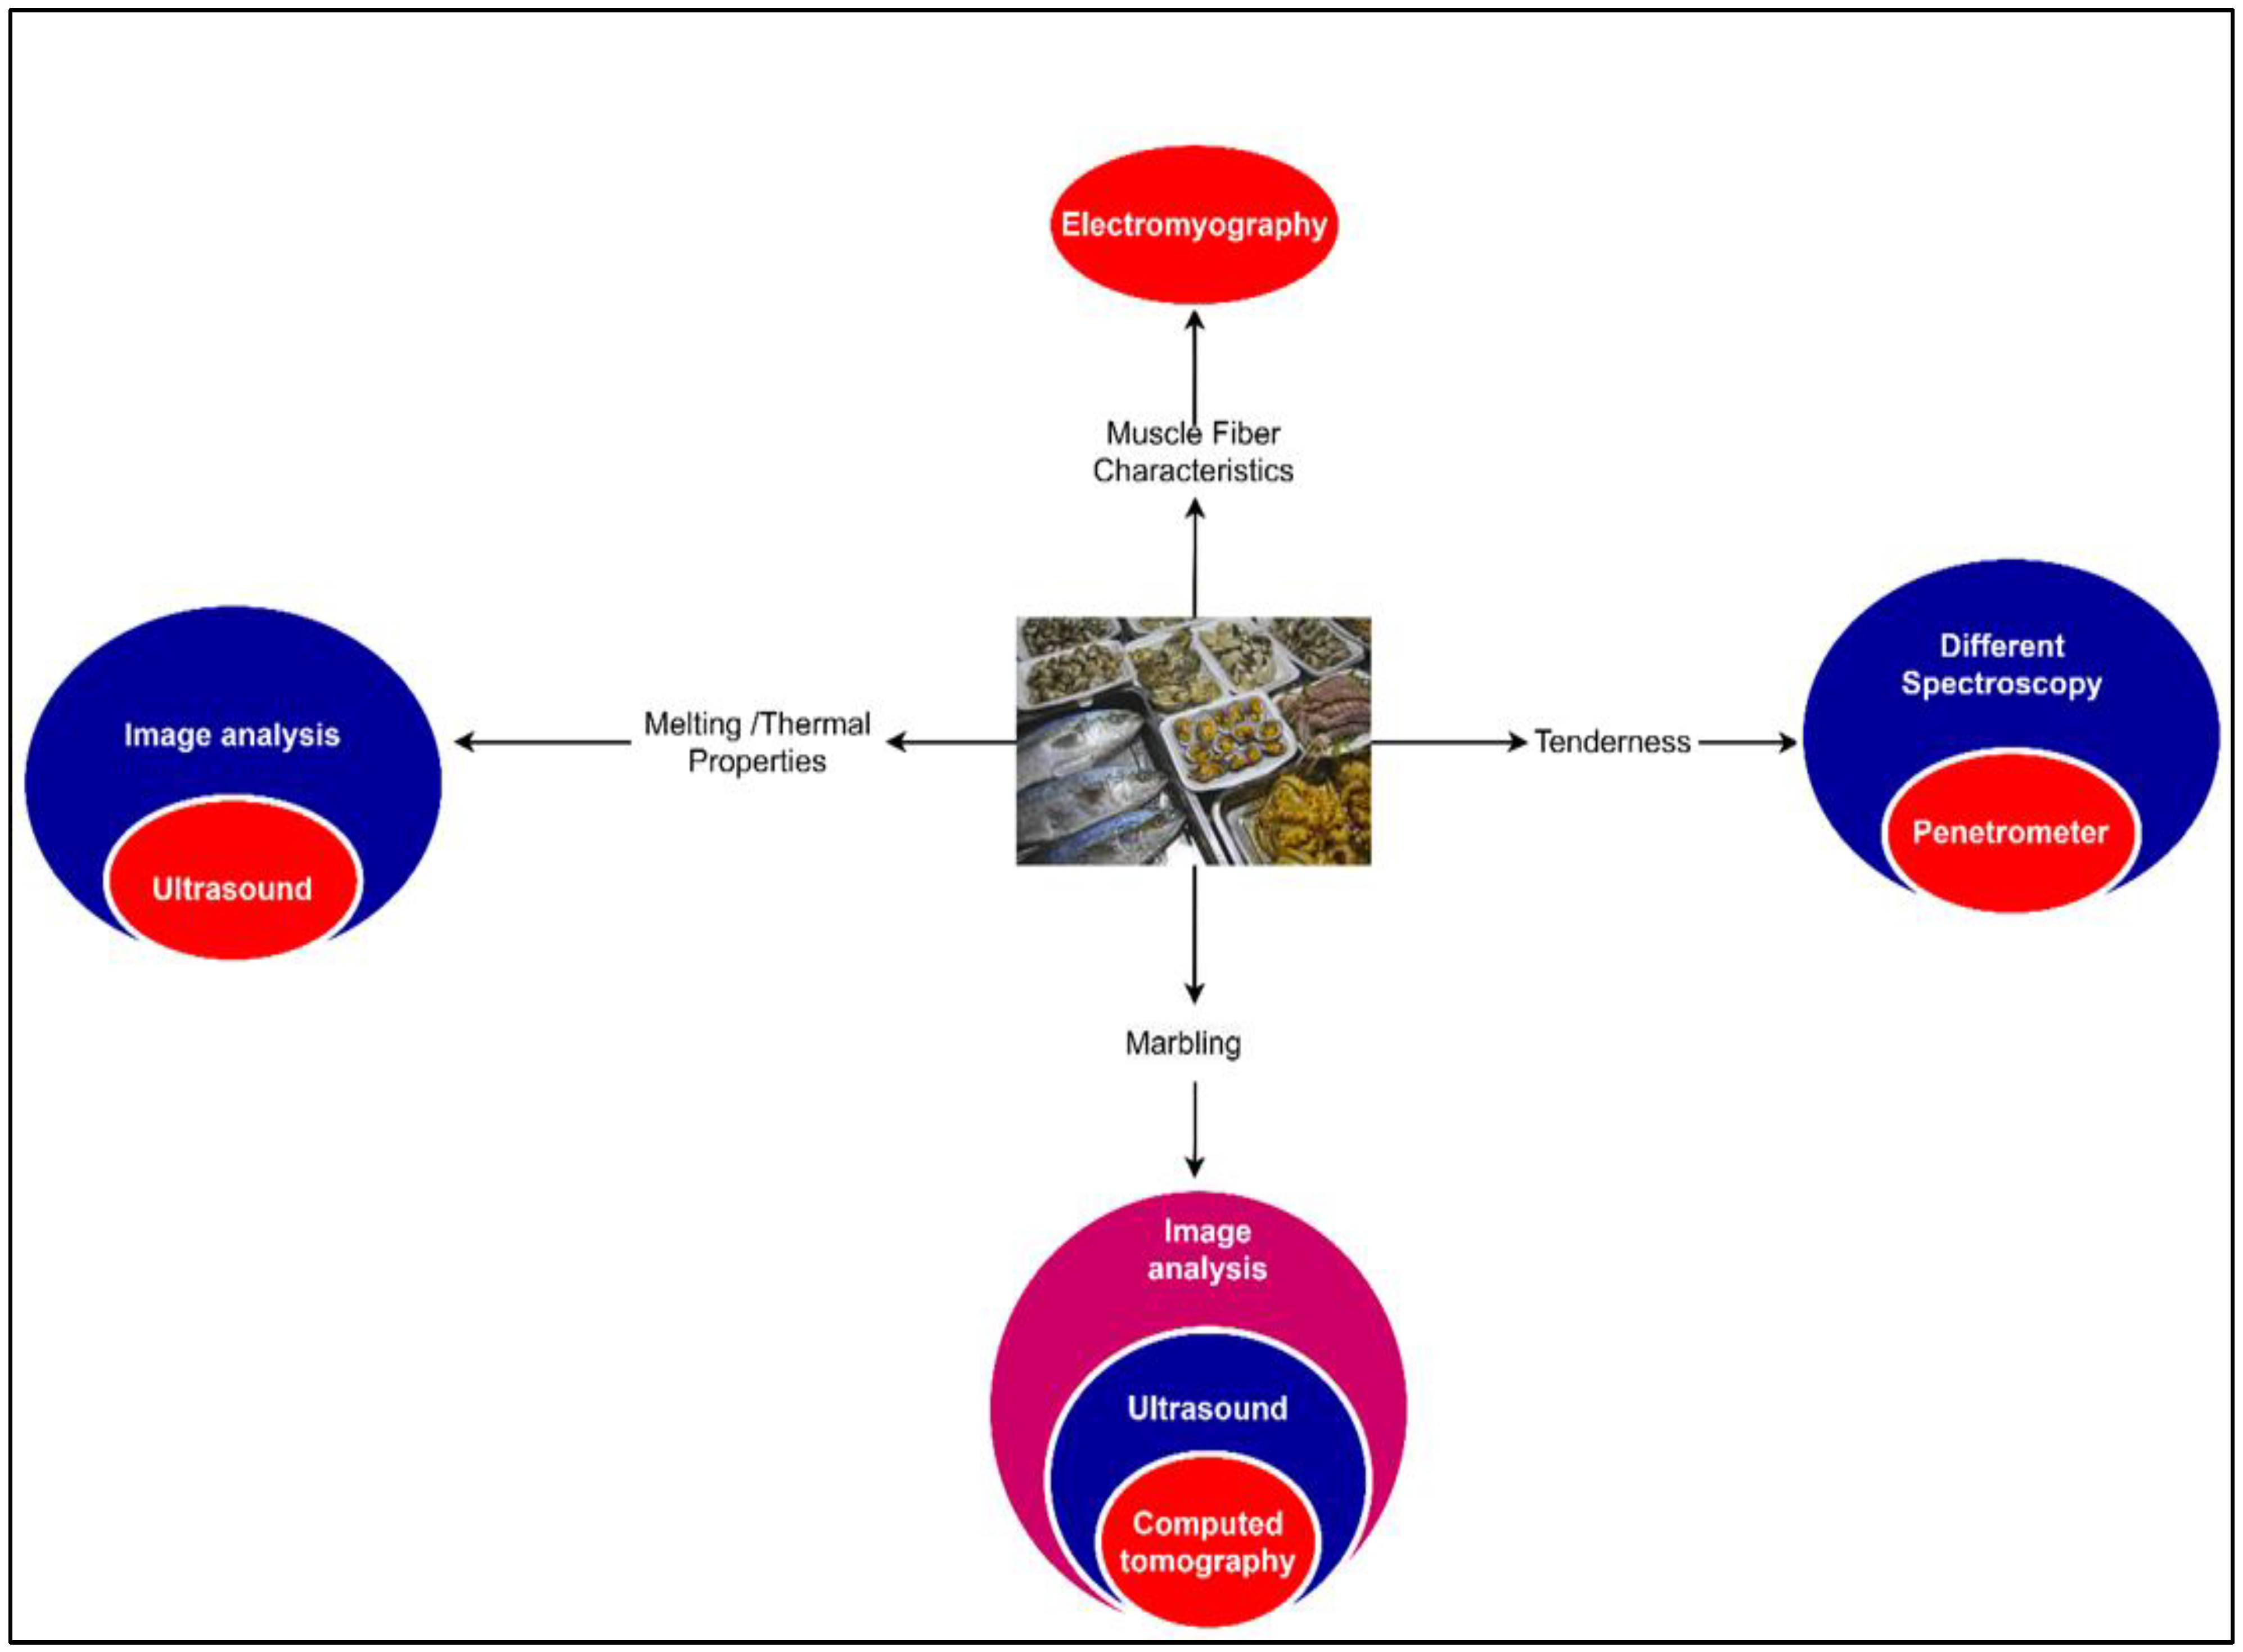
| Meat, Fish and Poultry | Surface electromyography | Recording of electrical signal | Muscle fiber composition and diameter | Lamb, pig | [189] |
| Image analysis, video image analysis | Non-invasive | Colour, curvature, angle, volume, linear measurements, marbling | Beef | [190,191] | |
| Ultrasound | Non-invasive | Marbling, longissimus muscle | Beef | [192] | |
| Spectrophotocolorimeter, colorimeter | Color Reflectance, for external colour | Lightness, redness, yellowness, chroma, hue | Beef | [193] | |
| Optic probes | For internal colour | Lightness, redness, yellowness, chroma, hue | Beef | [194] | |
| Visible and near-infrared spectroscopy | Non-destructive | Tenderness | Beef | [195] | |
| Bioelectrical impedance analysis, electrical conductivity, magnetic inductance technology | Non-destructive | Fat and lean content | Lamb | [196] | |
| X-ray CT | Lower cost alternative | Average density and area | [197] | ||
| Warner-Bratzler shear force (cooked meat), compression test (raw meat), Texture Analyzer | Invasive method | Rheological properties | Beef | [198] | |
| Beefcam | Simplified, useful in commercial application | Tenderness | Beef | [199] | |
| Optical reflectance | Measurement of physical characteristics | Tenderness | Beef | [200] | |
| Bite tests, penetrometry, tensile test | Invasive method | Tenderness | Beef | [201] | |
| Digital image analysis | Non-invasive method | Surface texture, Colour, marbling | Beef | [202] | |
| X-ray microtomography | Non-invasive method | Intramuscular fat | Beef | [107] | |
| Hyperspectral imaging | Non-invasive method | Colour, marbling, drip loss | Pork | [203] | |
| Viscometer | Fluid friction measurement | Viscosity | Low-fat meat batters | [204] | |
| Finite element method | Computer simulation model | Thermal conductivity | Meat emulsion | [205] | |
| Image analysis | Non-invasive method | Visual appearance, taste, texture | Ham | [206] | |
| Lacunarity analysis, variogram | Non-invasive method | Fat-connective tissue, pores | Ham | [206] | |
| NIR spectroscopy | Provide results closer to true quantitative value and fast method | Brightness, oiliness | Iberian pig fat | [207] | |
| Differential scanning calorimetry | Non-invasive and fast method | Melting properties, thermal behaviour | Dry cured ham | [208] | |
| Dairy product | Static light scattering (Malvern Mastersizer) | Measurement of refractive index | Particle size | Milk powder | [209] |
| Powder tester | Cohesion, Compressibility, Packed, and Bulk densities, angle of spatula, angle of repose | Milk powder | [210] | ||
| Micromeritis pycnometer | Measured by the change in gas pressure | Density and volume | Milk powder | [211] | |
| Shear cell technique | Traditional method | Wall friction, internal friction, flow function | Milk powder | [212] | |
| Annular shear cell | Effective angle of internal friction, flow function | Milk powder | [209] | ||
| Angle of repose | Static measure of relative flowability | Flow function | Milk powder | [213] | |
| Pneumatic techniques | Direct method | Cohesiveness, adhesiveness, sticky-point temperature | Milk powder | [214] | |
| Propeller-driven method | Simple, easy to use | Sticky-point temperature | Milk powder | [215] | |
| Ampule method | Simple, easy to use | Surface caking temperature | Milk powder | [216] | |
| Unconfined yield test | Simple, easy to use | Cohesiveness | Milk powder | [217] | |
| Viscometer technique | Provide results closer to true quantitative value and simple | Stickiness, torque | Milk powder | [215] | |
| Force–displacement cake strength determination | Easy to use | Caking strength | Milk powder | [209] | |
| Particle-gun method | Venturi funnel arrangement | Stickiness | Milk powder | [218] | |
| Fluidized bed rig | Easy to use | Sticky-point | Milk powder | [219] | |
| Cyclone test | Rotary motion generation | Stickiness | Milk powder | [220] | |
| Thermal mechanical compression test | Thermal compression test | Glass–rubber transition | Milk powder | [214] | |
| Rheometer | Rheological technique | Glass–rubber transition | Milk powder | [221] | |
| Static and dynamic wetting tests | Easy to use | Wettability | Milk powder | [213] | |
| Rehydration method, NMR relaxometry | Simple, easy to use | Solubility index | Milk powder | [210] | |
| Confocal scanning laser microscopy, SEM, X-ray photoelectron spectroscopy | Stereospecific vision, higher magnification and resolution | Microstructure | Milk powder | ||
| Melting thermogram | Easy to use | Melting behaviour | Butter | [222] | |
| Nmr | On-line phase transition monitoring | Phase transition temperature | Cream | [223] | |
| Ultrasonic velocimetry, pulsed NMR, ultrasonic spectrometry | Online crystallization process monitoring | Solid fat content | Anhydrous milk fat | [120] | |
| Penetrometry test | Easy to use | Textural property, Adhesiveness | Butter | [222] | |
| Texture analyzer with a rig | Easy to use | Spreadability | Butter | [224] | |
| Parallel plate rheometer, scraper-rheometer | Easy to use | Viscoelasticity | Butter | [222] | |
| X-ray diffraction | Non-invasive method | Crystallinity | Butter | [225] | |
| Brookfield viscosity | [226] | ||||
| Drainage | Spontaneous, easy to use | Water-holding capacity | Butter | [226] | |
| Oscillatory rheometry, viscosity, turbidity, dynamic light scattering, thromboelastography, electrical conductivity, vibrational viscometry, thermal conductivity near-infrared spectroscopy, refractometry, diffusing wave spectroscopy, microscopy, electroacoustics, fluorescence spectroscopy and low- and high-frequency ultrasound | Rapid | Curd setting, textural property | Cheese | [227] | |
| Bending test, Puncture, wire cutting test, dynamic and transient oscillation, uniaxial compression, cone penetration, torsion | Rapid | Springiness, hardness, cohesiveness, adhesiveness | Cheese | [209] | |
| Centrifugation, gravity loss | Higher variability between results | Water retention capacity | Cheese | [228] | |
| Cryo SEM, fluorescence microscopy | Stereospecific vision, higher magnification and resolution | Microstructure | Ice-cream | [229] |
12. Conclusions
Author Contributions
Funding
Institutional Review Board Statement
Informed Consent Statement
Data Availability Statement
Acknowledgments
Conflicts of Interest
References
- Figura, L.O.; Teixeira, A.A. Food Physics: Physical Properties—Measurement and Applications; Springer: Berlin, Germany, 2010; p. 550. [Google Scholar]
- Berk, Z. Physical properties of food materials. Food Process Eng. Technol. 2018, 8, 1–29. [Google Scholar] [CrossRef]
- Joardder, M.U.H.; Karim, A.; Kumar, C.; Brown, R.J. Food as a Material; Springer: Berlin, Germany, 2016; pp. 5–13. [Google Scholar] [CrossRef]
- Bhuyan, M. Measurement and Control in Food Processing; CRC Press: Boca Raton, FL, USA, 2006; pp. 1–340. [Google Scholar] [CrossRef]
- Gebremariam, M.K.; Vaqué-Crusellas, C.; Andersen, L.F.; Stok, F.M.; Stelmach-Mardas, M.; Brug, J.; Lien, N. Measurement of availability and accessibility of food among youth: A systematic review of methodological studies. Int. J. Behav. Nutr. Phys. Act. 2017, 14, 1–19. [Google Scholar] [CrossRef] [PubMed] [Green Version]
- Maxwell, A.L.; Gardiner, E.; Loxton, N.J. Investigating the relationship between reward sensitivity, impulsivity, and food addiction: A systematic review. Eur. Eat. Disord. Rev. 2020, 28, 368–384. [Google Scholar] [CrossRef] [PubMed]
- Sarkar, T.; Salauddin, M.; Pati, S.; Chakraborty, R.; Shariati, M.A.; Rebezov, M.; Ermolaev, V.; Mirgorodskaya, M.; Pateiro, M.; Lorenzo, J.M. The Fuzzy Cognitive Map–Based Shelf-life Modelling for Food Storage. Food Anal. Methods 2021, 14, 147. [Google Scholar] [CrossRef]
- Steele, D.J.; McFarlane, I. Process measurement in the food industry—1. Meas. Control 1981, 14, 24–28. [Google Scholar] [CrossRef]
- Soltanali, H.; Khojastehpour, M.; Torres Farinha, J. Measuring the production performance indicators for food processing industry. Measurement 2021, 173, 108394. [Google Scholar] [CrossRef]
- Perrot, N.; Trelea, I.C.; Baudrit, C.; Trystram, G.; Bourgine, P. Modelling and analysis of complex food systems: State of the art and new trends. Trends Food Sci. Technol. 2011, 22, 304–314. [Google Scholar] [CrossRef]
- Joardder, M.U.H.; Kumar, C.; Karim, M.A. Food structure: Its formation and relationships with other properties. Crit. Rev. Food Sci. Nutr. 2017, 57, 1190–1205. [Google Scholar] [CrossRef]
- Toth, A.; Rendall, S.; Reitsma, F. Resilient food systems: A qualitative tool for measuring food resilience. Urban Ecosyst. 2016, 19, 19–43. [Google Scholar] [CrossRef]
- Guiné, R.P.F.; Florença, S.G.; Barroca, M.J.; Anjos, O. The Link between the Consumer and the Innovations in Food Product Development. Foods 2020, 9, 1317. [Google Scholar] [CrossRef]
- Nesvadba, P.; Houška, M.; Wolf, W.; Gekas, V.; Jarvis, D.; Sadd, P.A.; Johns, A.I. Database of physical properties of agro-food materials. J. Food Eng. 2004, 61, 497–503. [Google Scholar] [CrossRef]
- Tunick, M.H.; Onwulata, C.I. Physical Methods in Food Analysis; American Chemical Society: Washington, DC, USA, 2014. [Google Scholar]
- Joslyn, M. Methods in Food Analysis: Physical, Chemical, and Instrumental Methods of Analysis; Academic Press: San Diego, CA, USA, 1970. [Google Scholar]
- Rajput, H.; Rehal, J.; Goswami, D.; Mandge, H.M. Methods for Food Analysis and Quality Control. In State-of-the-Art Technologies in Food Science: Human Health, Emerging Issues and Specialty Topics; Apple Academic Press: Palm Bay, FL, USA, 2019; pp. 299–346. [Google Scholar]
- Bélanger, J.M.R.; Bissonnette, M.C.; Jocelyn Paré, J.R. Chapter 1 Chromatography: Principles and applications. In Instrumental Methods in Food Analysis; Paré, J.R.J., Bélanger, J.M.R., Eds.; Elsevier: Amsterdam, The Netherlands, 1997; Volume 18, pp. 1–35. ISBN 978-0-444-81868-3. [Google Scholar]
- García-Cañas, V.; Simó, C.; Herrero, M.; Ibáñez, E.; Cifuentes, A. Present and Future Challenges in Food Analysis: Foodomics. Anal. Chem. 2012, 84, 10150–10159. [Google Scholar] [CrossRef] [PubMed] [Green Version]
- Cifuentes, A. Food Analysis: Present, Future, and Foodomics. ISRN Anal. Chem. 2012, 2012, 801607. [Google Scholar] [CrossRef] [Green Version]
- Dzantiev, B.B.; Byzova, N.A.; Urusov, A.E.; Zherdev, A.V. Immunochromatographic methods in food analysis. TrAC Trends Anal. Chem. 2014, 55, 81–93. [Google Scholar] [CrossRef]
- Majid, I.; Nayik, G.A.; Nanda, V. Ultrasonication and food technology: A review. Cogent Food Agric. 2015, 1, 1071022. [Google Scholar] [CrossRef]
- Yildiz, F.; Özdemir, A.T.; Uluışık, S. Evaluation Performance of Ultrasonic Testing on Fruit Quality Determination. J. Food Qual. 2019, 2019, 6810865. [Google Scholar] [CrossRef]
- Mizrach, A. Assessing plum fruit quality attributes with an ultrasonic method. Food Res. Int. 2004, 37, 627–631. [Google Scholar] [CrossRef]
- Mizrach, A. Ultrasonic technology for quality evaluation of fresh fruit and vegetables in pre- and postharvest processes. Postharvest Biol. Technol. 2008, 48, 315–330. [Google Scholar] [CrossRef]
- Ross, K.A.; Pyrak-Nolte, L.J.; Campanella, O.H. The use of ultrasound and shear oscillatory tests to characterize the effect of mixing time on the rheological properties of dough. Food Res. Int. 2004, 37, 567–577. [Google Scholar] [CrossRef]
- Li, C.; Zheng, Y.; Kwabena, A. Prediction of IMF Percentage of Live Cattle by Using Ultrasound Technologies with High Accuracies. In Proceedings of the 2009 WASE International Conference on Information Engineering, Taiyuan, China, 10–11 July 2009; Volume 2, pp. 474–478. [Google Scholar]
- Hæggström, E.; Luukkala, M. Ultrasound detection and identification of foreign bodies in food products. Food Control 2001, 12, 37–45. [Google Scholar] [CrossRef]
- Awad, T.S.; Moharram, H.A.; Shaltout, O.E.; Asker, D.; Youssef, M.M. Applications of ultrasound in analysis, processing and quality control of food: A review. Food Res. Int. 2012, 48, 410–427. [Google Scholar] [CrossRef]
- Gallo, M.; Ferrara, L.; Naviglio, D. Application of Ultrasound in Food Science and Technology: A Perspective. Foods 2018, 7, 164. [Google Scholar] [CrossRef] [PubMed] [Green Version]
- Ogawa, Y.; Matsuura, M.; Yamamoto, N. Young’s Modulus and Poisson’s Ratio Changes in Japanese Radish and Carrot Root Tissues during Boiling. Int. J. Food Prop. 2015, 18, 1006–1013. [Google Scholar] [CrossRef]
- Fauzi, N.A.; Farid, M.M.; Silva, F. An insight on the relationship between food compressibility and microbial inactivation during high pressure processing. J. Food Sci. Technol. 2017, 54, 802–809. [Google Scholar] [CrossRef] [PubMed] [Green Version]
- Torrico, D.D.; Hutchings, S.C.; Ha, M.; Bittner, E.P.; Fuentes, S.; Warner, R.D.; Dunshea, F.R. Novel techniques to understand consumer responses towards food products: A review with a focus on meat. Meat Sci. 2018, 144, 30–42. [Google Scholar] [CrossRef]
- Ojolo, J.S.; Eweina, B.A. Predicting cashew nut cracking using hertz theory of contact stress. J. Saudi Soc. Agric. Sci. 2019, 18, 157–167. [Google Scholar] [CrossRef]
- Li, Z.; Miao, F.; Andrews, J. Mechanical Models of Compression and Impact on Fresh Fruits. Compr. Rev. Food Sci. Food Saf. 2017, 16, 1296–1312. [Google Scholar] [CrossRef] [Green Version]
- Felföldi, J.; Kertész, I.; Nagy, D.; Zsom-Muha, V. Non-destructive impact method for quality assessment of horticultural products. Prog. Agric. Eng. Sci. 2017, 13, 69–93. [Google Scholar] [CrossRef]
- Khodabakhshian, R.; Hassani, M. The study and comparison of elastic modulus of pineapple fruit in macroscopic and microscopic modes. Microsc. Res. Tech. 2021, 84, 1348–1357. [Google Scholar] [CrossRef]
- Walkowiak-Tomczak, D.; Idaszewska, N.; Łysiak, G.P.; Bieńczak, K. The Effect of Mechanical Vibration during Transport under Model Conditions on the Shelf-Life, Quality and Physico-Chemical Parameters of Four Apple Cultivars. Agronomy 2021, 11, 81. [Google Scholar] [CrossRef]
- Eissa, A.H.A.; Albaloushi, N.S.; Azam, M.M. Vibration analysis influence during crisis transport of the quality of fresh fruit on food security. Agric. Eng. Int. CIGR J. 2013, 15, 181–190. [Google Scholar]
- Wu, D.; Sun, D.-W.; He, Y. Novel non-invasive distribution measurement of texture profile analysis (TPA) in salmon fillet by using visible and near infrared hyperspectral imaging. Food Chem. 2014, 145, 417–426. [Google Scholar] [CrossRef]
- Breene, W.M. Application of texture profile analysis to instrumental food texture evaluation. J. Texture Stud. 1975, 6, 53–82. [Google Scholar] [CrossRef]
- Kwon, B.S.; Lee, J.H.; Lee, K.Y.; Kim, S.J. Sensory evaluation and texture of commercial dairy and vegan types of Cheddar cheese. Korean J. Food Sci. Technol. 2021, 53, 585–592. [Google Scholar]
- Zheng, Y.; Liu, Z.; Mo, B. Texture Profile Analysis of Sliced Cheese in relation to Chemical Composition and Storage Temperature. J. Chem. 2016, 2016, 8690380. [Google Scholar] [CrossRef] [Green Version]
- Zdunek, A.; Cybulska, J. Relation of biospeckle activity with quality attributes of apples. Sensors 2011, 11, 6317–6327. [Google Scholar] [CrossRef]
- Rosenthal, A.J. Texture profile analysis—How important are the parameters? J. Texture Stud. 2010, 41, 672–684. [Google Scholar] [CrossRef]
- Peleg, M. The instrumental texture profile analysis revisited. J. Texture Stud. 2019, 50, 362–368. [Google Scholar] [CrossRef]
- Krol, K.; Niderla, K.; Dmowski, A.; Cichorzewska, M. Industrial Tomography Platform for Diagnostics and Control of the Crystallization Process. Eur. Res. Stud. J. 2021, XXIV, 587–596. [Google Scholar] [CrossRef]
- Cullen, P.J.; Duffy, A.P.; O’Donnell, C.P.; O’Callaghan, D.J. Process viscometry for the food industry. Trends Food Sci. Technol. 2000, 11, 451–457. [Google Scholar] [CrossRef]
- Choi, Y.J.; Mccarthy, K.L.; Mccarthy, M.J. Tomographic Techniques for Measuring Fluid Flow Properties. J. Food Sci. 2002, 67, 2718–2724. [Google Scholar] [CrossRef]
- Shin, S.; Keum, D.-Y. Viscosity measurement of non-Newtonian fluid foods with a mass-detecting capillary viscometer. J. Food Eng. 2003, 58, 5–10. [Google Scholar] [CrossRef]
- Tan, C.; Murai, Y.; Liu, W.; Tasaka, Y.; Dong, F.; Takeda, Y. Ultrasonic Doppler Technique for Application to Multiphase Flows: A Review. Int. J. Multiph. Flow 2021, 144, 103811. [Google Scholar] [CrossRef]
- Qin, J.; Kim, M.S.; Chao, K.; Chan, D.E.; Delwiche, S.R.; Cho, B.-K. Line-Scan Hyperspectral Imaging Techniques for Food Safety and Quality Applications. Appl. Sci. 2017, 7, 125. [Google Scholar] [CrossRef] [Green Version]
- Saggin, R.; Coupland, J.N. Oil viscosity measurement by ultrasonic reflectance. JAOCS J. Am. Oil Chem. Soc. 2001, 78, 509–511. [Google Scholar] [CrossRef]
- Hauptmann, P.; Hoppe, N.; Püttmer, A. Application of ultrasonic sensors in the process industry. Meas. Sci. Technol. 2002, 13, R73–R83. [Google Scholar] [CrossRef]
- Fathizadeh, Z.; Aboonajmi, M.; Hassan-Beygi, S.R. Nondestructive methods for determining the firmness of apple fruit flesh. Inf. Process. Agric. 2021, 8, 515–527. [Google Scholar] [CrossRef]
- Li, B.; Lecourt, J.; Bishop, G. Advances in Non-Destructive Early Assessment of Fruit Ripeness towards Defining Optimal Time of Harvest and Yield Prediction—A Review. Plants 2018, 7, 3. [Google Scholar] [CrossRef] [Green Version]
- Vursavus, K.K.; Yurtlu, Y.B.; Diezma-Iglesias, B.; Lleo-Garcia, L.; Ruiz-Altisent, M. Classification of the firmness of peaches by sensor fusion. Int. J. Agric. Biol. Eng. 2015, 8, 104–115. [Google Scholar] [CrossRef]
- Kuswandi, B.; Siddiqui, M.W. Sensor-Based Quality Assessment Systems for Fruits and Vegetables; Apple Academic Press: Palm Bay, FL, USA, 2020. [Google Scholar]
- García-Ramos, F.J.; Valero, C.; Homer, I.; Ortiz-Cañavate, J.; Ruiz-Altisent, M. Non-destructive fruit firmness sensors: A review. Span. J. Agric. Res. 2005, 3, 61. [Google Scholar] [CrossRef]
- Steinmetz, V.; Crochon, M.; Bellon Maurel, V.; Garcia Fernandez, J.L.; Barreiro Elorza, P.; Verstreken, L. Sensors for Fruit Firmness Assessment: Comparison and Fusion. J. Agric. Eng. Res. 1996, 64, 15–27. [Google Scholar] [CrossRef] [Green Version]
- Pandey, N.; Pal, D.; Saha, D.; Ganguly, S. Vibration-based biomimetic odor classification. Sci. Rep. 2021, 11, 11389. [Google Scholar] [CrossRef] [PubMed]
- Abbaszadeh, R.; Rajabipour, A.; Delshad, M.; Mahjub, M.; Ahmadi, H.; Laguë, C. Application of vibration response for the nondestructive ripeness evaluation of watermelons. Aust. J. Crop Sci. 2011, 5, 920–925. [Google Scholar]
- Oveisi, Z.; Minaei, S.; Rafiee, S.; Eyvani, A.; Borghei, A. Application of vibration response technique for the firmness evaluation of pear fruit during storage. J. Food Sci. Technol. 2014, 51, 3261–3268. [Google Scholar] [CrossRef] [PubMed] [Green Version]
- Zhu, H.; Chu, B.; Fan, Y.; Tao, X.; Yin, W.; He, Y. Hyperspectral Imaging for Predicting the Internal Quality of Kiwifruits Based on Variable Selection Algorithms and Chemometric Models. Sci. Rep. 2017, 7, 7845. [Google Scholar] [CrossRef] [PubMed] [Green Version]
- Mukherjee, A.; Chatterjee, K.; Sarkar, T. Entropy-Aided Assessment of Amla ( Emblica officinalis ) Quality Using Principal Component Analysis. Biointerface Res. Appl. Chem. 2022, 12, 2162–2170. [Google Scholar] [CrossRef]
- Wang, X. 7—Near-infrared spectroscopy for food quality evaluation. In Woodhead Publishing Series in Food Science, Technology and Nutrition; Zhong, J., Wang, X., Eds.; Woodhead Publishing: Sawston, UK, 2019; pp. 105–118. ISBN 978-0-12-814217-2. [Google Scholar]
- Huang, Y.; Lu, R.; Chen, K. Prediction of firmness parameters of tomatoes by portable visible and near-infrared spectroscopy. J. Food Eng. 2018, 222, 185–198. [Google Scholar] [CrossRef]
- Mishra, P.; Woltering, E.; El Harchioui, N. Improved prediction of ‘Kent’ mango firmness during ripening by near-infrared spectroscopy supported by interval partial least square regression. Infrared Phys. Technol. 2020, 110, 103459. [Google Scholar] [CrossRef]
- Kim, K.B.; Jung, H.M.; Kim, M.S.; Kim, G.S. Evaluation of fruit firmness by ultrasonic measurement. Key Eng. Mater. 2004, 270–273, 1049–1054. [Google Scholar] [CrossRef]
- Alayed, M.; Deen, M.J. Time-Resolved Diffuse Optical Spectroscopy and Imaging Using Solid-State Detectors: Characteristics, Present Status, and Research Challenges. Sensors 2017, 17, 2115. [Google Scholar] [CrossRef] [Green Version]
- Cubeddu, R.; D’Andrea, C.; Pifferi, A.; Taroni, P.; Torricelli, A.; Valentini, G.; Dover, C.; Johnson, D.; Ruiz-Altisent, M.; Valero, C. Nondestructive quantification of chemical and physical properties of fruits by time-resolved reflectance spectroscopy in the wavelength range 650-1000 nm. Appl. Opt. 2001, 40, 538–543. [Google Scholar] [CrossRef] [PubMed] [Green Version]
- Hatzakis, E. Nuclear Magnetic Resonance (NMR) Spectroscopy in Food Science: A Comprehensive Review. Compr. Rev. Food Sci. Food Saf. 2019, 18, 189–220. [Google Scholar] [CrossRef] [PubMed] [Green Version]
- Ebrahimnejad, H.; Ebrahimnejad, H.; Salajegheh, A.; Barghi, H. Use of Magnetic Resonance Imaging in Food Quality Control: A Review. J. Biomed. Phys. Eng. 2018, 8, 127–132. [Google Scholar] [PubMed]
- Bizzani, M.; Flores, D.W.M.; Colnago, L.A.; Ferreira, M.D. Non-invasive spectroscopic methods to estimate orange firmness, peel thickness, and total pectin content. Microchem. J. 2017, 133, 168–174. [Google Scholar] [CrossRef] [Green Version]
- Arendse, E.; Fawole, O.A.; Magwaza, L.S.; Opara, U.L. Non-destructive prediction of internal and external quality attributes of fruit with thick rind: A review. J. Food Eng. 2018, 217, 11–23. [Google Scholar] [CrossRef]
- Tunick, M.H.; Onwulata, C.I.; Thomas, A.E.; Phillips, J.G.; Mukhopadhyay, S.; Sheen, S.; Liu, C.-K.; Latona, N.; Pimentel, M.R.; Cooke, P.H. Critical Evaluation of Crispy and Crunchy Textures: A Review. Int. J. Food Prop. 2013, 16, 949–963. [Google Scholar] [CrossRef] [Green Version]
- Alonzo-Macías, M.; Montejano-Gaitán, G.; Allaf, K. Impact of Drying Processes on Strawberry (Fragaria var. Camarosa) Texture: Identification of Crispy and Crunchy Features by Instrumental Measurement. J. Texture Stud. 2014, 45, 246–259. [Google Scholar] [CrossRef]
- Marzec, A.; Kowalska, H.; Kowalska, J.; Domian, E.; Lenart, A. Influence of Pear Variety and Drying Methods on the Quality of Dried Fruit. Molecules 2020, 25, 5146. [Google Scholar] [CrossRef]
- Arimi, J.M.; Duggan, E.; O’Sullivan, M.; Lyng, J.G.; O’Riordan, E.D. Effect of water activity on the crispiness of a biscuit (Crackerbread): Mechanical and acoustic evaluation. Food Res. Int. 2010, 43, 1650–1655. [Google Scholar] [CrossRef]
- Çarşanba, E.; Duerrschmid, K.; Schleining, G. Assessment of acoustic-mechanical measurements for crispness of wafer products. J. Food Eng. 2018, 229, 93–101. [Google Scholar] [CrossRef]
- Lewicki, P.P.; Jakubczyk, E.; Marzec, A.; Cabral, C. Effect of water activity on mechanical properties of dry cereal product. Acta Agrophysica 2006, 4, 381–391. [Google Scholar]
- Błońska, A.; Marzec, A.; Błaszczyk, A. Instrumental Evaluation of Acoustic and Mechanical Texture Properties of Short-Dough Biscuits with Different Content of Fat and Inulin. J. Texture Stud. 2014, 45, 226–234. [Google Scholar] [CrossRef]
- Yoshioka, Y.; Horie, H.; Sugiyama, M.; Sakata, Y. Quantifying cucumber fruit crispness by mechanical measurement. Breed. Sci. 2009, 59, 139–147. [Google Scholar] [CrossRef] [Green Version]
- Saeleaw, M.; Schleining, G. A review: Crispness in dry foods and quality measurements based on acoustic–mechanical destructive techniques. J. Food Eng. 2011, 105, 387–399. [Google Scholar] [CrossRef]
- Zdunek, A.; Cybulska, J.; Konopacka, D.; Rutkowski, K. Evaluation of apple texture with contact acoustic emission detector: A study on performance of calibration models. J. Food Eng. 2011, 106, 80–87. [Google Scholar] [CrossRef]
- Povey, M.J.W.; Harden, C.A. An application of the ultrasonic pulse echo technique to the measurement of crispness of biscuits. Int. J. Food Sci. Technol. 1981, 16, 167–175. [Google Scholar] [CrossRef]
- Zadeike, D.; Jukonyte, R.; Juodeikiene, G.; Bartkiene, E.; Valatkeviciene, Z. Comparative study of ciabatta crust crispness through acoustic and mechanical methods: Effects of wheat malt and protease on dough rheology and crust crispness retention during storage. LWT 2018, 89, 110–116. [Google Scholar] [CrossRef]
- Antonova, I. Determination of Crispness in Breaded Fried Chicken Nuggets Using Ultrasonic Technique. Doctoral Dissertation, Virginia Tech, Blacksburg, VA, USA, 2001. Available online: https://vtechworks.lib.vt.edu/handle/10919/36456 (accessed on 1 November 2021).
- Chaunier, L.; Courcoux, P.; Della Valle, G.; Lourdin, D. Physical and sensory evaluation of cornflakes crispness. J. Texture Stud. 2005, 36, 93–118. [Google Scholar] [CrossRef]
- Zdunek, A.; Bednarczyk, J. Eeefect of mannitol treatment on ultrasound emission during texture profile analysis of potato and apple tissue. J. Texture Stud. 2006, 37, 339–359. [Google Scholar] [CrossRef]
- Zdunek, A.; Konopacka, D.; Jesionkowska, K. Crispness and crunchiness judgment of apples based on contact acoustic emmision. J. Texture Stud. 2010, 41, 75–91. [Google Scholar] [CrossRef]
- Dias-Faceto, L.S.; Salvador, A.; Conti-Silva, A.C. Acoustic settings combination as a sensory crispness indicator of dry crispy food. J. Texture Stud. 2020, 51, 232–241. [Google Scholar] [CrossRef]
- Arefi, A.; Moghaddam, P.A.; Mollazade, K.; Hassanpour, A.; Valero, C.; Gowen, A. Mealiness Detection in Agricultural Crops: Destructive and Nondestructive Tests: A Review. Compr. Rev. Food Sci. Food Saf. 2015, 14, 657–680. [Google Scholar] [CrossRef] [Green Version]
- Armstrong, C.M.; Gehring, A.G.; Paoli, G.C.; Chen, C.-Y.; He, Y.; Capobianco, J.A. Impacts of Clarification Techniques on Sample Constituents and Pathogen Retention. Foods 2019, 8, 636. [Google Scholar] [CrossRef] [PubMed] [Green Version]
- Delwiche, M.; Sarig, Y. A probe impact sensor for fruit firmness measurement. Trans. ASAE 1991, 34, 187–192. [Google Scholar] [CrossRef]
- Ozer, N.; Engel, A.B.; Simon, E. A multiple impact approach for non-destructive measurement of fruit firmness and maturity. Trans. ASAE 1998, 41, 871–876. [Google Scholar] [CrossRef]
- Różańska, A.; Dymerski, T.; Namieśnik, J. Novel analytical method for detection of orange juice adulteration based on ultra-fast gas chromatography. Monatshefte fur Chemie 2018, 149, 1615–1621. [Google Scholar] [CrossRef] [PubMed] [Green Version]
- Crisosto, C.H.; Labavitch, J.M. Developing a quantitative method to evaluate peach (Prunus persica) flesh mealiness. Postharvest Biol. Technol. 2002, 25, 151–158. [Google Scholar] [CrossRef]
- Goto-Inoue, N.; Yoshimura, Y.; Zaima, N. 12—Applications of imaging techniques in food science. In Chemical Analysis of Food; Pico, Y., Ed.; Academic Press: Cambridge, MA, USA, 2020; pp. 553–575. ISBN 978-0-12-813266-1. [Google Scholar]
- Sarkar, M.; Gupta, N.; Assaad, M. Nondestructive Food Quality Monitoring Using Phase Information in Time-Resolved Reflectance Spectroscopy. IEEE Trans. Instrum. Meas. 2020, 69, 7787–7795. [Google Scholar] [CrossRef]
- Rizzolo, A.; Vanoli, M.; Spinelli, L.; Torricelli, A. Sensory characteristics, quality and optical properties measured by time-resolved reflectance spectroscopy in stored apples. Postharvest Biol. Technol. 2010, 58, 1–12. [Google Scholar] [CrossRef]
- De Smedt, V.; Barreiro, P.; Verlinden, B.E.; Veraverbeke, E.A.; De Baerdemaeker, J.; Nicolaï, B.M. A mathematical model for the development of mealiness in apples. Postharvest Biol. Technol. 2002, 25, 273–291. [Google Scholar] [CrossRef] [Green Version]
- Moshou, D.; Wahlen, S.; Strasser, R.; Schenk, A.; De Baerdemaeker, J.; Ramon, H. Chlorophyll Fluorescence as a Tool for Online Quality Sorting of Apples. Biosyst. Eng. 2005, 91, 163–172. [Google Scholar] [CrossRef]
- Kalaji, H.M.; Bąba, W.; Gediga, K.; Goltsev, V.; Samborska, I.A.; Cetner, M.D.; Dimitrova, S.; Piszcz, U.; Bielecki, K.; Karmowska, K.; et al. Chlorophyll fluorescence as a tool for nutrient status identification in rapeseed plants. Photosynth. Res. 2018, 136, 329–343. [Google Scholar] [CrossRef] [PubMed] [Green Version]
- Song, J.; Deng, W.; Beaudry, R.M.; Armstrong, P.R. Changes in chlorophyll fluorescence of apple fruit during maturation, ripening, and senescence. HortScience 1997, 32, 891–896. [Google Scholar] [CrossRef] [Green Version]
- Du, Z.; Hu, Y.; Ali Buttar, N.; Mahmood, A. X-ray computed tomography for quality inspection of agricultural products: A review. Food Sci. Nutr. 2019, 7, 3146–3160. [Google Scholar] [CrossRef]
- Frisullo, P.; Marino, R.; Laverse, J.; Albenzio, M.; Del Nobile, M. Assessment of intramuscular fat level and distribution in beef muscles using X-ray microcomputed tomography. Meat Sci. 2010, 85, 250–255. [Google Scholar] [CrossRef]
- Schoeman, L.; Williams, P.; du Plessis, A.; Manley, M. X-ray micro-computed tomography (μCT) for non-destructive characterisation of food microstructure. Trends Food Sci. Technol. 2016, 47, 10–24. [Google Scholar] [CrossRef]
- Antequera, T.; Caballero, D.; Grassi, S.; Uttaro, B.; Perez-Palacios, T. Evaluation of fresh meat quality by Hyperspectral Imaging (HSI), Nuclear Magnetic Resonance (NMR) and Magnetic Resonance Imaging (MRI): A review. Meat Sci. 2021, 172, 108340. [Google Scholar] [CrossRef]
- Brix, O.; Apablaza, P.; Baker, A.; Taxt, T.; Grüner, R. Chemical shift based MR imaging and gas chromatography for quantification and localization of fat in Atlantic mackerel. J. Exp. Mar. Bio. Ecol. 2009, 376, 68–75. [Google Scholar] [CrossRef]
- McCarthy, M.J.; McCarthy, K.L. Applications of magnetic resonance imaging to food research. Magn. Reson. Imaging 1996, 14, 799–802. [Google Scholar] [CrossRef]
- Al-Muhtaseb, A.H.; McMinn, W.A.M.; Magee, T.R.A. Water sorption isotherms of starch powders: Part 1: Mathematical description of experimental data. J. Food Eng. 2004, 61, 297–307. [Google Scholar] [CrossRef]
- Peng, G.; Chen, X.; Wu, W.; Jiang, X. Modeling of water sorption isotherm for corn starch. J. Food Eng. 2007, 80, 562–567. [Google Scholar] [CrossRef]
- Ziegler, G.R.; Mongia, G.; Hollender, R. The role of particle size distribution of suspended solids in defining the sensory properties of milk chocolate. Int. J. Food Prop. 2007, 4, 353–370. [Google Scholar] [CrossRef]
- Attaie, H.; Breitschuh, B.; Braun, P.; Windhab, E.J. The functionality of milk powder and its relationship to chocolate mass processing, in particular the effect of milk powder manufacturing and composition on the physical properties of chocolate masses. Int. J. Food Sci. Technol. 2003, 38, 325–335. [Google Scholar] [CrossRef] [Green Version]
- Lyu, F.; Thomas, M.; Hendriks, W.H.; van der Poel, A.F.B. Size reduction in feed technology and methods for determining, expressing and predicting particle size: A review. Anim. Feed Sci. Technol. 2020, 261, 114347. [Google Scholar] [CrossRef]
- Cuq, B.; Gonçalves, F.; Mas, J.F.; Vareille, L.; Abecassis, J. Effects of moisture content and temperature of spaghetti on their mechanical properties. J. Food Eng. 2003, 59, 51–60. [Google Scholar] [CrossRef]
- Juszczak, L.; Witczak, M.; Fortuna, T.; Banyś, A. Rheological properties of commercial mustards. J. Food Eng. 2004, 63, 209–217. [Google Scholar] [CrossRef]
- Resch, J.J.; Daubert, C.R. Rheological and physicochemical properties of derivatized whey protein concentrate powders. Int. J. Food Prop. 2007, 5, 419–434. [Google Scholar] [CrossRef]
- Gujral, H.S.; Sharma, A.; Singh, N. Effect of hydrocolloids, storage temperature, and duration on the consistency of tomato ketchup. Int. J. Food Prop. 2007, 5, 179–191. [Google Scholar] [CrossRef] [Green Version]
- Haley, T.A.; Smith, R.S. Evaluation of in-line absorption photometry to predict consistency of concentrated tomato products. LWT Food Sci. Technol. 2003, 36, 159–164. [Google Scholar] [CrossRef]
- Ahmed, J.; Ramaswamy, H.S. Dynamic rheology and thermal transitions in meat-based strained baby foods. J. Food Eng. 2007, 78, 1274–1284. [Google Scholar] [CrossRef]
- Chang, Y.; Hartel, R.W. Stability of air cells in ice cream during hardening and storage. J. Food Eng. 2002, 55, 59–70. [Google Scholar] [CrossRef]
- Funebo, T.; Ahrné, L.; Prothon, F.; Kidman, S.; Langton, M.; Skjöldebrand, C. Microwave and convective dehydration of ethanol treated and frozen apple—Physical properties and drying kinetics. Int. J. Food Sci. Technol. 2002, 37, 603–614. [Google Scholar] [CrossRef]
- Ferrando, M.; Spiess, W.E.L. Mass transfer in strawberry tissue during osmotic treatment I: Microstructural changes. J. Food Sci. 2003, 68, 1347–1355. [Google Scholar] [CrossRef]
- Hong, S.I.; Krochta, J.M. Oxygen barrier performance of whey-protein-coated plastic films as affected by temperature, relative humidity, base film and protein type. J. Food Eng. 2006, 77, 739–745. [Google Scholar] [CrossRef]
- Alvi, S.A.A. Quality evaluation of goat meat by an electrical method. J. Agric. Eng. 1989, 26, 59–65. [Google Scholar]
- Cogné, C.; Andrieu, J.; Laurent, P.; Besson, A.; Nocquet, J. Experimental data and modelling of thermal properties of ice creams. J. Food Eng. 2003, 58, 331–341. [Google Scholar] [CrossRef]
- Maroulis, Z.B.; Saravacos, G.D.; Krokida, M.K.; Panagiotou, N.M. Thermal conductivity prediction for foodstuffs: Effect of moisture content and temperature. Int. J. Food Prop. 2007, 5, 231–245. [Google Scholar] [CrossRef]
- Marschoun, L.T.; Muthukumarappan, K.; Gunasekaran, S. Thermal properties of cheddar cheese: Experimental and modeling. Int. J. Food Prop. 2006, 4, 383–403. [Google Scholar] [CrossRef]
- Olafsdottir, G.; Nesvadba, P.; Di Natale, C.; Careche, M.; Oehlenschläger, J.; Tryggvadóttir, S.V.; Schubring, R.; Kroeger, M.; Heia, K.; Esaiassen, M.; et al. Multisensor for fish quality determination. Trends Food Sci. Technol. 2004, 15, 86–93. [Google Scholar] [CrossRef]
- Ryder, J.; Ababouch, L. Food and Agriculture Organization of the United Nations. In Proceedings of the Fifth World Fish Inspection and Quality Control Congress, The Hague, The Netherlands, 20–22 October 2003; p. 162. [Google Scholar]
- Bhosale, A.A.; Sundaram, K.K. Firmness Prediction of the Apple Using Capacitance Measurement. Procedia Technol. 2014, 12, 163–167. [Google Scholar] [CrossRef] [Green Version]
- Evans, S.D.; Nott, K.P.; Kshirsagar, A.A.; Hall, L.D. The effect of freezing and thawing on the magnetic resonance imaging parameters of water in beef, lamb and pork meat. Int. J. Food Sci. Technol. 1998, 33, 317–328. [Google Scholar] [CrossRef]
- Huang, Y.; Cavinato, A.G.; Tang, J.; Swanson, B.G.; Lin, M.; Rasco, B.A. Characterization of sol–gel transitions of food hydrocolloids with near infra-red spectroscopy. LWT Food Sci. Technol. 2007, 40, 1018–1026. [Google Scholar] [CrossRef]
- Jaillais, B.; Morrin, V.; Downey, G. Image processing of outer-product matrices—A new way to classify samples: Examples using visible/NIR/MIR spectral data. Chemom. Intell. Lab. Syst. 2007, 86, 179–188. [Google Scholar] [CrossRef]
- Esteban-Díez, I.; González-Sáiz, J.; Sáenz-González, C.; Pizarro, C. Coffee varietal differentiation based on near infrared spectroscopy. Talanta 2007, 71, 221–229. [Google Scholar] [CrossRef]
- Chen, B.; Fu, X.G.; Lu, D.L. Improvement of predicting precision of oil content in instant noodles by using wavelet transforms to treat near-infrared spectroscopy. J. Food Eng. 2002, 53, 373–376. [Google Scholar] [CrossRef]
- Singh, S. Refractive Index Measurement and its Applications. Phys. Scr. 2002, 65, 167–180. [Google Scholar] [CrossRef]
- Mukherjee, A.; Sarkar, T.; Chatterjee, K. Freshness Assessment of Indian Gooseberry (Phyllanthus emblica) Using Probabilistic Neural Network. J. Biosyst. Eng. 2021, 46, 399–416. [Google Scholar] [CrossRef]
- Sarkar, T.; Mukherjee, A.; Chatterjee, K. Supervised Learning Aided Multiple Feature Analysis for Freshness Class Detection of Indian Gooseberry (Phyllanthus emblica). J. Inst. Eng. Ser. A 2021. [Google Scholar] [CrossRef]
- Sarkar, T.; Mukherjee, A.; Chatterjee, K.; Ermolaev, V.; Piotrovsky, D.; Vlasova, K.; Shariati, M.A.; Munekata, P.E.S.; Lorenzo, J.M. Edge Detection Aided Geometrical Shape Analysis of Indian Gooseberry (Phyllanthus emblica) for Freshness Classification. Food Anal. Methods 2022. [Google Scholar] [CrossRef]
- Sarkar, T.; Mukherjee, A.; Chatterjee, K.; Shariati, M.; Rebezov, M.; Rodionova, S.; Smirnov, D.; Dominguez, R.; Lorenzo, J.M. Comparative Analysis of Statistical and Supervised Learning Models for Freshness Assessment of Oyster Mushrooms. Food Anal. Methods 2021. [Google Scholar] [CrossRef]
- Iraguen, V.; Guesalaga, A.; Agosin, E. A portable non-destructive volume meter for wine grape clusters. Meas. Sci. Technol. 2006, 17, N92. [Google Scholar] [CrossRef]
- Gall, H.; Muir, A.; Fleming, J.; Pohlmann, R.; Göcke, L.; Hossack, W. A ring sensor system for the determination of volume and axis measurements of irregular objects. Meas. Sci. Technol. 1998, 9, 1809. [Google Scholar] [CrossRef]
- Gall, H. A ring sensor system using a modified polar coordinate system to describe the shape of irregular objects. MeScT 1997, 8, 1228–1235. [Google Scholar] [CrossRef]
- Moreda, G.P.; Ortiz-Cañavate, J.; García-Ramos, F.J.; Homer, I.R.; Ruiz-Altisent, M. Optimal operating conditions for an optical ring sensor system to size fruits and vegetables. Appl. Eng. Agric. 2005, 21, 661–670. [Google Scholar] [CrossRef]
- Moreda, G. Design and Assessment of a System for On-Line Size Determination of Fruits and Vegetables, Using an Optical Ring Sensor; Ciudad Universitaria: Madrid, Spain, 2004. [Google Scholar]
- Hahn, F. PH—Postharvest Technology: Automatic Jalapeño Chilli Grading by Width. Biosyst. Eng. 2002, 83, 433–440. [Google Scholar] [CrossRef]
- Hryniewicz, M.; Sotome, I.; Anthonis, J.; Ramon, H.; De Baerdemaeker, J. 3D surface modeling with stereovision. Acta Hortic. 2005, 674, 561–565. [Google Scholar] [CrossRef]
- Lee, D.-J.; Xu, X.; Eifert, J.D.; Zhan, P. Area and volume measurements of objects with irregular shapes using multiple silhouettes. Opt. Eng. 2006, 45, 027202. [Google Scholar] [CrossRef]
- Kanali, C.; Murase, H.; Honami, N. Three-dimensional shape recognition using a charge-simulation method to process primary image features. J. Agric. Eng. Res. 1998, 70, 195–208. [Google Scholar] [CrossRef]
- Pan, Y.; Li, X.; Jia, X.; Zhao, Y.; Li, H.; Zhang, L. Storage temperature without fluctuation enhances shelf-life and improves postharvest quality of peach. J. Food Process. Preserv. 2019, 43, e13881. [Google Scholar] [CrossRef]
- Alajaji, S.A.; El-Adawy, T.A. Nutritional composition of chickpea (Cicer arietinum L.) as affected by microwave cooking and other traditional cooking methods. J. Food Compos. Anal. 2006, 19, 806–812. [Google Scholar] [CrossRef]
- Mora, C.R.; Schimleck, L.R. Determination of specific gravity of green Pinus taeda samples by near infrared spectroscopy: Comparison of pre-processing methods using multivariate figures of merit. Wood Sci. Technol. 2009, 43, 441–456. [Google Scholar] [CrossRef]
- Jaya, S.; Das, H. Glass Transition and Sticky Point Temperatures and Stability/Mobility Diagram of Fruit Powders. Food Bioprocess Technol. 2008, 2, 89–95. [Google Scholar] [CrossRef]
- Bhadra, R.; Rosentrater, K.A.; Muthukumarappan, K. Measurement of Sticky Point Temperature of Coffee Powder with a Rheometer. Int. J. Food Prop. 2013, 16, 1071–1079. [Google Scholar] [CrossRef] [Green Version]
- Hashemi, N.; Milani, E.; Mortezavi, S.A.; Yazdi, F.T. Sticky Point Temperature as a Suitable Method in Evaluation of Shelf Life of Food Powders. Bull. Société R. Sci. Liège 2017, 86, 7–12. [Google Scholar] [CrossRef]
- Rodríguez, R.; Jaramillo, S.; Heredia, A.; Guillén, R.; Jiménez, A.; Fernández-Bolaños, J. Mechanical properties of white and green asparagus: Changes related to modifications of cell wall components. J. Sci. Food Agric. 2004, 84, 1478–1486. [Google Scholar] [CrossRef]
- De Ketelaere, B.; Howarth, M.S.; Crezee, L.; Lammertyn, J.; Viaene, K.; Bulens, I.; De Baerdemaeker, J. Postharvest firmness changes as measured by acoustic and low-mass impact devices: A comparison of techniques. Postharvest Biol. Technol. 2006, 41, 275–284. [Google Scholar] [CrossRef]
- Sakurai, N.; Iwatani, S.I.; Terasaki, S.; Yamamoto, R. Texture evaluation of cucumber by a new acoustic vibration method. J. Jpn. Soc. Hortic. Sci. 2005, 74, 31–35. [Google Scholar] [CrossRef] [Green Version]
- Hertog, M.L.A.T.M.; Ben-Arie, R.; Róth, E.; Nicolaï, B.M. Humidity and temperature effects on invasive and non-invasive firmness measures. Postharvest Biol. Technol. 2004, 1, 79–91. [Google Scholar] [CrossRef]
- Verlinden, B.E.; De Smedt, V.; Nicola, B.M. Evaluation of ultrasonic wave propagation to measure chilling injury in tomatoes. Postharvest Biol. Technol. 2004, 32, 109–113. [Google Scholar] [CrossRef]
- Vasighi-Shojae, H.; Gholami-Parashkouhi, M.; Mohammadzamani, D.; Soheili, A. Ultrasonic based determination of apple quality as a nondestructive technology. Sens. Bio-Sens. Res. 2018, 21, 22–26. [Google Scholar] [CrossRef]
- Charoensiddhi, S.; Anprung, P. Bioactive compounds and volatile compounds of Thai bael fruit (Aegle marmelos (L.) Correa) as a valuable source for functional food ingredients. Int. Food Res. J. 2008, 15, 287–295. [Google Scholar]
- Deell, J.R.; Toivonen, P.M.A. Chlorophyll Fluorescence as an Indicator of Physiological Changes in Cold-Stored Broccoli After Transfer to Room Temperature. J. Food Sci. 1999, 64, 501–503. [Google Scholar]
- Nicolaï, B.M.; Verlinden, B.E.; Lammertyn, J.; De Baerdemaeker, J. Texture assessment of perishable products. Acta Hortic. 2003, 600, 513–519. [Google Scholar] [CrossRef]
- Kohonen, T. The Self-Organizing Map. Proc. IEEE 1990, 78, 1464–1480. [Google Scholar] [CrossRef]
- Montouto-Grña, M.; Fernández-Fernández, E.; Vaázquez-Odeériz, M.L.; Romero-Rodríguez, M.A. Development of a sensory profile for the specific denomination “Galician potato”. Food Qual. Prefer. 2002, 13, 99–106. [Google Scholar] [CrossRef]
- Goula, A.M.; Karapantsios, T.D.; Adamopoulos, K.G. Characterization of Tomato Pulp Stickiness during Spray Drying using a Contact Probe Method. Dry. Technol. 2007, 25, 591–598. [Google Scholar] [CrossRef]
- Qin, J.; Lu, R. Measurement of the optical properties of fruits and vegetables using spatially resolved hyperspectral diffuse reflectance imaging technique. Postharvest Biol. Technol. 2008, 49, 355–365. [Google Scholar] [CrossRef]
- Rakulini, R.; Kalaichelvi, S.; Prasad, S. A Review of Anti—Diarrheal Activity of Aegle marmelos. Orig. Res. Artic. Rakulini Kalaichelvi 2019, 7, 1–10. [Google Scholar] [CrossRef] [Green Version]
- van Gelder, M.F. A Thermistor Based Method for Measurement of Thermal Conductivity and Thermal Diffusivity of Moist Food Materials at High Temperatures. Doctoral Dissertation, Virginia Polytechnic Institute and State University, Blacksburg, VA, USA, 1997. Available online: https://www.proquest.com/openview/0672c50df1ee96b7335c7ebdc9dc055c/1?pq-origsite=gscholar&cbl=18750&diss=y (accessed on 1 November 2021).
- Kumar, S.; Pandey, A.K. Chemistry and Biological Activities of Flavonoids: An Overview. Sci. World J. 2013, 2013, 162750. [Google Scholar] [CrossRef] [Green Version]
- Morikawa, J.; Hashimoto, T. Thermal imaging of micro-structured polymers with high-speed infrared camera. Smart Nano-Micro Mater. Devices 2011, 8204, 82042R. [Google Scholar] [CrossRef]
- Moya, M.; Guaita, M.; Aguado, P.; Ayuga, F. Mechanical properties of granular agricultural materials, Part 2. Trans. ASABE 2006, 49, 479–489. [Google Scholar] [CrossRef]
- Molenda, M.; Stasiak, M. Determination of the elastic constants of cereal grains in a uniaxial compression test. Int. Agrophysics 2002, 16, 61–65. [Google Scholar]
- Stasiak, M.; Molenda, M.; Horabik, J. Determination of modulus of elasticity of cereals and rapeseeds using acoustic method. J. Food Eng. 2007, 82, 51–57. [Google Scholar] [CrossRef]
- Zapotoczny, P.; Zielinska, M.; Nita, Z. Application of image analysis for the varietal classification of barley:. Morphological features. J. Cereal Sci. 2008, 48, 104–110. [Google Scholar] [CrossRef]
- Dang, J.M.; Copeland, L. Studies of the fracture surface of rice grains using environmental scanning electron microscopy. J. Sci. Food Agric. 2004, 84, 707–713. [Google Scholar] [CrossRef]
- Samapundo, S.; Devlieghere, F.; De Meulenaer, B.; Atukwase, A.; Lamboni, Y.; Debevere, J.M. Sorption isotherms and isosteric heats of sorption of whole yellow dent corn. J. Food Eng. 2007, 79, 168–175. [Google Scholar] [CrossRef]
- Argyropoulos, D.; Alex, R.; Müller, J. Equilibrium moisture contents of a medicinal herb (Melissa officinalis) and a medicinal mushroom (Lentinula edodes) determined by dynamic vapour sorption. Procedia Food Sci. 2011, 1, 165–172. [Google Scholar] [CrossRef] [Green Version]
- Picolli da Silva, L.; de Lourdes Santorio Ciocca, M. Total, insoluble and soluble dietary fiber values measured by enzymatic–gravimetric method in cereal grains. J. Food Compos. Anal. 2005, 18, 113–120. [Google Scholar] [CrossRef]
- McCleary, B.V.; De Vries, J.W.; Rader, J.I.; Cohen, G.; Prosky, L.; Mugford, D.C.; Champ, M.; Okuma, K. Determination of Total Dietary Fiber (CODEX Definition) by Enzymatic-Gravimetric Method and Liquid Chromatography: Collaborative Study. J. AOAC Int. 2010, 93, 221–233. [Google Scholar] [CrossRef] [Green Version]
- Gruwel, M.L.H.; Ghosh, P.K.; Latta, P.; Jayas, D.S. On the diffusion constant of water in wheat. J. Agric. Food Chem. 2008, 56, 59–62. [Google Scholar] [CrossRef]
- Nakamura, S.; Satoh, H.; Ohtsubo, K. Palatable and Bio-Functional Wheat/Rice Products Developed from Pre-Germinated Brown Rice of Super-Hard Cultivar EM10. OUP 2014, 74, 1164–1172. [Google Scholar] [CrossRef] [PubMed]
- Okadome, H.; Toyoshima, H.; Ohtsubo, K. Multiple Measurements of Physical Properties of Individual Cooked Rice Grains with a Single Apparatus. Cereal Chem. 1999, 76, 855–860. [Google Scholar] [CrossRef]
- Sánchez-Pardo, M.E.; Ortiz-Moreno, A.; Mora-Escobedo, R.; Chanona-Pérez, J.J.; Necoechea-Mondragón, H. Comparison of crumb microstructure from pound cakes baked in a microwave or conventional oven. LWT Food Sci. Technol. 2008, 41, 620–627. [Google Scholar] [CrossRef]
- Ravn, L.; Andersen, N.; Rasmussen, M.; Christensen, M.; Edwards, S.; Guy, J.; Henckel, P.; Harrison, A. De electricitatis catholici musculari—Concerning the electrical properties of muscles, with emphasis on meat quality. Meat Sci. 2008, 80, 423–430. [Google Scholar] [CrossRef] [PubMed]
- Campos, G.F.C.; Seixas, J.L.; Barbon, A.P.A.C.; Felinto, A.S.; Bridi, A.M.; Barbon, S. Robust computer vision system for marbling meat segmentation. Electron. Lett. Comput. Vis. Image Anal. 2020, 19, 15–27. [Google Scholar] [CrossRef] [Green Version]
- Chmiel, M.; Dasiewicz, K.; Słowiński, M. Quality evaluation of beef trimmings by video image analysis. Zywn. Nauk. Technol. Jakosc 2010, 17, 219–227. [Google Scholar] [CrossRef]
- Fabbri, G.; Gianesella, M.; Gallo, L.; Morgante, M.; Contiero, B.; Muraro, M.; Boso, M.; Fiore, E. Application of Ultrasound Images Texture Analysis for the Estimation of Intramuscular Fat Content in the Longissimus Thoracis Muscle of Beef Cattle after Slaughter: A Methodological Study. Animals 2021, 11, 1117. [Google Scholar] [CrossRef]
- Holman, B.W.B.; Hopkins, D.L. A comparison of the Nix Colour Sensor ProTM and HunterLab MiniScanTM colorimetric instruments when assessing aged beef colour stability over 72 h display. Meat Sci. 2019, 147, 162–165. [Google Scholar] [CrossRef]
- Gariépy, C.; Jones, S.D.M.; Tong, A.K.W.; Rodrigue, N. Assessment of the ColormetTM fiber optic probe for the evaluation of dark cutting beef. Food Res. Int. 1994, 27, 1–6. [Google Scholar] [CrossRef]
- Shackelford, S.; Wheeler, T.; Koohmaraie, M. On-line classification of US Select beef carcasses for longissimus tenderness using visible and near-infrared reflectance spectroscopy. Meat Sci. 2005, 69, 409–415. [Google Scholar] [CrossRef] [Green Version]
- Zollinger, B.; Farrow, R.; Lawrence, T.; Latman, N. Prediction of beef carcass salable yield and trimmable fat using bioelectrical impedance analysis. Meat Sci. 2010, 84, 449–454. [Google Scholar] [CrossRef] [PubMed]
- Navajas, E.A.; Glasbey, C.A.; Fisher, A.V.; Ross, D.W.; Hyslop, J.J.; Richardson, R.I.; Simm, G.; Roehe, R. Assessing beef carcass tissue weights using computed tomography spirals of primal cuts. Meat Sci. 2010, 84, 30–38. [Google Scholar] [CrossRef] [PubMed]
- Robbins, K.; Jensen, J.; Ryan, K.; Homco-Ryan, C.; McKeith, F.; Brewer, M. Consumer attitudes towards beef and acceptability of enhanced beef. Meat Sci. 2003, 65, 721–729. [Google Scholar] [CrossRef]
- Elango, G.; Rahuman, A.A. Evaluation of medicinal plant extracts against ticks and fluke. Parasitol. Res. 2011, 108, 513–519. [Google Scholar] [CrossRef]
- Ranasinghesagara, J.; Nath, T.; Wells, S.; Weaver, A.; Gerrard, D.; Yao, G. Imaging optical diffuse reflectance in beef muscles for tenderness prediction. Meat Sci. 2010, 84, 413–421. [Google Scholar] [CrossRef] [PubMed]
- Lepetit, J.; Culioli, J. Mechanical properties of meat. Meat Sci. 1994, 36, 203–237. [Google Scholar] [CrossRef]
- Jackman, P.; Sun, D.; Allen, P.; Brandon, K.; White, A. Correlation of consumer assessment of longissimus dorsi beef palatability with image colour, marbling and surface texture features. Meat Sci. 2010, 84, 564–568. [Google Scholar] [CrossRef]
- Qiao, X.; Du, R.; Wang, Y.; Han, Y.; Zhou, Z. Isolation, Characterisation and Fermentation Optimisation of Bacteriocin-Producing Enterococcus faecium. Waste Biomass Valoriz. 2020, 11, 3173–3181. [Google Scholar] [CrossRef]
- Choi, Y.; Choi, J.; Han, D.; Kim, H.; Lee, M.; Kim, H.; Jeong, J.; Kim, C. Characteristics of low-fat meat emulsion systems with pork fat replaced by vegetable oils and rice bran fiber. Meat Sci. 2009, 82, 266–271. [Google Scholar] [CrossRef]
- Diéguez, P.M.; Beriain, M.J.; Insausti, K.; Arrizubieta, M.J. Thermal Analysis of Meat Emulsion Cooking Process by Computer Simulation and Experimental Measurement. Int. J. Food Eng. 2010, 6. [Google Scholar] [CrossRef]
- Valous, N.A.; Mendoza, F.; Sun, D.W.; Allen, P. Texture appearance characterization of pre-sliced pork ham images using fractal metrics: Fourier analysis dimension and lacunarity. Food Res. Int. 2009, 42, 353–362. [Google Scholar] [CrossRef]
- Pérez-Marín, D.; De Pedro Sanz, E.; Guerrero-Ginel, J.; Garrido-Varo, A. A feasibility study on the use of near-infrared spectroscopy for prediction of the fatty acid profile in live Iberian pigs and carcasses. Meat Sci. 2009, 83, 627–633. [Google Scholar] [CrossRef]
- Niñoles, L.; Mulet, A.; Ventanas, S.; Benedito, J. Ultrasonic assessment of the melting behaviour in fat from Iberian dry-cured hams. Meat Sci. 2010, 85, 26–32. [Google Scholar] [CrossRef] [PubMed]
- Fitzpatrick, J.J.; O’Callaghan, E.; O’Flynn, J. Application of a novel cake strength tester for investigating caking of skim milk powder. Food Bioprod. Process. 2008, 86, 198–203. [Google Scholar] [CrossRef]
- Gaiani, C.; Ehrhardt, J.; Scher, J.; Hardy, J.; Desobry, S.; Banon, S. Surface composition of dairy powders observed by X-ray photoelectron spectroscopy and effects on their rehydration properties. Colloids Surf. B. Biointerfaces 2006, 49, 71–78. [Google Scholar] [CrossRef]
- Keogh, M.K.; Murray, C.A.; O’Kennedy, B.T. Effects of ultrafiltration of whole milk on some properties of spray-dried milk powders. Int. Dairy J. 2003, 13, 995–1002. [Google Scholar] [CrossRef]
- Jenike, A.W. Storage and flow of solids. In Bulletin of the University of Utah; The University of Utah: Salt Lake City, UT, USA, 1964; Volume 53, pp. 1–209. [Google Scholar] [CrossRef] [Green Version]
- Kim, E.; Chen, X.; Pearce, D. Effect of surface composition on the flowability of industrial spray-dried dairy powders. Colloids Surf. B Biointerfaces 2005, 46, 182–187. [Google Scholar] [CrossRef]
- Boonyai, P.; Howes, T.; Bhandari, B. Instrumentation and testing of a thermal mechanical compression test for glass-rubber transition analysis of food powders. J. Food Eng. 2007, 78, 1333–1342. [Google Scholar] [CrossRef]
- Özkan, N.; Walisinghe, N.; Chen, X.D. Characterization of stickiness and cake formation in whole and skim milk powders. J. Food Eng. 2002, 55, 293–303. [Google Scholar] [CrossRef]
- Chuy, L.E.; Labuza, T.P. Caking and Stickiness of Dairy-Based Food Powders as Related to Glass Transition. J. Food Sci. 1994, 59, 43–46. [Google Scholar] [CrossRef]
- Rennie, P.R.; Chen, X.D.; Hargreaves, C.; MacKereth, A.R. A study of the cohesion of dairy powders. J. Food Eng. 1999, 39, 277–284. [Google Scholar] [CrossRef]
- Mendoza, F.; Valous, N.; Sun, D.; Allen, P. Characterization of fat-connective tissue size distribution in pre-sliced pork hams using multifractal analysis. Meat Sci. 2009, 83, 713–722. [Google Scholar] [CrossRef] [PubMed]
- Murti, R.A.; Paterson, A.H.J.; Pearce, D.; Bronlund, J.E. The influence of particle velocity on the stickiness of milk powder. Int. Dairy J. 2010, 20, 121–127. [Google Scholar] [CrossRef]
- Intipunya, P.; Shrestha, A.; Howes, T.; Bhandari, B. A modified cyclone stickiness test for characterizing food powders. J. Food Eng. 2009, 94, 300–306. [Google Scholar] [CrossRef]
- Hogan, S.A.; Famelart, M.H.; O’Callaghan, D.J.; Schuck, P. A novel technique for determining glass–rubber transition in dairy powders. J. Food Eng. 2010, 99, 76–82. [Google Scholar] [CrossRef]
- Vithanage, C.R.; Grimson, M.J.; Smith, B.G. Temperature on the rheology of butter, a spreadable blend and spreads. J. Texture Stud. 2009, 40, 346–369. [Google Scholar] [CrossRef]
- Arana, I. Physical Properties of Foods: Novel Measurement Techniques and Applications; CRC Press: Boca Raton, FL, USA, 2012. [Google Scholar]
- Glibowski, P.; Zarzycki, P.; Krzepkowska, M. The rheological and instrumental textural properties of selected table fats. Int. J. Food Prop. 2008, 11, 678–686. [Google Scholar] [CrossRef]
- Campos, R.; Narine, S.S.; Marangoni, A.G. Effect of cooling rate on the structure and mechanical properties of milk fat and lard. Food Res. Int. 2002, 35, 971–981. [Google Scholar] [CrossRef]
- Sodini, I.; Remeuf, F.; Haddad, S.; Corrieu, G. The relative effect of milk base, starter, and process on yogurt texture: A review. Crit. Rev. Food Sci. Nutr. 2004, 44, 113–137. [Google Scholar] [CrossRef]
- Lucey, J. ADSA Foundation Scholar Award. Formation and physical properties of milk protein gels. J. Dairy Sci. 2002, 85, 281–294. [Google Scholar] [CrossRef]
- Capellas, M.; Mor-Mur, M.; Sendra, E.; Guamis, B. Effect of high-pressure processing on physico-chemical characteristics of fresh goats’ milk cheese (Mató). Int. Dairy J. 2001, 11, 165–173. [Google Scholar] [CrossRef]
- Innocente, N.; Biasutti, M.; Venir, E.; Spaziani, M.; Marchesini, G. Effect of high-pressure homogenization on droplet size distribution and rheological properties of ice cream mixes. J. Dairy Sci. 2009, 92, 1864–1875. [Google Scholar] [CrossRef] [PubMed]


Publisher’s Note: MDPI stays neutral with regard to jurisdictional claims in published maps and institutional affiliations. |
© 2022 by the authors. Licensee MDPI, Basel, Switzerland. This article is an open access article distributed under the terms and conditions of the Creative Commons Attribution (CC BY) license (https://creativecommons.org/licenses/by/4.0/).
Share and Cite
Sarkar, T.; Salauddin, M.; Kirtonia, K.; Pati, S.; Rebezov, M.; Khayrullin, M.; Panasenko, S.; Tretyak, L.; Temerbayeva, M.; Kapustina, N.; et al. A Review on the Commonly Used Methods for Analysis of Physical Properties of Food Materials. Appl. Sci. 2022, 12, 2004. https://doi.org/10.3390/app12042004
Sarkar T, Salauddin M, Kirtonia K, Pati S, Rebezov M, Khayrullin M, Panasenko S, Tretyak L, Temerbayeva M, Kapustina N, et al. A Review on the Commonly Used Methods for Analysis of Physical Properties of Food Materials. Applied Sciences. 2022; 12(4):2004. https://doi.org/10.3390/app12042004
Chicago/Turabian StyleSarkar, Tanmay, Molla Salauddin, Kohima Kirtonia, Siddhartha Pati, Maksim Rebezov, Mars Khayrullin, Svetlana Panasenko, Lyudmila Tretyak, Marina Temerbayeva, Nadezhda Kapustina, and et al. 2022. "A Review on the Commonly Used Methods for Analysis of Physical Properties of Food Materials" Applied Sciences 12, no. 4: 2004. https://doi.org/10.3390/app12042004