
Seismic Strengthening Effects of Full-Size Reinforced Concrete Frame Retrofitted with Novel Concrete-Filled Tube Modular Frame by Pseudo-Dynamic Testing


Abstract
:1. Introduction
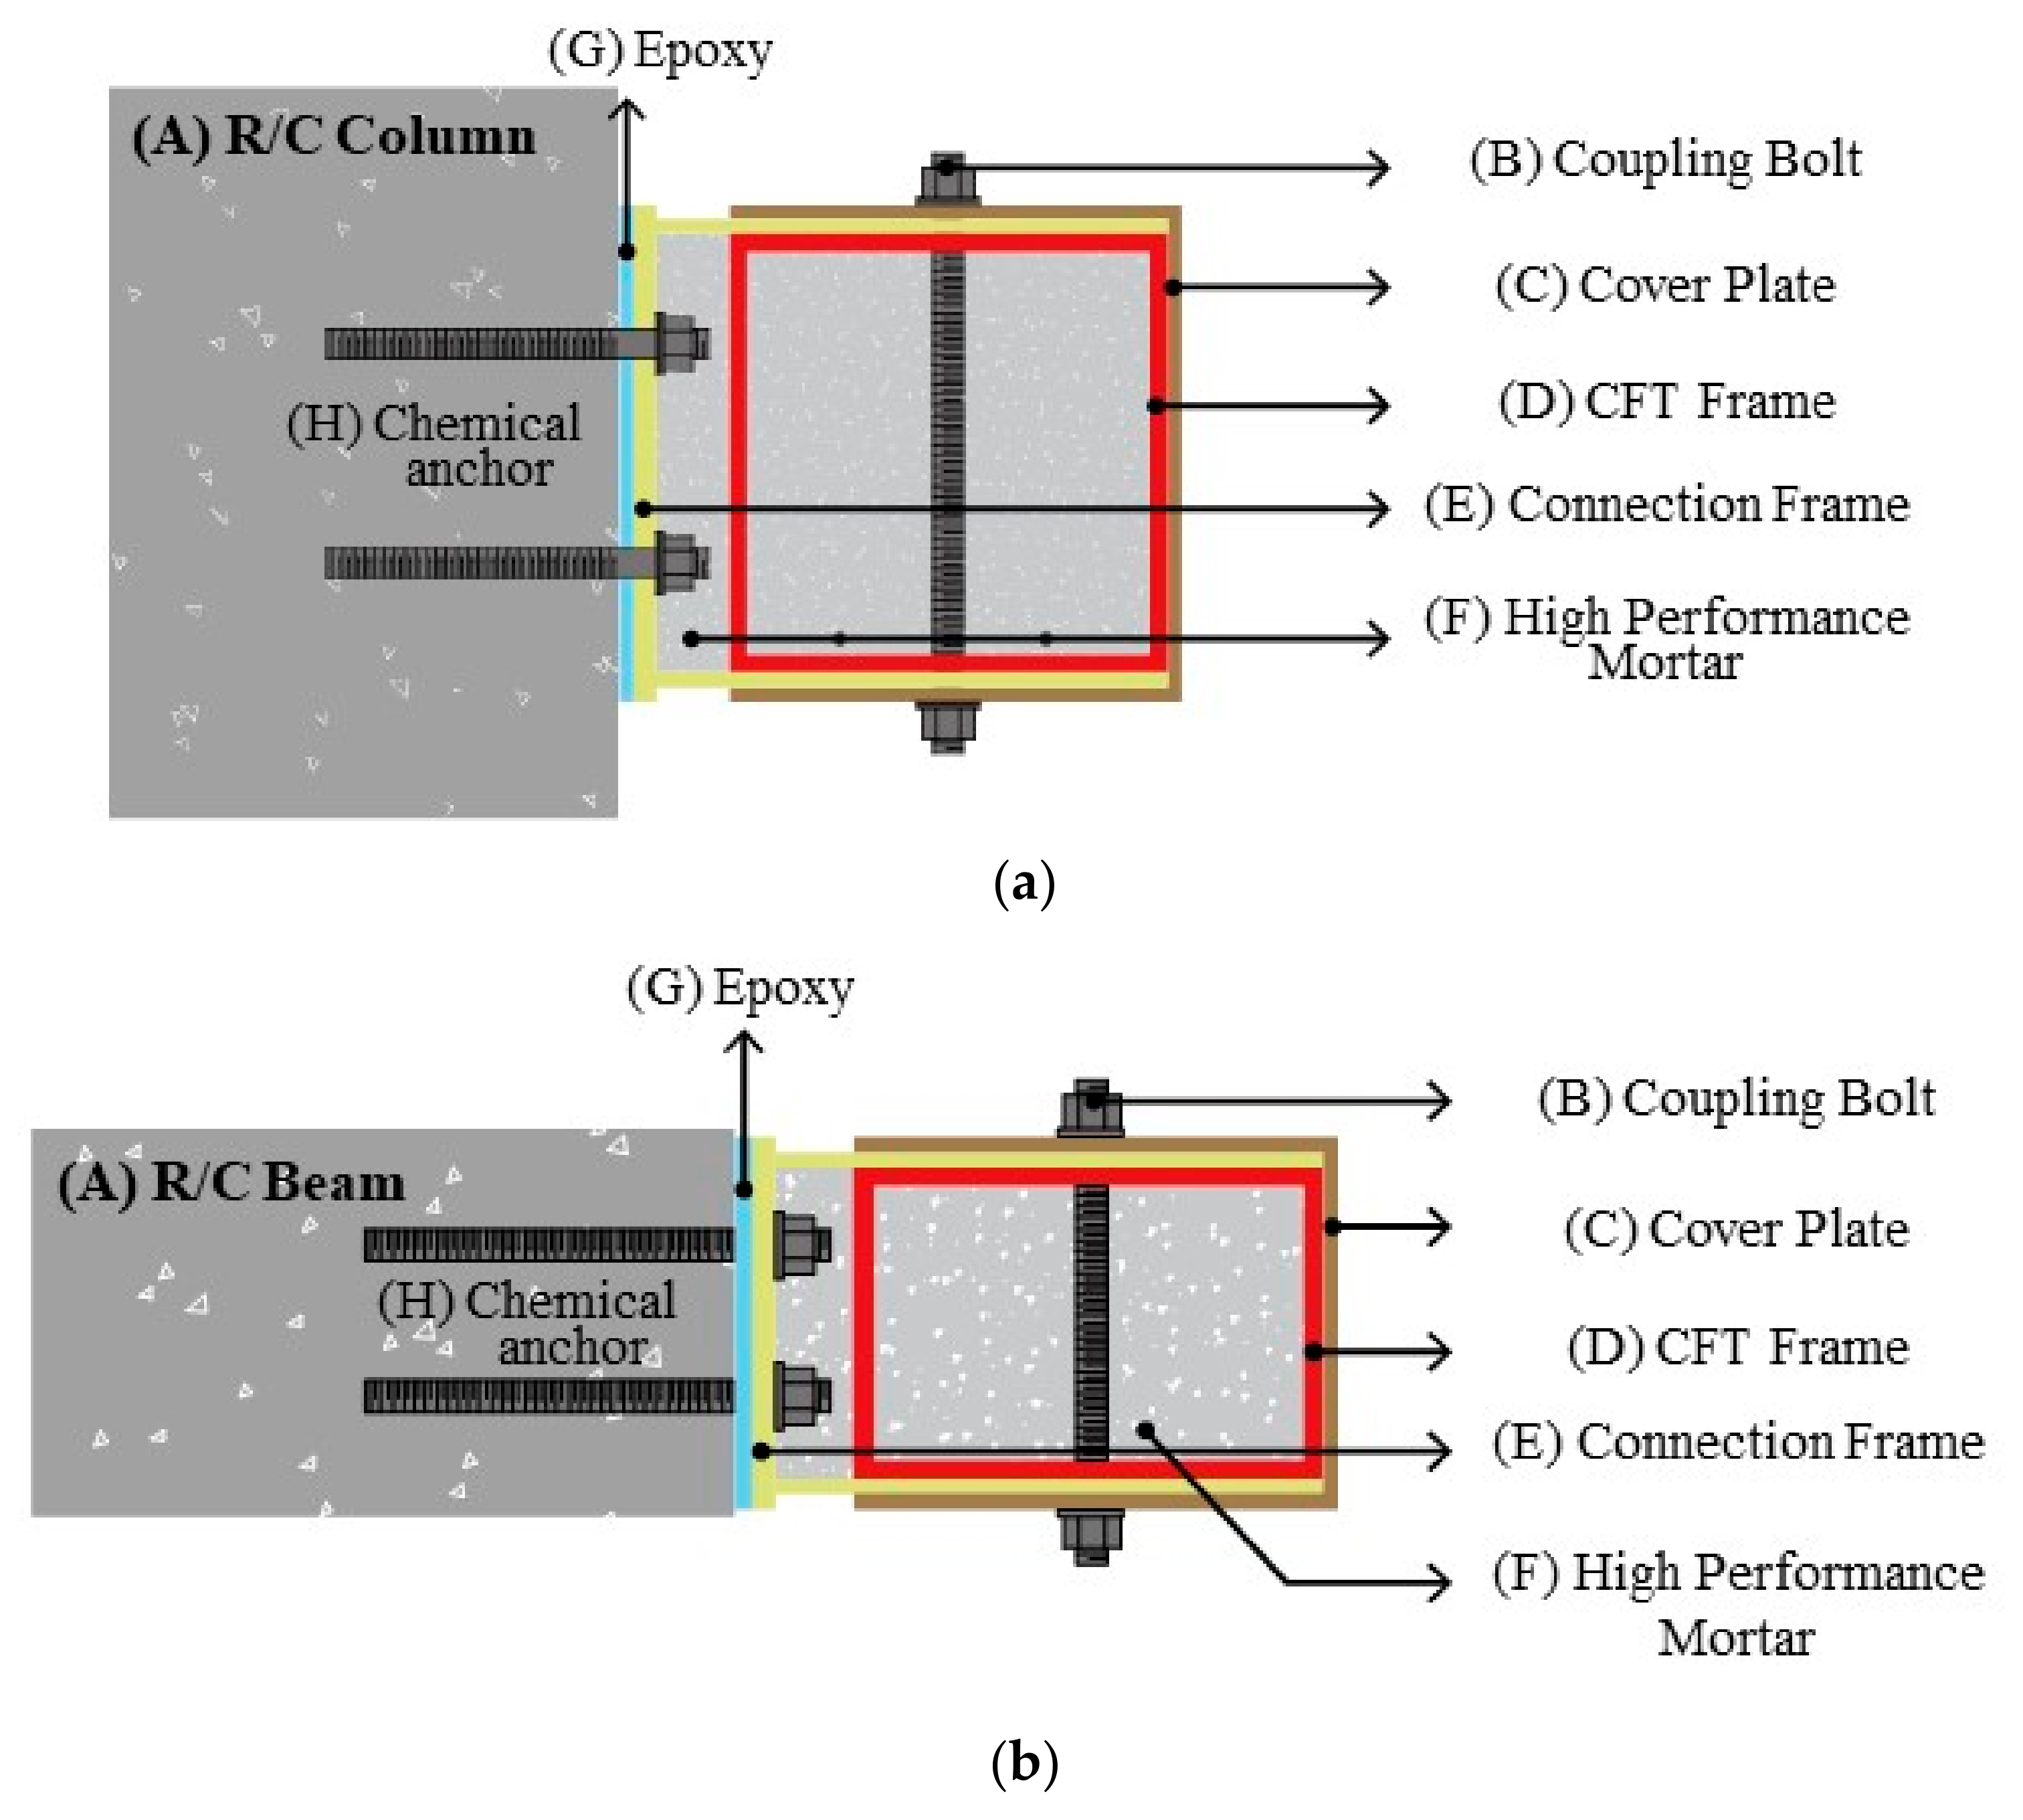
2. Overview of CFT-MF Seismic Retrofitting Method
- (1)
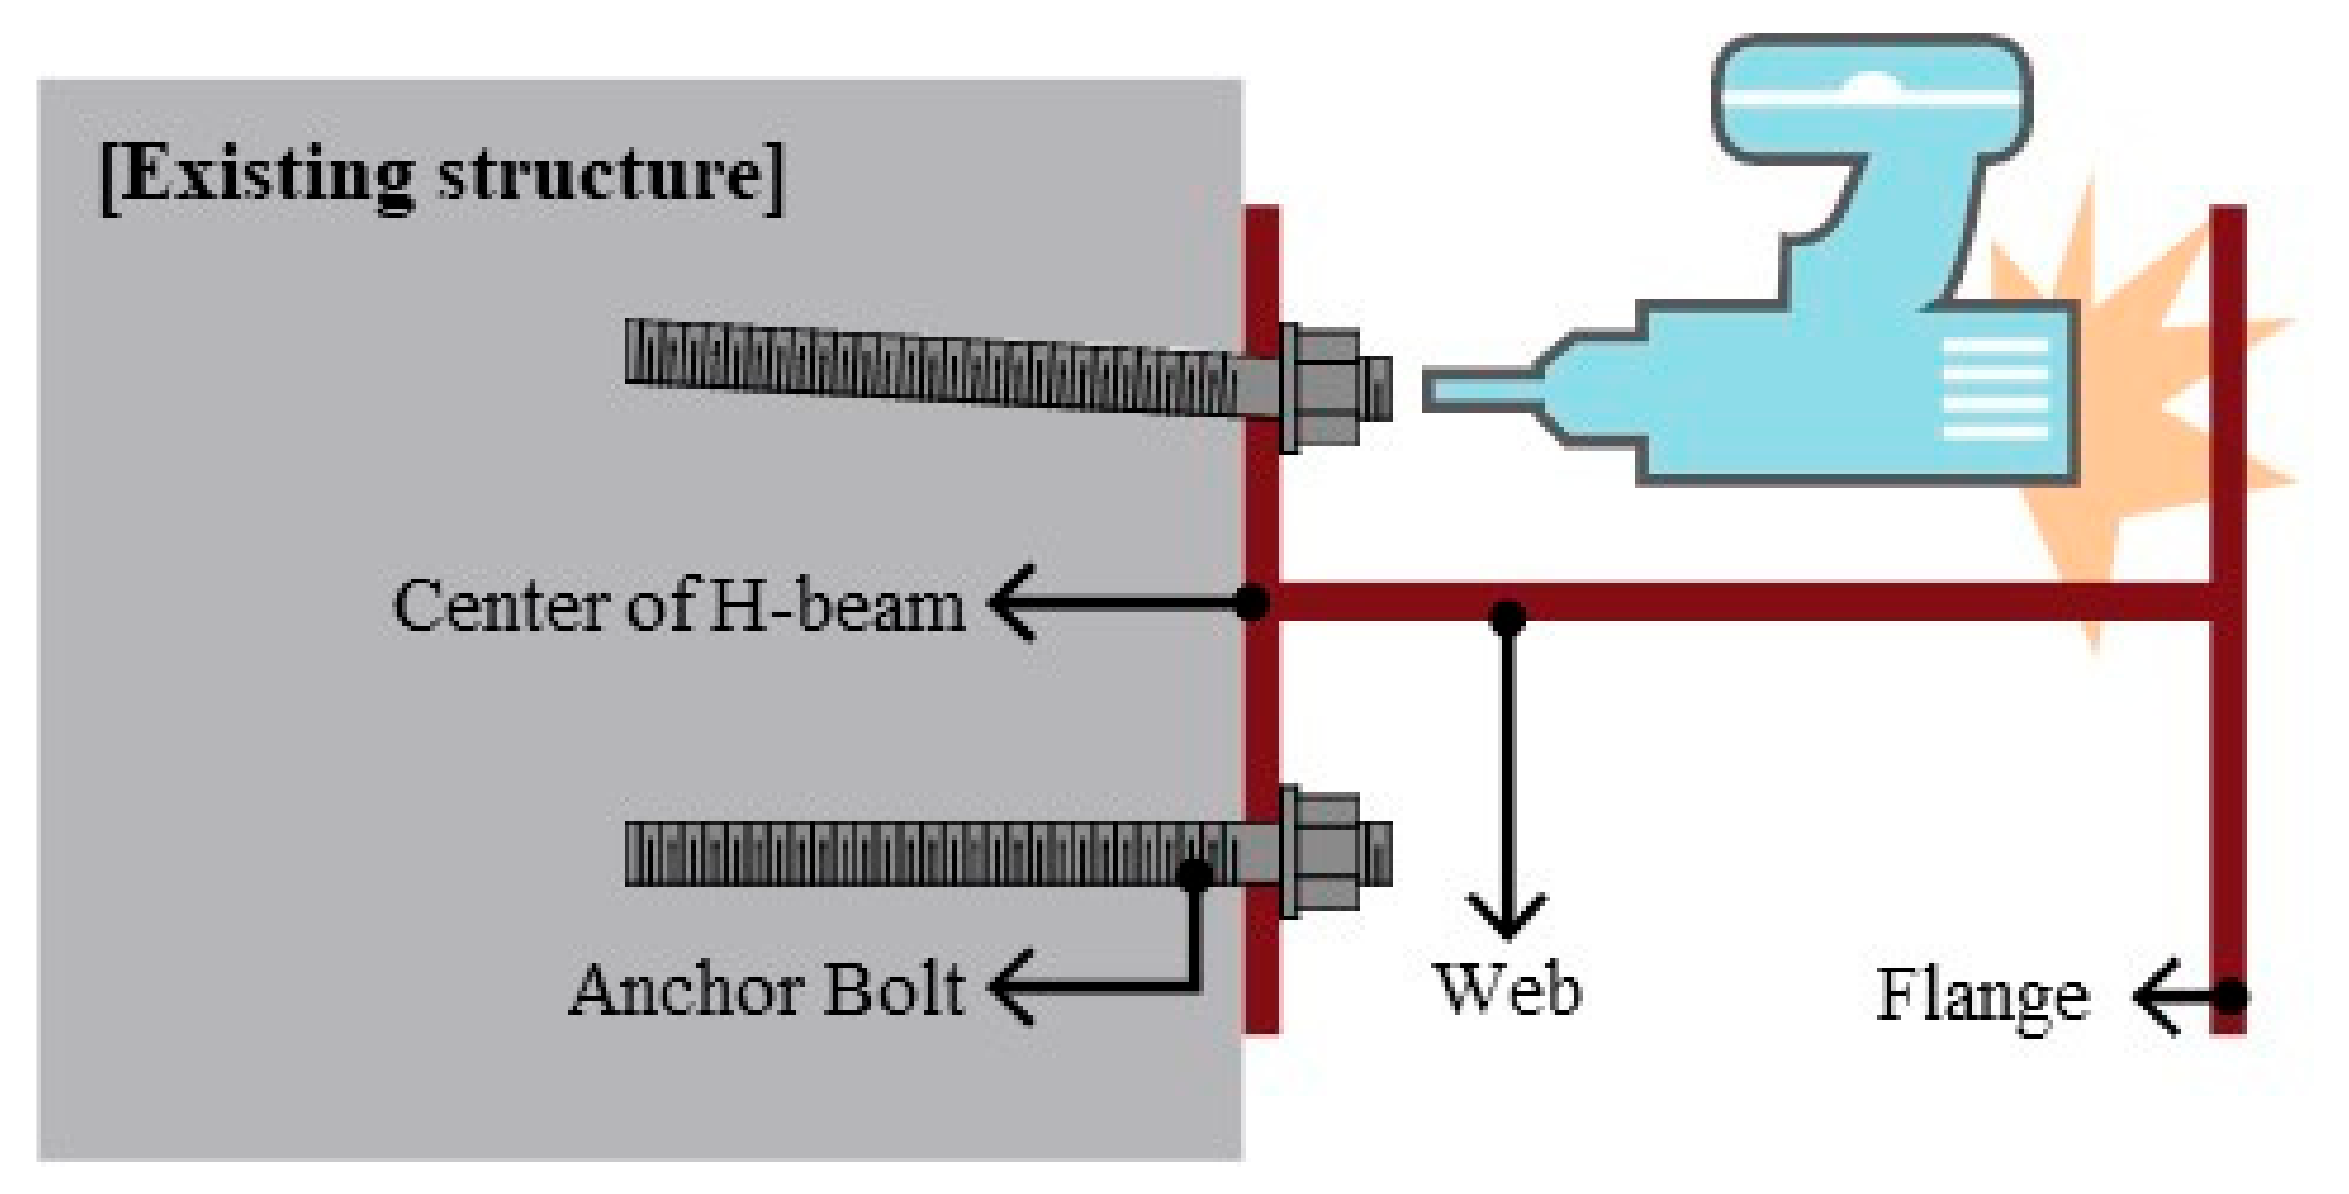
- Bore anchor bolt holes in the existing structure (columns and beams).
- (2)
- Install the connection device (steel plate) using anchor bolts.
- (3)
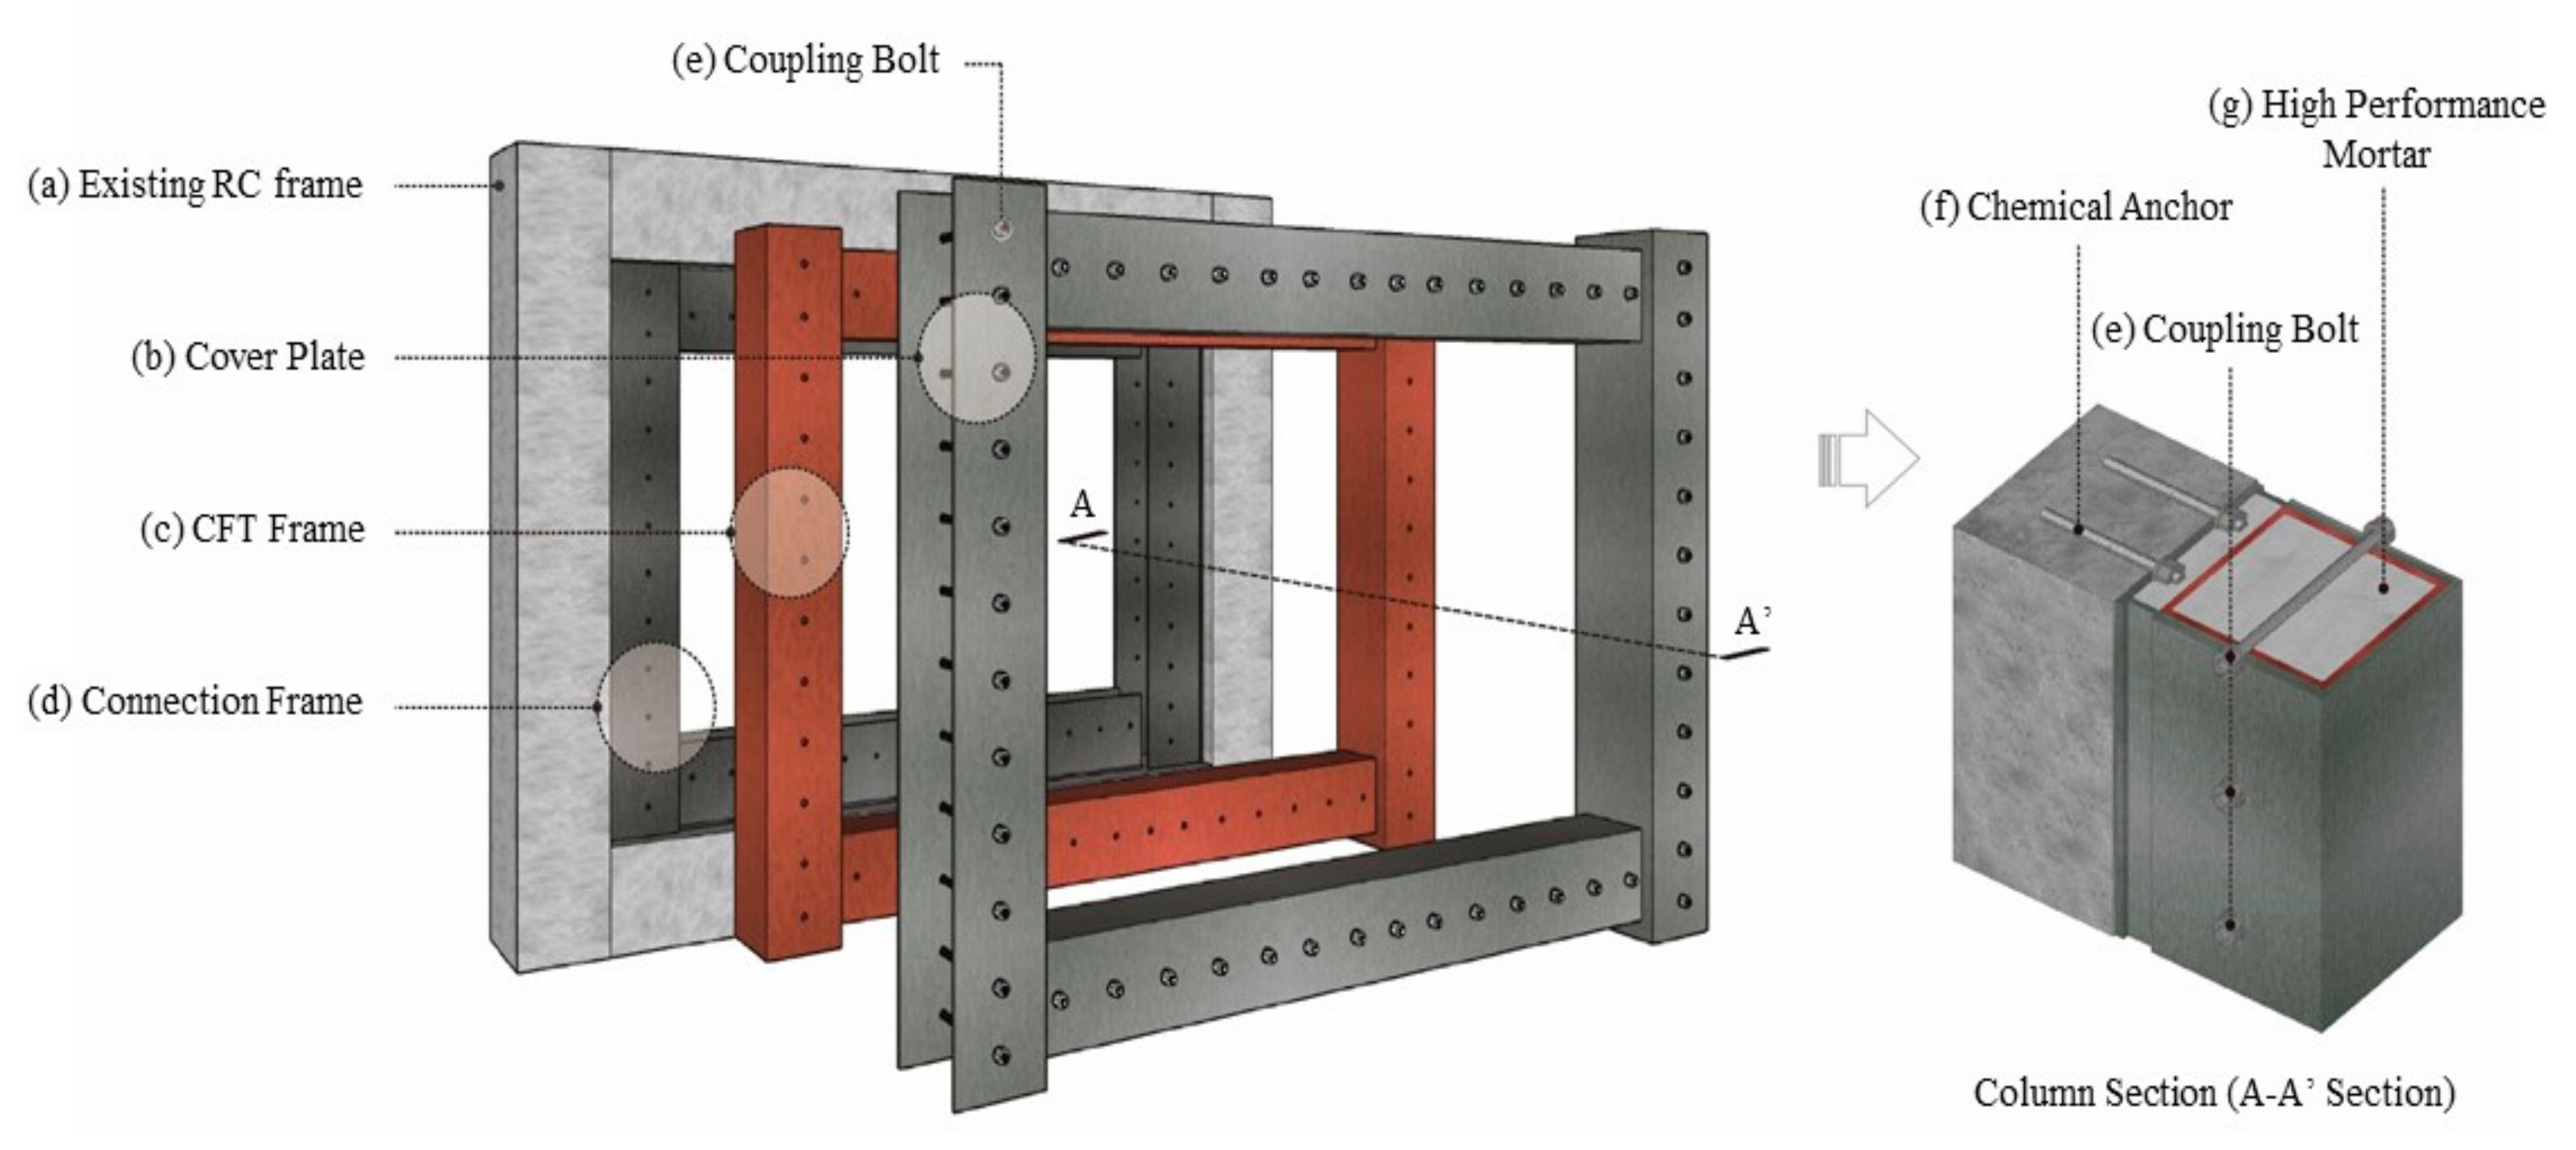
- Install the CFT frame for seismic retrofitting.
- (4)
- Install the cover plate (steel plate) using coupling bolts.
- (5)
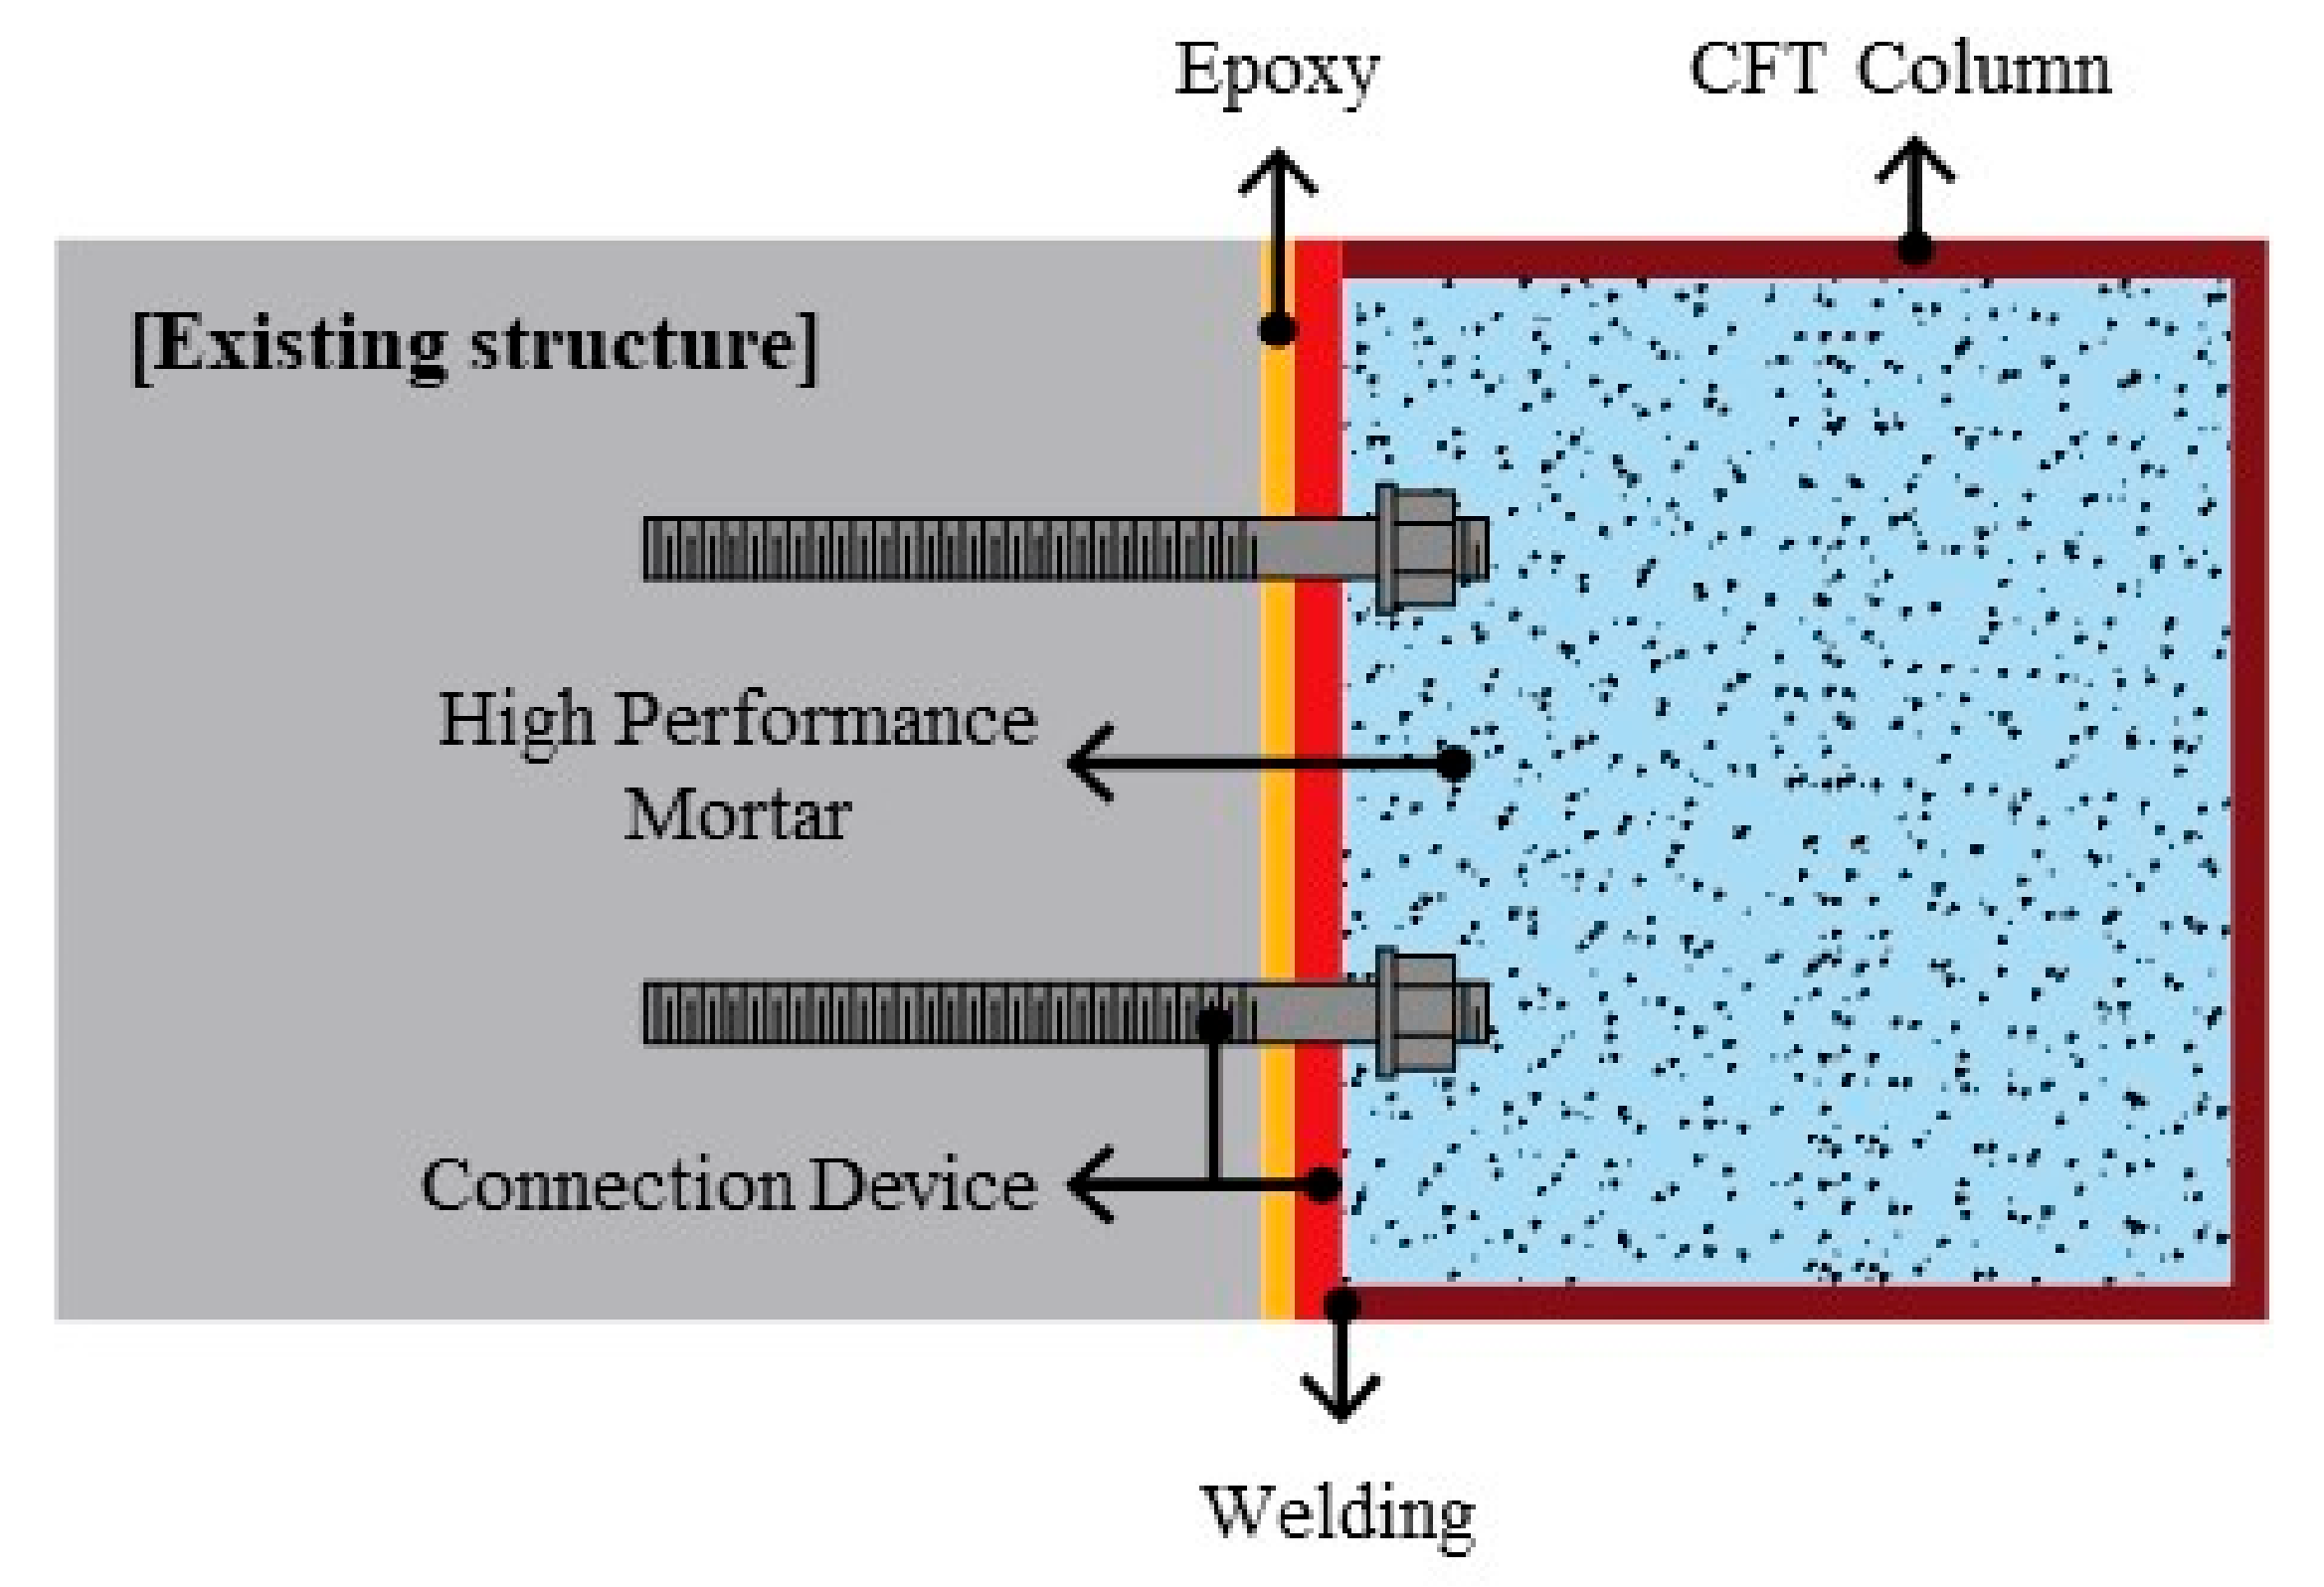
- Inject high-performance mortar and conduct finish work.
3. Overview of Pseudo-Dynamic Testing and Result Analysis
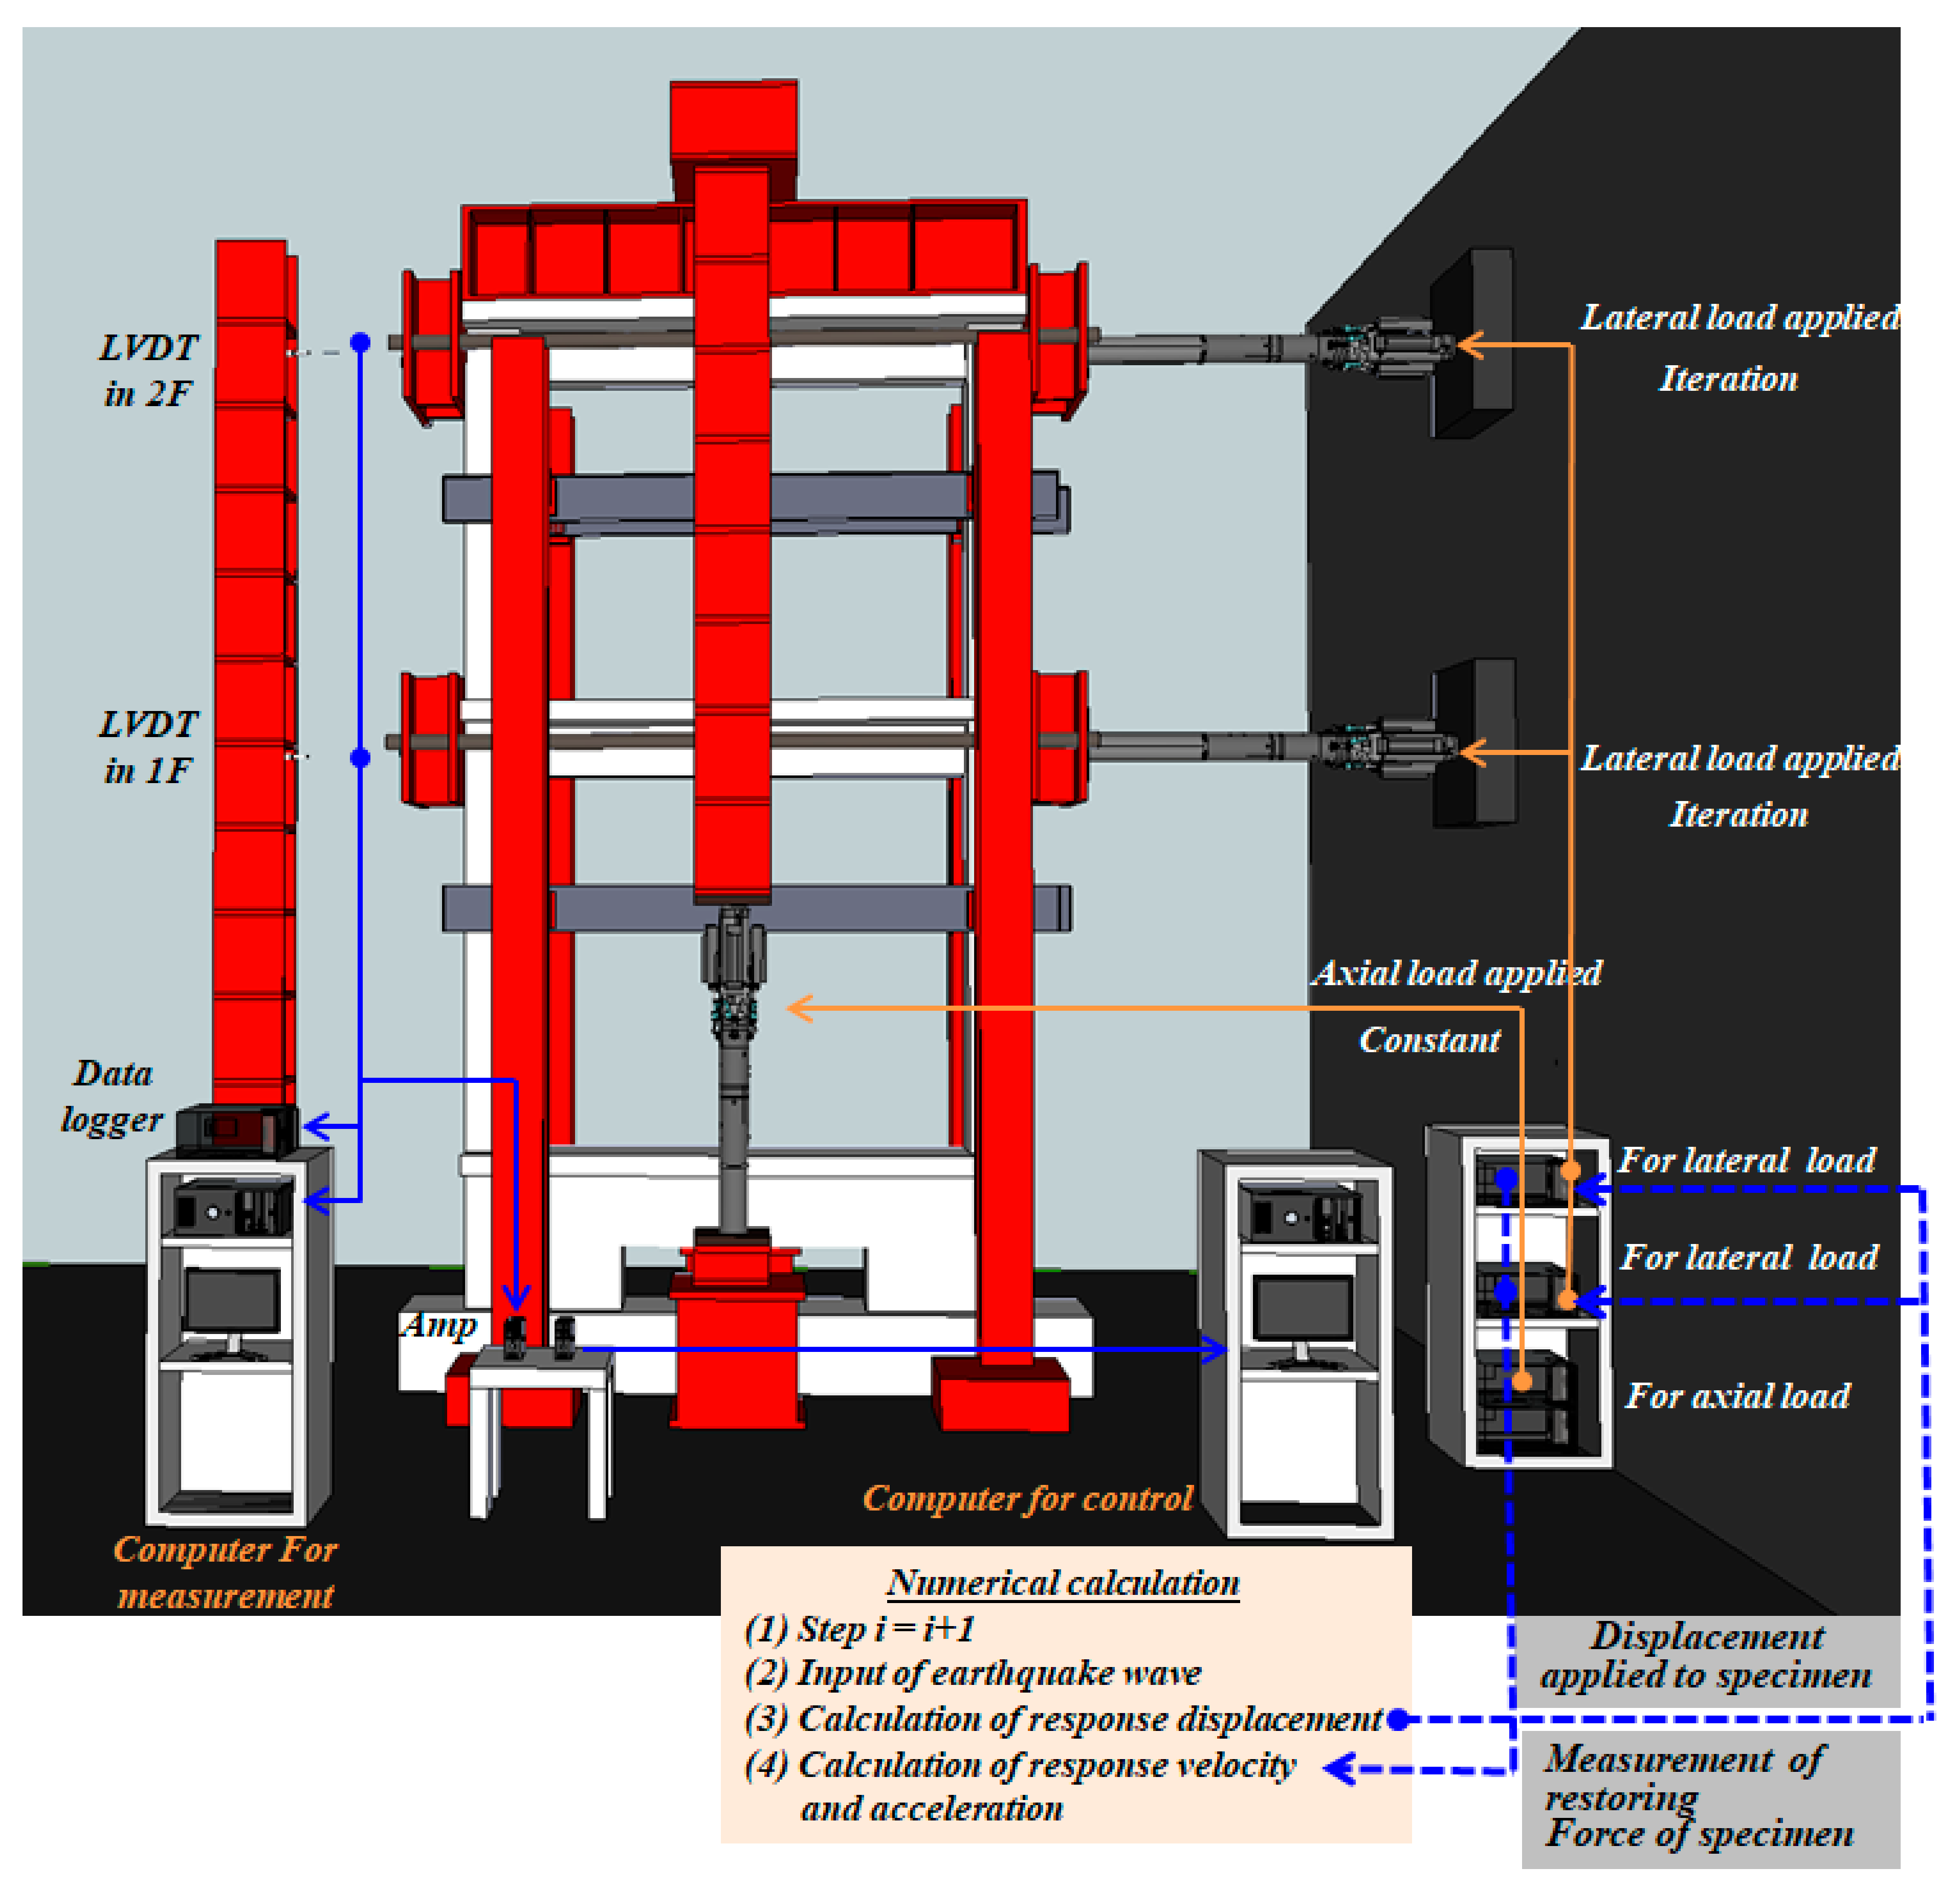
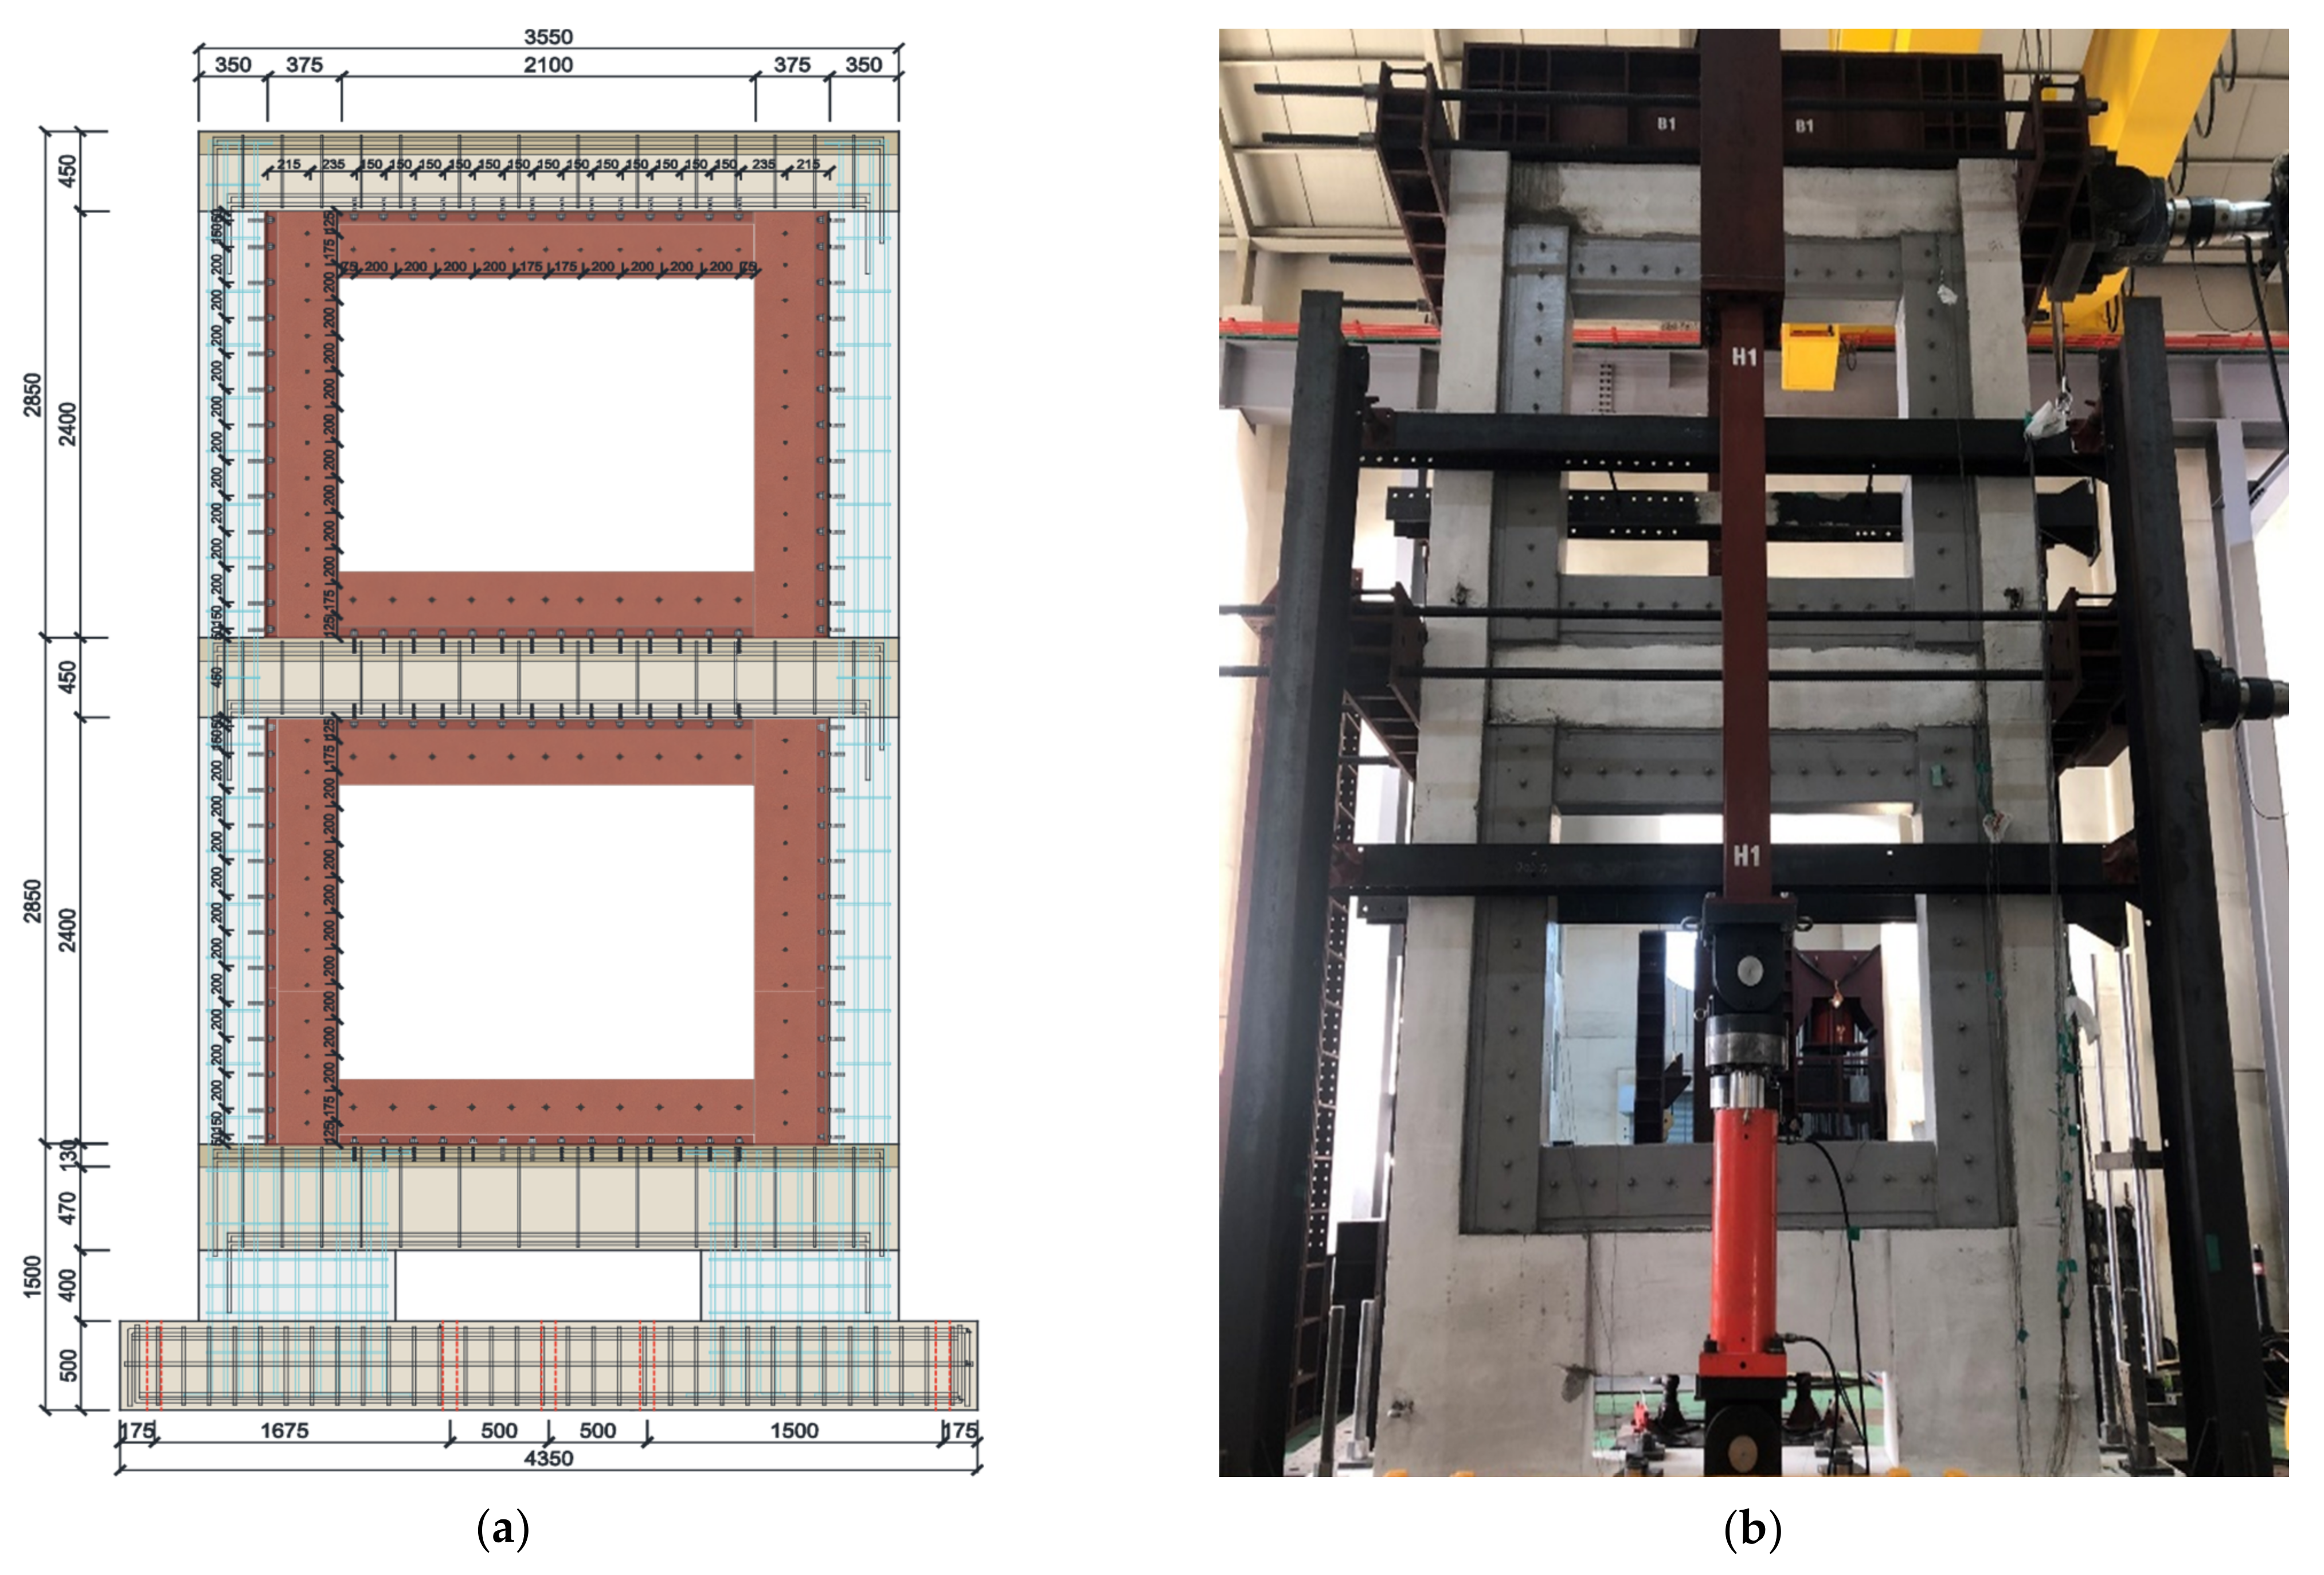
3.1. Pseudo-Dynamic Testing System and Test Methods
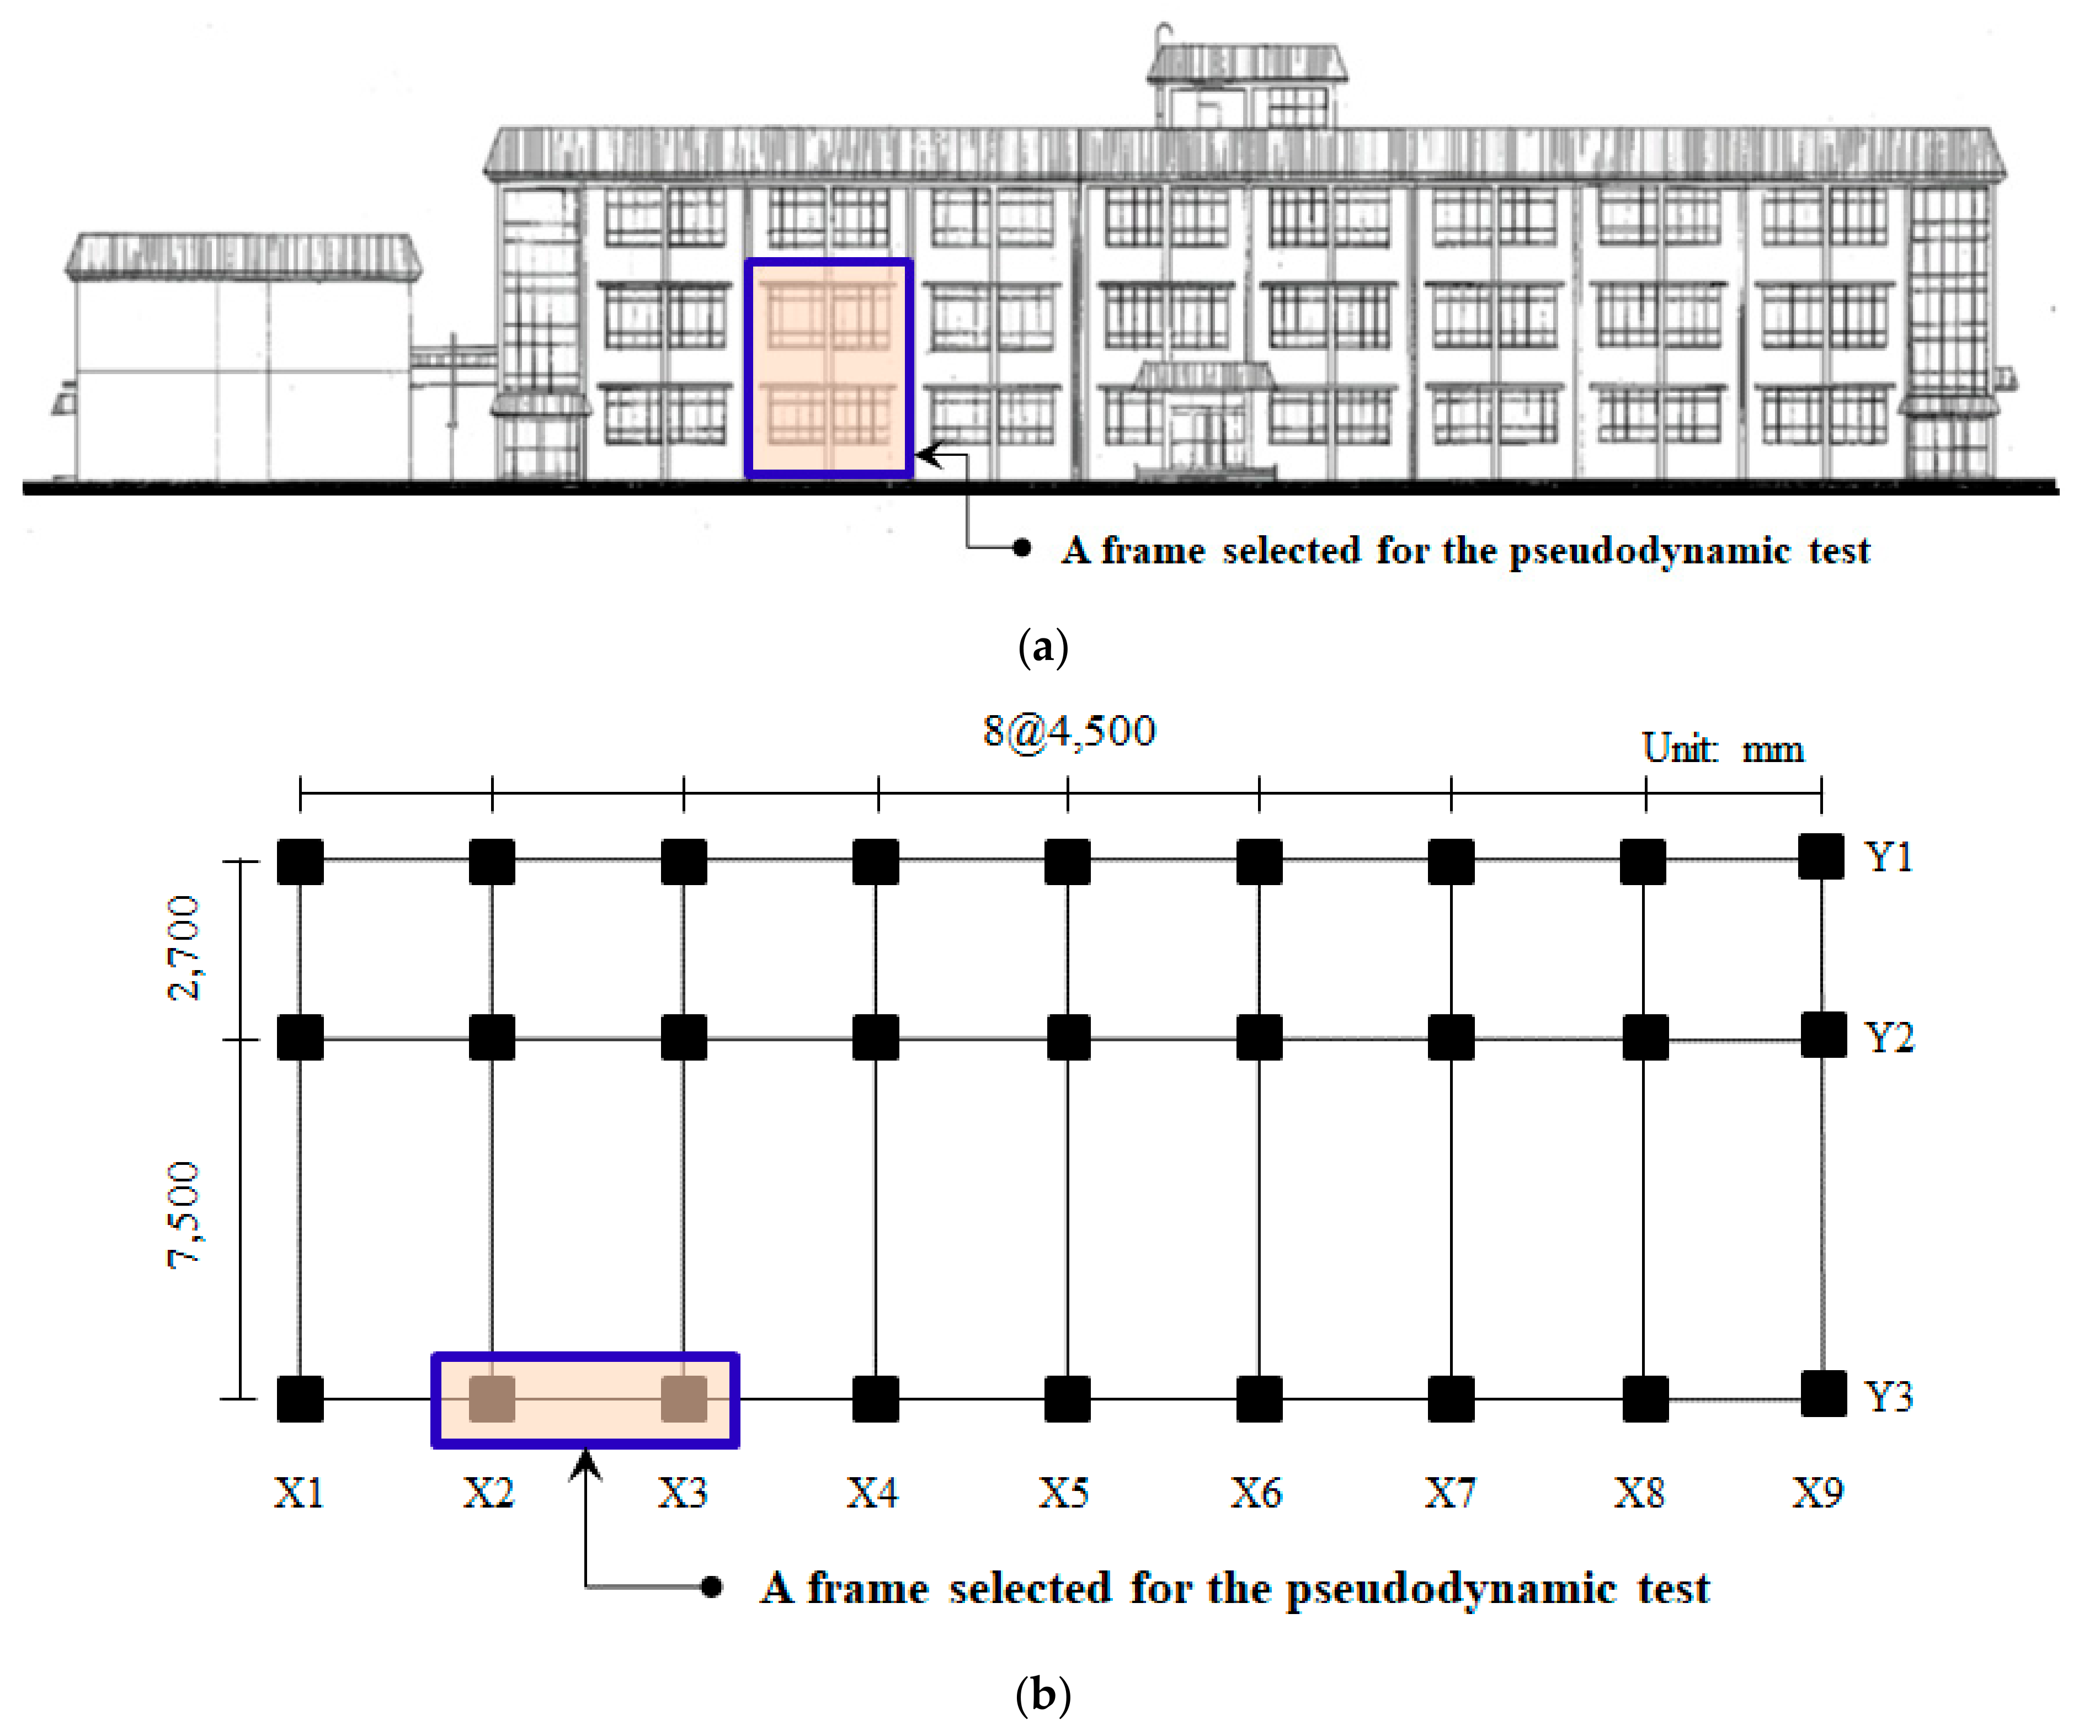
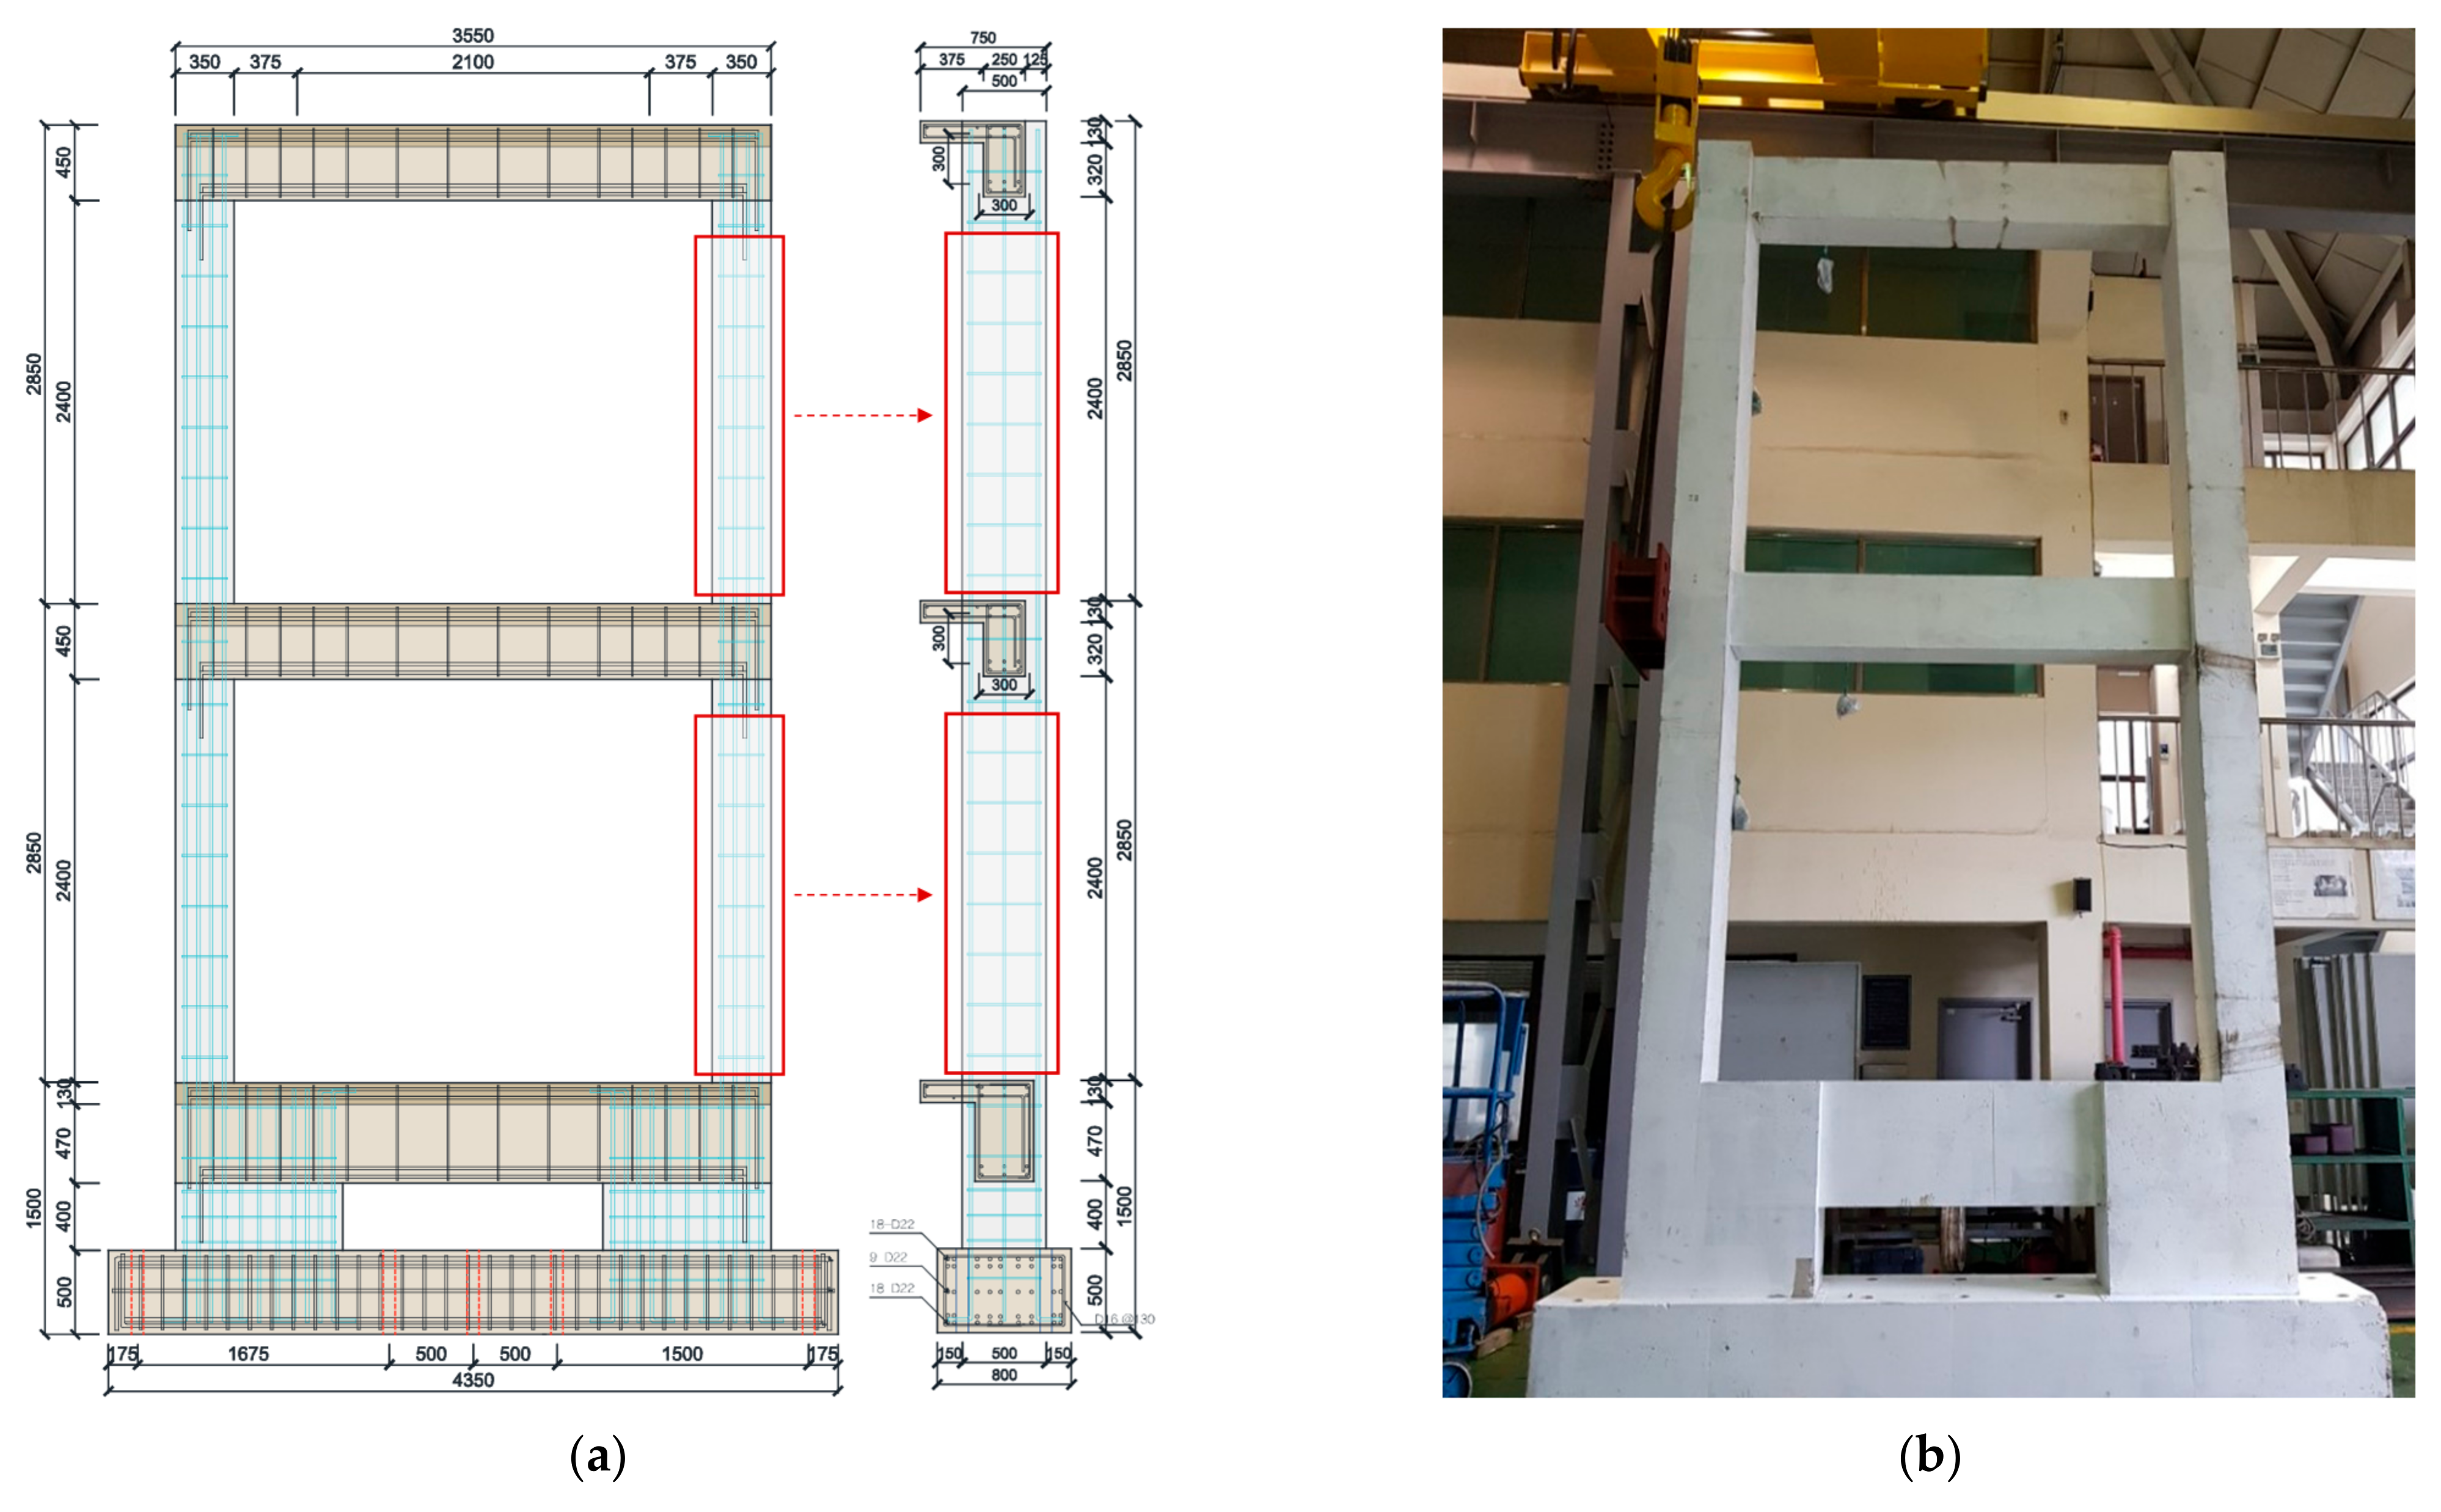
3.2. Specimen Preparation and Parameters
3.3. Used Materials and Their Properties
3.4. Experimental Results and Analysis
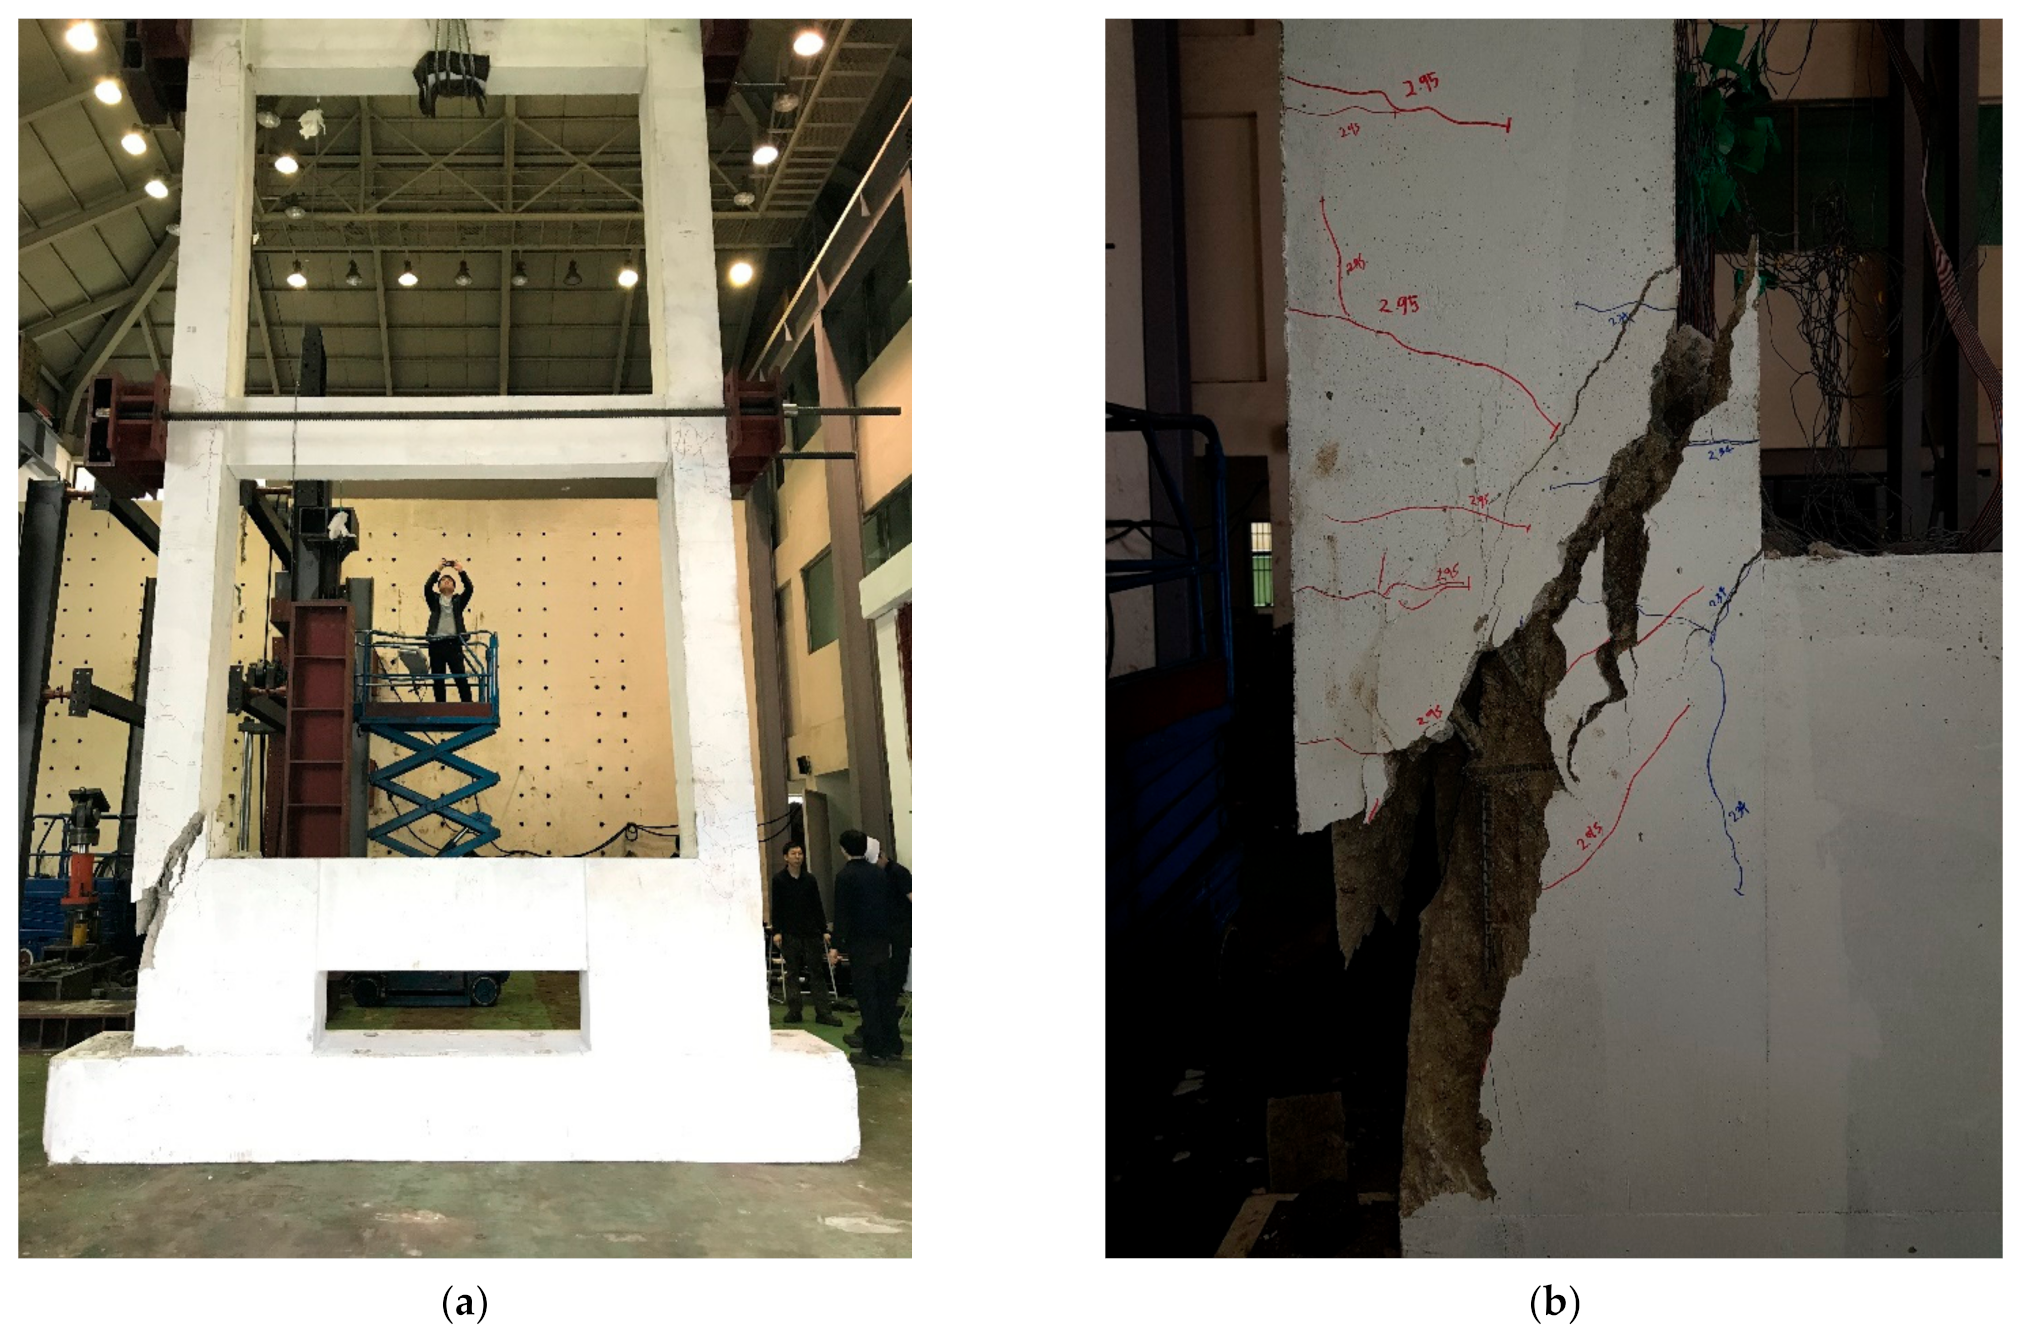
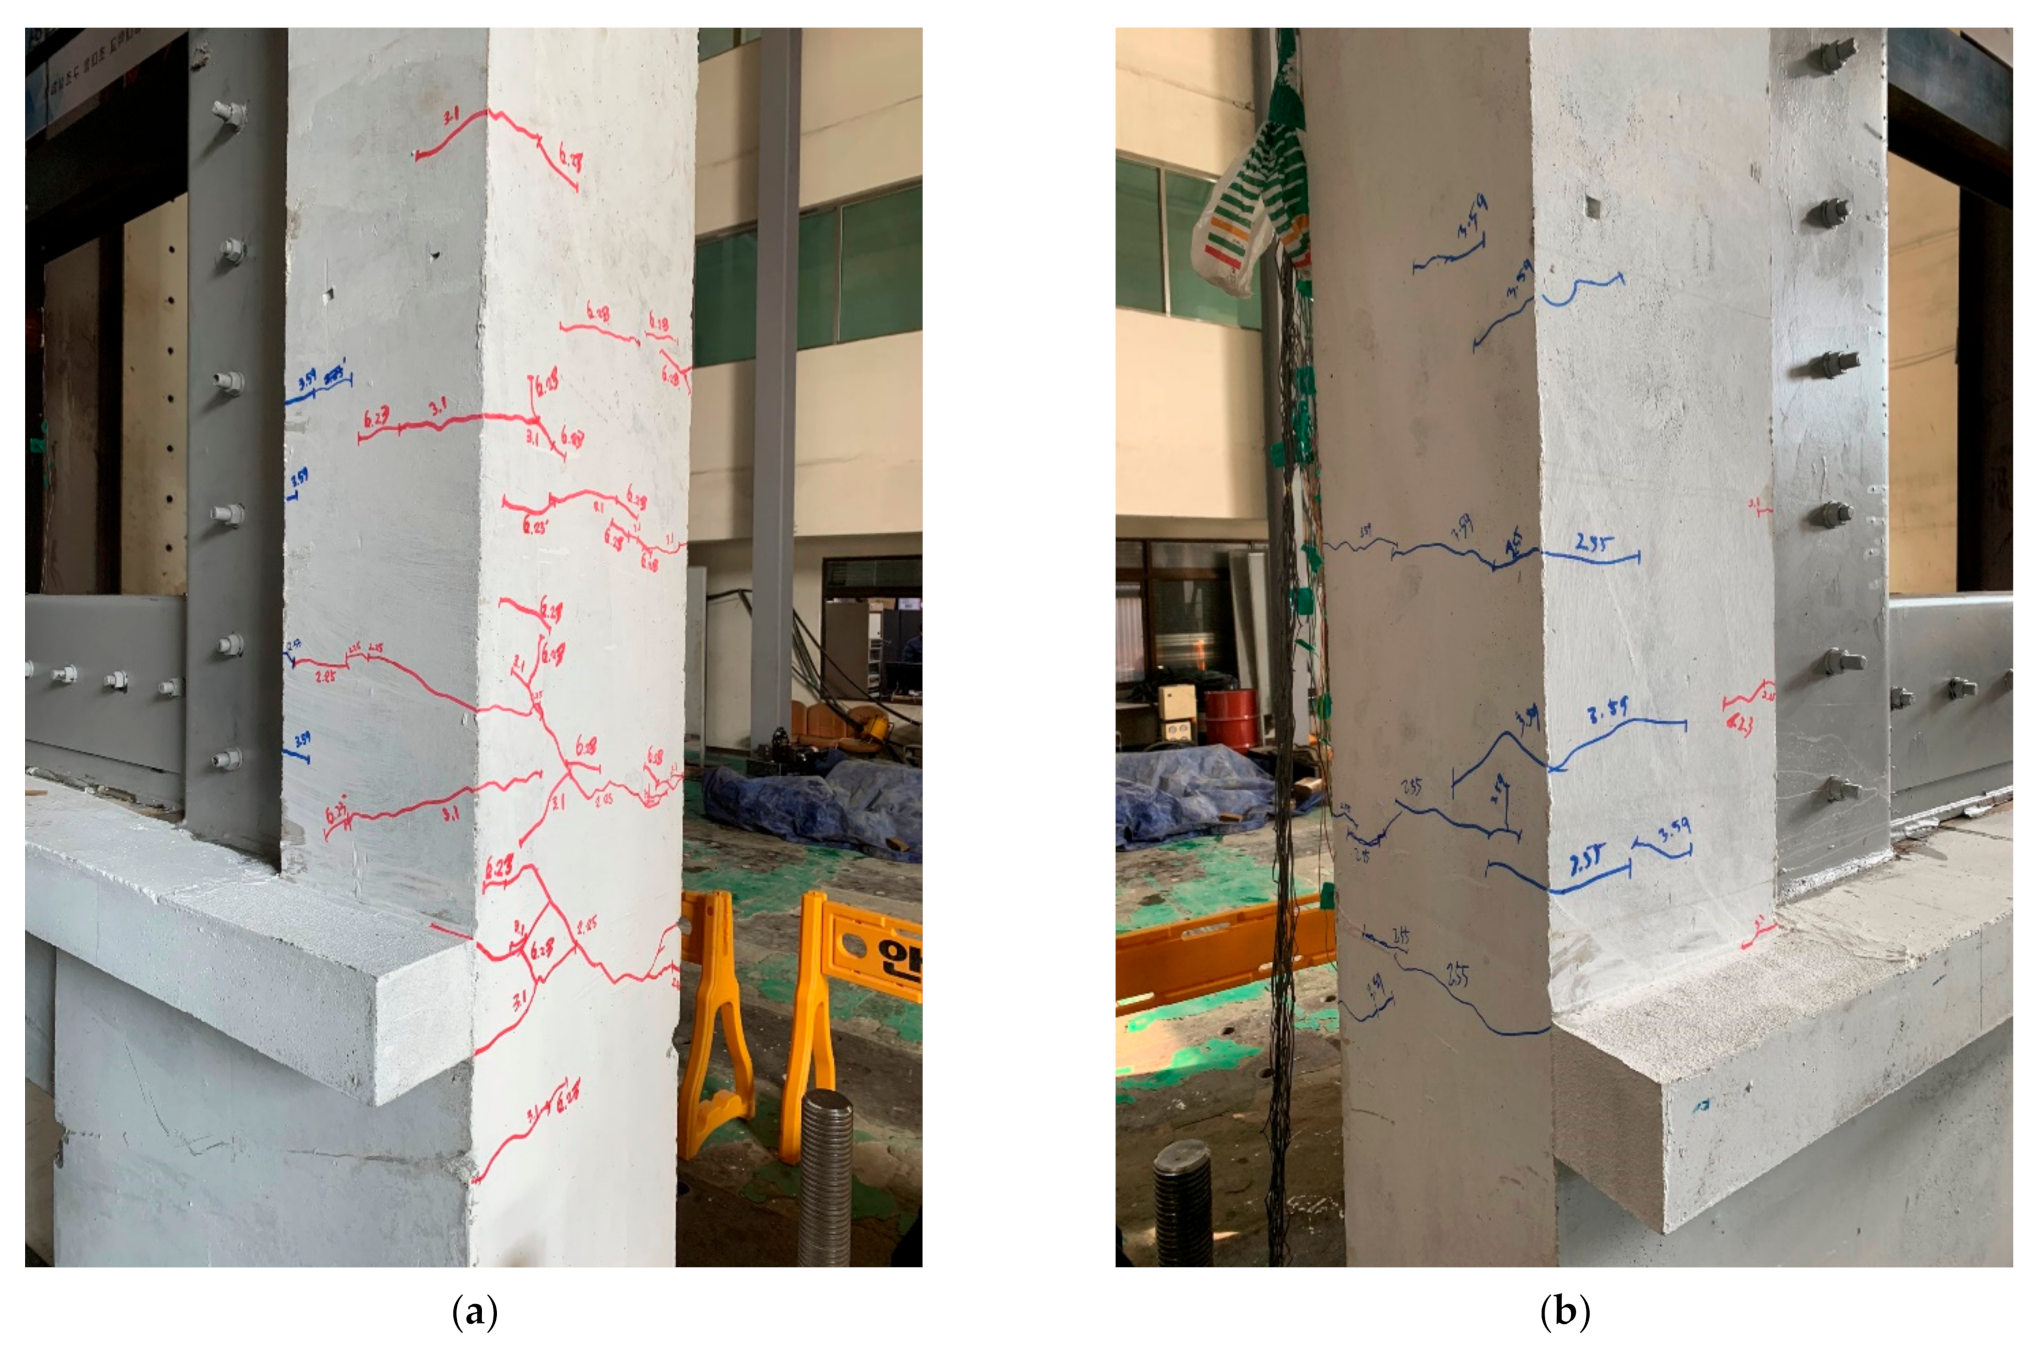
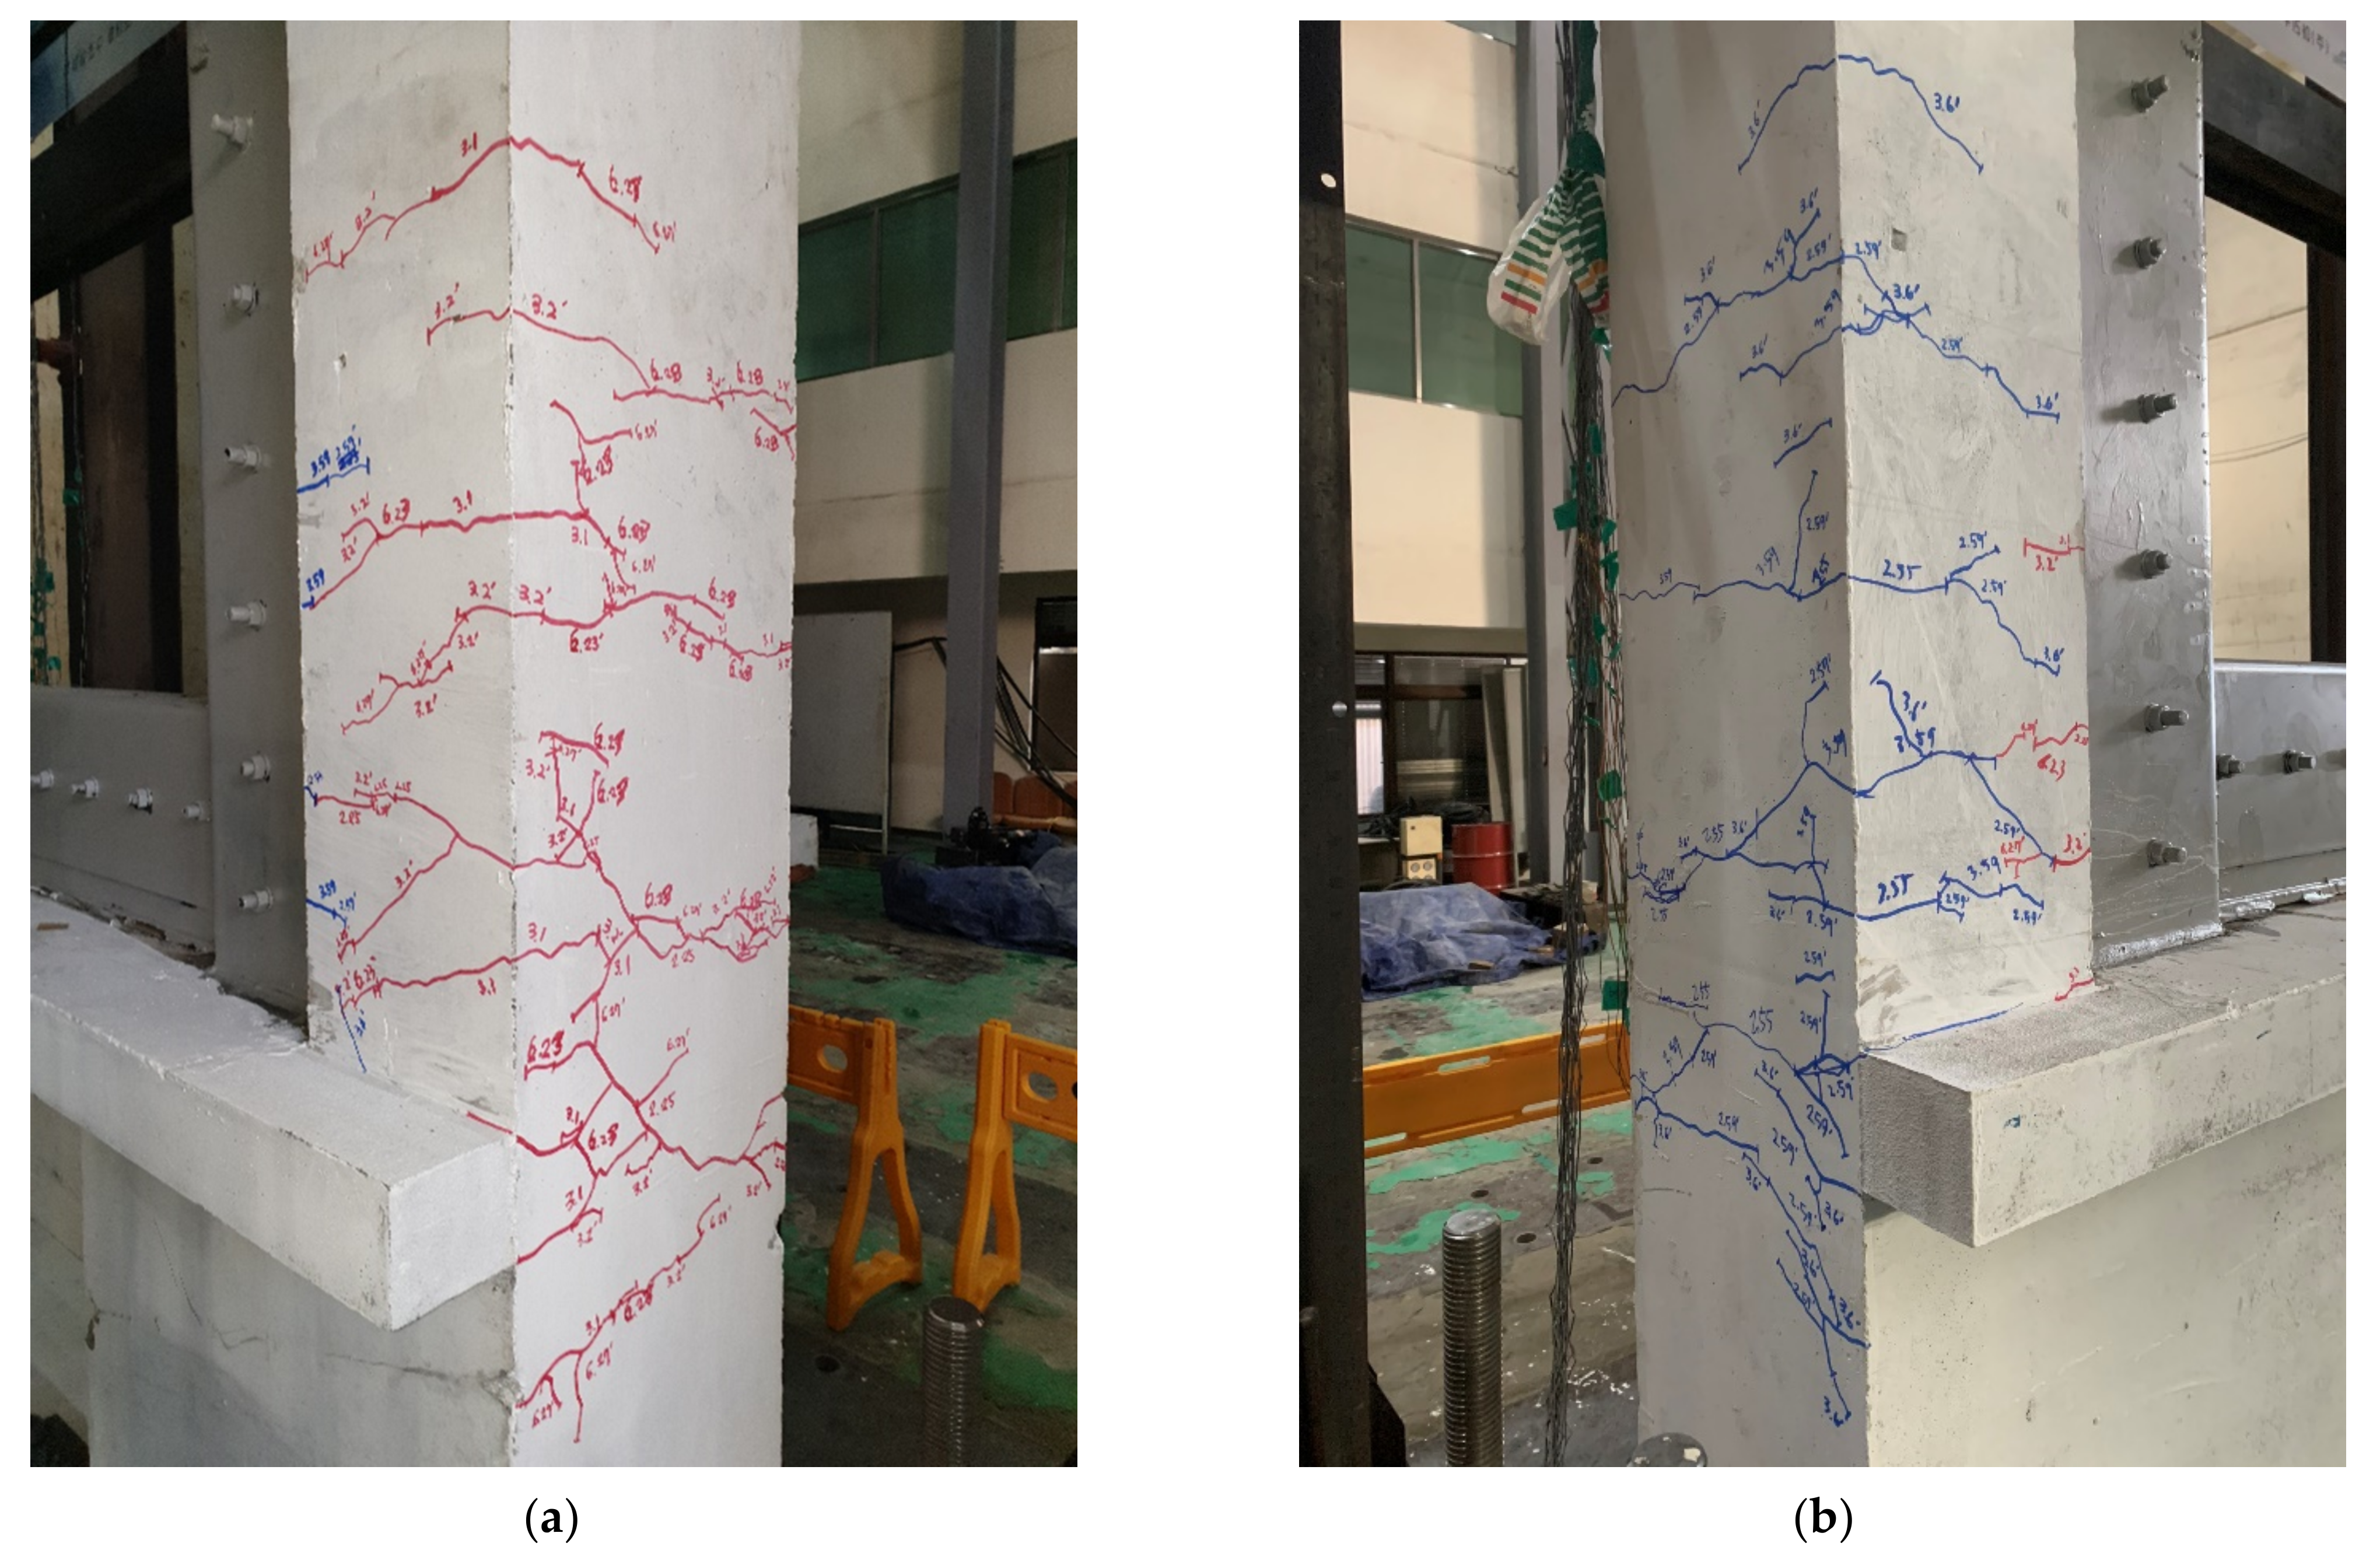
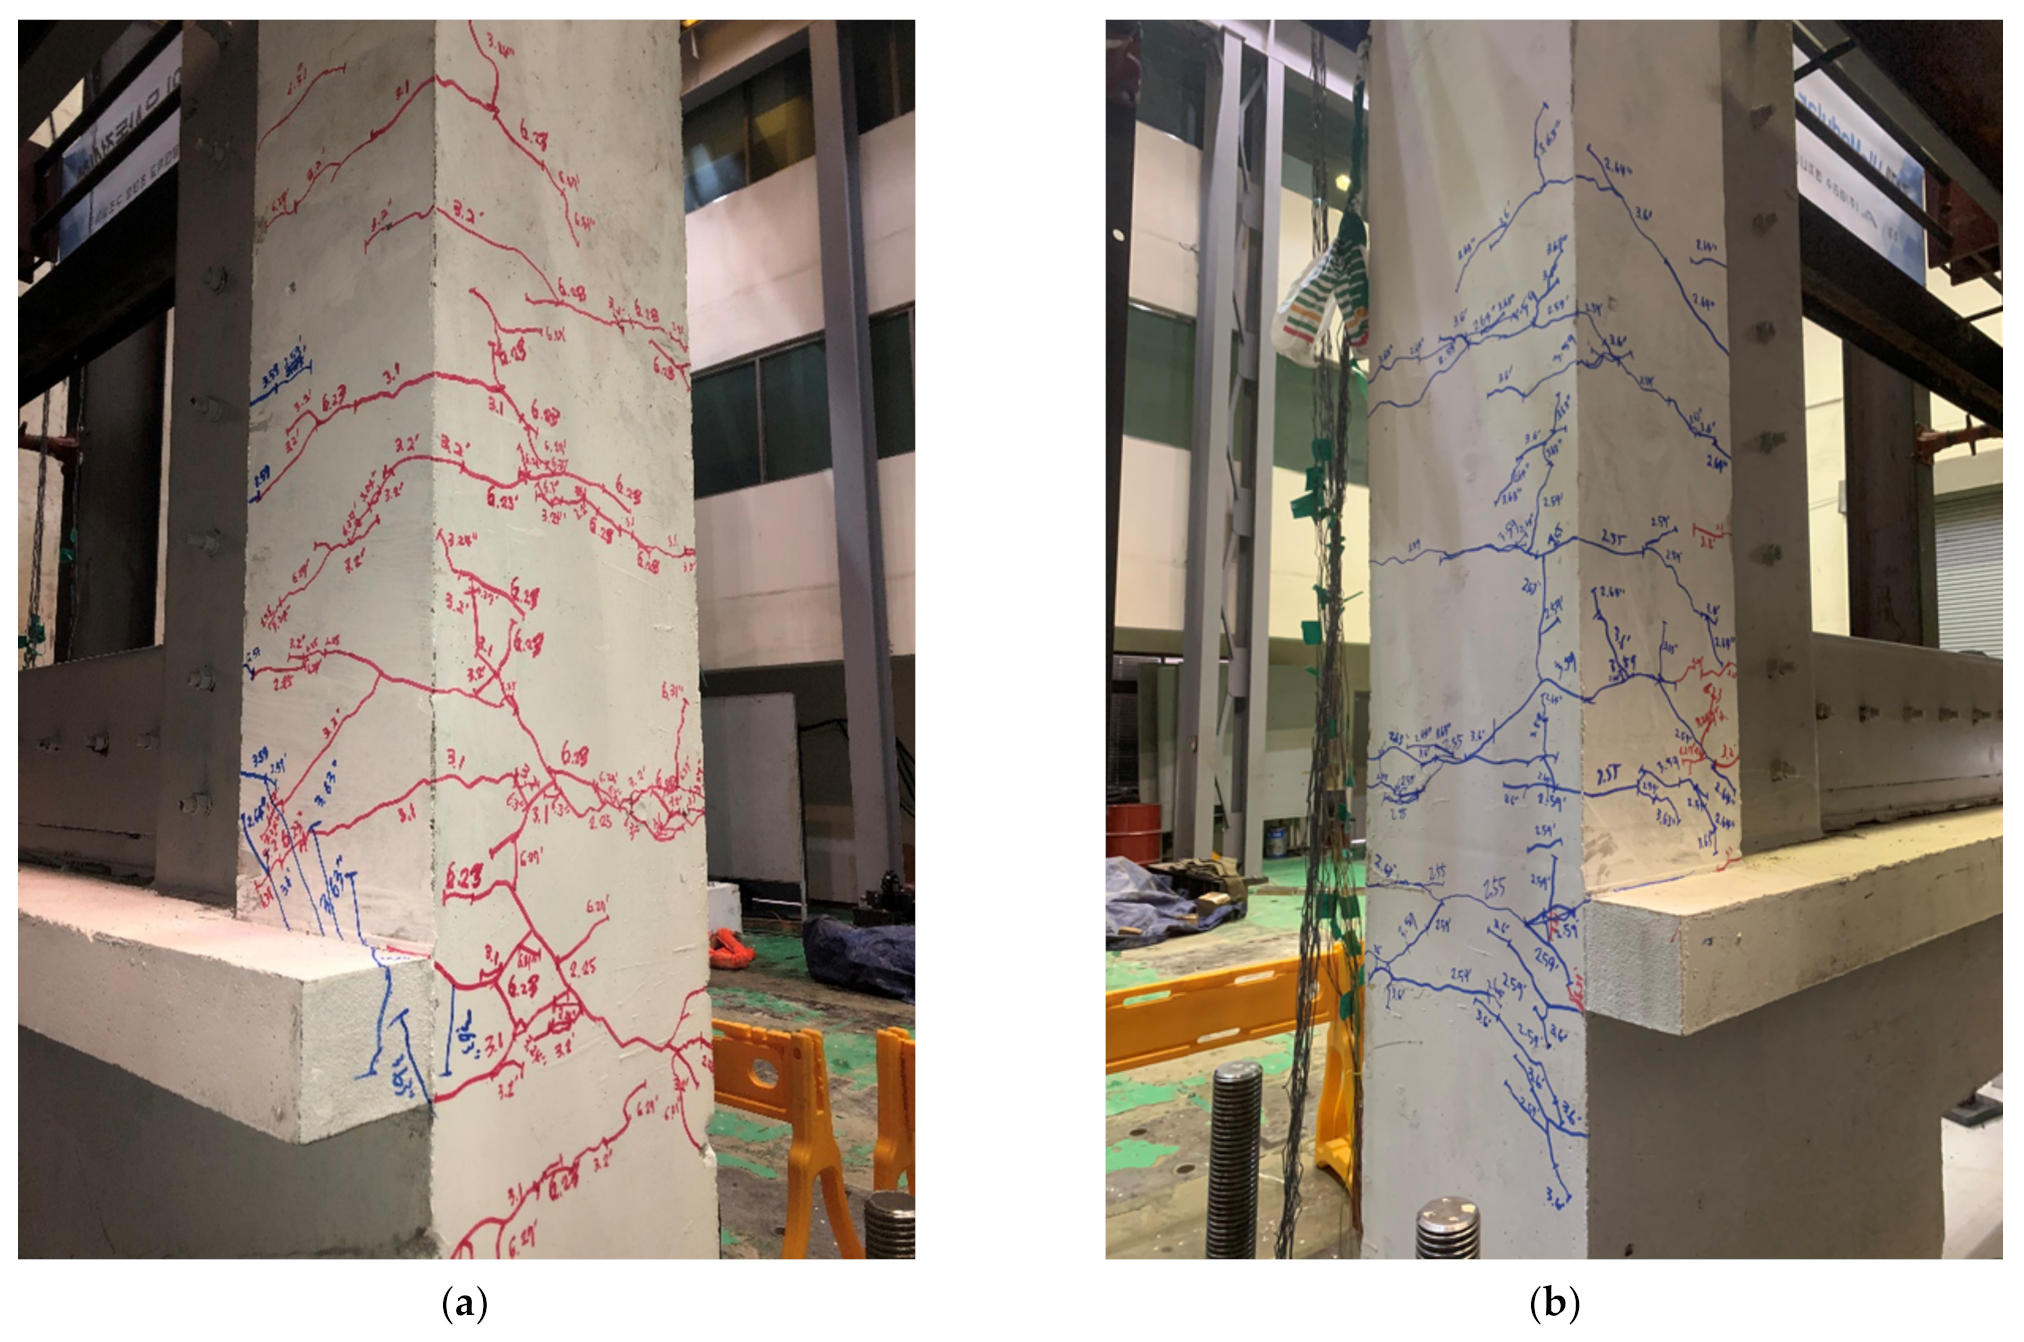
3.4.1. Crack and Failure Morphology
3.4.2. Maximum Seismic Response Load and Displacement
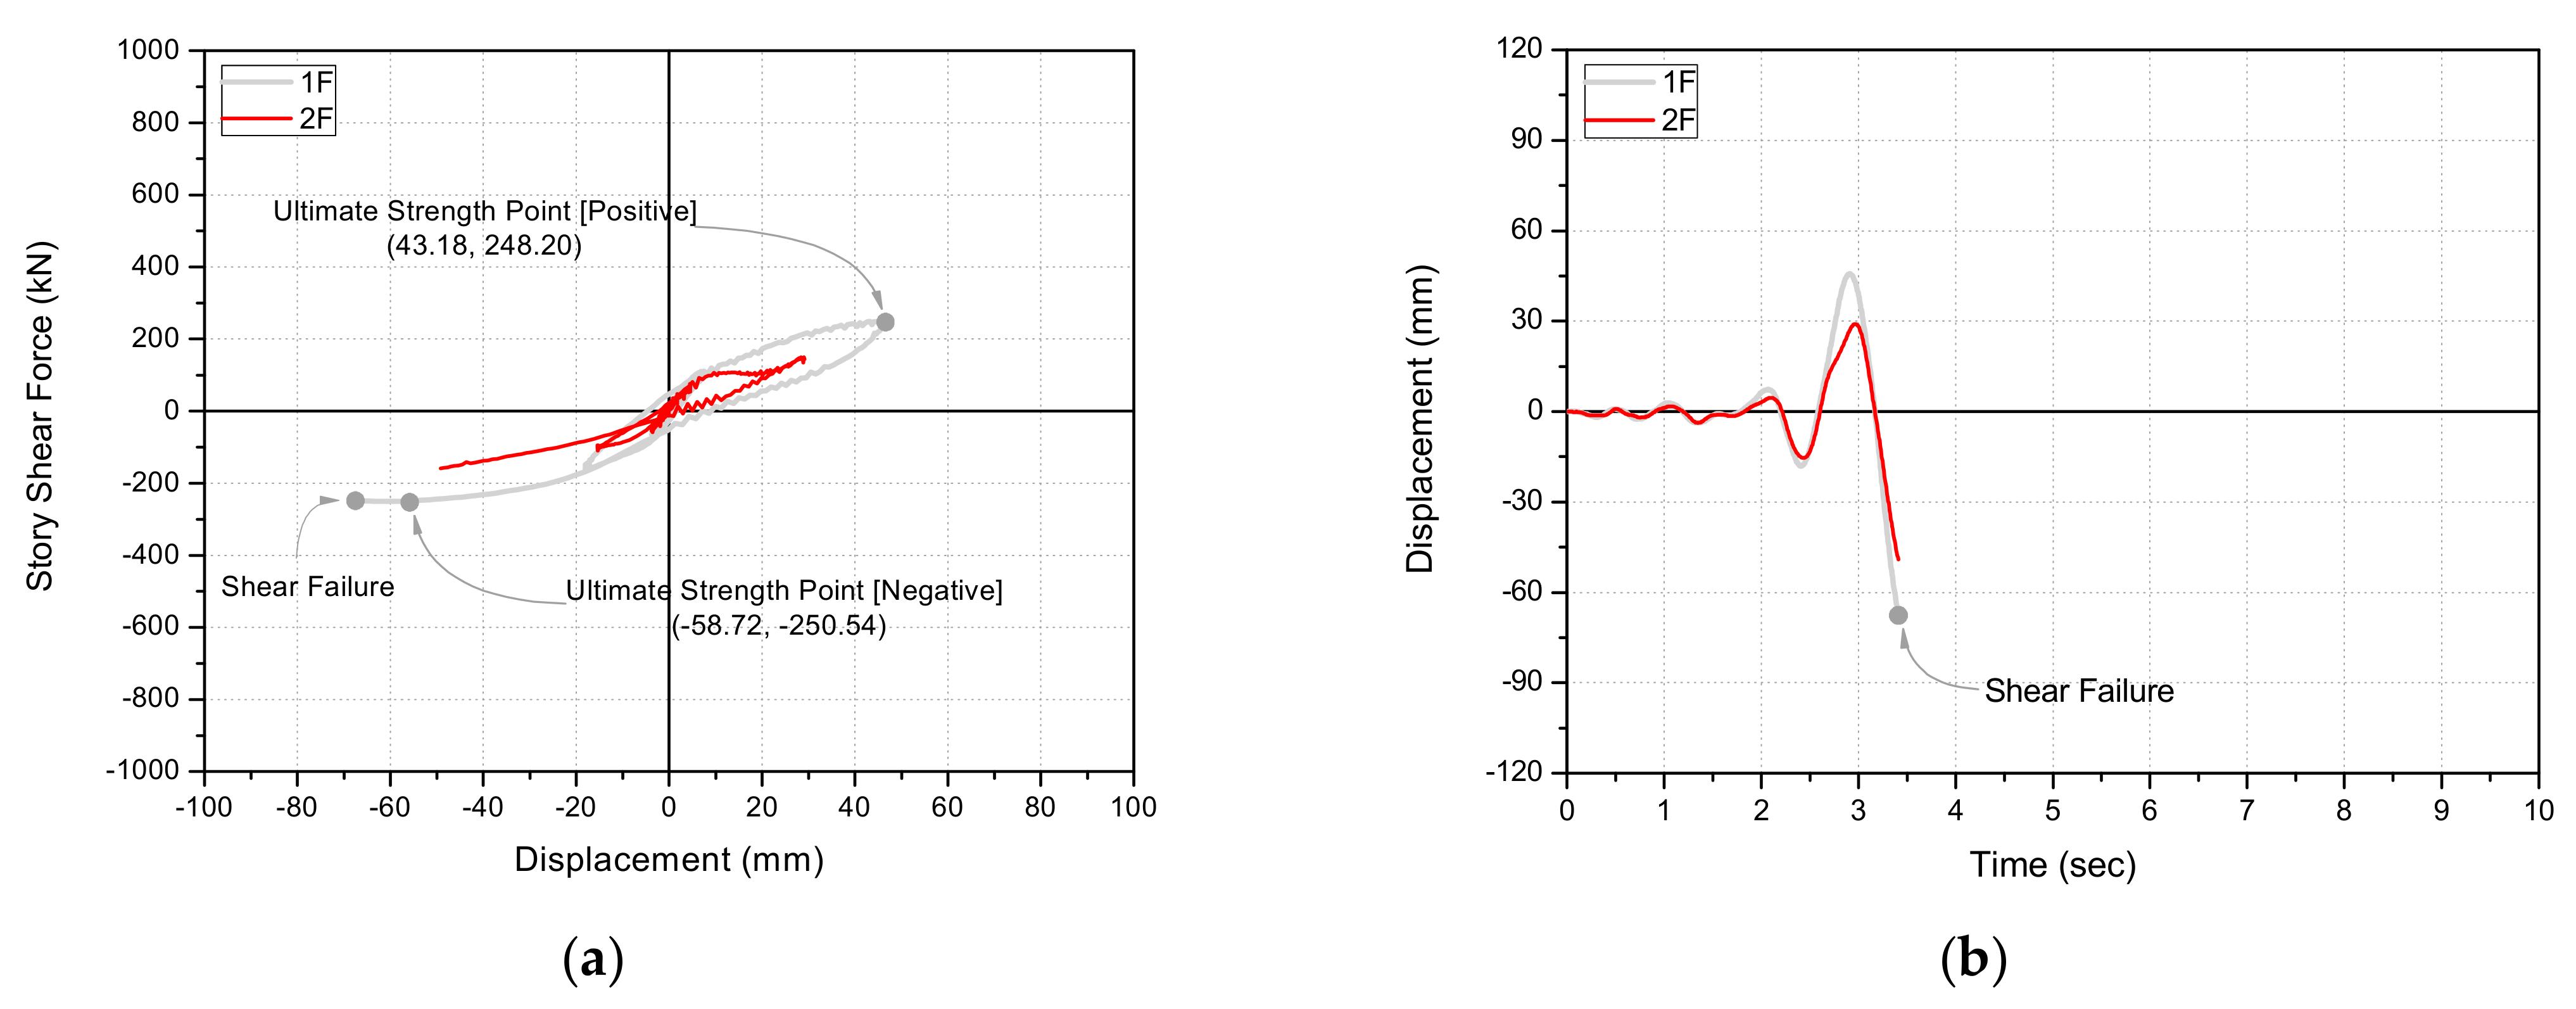
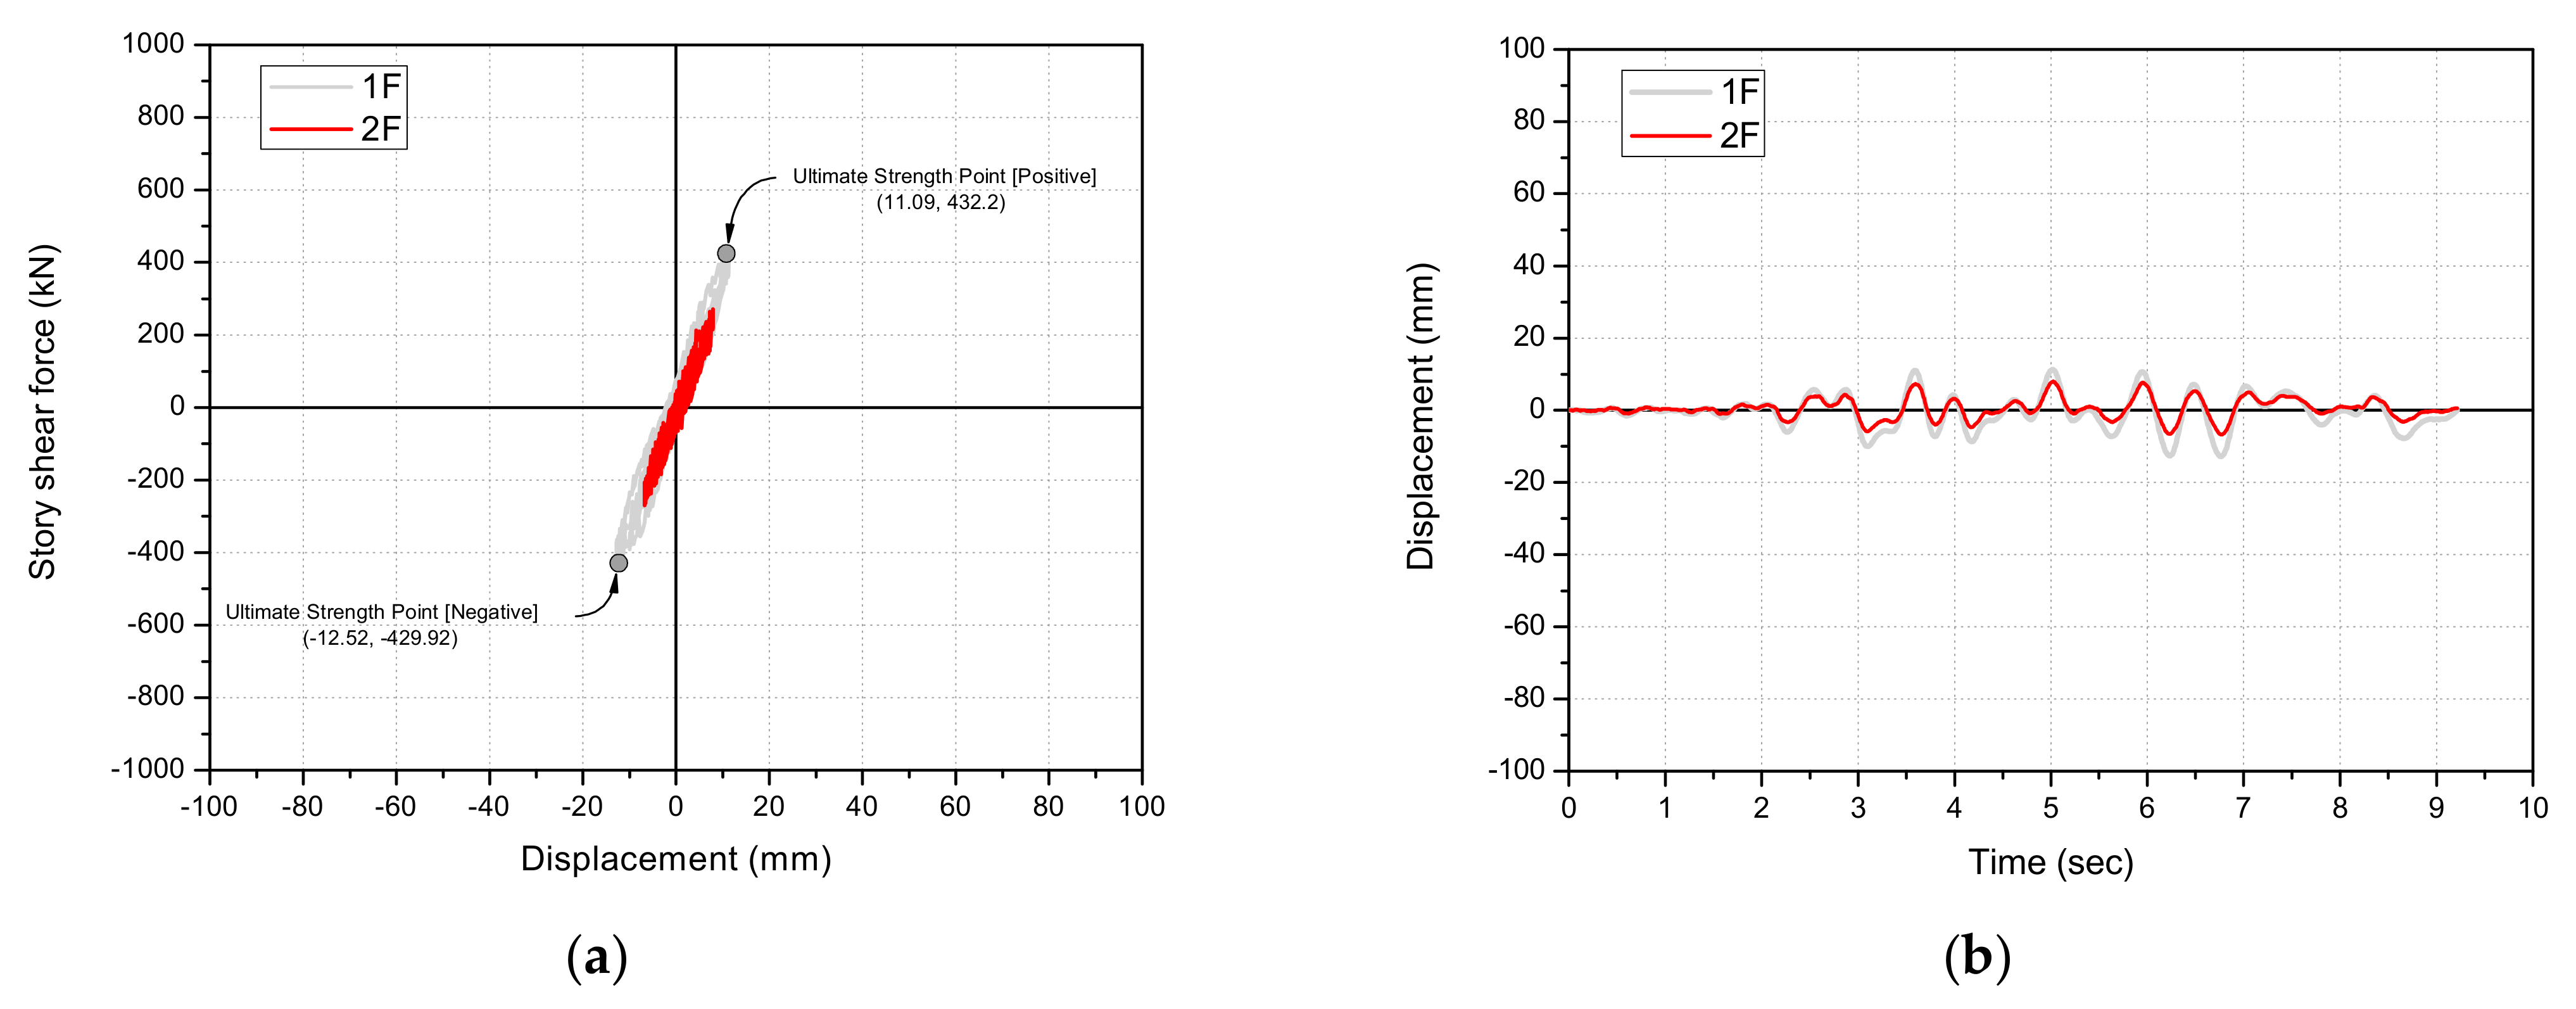
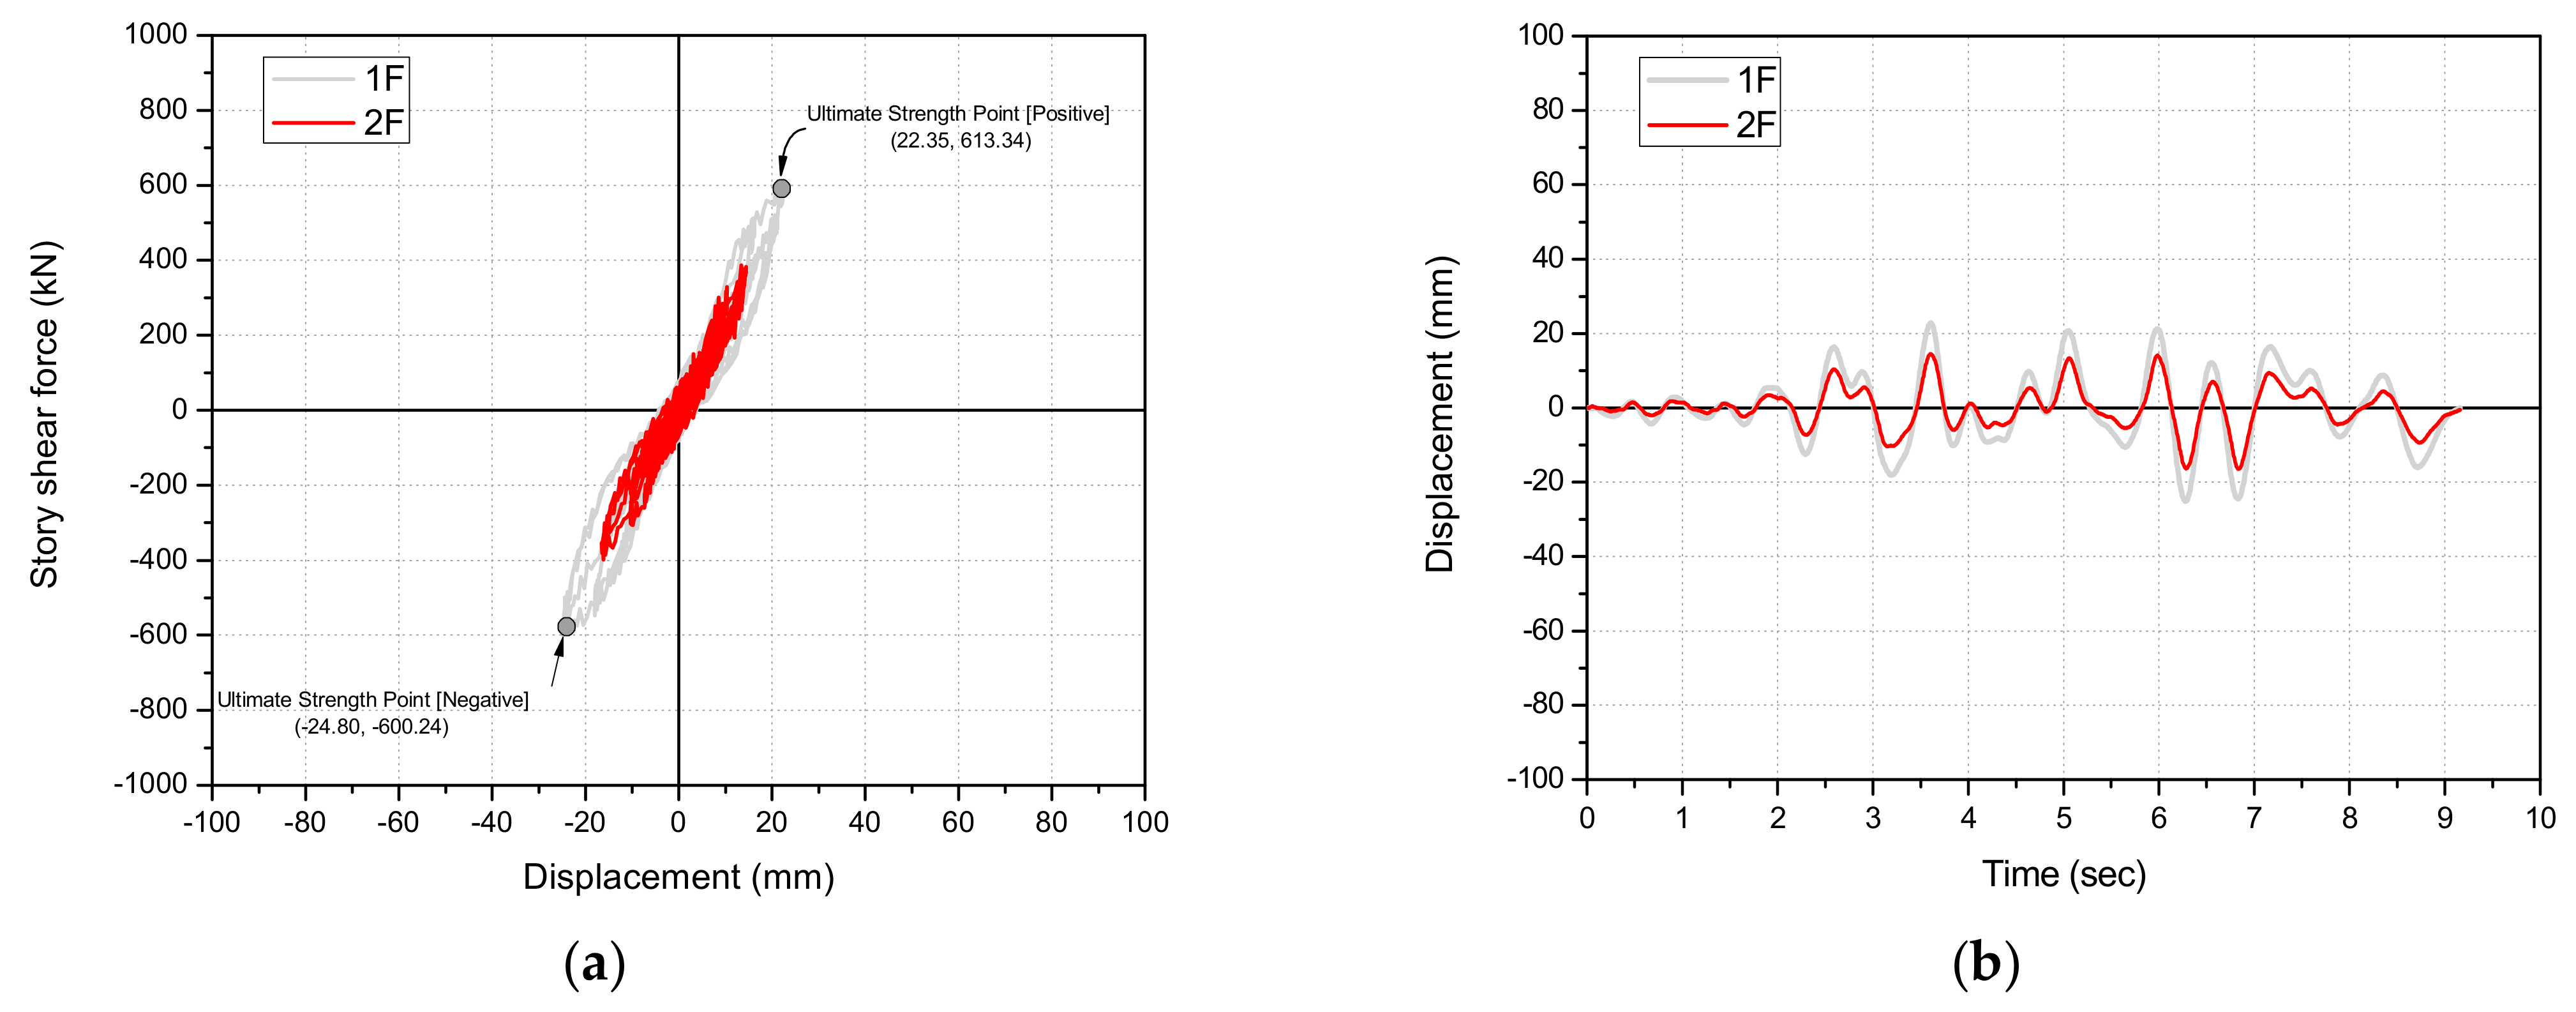
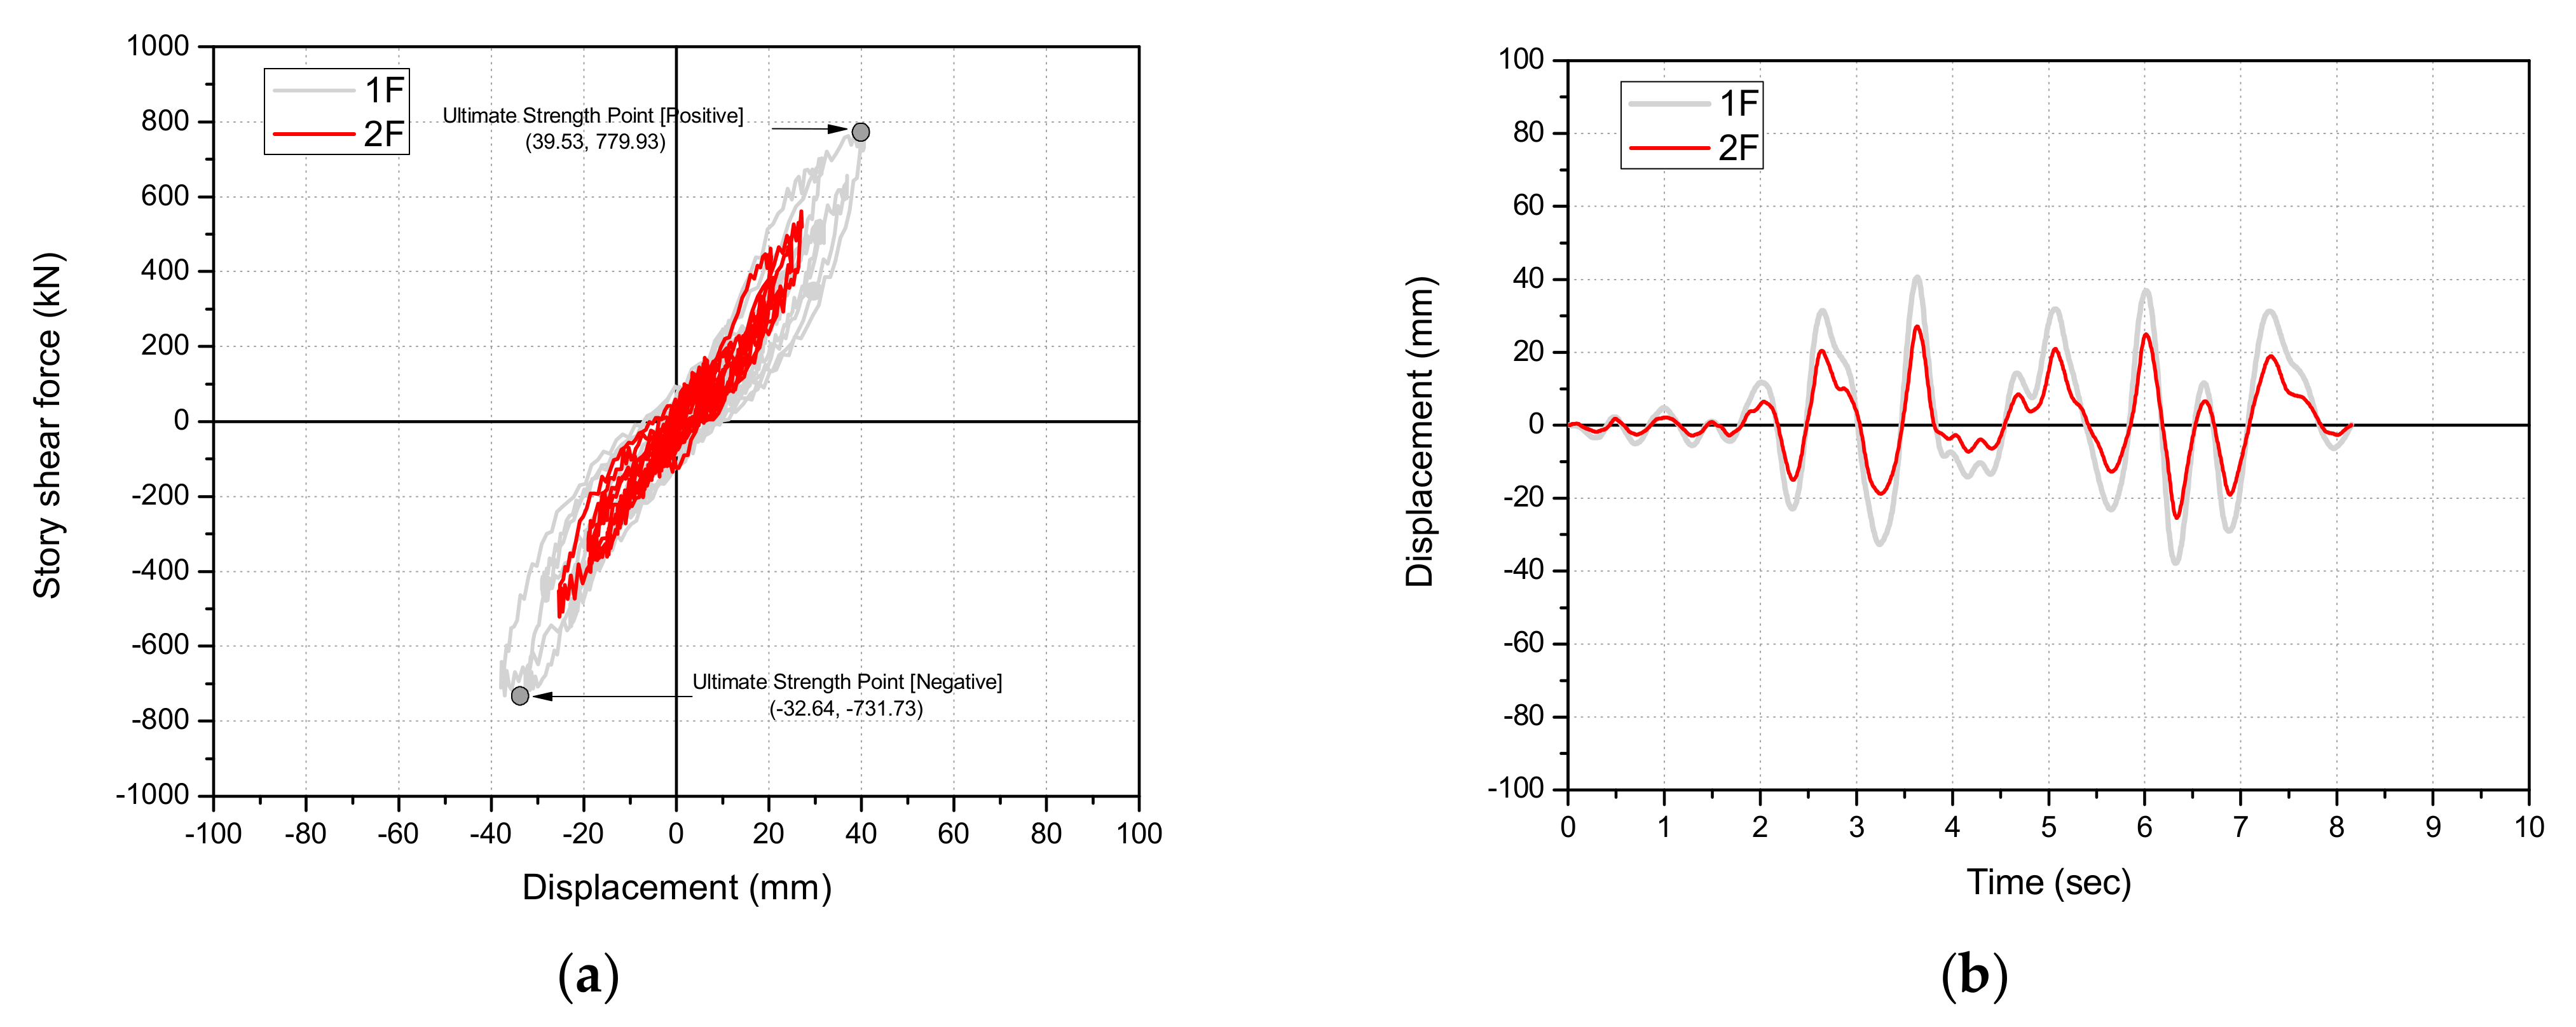
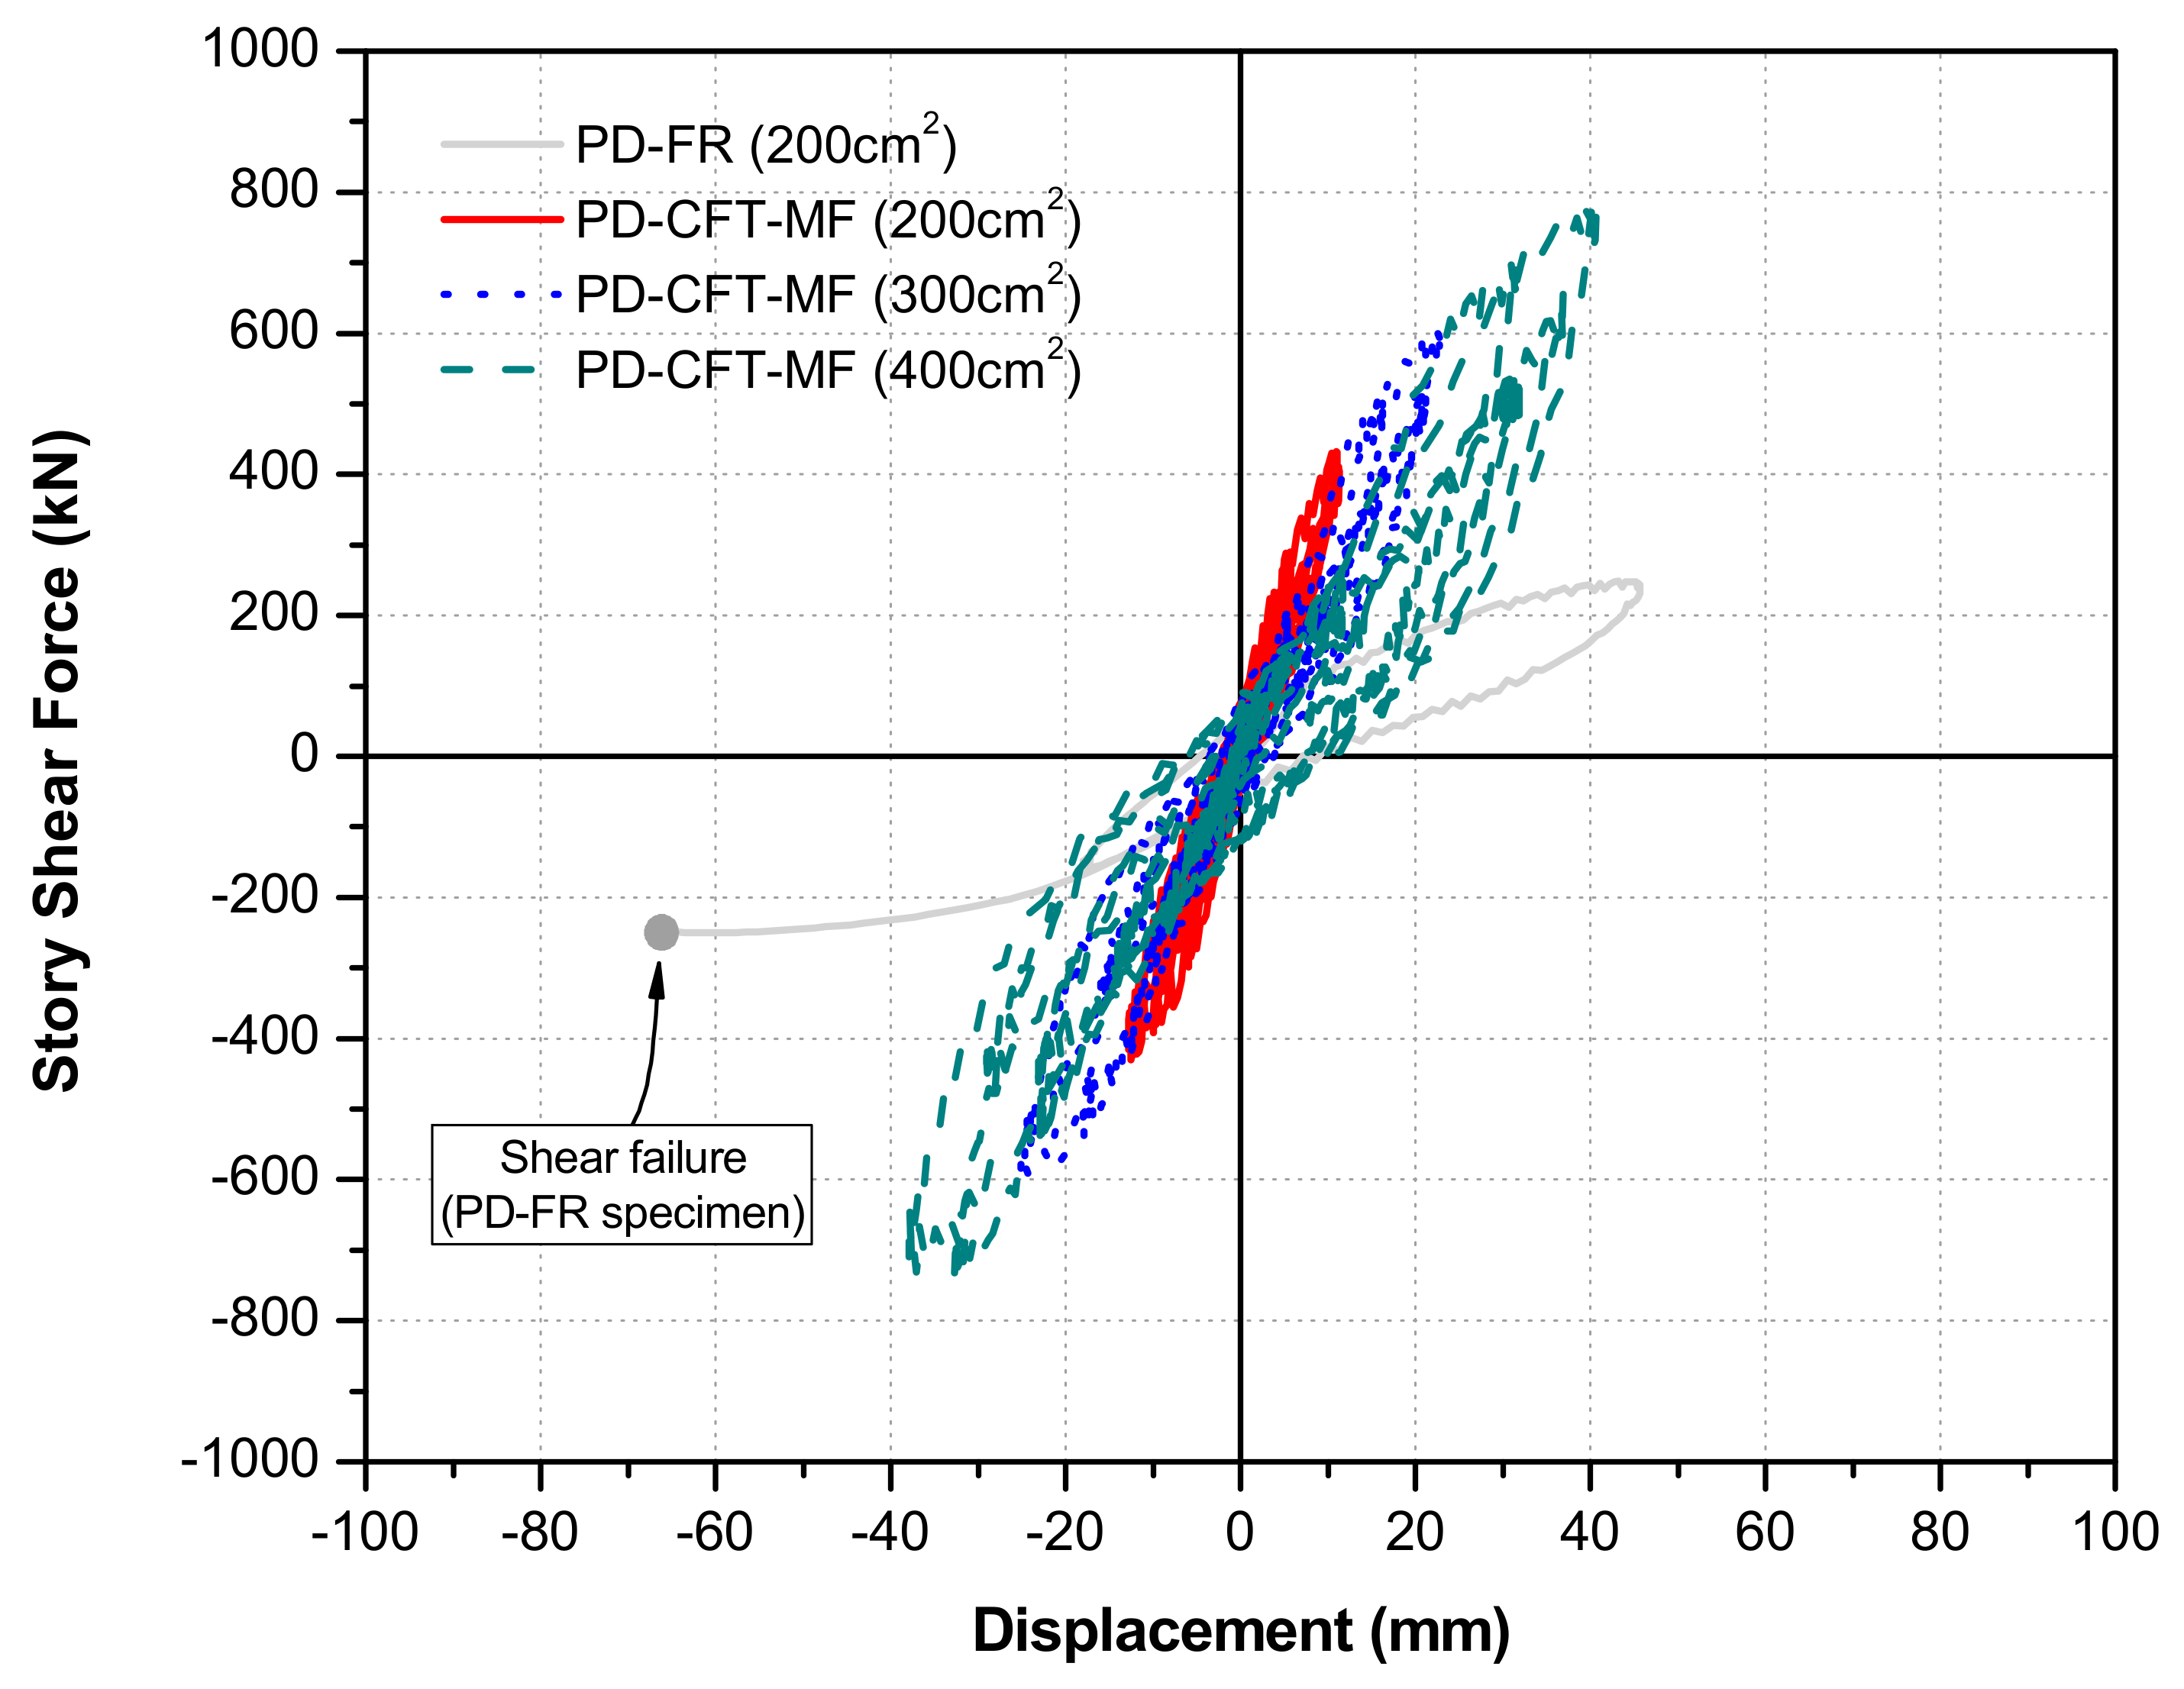
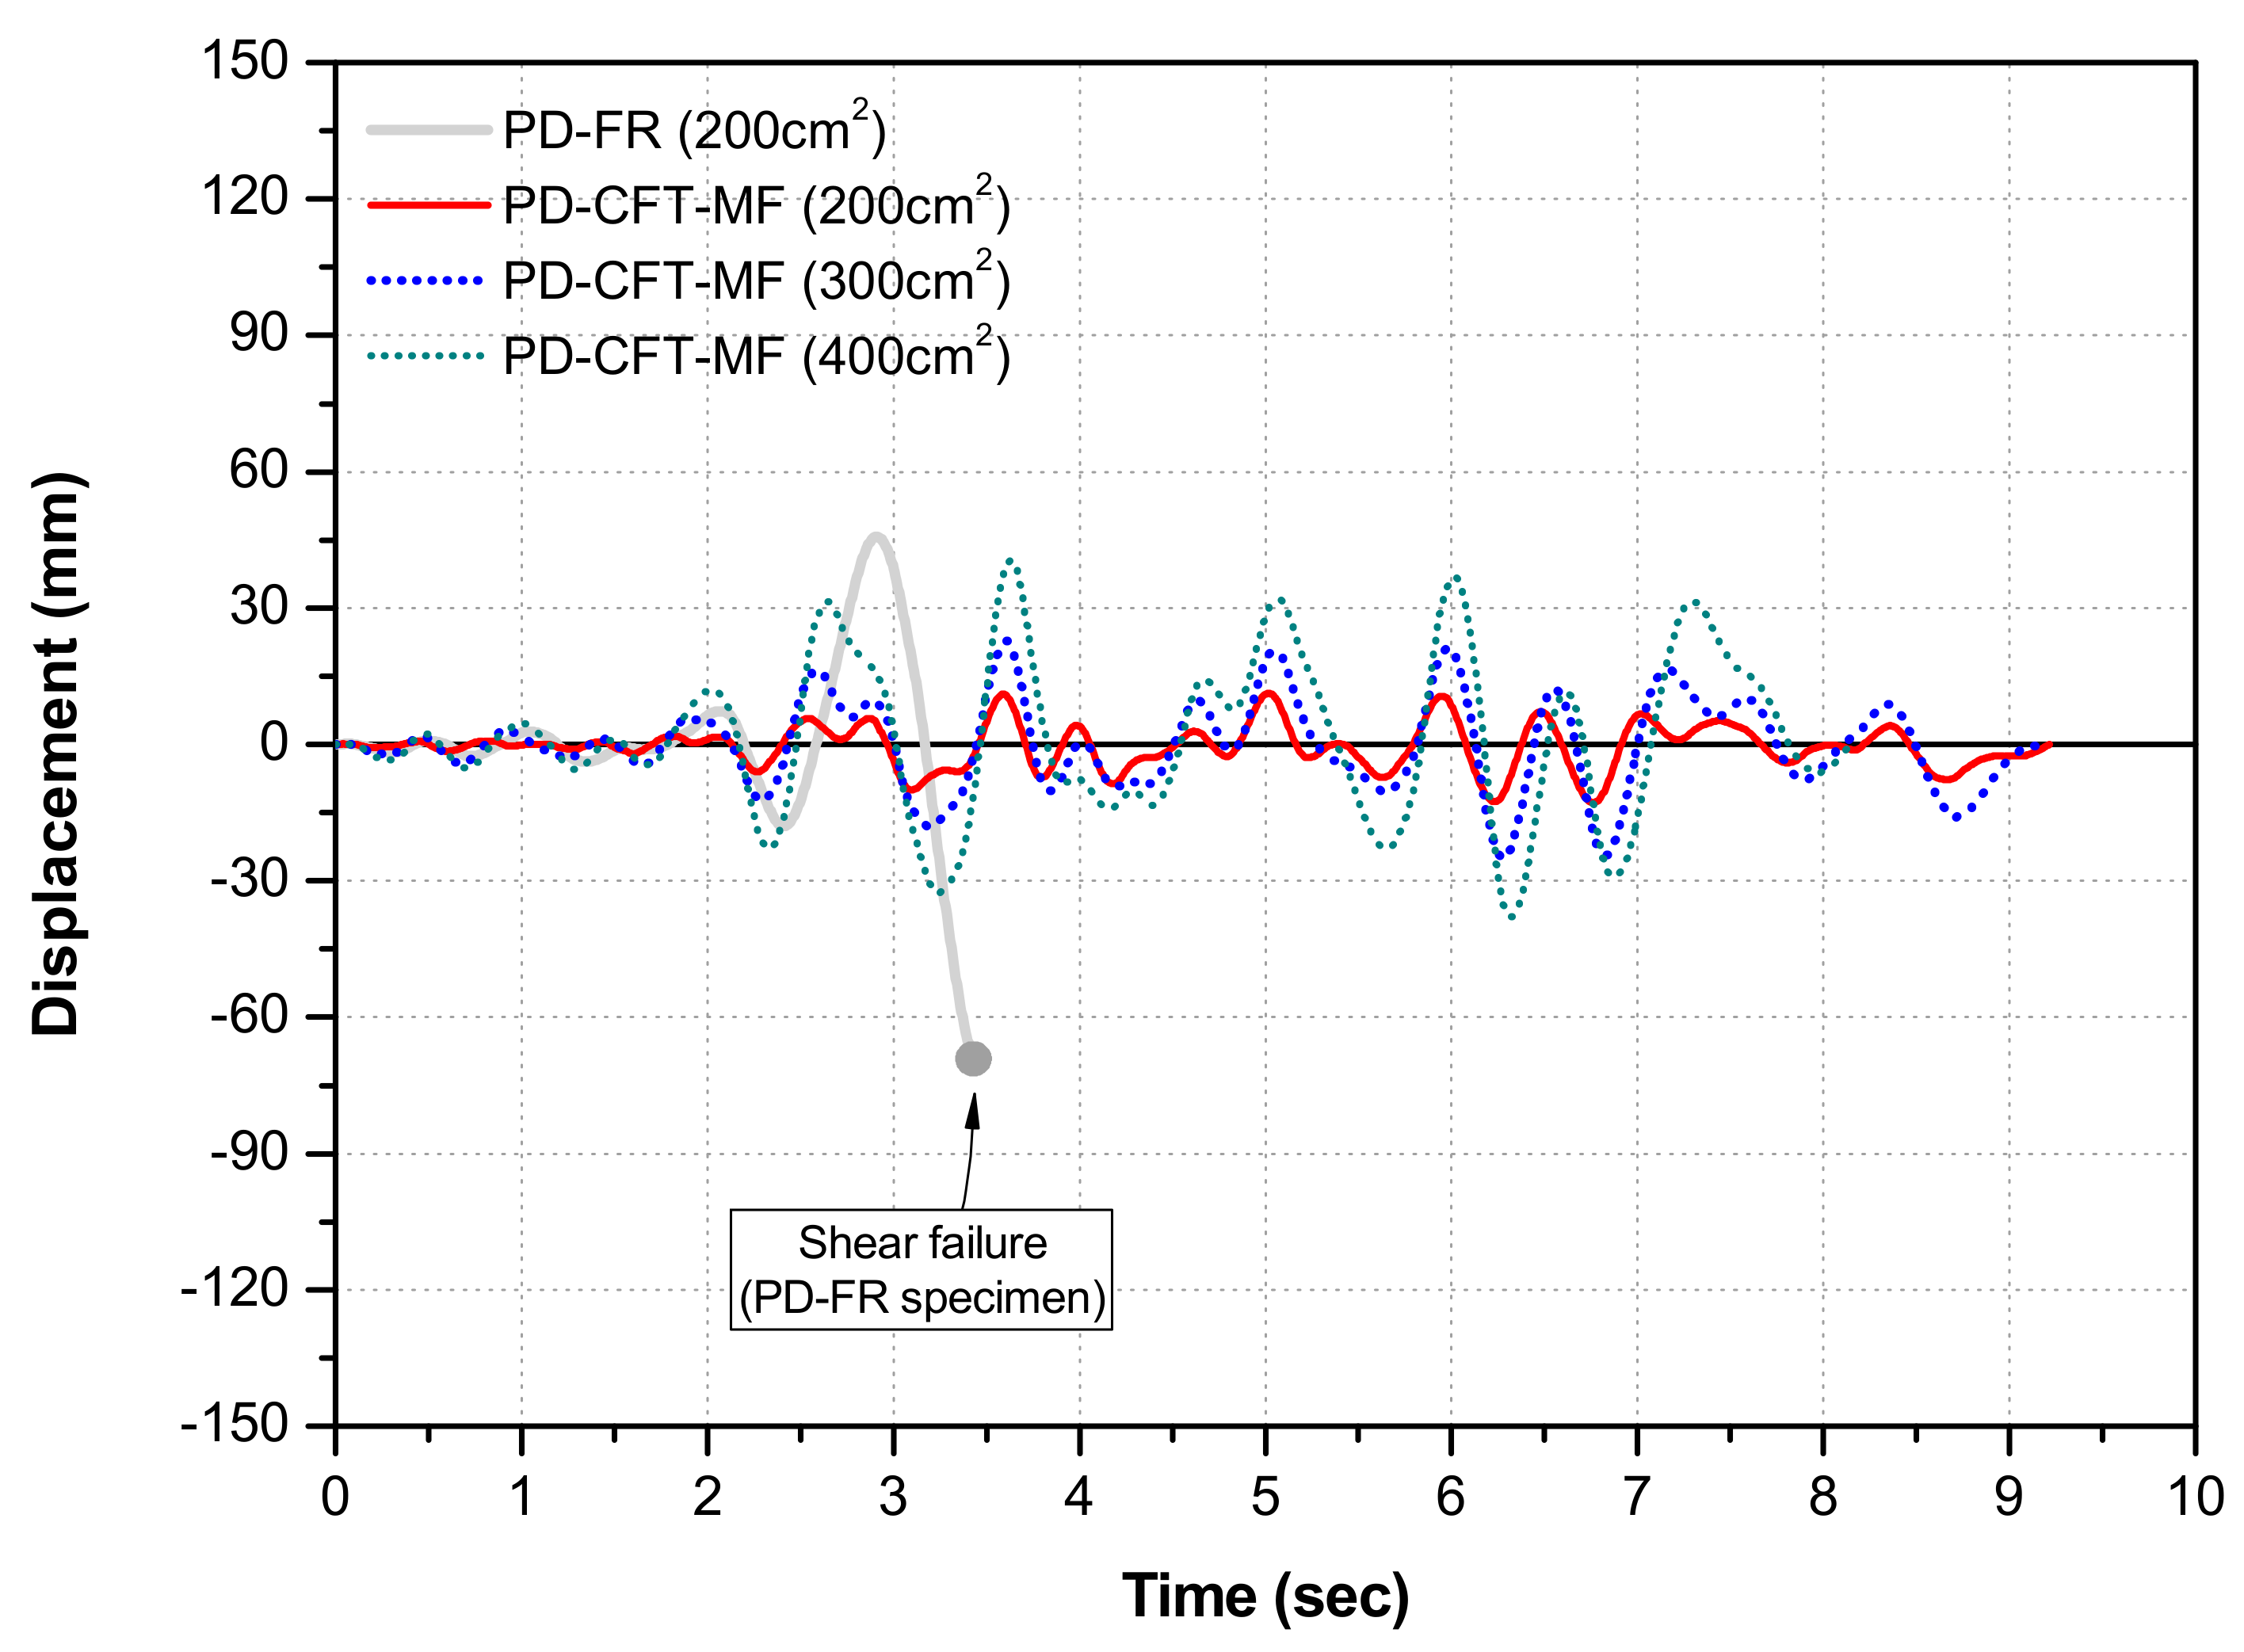
3.4.3. Comparison and Analysis of Seismic Response Load-Displacement Relationship and Displacement-Time Hysteresis
4. Comparison of Pseudo-Dynamic Test Results and Non-Linear Dynamic Analysis Results
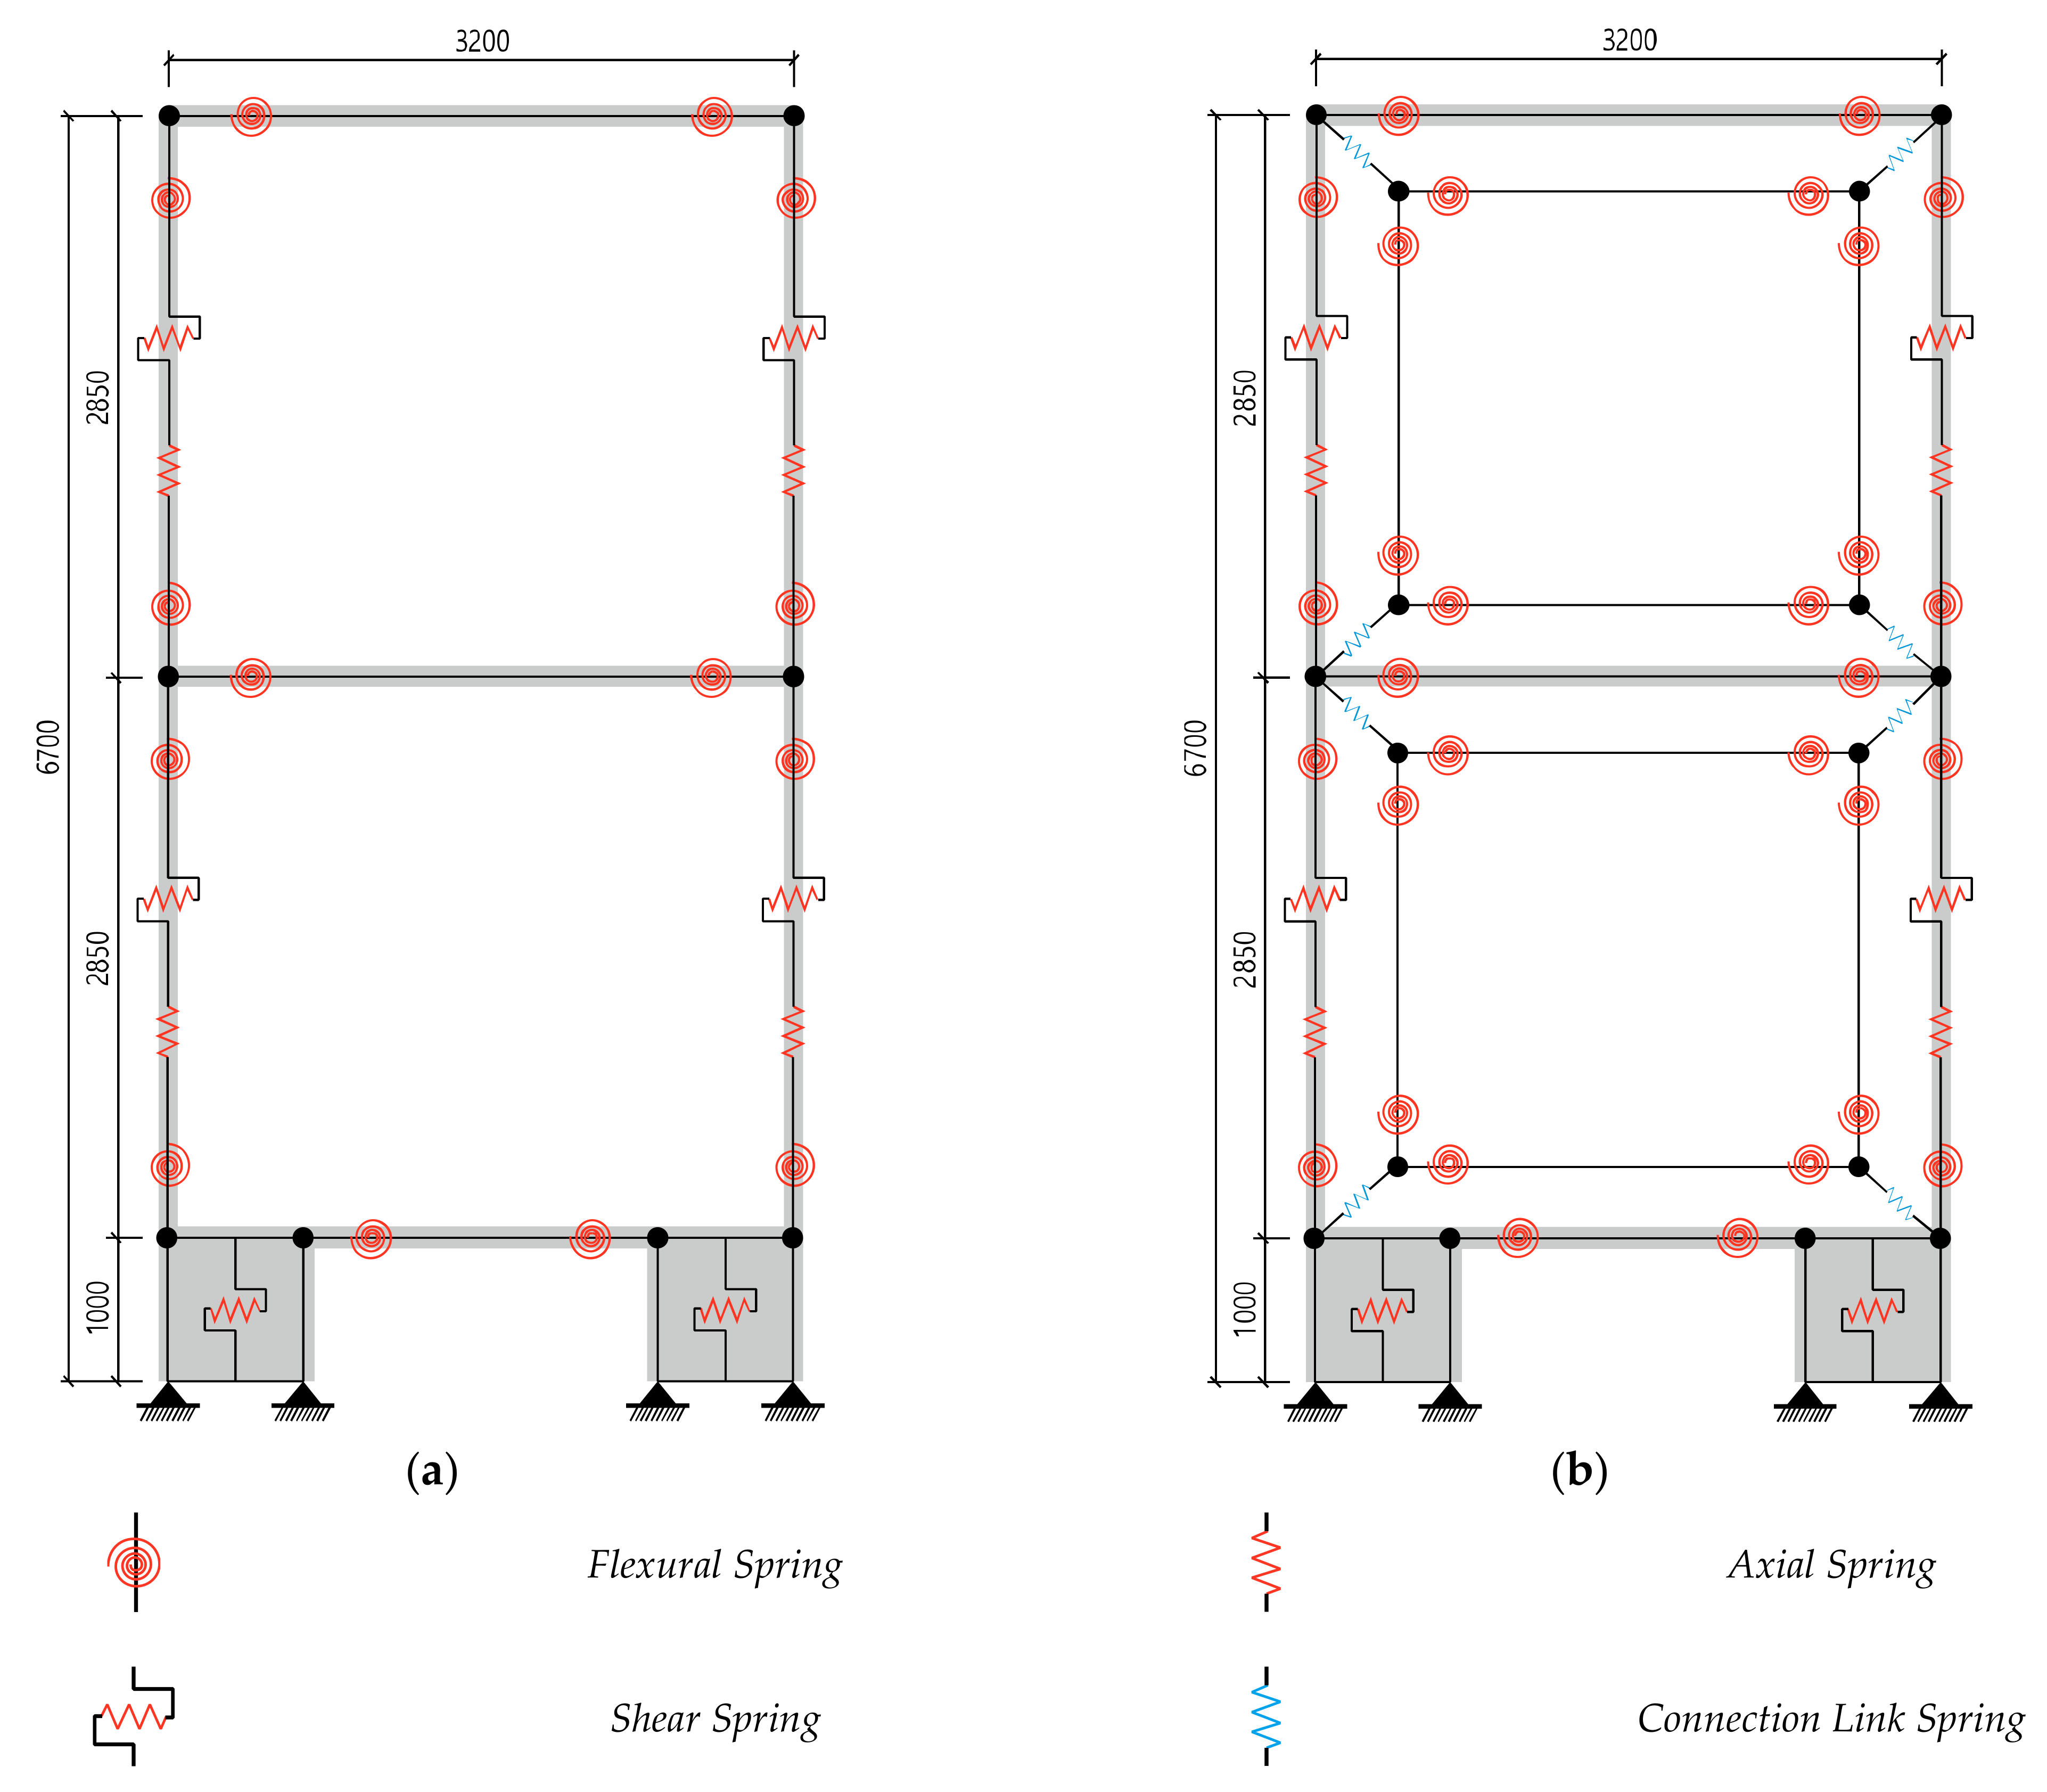
4.1. Overview of Non-linear Dynamic Analysis
4.1.1. Determination of Flexural Restoring Force Characteristics
4.1.2. Determination of Shear Restoring Force Characteristics
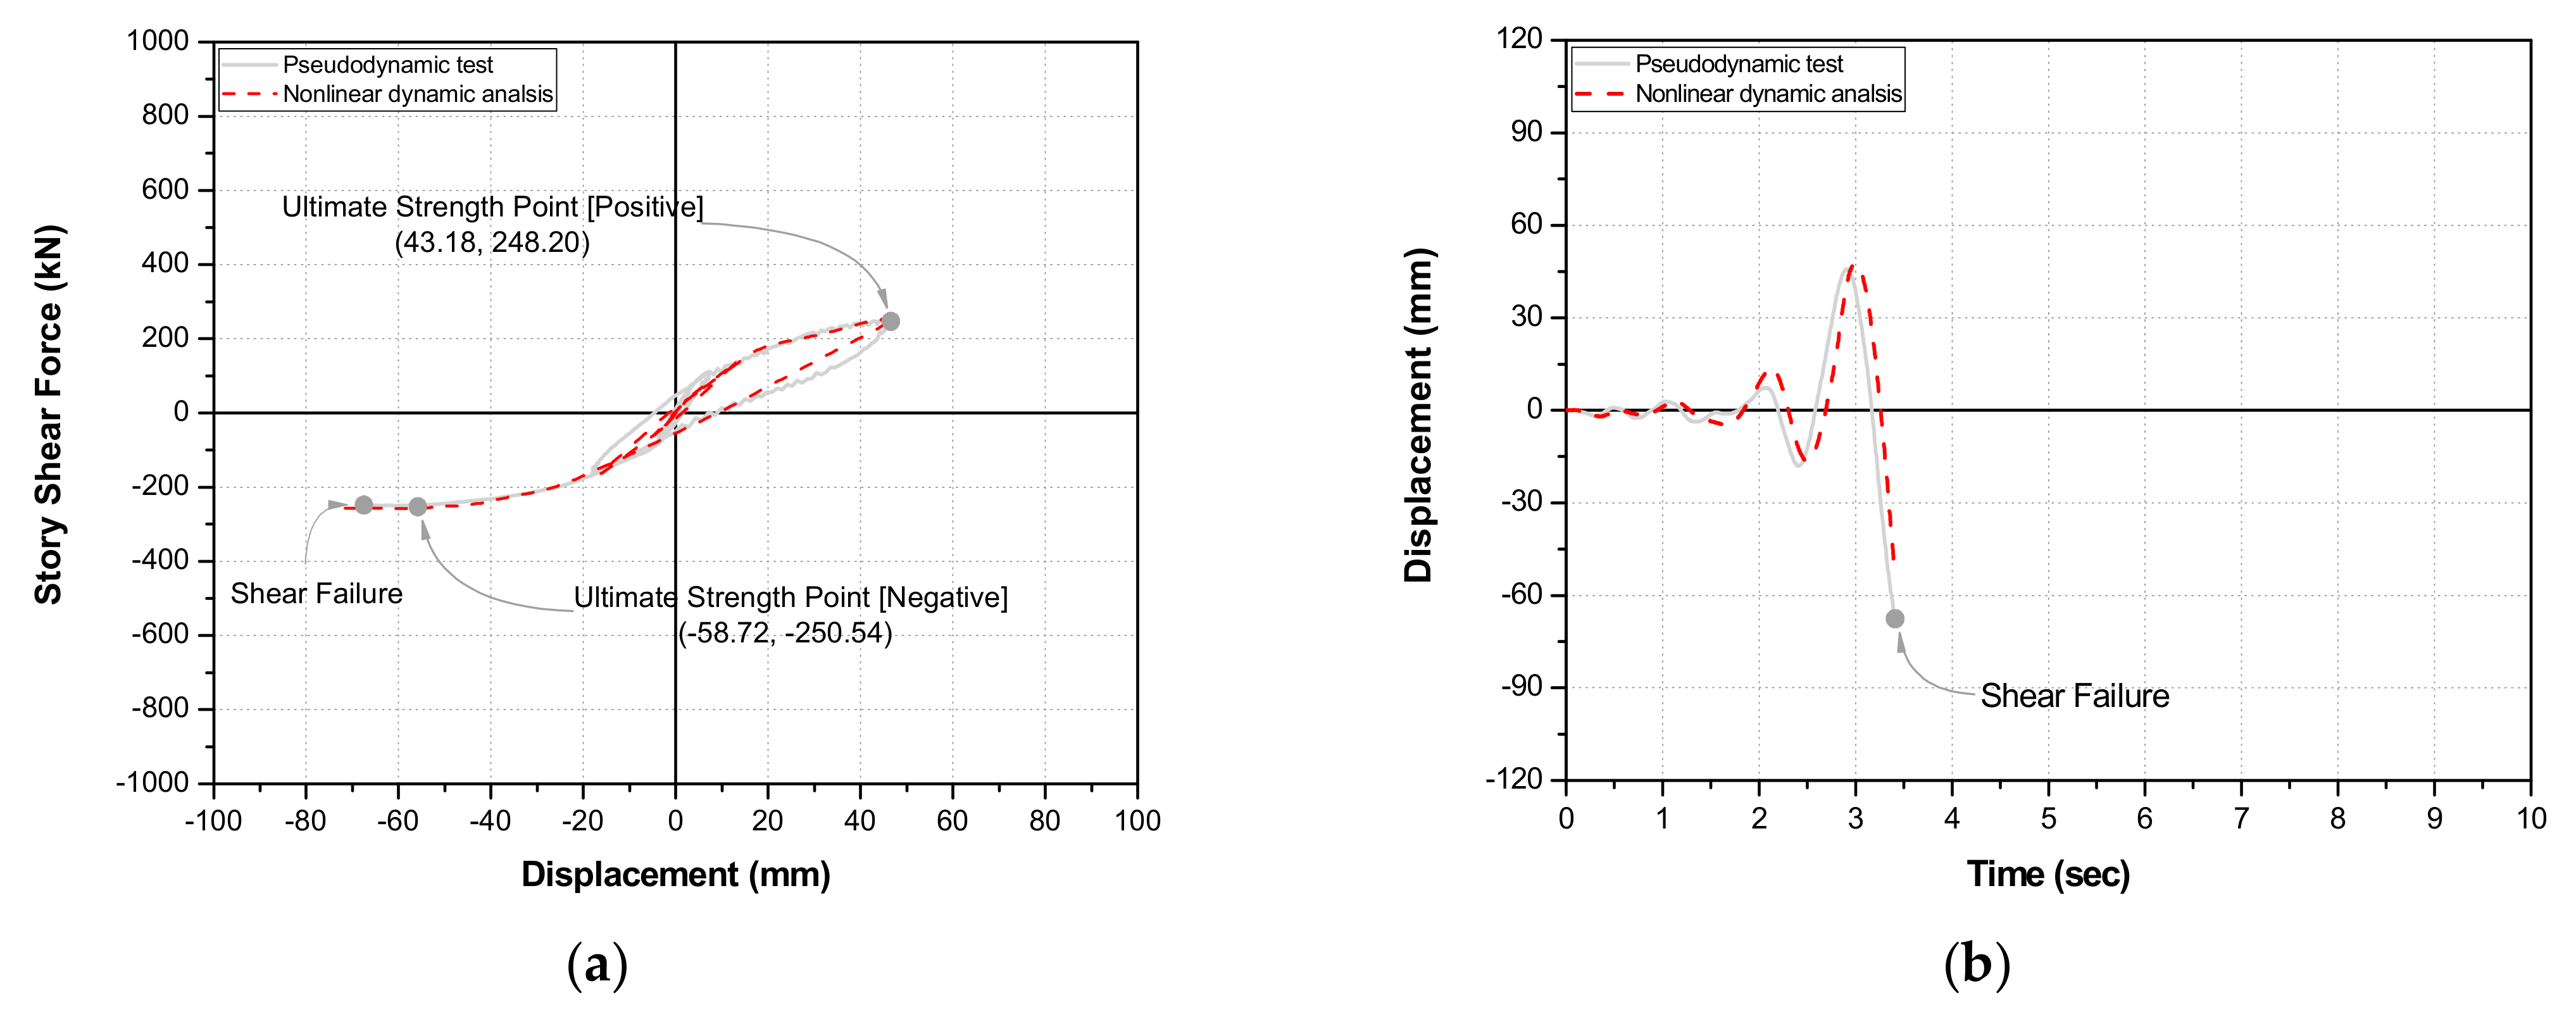
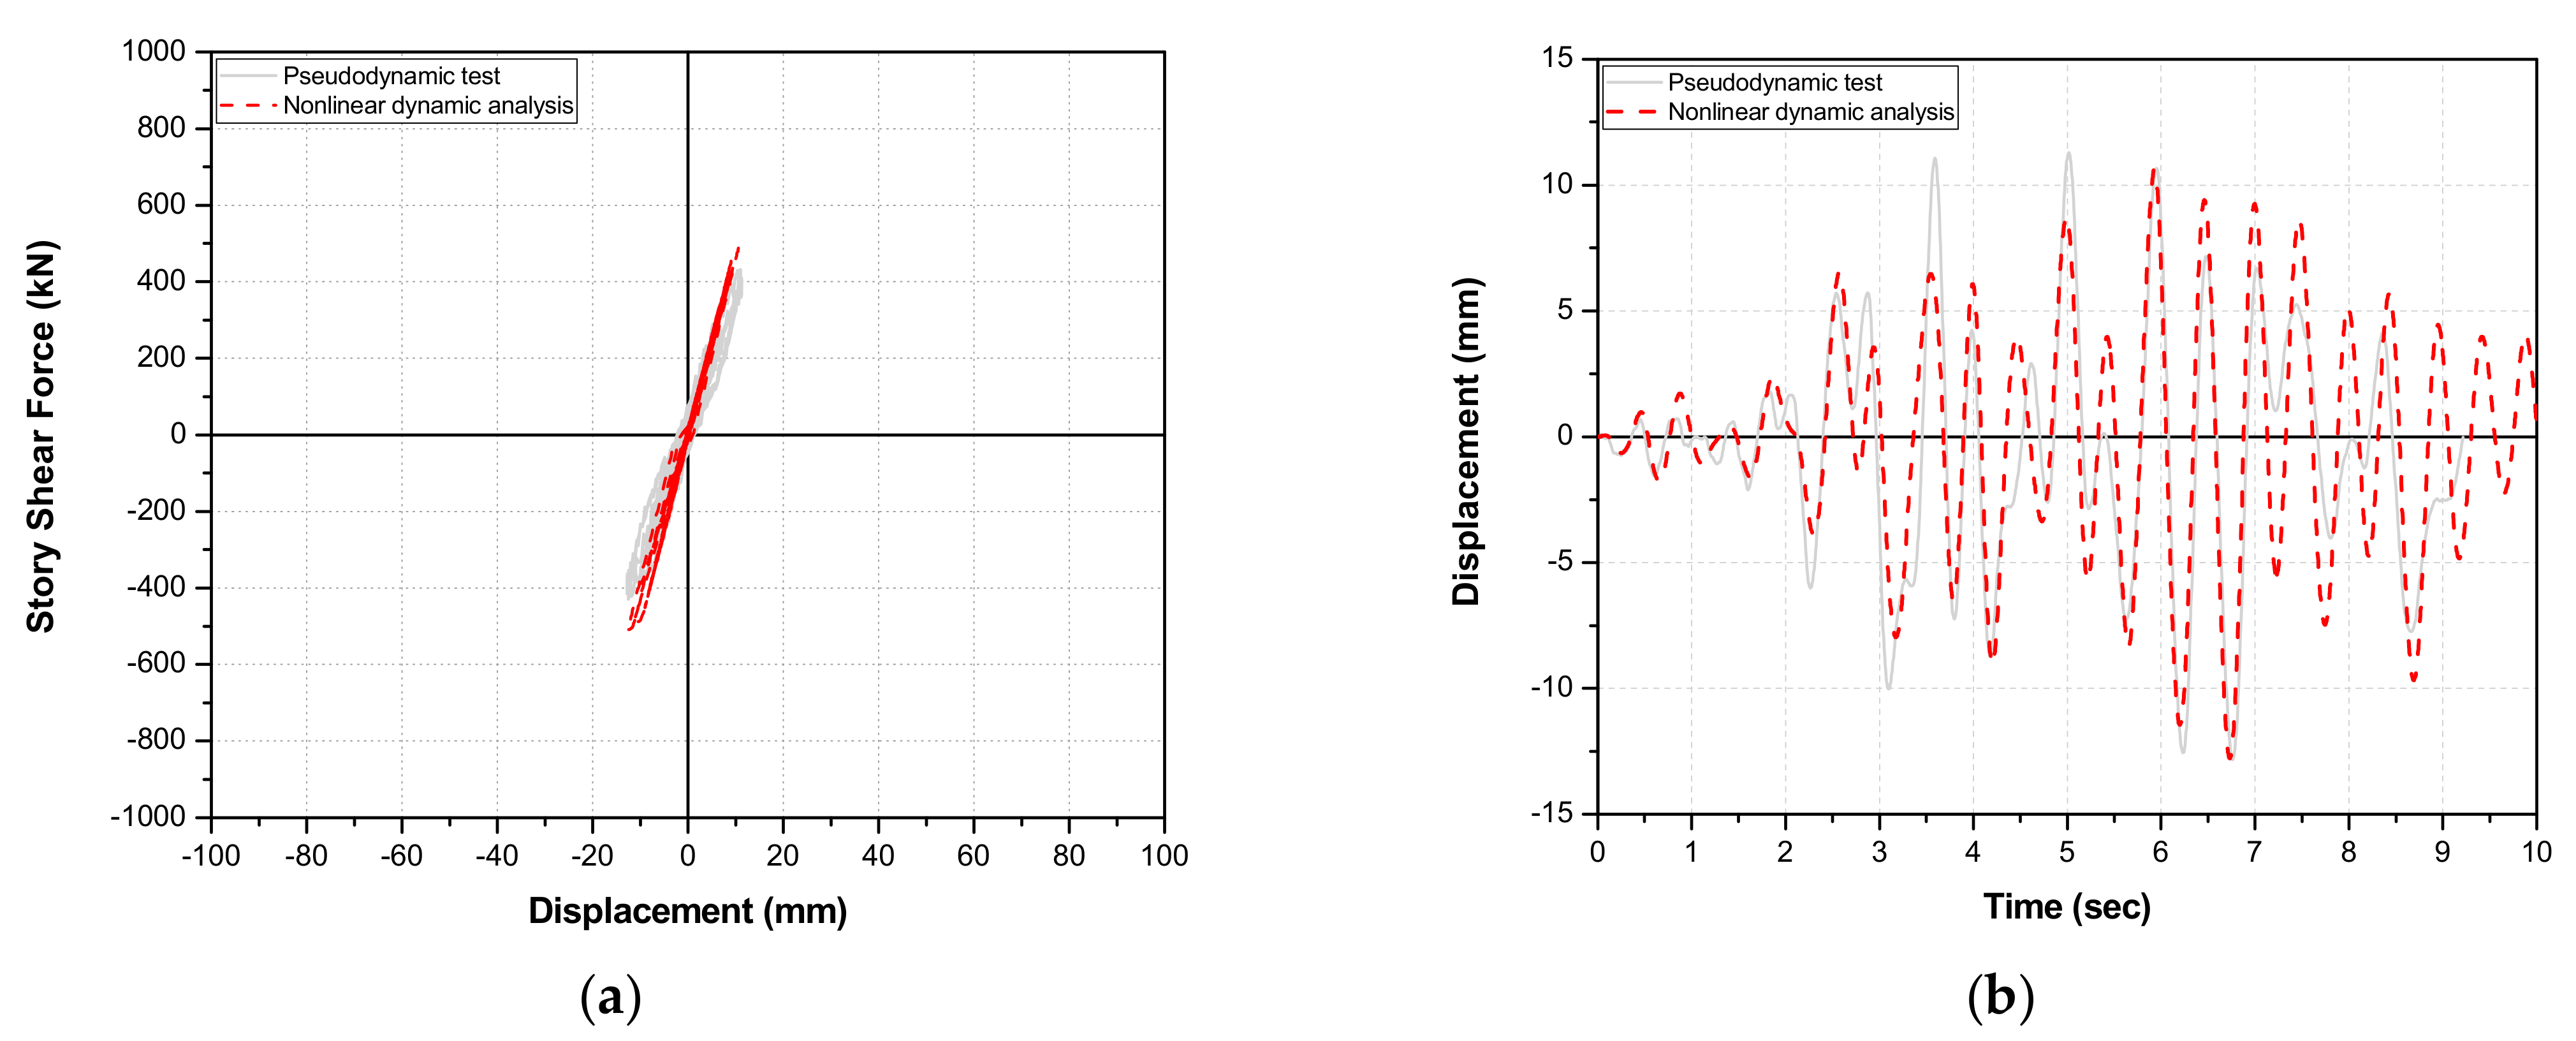
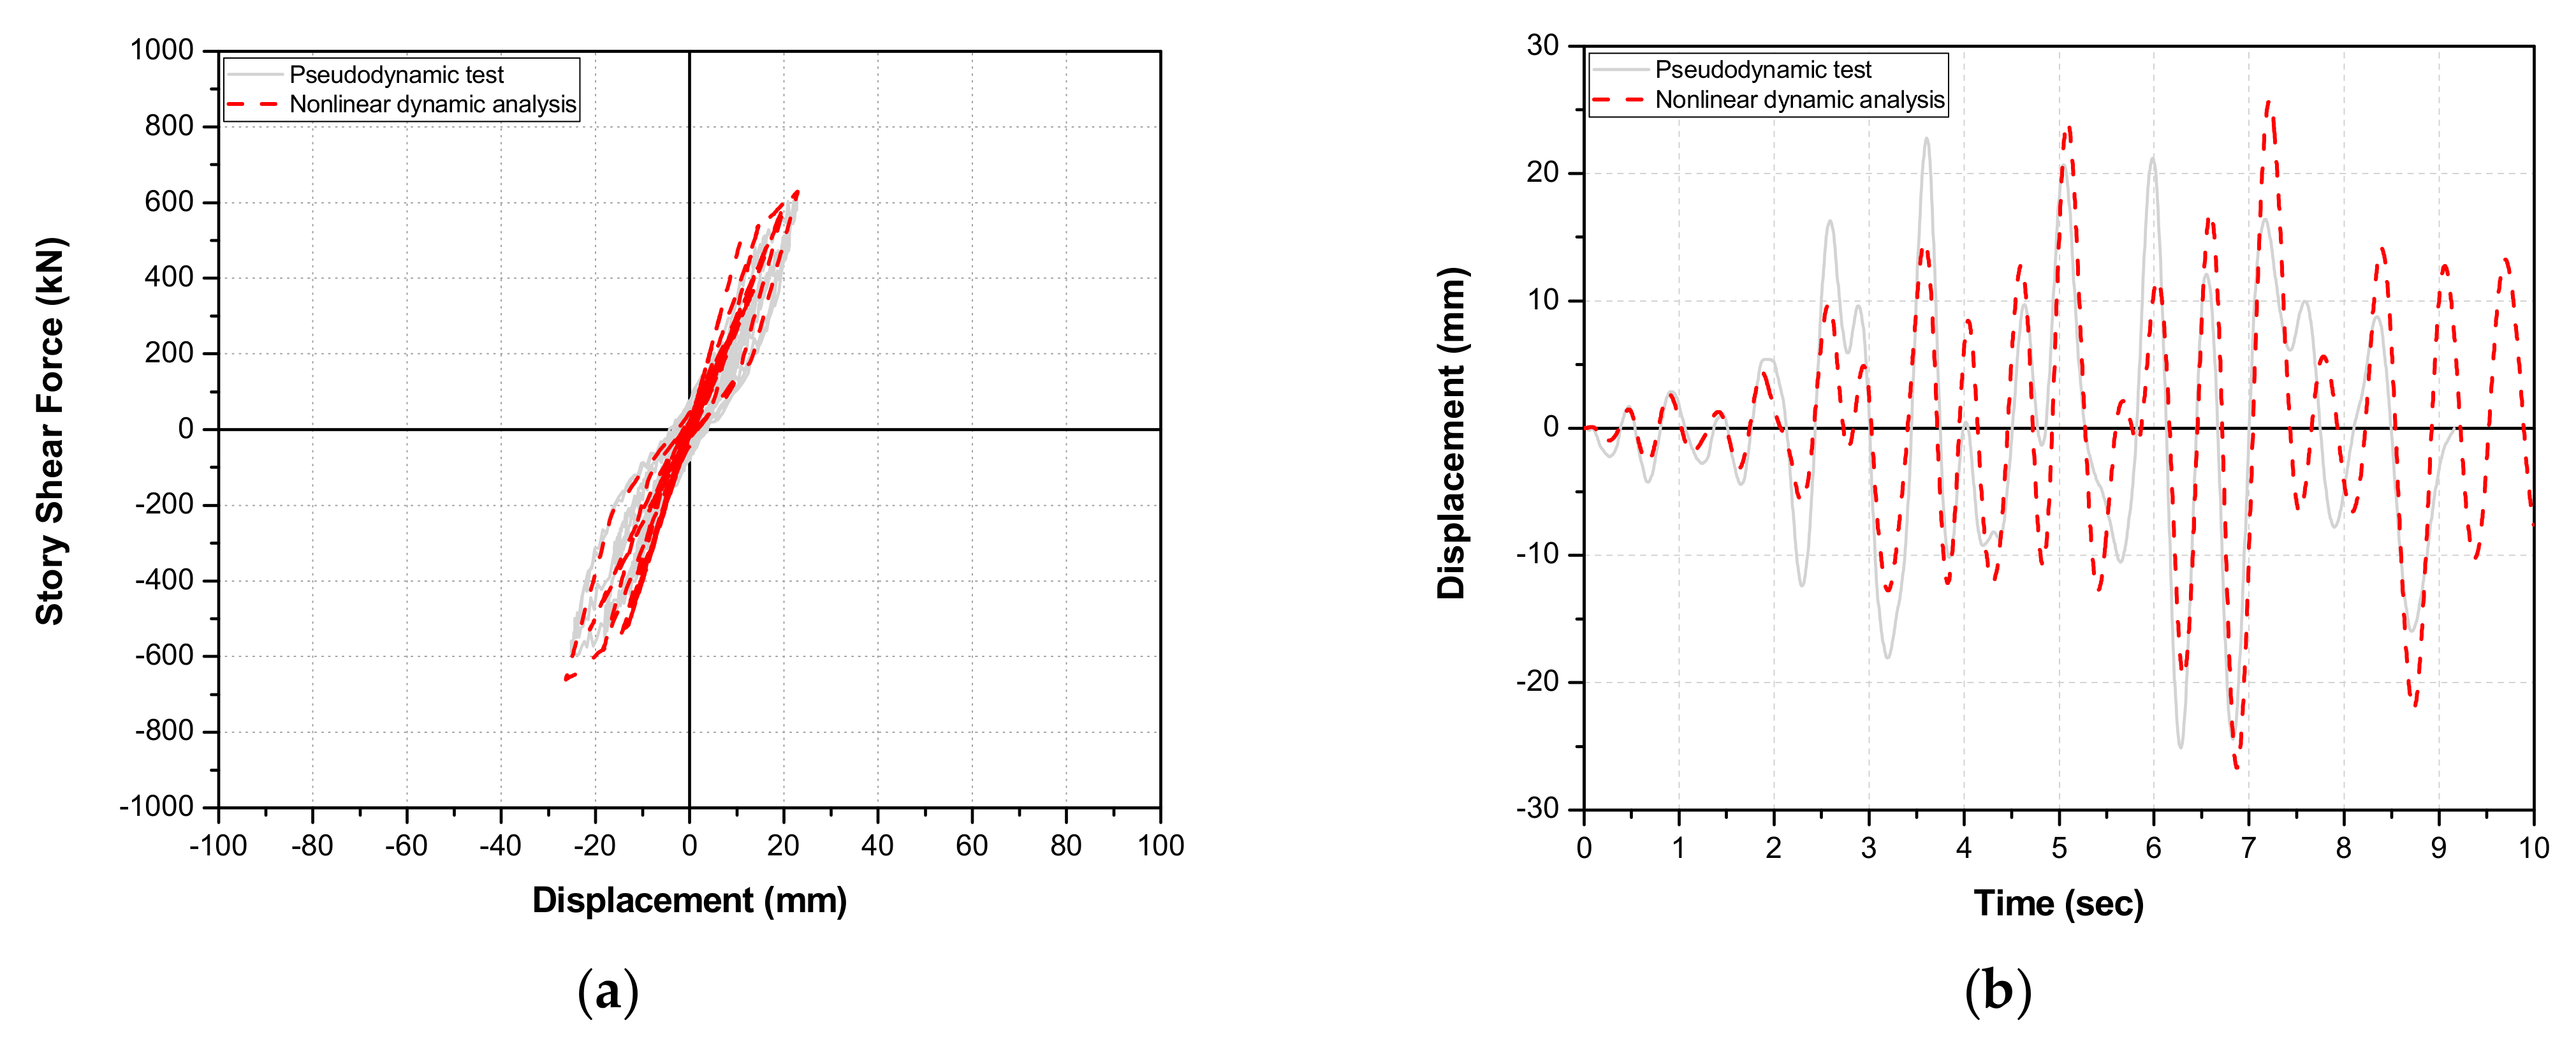
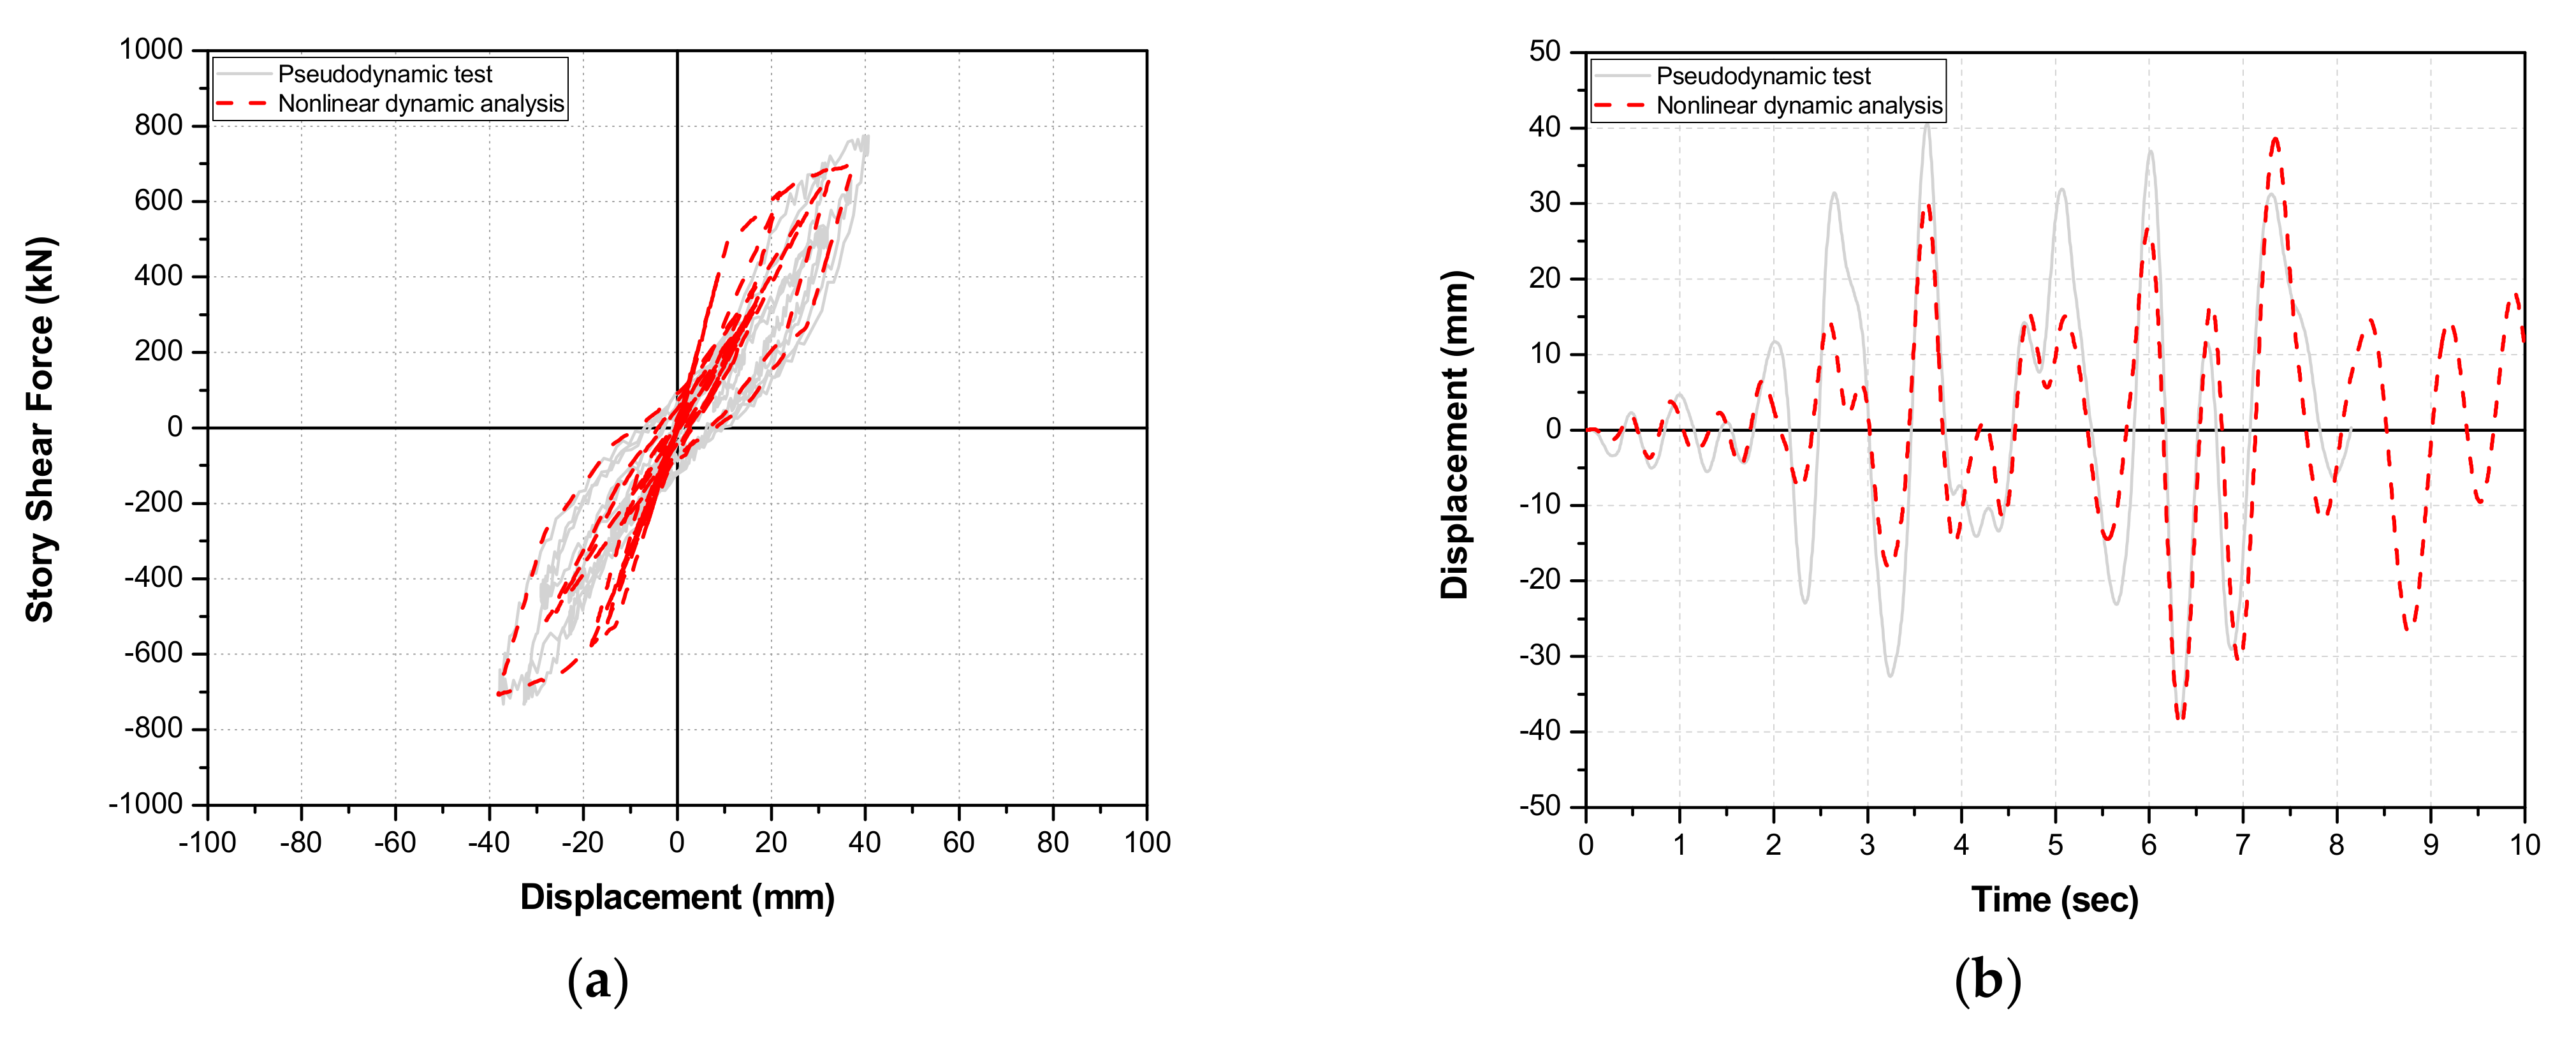
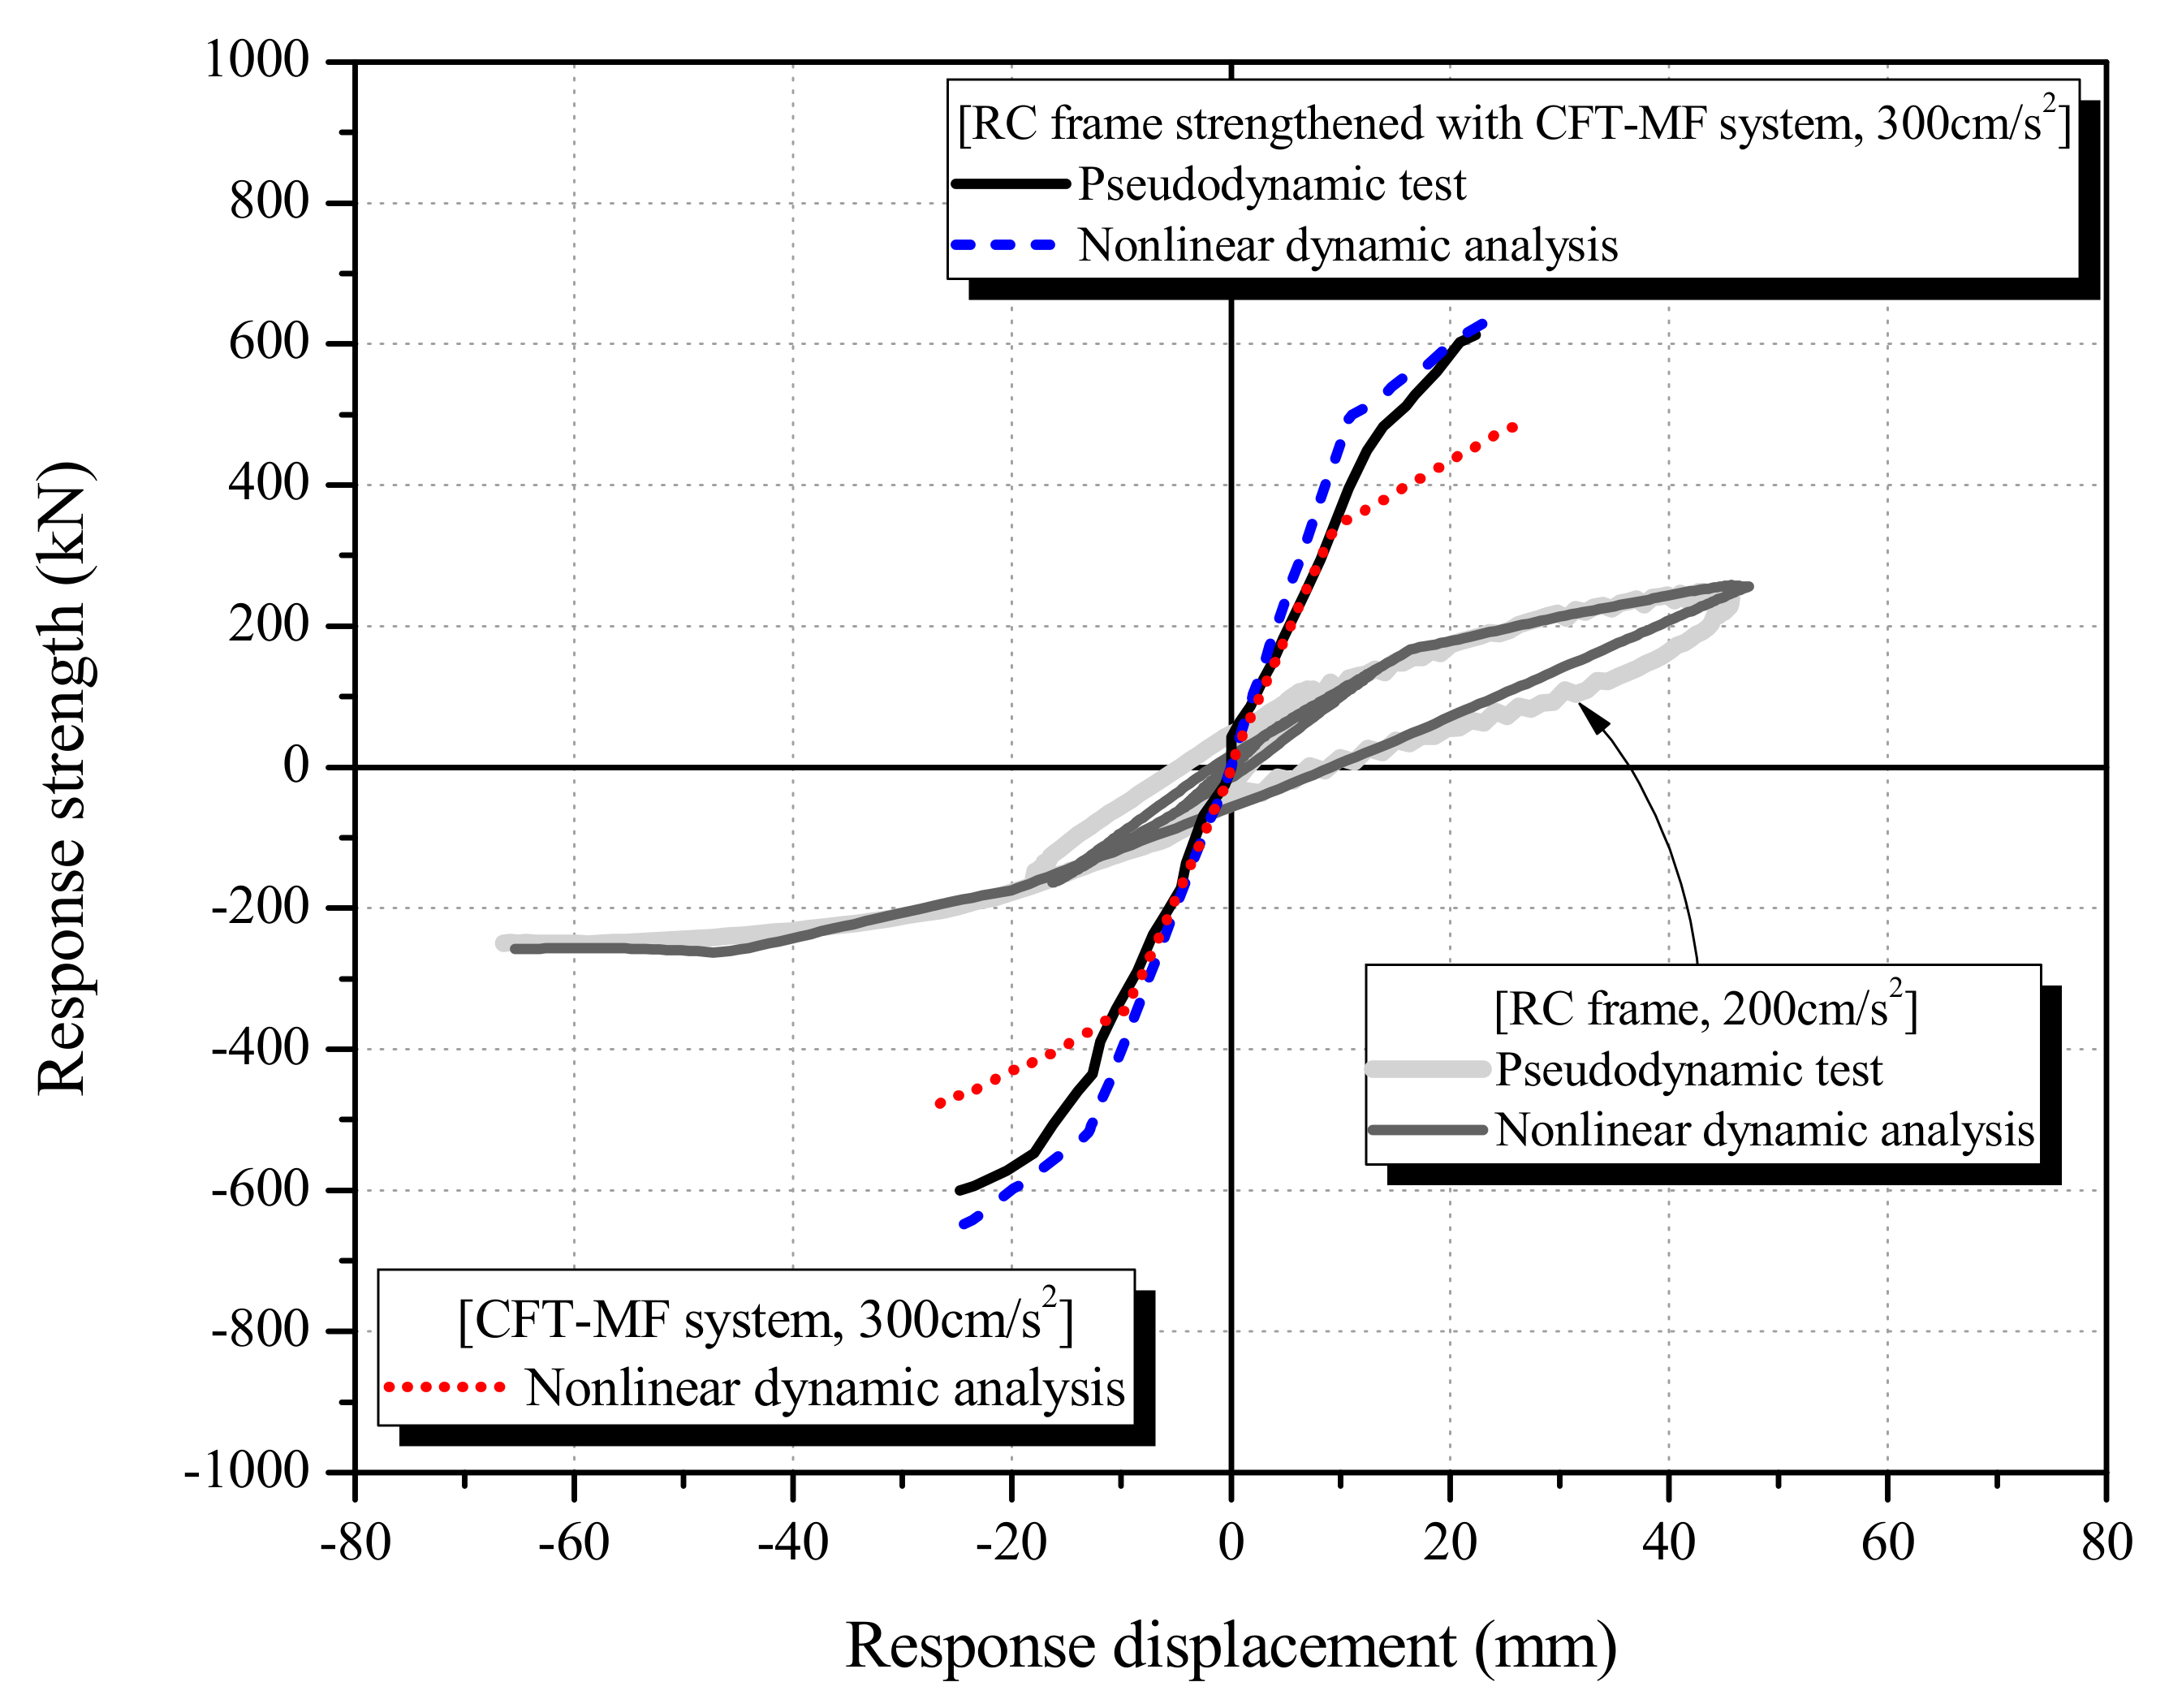
4.2. Comparison of Non-linear Dynamic Analysis and Pseudo-Dynamic Test Results
5. Conclusions
- (1)
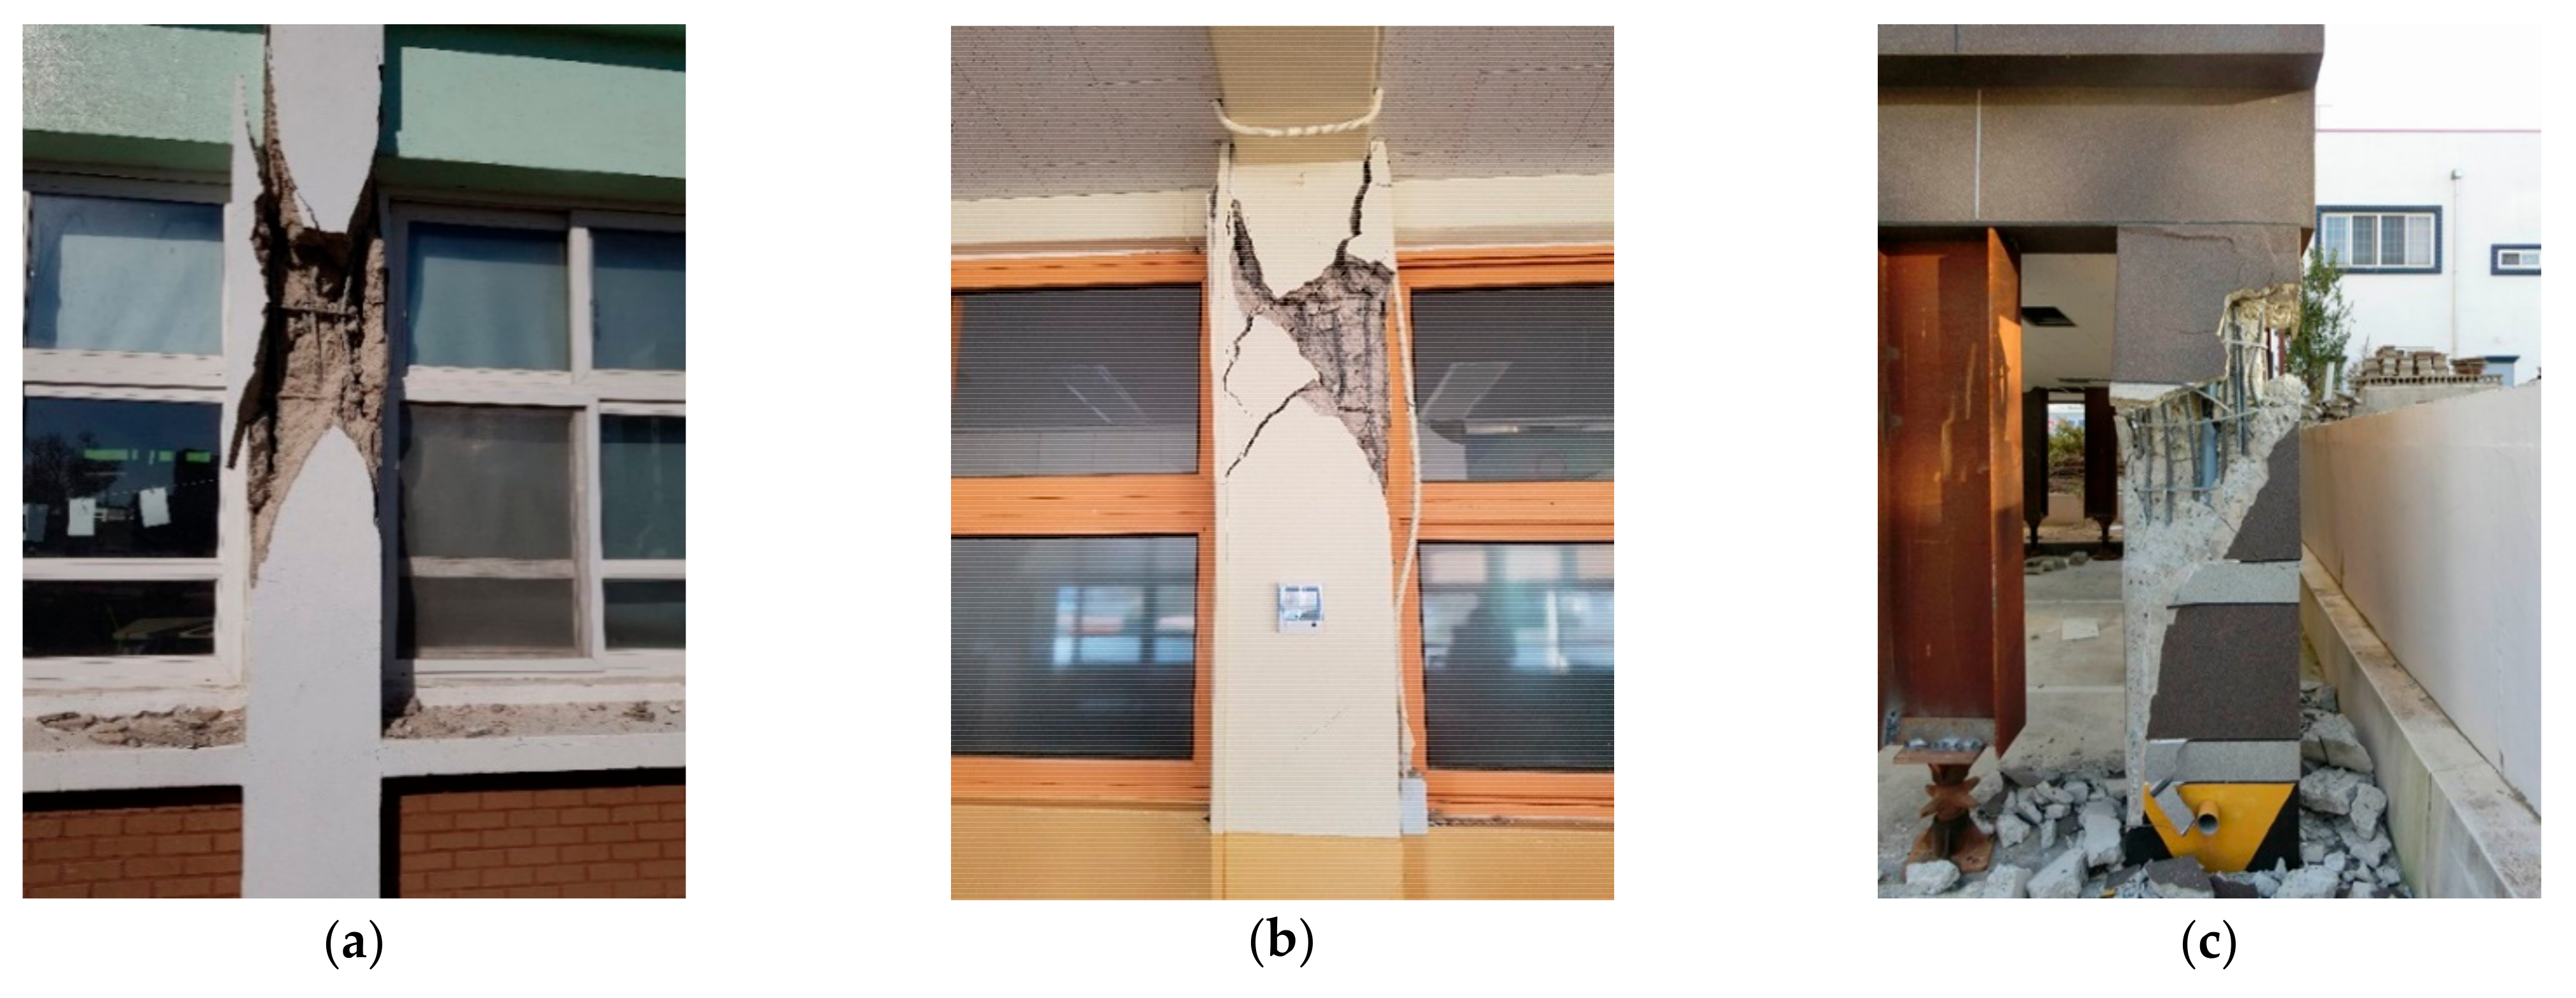
- The pseudo-dynamic test results of the test frame with no reinforcement applied showed that the maximum seismic response displacement was 58.7 mm (strength: 250.5 kN) at around 3.4 s when the Hachinohe wave (EW) of 200 cm/s2 was applied. This also coincided with shear failure. These results indicated that the test structure was prone to shear failure and exhibited low ultimate strength, structural characteristics commonly found in domestic RC structures with non-seismic details of the 1980s. It was also found that such structures with non-seismic details may be subject to large-scale seismic damage when an earthquake with a magnitude of 200 cm/s2 occurs. These data are considered important evidence to demonstrate the necessity of applying seismic retrofitting to such buildings.
- (2)
- In the test frame retrofitted with the CFT-MF system, the maximum seismic response displacement was 11.0 mm (strength: 432.2 kN) when the Hachinohe wave (EW) of 200 cm/s2 was applied. Only fine flexural cracks occurred, and the degree of overall structural damage was estimated to be insignificant. At 300 cm/s2, the maximum seismic response displacement was 22.4 mm (strength: 613.3 kN). The initial flexural cracks increased in number, and small shear cracks occurred compared to when the input seismic acceleration was 200 cm/s2. The degree of seismic damage was evaluated to be small. When the input seismic acceleration was 400 cm/s2, i.e., when a large-scale earthquake was assumed, the maximum seismic response displacement was 39.5 mm (strength: 773.9 kN). Flexural and shear cracks increased in width, and the degree of overall structural damage was estimated to be moderate.
- (3)
- The test frame retrofitted with the CFT-MF system exhibited seismic response strength about 1.72 times higher than the reference test frame when the same seismic acceleration was applied at 200 cm/s2. The difference was even larger when the seismic acceleration was higher: about 2.45 times at 300 cm/s2 and about 3.09 times at 400 cm/s2. The test frame retrofitted with the CFT-MF system also exhibited smaller seismic response displacements than the reference test frame. The difference was about 0.19 times at 200 cm/s2, about 0.38 times at 300 cm/s2, and 0.67 times at 400 cm/s2. When the same seismic acceleration was applied at 200 cm/s2, the seismic response displacement was about 81% lower in the test frame retrofitted with the CFT-MF system. These results indicated that the CFT-MF system was able to effectively enhance the ability of the test frame to absorb the applied seismic energy, verifying the effectiveness of the proposed seismic retrofitting method.
- (4)
- The non-linear dynamic analysis and pseudo-dynamic testing methods, conducted at input seismic ground motions of 200, 300, and 400 cm/s2, showed similar results. The deviation was about 10% or less on average. These results confirmed that the non-linear dynamic analysis model and methodology developed in the present study were able to effectively simulate the seismic behavior of the CFT-MF system and RC frames retrofitted with the system. This led to the conclusion that the seismic retrofitting performance of the CFT-MF system developed in the present study could be effectively evaluated via non-linear dynamic analysis based on the established analytical models and methods.
- (5)
- This CFT-MF seismic retrofitting method makes the most of the advantages of both concrete and steel pipes, thereby significantly improving constructability and increasing integration between the existing structure and the reinforcement joints. This method falls into the category of typical seismic retrofitting methods that focus on increasing strength, in which the required amount of seismic reinforcement can be easily estimated. Therefore, the method provides a suitable solution to improving the strength of middle- and low-rise RC structures with non-seismic details that are prone to shear failure. The validity of the method was verified through pseudo-dynamic testing and non-linear dynamic analysis.
- (6)
- To commercialize the Concrete-filled Tube Modular Frame (CFT-MF) going forward, a method to estimate the required amount of seismic reinforcement, along with seismic reinforcement design methods, needs to be proposed. Furthermore, the practicality of the CFT-MF seismic retrofitting method needs to be thoroughly assessed by conducting non-linear dynamic analysis of RC structures with non-seismic details retrofitted with the CFT-MF system.
Author Contributions
Funding
Institutional Review Board Statement
Informed Consent Statement
Data Availability Statement
Acknowledgments
Conflicts of Interest
References
- Kobayashi, T.; Zen, K.; Yasufuku, N.; Nagase, H.; Chen, G.; Kasama, K.; Hirooka, A.; Wada, H.; Onoyama, Y.; Uchida, H. Damage to Residential Retaining Walls at the Genkai-Jima Island Induced by the 2005 Fukuoka-Ken Seiho-Oki Earthquake. Soil Found. 2006, 46, 793–804. [Google Scholar] [CrossRef] [Green Version]
- Miyamoto, H.K.; Gilani, A.S.; Wada, A. Reconnaissance report of the 2008 Sichuan earthquake, damage survey of buildings and retrofit options. In Proceedings of the 14th World Conference on Earthquake Engineering, Beijing, China, 12–17 October 2008. [Google Scholar]
- Sarrafzadeh, M.; Elwood, K.J.; Dhakal, R.P.; Ferner, H.; Pettinga, D.; Stannard, M.; Maeda, M.; Nakano, Y.; Mukai, T.; Koike, T. Performance of reinforced concrete buildings in the 2016 Kumamoto Earthquakes and seismic design in Japan. Bull. New Zealand Soc. Earthq. Eng. 2017, 50, 394–435. [Google Scholar] [CrossRef]
- Architectural Institute of Korea (AIK). Site Inspection and Damage Investigation of Buildings by Earthquakes in Gyoungju and Pohang, Seoul, Korea. J. Korea Concr. Inst. 2018, 3, 1–47. [Google Scholar]
- Abou-Elfath, H.; Ghobarah, A. Behavior of reinforced concrete frames rehabilitated with concentric steel bracing. Can. J. Civ. Eng. 2000, 27, 433–444. [Google Scholar] [CrossRef]
- Ariyaratana, C.; Fahnestock, L.A. Evaluation of buckling-restrained braced frame seismic performance considering reserve strength. Eng. Struct. 2011, 33, 77–89. [Google Scholar] [CrossRef]
- Badoux, M.; Jirsa, O. Steel bracing of RC frames for seismic retrofitting. J. Struct. Eng. ASCE 1990, 116, 55–74. [Google Scholar] [CrossRef]
- Celik, O.C.; Bruneau, M. Seismic behavior of bidirectional-resistant ductile end diaphragms with buckling restrained braces in straight steel bridges. Eng. Struct. 2009, 31, 380–393. [Google Scholar] [CrossRef]
- Ghobarah, A.; Abou-Elfath, H. Rehabilitation of a reinforced concrete frames using eccentric steel bracing. Eng. Struct. 2001, 23, 745–755. [Google Scholar] [CrossRef]
- Lee, K.S. An experimental study on non-compression X-bracing systems using carbon fiber cable for seismic strengthening of RC buildings. Polymers 2015, 7, 1716–1731. [Google Scholar] [CrossRef] [Green Version]
- Maheri, M.R.; Kousari, R.; Razazan, M. Pushover tests on steel X-braced and knee-braced RC frames. Eng. Struct. 2003, 25, 1697–1705. [Google Scholar] [CrossRef]
- Ju, M.; Lee, K.S.; Sim, J.; Kwon, H. Non-compression cross-bracing system using carbon fiber anchors for seismic strengthening of RC structures. Mag. Concr. Res. 2014, 66, 159–174. [Google Scholar] [CrossRef]
- Nateghi-Alahi, F. Seismic strengthening of eight-storey RC apartment building using steel braces. Eng. Struct. 1995, 17, 455–461. [Google Scholar] [CrossRef]
- Onat, O.; Correia, A.A.; Lourenço, P.B.; Koçak, A. Assessment of the combined in-plane and out-of-plane behavior of brick infill walls within reinforced concrete frames under seismic loading. Earthq. Eng. Struct. Dyn. 2018, 47, 2821–2839. [Google Scholar] [CrossRef]
- Sarno, L.; Elnashai, A.S. Bracing systems for seismic retrofitting of steel frames. J. Constr. Steel Res. 2009, 65, 452–465. [Google Scholar] [CrossRef]
- Smith, S.T.; Kim, S.J. Shear strength and behavior of FRP spike anchors in FRP-to-concrete joint assemblies. In Proceedings of the Fifth International Conference on Advanced Composite Materials in Bridges and Structures (ACMBS-V), Winnipeg, MB, Canada, 22–24 September 2008; ISBN 978-0-9736430-7-7. [Google Scholar]
- Sugano, S. Seismic strengthening of existing reinforced concrete buildings in Japan. Bull. N. Z. Natl. Soc. Earthq. Eng. 1981, 14, 209–222. [Google Scholar] [CrossRef]
- Pankaj, M.; Singh, S.B. Out-of-plane response of ECC-strengthened masonry walls. J. Struct. Integr. Maint. 2020, 5, 18–30. [Google Scholar]
- Corey, T.G. Multi-performance retrofits to commercial buildings in seismic zones. J. Struct. Integr. Maint. 2017, 2, 133–142. [Google Scholar]
- Hwang, J.S.; Lee, K.S. Seismic Strengthening Effects Based on Pseudodynamic Testing of a Reinforced Concrete Building Retrofitted with a Wire-Woven Bulk Kagome Truss Damper. Shock Vib. 2016, 2016, 1–17. [Google Scholar] [CrossRef]
- Kunisue, A.; Koshika, N.; Kurokawa, Y.; Suzuki, N.; Agami, J.; Sakamoto, M. Retrofitting method of existing reinforced concrete buildings using elasto-plastic steel dampers. In Proceedings of the 12th World Conference on Earthquake Engineering, Auckland, New Zeland, 30 January–4 February 2000. [Google Scholar]
- Marko, J.; Thambiratnam, D.; Perera, N. Influence of damping systems on building structures subject to seismic effects. Eng. Struct. 2004, 26, 1939–1956. [Google Scholar] [CrossRef]
- Sarranya, B.; Aparna, D.G. Optimal design of nonlinear TMD with Bingham-type damping for base-excited structures. J. Struct. Integr. Maint. 2020, 5, 211–222. [Google Scholar]
- Oliveto, G.; Caliò, I.; Marletta, M. Retrofitting of Reinforced Concrete Buildings Not Designed to Withstand Seismic Action: A Case Study Using Base Isolation. In Proceedings of the 13th World Conference on Earthquake Engineering, Vancouver, BC, Canada, 1–6 August 2004. Paper No. 954. [Google Scholar]
- Lee, K.S.; Jung, J.S. A Seismic Capacity of R/C Building Damaged by the 2016 Gyeongju Earthquake Based on the Non-linear Dynamic Analysis. J. Korea Inst. Struct. Maint. Insp. 2018, 22, 137–146. [Google Scholar]
- Lee, K.S.; Choi, H.; Yi, W.H. Earthquake Damage Ratio Estimation and Seismic Capacity Evaluation of Existing Reinforced Concrete Buildings in Korea. J. Archit. Inst. Korea 2002, 18, 11–20. [Google Scholar] [CrossRef]
- Lee, K.S.; Wi, J.D.; Kim, Y.I.; Lee, H.H. Seismic Safety Evaluation of Korean R/C School Buildings Built in the 1980s. J. Korea Inst. Struct. Maint. Insp. 2009, 13, 1–11. [Google Scholar]
- Federal Emergency Management Agency (FEMA). FEMA 356: Prestandard and Commentary for Seismic Rehabilitation of Buildings; FEMA: Washington, DC, USA, 2000; p. 450.
- Japan Building Disaster Prevention Association (JBDPA). Guideline for Seismic Strengthening of Existing Reinforced Concrete Buildings; JBDPA: Tokyo, Japan, 2017; p. 197. [Google Scholar]
- Seismic Strengthening Research Group (SSRG). Seismic Strengthening of RC Buildings; Ohmsha Press: Tokyo, Japan, 2008; 230p. [Google Scholar]
- Takanashi, K.; Udagawa, K.; Tanaka, H. Pseudo-dynamic tests on a 2-storey steel frame by a computer-load test apparatus hybrid system. In Proceedings of the 7th World Conference on Earthquake Engineering, Istanbul, Turkey, 8–13 September 1980; Volume 7, pp. 225–232. [Google Scholar]
- Tokyo Soki Kenkyujo Company (TSKC), 2020, Tokyo, Japan. Available online: https://www.tml.jp/e/ (accessed on 10 April 2021).
- MTS Pseudodynamic Testing for 793 Controllers; MTS Systems Corporation: Eden Prairie, MI, USA, 2002.
- Hilber, H.M.; Hughes, T.J.; Taylor, R.L. Improved numerical dissipation for time integration algorithms in structural dynamics. Earthq. Eng. Struct. Dyn. 1977, 5, 283–292. [Google Scholar] [CrossRef] [Green Version]
- Lee, K.S. Seismic capacity requirements for low-rise reinforced concrete buildings controlled by both shear and flexure. J. Adv. Concr. Technol. 2010, 8, 75–91. [Google Scholar] [CrossRef] [Green Version]
- Korean Design Standard 41 (KDS 41) Korean Design Standard 41; Architectural Institute of Korea: Seoul, Korea, 2019.
- KS B 0801. Test Pieces for Tension Test for Metallic Materials; Korean Industrial Standards: Eumseong-gun, Korea. Available online: https://standard.go.kr (accessed on 12 April 2021).
- Jung, H.C.; Jung, J.S.; Lee, K.S. Seismic performance evaluation of internal steel frame connection method for seismic strengthening by cycling load test and nonlinear analysis. J. Korea Con. Inst. 2019, 31, 79–88. [Google Scholar] [CrossRef] [Green Version]
- Japan Building Disaster Prevention Association (JBDPA). Standard for Damage Level Classification; JBDPA: Tokyo, Japan, 2015; p. 360. [Google Scholar]
- Maeda, M.; Nakano, Y.; Lee, K.S. Post-Earthquake Damage Evaluation for R/C Buildings Based on Residual Seismic Capacity. In Proceedings of the 13th World Conference on Earthquake Engineering, Vancouver, BC, Canada, 1–6 August 2004; p. 1179. [Google Scholar]
- Architectural Institute of Japan (AIJ). Standard for Structural Calculation of Reinforced Concrete Structures; AIJ: Tokyo, Japan, 2010; p. 952. [Google Scholar]
- Li, K.N. Canny: A 3-dimensional Nonlinear Dynamic Structural Analysis Computer Program (User Manual); CANNY Structural Analysis Company: Vancouver, BC, Canada, 2009. [Google Scholar]


| Sequence | Construction Procedures | |
|---|---|---|
| 1 |  | Bore connection anchoring halls. |
| 2 |  | Install connection device (steel plate) using chemical anchors and epoxy resin. |
| 3 |  | Install CFT Frame. |
| 4 |  | Install cover plate using coupling bolts. |
| 5 |  | Inject high-performance mortar and conduct finish work. |
| Strengthening Method | Element | Number of Reinforcement | Unit Cost (USD) | Total Cost (USD) | Cost-Benefit Ratio (%) |
|---|---|---|---|---|---|
| RC shear wall | Concrete shear wall | 8 | 28,351 | 385,875 | - |
| Micro pile | 10 | 15,907 | |||
| CFT-MF | CFT-MF | 8 | 40,982 | 327,856 | 15 |
| Specimen Name | Test Method | Reinforcing Method | Input Seismic Wave Intensity (cm/s2) |
|---|---|---|---|
| PD-FR | Pseudo-dynamic testing | Control bare frame | 200 |
| PD-CFT-MF | Pseudo-dynamic testing | CFT-MF seismic system | 200/300/400 |
| Specimen Name | Input Seismic Ground Motion | Input Seismic Ground Motion [cm/s2] | Maximum Load Vu [kN] | Maximum Displacement δu [mm] | Degree of Seismic Damage * (Failure Mode) |
|---|---|---|---|---|---|
| PD-FR | Hachinohe (EW) | 200 | 250.5 | 58.7 | Collapse [Shear collapse] |
| PD-CFT-MF | 200 | 432.2 | 11.0 | Light [Flexural crack] | |
| 300 | 613.3 | 22.4 | Small [Flexural and shear cracks] | ||
| 400 | 773.9 | 39.5 | Moderate [Flexural and shear cracks] |
| Specimen | Earthquake Levels (cm/s2) | Response Strength | Response Displacement | ||
|---|---|---|---|---|---|
| Vu a [kN] | Rs b | δu c [mm] | Rd d | ||
| PD-FR | 200 | 250.5 | 1.00 (250.5/250.5) | 58.7 | 1.00 (58.7/58.7) |
| PD-CFT-MF | 200 | 432.2 | 1.72 (432.2/250.5) | 11.0 | 0.19 (11.0/58.7) |
| 300 | 613.3 | 2.45 (613.3/250.5) | 22.4 | 0.38 (22.4/58.7) | |
| 400 | 773.9 | 3.09 (773.9/250.5) | 39.5 | 0.67 (39.5/58.7) | |
| Member | Restoring Force Model | Model Name | |
|---|---|---|---|
| Beam | Flexural spring | CP3 | Cross-peak trilinear model |
| Shear spring | OO3 | Trilinear origin-oriented | |
| Column | Flexural spring | CA7 | CANNY sophisticated trilinear hysteresis model |
| Shear spring | OO3 | Trilinear origin-oriented | |
| Axial spring | AE1 | Axial stiffness model | |
| Wall | Shear spring | OO3 | Trilinear origin-oriented |
| Anchor bolt | Shear spring | EL2 | Bilinear elastic model |
| CFT-MF | Flexural spring | SL2 | Bilinear slip model (SL2) |
| Shear spring | EL1 | Linear elastic model | |
| Speci- men | Input Seismic Accele- Ration [cm/s2] | Method | Maximum Displacement [mm] | Deviation Ratio in Terms of Maximum Displacement *1 [Analytical/Exp- Erimental] | Maximum Load [kN] | Deviation Ratio in Terms of Maximum Load *1 [Analytical/Exp- Erimental] |
|---|---|---|---|---|---|---|
| PD-FR | 200 | PDT *2 | 66.4 | 1.08 (71.6/66.4) | 250.5 | 1.03 (258.1/250.5) |
| NDA *2 | 71.6 | 258.1 | ||||
| PD-CFT-MF | 200 | PDT *2 | 12.8 | 1.00 (12.7/12.8) | 432.2 | 1.18 (514.8/432.2) |
| NDA *2 | 12.7 | 514.8 | ||||
| 300 | PDT *2 | 25.1 | 1.06 (26.7/25.1) | 613.3 | 1.08 (662.5/613.3) | |
| NDA*2 | 26.7 | 662.5 | ||||
| 400 | PDT *2 | 40.6 | 0.97 (39.4/40.6) | 773.9 | 0.92 (712.4/773.9) | |
| NDA *2 | 39.4 | 712.4 |
| Displacement Point (mm) | Lateral Response Strength (kN) | Contribution Ratio of vs. * (%) | ||
|---|---|---|---|---|
| 300 cm/s2 | 200 cm/s2 | |||
| RC Frame Strengthened with CFT-MF System [VT] | CFT-MF System [VS] | Non-Reinforced Frame [VN] | ||
| 10 | 486.8 | 350.7 | 136.1 | 72.0 |
| 20 | 602.9 | 435.8 | 167.1 | 72.3 |
| 30 | 679.6 | 499.6 | 180.1 | 73.5 |
Publisher’s Note: MDPI stays neutral with regard to jurisdictional claims in published maps and institutional affiliations. |
© 2021 by the authors. Licensee MDPI, Basel, Switzerland. This article is an open access article distributed under the terms and conditions of the Creative Commons Attribution (CC BY) license (https://creativecommons.org/licenses/by/4.0/).
Share and Cite
Kim, J.-S.; Jung, J.-S.; Jung, D.-K.; Kim, E.-Y.; Lee, K.-S. Seismic Strengthening Effects of Full-Size Reinforced Concrete Frame Retrofitted with Novel Concrete-Filled Tube Modular Frame by Pseudo-Dynamic Testing. Appl. Sci. 2021, 11, 4898. https://doi.org/10.3390/app11114898
Kim J-S, Jung J-S, Jung D-K, Kim E-Y, Lee K-S. Seismic Strengthening Effects of Full-Size Reinforced Concrete Frame Retrofitted with Novel Concrete-Filled Tube Modular Frame by Pseudo-Dynamic Testing. Applied Sciences. 2021; 11(11):4898. https://doi.org/10.3390/app11114898
Chicago/Turabian StyleKim, Jin-Seon, Ju-Seong Jung, Dong-Keun Jung, Eui-Yong Kim, and Kang-Seok Lee. 2021. "Seismic Strengthening Effects of Full-Size Reinforced Concrete Frame Retrofitted with Novel Concrete-Filled Tube Modular Frame by Pseudo-Dynamic Testing" Applied Sciences 11, no. 11: 4898. https://doi.org/10.3390/app11114898