Article

Quantitative Assessment Method of Force Tracking Capabilities for Detection of Motor Intentional Disorders

1
School of Industrial Engineering, University of Ulsan, Ulsan 44610, Korea
2
Samsung Medical Center, Department of Neurology, Sungkyunkwan University School of Medicine, 81 Irwon-ro, Gangnam-gu, Seoul 06351, Korea
3
Neuroscience Center, Samsung Medical Center, 81 Irwon-ro, Gangnam-gu, Seoul 06351, Korea
4
Samsung Alzheimer Research Center, Samsung Medical Center, 81Irwon-ro, Gangnam-gu, Seoul 06351, Korea
5
Department of Intelligent Precision Healthcare Convergence, Sungkyunkwan University, Suwon 06351, Korea
6
Department of Health Sciences and Technology, SAIHST, Sungkyunkwan University, 81 Irwon-ro, Gangnam-gu, Seoul 06351, Korea
7
Hyundai Motor Company, Seoul 100-011, Korea
8
Samsung Medical Center, Stem Cell & Regenerative Medicine Institute, 81 Irwon-ro, Gangnam-gu, Seoul 06351, Korea
9
Department of Industrial and Management Engineering, Pohang University of Science and Technology, Pohang 37673, Korea
*
Author to whom correspondence should be addressed.
Appl. Sci. 2021, 11(7), 3244; https://doi.org/10.3390/app11073244
Submission received: 3 March 2021 / Revised: 22 March 2021 / Accepted: 31 March 2021 / Published: 5 April 2021
(This article belongs to the Special Issue Novel Approaches and Applications in Ergonomic Design)

Abstract

:
Early detection of motor intentional disorders associated with dysfunction in the action–intention system of the brain is clinically important to provide timely intervention. This study developed a force tracking system that can record forces exerted by the index finger while tracking 5 N, 10 N, 15 N, and 20 N of target forces varying over time. The force tracking system quantified force control measures (initiation time IT; development time, DT, maintenance error, ME; termination time, TT; tracking error, TE) for the individual and overall force control phases. This study evaluated the effectiveness of the force tracking system for a normal control group (n = 12) and two patient groups diagnosed with subcortical vascular mild cognitive impairment (svMCI, n = 11) and subcortical vascular dementia (SVaD, n = 13). Patients with SVaD showed significantly worse force control capabilities in IT (0.84 s) and ME (1.71 N) than those with svMCI (0.64 s in IT, and 1.38 N in ME). Patients with svMCI had significantly worse capabilities in IT, ME, and TE (3.80 N) than the control group (0.49 s in IT, 0.78 N in ME, and 3.07 N in TE). The prevalence rates of force control capabilities lower than the 99% confidence interval of the control group ranged from 17% to 62% for the two patient groups. The force tracking system can sensitively quantify the severity of the force control deficiencies caused by dysfunction in the action–intention system of the brain.

1. Introduction

Patients with damage in the action–intention system of the brain may have motor intentional disorders (MIDs), which show dysfunction in the execution and/or control of movement. MIDs are associated with damage in the premotor and prefrontal regions of the brain in charge of planning movement [1]. Thus, patients with damage in these regions may have MIDs despite an intact musculoskeletal system [2]. MIDs occur more among patients with right hemispheric lesions than those with left hemispheric lesions [3,4].
MIDs have been classified into motor akinesia, motor impersistence, and motor perseveration based on behavioral observation methods [1]. Motor akinesia with dysfunction in initiation is tested by asking a patient to lift the arm ipsilateral to the lesion as the hand is touched [3,5]. Motor impersistence with dysfunction in maintenance is assessed by asking a patient to keep the arms extended for 20 s [4,6,7]. Motor perseveration with dysfunction in termination is tested by asking a patient to draw the Luria loop [8]. Although these observational tests are commonly used, they can neither quantify the severity of dysfunction in the action-intension system nor detect mild dysfunction [9,10].
Quantitative assessment of dysfunction in the action–intention system is clinically important in several ways. Quantification of the severity of dysfunction allows early detection of MIDs, facilitating timely clinical interventions from an early stage [11]. For example, the quantification of severity can help in early screening of a patient with subcortical vascular mild cognitive impairment who may have a dysfunction in the action–intention system [12]. In addition, the quantification of severity helps clinicians monitor the symptom progression of a patient who is at an increased risk of developing severe symptoms and dementia. Lastly, the quantified severity can be used to evaluate the effectiveness of treatments provided to patients with MIDs.
A few recent studies have demonstrated that force control tests can objectively quantify dysfunction in the action–intention system. Seo et al. [13] proposed the four force control tests for each force phase (force initiation, development, maintenance, and termination phases). Later, Seo et al. [14] used the force control tests and found that force control capabilities of brain-damaged patients were far inferior to those of normal controls. Yoon et al. [11] and Kim et al. [15] applied the force control tests and revealed that the force control capabilities of brain-damaged patients significantly differed as compared with normal controls. These results indicate that measuring force control capabilities using the force control tests can objectively quantify the severity of dysfunction in the action–intention system.
The present study developed a quantitative assessment method of force control capabilities using a force tracking test. The force control tests used in existing studies require a longer testing time (about 20 min per patient) since the four tests corresponding to each force control phase should be separately conducted. In contrast, the force tracking test, which involves exerting forces to track target forces randomly varying over time, can examine the force control capabilities of the four phases in a single test. In addition, the force tracking test can more sensitively detect mild dysfunction than the four tests since it is a greater challenge to the action–intention system. This study developed a force tracking system and investigated its effectiveness in one normal control group (hereafter, normal group) and two patient groups with subcortical lesions.

2. Force Tracking System

2.1. System Configuration

The force tracking system developed in this study consisted of a force sensor (NK Pinch-Grip, NK Biotechnical Co., USA) and a computer screen to quantify the force control capabilities, as illustrated in Figure 1a. The force sensor (precision = 0.098 N, sampling rate = 32 Hz), which can measure the exerting forces of an index finger, was located 30 cm in front of the participant. The computer screen displayed the information needed to conduct a force tracking test and was placed 70 cm from the participant.
The force tracking system instructed the participant to apply designated target forces with the index finger on the force sensor. The target forces changed randomly among four different levels (5 N, 10 N, 15 N, and 20 N) over time. The time interval between target forces was randomly assigned between 3 and 5 s to prevent expectancy effects. The force tracking test continued for 60 s to obtain the assessment data of force control capabilities under various target force levels.
The computer screen consisted of a force gauge with a horizontal red line indicating the target force and a ball showing the force exerted by the participant, as shown in Figure 1b. The ball moved vertically in proportion to the exertion force. The color of the ball turned white, green, and red when the exertion force was below 10%, within the target range, and above the designated target force, respectively [9,10,13].

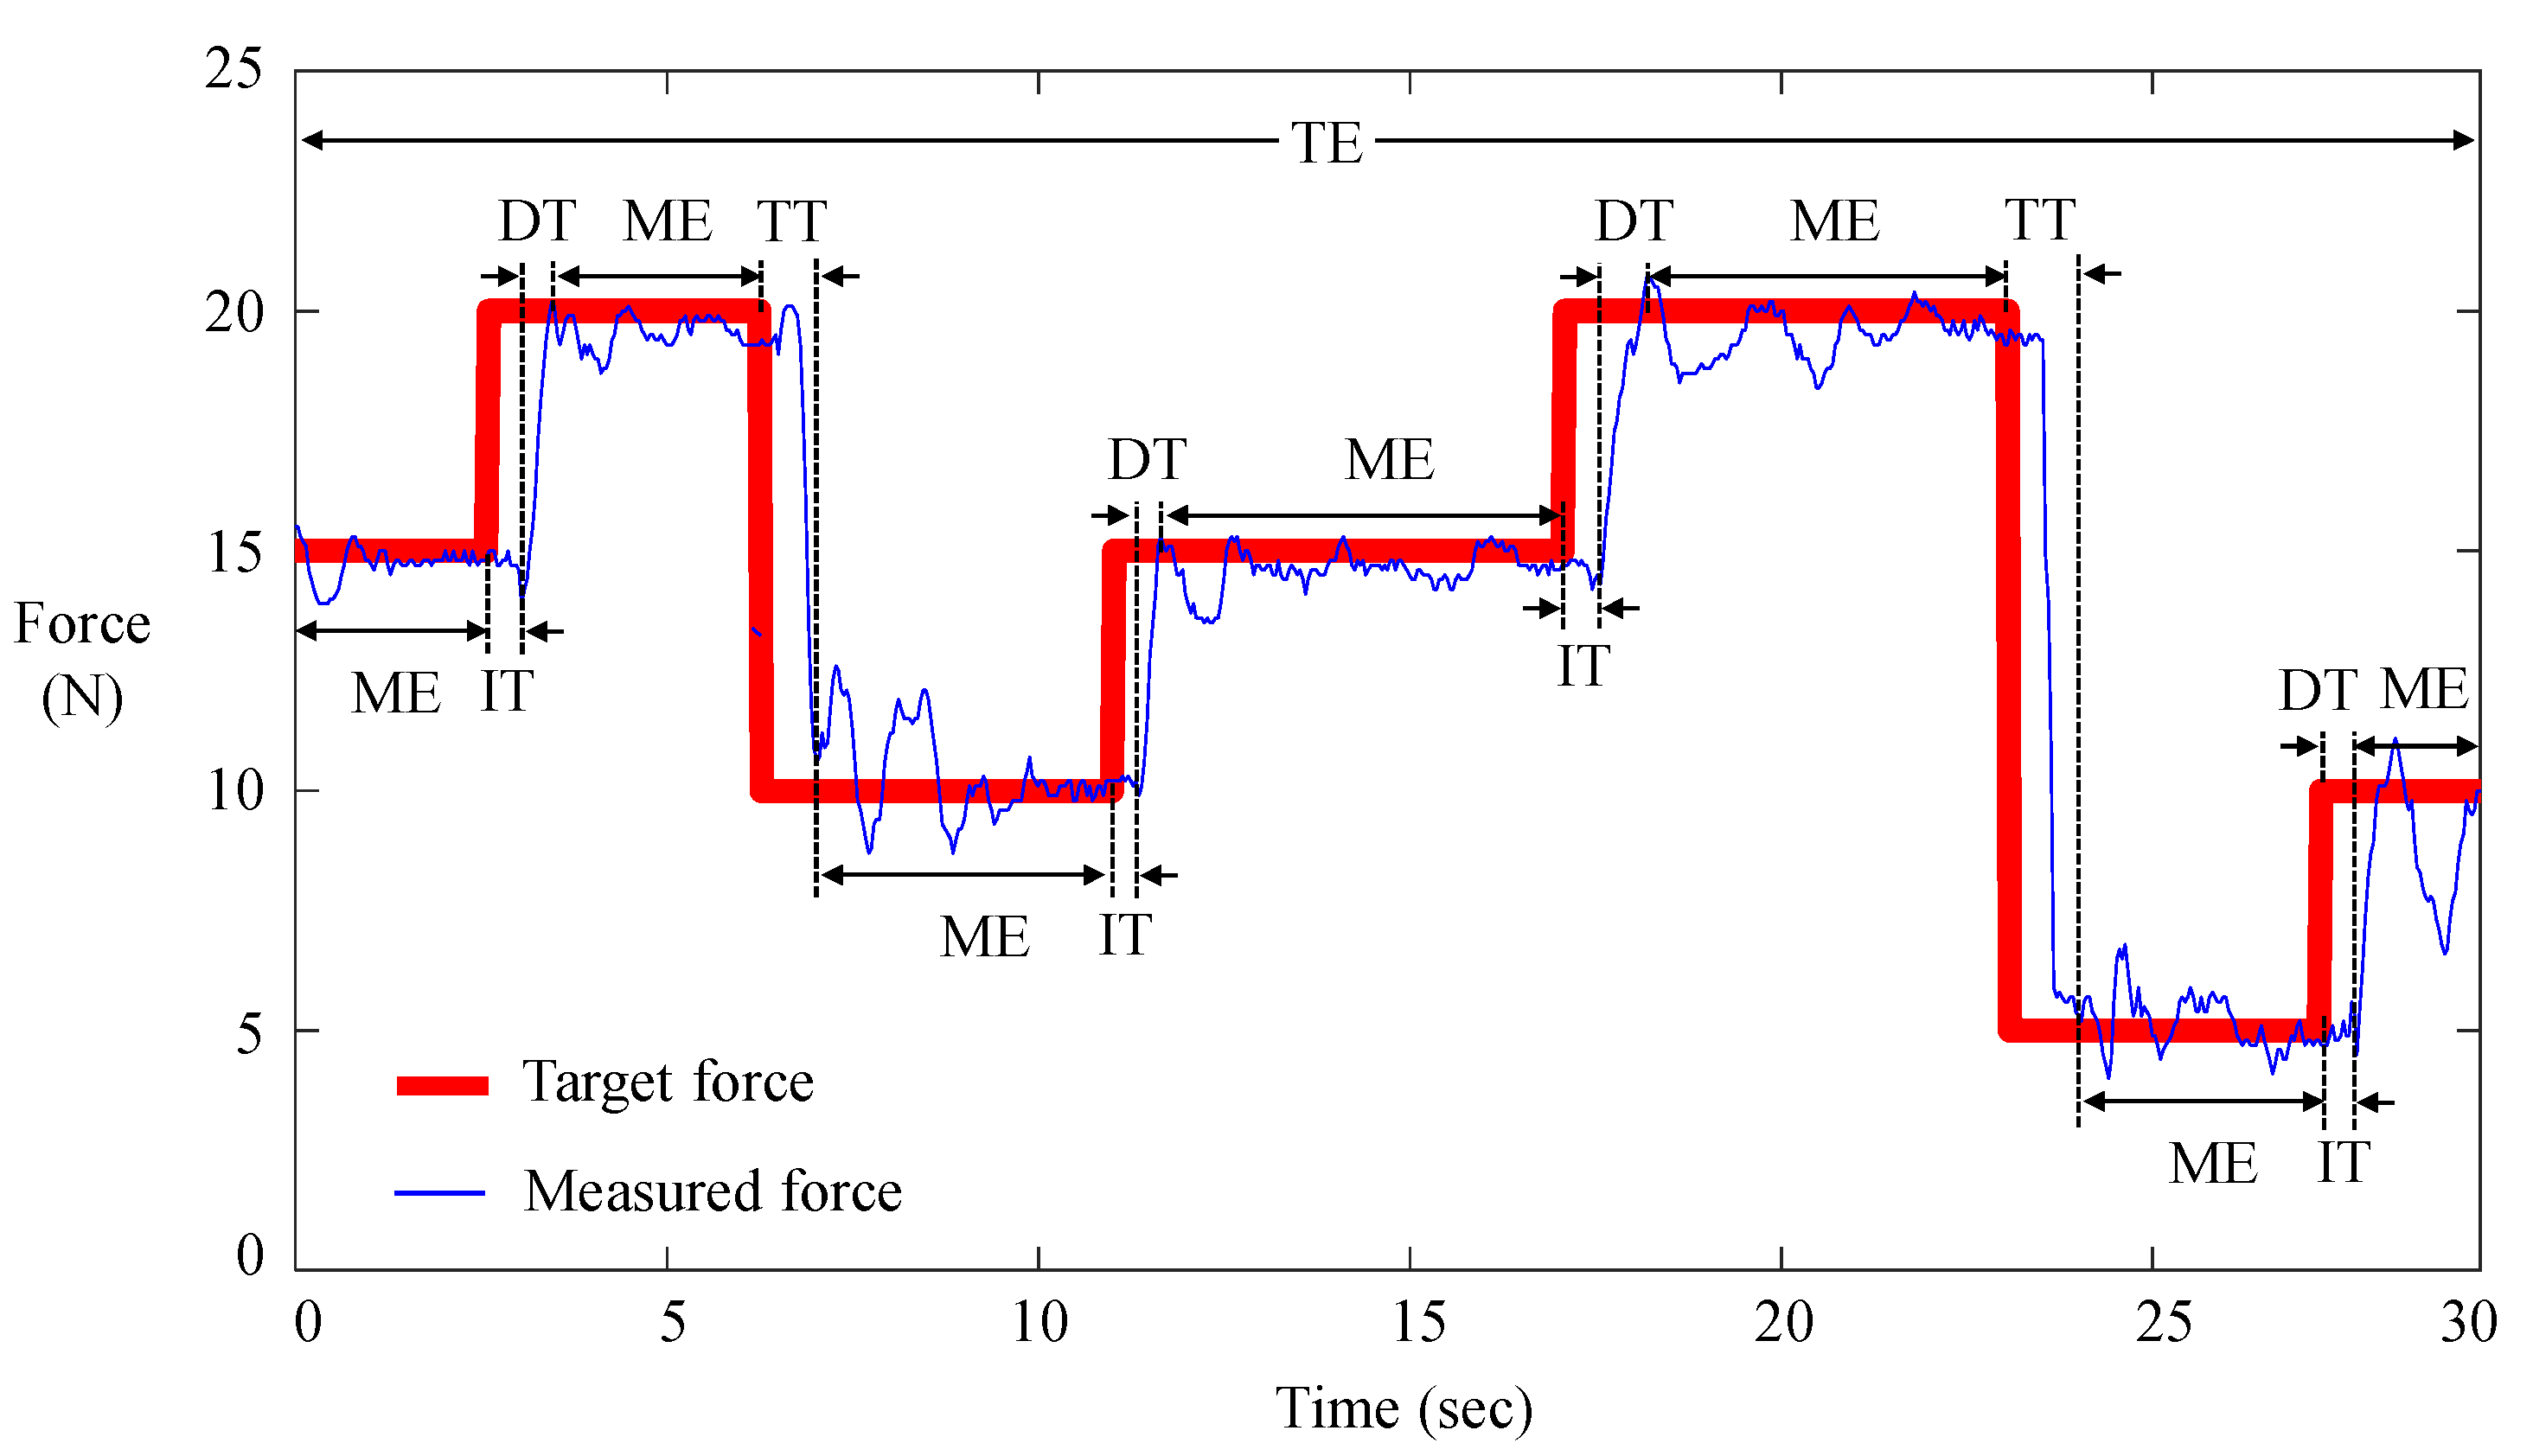
2.2. Quantification Protocol of Force Control Capabilities

To accurately quantify force control capabilities, the analysis period of the measured force data was set as 30 s after the time to stably reach a target force. Since the first time to reach a target force is often subject to artifacts, including the initial status of the participant, the force data measured after the first achievement of target force was included in the analysis.
Force control capabilities were quantified in (1) initiation time, (2) development time, (3) maintenance error, (4) termination time, and (5) tracking error, as illustrated in Figure 2. The initiation time (IT, unit: second) was the elapsed time between the increase of a target force and the beginning of increase force exertion. The development time (DT, unit: second) was the elapsed time between the end of the initiation phase and the time to reach a designated target force. The maintenance error (ME, unit: N) was the average absolute difference between a designated target force and corresponding exerted forces during the maintenance phase. The termination time (TT, unit: second) was the elapsed time between the decrease of a target force and the time to reach a designated target force. Lastly, the tracking error (TE, unit: N) was the average absolute difference between target forces and exerting forces during all the test phases.

2.3. System Configuration

The patients with abnormal force control capabilities were identified by comparing their measures with 99% confidence intervals of the normal group who had similar average age and gender ratio to the patients.

3. Case Study

3.1. Participants

To evaluate the effectiveness of the force tracking system, the present study analyzed the normal group and two patient groups diagnosed with subcortical vascular mild cognitive impairment (svMCI) or subcortical vascular dementia (SVaD) at Samsung Medical Center in Seoul, Republic of Korea. Eleven patients with svMCI (male = 6, female = 5; mean age = 74.5, SD = 5.6) and 13 patients with SVaD (male = 5, female = 8; mean age = 75.8, SD = 4.7) participated in this case study. All svMCI cases fulfilled the criteria suggested in Petersen et al. [16], and all SVaD cases met the criteria proposed by Erkinjuntti et al. [17]. Twelve normal participants (male = 4, female = 8; mean age = 71.6, SD = 7.3) were recruited as controls. The mean age and gender ratio of each group were approximately matched with each other as shown in Table 1 because force control capabilities may differ by age and gender [18,19,20]. This study was approved by the Institutional Review Board of Samsung Medical Center (IRB No. 2009-09-084).
The primary lesions for svMCI and SVaD were located in the frontal and related subcortical areas. Seo et al. [10,14] have shown that svMCI and SVaD are associated with cortical thinning in the frontal regions that may cause MIDs. The cortical thinning largely overlaps between svMCI and SVaD; however, the severity is greater in SVaD since svMCI is regarded as the prodromal stage of SVaD [21,22].

3.2. Experimental Design and Statistical Analysis
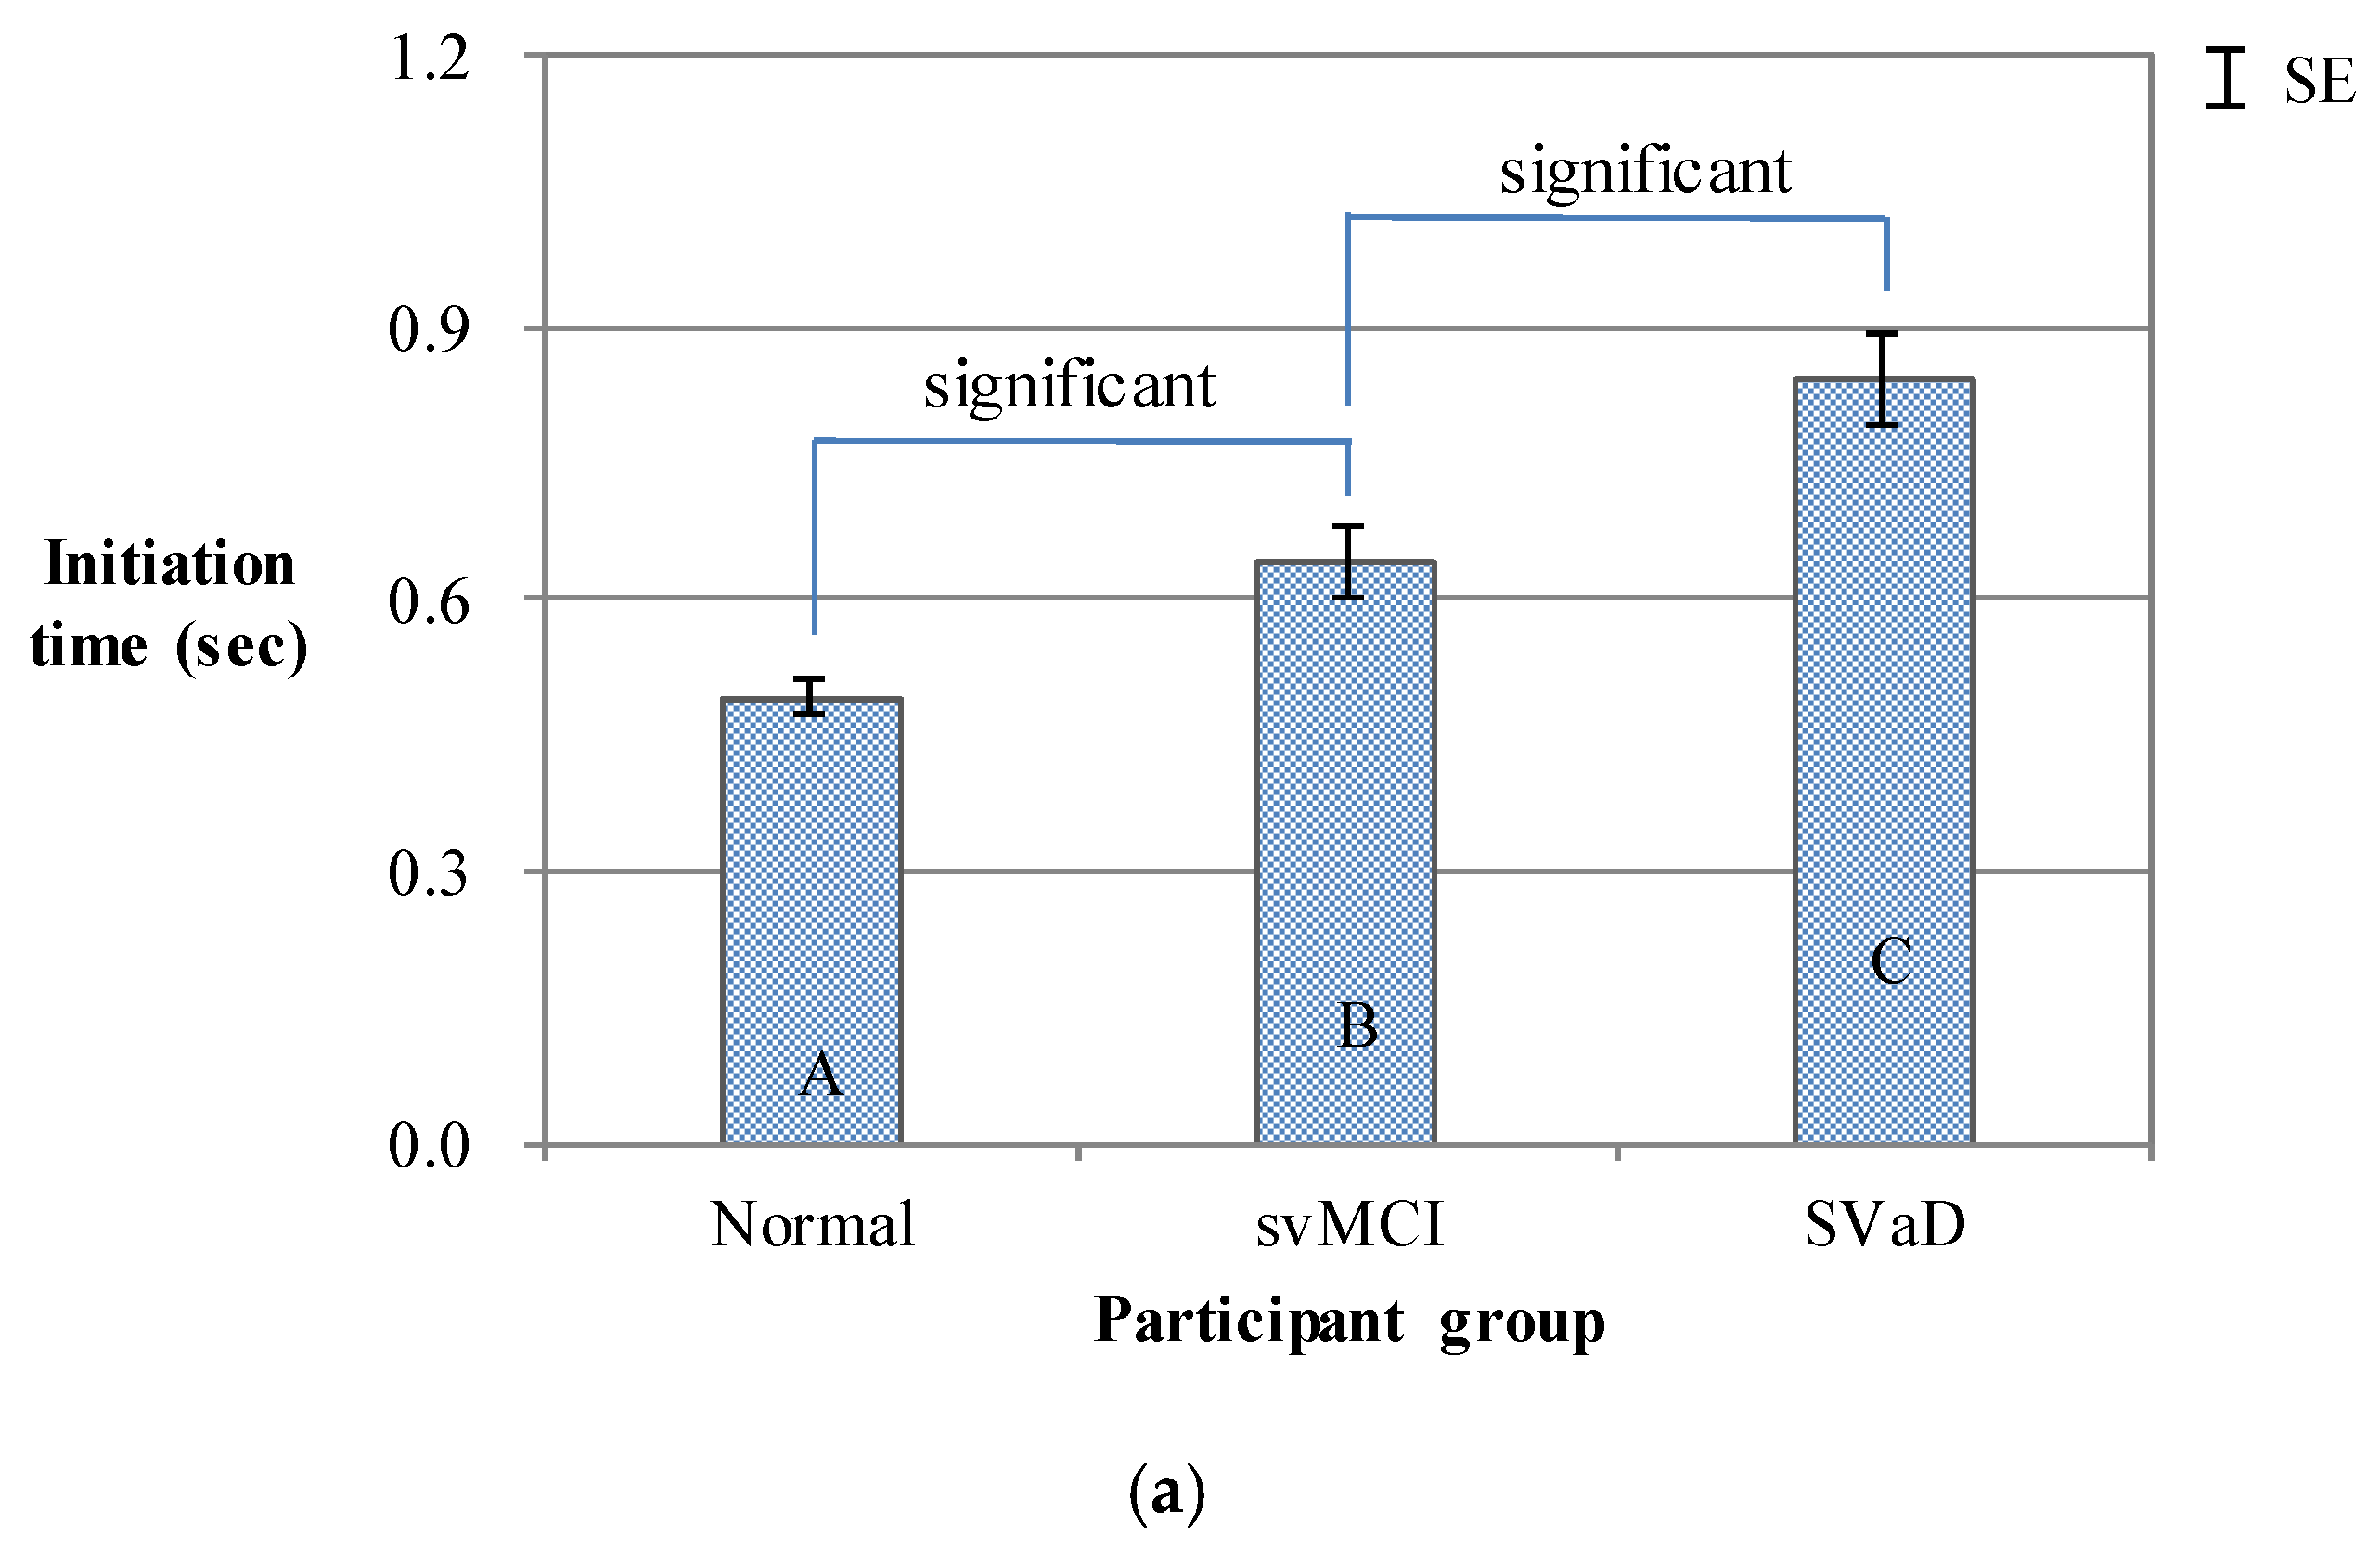
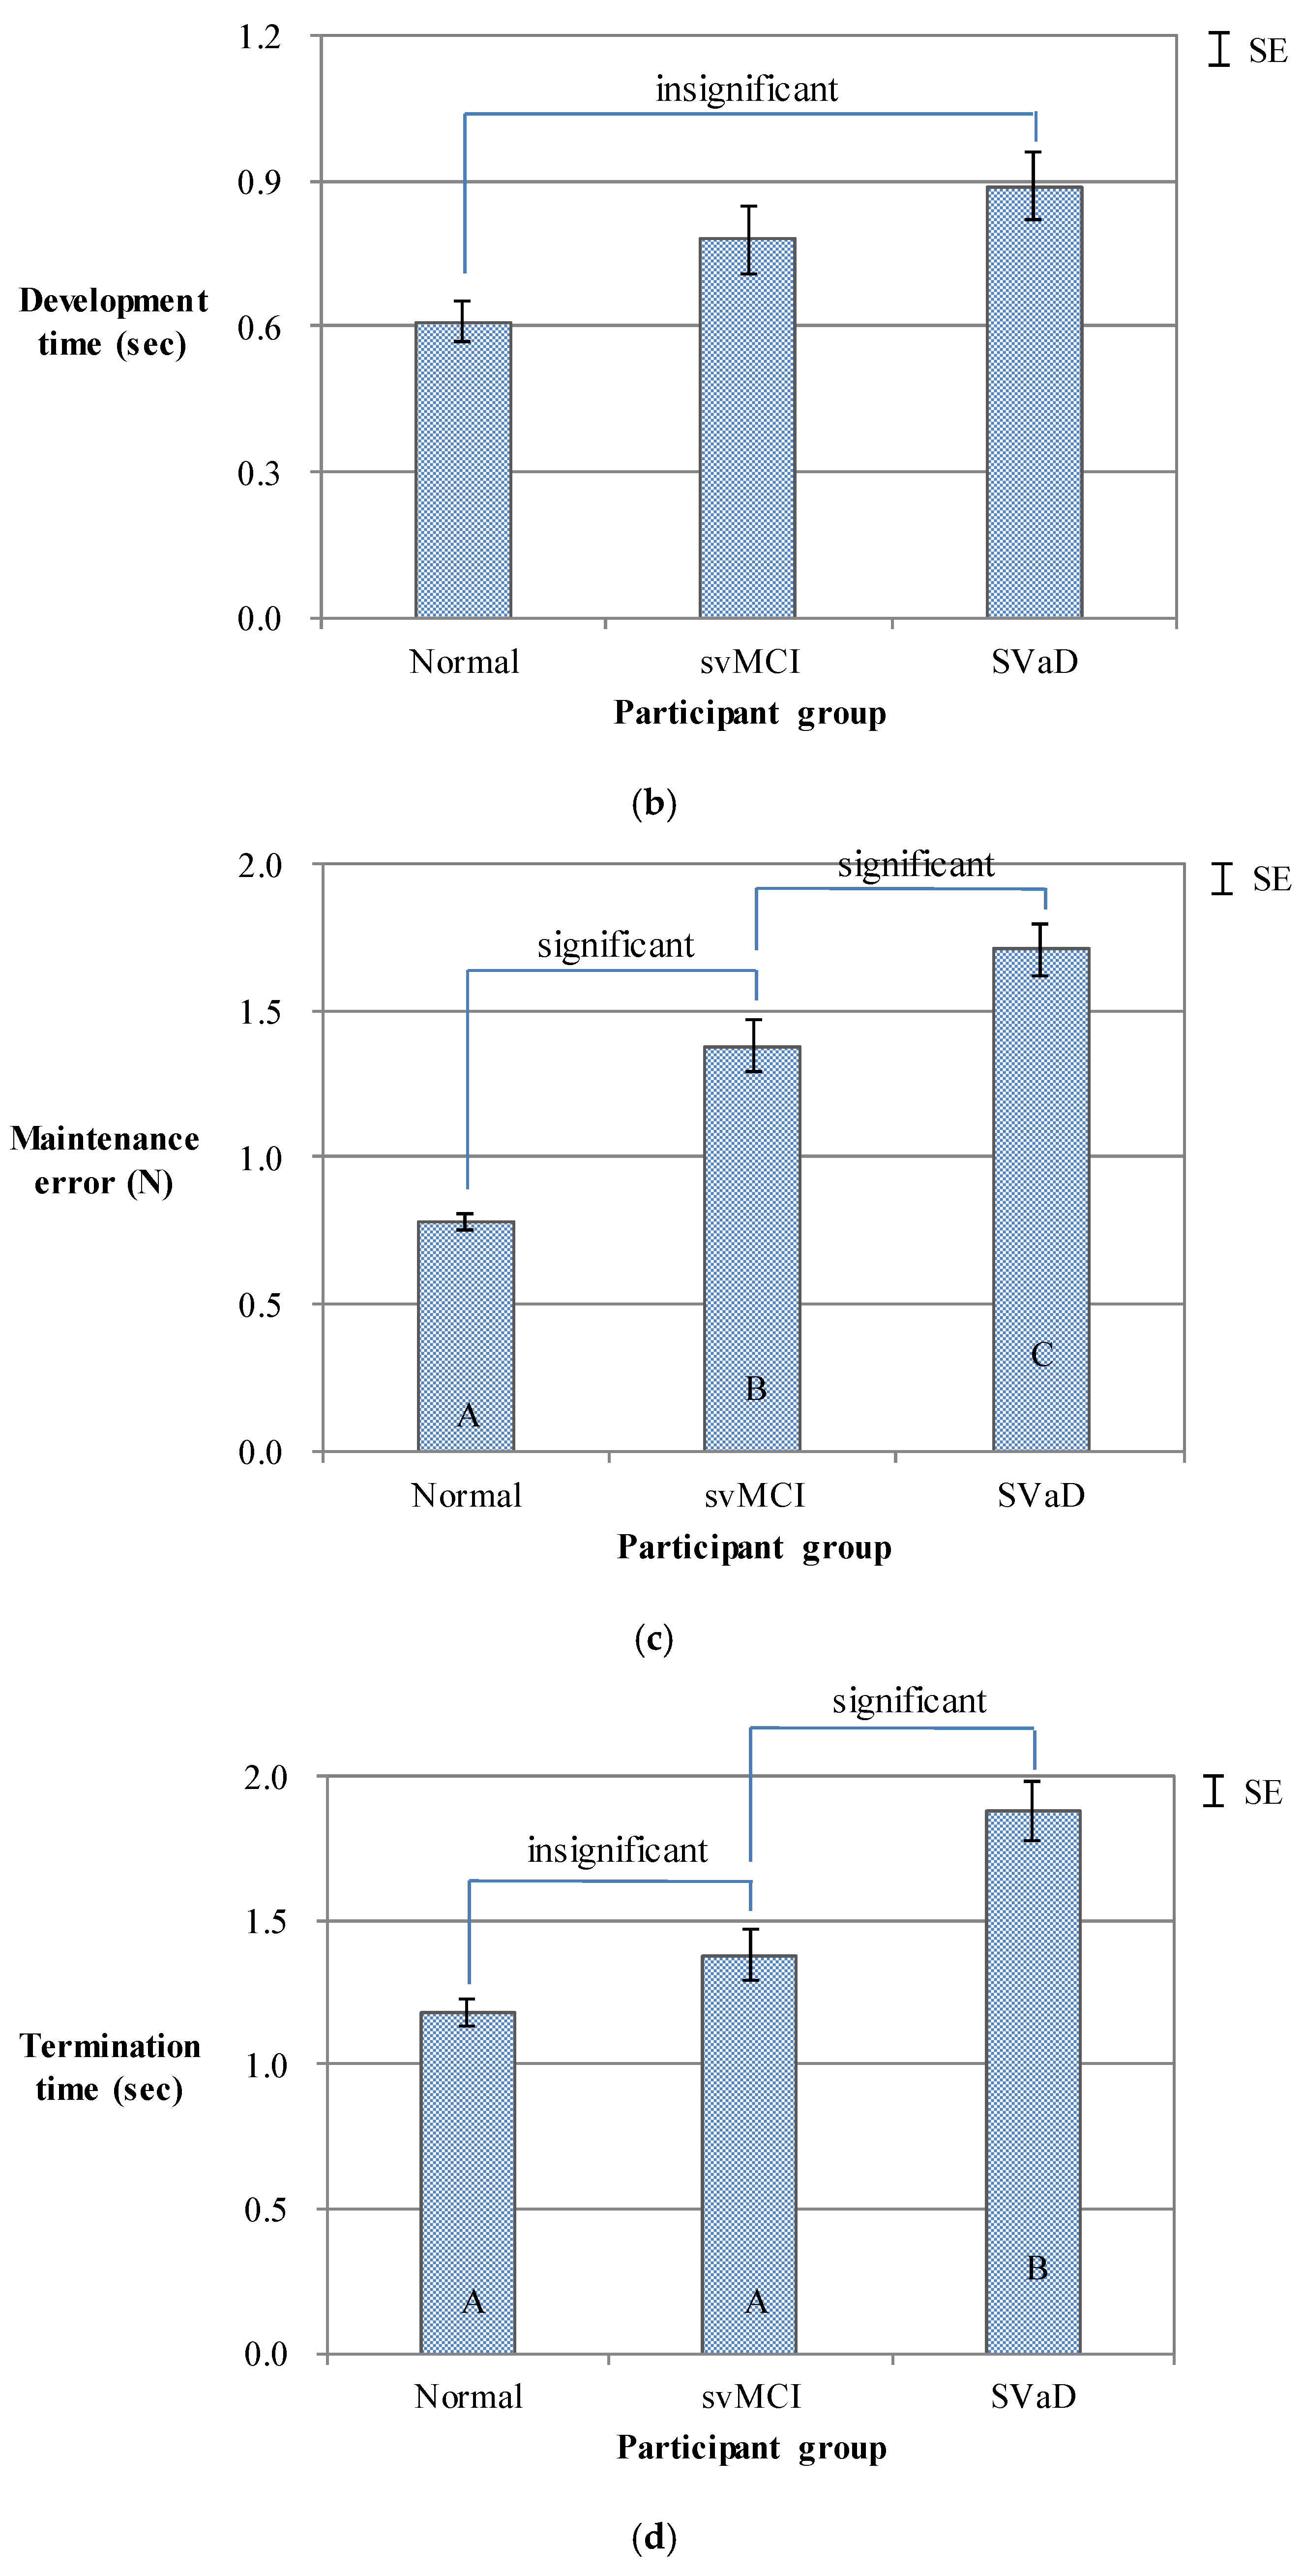
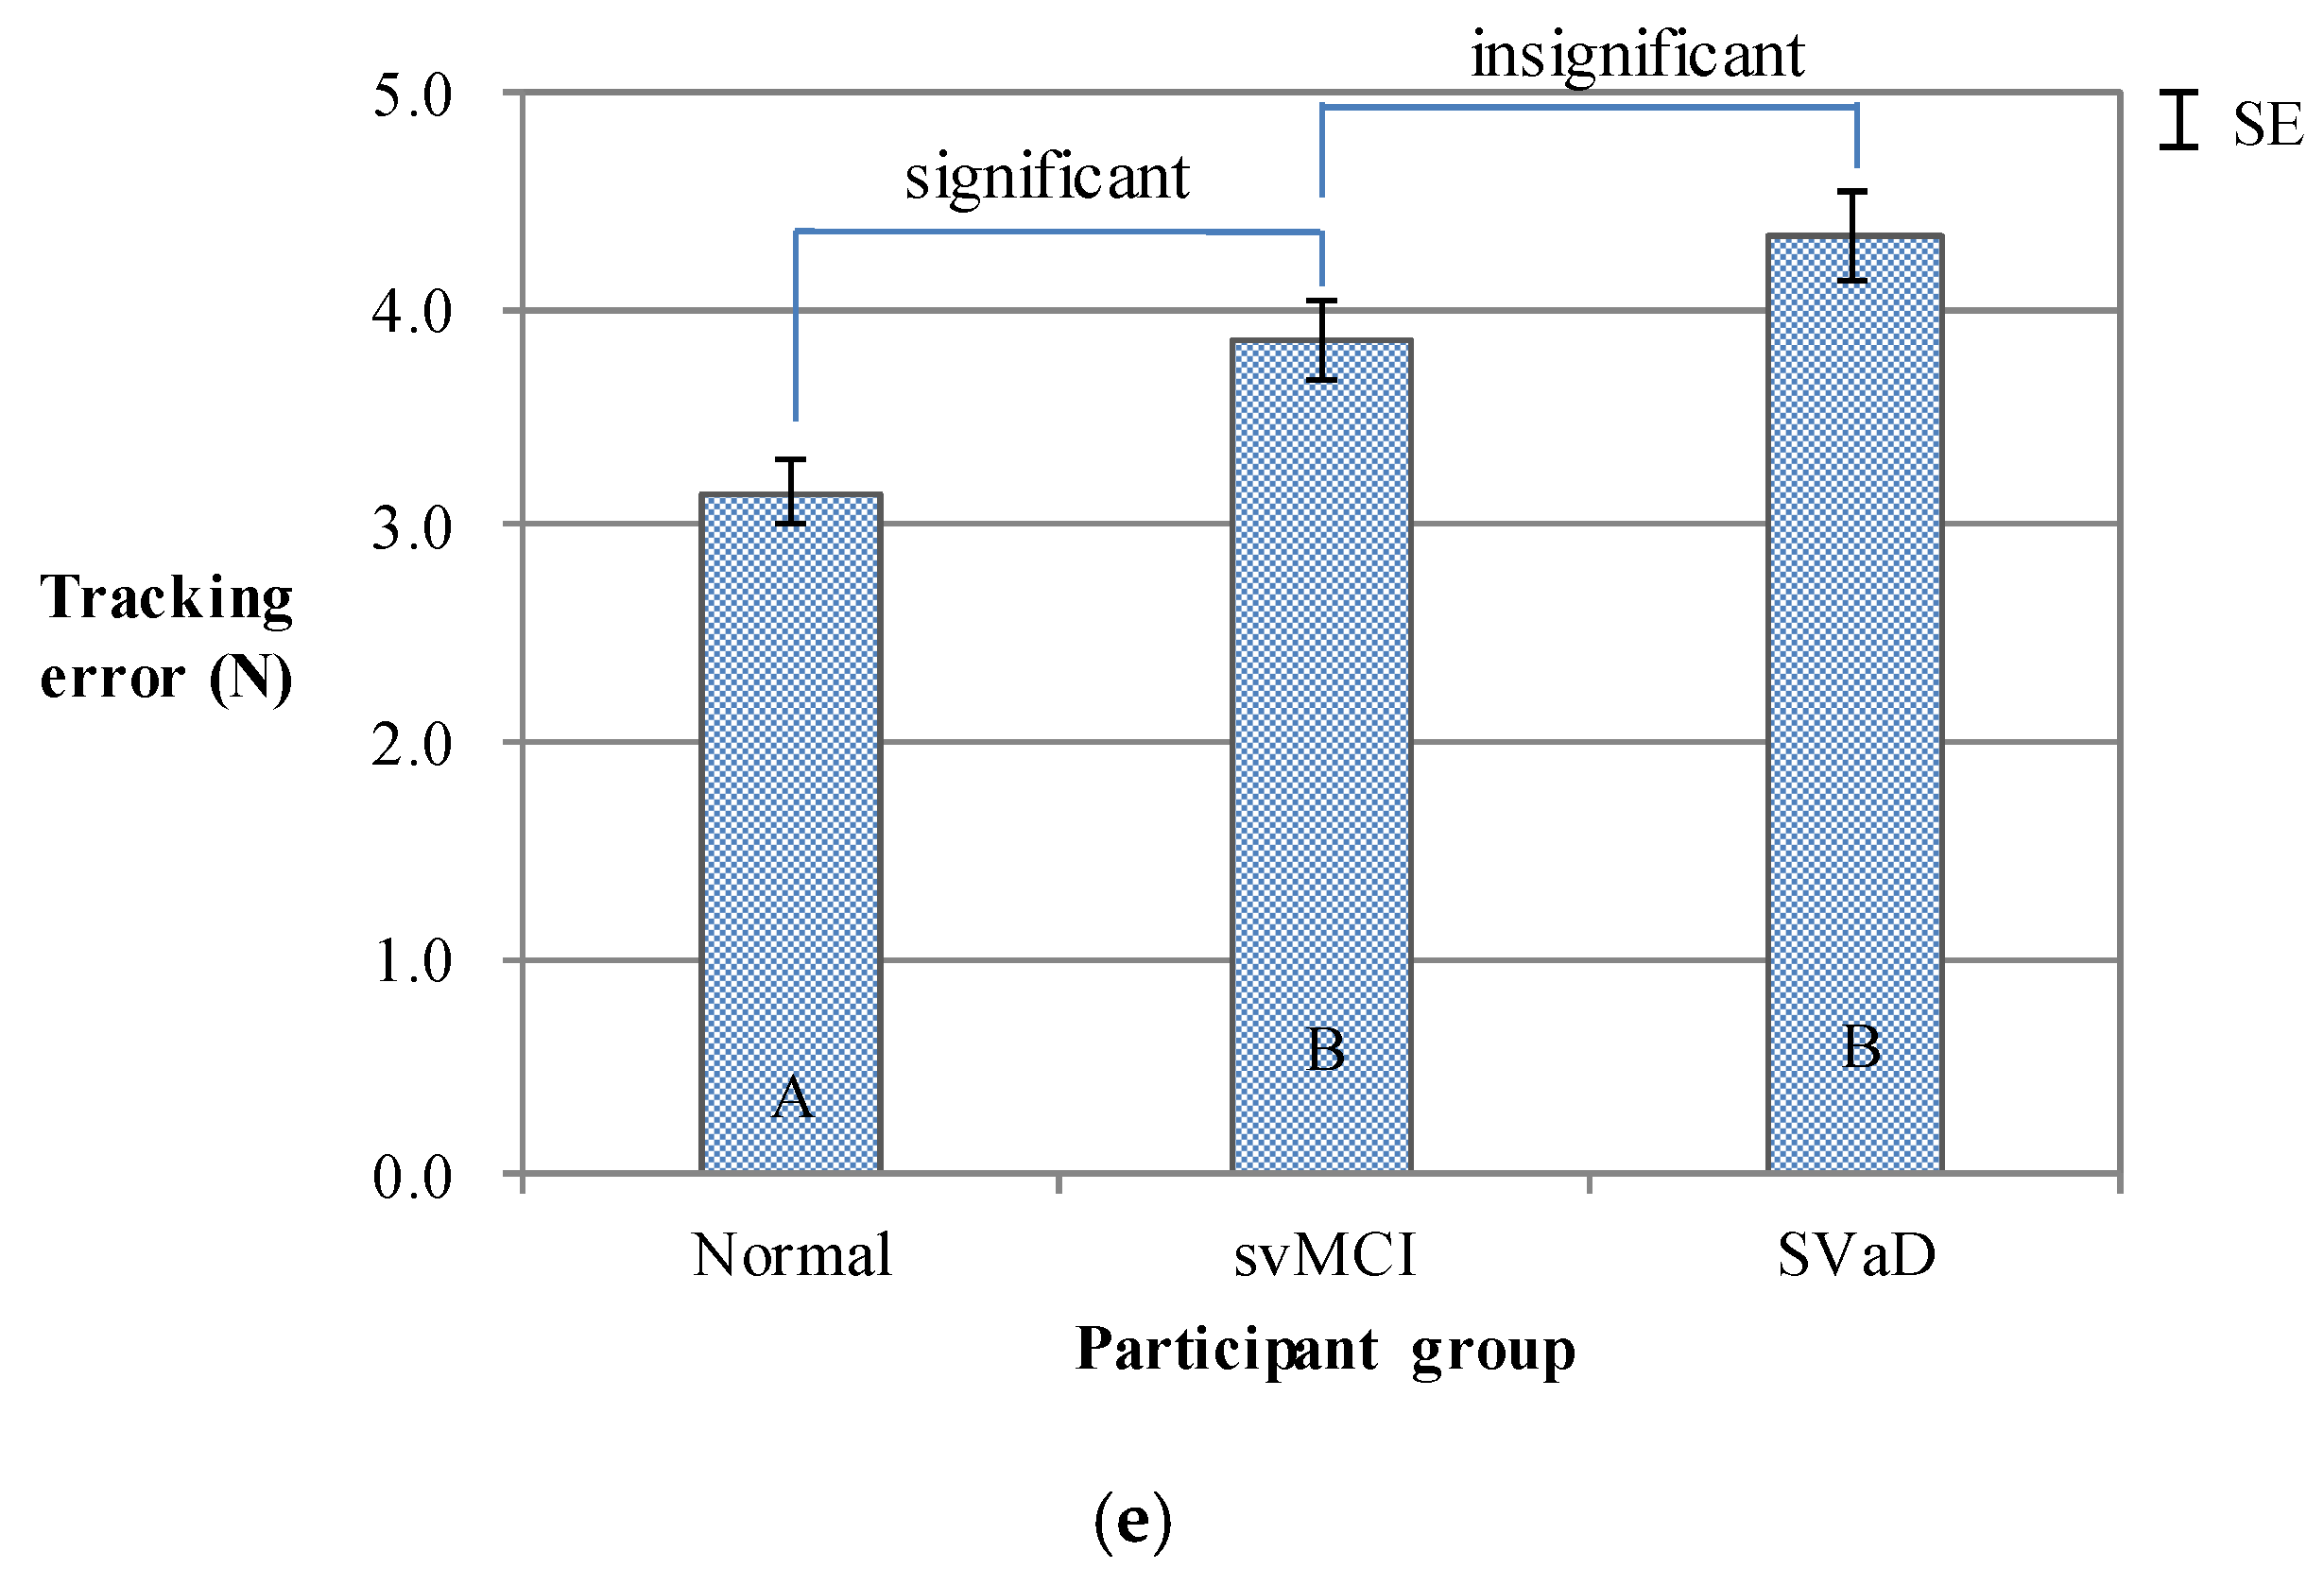
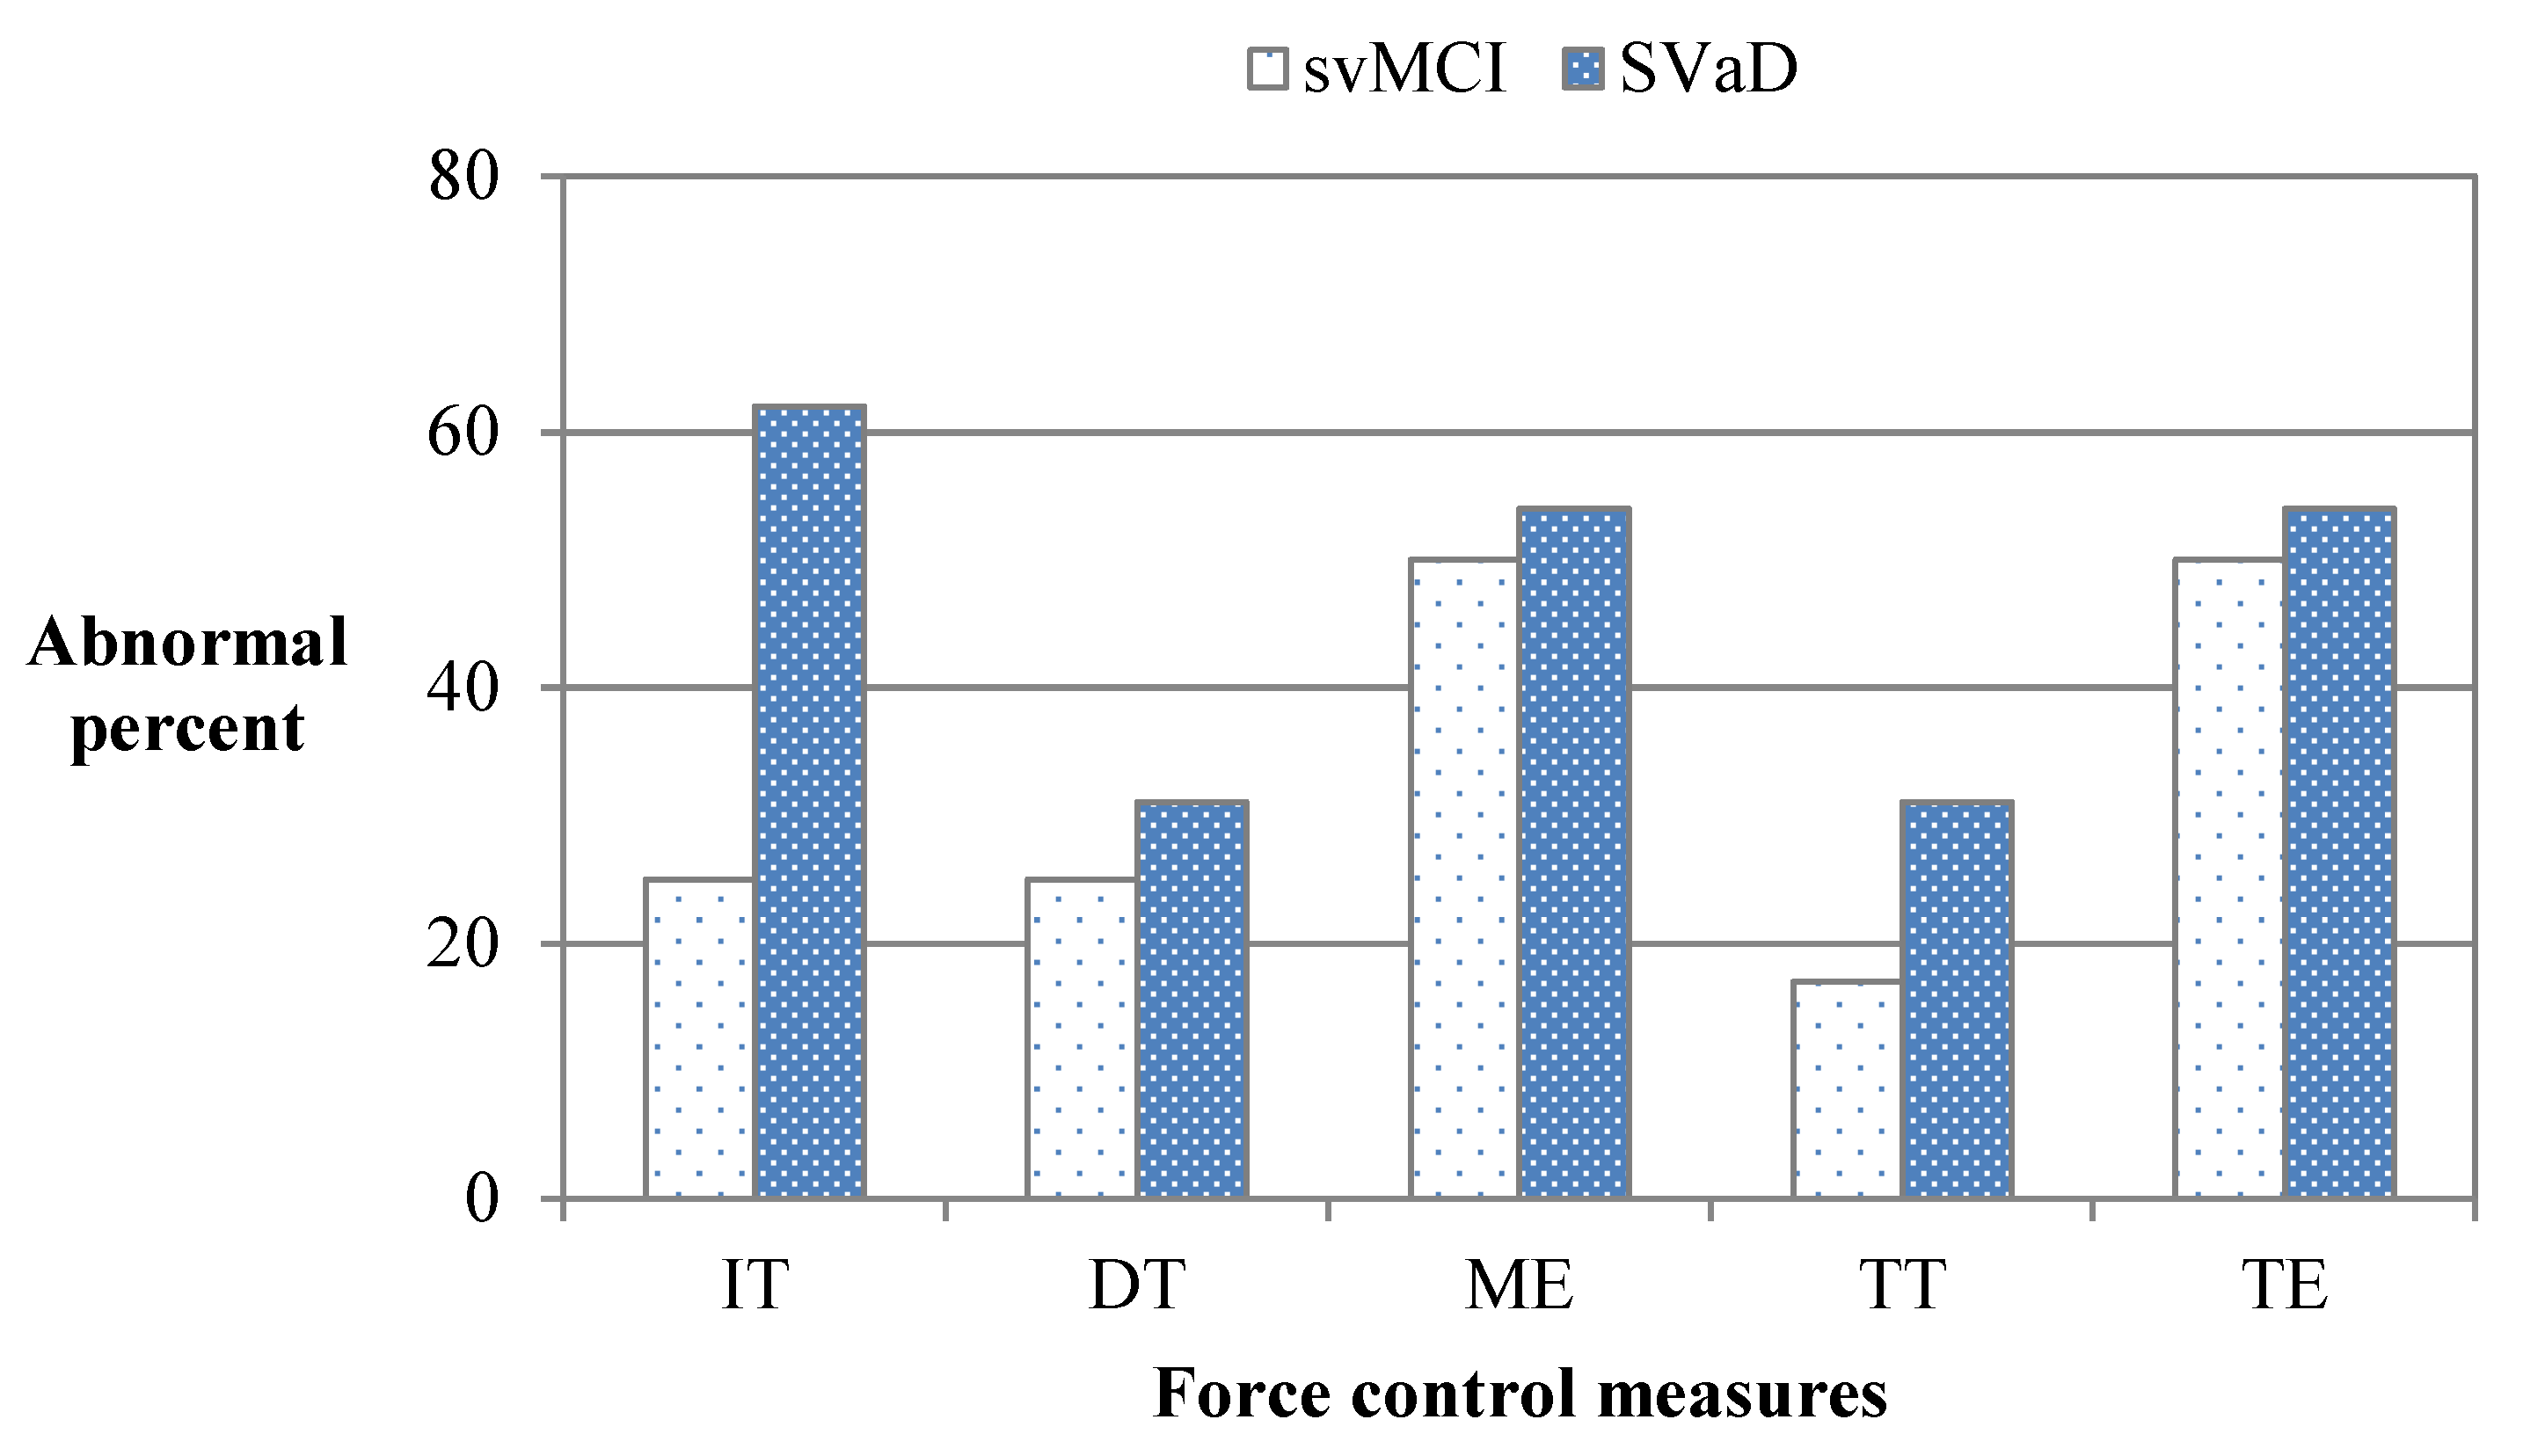
The present study employed a one-factor (participant group) between subjects design and conducted the force tracking tests in three steps (orientation, practice, and main test). In the first step, the purpose and instruction of the test were explained to the participant. In the second step, the participant was asked to practice the force tracking task to become familiarized. In the last step, the main tests were conducted four times for the participant. Breaks of about 2 min were allowed between the repetitions.
One-factor between-subjects ANOVA and Tukey tests were conducted using MINITAB (Minitab Inc., State College, PA, USA) at α = 0.05. This study excluded data that fell outside 95% confidence intervals of repeated trials [10,11]. The average proportion of excluded data was similar among the three groups of participants (normal: 4.0%, svMCI: 3.5%, and SVaD: 3.3%).

3.3. Results

The IT, ME, and TE of the normal group were significantly smaller than those of the patient groups, as shown in Figure 3 (IT: F(2, 34) = 35.78, p < 0.001; ME: F(2, 34) = 7.67, p = 0.002; TE: F(2, 34) = 13.32, p < 0.001). Tukey tests on IT classified the normal group (mean ± SE; 0.49 ± 0.02) as the fastest group, svMCI (0.64 ± 0.04) as the middle group, and SVaD (0.84 ± 0.05) as the slowest group. Similarly, Tukey tests on ME grouped the normal group (0.78 ± 0.03) as the best group, svMCI (1.38 ± 0.09) as the middle group, and SVaD (1.72 ± 0.09) as the worst group. TE slightly differed from IT and ME, although the trend remained; Tukey tests on TE classified the normal group (3.07 ± 0.13) as the best group and svMCI (3.80 ± 0.22) and SVaD (4.33 ± 0.21) as the worst groups.
TT was significantly different according to participant group (F(2, 34) = 23.01, p < 0.001). Tukey tests on TT classified the normal group (1.18 ± 0.05) and svMCI (1.38 ± 0.09) as the fastest groups and SVaD (1.88 ± 0.10) as the slowest group. Lastly, DT was not significantly different between groups (F(2, 34) = 2.58, p = 0.089), although it increased from the normal group (0.61 ± 0.04) to the svMCI (0.78 ± 0.07) and SVaD (0.89 ± 0.07) groups in ascending order.
Large percentages of svMCI cases in ME and TE and SVaD cases in IT, ME, and TE exceeded the 99% confidence intervals of the normal group, as shown in Figure 4. Subjects with svMCI showed larger deficits in ME (50%) and TE (50%) than IT (25%), DT (25%), and TT (17%). Those with SVaD revealed larger deficits in IT (62%), ME (54%), and TE (54%) than DT (31%) and TT (31%).

4. Discussion

The force tracking system developed in the present study can efficiently assess force control capabilities in a shorter time (about 10 min) than the force control tests used in previous studies. The force tracking system can quantify four measures of each force control phase (initiation time, development time, maintenance error, and termination time) and one overall measure (tracking error) using a single force tracking test. However, the force control tests used in previous studies [10,11,13,15] quantify the four measures by separately testing each force control phase, which requires more time to complete than the force tracking test.
The force tracking system can better statistically discriminate the severity of the force control deficiencies. Yoon et al. [11] and Kim et al. [15] used force control tests and failed to show a significant difference in IT between the normal and svMCI groups, while this study clearly showed a significant difference. In addition, Yoon et al. [11] had similar results for svMCI and SVaD in ME; however, this study showed a clear difference between the two patient groups. The present study was more sensitive because the force tracking test required more action–intention, making it easier to detect mild dysfunction in the action–intention system. However, large-scale experiments are needed using the force tracking system developed in this study to confirm these findings.
Patients with SVaD showed force control capabilities in all measures worse than those with svMCI. IT (mean = 0.84 s), DT (0.89 s), ME (1.71 N), TT (1.88 p), and TE (4.33 N) in the SVaD group were 31%, 14%, 24%, 36%, and 14% greater than those (0.64 s in IT, 0.78 s in DT, 1.38 N in ME, 1.38 s in TT, and 3.80 N in TE) in the svMCI group, respectively. From these results, we conclude that SVaD patients have more severe dysfunction in the action–intention system than svMCI patients. These findings are consistent with previous studies [11,14] that show that svMCI may represent a prodromal state of SVaD in terms of neuropsychological results and neuroimaging findings.
The proportion of patients outside the 99% confidence intervals of the force control capabilities of the normal group was higher for ME and TE in the svMCI group and IT, ME, and TE in the SVaD group. The svMCI group showed higher prevalence rates for ME (50%) and TE (50%) than the other measures (17% to 25%). On the other hand, the SVaD group showed higher prevalence rates in IT (62%), ME (54%), and TE (54%) than the other measures (31%). These results indicate that svMCI patients are more prone to have motor impersistence, while SVaD patients are more prone to have motor akinesia and motor impersistence. Thus, motor impersistence can be considered an early symptom of MIDs, while motor akinesia represents a late symptom observed in more severe patients. Although this finding agrees with Yoon et al. [11], more case studies are needed to generalize the results.
The present study demonstrated the usefulness of the force tracking system in detecting patients with dysfunction in the action–intention system. Among patients with svMCI and SVaD, about 10% to 60% had dysfunction in the associated force control measure, implying that the force tracking system can be used to select brain-damaged patients who need clinical interventions to improve their symptoms. In addition, the case study revealed that prevalence rates of the patients were different among the force control phases. Such differences indicate that customized intervention is needed for each patient, since they may experience dysfunction in different force control phases. However, future research is required with diverse age groups and patient groups to generalize the findings of this study.
The force tracking system described here can help develop a brain fitness method specialized in enhancing the action–intention system of the brain. Brain fitness serves to maintain and/or improve brain abilities by stimulating the brain [23], which may promote the creation of new neurons, neural connections, and brain vascularization. Brain fitness for brain-damaged patients can be done by force tracking exercises designed to challenge the action–intention system. This force tracking system can be used not only as a brain fitness tool, but also to objectively monitor the effectiveness of brain fitness exercises.

5. Conclusions

The present study developed a force tracking system that can quantify force control capabilities to detect motor intentional disorders. The force tracking system recorded the forces exerted by a patient while tracking designated forces (5 N, 10 N, 15 N and 20 N) varying over time. Four force control measures (initiation time, development time, maintenance error, and determination time) were quantified for each phase, as well as one overall measure (tracking error). The study found that the force tracking system (a single test) quantified force control capabilities more efficiently and sensitively than force control tests (multiple separate tests).

Author Contributions

Conceptualization, all authors; methodology, all authors; software, K.J.; formal analysis, K.J. and B.H.L.; data curation, B.H.L., S.W.S. and D.S.Y.; writing—original draft preparation, K.J.; writing—review and editing, all coauthors; supervision, D.L.N. and H.Y.; funding acquisition, D.L.N. and H.Y. All authors have read and agreed to the published version of the manuscript.

Funding

This research was jointly supported by the National Research Foundation (NRF) of Korea Grant funded by the Korean Government (NRF-2020M3C1B6113677; NRF-2018R1A2A2A05023299; NRF-2018K1A3A1A20026539; NRF- 2018R1C1B5047805), the Ministry of Trade, Industry, and Energy (R0004840, 2020), Samsung Biomedical Research Institute grant (C-B0-217-3), the Korean Health Technology R&D Project funded by the Ministry of Health & Welfare (HI19C1132), and the Korea Health Technology R&D Project through the Korea Health Industry Development Institute (KHIDI) funded by the Ministry of Health & Welfare and Ministry of Science and ICT (HU20C0111).

Institutional Review Board Statement

This study was approved by the Institutional Review Board of Samsung Medical Center (IRB No. 2009-09-084) and conducted according to the research ethnics and standards.

Informed Consent Statement

Informed consent was obtained from all participants involved in the study.

Data Availability Statement

Data not available due to privacy or ethical restrictions.

Conflicts of Interest

The authors declare no conflict of interest.

References

  1. Heilman, K.M. Intentional neglect. Front. Biosci. 2004, 1, 694–705. [Google Scholar] [CrossRef] [PubMed]
  2. Heilman, K.M.; Watson, R.T.; Valenstein, E. Neglect and related disorders. In Clinical Neuropsychology; Heilman, K.M., Valenstein, E., Eds.; Oxford University Press: New York, NY, USA, 2012; pp. 296–348. [Google Scholar]
  3. Coslett, H.B.; Heilman, K.M. Hemihypokinesia after right hemisphere stroke. Brain Cogn. 1989, 9, 267–278. [Google Scholar] [CrossRef]
  4. Kertesz, A.; Nicholson, I.; Cancelliere, A.; Kassa, K.; Black, S.E. Motor impersistence: A right-hemisphere syndrome. Neurology 1985, 35, 662–666. [Google Scholar] [CrossRef] [PubMed]
  5. Crucian, G.P.; Heilman, K.M.; Junco, E.; Maraist, M.; Owens, W.E.; Foote, K.D.; Okun, M.S. The crossed response inhibition task in Parkinson’s disease: Disinhibition hyperkinesia. Neurocase 2007, 13, 158–164. [Google Scholar] [CrossRef] [PubMed]
  6. Buchanan, R.W.; Heinrichs, D.W. The Neurological Evaluation Scale (NES): A structured instrument for the assessment of neurological signs in schizophrenia. Psychiatry Res. 1989, 27, 335–350. [Google Scholar] [CrossRef]
  7. Chen, E.Y.H.; Shapleske, J.; Luque, R.; McKenna, P.J.; Hodges, J.R.; Calloway, S.P.; Hymas, N.F.; Dening, T.R.; Berrios, G.E. The Cambridge Neurological Inventory: A clinical instrument for assessment of soft neurological signs in psychiatric patients. Psychiatry Res. 1995, 56, 183–204. [Google Scholar] [CrossRef]
  8. Luria, A.R. L.S. Vygotsky and the problem of localization of functions. Neuropsychologia 1965, 3, 387–392. [Google Scholar] [CrossRef]
  9. Lee, B.; Park, H.; Jung, K.; Lee, B.H.; Na, D.L.; You, H. The effects of age, gender, and hand on finger force control capabilities. Hum. Factors 2015, 57, 1248–1358. [Google Scholar] [CrossRef] [PubMed]
  10. Seo, S.W.; Jung, K.; You, H.; Lee, B.H.; Kim, G.; Chung, C.; Lee, K.H.; Na, D.L. Motor-intentional disorders in right hemisphere stroke. Cogn. Behav. Neurol. 2009, 22, 242–248. [Google Scholar] [CrossRef] [PubMed] [Green Version]
  11. Yoon, D.S.; Jung, K.; Kim, G.H.; Kim, S.H.; Lee, B.H.; Seo, S.W.; You, H.; Na, D.L. Motor intentional disorders in vascular mild cognitive impairment and vascular dementia of subcortical type. Neurocase 2014, 20, 53–60. [Google Scholar] [CrossRef]
  12. Kim, S.H.; Seo, S.W.; Go, S.M.; Chin, J.; Lee, B.H.; Lee, J.H.; Han, S.H.; Na, D.L. Pyramidal and extrapyramidal scale (PEPS): A new scale for the assessment of motor impairment in vascular cognitive impairment associated with small vessel disease. Clin. Neurol. Neurosurg. 2011, 113, 181–187. [Google Scholar] [CrossRef] [PubMed]
  13. Seo, S.W.; Jung, K.; You, H.; Kim, E.J.; Lee, B.H.; Adair, J.C.; Na, D.L. Dominant limb motor impersistence associated with callosal disconnection. Am. Acad. Neurol. 2007, 68, 862–864. [Google Scholar] [CrossRef]
  14. Seo, S.W.; Ahn, J.; Yoon, U.; Im, K.; Lee, J.M.; Tae, K.S.; Ahn, H.J.; Chin, J.; Jeong, Y.; Na, D.L. Cortical thinning in vascular mild cognitive impairment and vascular dementia of subcortical type. J. Neuroimaging 2009, 20, 37–45. [Google Scholar] [CrossRef]
  15. Kim, G.H.; Seo, S.W.; Jung, K.; Kwon, O.; Kwon, H.; Kim, J.H.; Roh, J.H.; Kim, M.; Lee, B.H.; Yoon, D.S.; et al. The neural correlates of motor intentional disorders in patients with subcortical vascular cognitive impairment. J. Neurol. 2016, 263, 89–99. [Google Scholar] [CrossRef] [PubMed]
  16. Petersen, R.C.; Smith, G.E.; Waring, S.C.; Ivnik, R.J.; Tangalos, E.G.; Kokmen, E. Mild cognitive impairment: Clinical characterization and outcome. Arch. Neurol. 1999, 56, 303–308. [Google Scholar] [CrossRef] [PubMed]
  17. Erkinjuntti, T.; Inzitari, D.; Pantoni, L.; Wallin, A.; Scheltens, P.; Rockwood, K.; Roman, G.C.; Chui, H.; Desmond, D.W. Research criteria for subcortical vascular dementia in clinical trials. J. Neural Transm. Suppl. 2000, 59, 23–30. [Google Scholar]
  18. Hubner, L.; Godde, B.; Voelcker-Rehage, C. Older adults reveal enhanced task-related beta power decreases during a force modulation task. Behav. Brain Res. 2018, 345, 104–113. [Google Scholar] [CrossRef] [PubMed]
  19. Liu, C.; Li, C.; Yang, J.; Gui, L.; Zhao, L.; Evans, A.C.; Yin, X.; Wang, J. Characterizing brain iron deposition in subcortical ischemic vascular dementia using susceptibility-weighted imaging: An in vivo MR study. Behav. Brain Res. 2015, 288, 33–38. [Google Scholar] [CrossRef] [PubMed]
  20. Li, C.; Liu, C.; Yin, X.; Yang, J.; Gui, L.; Wei, L.; Wang, J. Frequency-dependent changes in the amplitude of low-frequency fluctuations in subcortical ischemic vascular disease (SIVD): A resting-state fMRI study. Behav. Brain Res. 2014, 274, 205–210. [Google Scholar] [CrossRef] [PubMed]
  21. Frisoni, G.B.; Galluzzi, S.; Bresciani, L.; Zanetti, O.; Geroldi, C. Mild cognitive impairment with subcortical vascular features: Clinical characteristics and outcome. J. Neurol. 2002, 249, 1423–1432. [Google Scholar] [CrossRef] [PubMed]
  22. Sun, Y.; Qin, L.; Zhou, Y.; Xu, Q.; Qian, L.; Tao, J.; Xu, J. Abnormal functional connectivity in patients with vascular cognitive impairment, no dementia: A resting-state functional magnetic resonance imaging study. Behav. Brain Res. 2011, 223, 388–394. [Google Scholar] [CrossRef] [PubMed]
  23. Kramer, A.F.; Colcombe, S. Fitness effects on the cognitive function of older adults: A meta-analytic study-revisited. Perspect. Psychol. Sci. 2018, 13, 213–217. [Google Scholar] [CrossRef] [PubMed] [Green Version]
Figure 1. Force tracking system: (a) system layout; (b) computer screen.
Applsci 11 03244 g001
Figure 2. Illustration of force control measures (IT: initiation time, DT: development time, ME: maintenance error, TT: termination time, TE: tracking error).
Applsci 11 03244 g002
Figure 3. Force control capabilities of the normal, subcortical vascular mild cognitive impairment (svMCI), and subcortical vascular dementia (SVaD) groups (letters indicate statistical differences at α = 0.05). (a) Initiation time; (b) development time; (c) maintenance error; (d) termination time; (e) tracking error.
Applsci 11 03244 g003aApplsci 11 03244 g003bApplsci 11 03244 g003c
Figure 4. Percentages of patients outside the 99% confidence intervals of the force control capabilities of the normal group (IT: initiation time, DT: development time, ME: maintenance error, TT: termination time, TE: tracking error).
Applsci 11 03244 g004
Table 1. Participant characteristics.
GroupGenderAge
MaleFemalePercentage of MaleMeanSD
Normal4833%71.67.3
svMCI6555%74.55.6
SVaD5839%75.84.7
Publisher’s Note: MDPI stays neutral with regard to jurisdictional claims in published maps and institutional affiliations.

