Article

Thermodynamic Analysis of Compressed Air Energy Storage (CAES) Reservoirs in Abandoned Mines Using Different Sealing Layers

by
Laura Álvarez de Prado
1,
Javier Menéndez
2,*,
Antonio Bernardo-Sánchez
1,
Mónica Galdo
3,
Jorge Loredo
4 and
Jesús Manuel Fernández-Oro
3
1
Department of Mining Technology, Topography and Structures, University of León, 24071 León, Spain
2
Mining Department, SADIM Engineering, Avda. Galicia, 44, 33005 Oviedo, Spain
3
Energy Department, University of Oviedo, 33271 Gijón, Spain
4
Mining Exploitation Department, University of Oviedo, 33004 Oviedo, Spain
*
Author to whom correspondence should be addressed.
Appl. Sci. 2021, 11(6), 2573; https://doi.org/10.3390/app11062573
Submission received: 16 February 2021 / Revised: 7 March 2021 / Accepted: 11 March 2021 / Published: 13 March 2021
(This article belongs to the Special Issue Advances in Underground Energy Storage for Renewable Energy Sources)

Abstract

:
Million cubic meters from abandoned mines worldwide could be used as subsurface reservoirs for large scale energy storage systems, such as adiabatic compressed air energy storage (A-CAES). In this paper, analytical and three-dimensional CFD numerical models have been conducted to analyze the thermodynamic performance of the A-CAES reservoirs in abandoned mines during air charging and discharging processes. Unlike other research works, in which the heat transfer coefficient is considered constant during the operation time, in the present investigation a correlation based on both unsteady Reynolds and Rayleigh numbers is employed for the heat transfer coefficient in this type of application. A tunnel with a 35 cm thick concrete lining, 200 m3 of useful volume and typical operating pressures from 5 to 8 MPa were considered. Fiber-reinforced plastic (FRP) and steel were employed as sealing layers in the simulations around the fluid. Finally, the model also considers a 2.5 m thick sandstone rock mass around the concrete lining. The results obtained show significant heat flux between the pressurized air and the sealing layer and between the sealing layer and concrete lining. However, no temperature fluctuation was observed in the rock mass. The air temperature fluctuations are reduced when steel sealing layer is employed. The thermal energy balance through the sealing layer for 30 cycles, considering air mass flow rates of 0.22 kg s−1 (charge) and −0.45 kg s−1 (discharge), reached 1056 and 907 kWh for FRP and steel, respectively. In general, good agreements between analytical and numerical simulations were obtained.

1. Introduction

Large scale energy storage systems are required to facilitate the penetration of variable renewable energies in the electricity grids [1,2,3,4]. Underground space from abandoned mines can be used as underground reservoirs for underground pumped storage hydropower (UPSH) and compressed air energy storage (CAES) systems [5,6,7,8,9,10,11]. Pumped storage hydropower (PSH) is the most mature large-scale energy storage technology, and the round trip efficiency is typically in the range of 70–80% [12,13]. Diabatic CAES (D-CAES) is an alternative to PSH that requires lower capital costs and the round trip energy efficiency is around 40–50% [14]. D-CAES systems use natural gas to heat the compressed air in the decompression period. However, Adiabatic CAES (A-CAES) allows the storage of the thermal energy during the air compression period, avoiding the consumption of natural gas, therefore increasing the round trip energy efficiency up to 70–75% [15,16,17].
During the operation of A-CAES plants, the air is stored in the underground reservoir at high pressures during the charge period. Then, in the discharge period, the pressurized air is released, heated (stored heat), and expanded to generate electricity as the pressure within the reservoir is reduced. During the storage period, between charging and discharging, the air pressure and temperature vary depending on the storage time. The amount of stored energy depends on the reservoir volume and the thermodynamic conditions. The air temperature variations depend on the thermal conductivity of the sealing layer, concrete lining and rock mass. Therefore, the air temperature and pressure fluctuations are essential to design the reservoir volume, to select the appropriate compressor and turbines and to ensure safe operating conditions. Kushnir et al. [18] developed a study to determine the temperature and pressure variations within compressed air energy storage caverns and showed that the heat transfer reduces the temperature and pressure variations during the compression and decompression periods, leading to a higher storage capacity. Thermodynamic models were performed to determine temperature and pressure variations within adiabatic caverns of compressed air energy storage plants [19]. The results showed that the storage volume is highly dependent on the air maximum to minimum pressure ratio. Safaei and Aziz [20] carried out a thermodynamic analysis of three compressed air energy storage systems. They concluded that A-CAES with physical heat storage is the most efficient option with an exergy efficiency of 69.5%.
A pilot-scale demonstration of A-CAES was built in Switzerland [21,22]. The cavern was 120 m long and 4.9 m in diameter with a usable volume of 1942 m3. A packed-bed of rocks for thermal energy storage was located inside the cavern. Charging temperatures of 550 °C and air pressures between 0 and 0.7 MPa were employed in the test and constant heat transfer coefficients of 5 and 10 W m−2 K−1 were considered in the simulations. The estimated round trip efficiency of the pilot plant reached 63–74%. Schmidt et al. [23] analyzed the effect of the cyclic loading on the geomechanical performance of CAES systems for lined and unlined tunnels in closed mines. The cycling loading operation was simulated for 10,000 cycles considering an operating pressure within the reservoir from 4.5 to 7.5 MPa. They observed moderate deformations and small thickness of plastic zones, while an increase of the initial volume of less than 0.5% was reached.
Jiang et al. [24] carried out experimental and numerical investigations of a lined rock cavern to analyze the thermodynamic process within the underground cavern. The volume of the cavern was 28.8 m3 with 5 m length and 2.9 m in diameter. A 2 cm thick RFP was employed as sealing layer around the compressed air. The air pressure reached 6 MPa at constant mass flow rate (0.12 kg s−1). Zhou et al. [25] developed a numerical simulation for the coupled thermo-mechanical performance of a lined rock cavern for CAES systems. An air pressure range from 4.5 to 6.9 MPa was considered for 100 cycles with a thickness of concrete lining of 0 and 0.1 m. They concluded that significant air temperature fluctuation was observed in sealing layer and concrete lining and no fluctuation occurred in the rock mass. An analytical study was proposed to estimate the geomechanical performance caused by air temperature and pressure variations in CAES systems [26]. Khaledy et al. [27] studied the thermo-mechanical responses of CAES systems in rock salt caverns. They concluded that the stability of the salt cavern is affected by the internal operating conditions with the air temperature increasing the volume convergence. Li et al. [28] carried out a failure study for gas storage by thermo-mechanical modelling in salt caverns. The results showed an affected area by the air and temperature operating conditions up to 10 m in the rock mass from the cavern walls. Round trip efficiencies between 70.5 and 75.1% were estimated by Barbour et al. [29] in A-CAES systems for continuous operation with packed bed thermal energy storage. The thermodynamic and geomechanical performance was studied by Rutqvist et al. [30] in lined rock caverns. They found that 97% of the thermal energy injected in the charge period could be recovered in the discharge period. Deng et al. [31] designed a new CAES systems with constant gas pressure and temperature in closed coal mines. A power output of 18 MW and a generating time of 1.76 h were obtained for a mine tunnel with 10,000 m3 of volume at 500 m depth. The ADELE project was studied in Germany to install an A-CAES plant with a storage capacity of 360 MWh and output power of 90 MW [2].
In this paper, abandoned mines are proposed as underground reservoirs for large scale energy storage systems. A 200 m3 tunnel in an abandoned coal mine was investigated as compressed air reservoir for A-CAES plants, where the ambient air is stored at high pressure. The thermodynamic response of A-CAES reservoirs was analyzed considering three solids around the pressurized air: a 20 mm thick sealing layer, a 35 cm thick concrete lining, and a 2.5 m thick sandstone rock mass. One-dimensional analytical and three-dimensional CFD numerical models were conducted considering fiber-reinforced plastic (FRP) and steel as sealing layers and a typical operational pressure from 5 to 8 MPa. In the analytical model, air mass flow rates of 0.22 and −0.45 kg s−1 have been considered for 30 cycles of compression and decompression, respectively. To reduce the computational time, the numerical simulation has been conducted for five cycles with air mass flow rates of 50 and −75 kg s−1. The air temperature and pressure fluctuations were estimated in the simulations. The temperature and the heat flux were also analyzed on the contact surfaces of the solids considering both FRP and steel sealing layers and the heat convection from the air to the sealing layers was calculated. Finally, the energy balance through the sealing layer was obtained during air charging and discharging.

2. Materials and Methods

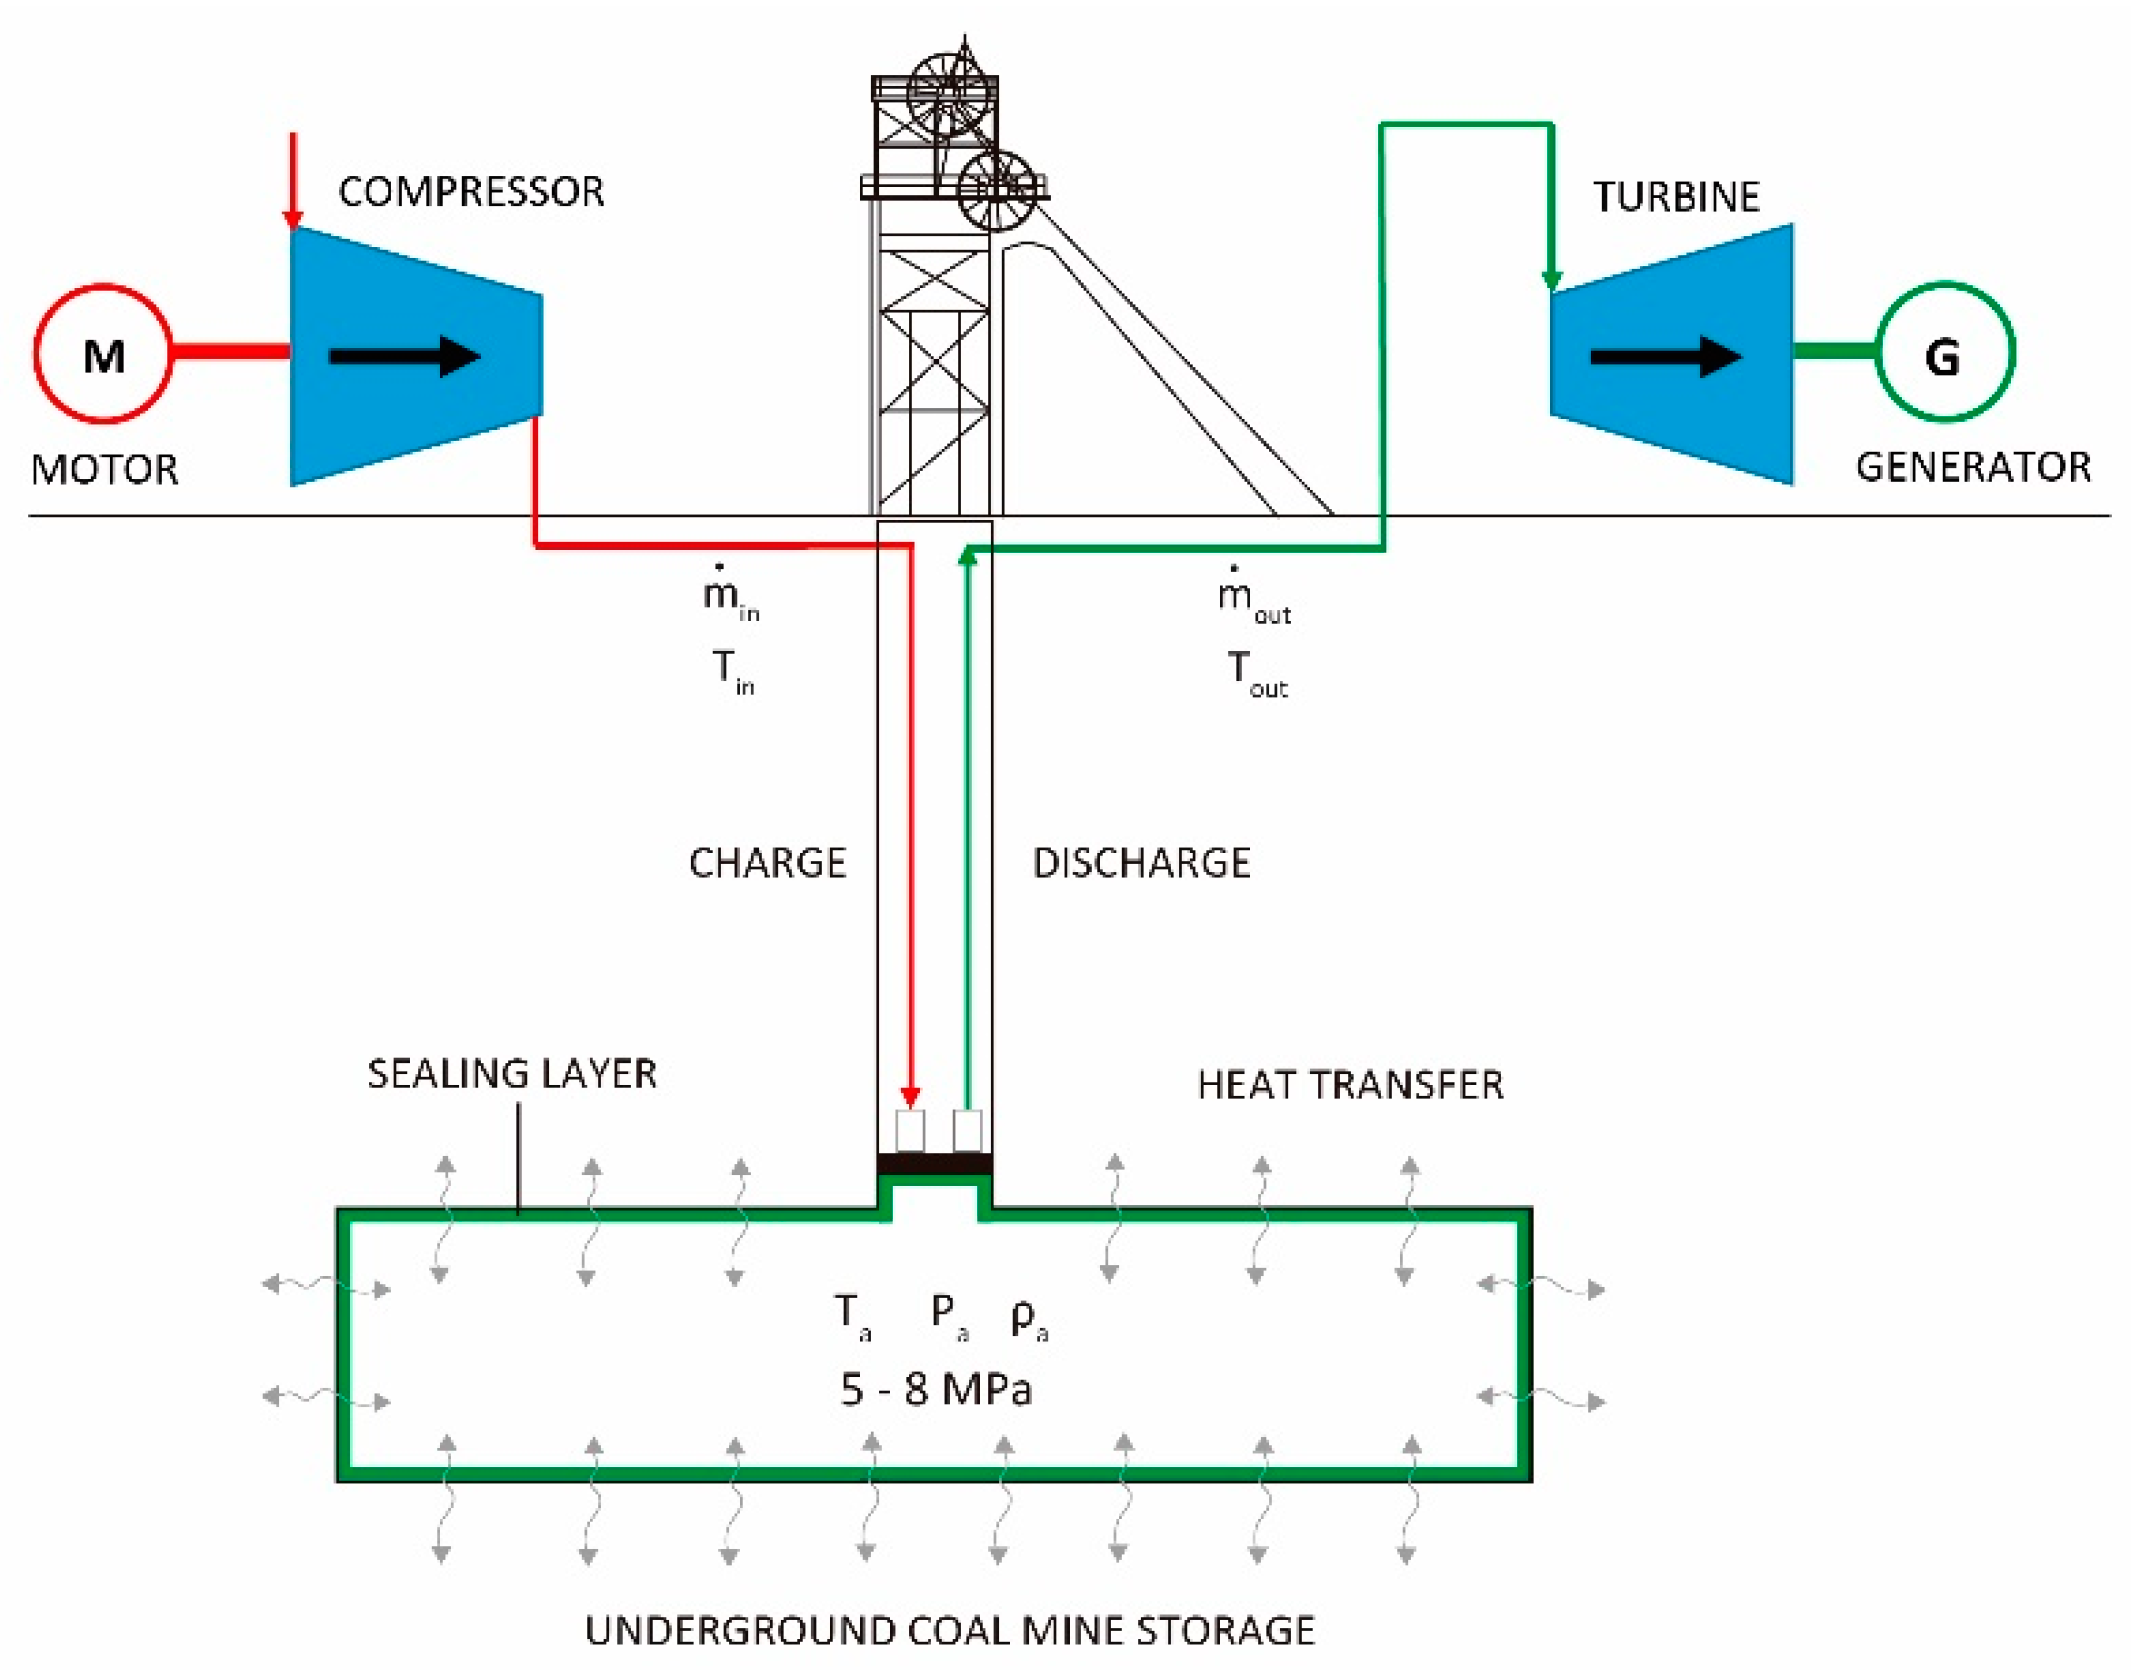
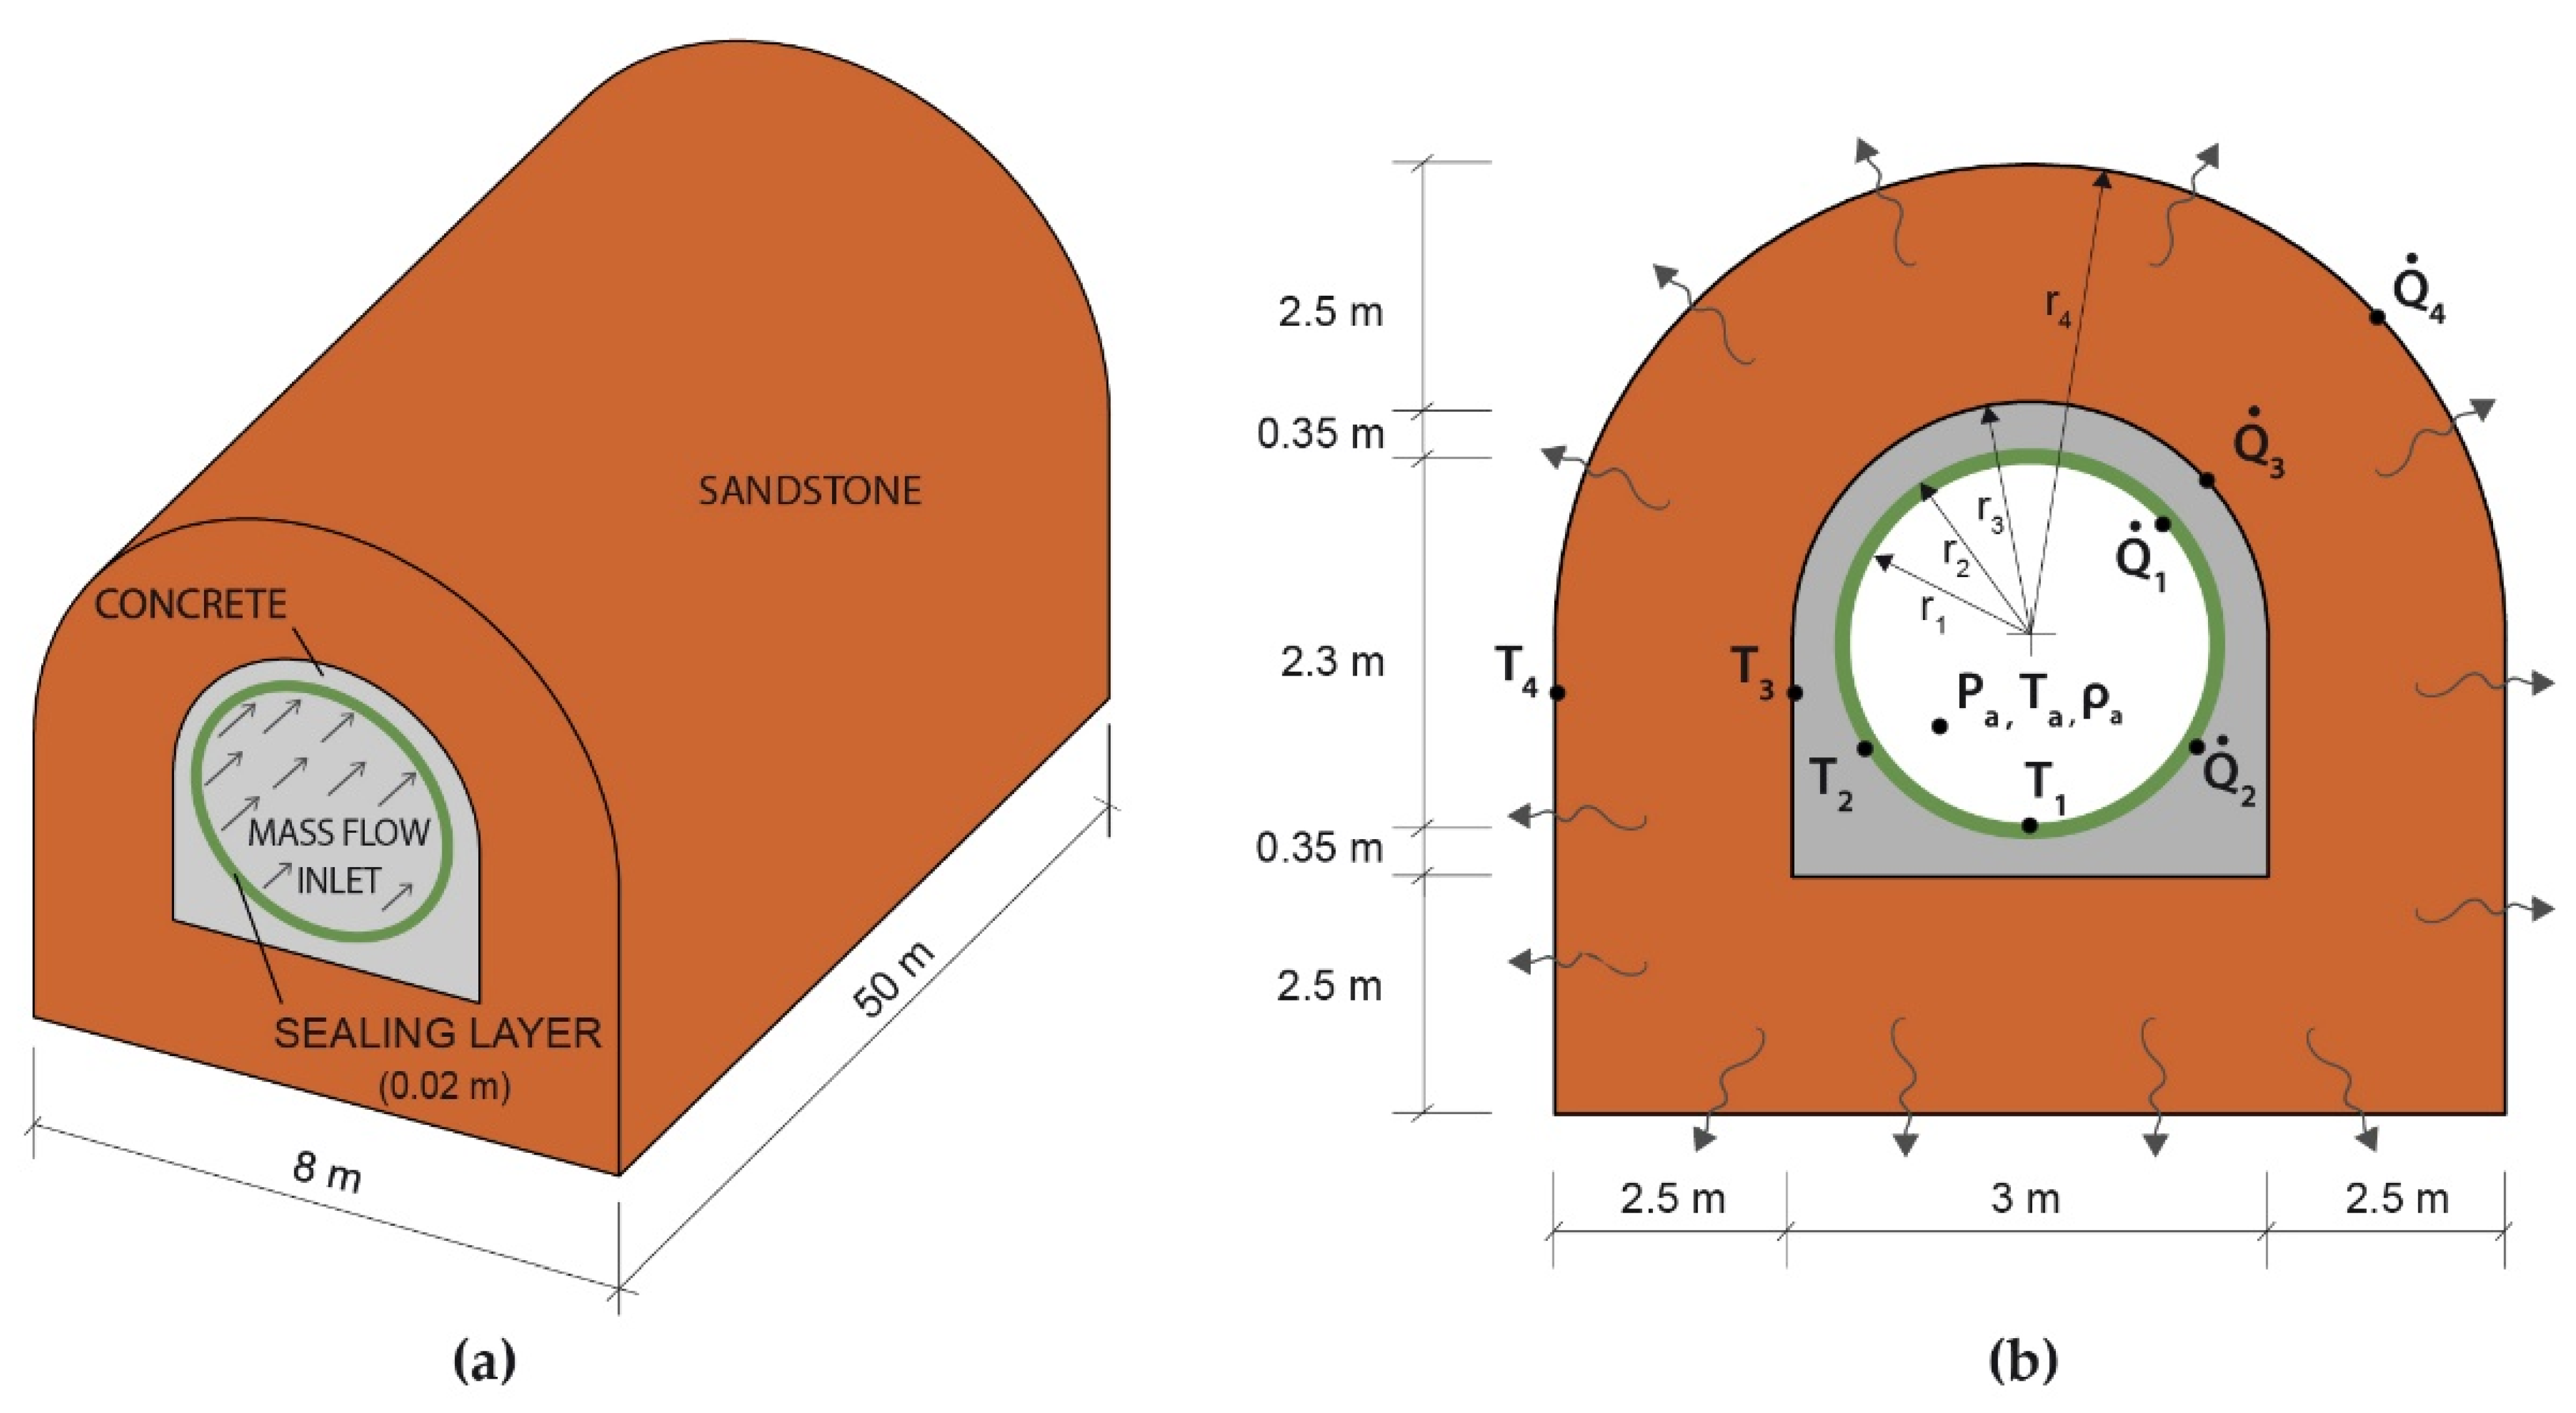
2.1. Problem Statement

Underground space in abandoned mines may be used as compressed air storage systems for CAES plants. The simplified schematic diagram of the CAES system is shown in Figure 1. The compressor and turbine facilities are installed above the ground, while the compressed air reservoir is underground. The ambient air is compressed during off-peak periods and stored at high pressure in the underground reservoir (charge period). Then, when the electricity is required, the compressed air is released, heated, and expanded during peak hours in conventional gas turbines, driving a generator for power production (discharge period). The charge and discharge processes are carried out with a typical operating pressure range from 5 to 8 MPa. To reduce air leakage, two different sealing layers, FRP, and steel, have been employed in the present study. The air temperature and pressure fluctuations are estimated for both FRP and steel sealing layers.

2.2. Analytical Model

A one-dimensional analytical model has been developed in MATLAB to study the thermodynamic performance during the operation time of the CAES system in a closed mine. Figure 2 shows the scheme of the 50 m long model. A lined tunnel with a usable volume of 200 m3 and a cross section of 8 m2 has been considered. A 20 mm thick sealing layer, a 35 cm thick concrete lining and a 2.5 m thick sandstone rock mass have also been considered in the model around the fluid. The evolution of the temperature (Ta), density (ρa) and air pressure (Pa) over time has been analyzed considering different air mass flow rates (). The heat flux through the contact surfaces, i.e., air-sealing layer ( Q ˙ 1 ) , sealing layer-concrete ( Q ˙ 2 ) , and concrete-sandstone ( Q ˙ 3 ) , has been estimated. Finally, the temperature on the sealing layer wall (T1), concrete wall (T2), and sandstone wall (T3) have also been estimated during the operation time considering an external temperature (T4) of 300 K.
The energy equation has been applied following Equation (1), where Q ˙ is the net heat transfer, W ˙ is the net work done, e is the specific energy, ρ is the density in kg m−3, V is the reservoir volume, v is the air velocity and S is the cross section of the tunnel. In the air domain, the first term of Equation (2) represents the heat convection from the air to the sealing layer, which depends on the film coefficient of heat transfer (h), in Wm−2 K−1, the sealing layer surface in contact with the fluid (A1) and the temperature difference between the air and the concrete wall (Ta-T1). The second term of Equation (2) corresponds to the energy variation within the reservoir where the air pressure increases, which depends on the air mass inside the reservoir (m), the specific heat at constant volume (Cv) and the air temperature (Ta). Finally, the third term represents the input and output of energy in the control volume due to the energy provided by the air jet in the form of heat (T0) and kinetic energy. The air mass inside the reservoir at an instant of time, t, depends on the initial air mass (m0) and the air mass flow rate (), and is obtained by applying Equation (3).
Q ˙ W ˙ = t ρ e   d V + ρ e   ^ ( v ^ d S )
h A 1 ( T a T 1 ) = d d t ( m C v T a ) m ˙ ( C v T 0 + R T 0 + v 2 2 )
m = m 0 + m ˙   t
After some algebra, the air temperature (Ta) is calculated by applying Equation (4). The air temperature and density increase as the air pressure increases in the reservoir, and therefore the wall temperature increases by heat convection.
d T a d t = m ˙ m [ C p C v T 0 + 1 2 C v ( m ˙ m L ) 2 T a ] h 2 π r 1 L C v m ( T a T 1 )
The temperatures on the sealing layer wall (T1), the concrete wall (T2) and sandstone wall (T3) are obtained applying the equations of non-stationary heat transfer in sealing layer, concrete and sandstone domains (solid regions) considering an external temperature (T4) of 300 K and a temperature of the air mass flow inlet (T0) of 310 K. The heat flux reaches the sealing layer by convection. A part of this heat is transmitted to the concrete by conduction while another part increases the temperature of the sealing layer. A similar mechanism takes place for the concrete lining. Equations (5)–(7) represent the heat transmission on the sealing layer, concrete and sandstone formation, respectively.
d T 1 d t = 2 U h m s C p s ( T a T 1 ) 2 U s m s C p s ( T 1 T 2 ) d T 2 d t
d T 2 d t = 2 U s m c C p c ( T 1 T 2 ) 2 U c m c C p c ( T 2 T 3 )
d T 3 d t = 2 U c m s s C p s s ( T 2 T 3 ) 2 U s s m s s C p s s ( T 3 T 4 )
where Uh, Us, Uc, and Uss are the convection transmittance, sealing layer transmittance, concrete transmittance, and sandstone transmittance, respectively. These thermal coefficients are evaluated according to
U h = h 2 π r 1 L
U s = 2 π K s L L n ( r 2 r 1 )
U c = 2 π K c L L n ( r 3 r 2 )
U s s = 2 π K s s L L n ( r 4 r 3 )
In these expressions, h is the film coefficient of heat transfer, in Wm−2 K−1; L is the tunnel length, in m; Ks, Kc and Kss are the thermal conductivity of sealing layer, concrete and sandstone, in Wm−1 K−1; Cps, Cpc, and Cpss are the specific heat at constant pressure for the sealing layer, reinforced concrete and sandstone, in J kg−1 K−1; and r1, r2, r3, and r4 are the (equivalent) radius of sealing layer, concrete, sandstone and external walls, in m (Figure 2b). Note that due to the geometrical characteristics of the tunnel, the heat transfer formulation in cylindrical coordinates has been used for Equations (8)–(11).
For the evaluation of the convection film coefficient, the correlation proposed by Woodfield et al. [32] and Heath et al. [33] for the measurement of heat transfer coefficients in high-pressure vessels during gas charging was considered. In particular, a mixed (natural and forced) convection is modelled as a combination of both unsteady Reynolds and Rayleigh numbers. For the present investigation, a slight correction has been introduced for the exponent of the Rayleigh number, resulting the Nusselt number in the following expression:
N u = 0.56   R e 0.67 + 0.104   R a 0.34
where Re is defined as the Reynolds number of the incoming mass flow rate ( R e = 4 m ˙ / 2 μ π r 1 ) and Ra is computed from the instantaneous thermal properties of the air ( R a = g β ( T a T 1 ) C p ρ 2 L 3 / ( μ K ) ), being g the gravity acceleration, β is the volumetric thermal expansion coefficient, Cp the specific heat coefficient at constant pressure, ρ the density, L the tunnel length, μ the dynamic viscosity and K the thermal conductivity. The film coefficient is thus computed as
h = N u K L
Finally, a backward Euler explicit discretization has been employed over Equations (3)–(7) to resolve the coupled system of equations. A typical time-step of 0.01 s was applied to provide an accurate temporal description of the different temperatures. The model was resolved iteratively until a maximum prescribe pressure was reached inside the reservoir.
In addition, according to Kushnir et al. [18] and Zhou et al. [25], the air has been considered as a real gas through a compressibility factor (Z) that it is computed using the Berthelot gas state equation. Finally, considering a density value uniformly distributed in the volume, the pressure value of the CAES may be obtained at any instant by applying Equations (14) and (15).
P a = ( R V ) Z m T a
Z = 1 9 128 ( P a P c ) ( T c T ) ( 6 T c 2 T 2 1 )
where Tc and Pc the air temperature and the air pressure at critical conditions, assumed to be 132.65 K and 3.76 MPa. The contact surfaces between air-sealing layer (A1 = 2πr1L), sealing layer-concrete (A2~2πr2L), concrete-sandstone (A3~2πr3L), and sandstone-exterior (A4~2πr4L), are 359, 365, 545, and 1610 m2, respectively. Note that, in order to model a complete cycle of compression (storing energy) and expansion (releasing energy) of the CAES system, the energy balance for the air domain—Equation (4)—needs to be rewritten as a function of the discharge mass flow rate (out < 0) and the air temperature within the reservoir, according to Equation (16):
d T a d t = m ˙ o u t m [ ( C p C v 1 ) T a + 1 2 C v ( m ˙ o u t m L ) 2 ] h 2 π r 1 L C v m ( T a T 1 )
Air mass flow rates of 0.22 kg s−1 and −0.45 kg s−1 have been considered in the charge and discharge periods, respectively, for both RFP and steel sealing layers. The thermal properties and the volume of air, reinforced concrete, sandstone rock mass and sealing layers considered in the model are shown in Table 1 [24,25]. Note significant differences between the thermal conductivity of FRP and steel.

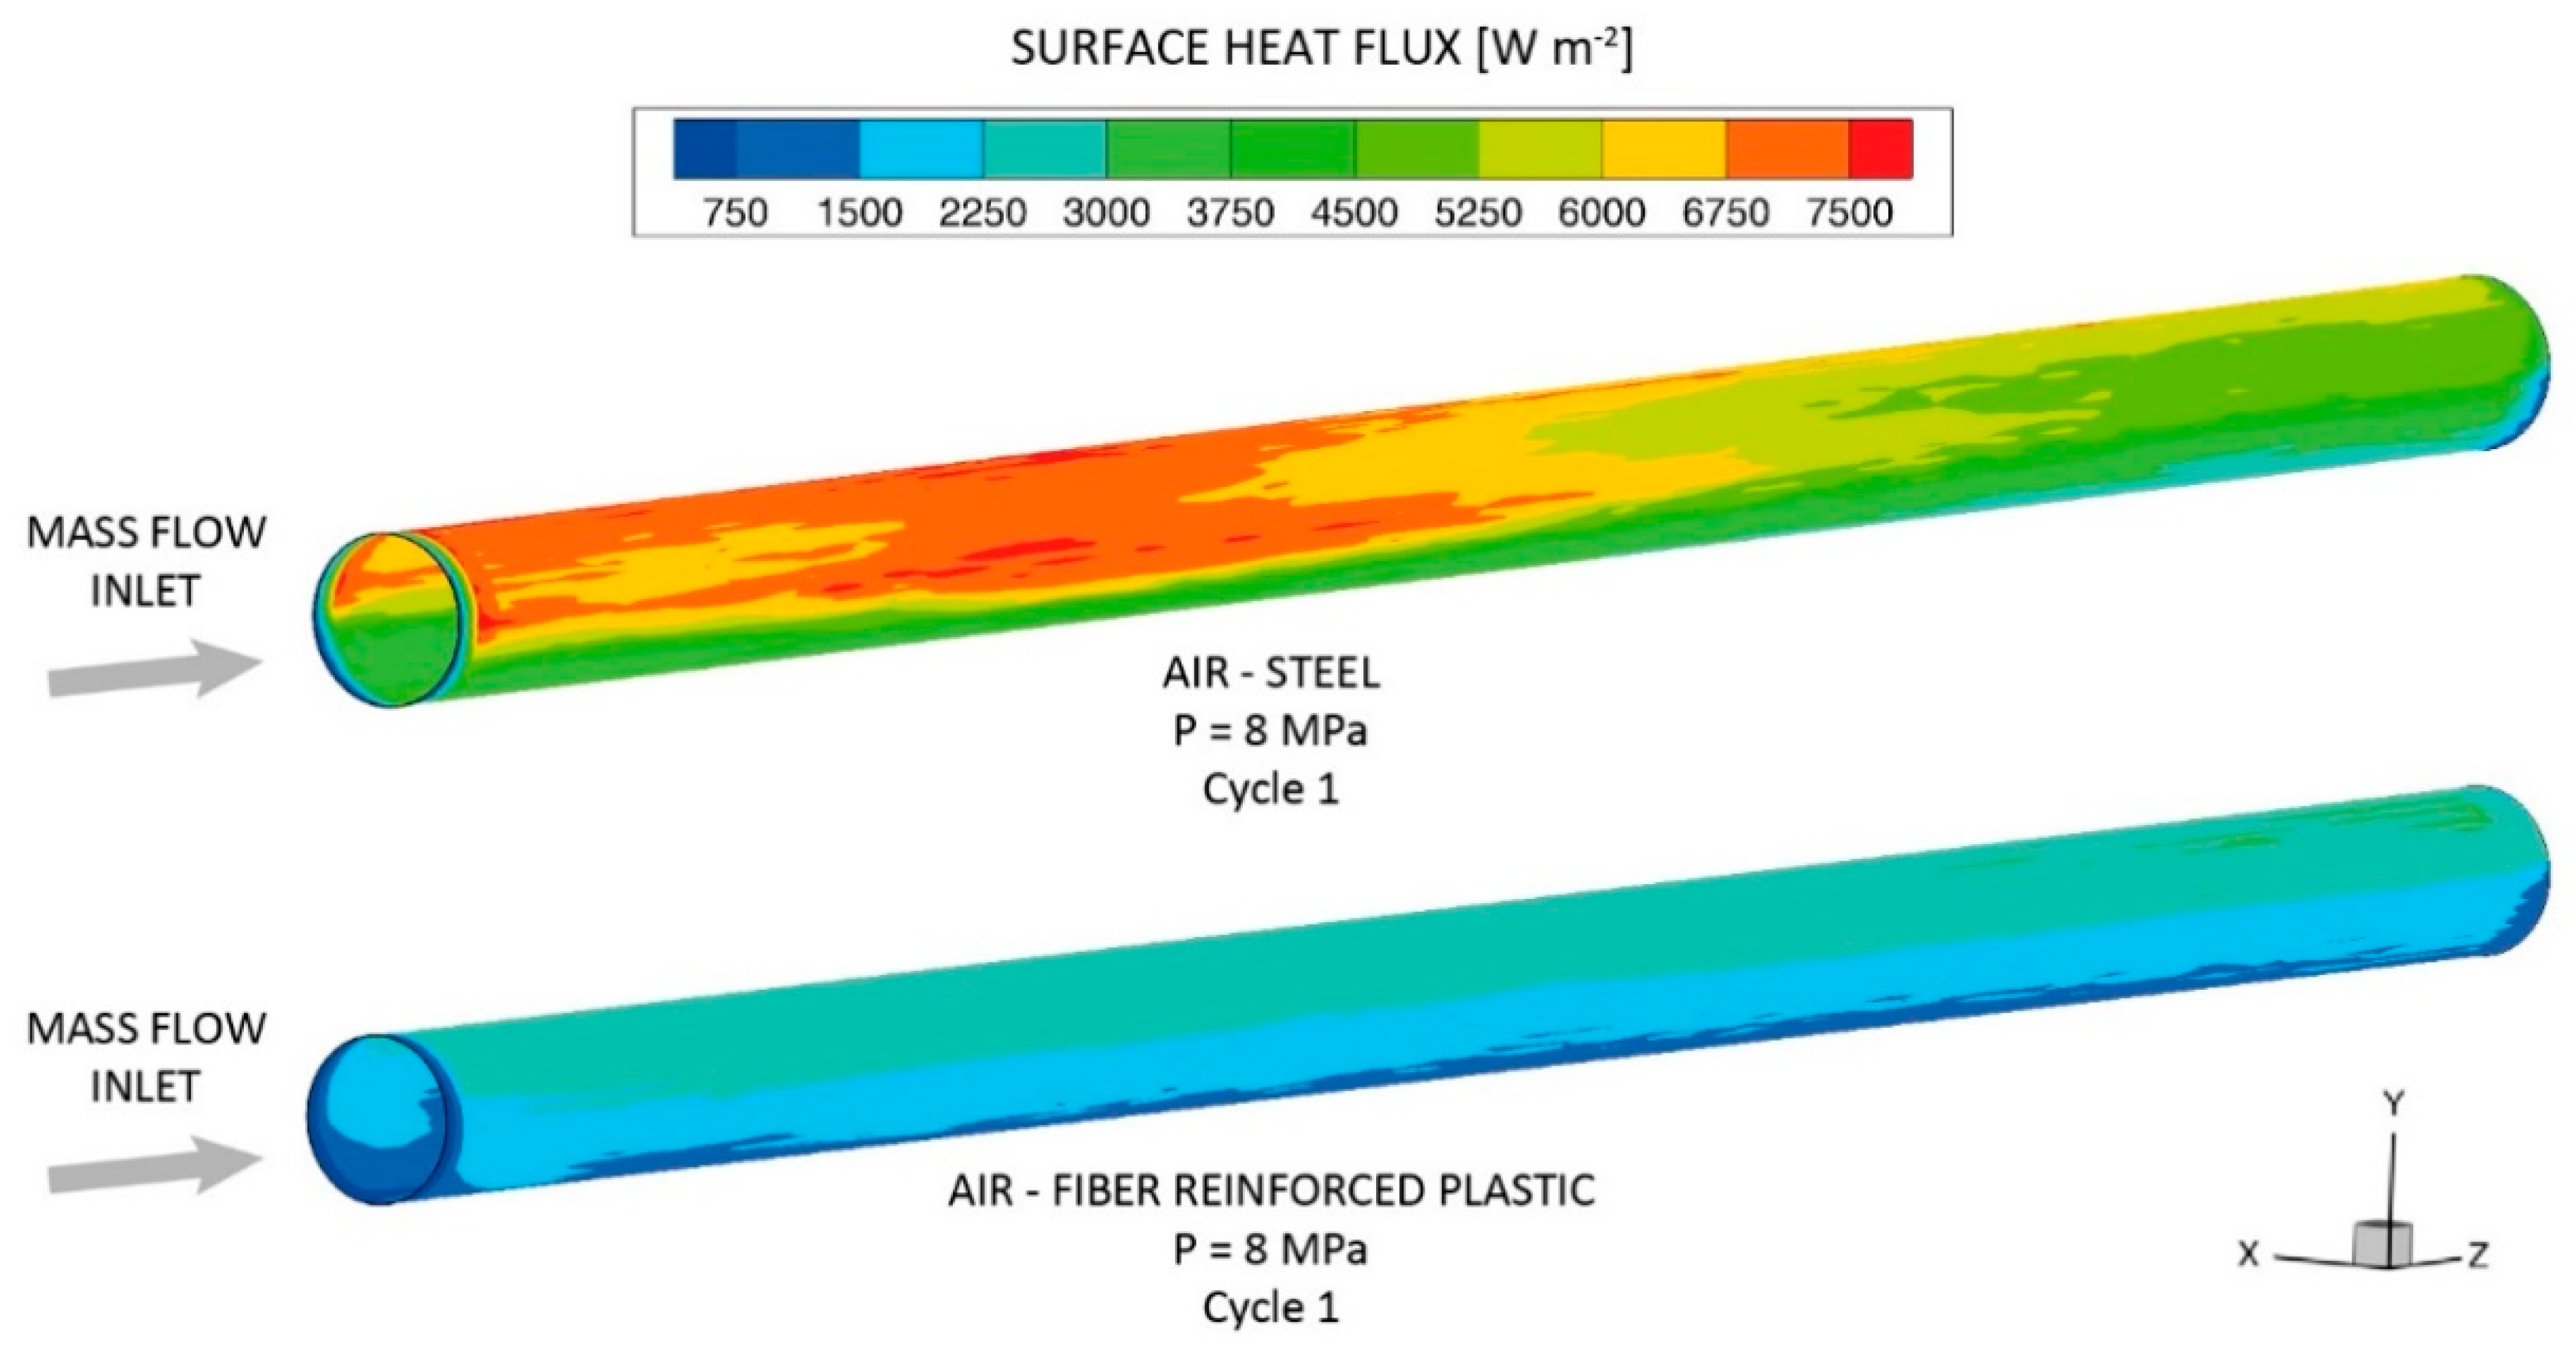
2.3. CFD Numerical Model

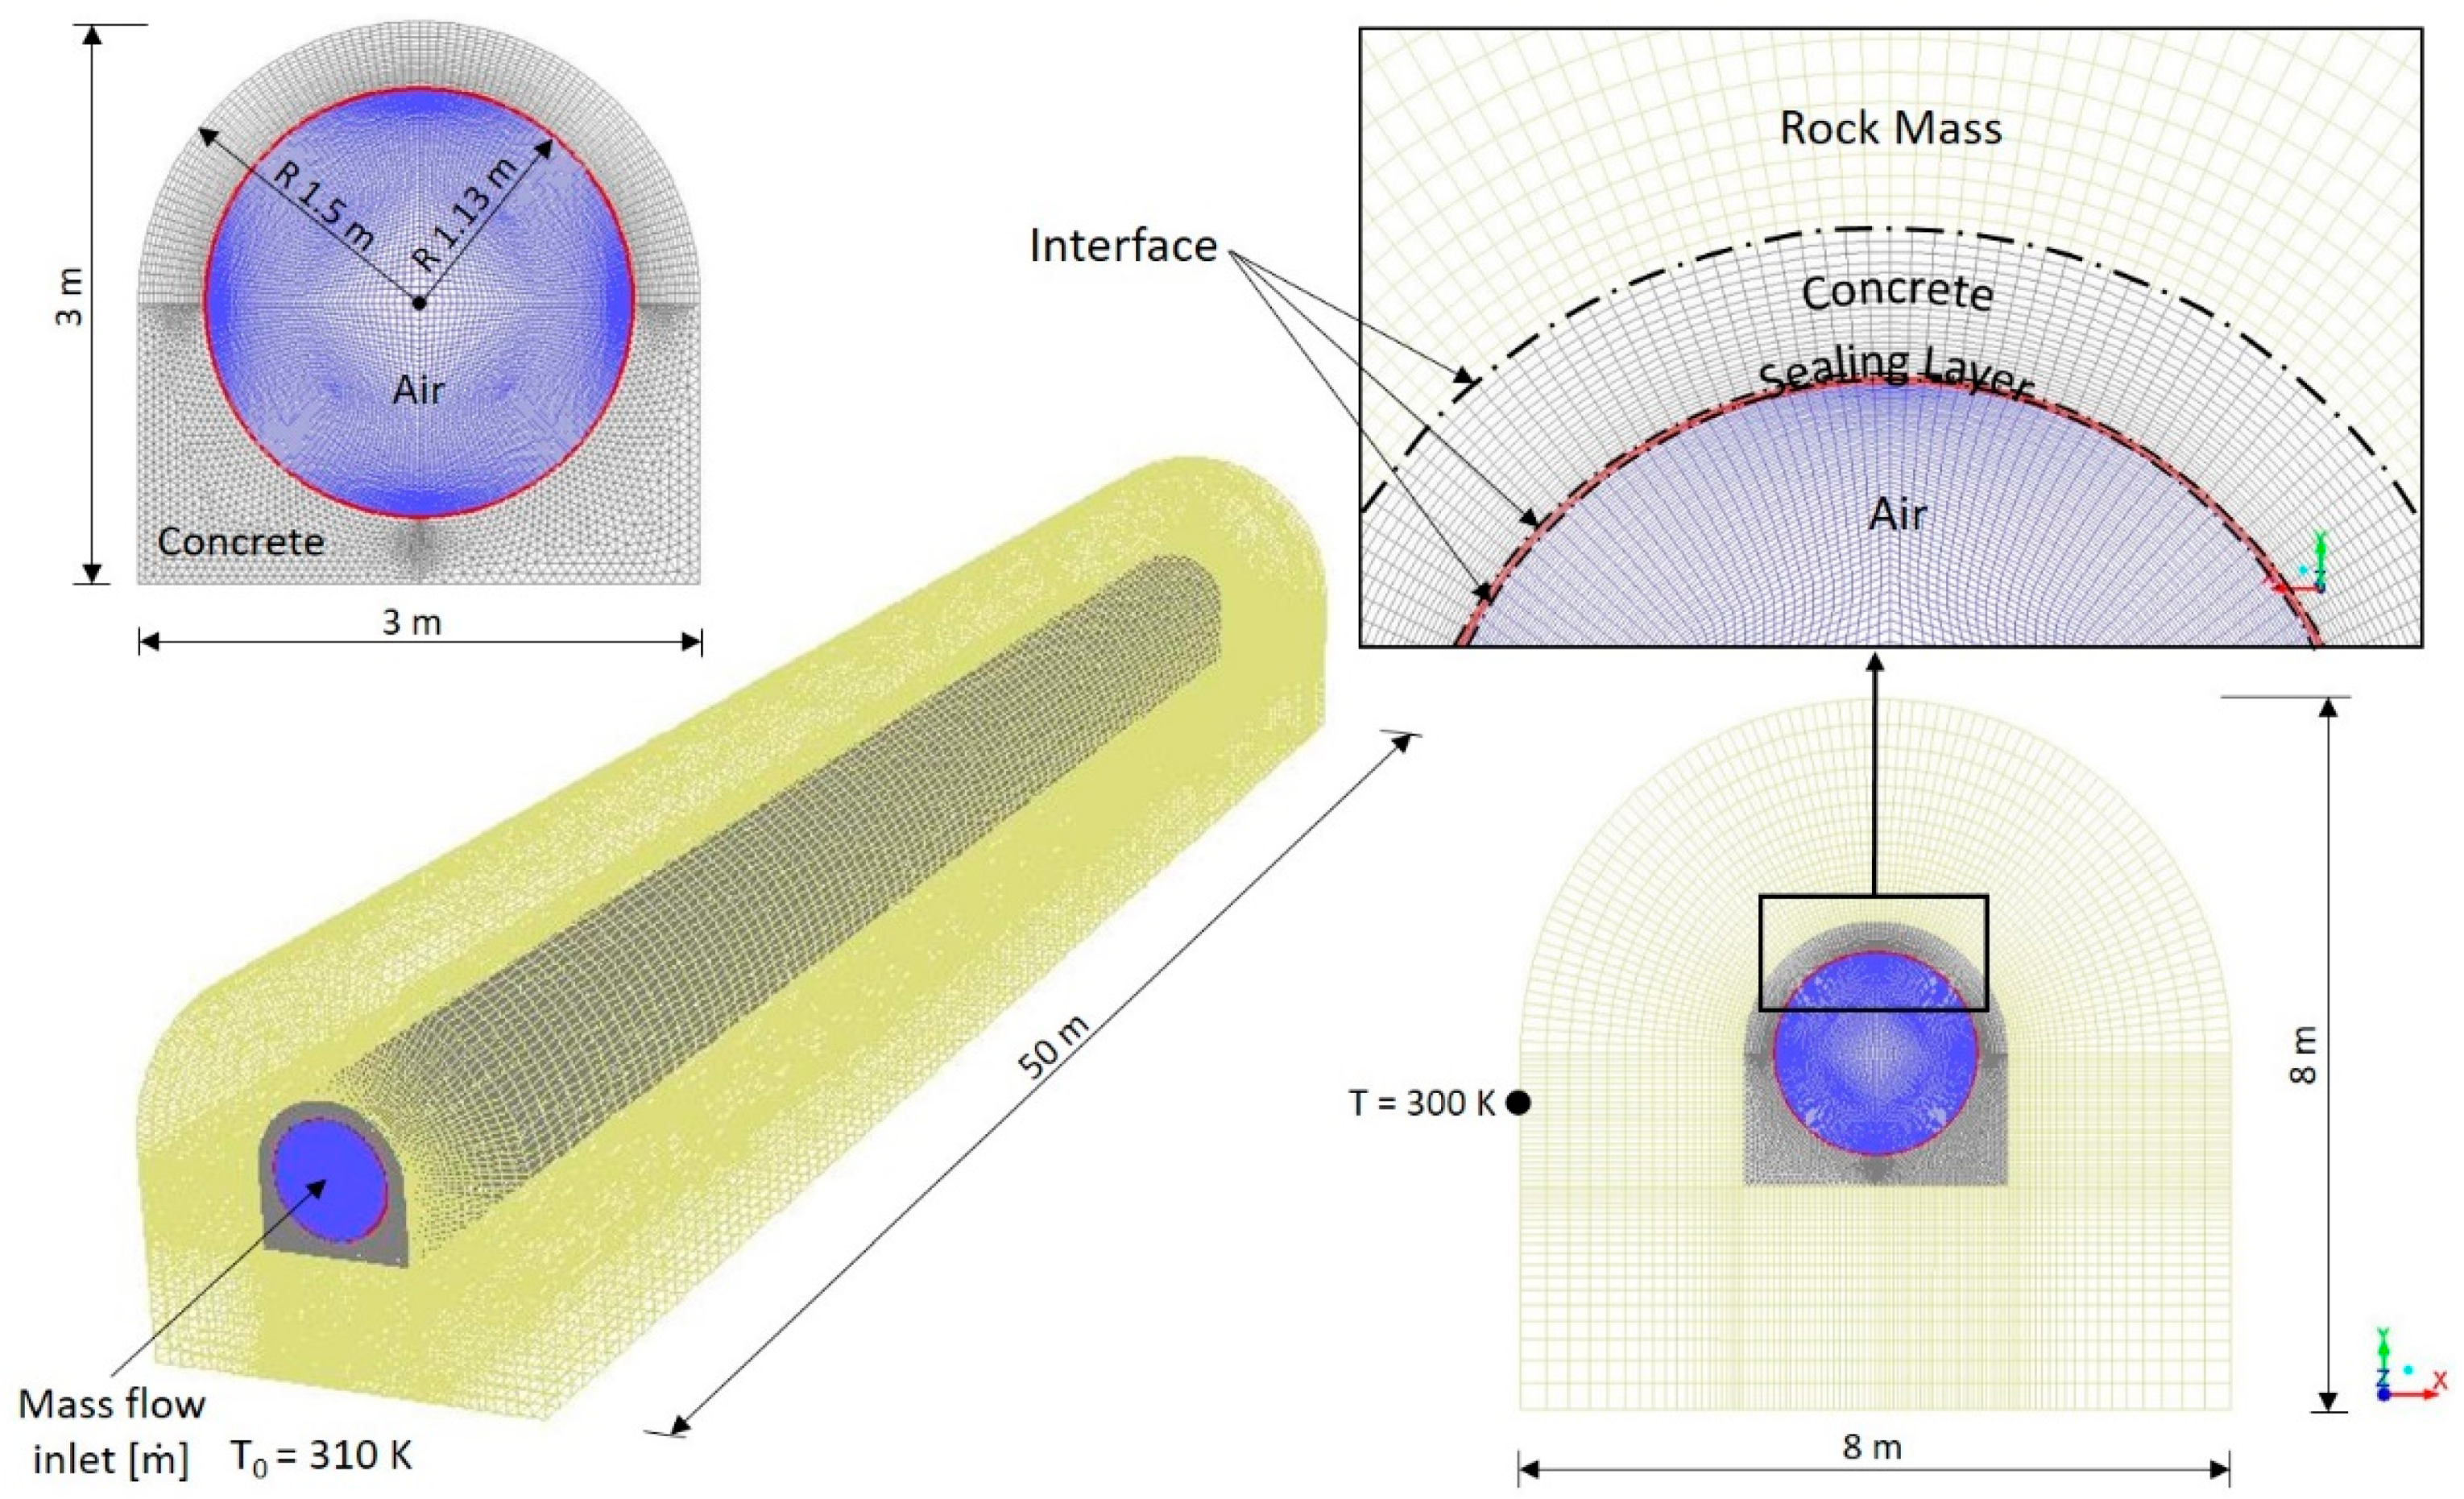
2.3.1. Model Geometry, Mesh and Boundary Conditions

A 3D numerical model of a horseshoe-shaped tunnel located inside a closed mine was conducted to simulate the compression and decompression processes (air charging and discharging) that occur in the tunnel during the operation of the CAES plant. The computational domain is a tunnel with 8 m2 of cross section and 50 m in length and includes both the fluid area and the solid areas around the fluid. The configuration of the simulated tunnel is illustrated in Figure 3. To improve the geomechanical performance, a 4 m2 circular cross-section has been designed for the compressed air (blue area in Figure 3). The tunnel is reinforced with a 35 cm thick concrete lining and is finished with a dead-end. To avoid thermal leakage, a 20 mm thick sealing layer is considered between the air and concrete lining. Two types of sealing materials are considered: FRP and steel. The external part of the model corresponds to the 2.5 m thick sandstone rock mass existing in the mine. The total cross section of the model is 57.13 m2 (8 × 8 m) and the model volume is 2587 m3. In addition, the useful volume of air reaches 200.53 m3. The entire geometry is meshed with 2,690,038 hexahedral and tetrahedral cells. Finer mesh was defined in the sealing layer, concrete and air zones, with higher grid density in those regions where the gradients of the flow characteristics are extremely important.
Four different type of materials (air, sealing layer, concrete, and sandstone) are used to simulate the heat transfer process between the air inside the mine and the surrounding media. In addition, as in the analytical model, FRP and steel are considered as sealing layers. The air is defined as real-gas to allow the simulation of the compression process. To reproduce the concrete layer existing between the sealing layer and the sandstone, a solid material zone is defined. The sandstone and sealing layer zones are also defined as solid materials. In addition, a series of thermal properties are imposed on the sandstone, concrete and sealing zones to simulate the conduction heat transfer.
The numerical simulation of the compression/expansion process was carried out with the commercial software ANSYS Fluent® 16.2. This code was used to solve the full 3-D Unsteady Reynolds-Averaged Navier–Stokes (URANS) equations for compressible flow. The coupling between velocity and pressure was resolved by the SIMPLE algorithm. The spatial and temporal derivatives of the governing equations for the fluid flow were calculated by means of a second-order discretization, and the pressure interpolation PREssure STaggering Option (PRESTO) scheme has been used. Turbulent closure was established by the RNG k–ε model together with standard wall functions. In addition, the resolution of the energy equation for both fluid and solid volumes was activated. A constant mass flow rate was imposed as an inlet boundary condition for each model and an interface condition was established for solid/solid and solid/fluid surfaces. To reduce the computational time, air mass flow rates of 50 kg s−1 and −75 kg s−1 were considered in the numerical simulations. In Section 3.3, these mass flow rates are also employed in the analytical model to carry out the comparative analysis. In addition, a constant temperature of 300 K was considered in the sandstone surface. Moreover, a no-slip shear condition was imposed on the walls. The material properties used in the numerical model have been indicated in Table 1. A fixed time step of 5 × 10⁻² s was selected for the simulations to ensure their stable convergence. The convergence criteria is based on the residual values of the solution solved in the numerical domain. A typical threshold of 10−5 was set for continuity, momentum and energy equations.

2.3.2. Mesh Sensitivity Study

A mesh sensitivity analysis has been carried out to optimize the numerical model results. Four different mesh sizes between 1.44 × 10⁶ and 3.47 × 10⁶ cells were used to simulate the air compression process from the ambient conditions to 8 MPa using FRP as sealing layer. The thermal energy balance through the sealing layer was analyzed for the first cycle of compression.
The results for the four scenarios are indicated in Table 2. Finally, a mesh model with 2.69 × 10⁶ cells was selected to simulate the air charge and discharge periods in the underground reservoir. When a model with 3.47 × 10⁶ cells is considered, an increase in the computational time of 26.72% is obtained regarding the selected mesh size.

3. Results and Discussion

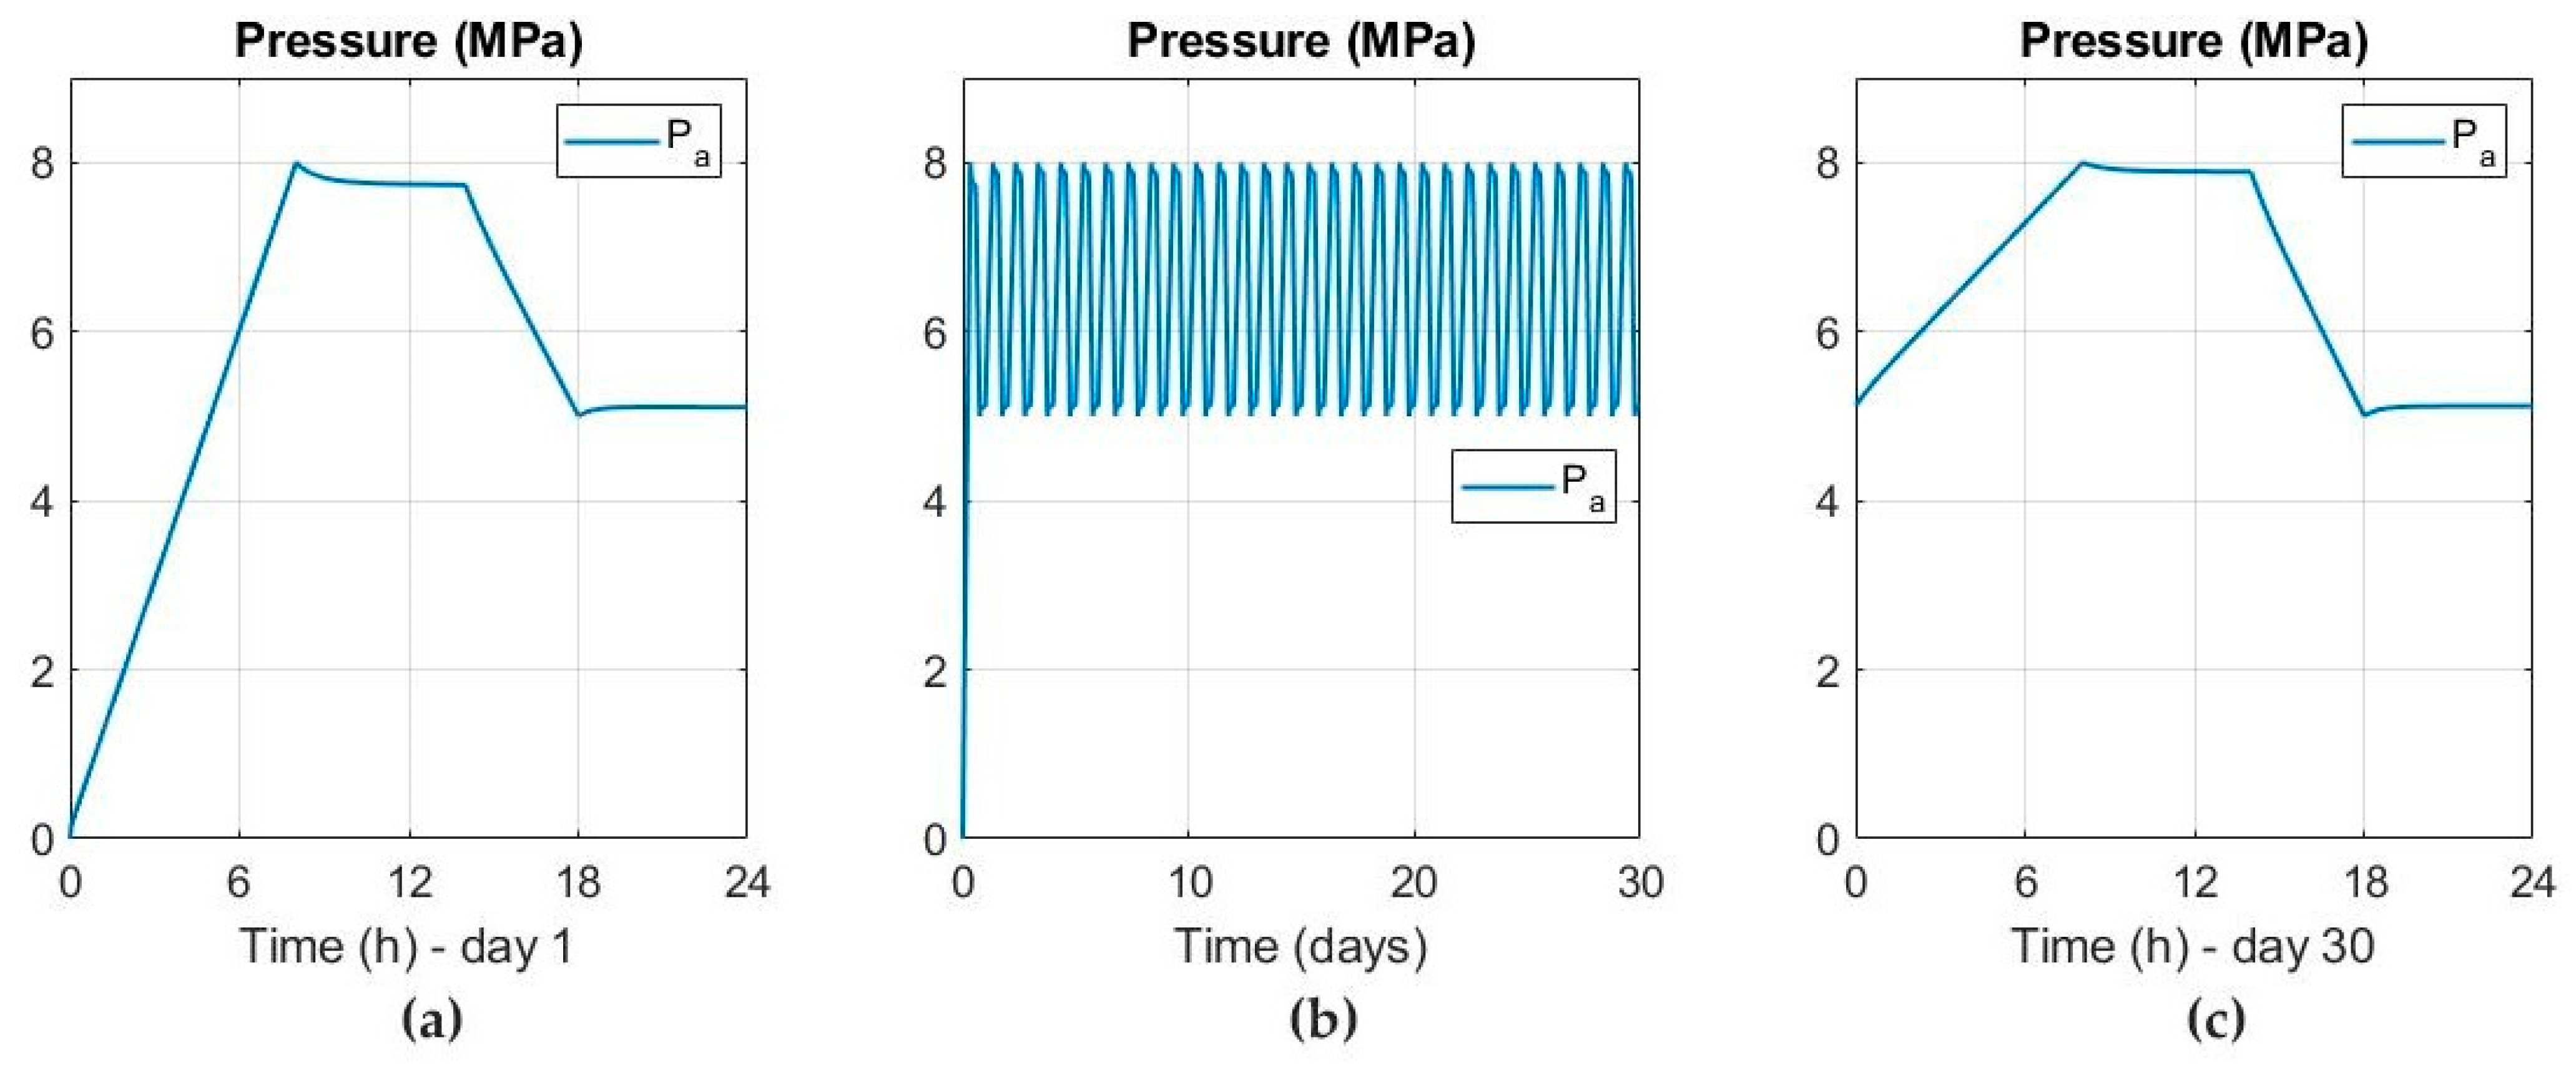
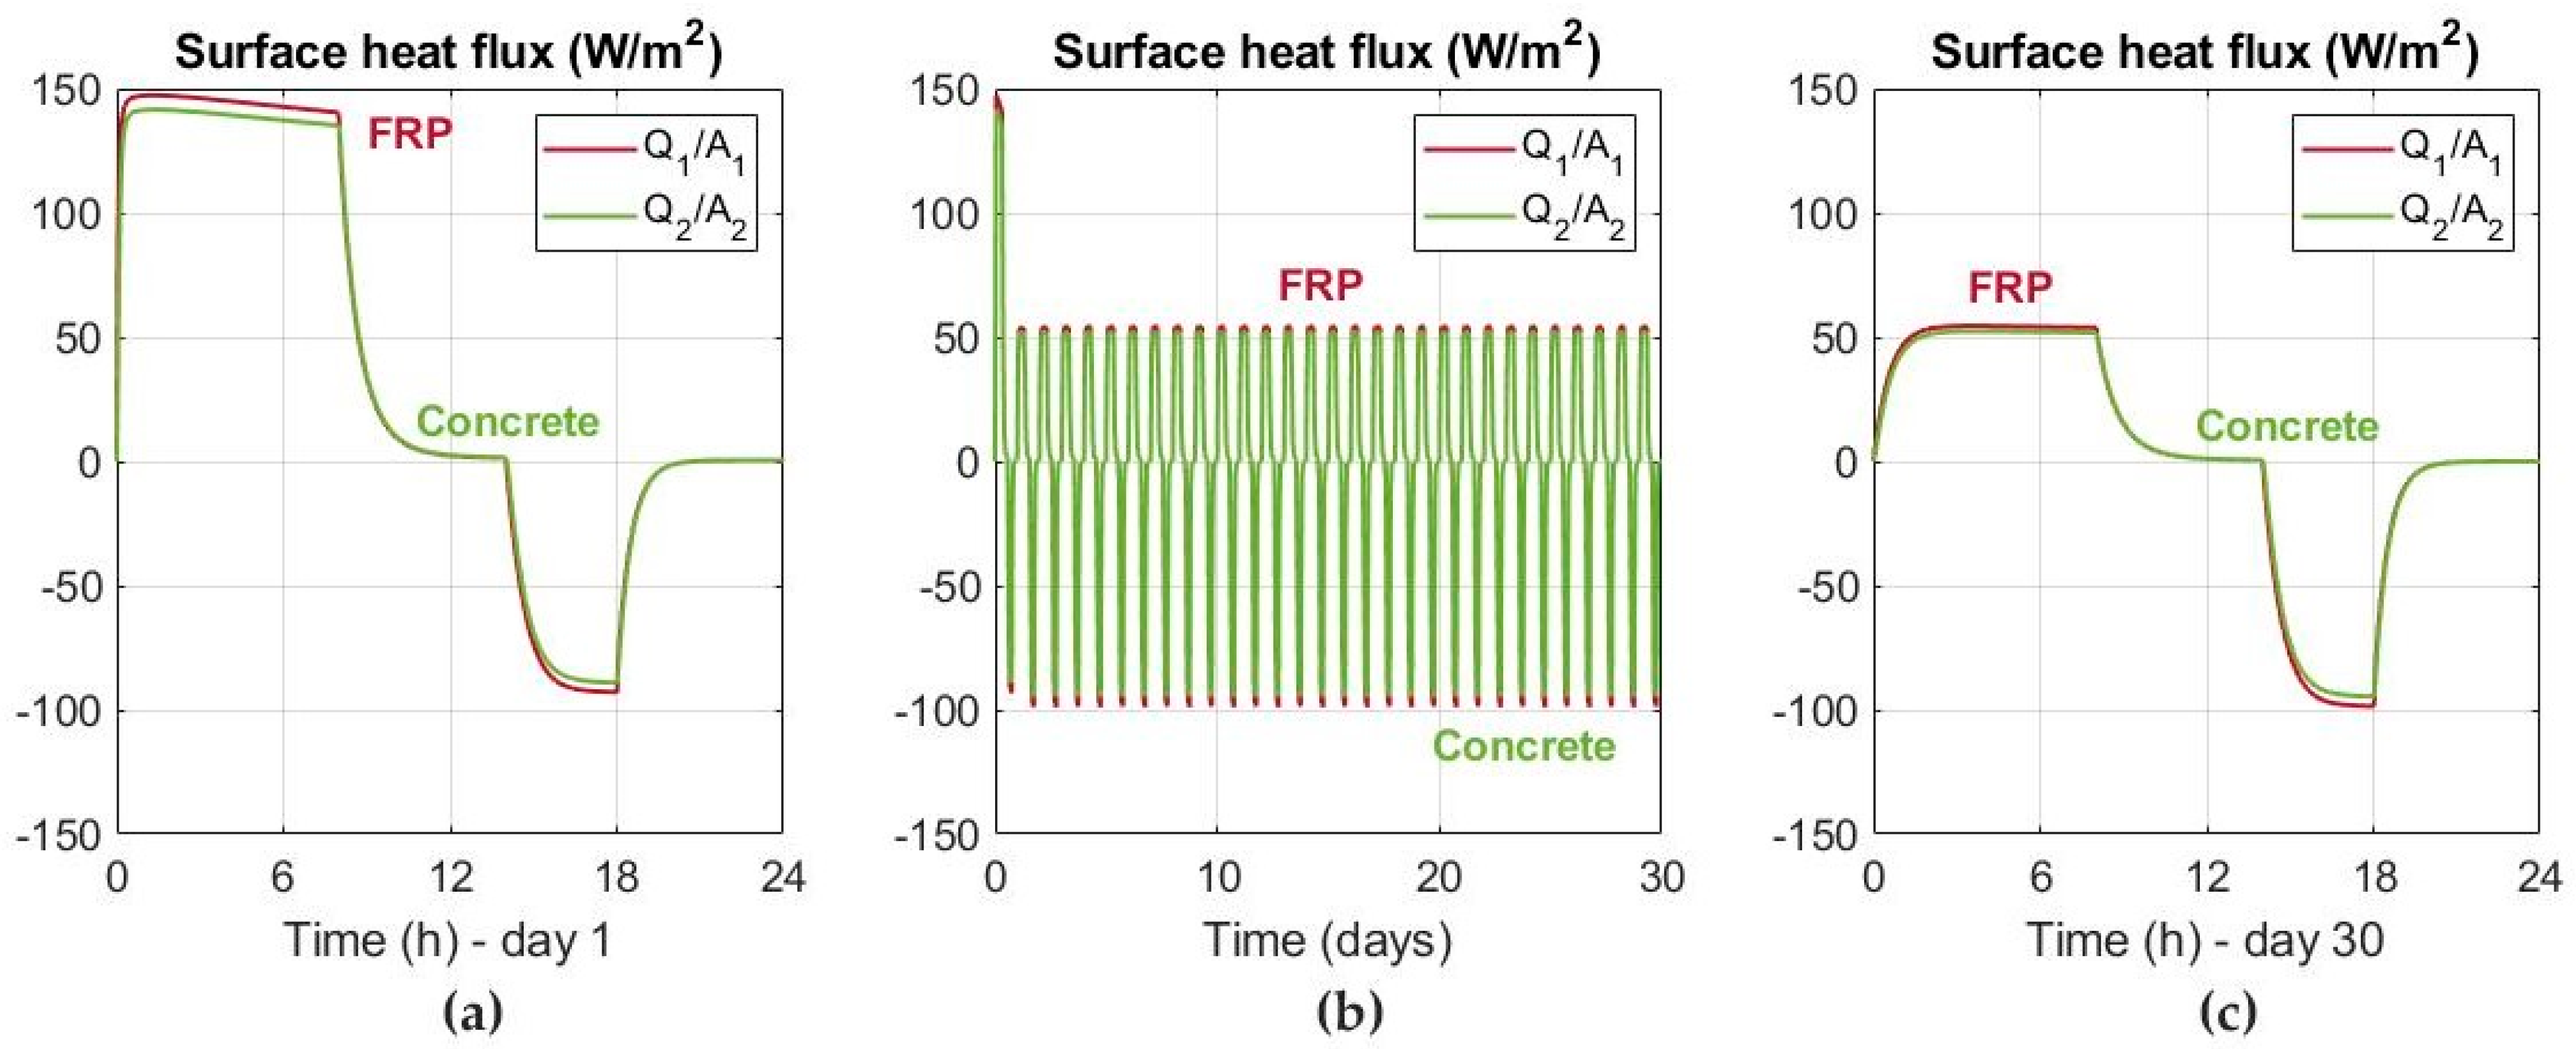
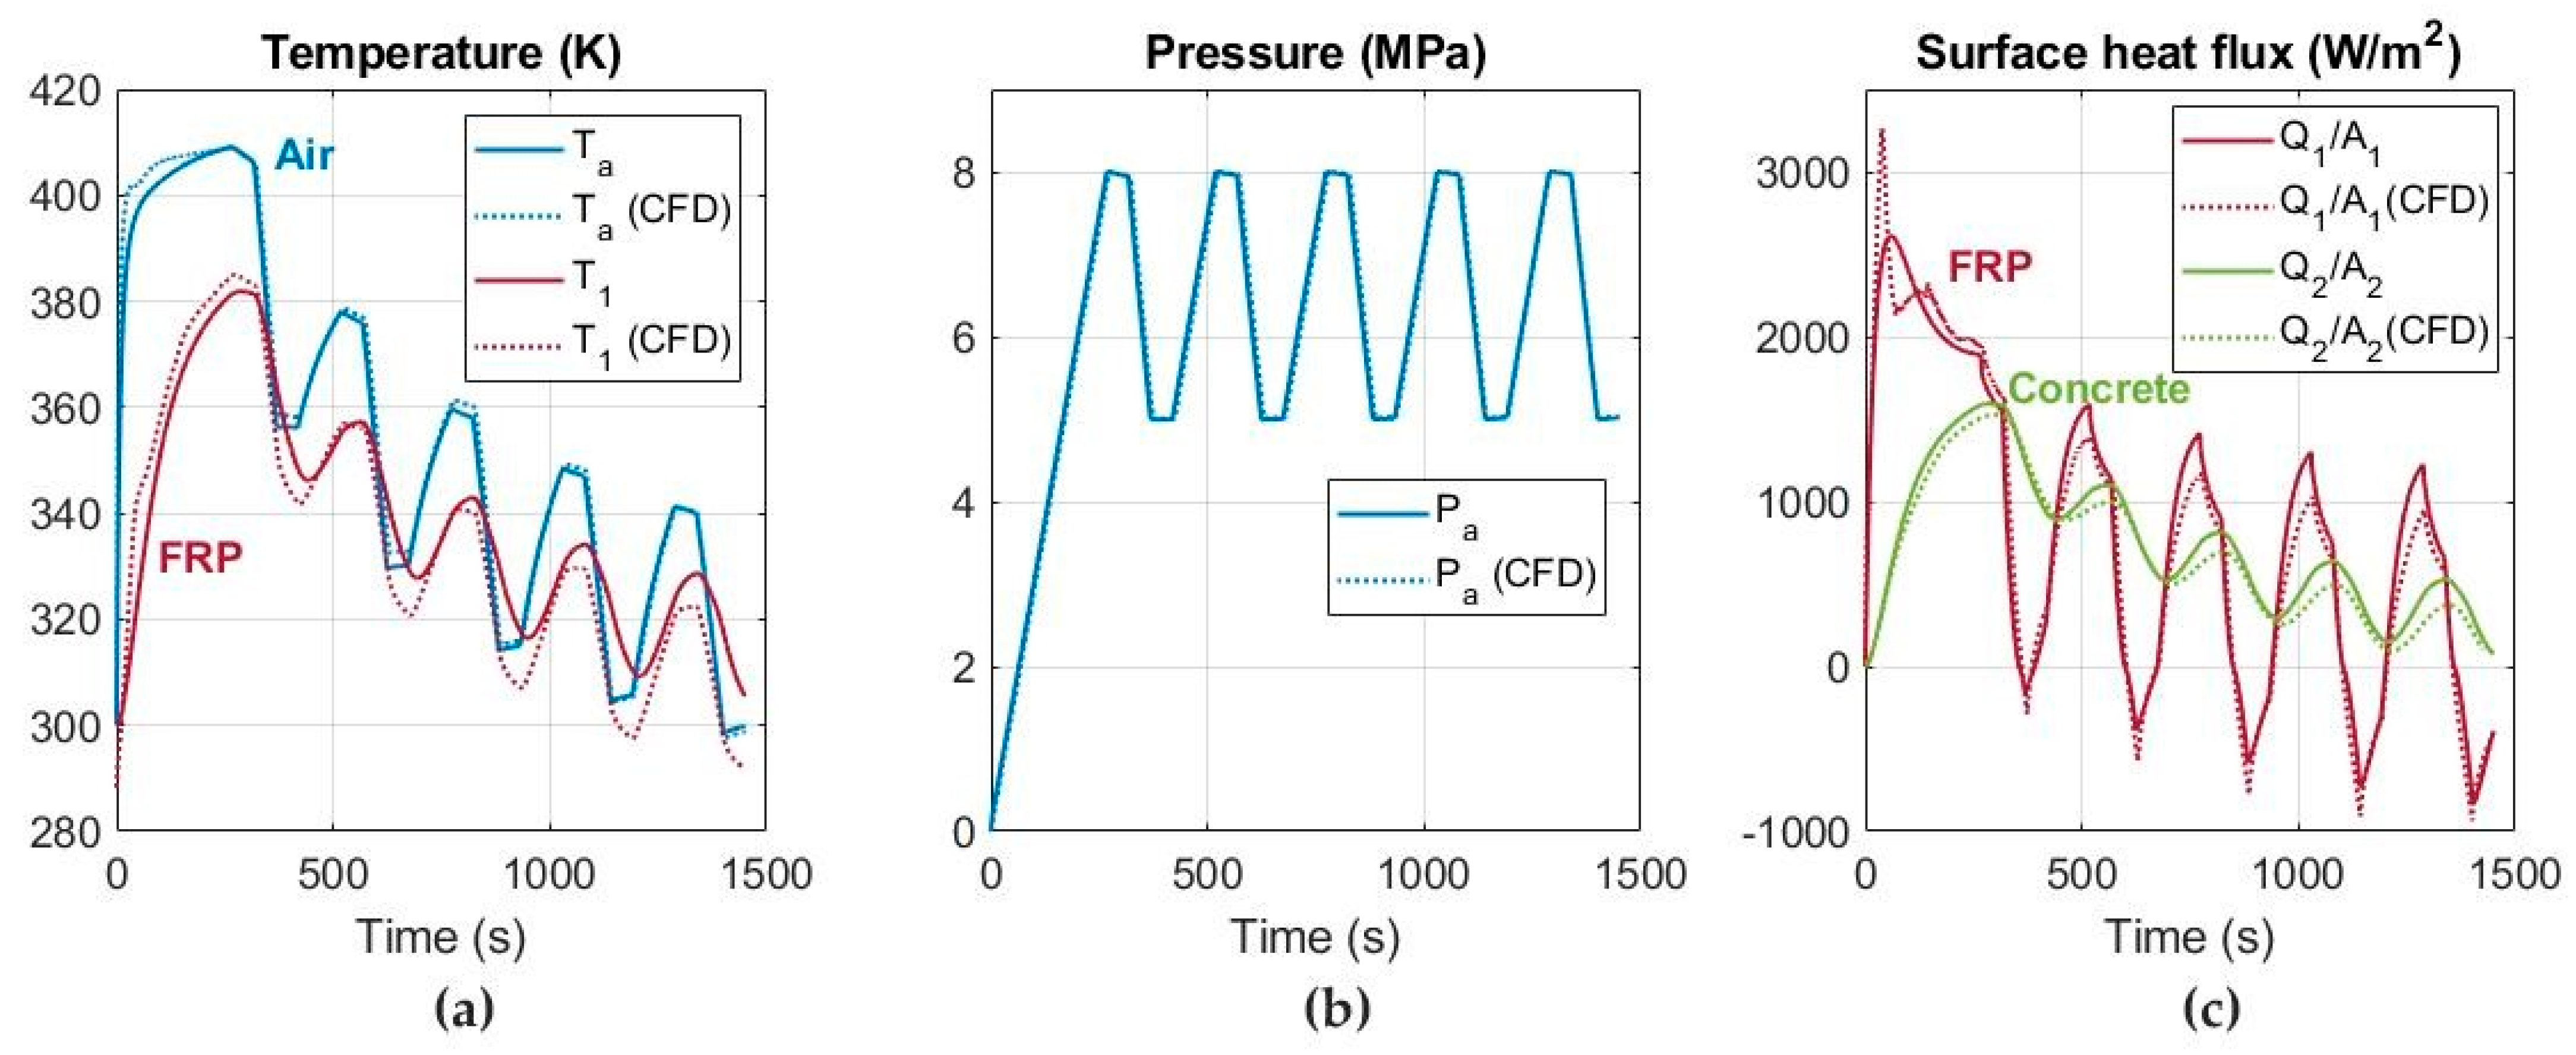
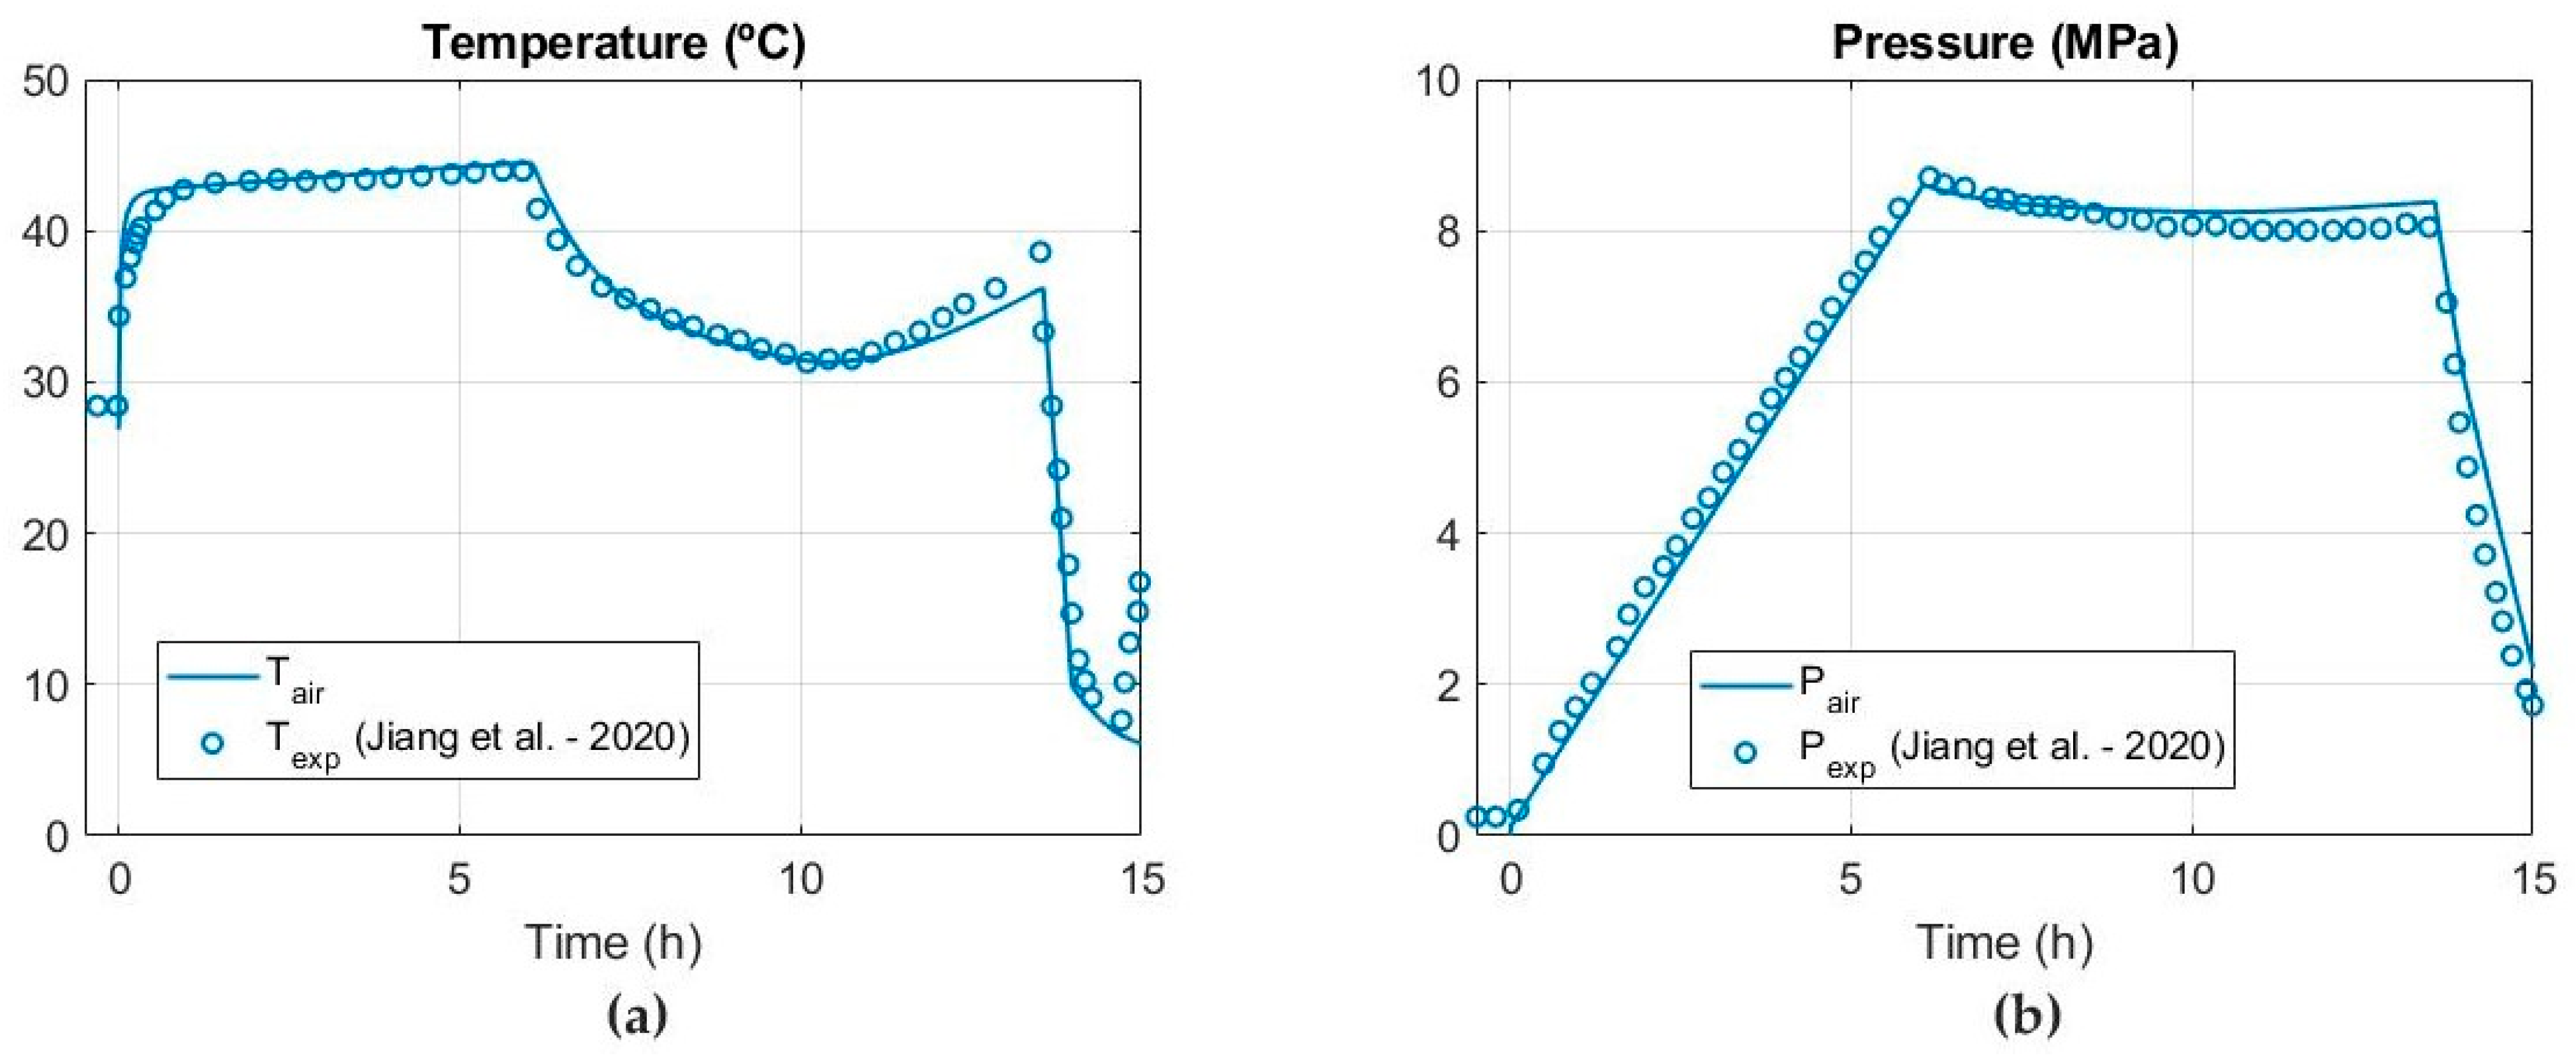
3.1. Analytical Model Results

The analytical model has been simulated for 30 cycles. The air is compressed from atmospheric conditions to 8 MPa in the first cycle. In the following cycles, the air pressure varies from 5 to 8 MPa at a stable mass flow rate considering an injected air temperature of 310 K and daily compression and decompression cycles. During an operation cycle, the air is compressed for 8 h at a mass flow rate of 0.22 kg s−1 and stored for 6 h. Then, the air is released for 4 h at a mass flow rate of −0.45 kg s−1 and stored for 6 h.
The variations in temperature for the air, sealing layer and concrete lining are shown in Figure 4 using FRP as sealing layer for 30 continuous cycles, which is equivalent to one month of operation. The results are also presented more in detail for the first cycle (Figure 4a) and the 30th cycle (Figure 4c). The air temperature increases up to 322 K during the first compression cycle. However, due to mixing with the injected air and heat exchange between the compressed air and the lining, the air temperature within the reservoir decreases to 307 K from the fifth cycle (five days). During the discharge period the air temperature is also stable, reaching minimum values of 294 K. The temperature of the FRP and concrete during the charge period reach 305 and 303 K, respectively, decreasing to 296 and 300 K during the discharge phase.
As shown in Figure 5, the air pressure varies from 5 to 8 MPa over the entire 30 days. Because of air temperature, the pressure decreases to 7.8 MPa during the storage period in the first cycle (Figure 5a). This reduction decreases to 7.9 MPa from the fifth cycle. The air pressure increases slightly in the storage period after the decompression stage.
The surface heat flux by convection between the compressed air and the FRP and between the FRP and concrete is shown in Figure 6. Note the thickness of the sealing layer (20 mm). Due to the temperature effect, the surface heat flux increases in the first cycle to 150 and 140 W m−2 for FRP and concrete lining, respectively. The heat flux decreases to −90 W m−2 in the decompression stage. As observe in Figure 6c in more detail, from second cycle the heat flux through the FRP and concrete is stable, reaching maximum values of 50 and −100 W m−2 in the charge and discharge periods, respectively. The surface heat flux is decreasing rapidly during the storage periods. Due to the thickness of the sealing layer and the long air charging and discharging time, the surface heat flux in the sealing layer and the concrete lining is very similar.
A comparative analysis for the air temperature, pressure and surface heat flux is shown in Figure 7 for the first cycle considering both FRP and steel as sealing layers. The results are also presented for cycle 30th in Figure 8. The air temperature fluctuation between the compression and decompression periods decreases when steel is employed as sealing layer. Because of the thermal conductivity, the temperature in the contact surface between the compressed air and sealing layer is lower when steel is employed as sealing layer (Figure 8a). The reduction in air pressure in the first cycle is greater during the storage period when FRP is used as sealing layer (Figure 7b). However, as shown in Figure 8b, this reduction is very similar from second cycle. Regarding the surface heat flux, the results are very similar for both sealing layers, reaching values 50 and −100 W m−2 in the compression and decompression stages (Figure 8c). The thermal energy balance in the 30th cycle (day 30) through the sealing layer reaches 25.27 and 20.48 kWh for FRP and steel, respectively. Although the system loses slightly more thermal energy in the compression stage when steel is used, the lining contributes with more energy to the compressed air in the decompression stage when steel is used as sealing layer (Figure 8c).

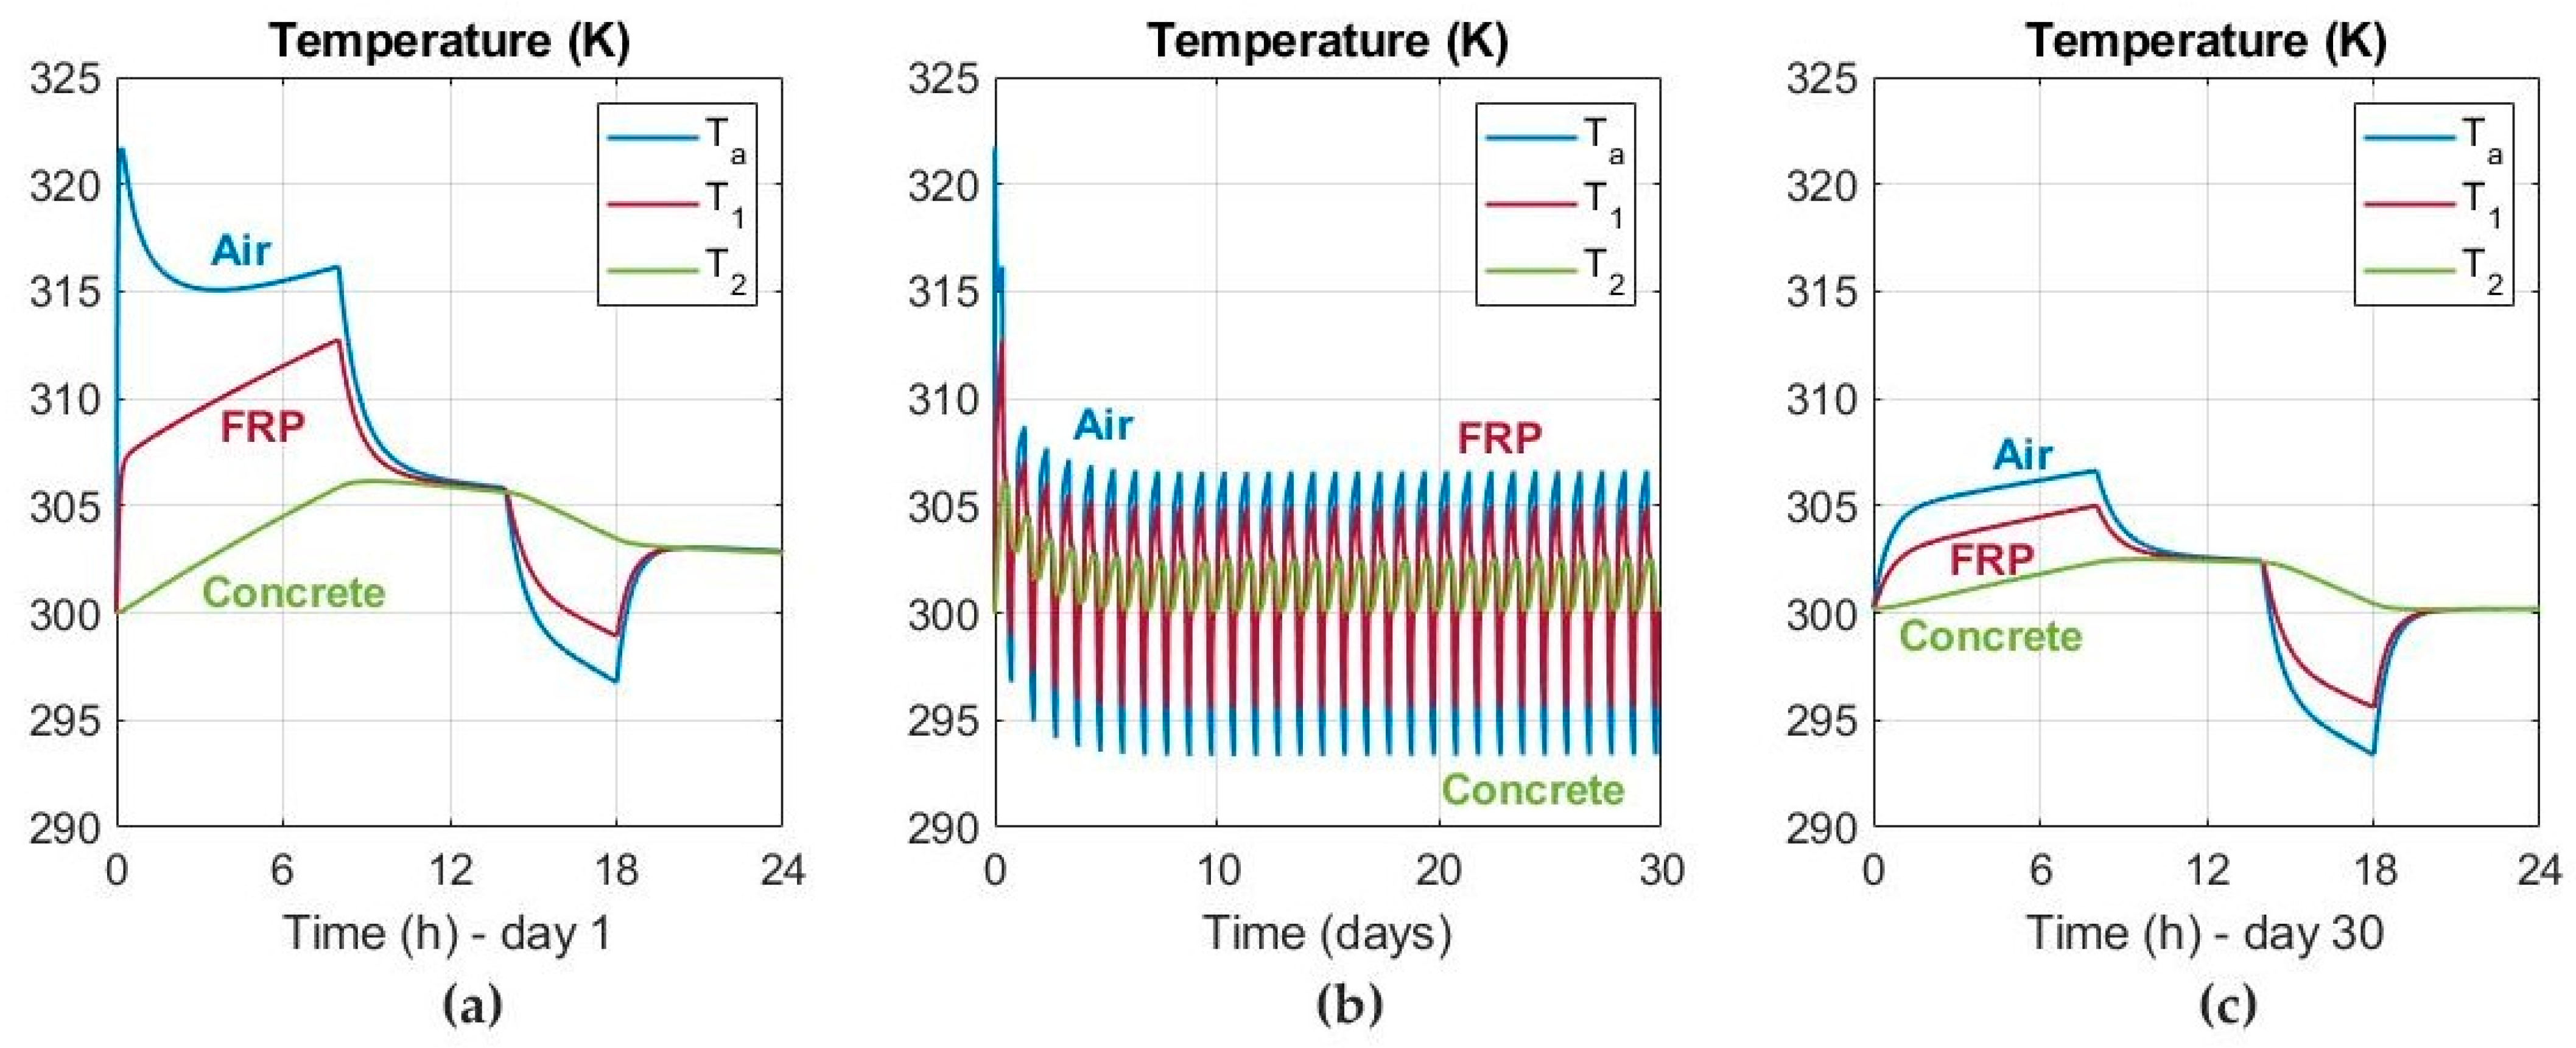
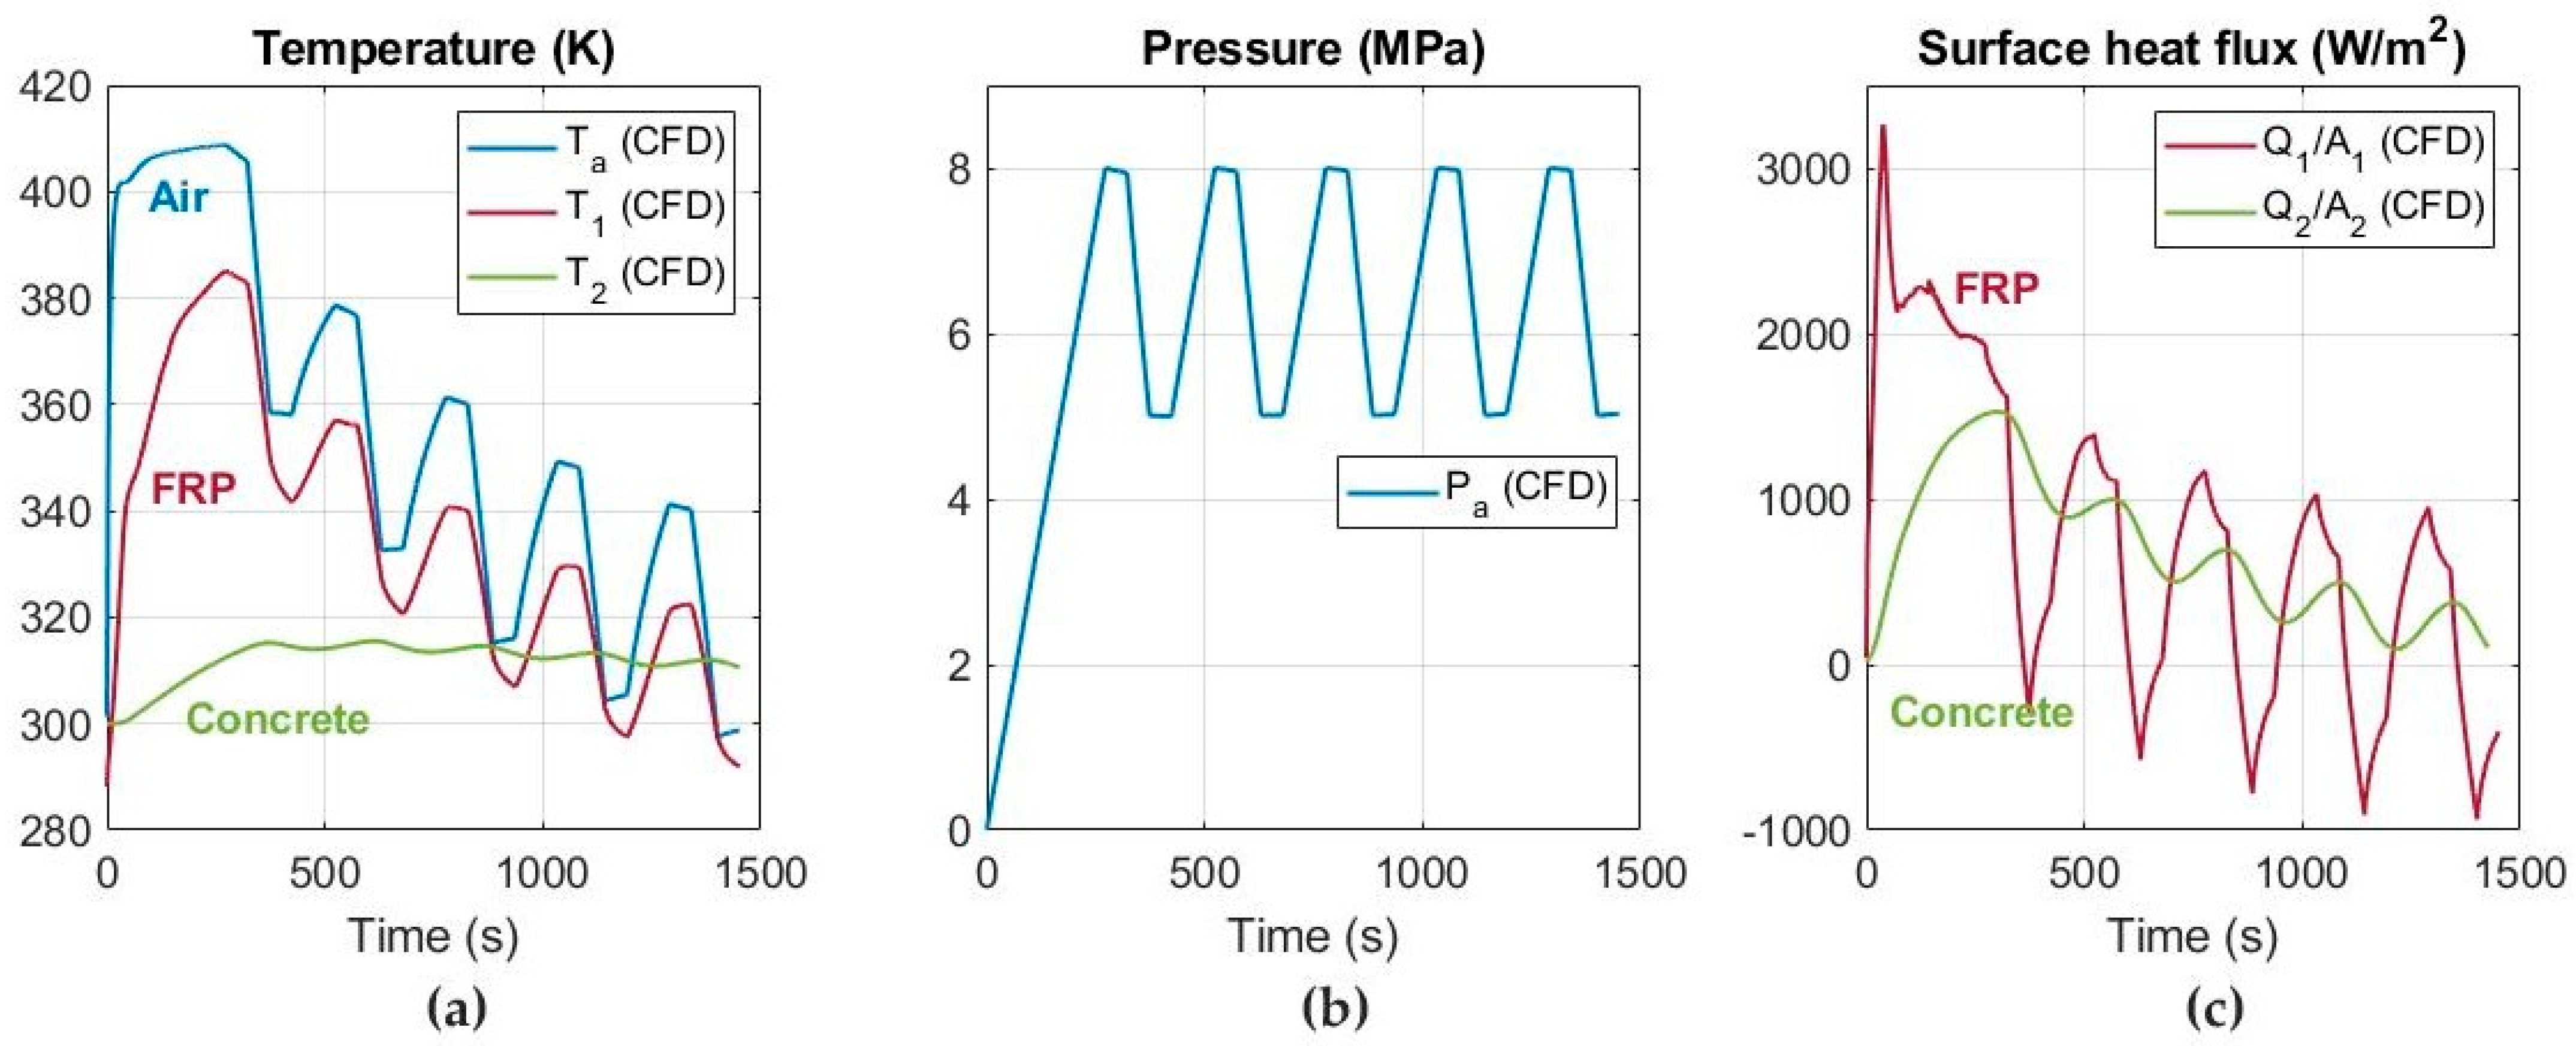
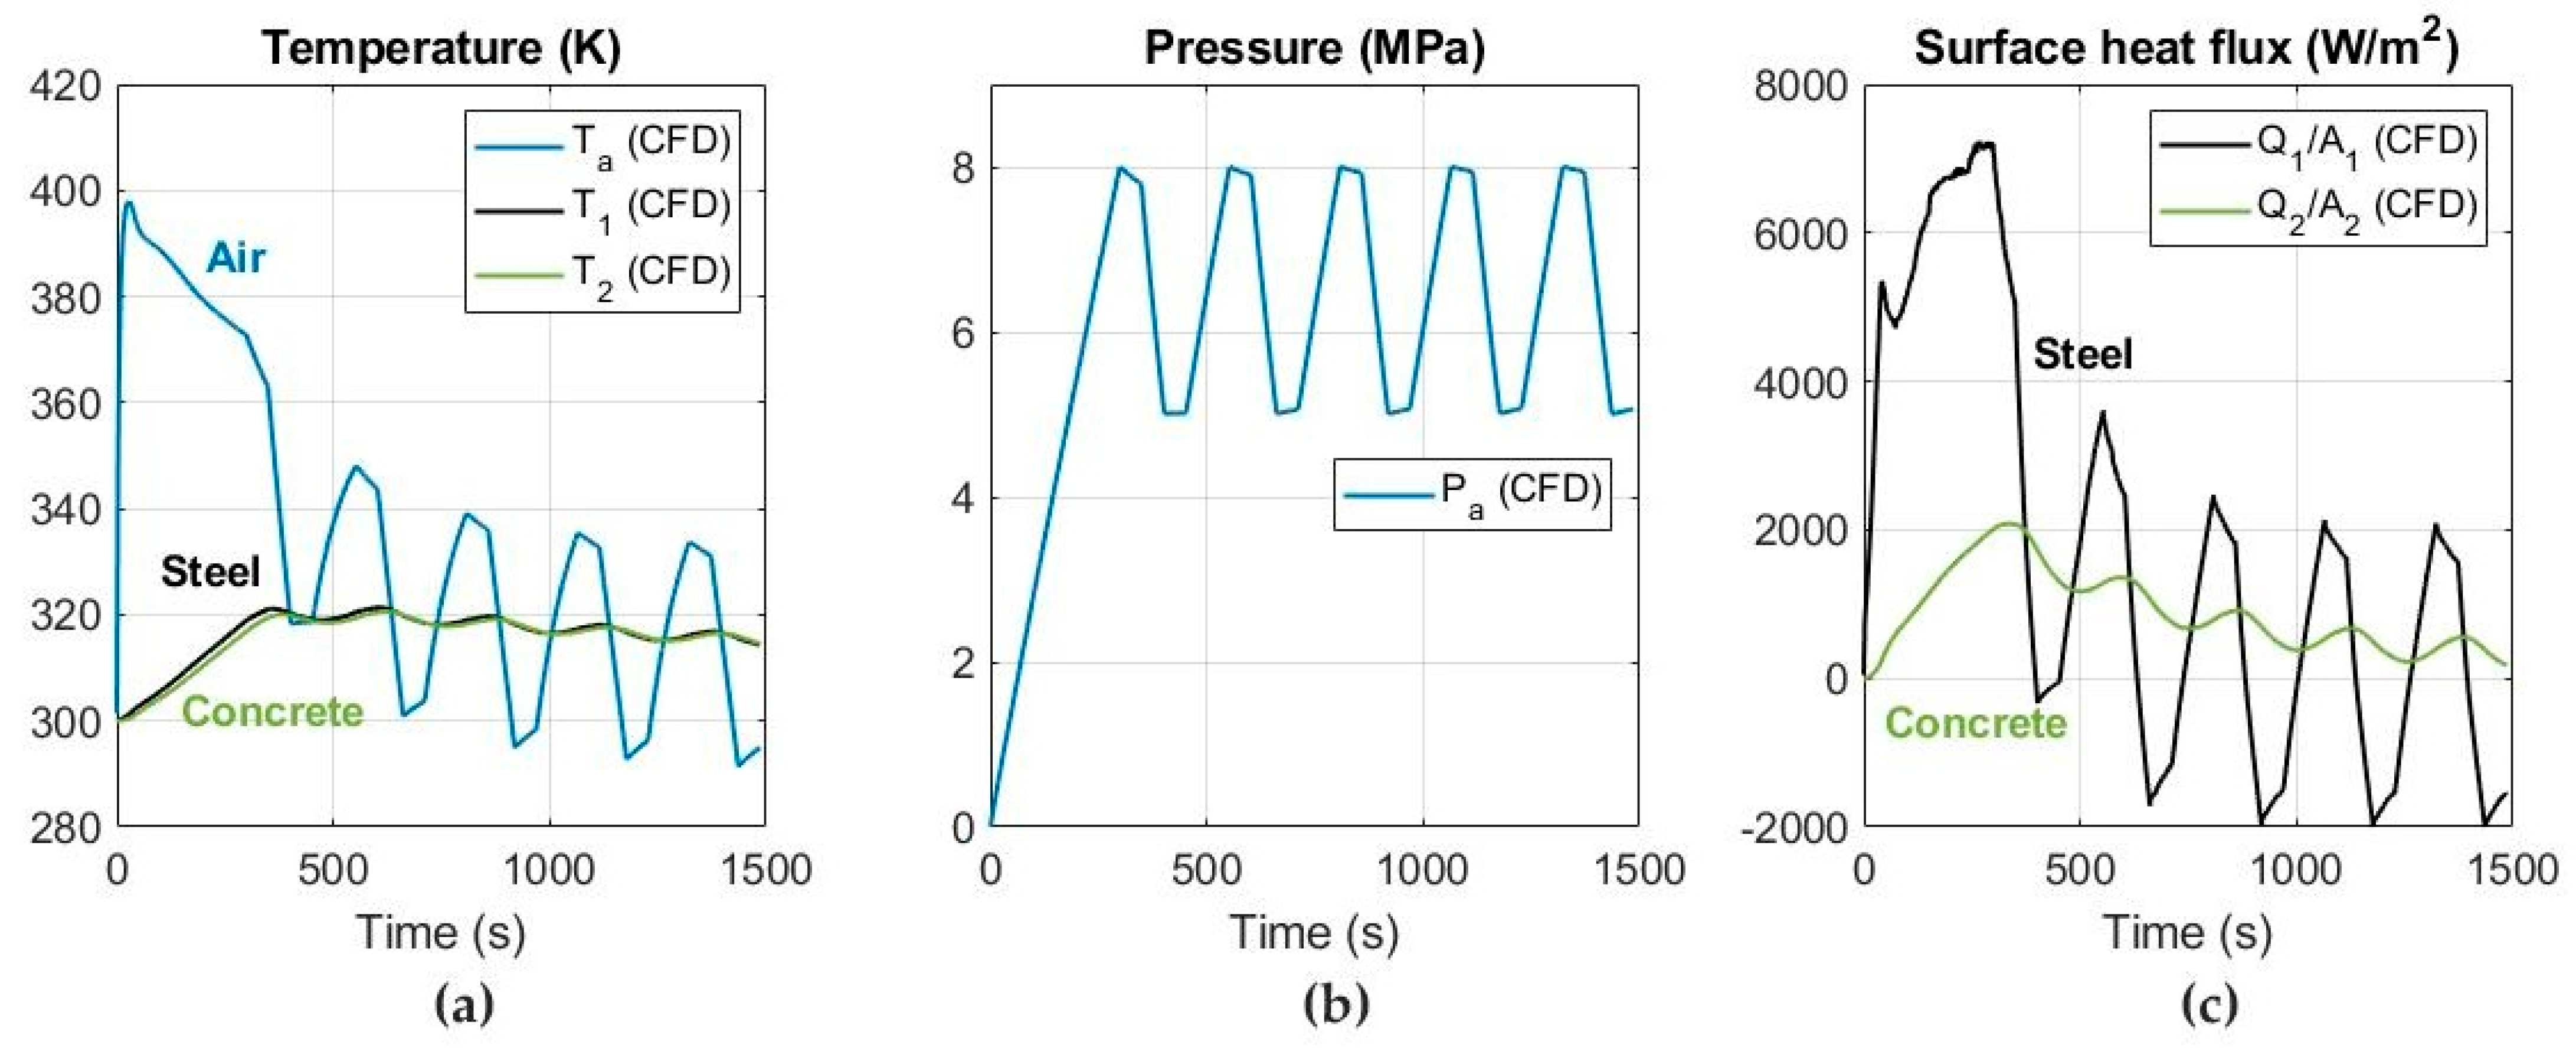
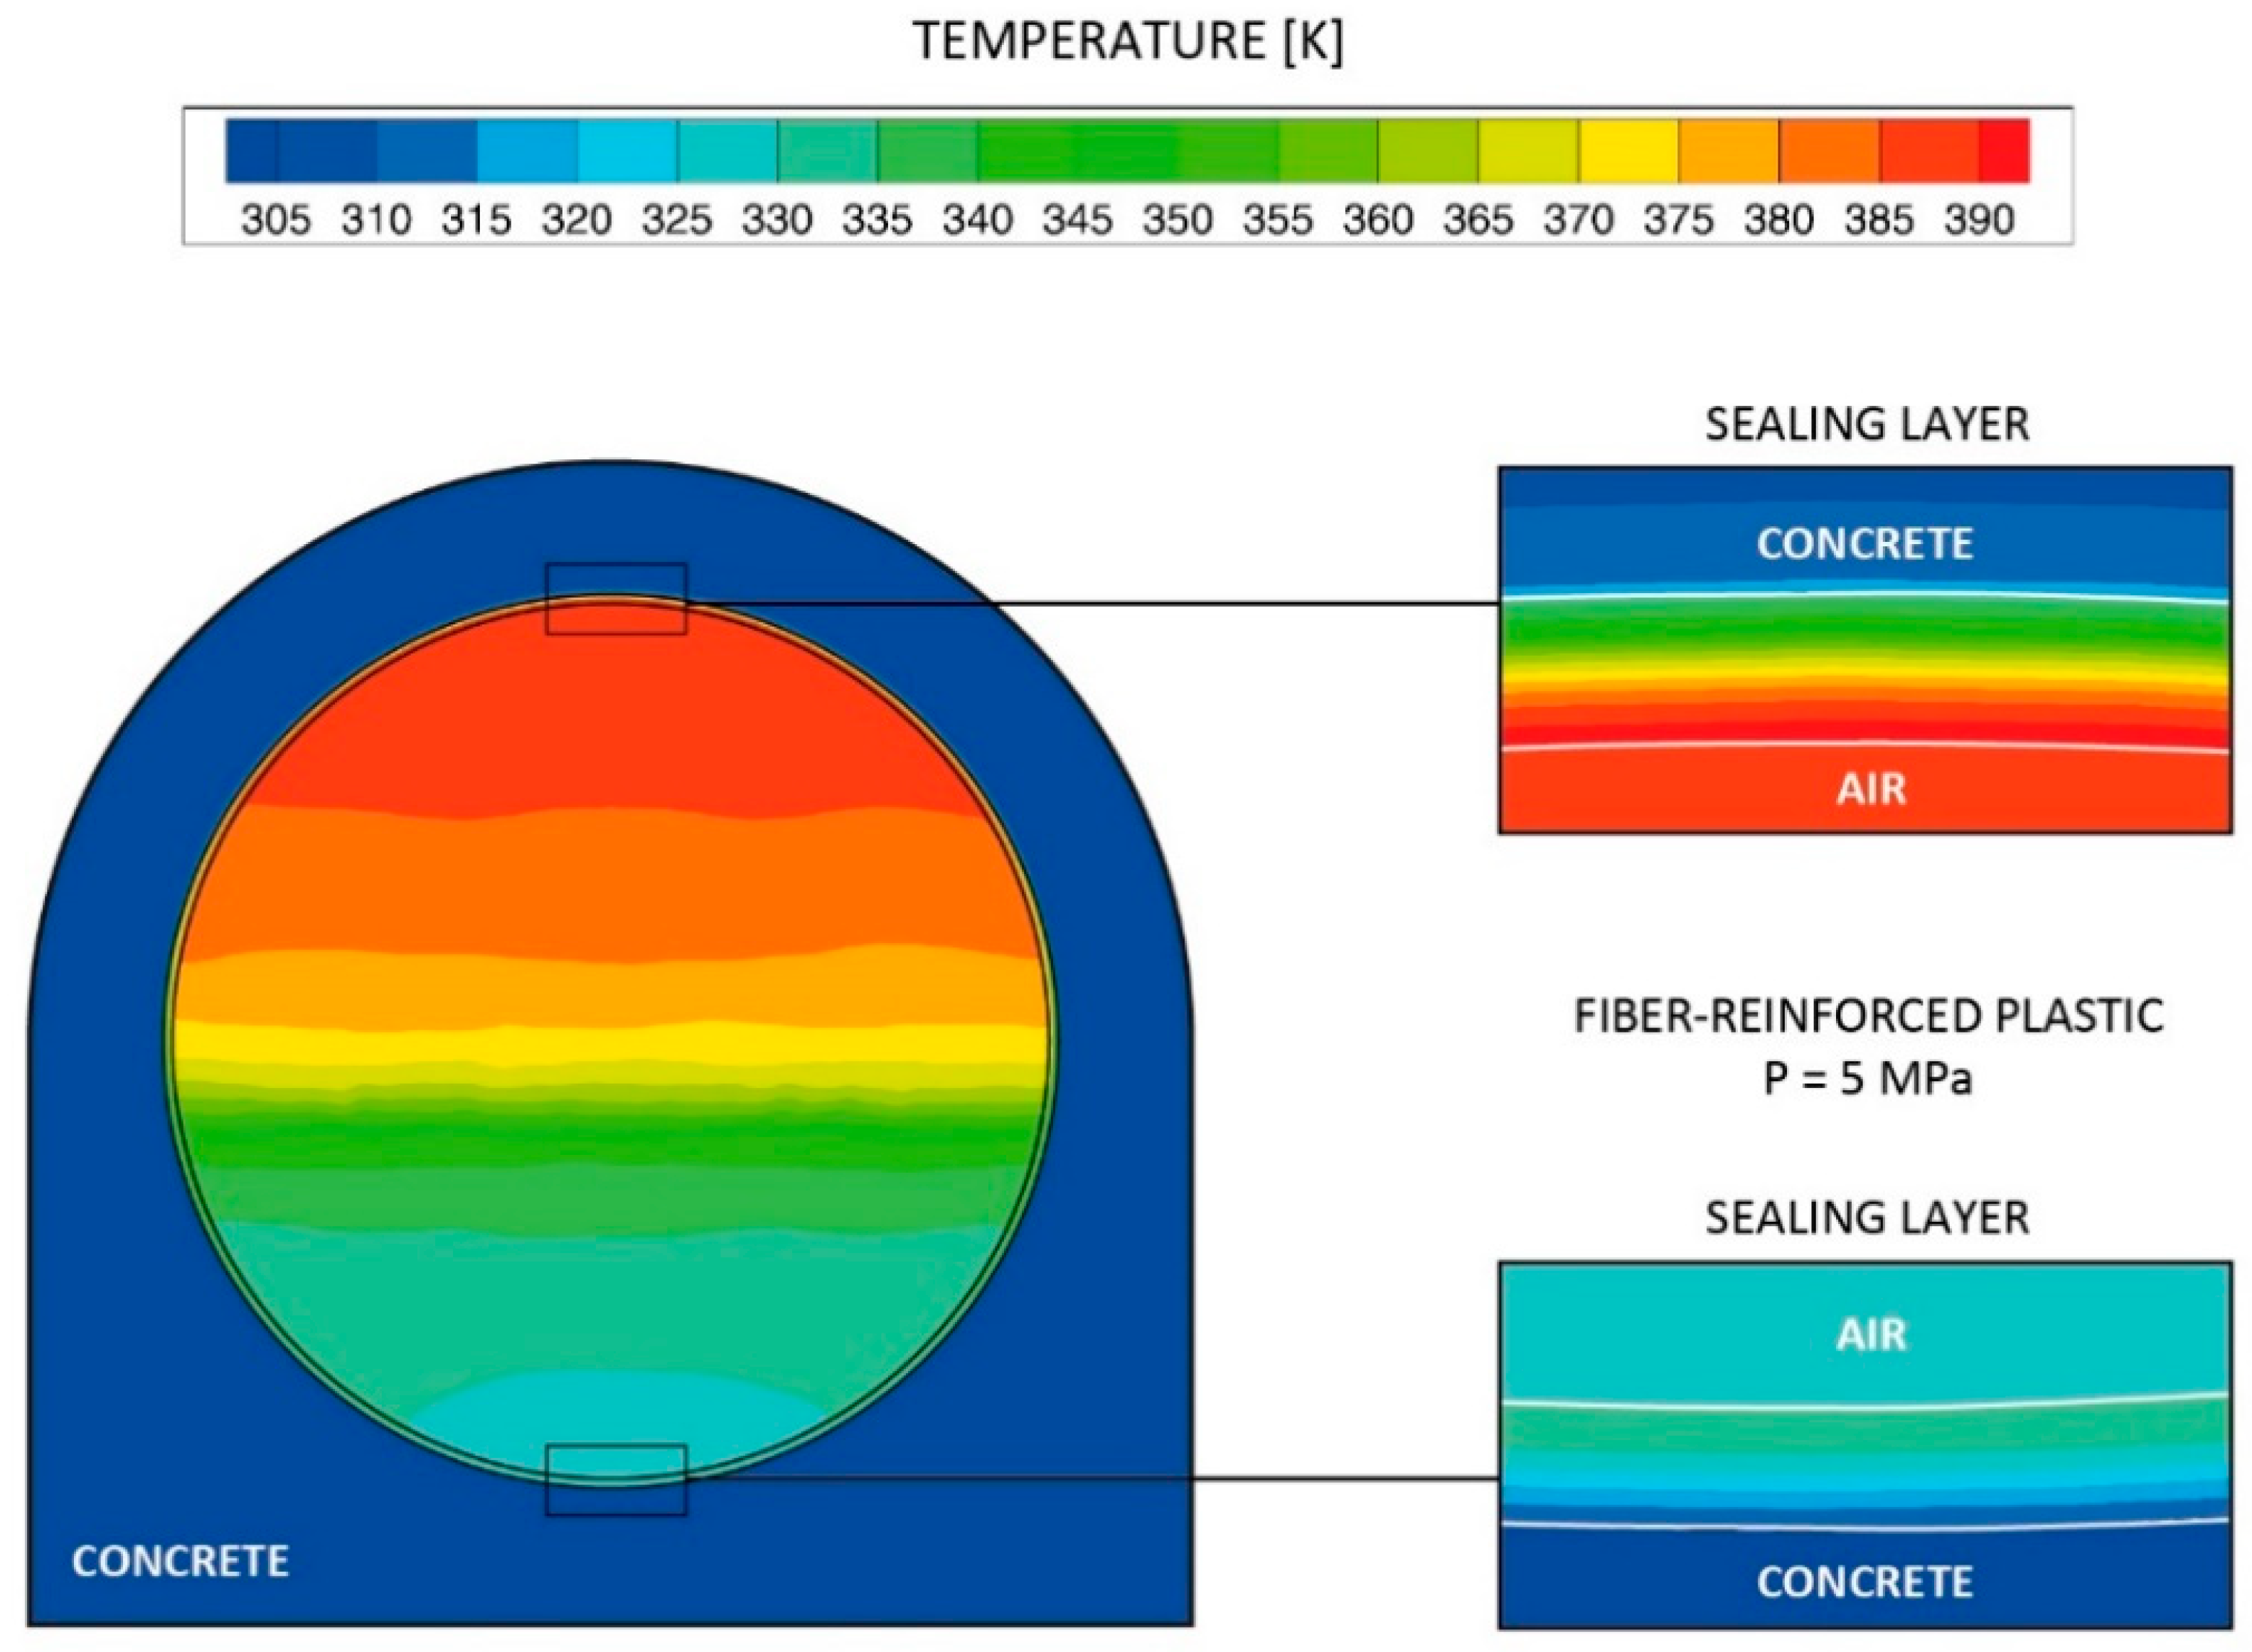
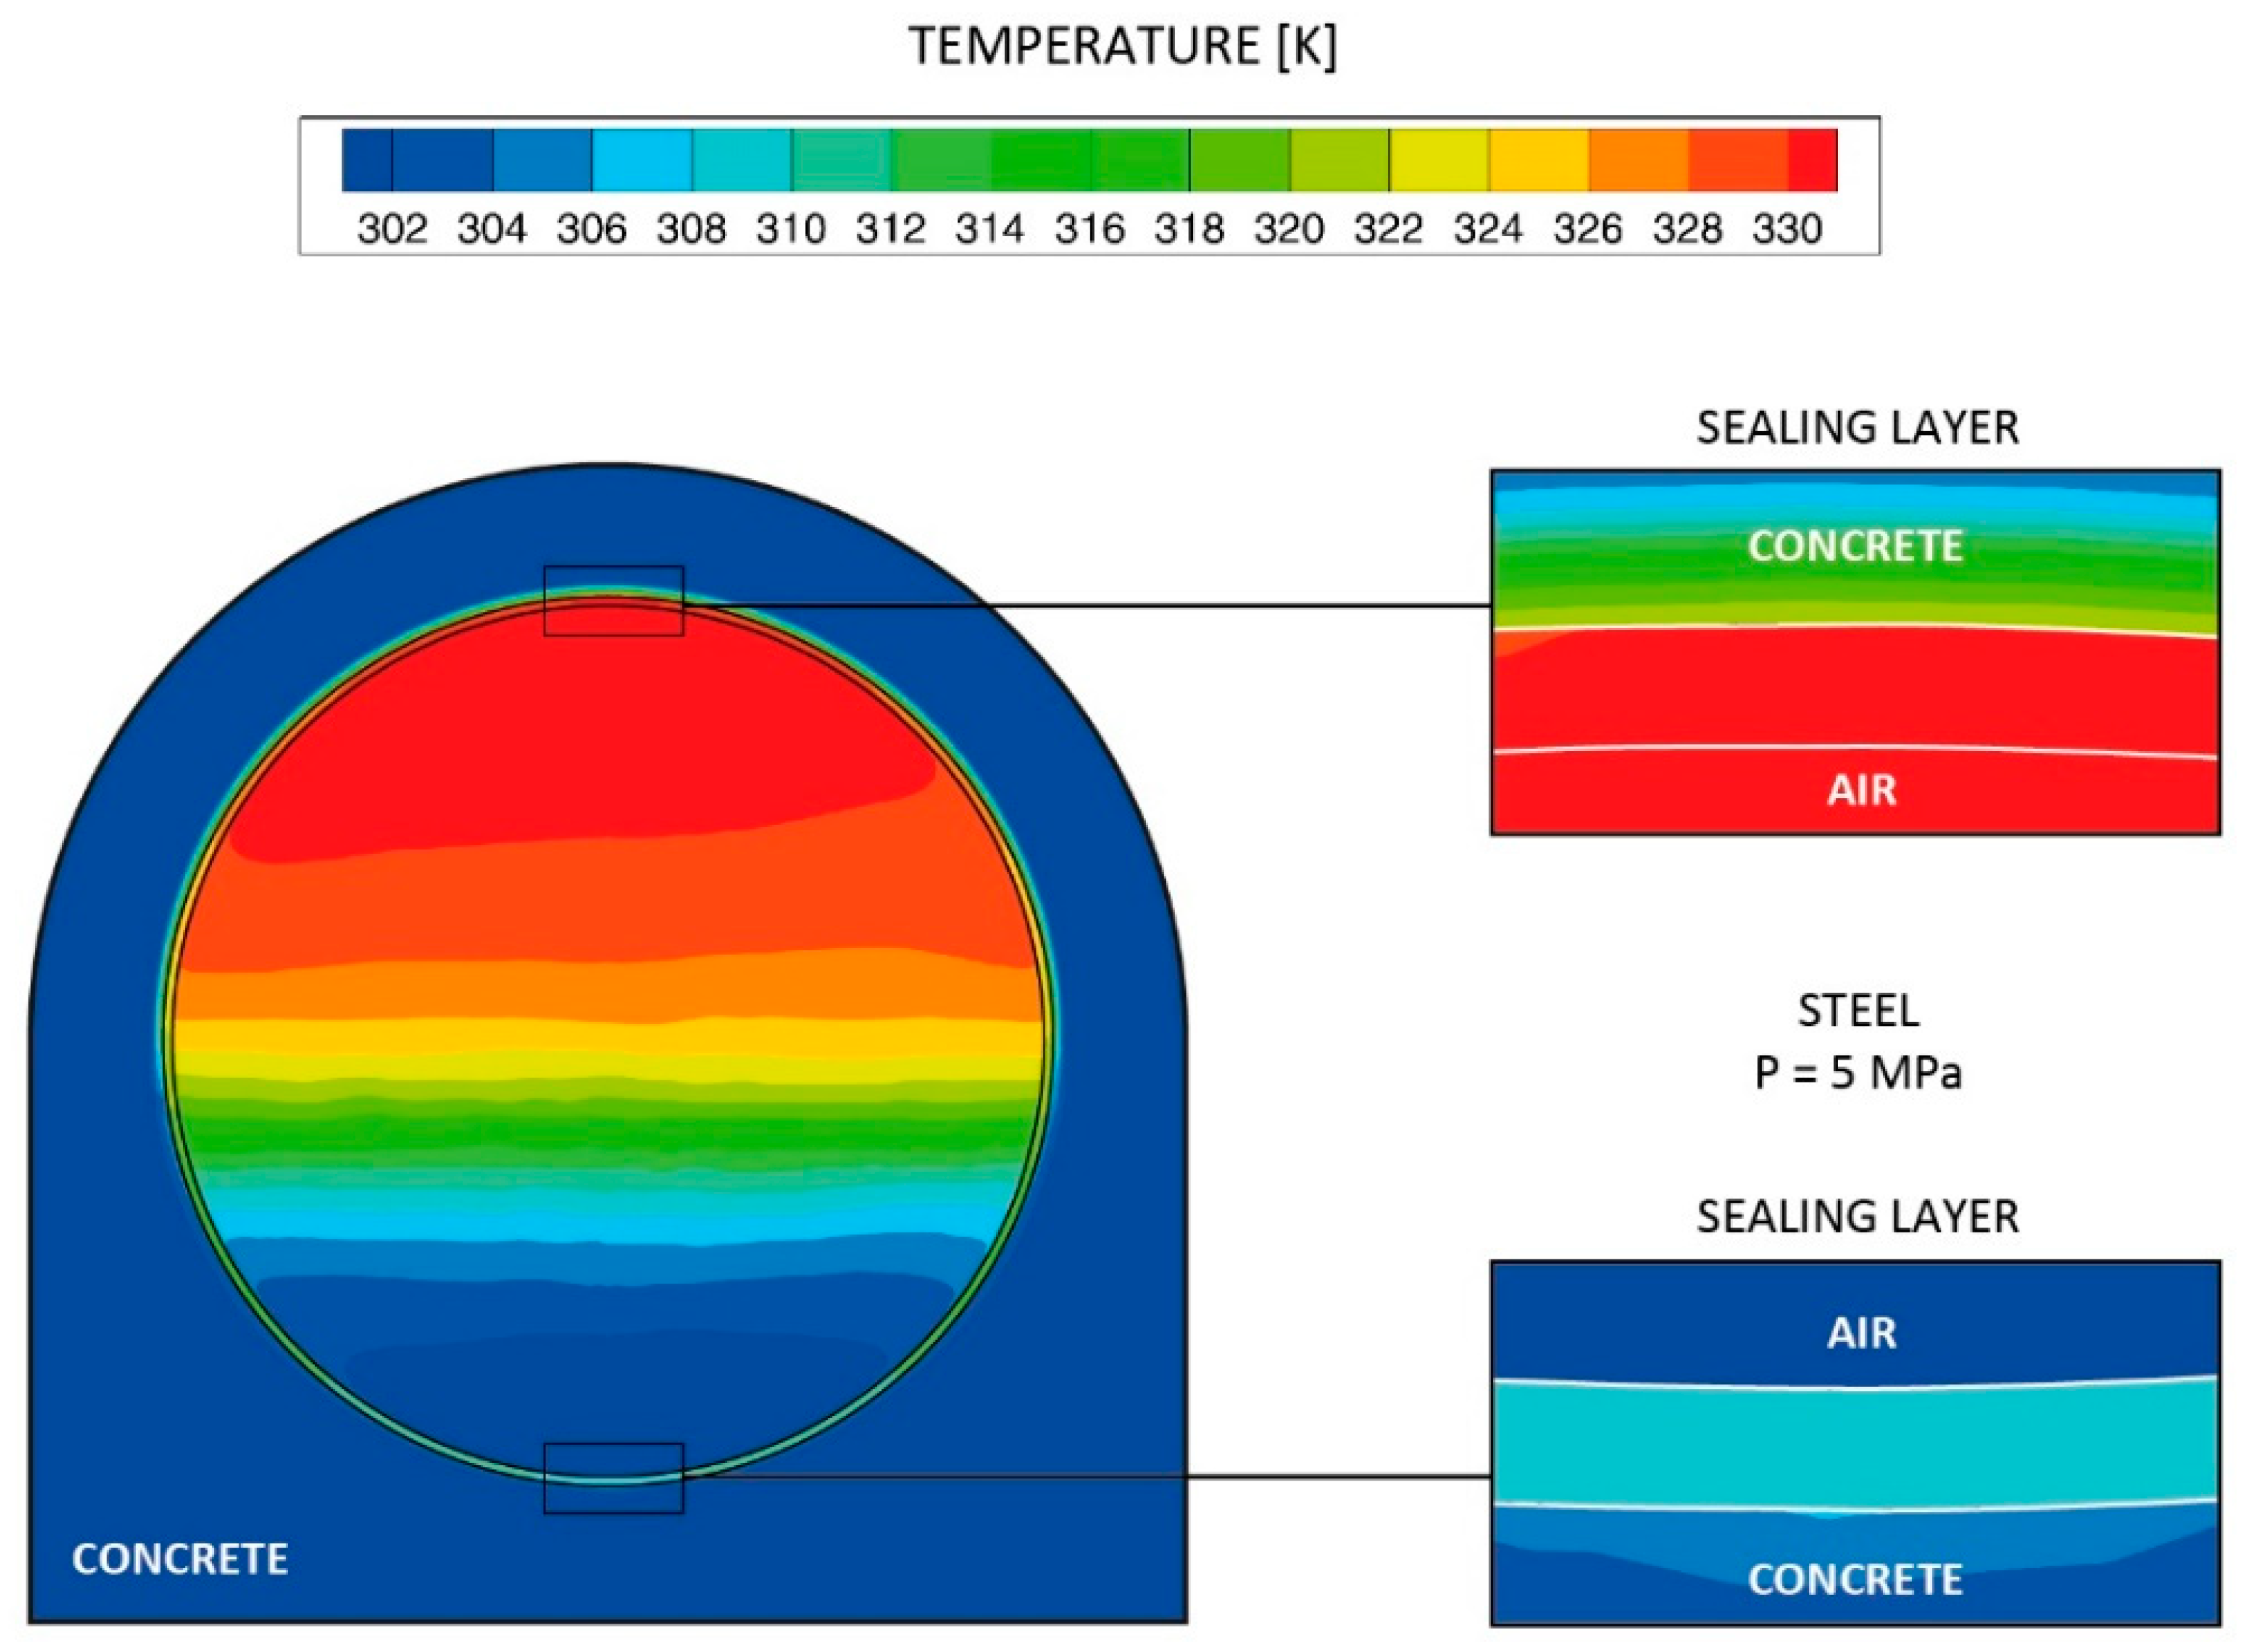
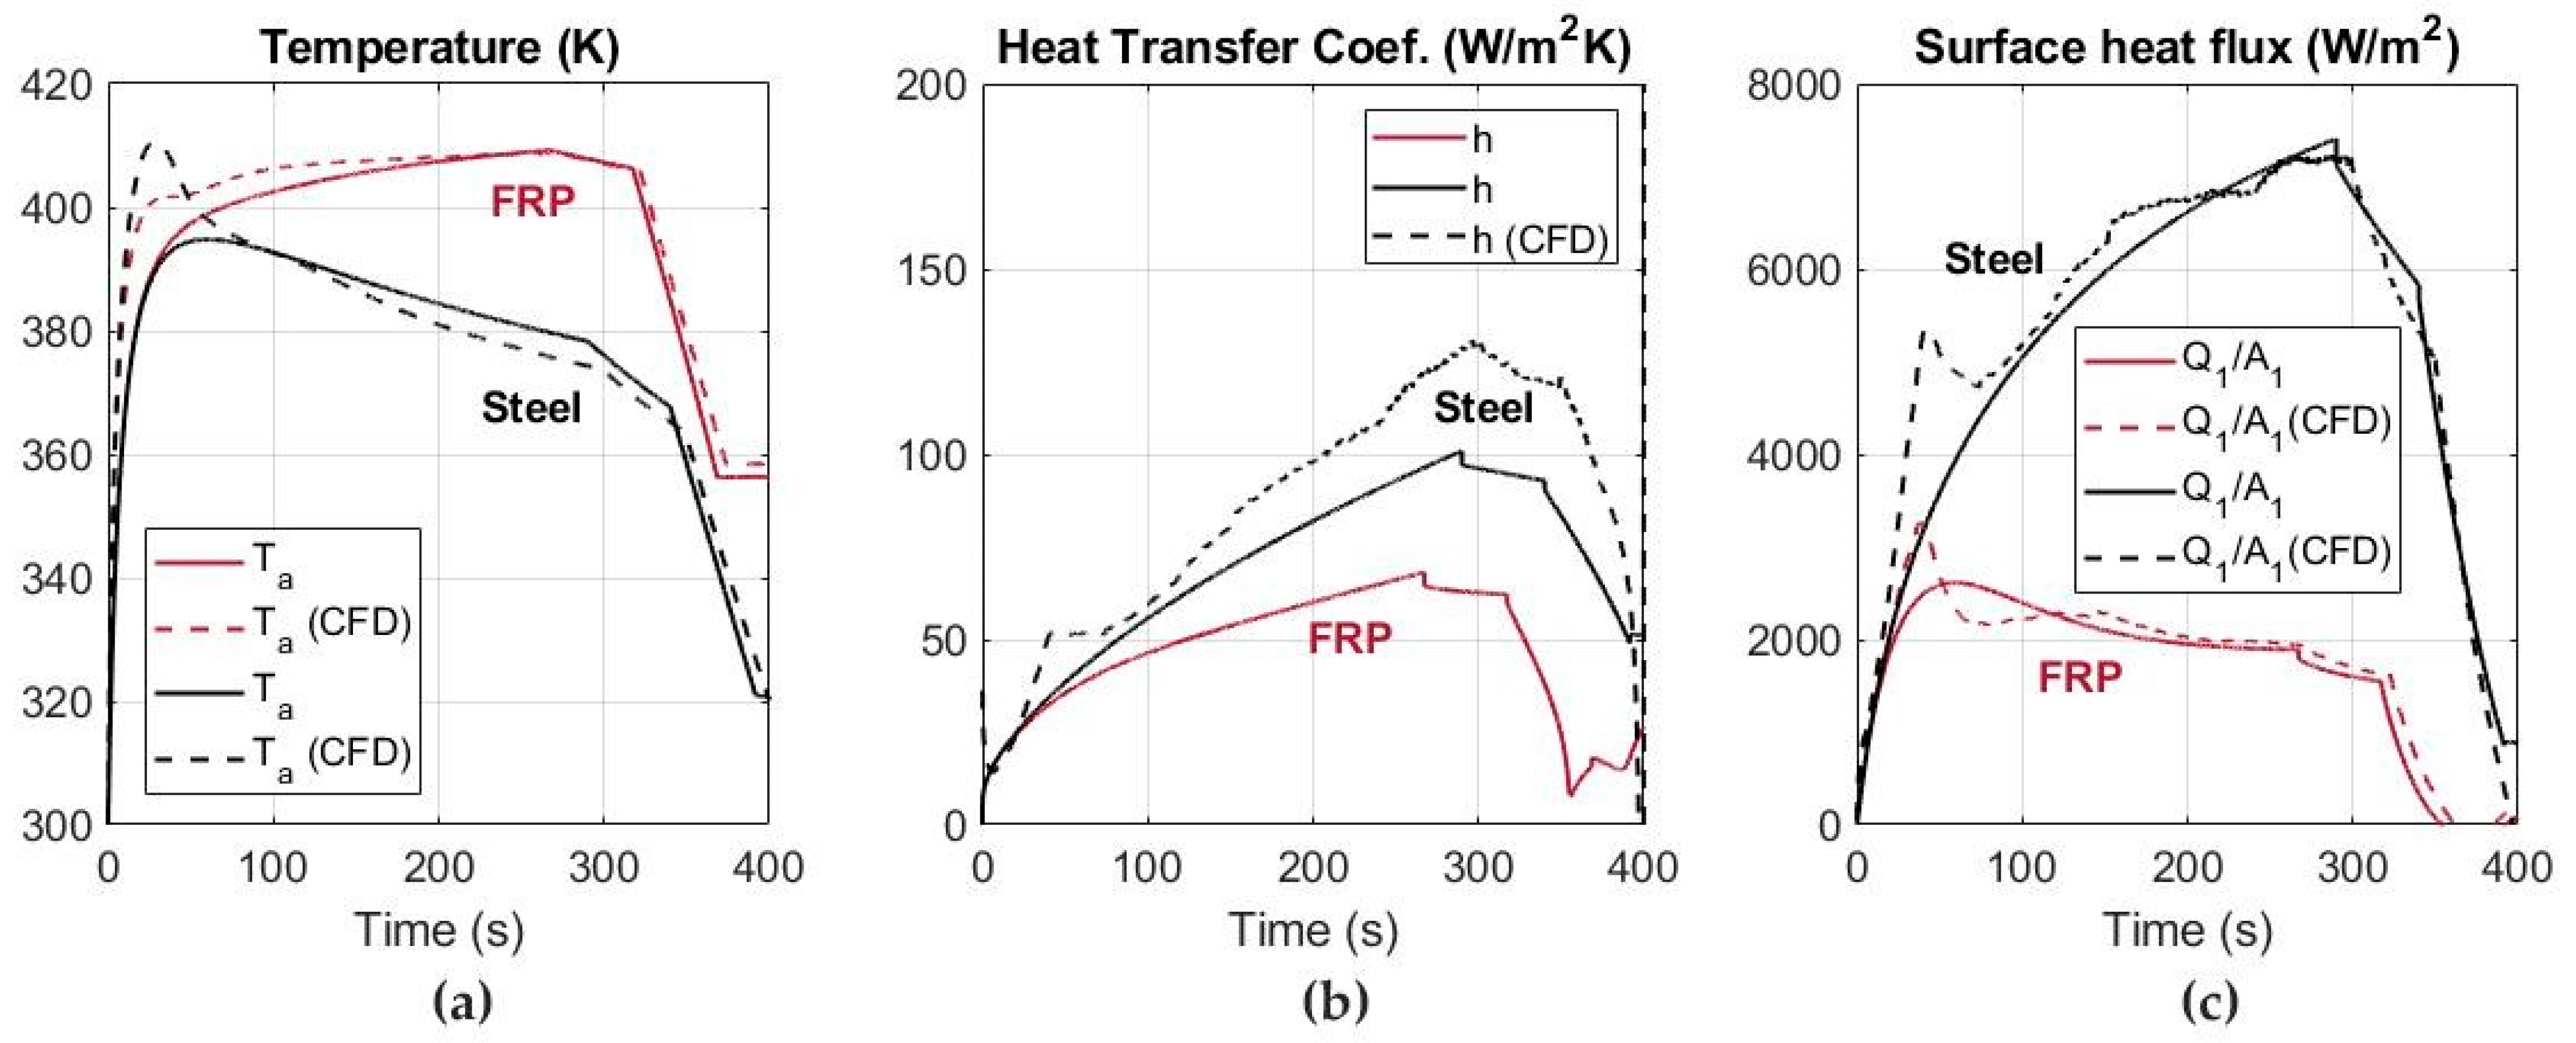
3.2. Numerical Model Results

To validate the results of the analytical model, a 3D CFD numerical model has been performed and the results are shown in Figure 9. The numerical model has been simulated for 5 cycles, considering an injected air temperature of 310 K and stable air mass flow rates of 50 kg s−1 and −75 kg s−1 in the charge and discharge periods, respectively. The model geometry and thermal properties of air and solids are the same as those used in the analytic model. As presented in Figure 9a, the maximum air temperature decreases from 410 to 340 K between the first and fifth cycle. The air temperature fluctuation between air charging and discharging reaches 45 K in the fifth cycle. Likewise, the FRP temperature decreases from 385 to 322 K. However, the concrete lining temperature is more constant throughout the process. The surface heat flux for FRP and concrete is shown in Figure 9c. Due to convective effects, the heat flux increases in FRP during the first cycle. Then, from third cycle is stabilized in a maximum value of 1000 W m−2 in the compression period and −1000 W m−2 in the decompression period. The numerical model results using steel as sealing layer are shown for five cycles in Figure 10.
As in the analytical model, the air temperature fluctuation between air compression and decompression periods is reduced down to 41 K when steel is employed as sealing layer (Figure 10a). In general, the air temperature is much lower than the previous scenario. The surface heat flux is presented in Figure 10c, varying in the steel surface between 2000 W m−2 and −2000 W m−2 for the charge and discharge periods, respectively. Due to the high thermal conductivity (45 W m−1 K−1), the heat flux through the sealing layer is greater, and therefore the temperature in the steel surface is lower. The temperature in the steel coincides with the temperature on the concrete surface, reaching a maximum value of 320 K in the first cycle.
The distribution of the air temperature within de reservoir and the detail of the temperature in the sealing layer are shown in Figure 11 after the decompression period at 5 MPa in the first cycle, using FRP as sealing layer.
Due to the low thermal conductivity of FRP, the temperature reaches 390 K at the top of the reservoir. However, the temperature in the FRP decreases to 330 K at the bottom. A minimal increase in temperature is observed in the concrete lining. The distribution of the air temperature within de reservoir and the detail of the temperature in the sealing layer are shown in Figure 12 after the decompression period at 5 MPa in the first cycle, using steel as sealing layer. The temperature in the steel reaches 330 K at the top of reservoir. In this scenario, a temperature increase up to 320 K has been obtained for the concrete lining.
The distribution of the surface heat flux around the compressed air is shown in Figure 13 after the first compression cycle at 8 MPa for both FRP and steel sealing layers. The surface heat flux reaches a maximum value of 7500 W m−2 in the steel surface, while in the FRP surface the maximum value is 3000 W m−2.

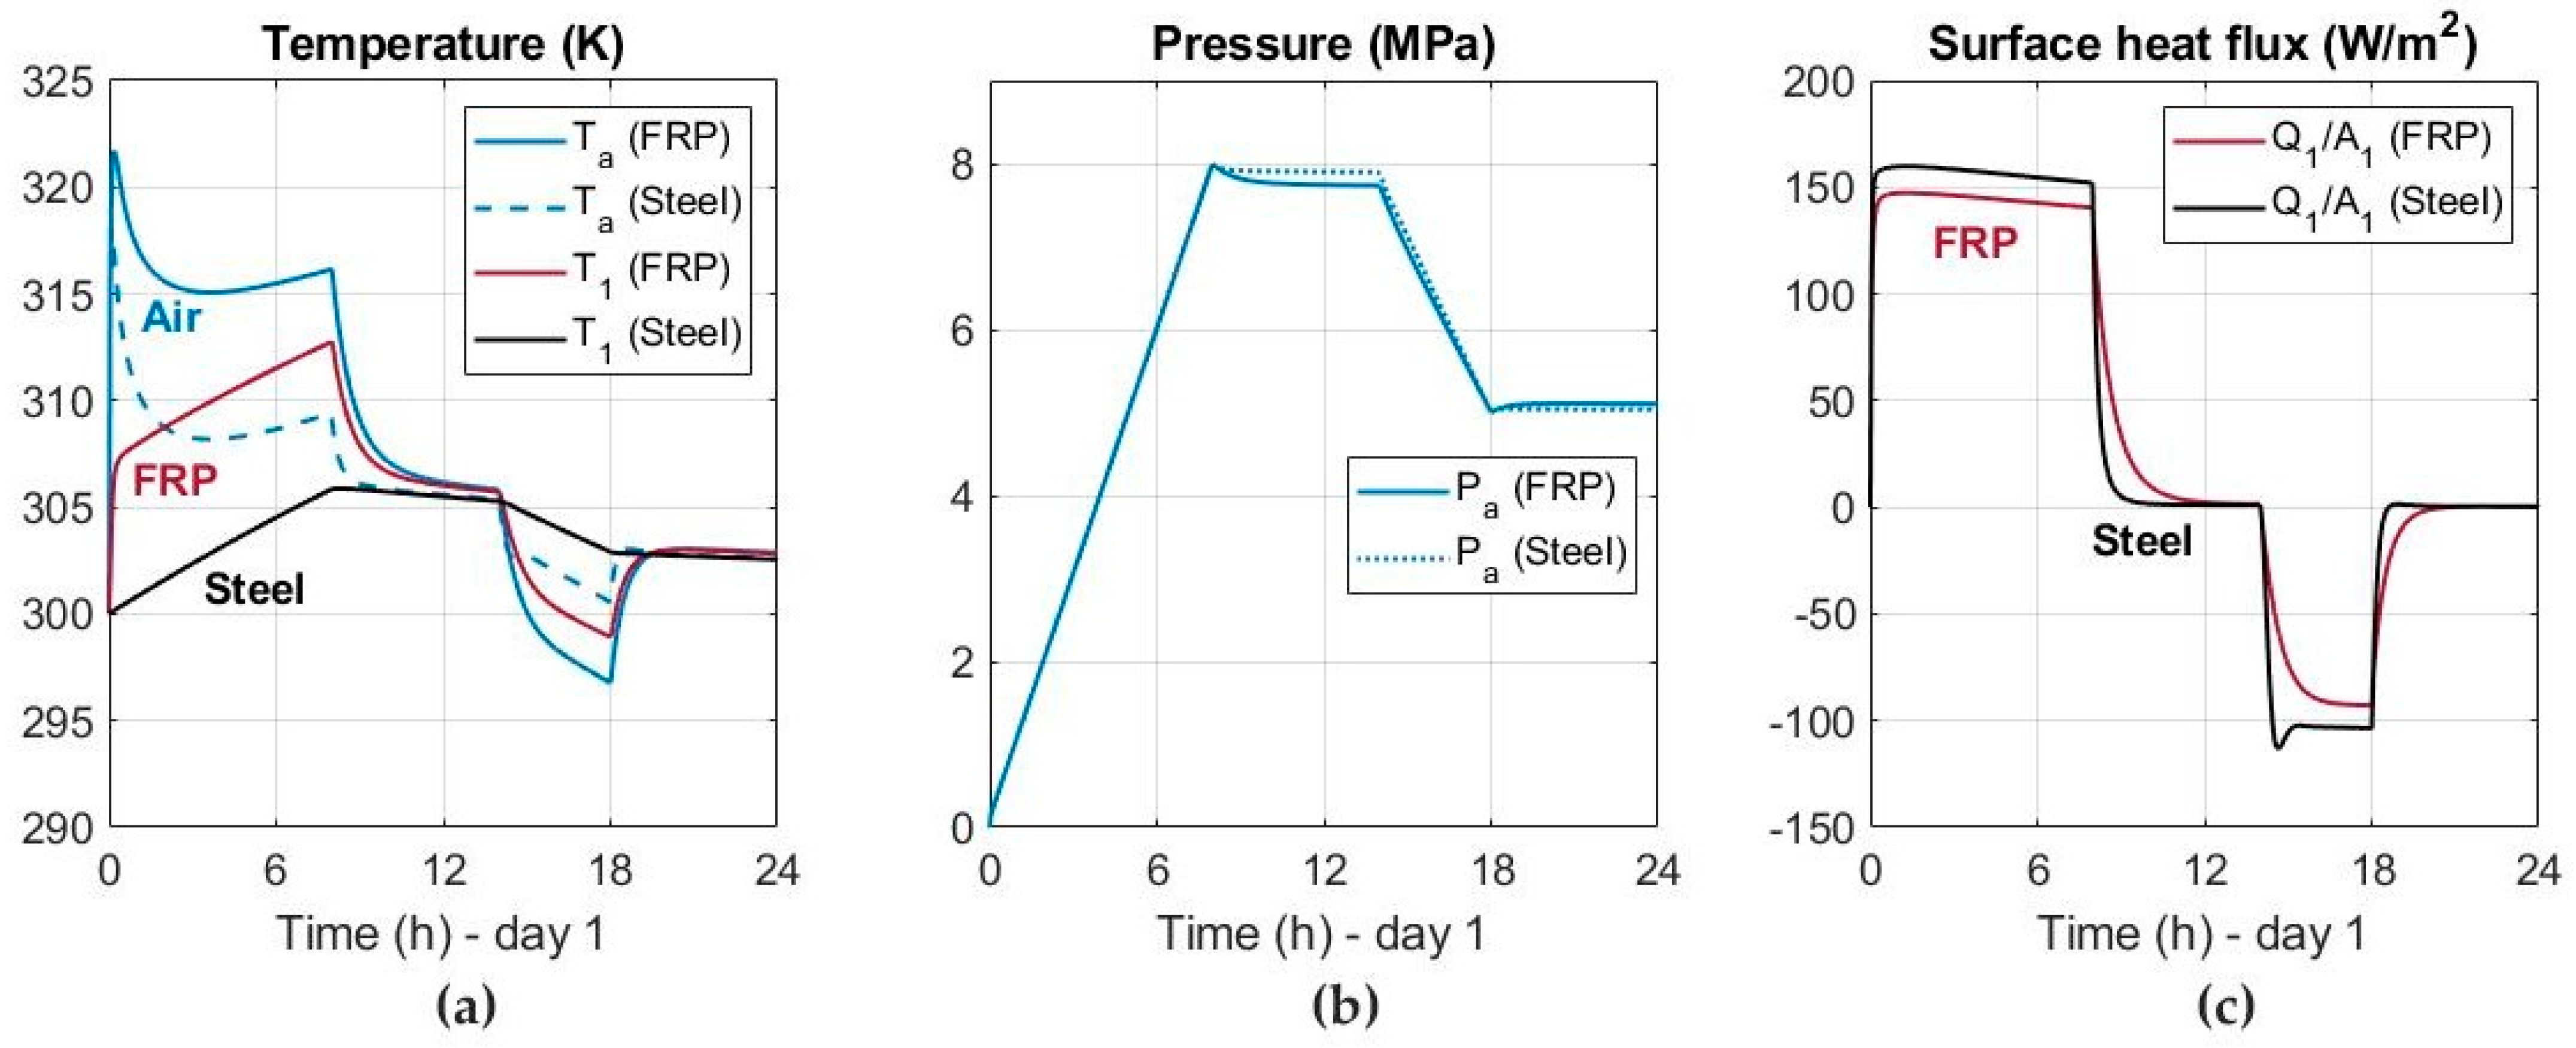
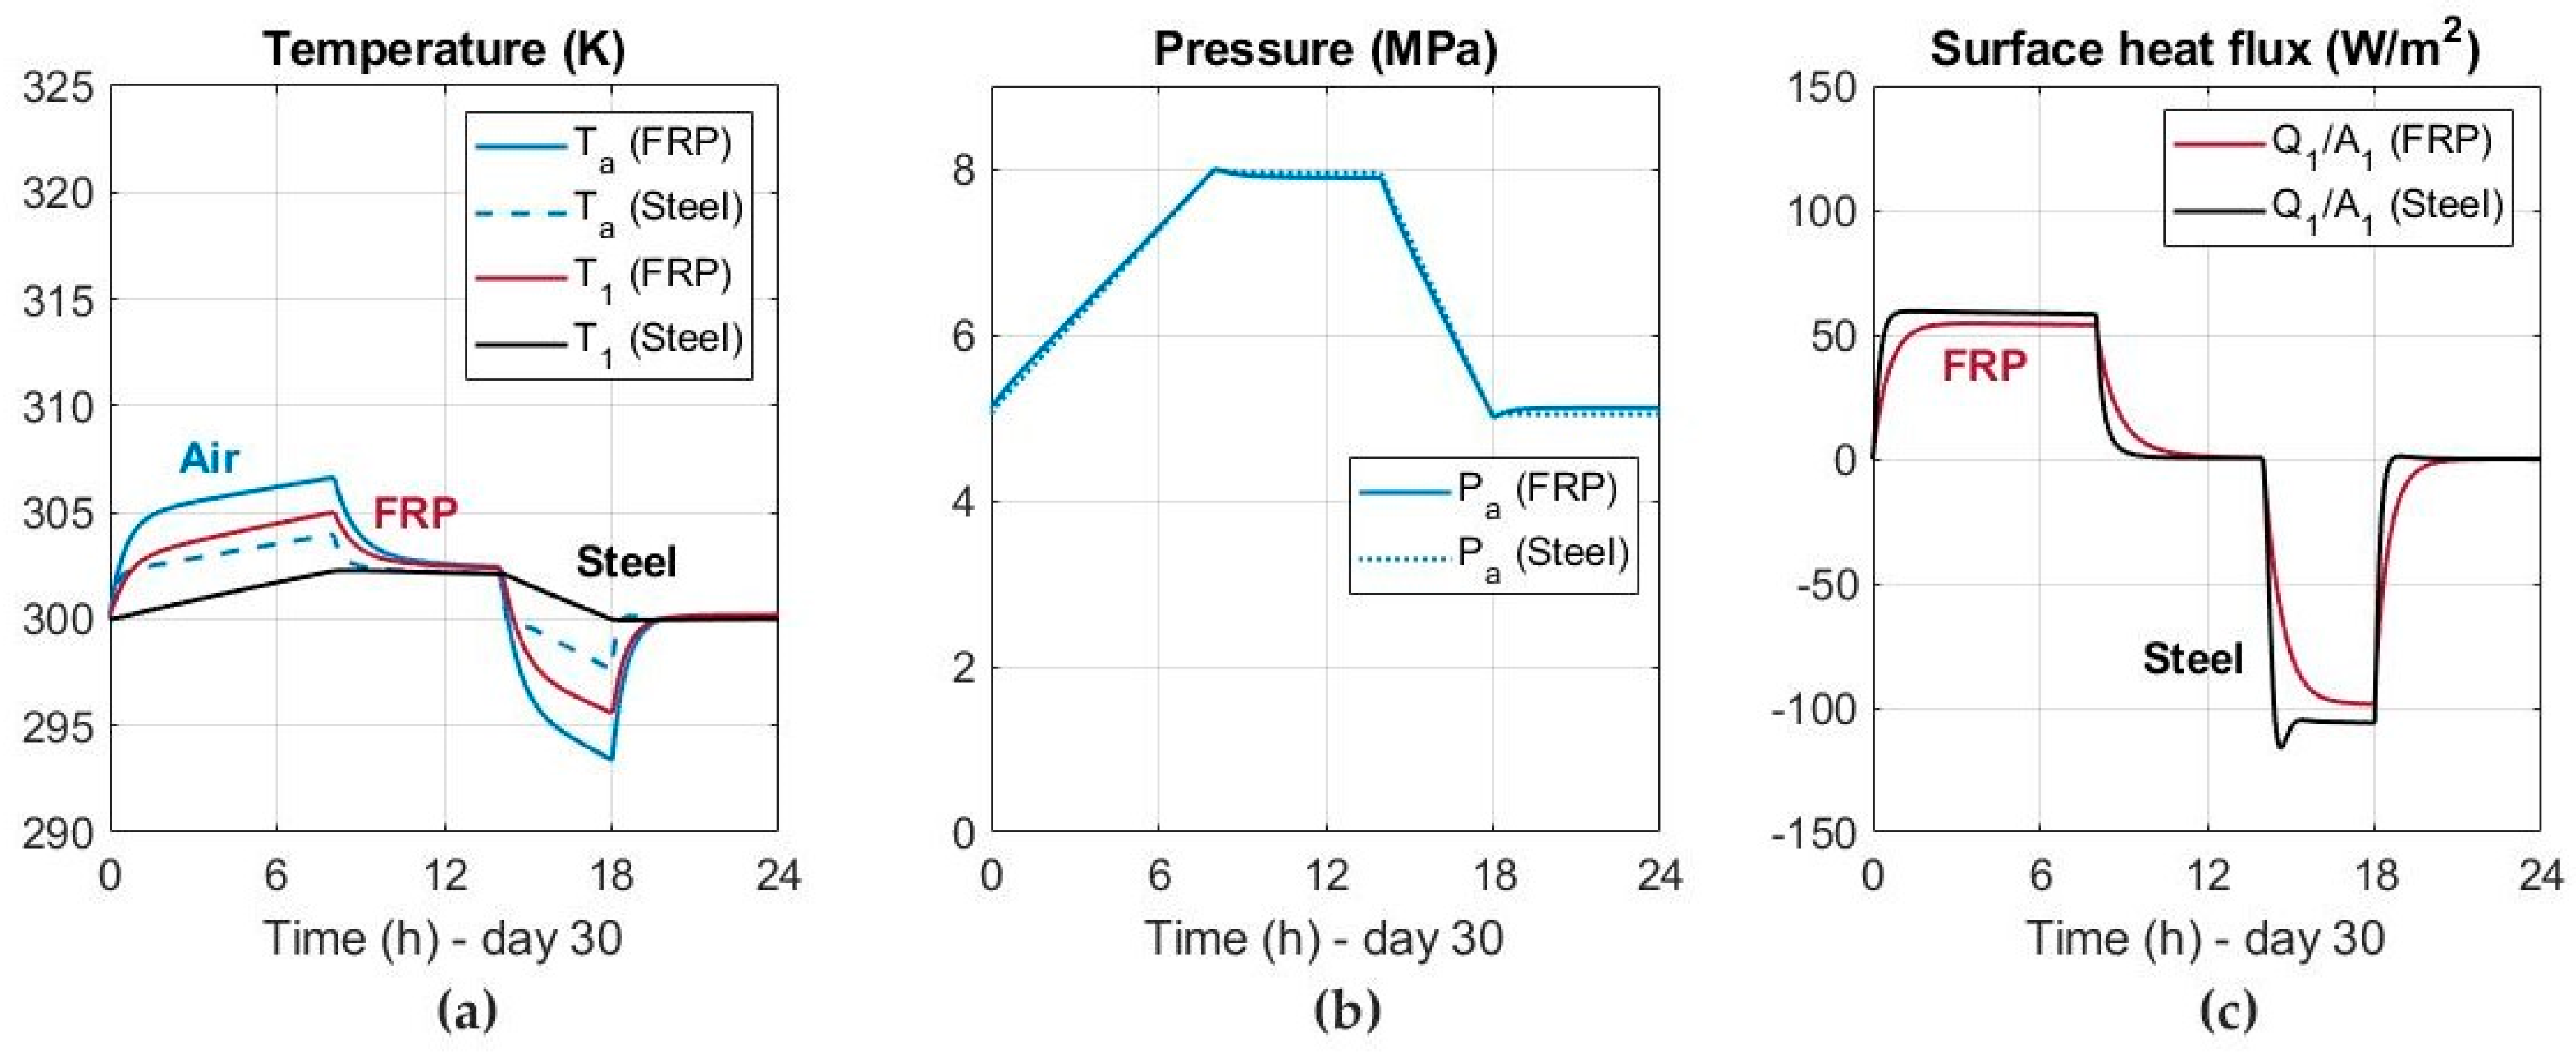
3.3. Comparative Analysis

A comparative analysis between the analytical and numerical models have been carried out. Air mass flow rates of 50 kg s−1 and −75 kg s−1 were also considered in the analytical model to carry out the comparative study. As indicated previously, although both analytical and numerical models use the same model geometry, the air mass flow rates of the numerical model are higher to reduce the computational time. Figure 14 shows a comparative analysis for five cycles between analytical and CFD results using FRP as sealing layer. A comparison between FRP and steel is shown afterwards in Figure 15 for one cycle. The obtained heat transfer coefficient is also indicated in Figure 15b. In general, good agreements have been obtained between both analytical and numerical simulations.
To justify the accuracy of the simulations, the results obtained in the analytical model have been compared with experimental and numerical models. Figure 16 shows the comparison of results obtained for air temperature (Figure 16a) and pressure (Figure 16b) during the first cycle with an experimental model developed by Jiang et al. [24]. Dot points, corresponding to the experimental values, are compared with the results obtained in solid blue lines in Figure 16. In addition, Figure 17 shows the comparison of results obtained for air and wall temperatures (Figure 17a) and air pressure (Figure 17b) during the first cycle with a numerical model conducted by Zhou et al. [25]. The analytical model (solid lines) has been employed to reproduce the numerical model considered by Zhou et al. (dashed lines), reporting good accuracy as shown in Figure 17.

4. Conclusions

Analytical and numerical models were established to investigate the thermodynamic performance of an underground reservoir located in abandoned mines for A-CAES plants. Analyzing air temperature and pressure fluctuations during the operation time in A-CAES plants is essential to design the underground reservoir volume and the turbomachinery. Typical operating pressures from 5 to 8 MPa were considered in the air charging and discharging periods. A 20 mm thick sealing layer, 35 cm thick concrete lining and 2.5 m thick sandstone rock mass have been considered around the compressed air. In addition, FRP and steel have been employed as sealing layer. Unlike other research works, in which the heat transfer coefficient is considered constant during the operation time, in the present investigation a correlation based on both unsteady Reynolds and Rayleigh numbers is employed for the heat transfer coefficient.
The results obtained show greater variations in air temperature between the air compression and decompression when FRP is used as sealing layer. Thus, significant temperature variations in the sealing layer and only a 15 cm thickness of the concrete lining is affected by a temperature rise during operation when steel is employed as sealing layer. The volume of concrete affected is reduced when FRP is used as sealing layer around the fluid. Regarding the sandstone rock mass, no temperature fluctuation was observed in the simulations. In addition, the heat flux increases and the air temperature within the reservoir is lower when steel is employed as sealing layer.
Finally, the thermal energy balance in the 30th cycle through the sealing layer considering air mass flow rates of 0.22 and −0.45 kg s−1 reached 25.27 and 20.48 kWh for FRP and steel, respectively. In general, good agreements were obtained between analytical and numerical simulations. Unlike a 1D analytical model, in the 3D CFD numerical model it is possible to analyze the distribution of the thermodynamic responses in the entire domain, assuming a significant advantage to design the reservoir.

Author Contributions

Conceptualization, L.Á.d.P., J.M., A.B.-S., and J.M.F.-O.; Methodology, L.Á.d.P., J.M., and J.M.F.-O.; Software, L.Á.d.P., J.M., M.G., and J.M.F.-O.; Investigation, L.Á.d.P., J.M., M.G., A.B.-S., and J.M.F.-O.; Validation, J.M., M.G., and J.F-O; Writing—original draft preparation, L.Á.d.P., J.M., and J.M.F.-O.; Writing—review and editing, J.M., M.G., A.B.-S., and J.M.F.-O.; Visualization, J.M.F.-O. and J.L.; Supervision, A.B.-S., J.L., and J.M.F.-O.; All authors have read and agreed to the published version of the manuscript.

Funding

This research received no external funding.

Institutional Review Board Statement

N/A.

Informed Consent Statement

N/A.

Conflicts of Interest

The authors declare no conflict of interest.

Nomenclature

A1Contact surface between air-sealing layer (m2)
A2Contact surface between sealing layer-concrete (m2)
A3Contact surface between concrete-sandstone (m2)
A4Contact surface between sandstone-exterior (m2)
CpcSpecific heat at constant pressure for concrete (J kg−1 K−1)
CpsSpecific heat at constant pressure for the sealing layer (J kg−1 K−1)
Cpss Specific heat at constant pressure for sandstone layer (J kg−1 K−1)
Cv Specific heat at constant volume (J kg−1 K−1)
eSpecific energy (J kg−1)
gGravity acceleration (m s−2)
hHeat transfer coefficient (W m−2 K−1)
KcThermal conductivity of sealing layer (W m−1 K−1)
KsThermal conductivity of sealing layer (W m−1 K−1)
KssThermal conductivity of sandstone (W m−1 K−1)
LTunnel length (m)
Air mass flow rate in the charge period (kg s−1)
outAir mass flow rate in the discharge period (kg s−1)
NuNusselt number (-)
PaAir pressure (MPa)
PcAir pressure at critical conditions (MPa)
Q ˙ Surface heat transfer (W m−2)
r1Equivalent radius of sealing layer (m)
r2Equivalent radius of concrete lining (m)
r3Equivalent radius of sandstone (m)
r4Equivalent radius of external walls (m)
RaRayleigh number (-)
ReReynolds number (-)
STunnel cross section (m2)
tTime (s)
T1Temperature on the sealing layer wall (K)
T2Temperature on the concrete lining wall (K)
T3Temperature on the sandstone rock mass wall (K)
T4External temperature (K)
TaAir temperature (K)
TcAir temperature at critical conditions (K)
UcConcrete transmittance (W K−1)
UhConvection transmittance (W m−2 K−1)
UsSealing layer transmittance (W K−1)
UssSandstone transmittance (W K−1)
vAir velocity (m s−1)
W   ˙ Net work (W)
VTunnel volume (m3)
ZCompressibility factor (-)
β Volumetric thermal expansion coefficient
μDynamic viscosity (kg m−1 s−1)
ρaAir density (kg m−3)

References

  1. Gallo, A.; Simões-Moreira, J.; Costa, H.; Santos, M.; Dos Santos, E.M. Energy storage in the energy transition context: A technology review. Renew. Sustain. Energy Rev. 2016, 65, 800–822. [Google Scholar] [CrossRef]
  2. Luo, X.; Wang, J.; Dooner, M.; Clarke, J. Overview of current development in electrical energy storage technologies and the application potential in power system operation. Appl. Energy 2015, 137, 511–536. [Google Scholar] [CrossRef] [Green Version]
  3. Wang, J.; Lu, K.; Ma, L.; Wang, J.; Dooner, M.; Miao, S.; Li, J.; Wang, D. Overview of Compressed Air Energy Storage and Technology Development. Energies 2017, 10, 991. [Google Scholar] [CrossRef] [Green Version]
  4. Sameer, H.; Johannes, L. A review of large-scale electrical energy storage. Int. J. Energy Storage 2015, 39, 1179–1195. [Google Scholar]
  5. Pujades, E.; Willems, T.; Bodeux, S.; Orban, P.; Dassargues, A. Underground Pumped Storage Hydroelectricity Using Aban-doned Works (Deep Mines or Open Pits) and the Impact on Groundwater Flow. Hydrogeol. J. 2016, 24, 1531–1546. [Google Scholar] [CrossRef] [Green Version]
  6. Menéndez, J.; Loredo, J.; Galdo, M.; Fernández-Oro, J.M. Energy storage in underground coal mines in NW Spain: Assessment of an underground lower water reservoir and preliminary energy balance. Renew. Energy 2019, 134, 1381–1391. [Google Scholar] [CrossRef]
  7. Lutyński, M. An overview of potential benefits and limitations of Compressed Air Energy Storage in abandoned coal mines. IOP Conf. Ser. Mater. Sci. Eng. 2017, 268, 012006. [Google Scholar] [CrossRef]
  8. Menéndez, J.; Fernández-Oro, J.M.; Loredo, J. Economic Feasibility of Underground Pumped Storage Hydropower Plants Providing Ancillary Services. Appl. Sci. 2020, 10, 3947. [Google Scholar] [CrossRef]
  9. Menéndez, J.; Ordóñez, A.; Álvarez, R.; Loredo, J. Energy from closed mines: Underground energy storage and geothermal applications. Renew. Sustain. Energy Rev. 2019, 108, 498–512. [Google Scholar] [CrossRef]
  10. Menéndez, J.; Schmidt, F.; Konietzky, H.; Fernández-Oro, J.M.; Galdo, M.; Loredo, J.; Díaz-Aguado, M.B. Stability analysis of the underground infrastructure for pumped storage hydropower plants in closed coal mines. Tunn. Undergr. Space Technol. 2019, 94, 103117. [Google Scholar] [CrossRef]
  11. Menéndez, J.; Schmidt, F.; Konietzky, H.; Sánchez, A.B.; Loredo, J. Empirical Analysis and Geomechanical Modelling of an Underground Water Reservoir for Hydroelectric Power Plants. Appl. Sci. 2020, 10, 5853. [Google Scholar] [CrossRef]
  12. Winde, F.; Kaiser, F.; Erasmus, E. Exploring the use of deep level gold mines in South Africa for underground pumped hy-droelectric energy storage schemes. Renew. Sustain. Energy Rev. 2016, 78, 668–682. [Google Scholar] [CrossRef]
  13. Menéndez, J.; Fernández-Oro, J.M.; Galdo, M.; Loredo, J. Efficiency analysis of underground pumped storage hydropower plants. J. Energy Storage 2020, 28, 101234. [Google Scholar] [CrossRef]
  14. Odukomaiya, A.; Abu-Heiba, A.; Gluesenkamp, K.R.; Abdelaziz, O.; Jackson, R.K.; Daniel, C.; Graham, S.; Momen, A.M. Thermal analysis of near-isothermal compressed gas energy storage system. Appl. Energy 2016, 179, 948–960. [Google Scholar] [CrossRef]
  15. Tola, V.; Meloni, V.; Spadaccini, F.; Cau, G. Performance assessment of Adiabatic Compressed Air Energy Storage (A-CAES) power plants integrated with packed-bed thermocline storage systems. Energy Convers. Manag. 2017, 151, 343–356. [Google Scholar] [CrossRef]
  16. Liu, J.L.; Wang, J.H. A comparative research of two adiabatic compressed air energy storage systems. Energy Convers. Manag. 2016, 108, 566–578. [Google Scholar] [CrossRef]
  17. Yang, K.; Zhang, Y.; Li, X.; Xu, J. Theoretical evaluation on the impact of heat exchanger in Advanced Adiabatic Compressed Air Energy Storage system. Energy Convers. Manag. 2014, 86, 1031–1044. [Google Scholar] [CrossRef]
  18. Kushnir, R.; Dayan, A.; Ullmann, A. Temperature and pressure variations within compressed air energy storage caverns. Int. J. Heat Mass Transf. 2012, 55, 5616–5630. [Google Scholar] [CrossRef]
  19. Kushnir, R.; Ullmann, A.; Dayan, A. Thermodynamic Models for the Temperature and Pressure Variations Within Adiabatic Caverns of Compressed Air Energy Storage Plants. J. Energy Resour. Technol. 2012, 134, 021901. [Google Scholar] [CrossRef]
  20. Safaei, H.; Aziz, M.J. Thermodynamic Analysis of Three Compressed Air Energy Storage Systems: Conventional, Adiabatic, and Hydrogen-Fueled. Energies 2017, 10, 1020. [Google Scholar] [CrossRef] [Green Version]
  21. Geissbühler, L.; Becattini, V.; Zanganeh, G.; Zavattoni, S.; Barbato, M.; Haselbacher, A.; Steinfeld, A. Pilot-scale demonstration of advanced adiabatic compressed air energy storage, Part 1: Plant description and tests with sensible thermal-energy storage. J. Energy Storage 2018, 17, 129–139. [Google Scholar] [CrossRef]
  22. Becattini, V.; Geissbühler, L.; Zanganeh, G.; Haselbacher, A.; Steinfeld, A. Pilot-scale demonstration of advanced adiabatic compressed air energy storage, Part 2: Tests with combined sensible/latent thermal-energy storage. J. Energy Storage 2018, 17, 140–152. [Google Scholar] [CrossRef]
  23. Schmidt, F.; Menéndez, J.; Konietzky, H.; Pascual-Muñoz, P.; Castro, J.; Loredo, J.; Sánchez, A.B. Converting closed mines into giant batteries: Effects of cyclic loading on the geomechanical performance of underground compressed air energy storage systems. J. Energy Storage 2020, 32, 101882. [Google Scholar] [CrossRef]
  24. Jiang, Z.; Li, P.; Tang, D.; Zhao, H.; Li, Y. Experimental and Numerical Investigations of Small-Scale Lined Rock Cavern at Shallow Depth for Compressed Air Energy Storage. Rock Mech. Rock Eng. 2020, 53, 2671–2683. [Google Scholar] [CrossRef]
  25. Zhou, S.-W.; Xia, C.-C.; Zhao, H.-B.; Mei, S.-H.; Zhou, Y. Numerical simulation for the coupled thermo-mechanical performance of a lined rock cavern for underground compressed air energy storage. J. Geophys. Eng. 2017, 14, 1382–1398. [Google Scholar] [CrossRef]
  26. Zhou, S.-W.; Xia, C.-C.; Du, S.-G.; Zhang, P.-Y.; Zhou, Y. An Analytical Solution for Mechanical Responses Induced by Temperature and Air Pressure in a Lined Rock Cavern for Underground Compressed Air Energy Storage. Rock Mech. Rock Eng. 2014, 48, 749–770. [Google Scholar] [CrossRef]
  27. Khaledi, K.; Mahmoudi, E.; Datcheva, M.; Schanz, T. Analysis of compressed air storage caverns in rock salt considering thermo-mechanical cyclic loading. Environ. Earth Sci. 2016, 75, 1–17. [Google Scholar] [CrossRef]
  28. Li, W.; Miao, X.; Yang, C. Failure analysis for gas storage salt cavern by thermo-mechanical modelling considering rock salt creep. J. Energy Storage 2020, 32, 102004. [Google Scholar] [CrossRef]
  29. Barbour, E.; Mignard, D.; Ding, Y.; Li, Y. Adiabatic Compressed Air Energy Storage with packed bed thermal energy storage. Appl. Energy 2015, 155, 804–815. [Google Scholar] [CrossRef] [Green Version]
  30. Rutqvist, J.; Kim, H.-M.; Ryu, D.-W.; Synn, J.-H.; Song, W.-K. Modeling of coupled thermodynamic and geomechanical per-formance of underground compressed air energy storage in lined rock caverns. Int. J. Rock Mech. Min. Sci. 2012, 52, 71–81. [Google Scholar] [CrossRef]
  31. Deng, K.; Zhang, K.; Xue, X.; Zhou, H. Design of a New Compressed Air Energy Storage System with Constant Gas Pressure and Temperature for Application in Coal Mine Roadways. Energies 2019, 12, 4188. [Google Scholar] [CrossRef] [Green Version]
  32. Woodfield, P.L.; Monde, M.; Mitsutake, Y. Measurement of Averaged Heat Transfer Coefficients in High-Pressure Vessel during Charging with Hydrogen, Nitrogen or Argon Gas. J. Therm. Sci. Technol. 2007, 2, 180–191. [Google Scholar] [CrossRef] [Green Version]
  33. Heath, M.; Woodfield, P.L.; Hall, W.; Monde, M. An experimental investigation of convection heat transfer during filling of a composite-fibre pressure vessel at low Reynolds number. Exp. Therm. Fluid Sci. 2014, 54, 151–157. [Google Scholar] [CrossRef] [Green Version]
Figure 1. Schematic diagram of compressed air energy storage (CAES) system in abandoned underground mines. Compressor and turbine facilities installed on the surface and underground compressed air reservoir with an operating pressure range from 5 to 8 MPa.
Applsci 11 02573 g001
Figure 2. Scheme of the deep tunnel with a sealing layer, concrete lining and sandstone rock mass. (a) 3D model (not to scale); (b) Cross section.
Applsci 11 02573 g002
Figure 3. Computational domain. Mesh and boundary conditions used in CFD simulations.
Applsci 11 02573 g003
Figure 4. Temperature of air, fiber-reinforced plastic (FRP) and concrete lining for 30 charging and discharging cycles considering FRP as sealing layer. (a) First cycle; (b) 30 days of operation; (c) 30th cycle.
Applsci 11 02573 g004
Figure 5. Air pressure for 30 charging and discharging cycles considering FRP as sealing layer. (a) First cycle; (b) 30 days of operation; (c) 30th cycle.
Applsci 11 02573 g005
Figure 6. Surface heat flux of FRP and concrete lining for 30 charging and discharging cycles considering FRP as sealing layer. (a) First day; (b) 30 days of operation; (c) 30th cycle.
Applsci 11 02573 g006
Figure 7. Comparative analysis between FRP and steel in the first cycle. (a) Temperature of air, FRP and steel; (b) Air pressure; (c) Surface heat flux of FRP and steel.
Applsci 11 02573 g007
Figure 8. Comparative analysis between FRP and steel in the 30th cycle. (a) Temperature of air, FRP and steel; (b) Air pressure; (c) Surface heat flux of FRP and steel.
Applsci 11 02573 g008
Figure 9. Numerical model results for 5 charging and discharging cycles considering FRP as sealing layer. (a) Temperature of air, FRP and concrete lining; (b) Air pressure; (c) Surface heat flux of FRP and concrete lining.
Applsci 11 02573 g009
Figure 10. Numerical model results for 5 charging and discharging cycles considering steel as sealing layer. (a) Temperature of air, steel and concrete lining; (b) Air pressure; (c) Surface heat flux of steel and concrete lining.
Applsci 11 02573 g010
Figure 11. Numerical model results in the first cycle at 5 MPa (decompression). Distribution of air temperature within the reservoir and temperature detail in the FRP and concrete.
Applsci 11 02573 g011
Figure 12. Numerical model results in the first cycle at 5 MPa (decompression). Distribution of air temperature within the reservoir and temperature detail in the steel and concrete.
Applsci 11 02573 g012
Figure 13. Numerical model results. Distribution of surface heat flux for FRP and steel in the first cycle at a pressure of 8 MPa in the contact surface air-sealing layer.
Applsci 11 02573 g013
Figure 14. Comparative analysis between analytical and numerical models for 5 charging and discharging cycles considering FRP as sealing layer. (a) Temperature of air and FRP; (b) Air pressure; (c) Surface heat flux of FRP and concrete lining.
Applsci 11 02573 g014
Figure 15. Comparative analysis between analytical and numerical models in the first cycle considering FRP and steel as sealing layers. (a) Air temperature; (b) Heat transfer coefficient; (c) Surface heat flux.
Applsci 11 02573 g015
Figure 16. Comparison of results obtained during the first cycle with an experimental model developed by Jiang et al. [24]. (a) Air temperature; (b) Air pressure.
Applsci 11 02573 g016
Figure 17. Comparison of results obtained during the first cycle with a numerical model conducted by Zhou et al. [25]. (a) Air and wall temperatures; (b) Air pressure.
Applsci 11 02573 g017
Table 1. Thermal properties and volume of air, concrete, sealing layers and sandstone rock mass.
MaterialSpecific Heat
(J kg−1 K−1)
Thermal Conductivity
(W m−1 K−1)
Volume
(m3)
Density
KN m−3
Air10060.0242200.530.0117
Reinforced concrete10001.60195.2623
Sandstone 7115.00260525
Sealing layer (FRP)3840.407.248.82
Sealing layer (Steel)500457.2476.5
Table 2. Mesh sensitivity analysis.
Mesh Cells
×106
Thermal Energy
(kWh)
Error
(%)
Computational Time (h)
1.4453.967.1456
2.0156.762.3378
2.6957.720.68116
3.4758.11-147
Publisher’s Note: MDPI stays neutral with regard to jurisdictional claims in published maps and institutional affiliations.

