
Trends towards Coordination between Grain Production and Economic Development in China


1
School of Geography and Environment, Jiangxi Normal University, Nanchang 330028, China
2
School of Special Education, Yuzhang Normal University, Nanchang 330103, China
3
Key Lab of Poyang Lake Wetland and Watershed Research of Ministry of Education, School of Geography and Environment, Jiangxi Normal University, Nanchang 330028, China
4
College of City Construction, Jiangxi Normal University, Nanchang 330022, China
*
Author to whom correspondence should be addressed.
Agriculture 2021, 11(10), 975; https://doi.org/10.3390/agriculture11100975
Submission received: 7 September 2021
/
Revised: 28 September 2021
/
Accepted: 6 October 2021
/
Published: 8 October 2021
(This article belongs to the Special Issue Agricultural Policy, Food Security, and Rural Development: Innovations and Perspectives)
Abstract
:Accurately understanding the relationship between grain production and economic development is of great practical significance for ensuring national food security and coordinating inter-regional economic development. Using 2012 counties as research units, we analyzed the spatial coordination between grain production and economic development in China using the coupling of grain and economy (CGE) index, as well as the curve of gravity center and thematic map series methods based on statistical data from counties between 2000–2017. The results showed that: (1) Grain production was weakly coordinated with the economic development in China; but this coordination was enhanced. (2) China’s conversion between various types of grain production and economic development mainly occurred in the central and western regions, which are characterized by a much higher grain agglomeration level than the economic agglomeration level. (3) The northeastern region was prone to the grain agglomeration, the central and western regions were characterized by a grain-economy balance and the eastern region was dominated by economic agglomeration. (4) The increase of China’s CGE gradually increased from the southwest to northeast. Therefore, we proposed that the government should pay more attention to grain circulation in the eastern region and main grain-producing areas in central region should develop an accurate benefit compensation system, support leading grain processing enterprises and implement cultivated land protection policies in order to ensure national food security.
1. Introduction
Grain production is closely related to economic development [1]. As a basic necessity human survival, grain provides the material basis for regional economic development. Meanwhile, economic development provides material support for grain production. With the elevation of their economic level, countries tend to strengthen financial support for agricultural production and to further stabilize the production of grain [2,3,4]. However, there are many problems that threaten grain production and agricultural development, such as urban expansion occupied cultivated land, famers’ non-agricultural employment, low agricultural efficiency and a rural economic recession brought by economic development, have gradually emerged. Therefore, improving research on the relationship between grain production and economic development can help ensure food security and promote coordinated economic development among regions.
Grain production and economic development have almost always been incompatible in terms of process of industrialization and urbanization both in developed and developing countries. Some countries have quickly adjusted their development strategies. Through policies of agricultural and rural land reform, Japan has adopted a fully cooperative land-saving strategy and it has invested a large amount of capital and technology. This was done in order to ensure that agriculture can keep pace with economic development, with a ratio of agricultural employment income to income from other industries of only 1.1 [5]. The Netherlands has also made great efforts to develop agriculture by strengthening various forms of support including policy, technology and industry. According to the European Commission data, the farmers’ income reached €60k in 2017 in Netherlands. However, there are also countries with inconsistencies between agricultural production and economic development. For example, although the agriculture is developed in Argentina, poverty in rural areas is severe, with 29.9% of the poor population living there [6], which leads to a severe imbalance between agricultural production and economic development.
This kind of imbalance also exists in China [7,8]. In the past 70 years, China’s grain production has made great strides, with total grain yields increasing from 113.18 million tons in 1949 to 663.84 million tons in 2019. During this period, China experienced unprecedented economic development, especially over the last 40 years since the reform and opening up of the national economy, which has since enjoyed sustainable and rapid growth. The annual average economic growth rate was 9.4% during the period between 1979–2018, which was much higher than that for the world economy during the same period (about 2.9%). However, the conflict between grain production and economic development was increasingly prominent in China, with the two following different trajectories. On the one hand, economic development in grain-producing regions was slow and some major grain-producing counties were caught in a situation in which economic development was poor despite increasing grain yield in successive years [7]. In 2017, a total of 105 of the 800 major grain-producing Chinese counties were listed as poverty-stricken in terms of the national-level standard. On the other hand, grain production was declining in areas of economic agglomeration. With rapid economic development, a large quantity of cultivated land was transformed into non-agricultural land at an accelerating rate [9,10]. Between 1992–2015, urban expansion completely occupied 33,100 km2 of high-quality and high-yield cultivated land, leading to a reduction in grain production by 12.45 million tons [11,12]. In addition, agricultural returns have declined in comparative terms and much of the agricultural labor force migrated into non-agricultural industries. These two phenomena were especially evident in some economically developed main grain-producing regions [13,14]. The most recent 20 years witnessed a continuous decline in the level of grain commercialization and the problem of economic development impeding grain production has increasingly taken hold even in the main grain-producing regions of China [8]. This shows that the concentration of grain production and the agglomeration of economic development in China are in spatial conflict.
Why do economies and industries agglomerate or diverge in particular regions? Fujita, Krugman, Venables [15,16] and other scholars have succeeded in modeling increasing returns with respect to scale and imperfectly competitive market structures. They have proposed a “Core-periphery Model” to explain the agglomeration. This research has led to a boom in terms of interest in spatial economics. Subsequent studies have shown that the impacts of vertical spaces upstream and downstream of industries [17], infrastructure [18], government actions [19], market potential and incremental returns to scale [20] and traffic costs [21] on industrial agglomeration. Due to the cumulative circular effect and industrial linkage effect, economic center and urban center eventually be formed. Economic growth attracts the transfer of production factors to core area [22]. To a certain extent, these make socioeconomic development spatially polarized.
This kind of agglomeration and differentiation is also reflected in the process of grain production and economic development in China. China’s grain production has transformed since the 1990s and the focus of grain yield growth has trended northward and westward [23,24]. Meanwhile, the distributional pattern of economic development has shifted in a southeast direction. The differences and divergences in terms of economic development level have evolved from a northeast-to-southwest direction into a coastal-inland pattern and the current southeast-northwest direction [25,26]. Interregional and urban-rural gaps are still expanding. However, the spatial relation between grain production and economic development has rarely been discussed [7,27,28]. Studies have shown that it has been difficult to synchronize China’s grain production and economic development but their conclusions regarding trends in terms of variation are still controversial [28,29]. For instance, some studies conclude that the main grain-producing regions with higher grain yields have fewer fiscal revenue sources. Grain production and economic development are spatially unmatched, which suggests a strengthening trend [8]. Nevertheless, some studies have pointed out that both the coordination of grain production relative to finance and income have improved [30].
The present research provides in-depth theoretical analysis and practical verification on economic agglomeration and economic polarization and examined the relationship between grain production and economic development in China. However, the spatial pattern of grain and economic agglomeration simultaneously are less well known [31]. Given this situation, our study is based on grain production and economic data at the scale of Chinese counties between 2000–2017. Our analytical method involving geographic concentration was used to establish an index of the coupling of grain and economy (CGE) with the goal of revealing the spatial coordination between China’s grain production and economic development at the county level. We tried to address the following questions: (1) Is grain production coordinated with its economic development? What is the extent of this coordination in China? (2) How is the coordination between grain production and economic development changing spatially? In addition, the causes of the formation and change of this coordination have been explained and pertinent policy suggestions have been proposed.
2. Materials and Methods
2.1. Data Sources and Processing
The data used in this paper are derived from the Socioeconomic Statistical Yearbook of Chinese Counties (Cities), the provincial (municipal and autonomous region-level) statistical yearbooks and the county-level (city-level) statistical bulletin of the national economy and social development during the period between 2000–2017. These sources include the total grain yields and gross domestic product (GDP) of the counties (cities). Using the county-level administrative regions as the research units, the administrative division in 2010 was taken as the benchmark and the county-level units for other years were corrected. After the counties without statistical data were excluded, a total of 2012 effective statistical units were acquired, not including Taiwan, Hong Kong and Macao.
2.2. Research Methods
2.2.1. Geographic Concentration and CGE Index
In order to analyze the spatial deviation or correlation between grain yield and economic development level, the spatial consistency coefficient of population and economy was referenced [8,32] and the ratio of the geographic concentration of grain to economic concentration—namely, the CGE index—was used to measure the relationship between grain yield and economic development level. The CGE index was calculated as follows:
where is the CGE index of the region and and stand for the geographic concentration of grain and economic geographic concentration in the region . , and represent the grain yield, GDP and national territorial area in region , respectively.
In terms of grain production and economic development, the CGE value represents the relationship between the geographic concentration of grain production and the economic geographic concentration; that is, the relationship between grain agglomeration level and economic agglomeration level for a particular region. The grain agglomeration here means grain production is concentrated distribution in a region. The more the CGE value deviates from 1, the lower the degree of matching between regional grain production and economic development, with the opposite indicating a greater degree of balance. A higher value indicates a greater geographic concentration of grain production than economic geographic concentration, a relatively higher grain production level and a greater tendency for grain agglomeration. Conversely, if the regional economic development level is higher, there is a greater tendency toward economic agglomeration.
In order to facilitate the comparison between counties, related observations were made as a reference for dividing the Chinese counties into five types according to their CGE value [32]: When CGE ≤ 0.5, the regional grain agglomeration level was much lower than the economic agglomeration level and economic development was obviously favored (Type I). When 0.5 < CGE < 0.8, the regional grain agglomeration level was slightly lower than the economic agglomeration level, with a moderate economic development advantage and grain yields showed strong growth potential (Type II). When 0.8 ≤ CGE ≤ 1.2, the regional grain production level was basically coordinated with the economic development level (Type III). When 1.2 < CGE < 2.0, the regional grain agglomeration level was slightly higher than the economic agglomeration level, with a moderate favoring of grain production (Type IV). When CGE ≥ 2.0, the regional grain agglomeration level was much higher than the economic agglomeration level, with a major grain production advantage (Type V).
2.2.2. The Gravity Centers Curve and Thematic Map Series
The gravity centers curve is a spatial statistical approach used to describe the spatial agglomeration and distribution of geographic elements and their migration. This approach takes the average center of the spatial distribution of geographic elements as a gravity center, whose migration reflects the overall displacement characteristics of the geographic elements. In this paper, this method was used to construct the migration paths for the gravity centers for different levels of CGE change in China. The calculation formula is as follows:
where and are the barycentric coordinates for one distribution region of CGE change levels, and represent the coordinates of geographic center for the evaluation unit and is the change intensity of CGE index for the evaluation unit .
With reference to related research [33], the CGE index for China was divided into 16 levels. The graph layer was independently drawn for each level, thus forming the thematic map series for the CGE index, which contributed to a more detailed description of spatial patterning for the CGE index changes. Second, the gravity center for each level was generated and the gravity center curves for the CGE index changes were drawn based on their grading. In the end, points near one another on the curve were appropriately merged and the typological division was implemented according to the First Law of Geography (i.e., that everything is related to everything else but near things are more related than distant things) [34].
3. Results
3.1. Spatial Pattern of the Coordination between Grain Production and Economic Development in China
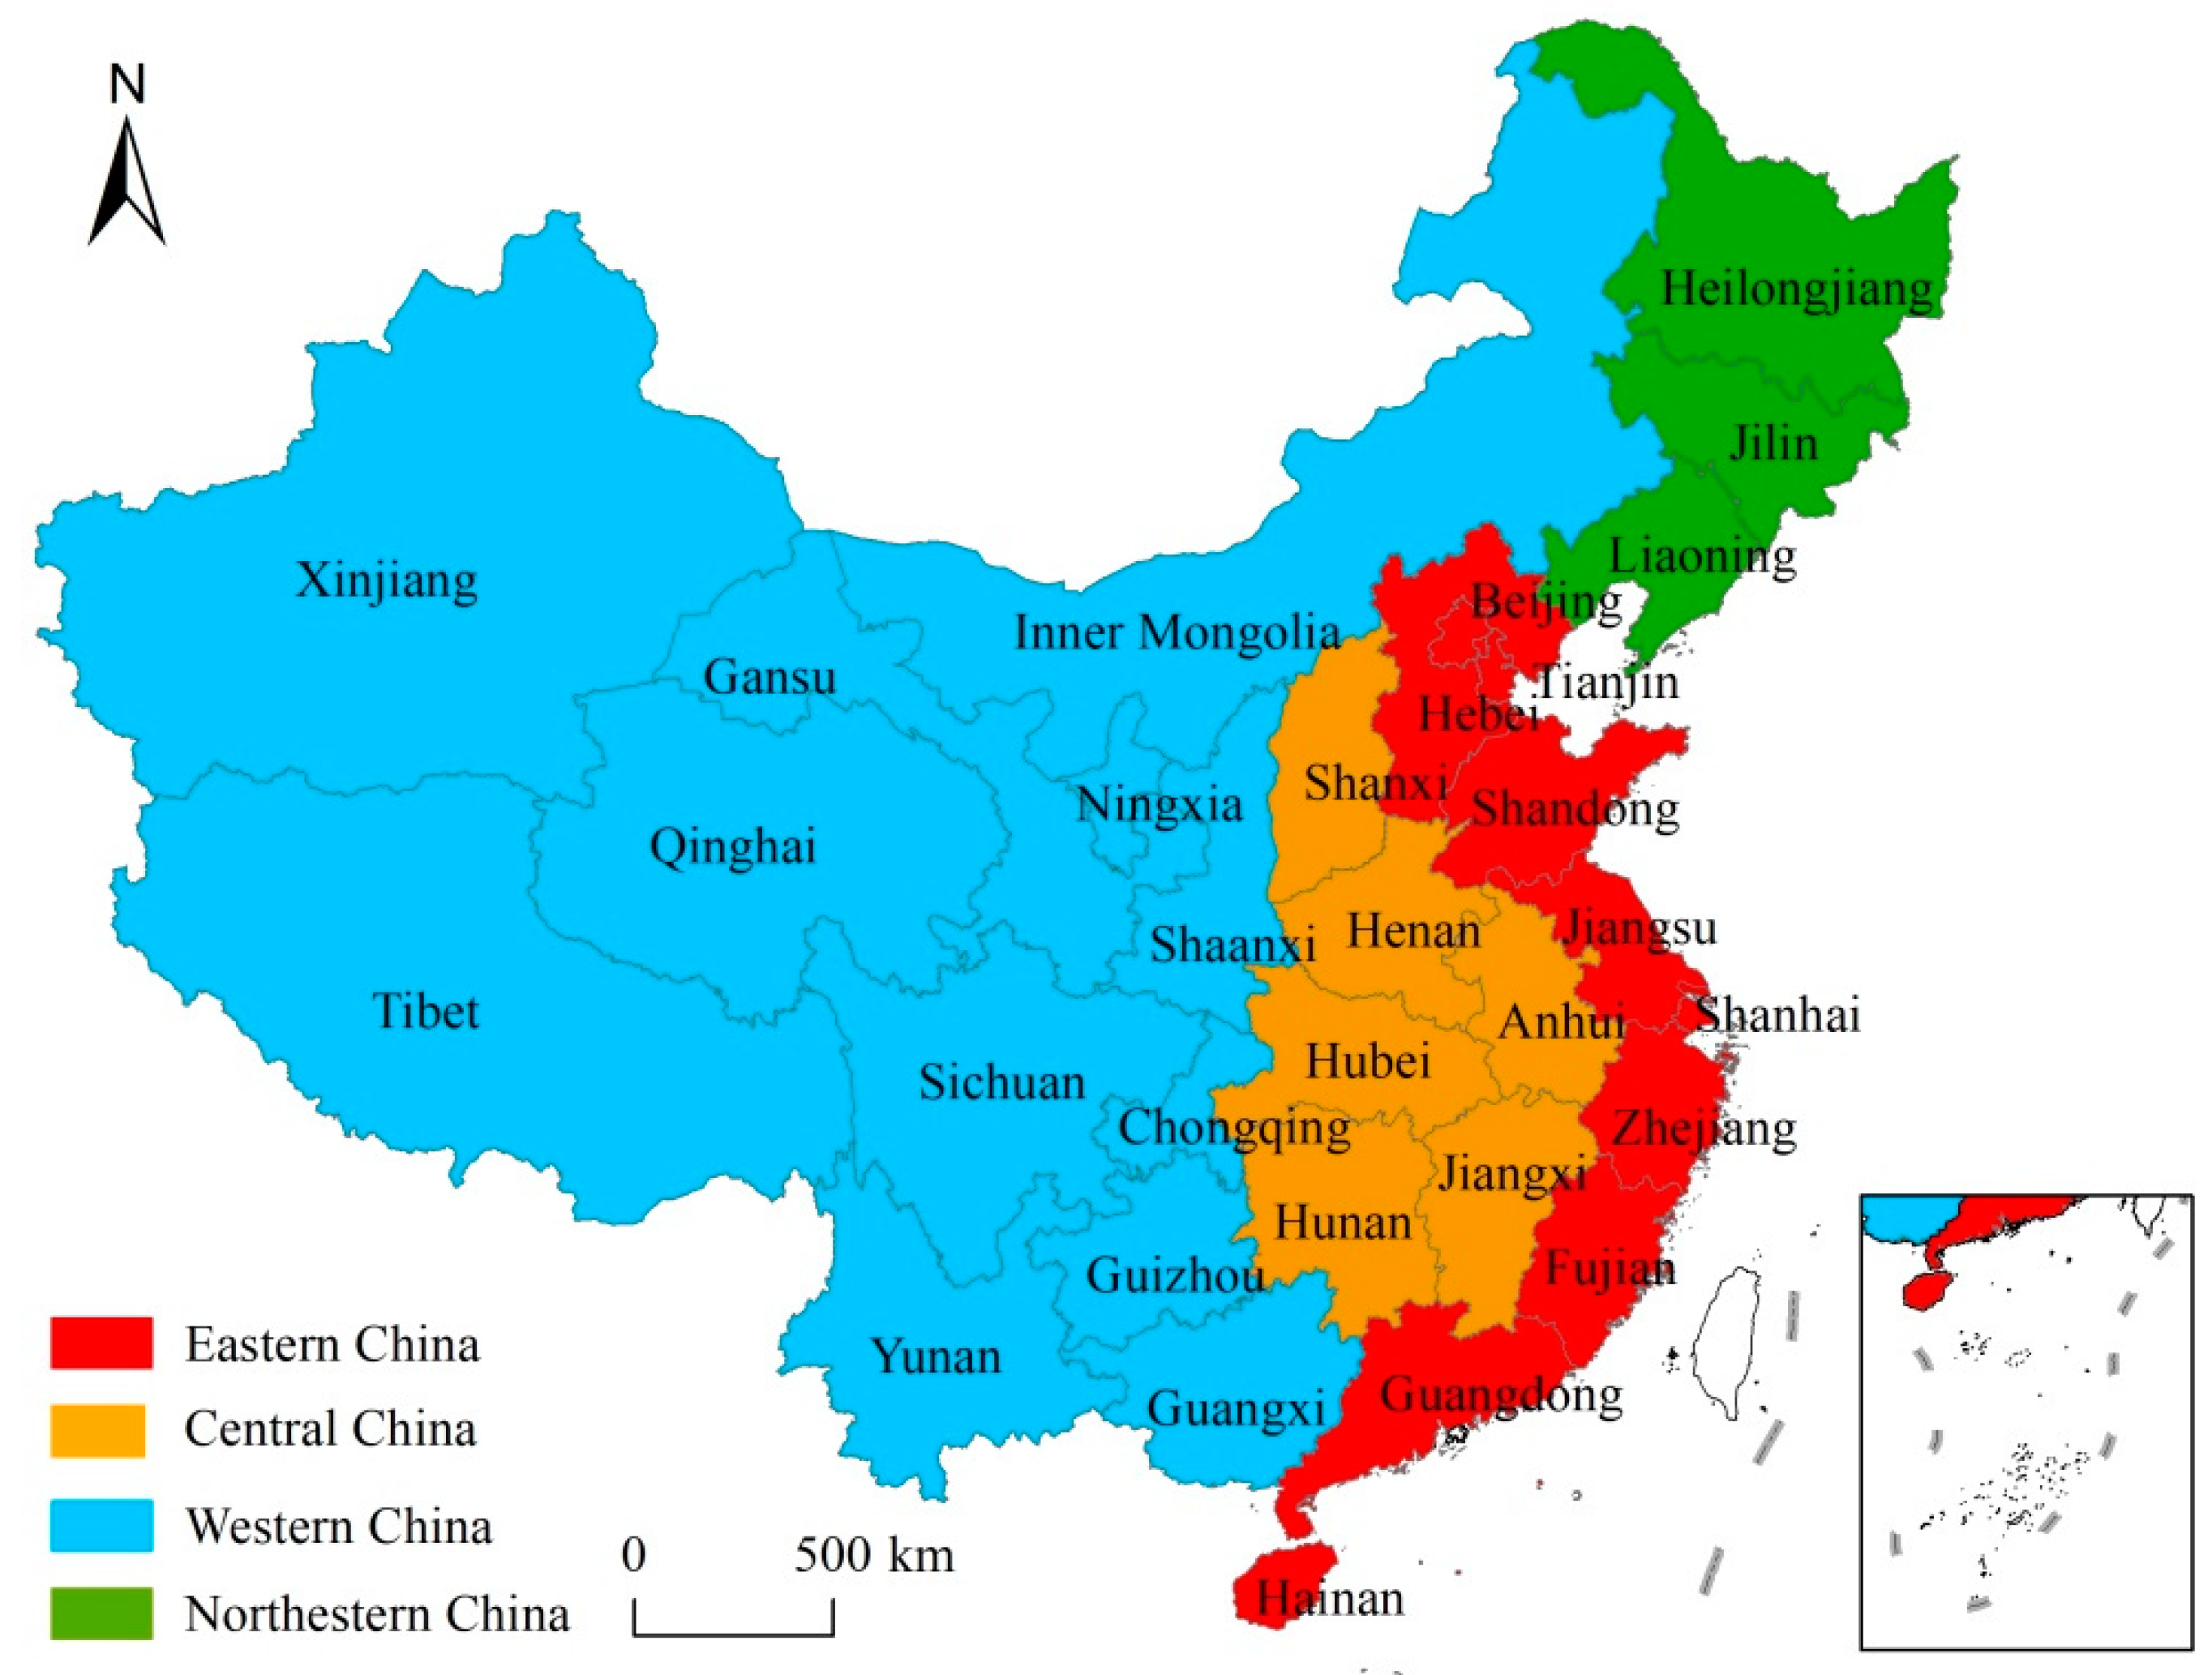
In order to analyze the spatial distribution laws for the different types of counties, the “four plates” proposed by the Research Center of for the Legal System of the State Council in 2005 was referenced in dividing China into four regions (Figure 1): the eastern region (Beijing, Tianjin, Shanghai, Hebei, Shandong, Jiangsu, Zhejiang, Fujian, Guangdong and Hainan), the central region (Shanxi, Henan, Anhui, Hunan, Hubei and Jiangxi), the western region (Inner Mongolia Autonomous Region, Shaanxi, Sichuan, Chongqing, Guizhou, Yunnan, Guangxi Zhuang Autonomous Region, Gansu, Qinghai, Tibet Autonomous Region, Ningxia Hui Autonomous Region and Xinjiang Uygur Autonomous Region) and the northeastern region (Heilongjiang, Jilin and Liaoning).
3.1.1. Coordination Types between Grain Production and Economic Development in 2000
In 2000, China’s grain production and economic development showed obvious weak coordination and the grain agglomeration level was higher than the economic agglomeration level (Table 1). To be more specific, grain production was relatively consistent with economic development in only 249 counties in 2000, accounting for 12.38% of the total number of counties nationwide. In contrast, a total of 1763 counties (87.62%) experienced inconsistencies between grain production and economic development. The grain agglomeration level was higher than the economic agglomeration level in 1441 (71.62%) of counties with inconsistent grain production and economic development. Most of these counties had a much higher grain agglomeration level than the economic agglomeration level. In addition, the grain agglomeration level was lower than the economic agglomeration level in 322 counties, accounting for 16.01% of the total number of counties.
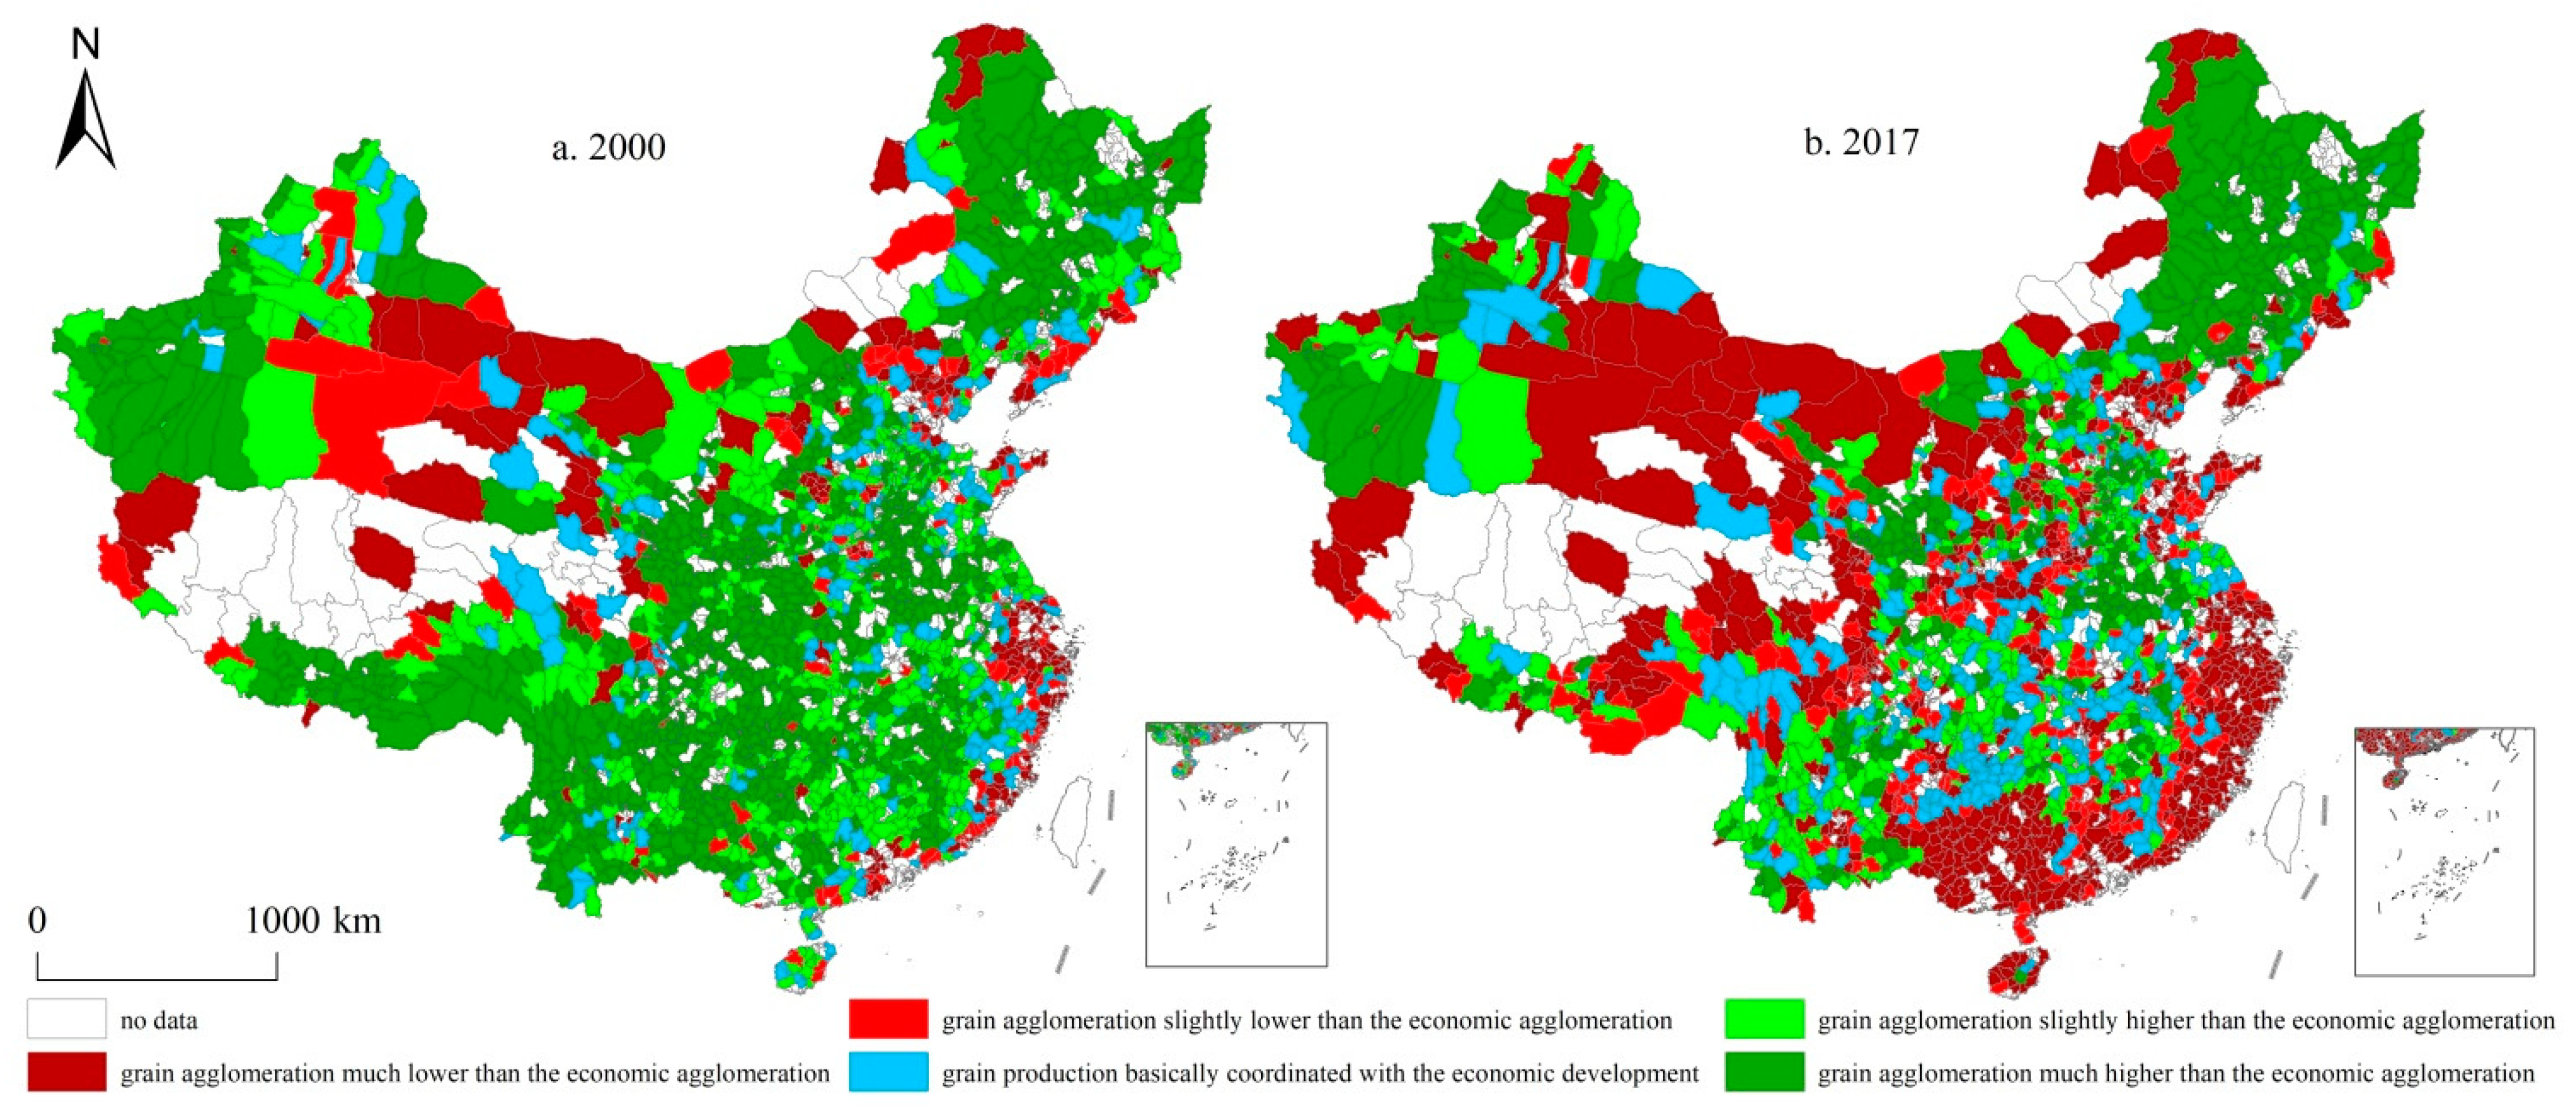
From the perspective of spatial distribution (Table 1, Figure 2a), the counties with mostly consistent grain production and economic development in 2000 had a dispersed distribution mainly in Shandong, Zhejiang and Fujian in the eastern region, on the border between Henan and Shanxi in the central region, in Liaoning in the northeast region and the north of Sichuan, Ningxia and Qinghai in the western region. Some of these counties were relatively underdeveloped traditional regions with major grain production. Others enjoyed relatively rapid economic development and steady grain production, with either the overall grain production or economic development either lagging behind or taking the lead. The grain agglomeration level was higher than the economic agglomeration level in the majority of Chinese counties, which were continuously distributed throughout most areas in the northeast, central and western regions in China. The counties with a significantly higher grain agglomeration level in comparison with their economic agglomeration level were concentrated in Heilongjiang and Jilin in the northeast region, Henan, Anhui, Jiangxi, Hubei and Hunan in the central region and in Guizhou, Yunnan, the east and south of Sichuan, Shaanxi, the southeast of Gansu and the northwest of Xinjiang in the western region. Most of the above-mentioned areas were the major grain-producing areas in China, where a long history of grain production, intensive cultivation experience, improved soil quality and abundant labor resources laid a strong foundation for grain agriculture [35]. For example, the CGE index in 11 out of the 65 counties in Heilongjiang Province was greater than 7. It even reached 17.05 in Fuyuan County, embodying the evident advantages in grain production. The counties with a grain agglomeration level lower than the economic agglomeration level were mainly distributed in Shanghai, Zhejiang, Fujian, Guangdong, Beijing and Tianjin in the eastern region, as well as the west of Inner Mongolia, the northwest of Gansu, the east of Xinjiang and Qinghai in the western region. The counties with a much lower grain production level relative to economic agglomeration level were concentrated in the southeastern coastal areas, which were economically developed, with a high level of urbanization and much greater economic development compared to grain production capacity. In Shengsi County, Zhejiang Province, for example, the CGE index was only 0.0017 in 2000 and the proportion of economic aggregate was over 580 times that of the grain yield, which demonstrates a low level of grain production relative to its economically developed background. In the west of Inner Mongolia, the northwest of Gansu, the east of Xinjiang and some areas in Qinghai, grain production was highly constrained by natural conditions and the economic level was higher relative to the fragile grain production. For example, the grain yield in 2000 was only 8320 tons in Golmud City, Qinghai Province, due to the climate of the inland plateau basin’s climate; namely, that it is cold, arid, windy and with steep terrain, along with other poor natural conditions for agricultural production. Comparatively speaking, benefiting from its abundant tourism resources, the GDP in this city reached RMB 1674.09 million in 2000, of which tertiary industry accounted for 40.7%. In this way, grain production evidently lagged behind economic development.
3.1.2. Coordination Types between Grain Production and Economic Development and their Spatial Distribution Laws in 2017
In 2017, an obviously weak coordination between China’s grain production and economic development was still present, but the coordination had improved for certain reasons and the grain agglomeration level was lower than the economic agglomeration level (Table 1). Specifically, grain production was basically consistent with the economic development in 344 counties, accounting for 17.10% of the total number of counties. In contrast, the inconsistent relationship between grain and economic agglomeration levels appeared in 1668 counties, accounting for 82.90% of the total number of counties. Among these, the grain agglomeration level was higher than the economic agglomeration level in 738 counties, accounting for 36.68% of the total number of counties. In addition, the grain agglomeration level was lower than the economic agglomeration level in 930 counties, making up a proportion of 46.62% of the total number of counties. Most of these counties had a grain agglomeration level much lower than the economic agglomeration level.
From the perspective of spatial patterning (Table 1, Figure 2b), the counties with basically consistent grain production and economic development in 2017 still maintained a dispersed distribution. However, they formed continuous patches in Hunan and Hubei in the central region, Guizhou, the west of Sichuan and the east of Tibet in the western region. The counties with a higher grain agglomeration level than economic agglomeration level were distributed in the northeastern region, Hebei, Henan, Anhui and Jiangxi in the central region and the southeast of Gansu and the northwest of Xinjiang in the western region. The scale of counties with a significantly higher grain agglomeration level than economic agglomeration level was narrowed to Heilongjiang and Jilin in the northeastern region, Henan and Anhui in the central region and the northwest of Xinjiang in the western region. The above-mentioned areas were mostly major grain-producing zones with high grain agglomeration levels and relatively under-developed economies. The counties with lower grain agglomeration levels relative to economic agglomeration level were mainly concentrated in the eastern coastal areas, Shanxi, Hubei and the center of Hunan in the central region and Guangxi, Inner Mongolia and the border between Gansu, Xinjiang and Qinghai in the western region. Especially in the Guangxi Zhuang Autonomous Region, the number of counties with a grain agglomeration level far lower than the economic agglomeration level increased from 2 in 2000 to 79 in 2017. Karst landforms are widely distributed in this province, with deep grooves and valleys crossing the territory, as well as basins alternating with hills, making the landscape complex. Moreover, this province is also extensively populated with carbonate rocks, leading to inadequate soil fertility, serious water loss and soil erosion and, consequently, relatively low grain yield [36]. According to these statistical data, Guangxi Province has vigorously developed its tourism industry and related tertiary industries in recent years, with the proportion of tertiary industry in GDP rising from 39.2% in 2005 to 44.2% in 2017. Meanwhile, the proportion of primary industry in GDP declined by 7.4%. Primary industry here is concentrated on the planting of commercial crops like vegetables, melons and fruits, tea plants and garden fruits. The grain yield in this province declined from 15.163 million tons in 2005 to 14.677 million tons in 2017. Sugarcane and vegetable yields grew from 51.547 million tons and 21.184 million tons in 2005 to 76.1169 million tons and 30.8685 million tons in 2017, respectively. The garden fruit yield increased sharply from 5.716 million tons in 2005 to 17.013 million tons in 2017, nearly doubling.
In summary, irrespective of whether it was in 2000 or 2017, the counties with lower grain agglomeration levels than economic agglomeration levels were mainly distributed in the eastern region with a high overall economic development level and the northwestern region with a relatively low grain yield. The counties in which grain agglomeration levels were higher than their economic agglomeration levels were mainly distributed in the central regions with relatively lower level of economic development and in the northeastern region with a high level of grain production. Counties with a basically consistent grain agglomeration and economic development were mainly distributed in the central region and were associated with a relatively slow economic development and relatively steady grain production. As the time has passed, the coordination between China’s grain production and economic development has improved and has been increasingly influenced by the economic development. Therefore, the economic agglomeration level usually exceeds the grain agglomeration level.
3.2. Change in the Features of Coordination between China’s Grain Production and Economic Development between 2000–2017
3.2.1. Conversion Features of Different Coordination Types between Grain Production and Economic Development in China between 2000–2017
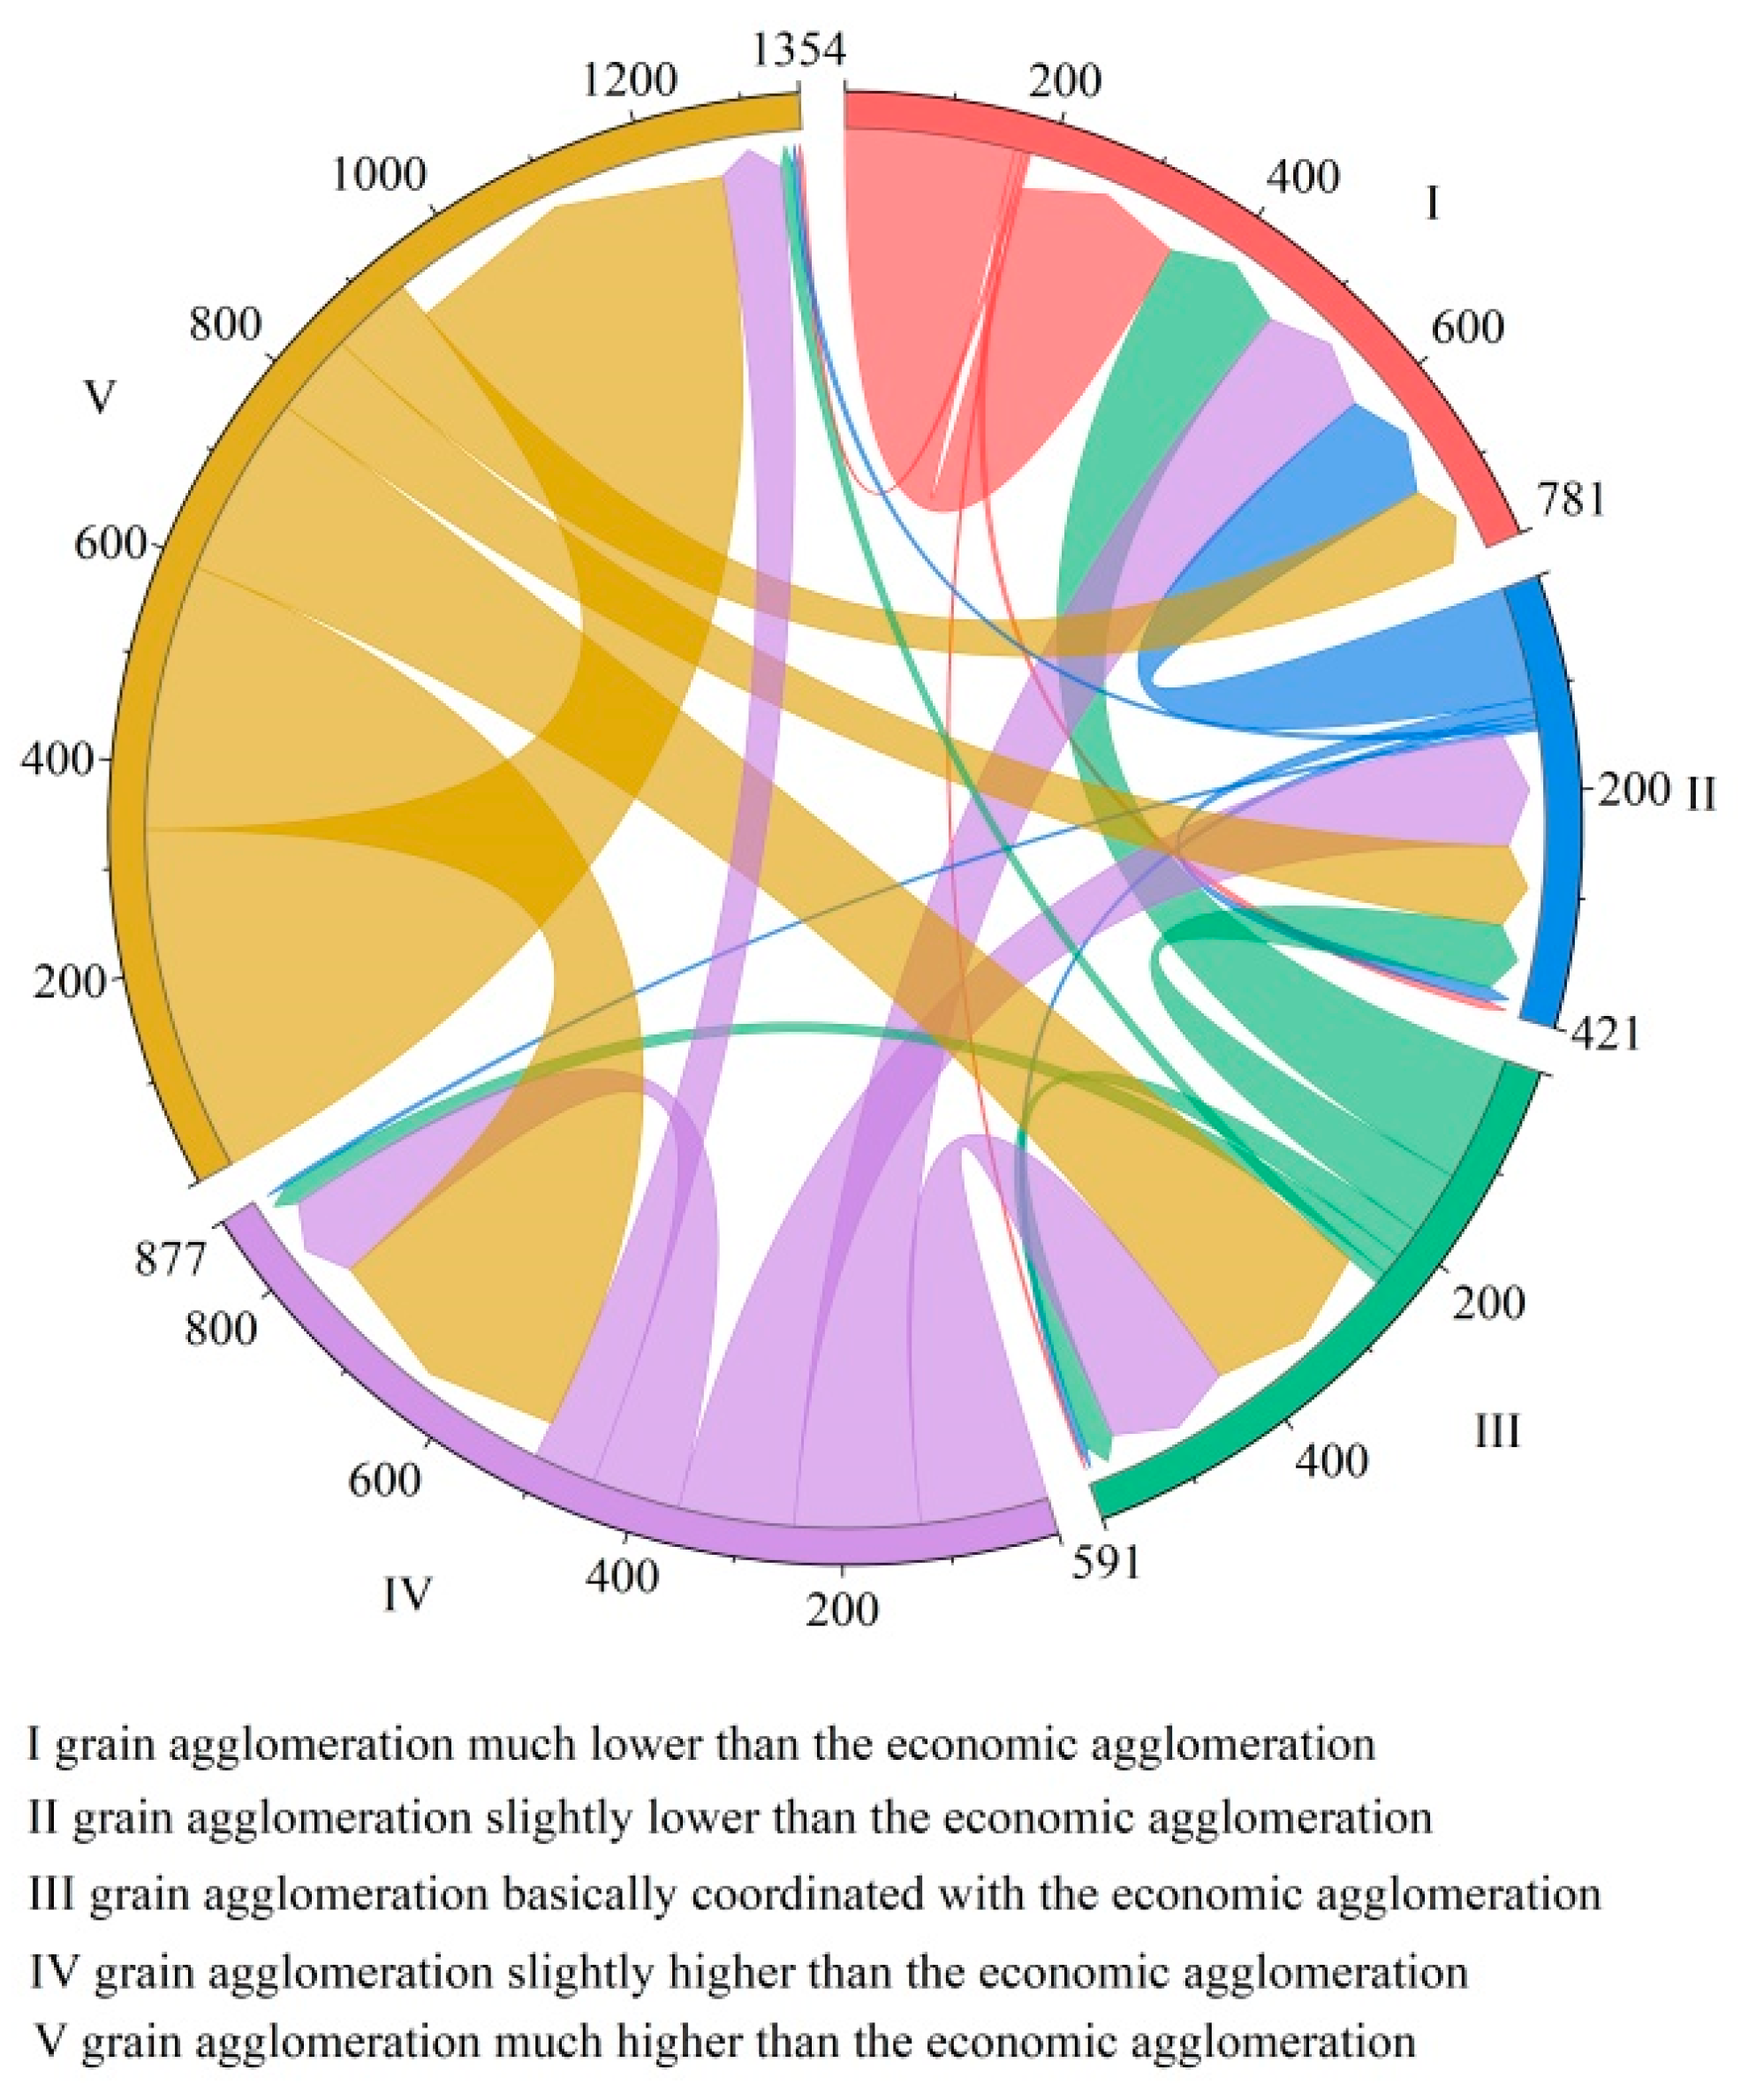
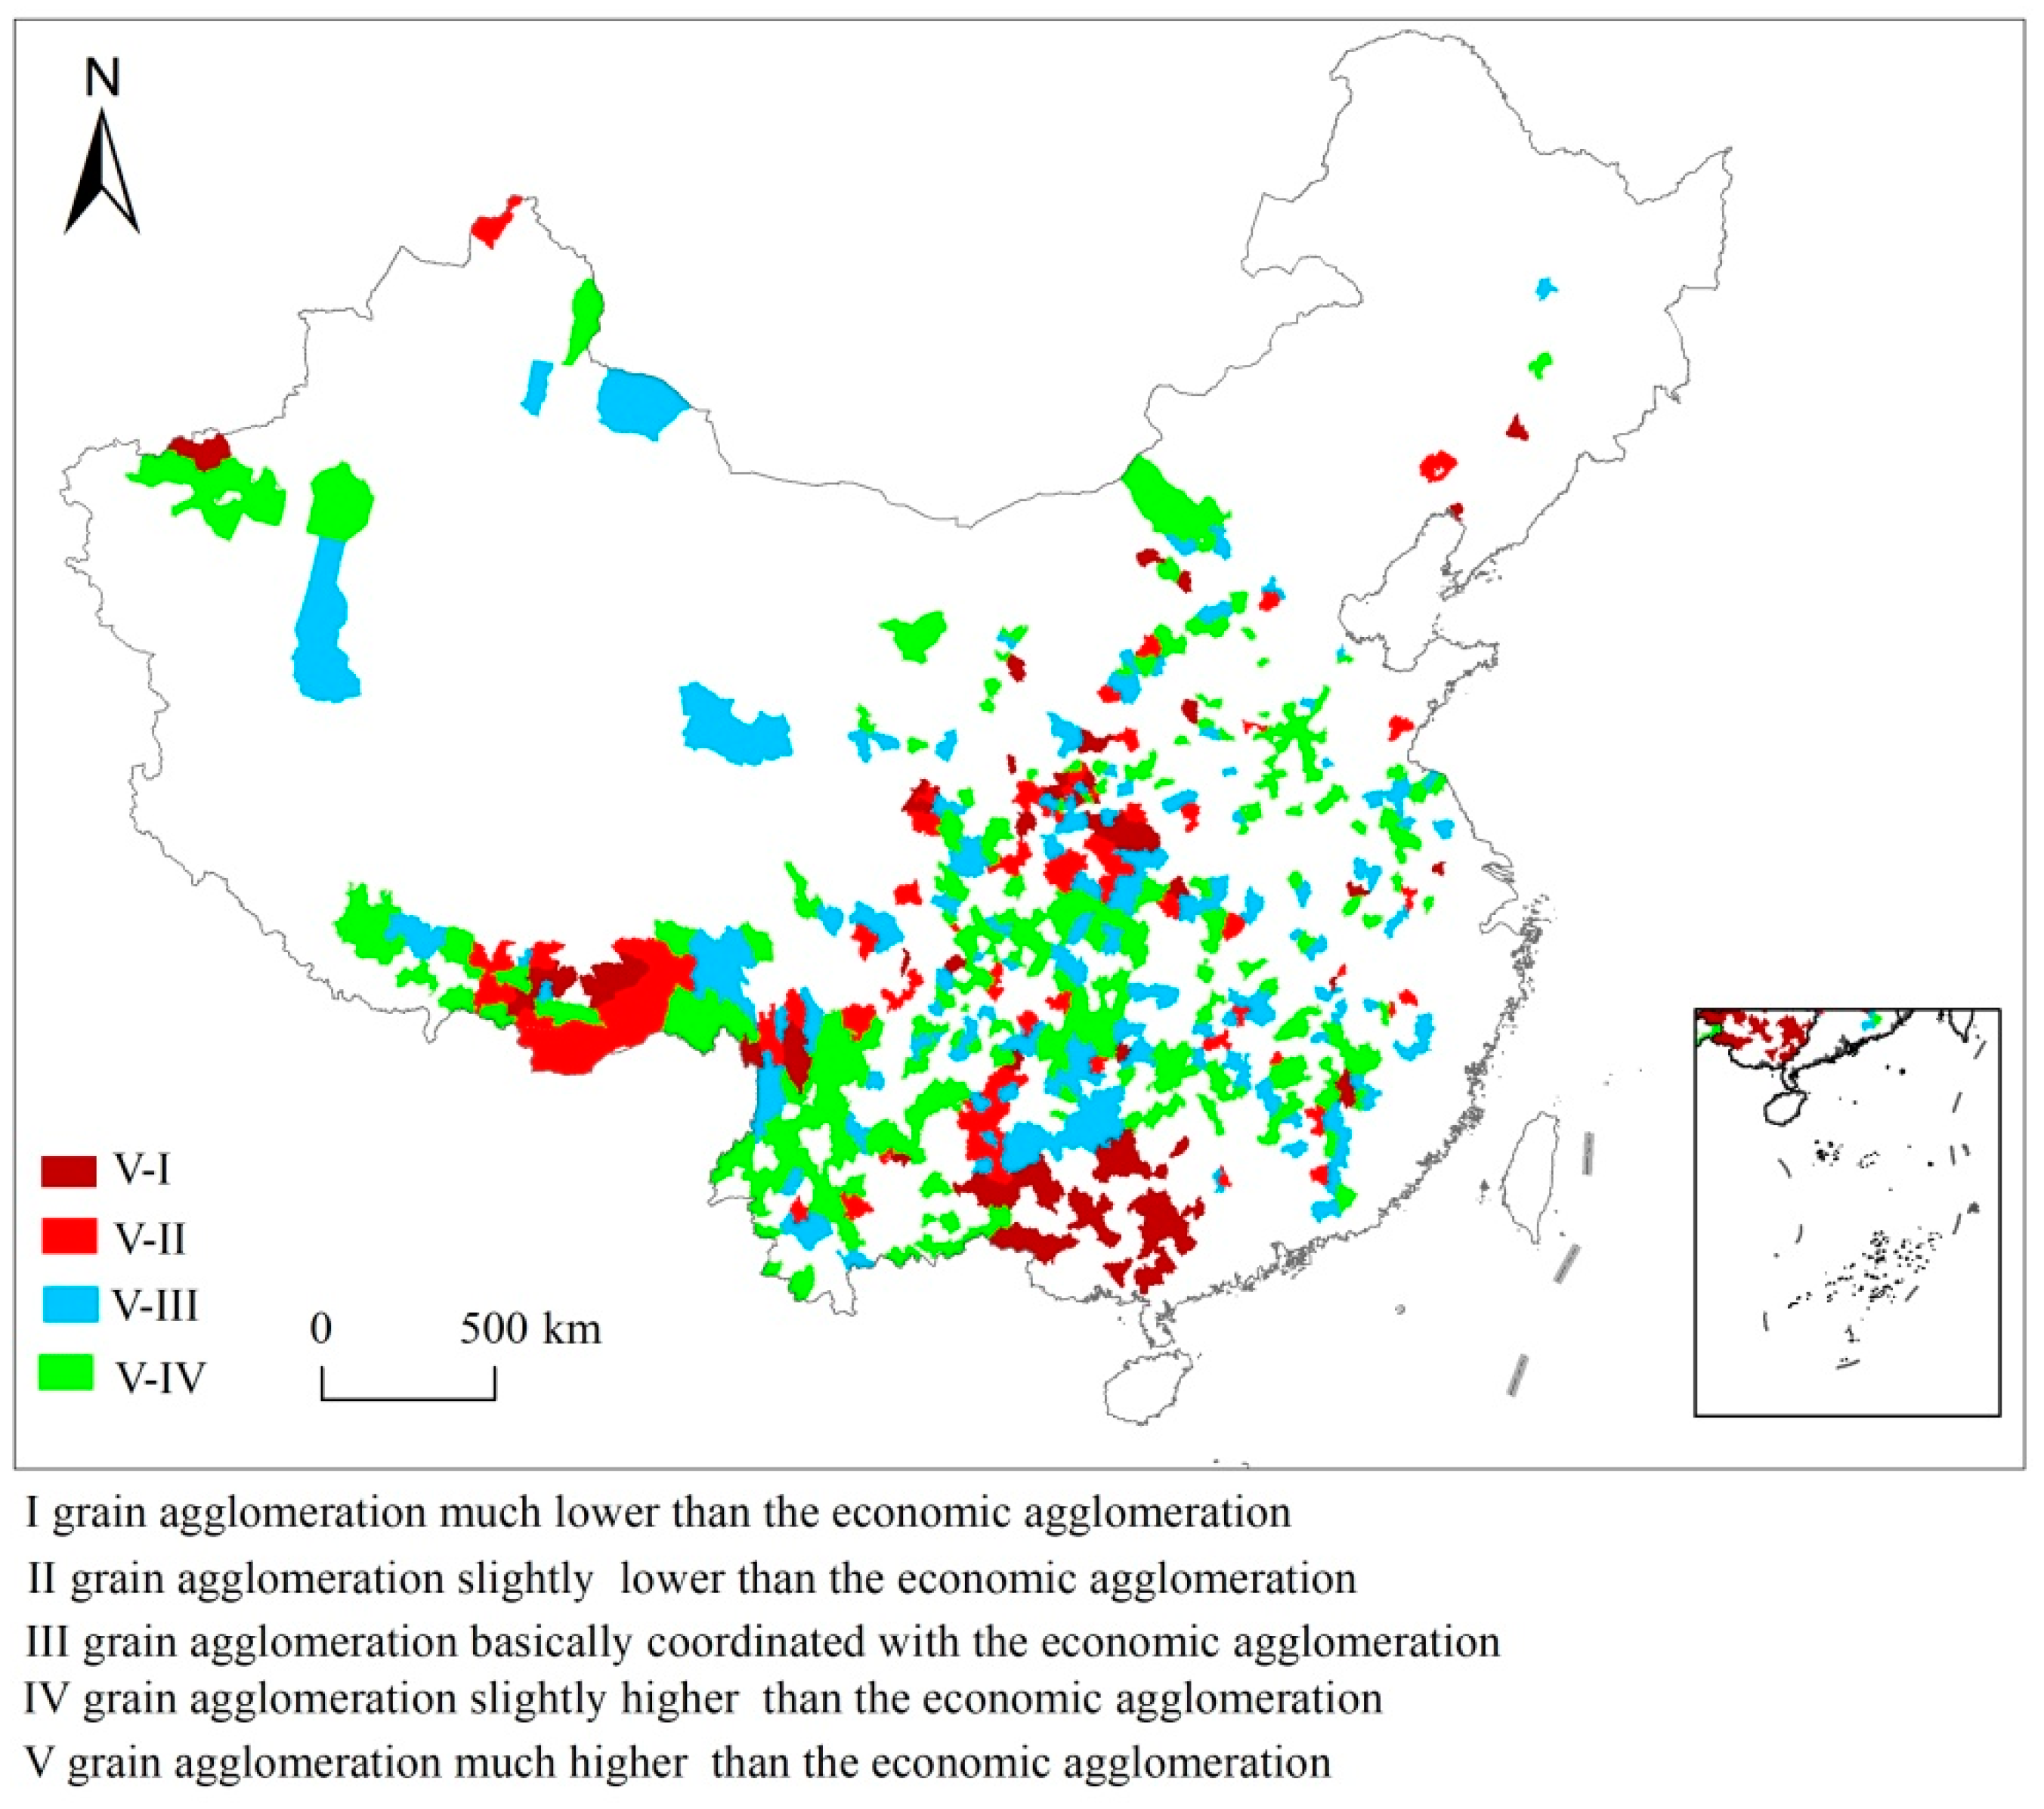
The transformation of China’s grain production and economic development pattern was mainly manifested in terms of the transition away from a much higher grain agglomeration level relative to economic agglomeration level between 2000–2017 (Figure 3, Table 2). More specifically, a total of 598 counties were converted from a type defined by a much higher grain agglomeration level than the economic agglomeration level into otherwise defined types. As for counties experiencing this kind of type conversion, as shown in Figure 4 and Table 2, a total of 259 counties were converted into the type defined by a slightly higher grain agglomeration level relative to the economic agglomeration level, which were mainly distributed in Yunnan, the east of Sichuan and the south of Tibet in the western region and Hunan and Jiangxi in the central region. A total of 178 counties were converted into the type in which grain agglomeration was basically consistent with economic development, which were sporadically distributed within Guizhou, Shaanxi and Gansu in the western region and Hunan, Hubei and Jiangxi in the central region. A total of 161 counties were converted into the type defined by a lower grain agglomeration level relative to economic agglomeration level, which were distributed in Guangxi, the south of Tibet and the central area of Shaanxi. Therefore, the economic development level was gradually elevated in the central and western regions as time passed and the economic agglomeration level gradually surpassed the grain agglomeration level. In addition, the proportion transitions to a significantly lower grain agglomeration level relative to economic agglomeration level was equivalent to that for the conversion from a slighter higher grain agglomeration level relative to economic agglomeration level. The number of counties experiencing the above two conversion types was 435 and 421, respectively.
3.2.2. Temporal Change Features for China’s CGE Index between 2000–2017
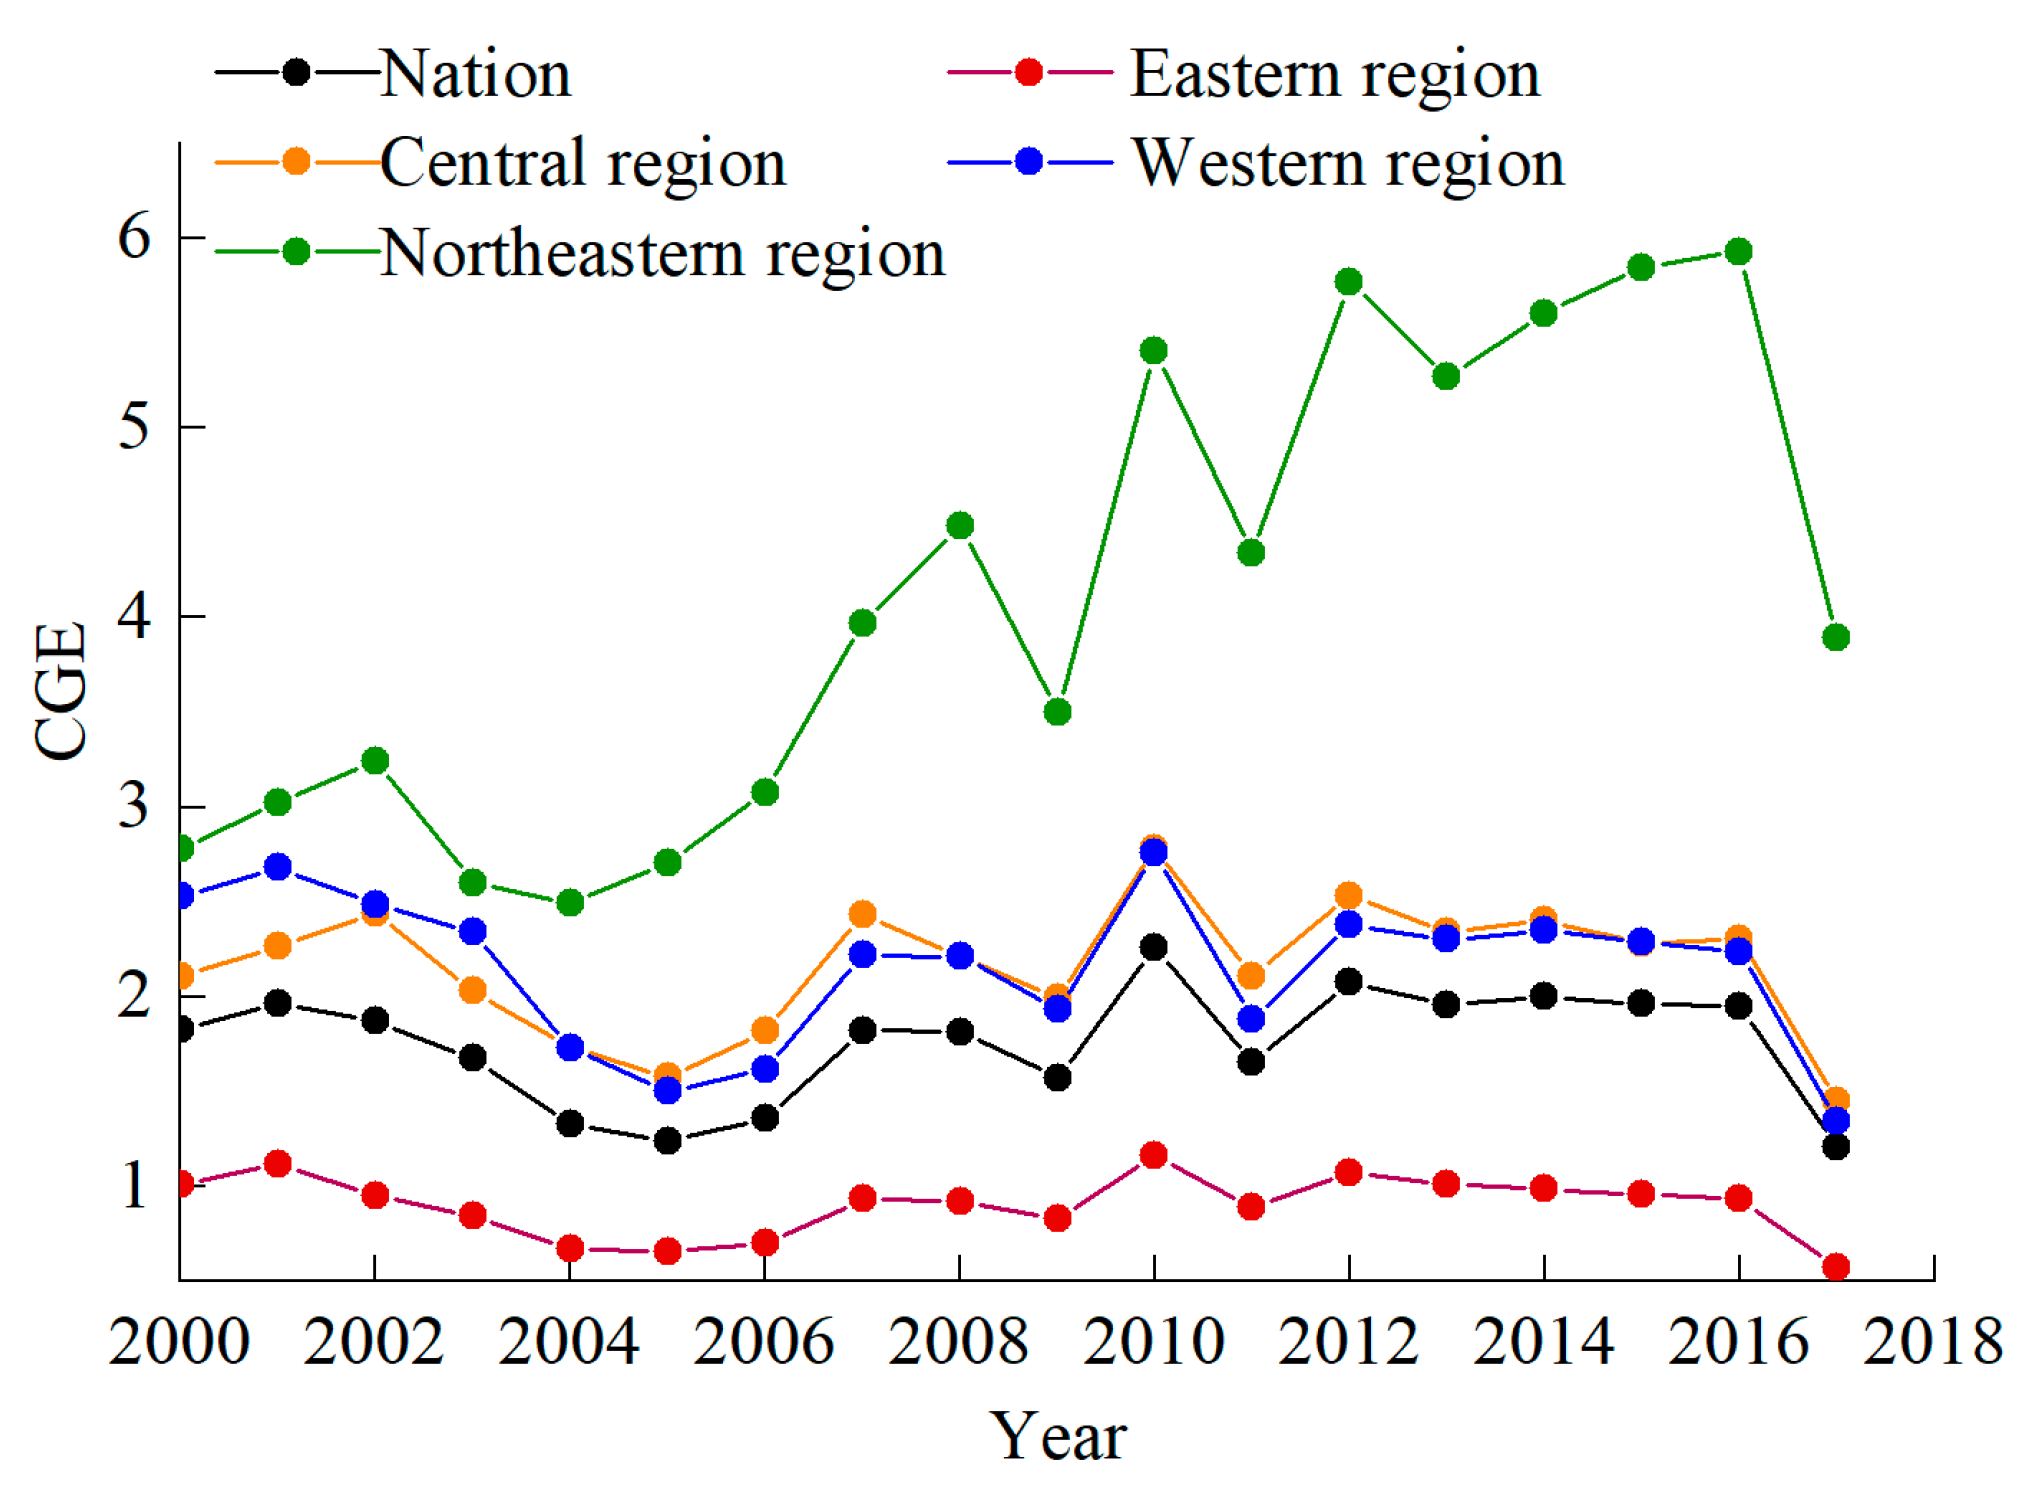
China’s CGE index tended to be coordinated in terms of its fluctuations, which showed apparent geographical patterning between 2000–2017 (as shown in Figure 5). From the perspective of temporal change, the change of the nationwide CGE index was similar to that for the CGE index for the four major regions. Specifically, the CGE index was at its lowest during 2005–2006 and then began a wave-like rise after 2006, indicating that the grain production level improved to some extent. The grain production level fluctuated significantly between 2009–2011, remained relatively stable after 2012 and declined by a large amount in 2017. The rise following 2006 may be attributed to China’s adoption of farmer-benefiting measures carried out between 2004–2007, such as the cancellation of the agricultural tax, grain subsidies and price protection for grain, all of which effectively promoted grain production. In 2011, China started to implement a nationwide main functional area planning effort and clarified development directions for the functional areas. As a result, the CGE index was relatively steady after 2012. In terms of regional discrepancy, the northeast region was favored in terms of grain agglomeration. The CGE index in the northeast region stayed at a high level, experiencing a wave-like rise since 2000 and experiencing a dramatic drop following the achievement of its maximum value (5.93) in 2016. The decline of the CGE index during 2016–2017 was associated with the adjustment of temporary corn purchase and storage policies in China [37]. In 2016, the Chinese government adjusted temporary corn purchase and storage policies in order to institute marketization-based purchase and subsidy mechanisms in the three provinces in northeast China and the Inner Mongolia Autonomous Region. The corn price then began declining rapidly, which led to a widespread corn crop failure accompanied by a sharp fall in the CGE index. In contrast with the northeast region, the CGE index declined from 1.02 in 2000 to 0.54 in 2017 in the eastern region and the grain–economy coordination was transformed from a balanced state to one obviously favoring economic agglomeration. The central and western regions were on the verge of equilibrium between grain production economic development; however, the CGE indexes decreased from 2.11 and 2.53 in 2000 to 1.45 and 1.14 in 2017, respectively. Grain production was gradually coordinated with the economic development, which was converted from the type defined by a higher grain agglomeration level than the economic agglomeration level.
3.2.3. Spatial Change Features of China’s CGE Index between 2000–2017
The thematic map series method and analytical approach were utilized in dividing the change intensity of China’s CGE index into 16 levels from a maximum decrease amplitude to a maximum increase amplitude, where Level 1 represented the maximum decrease amplitude and Level 16 stood for the maximum increase amplitude. It is evident from the hierarchical thematic map series of change intensity (Figure 6) that the changes in China’s CGE index largely follow a west-to-east and south-to-north spatial distribution pattern in an ascending order. Decrease in amplitude was at its maximum in the southwest region, where Level 1 was most widely distributed. Levels 4–7 were mainly distributed in the central and eastern regions, Levels 10–13 gradually shifted towards northern China and Level 16 was concentrated in the northeastern region.
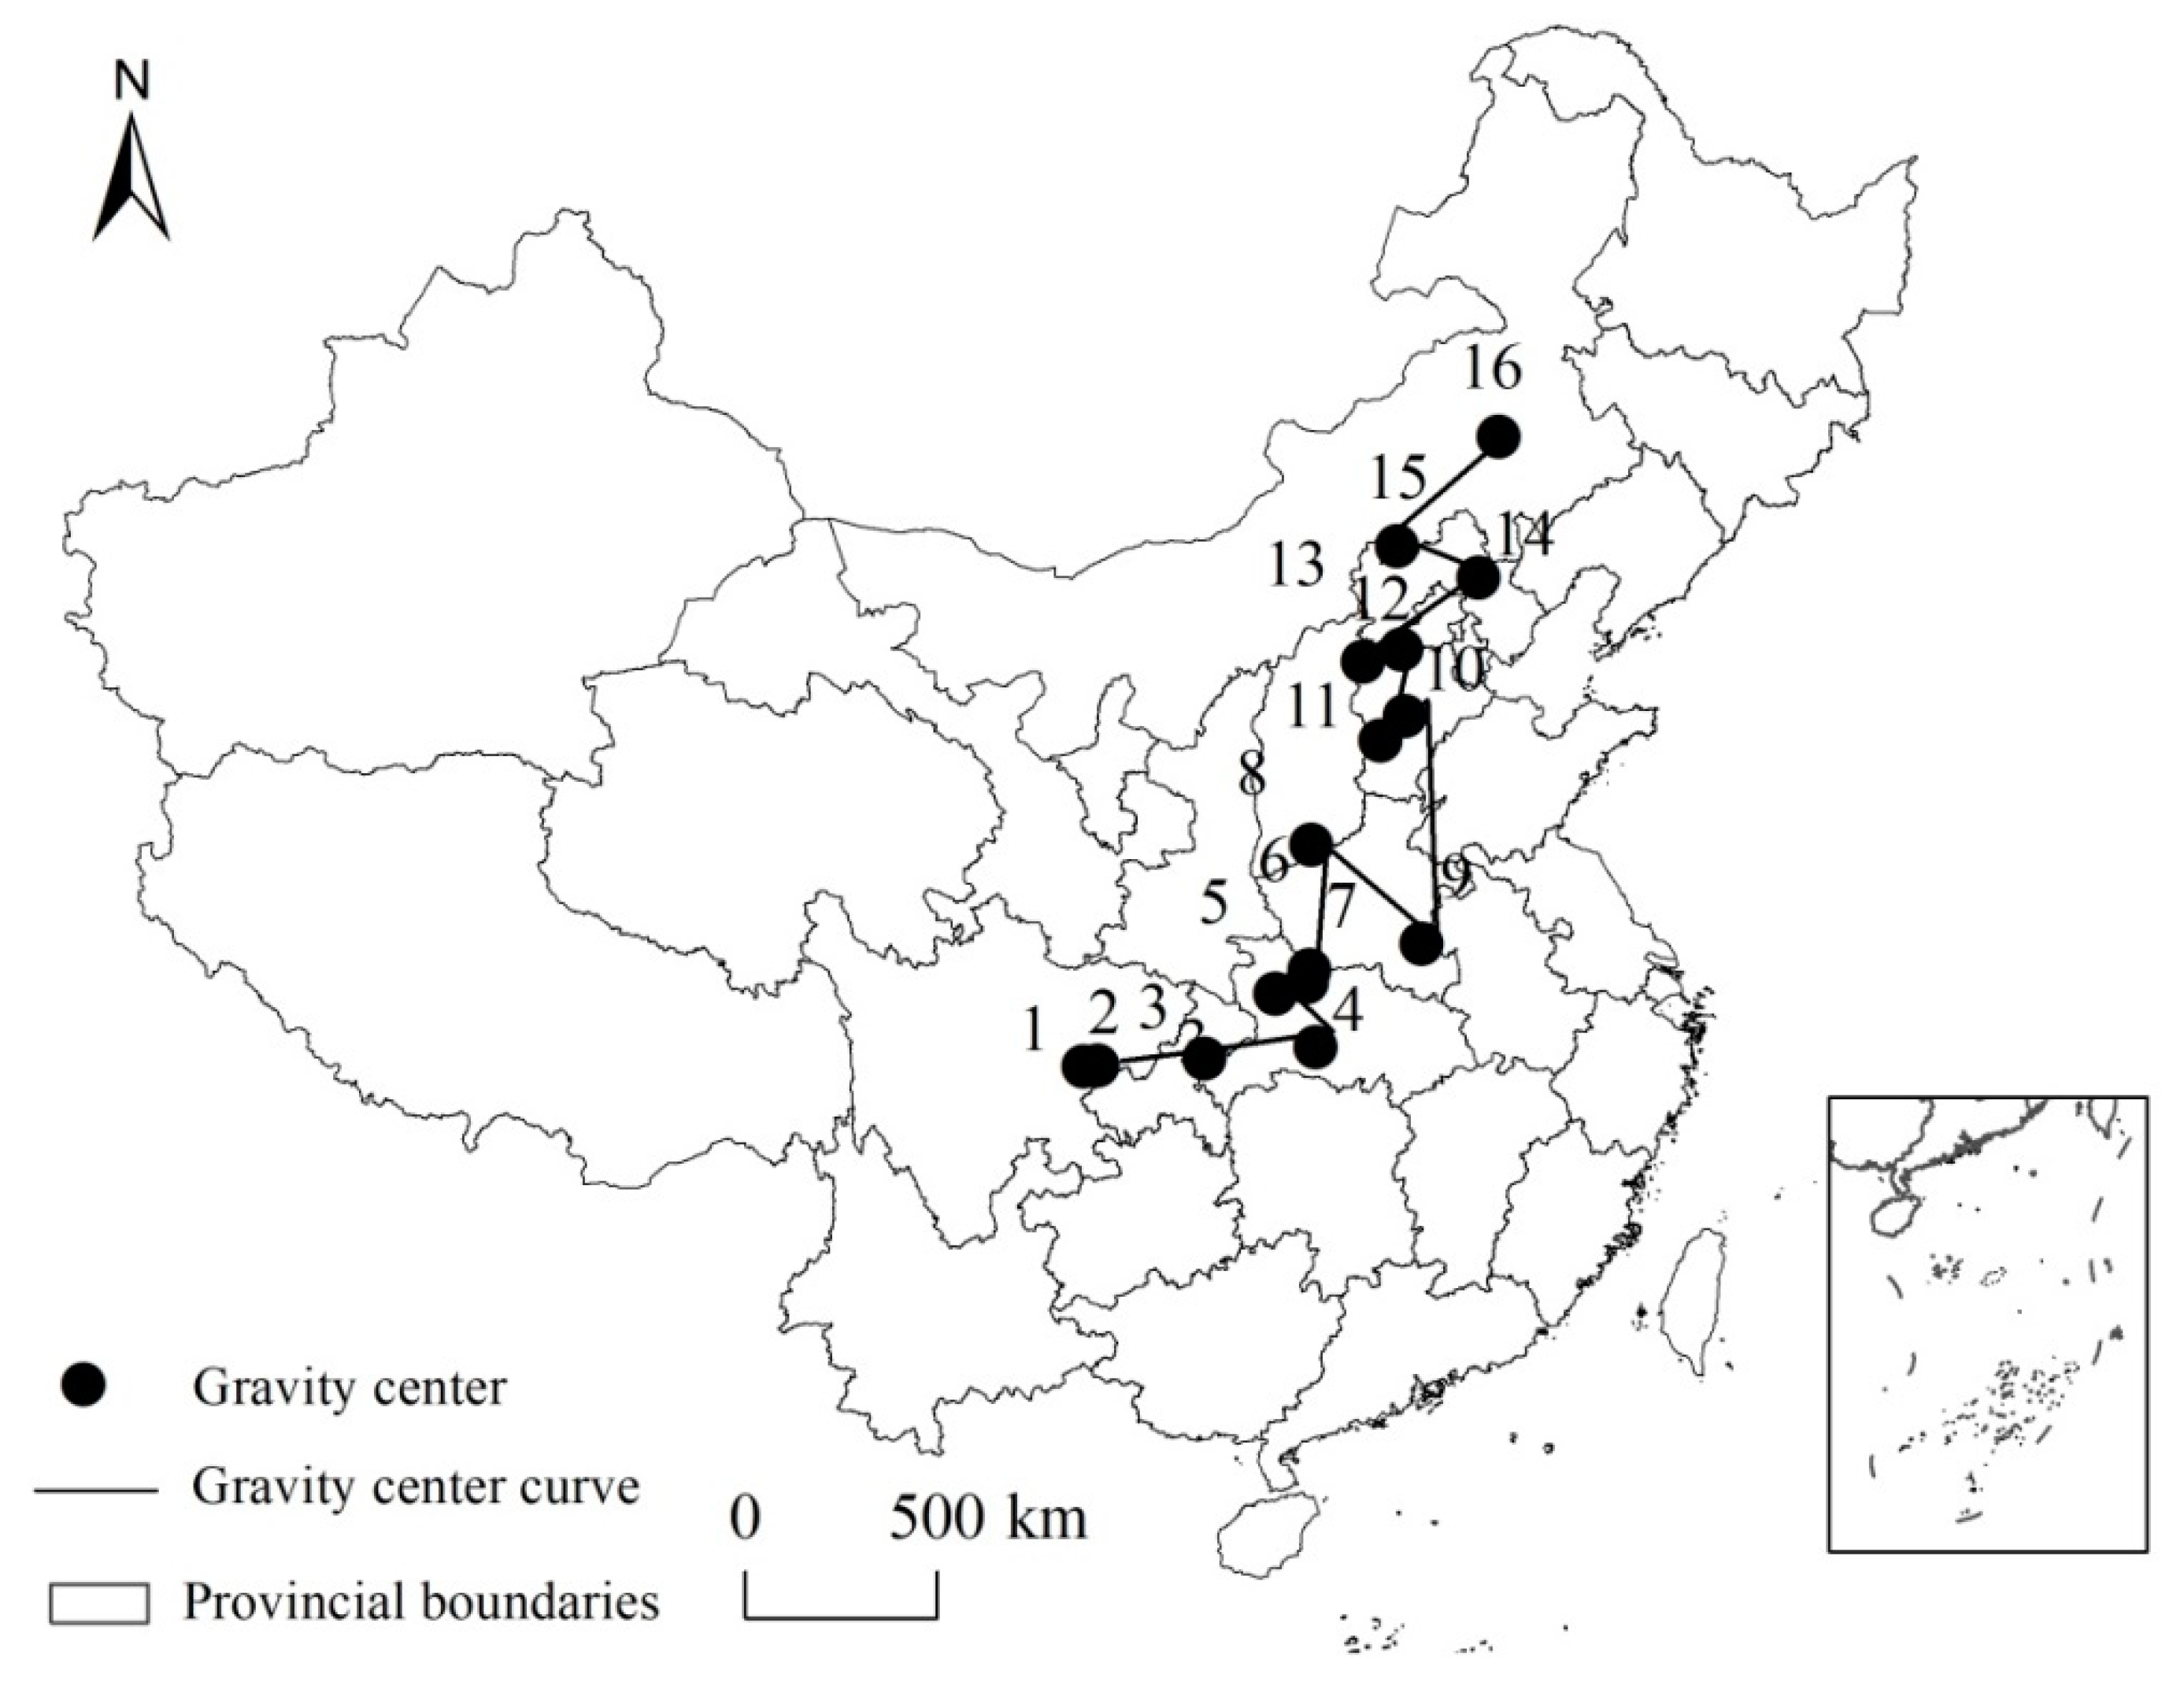
The gravity centers of the 16 levels were connected by straight lines to form a gravity center curve (Figure 7) representing the changes in CGE index. As shown in Figure 7, the areas with high reduction levels in the gravity center curve of changes in China’s CGE index were mainly located in the central and western regions and the decrease in amplitude was greater towards the southwest. The areas with greatly increased levels were concentrated in northern China and the increase in amplitude seemed larger towards the northeast.
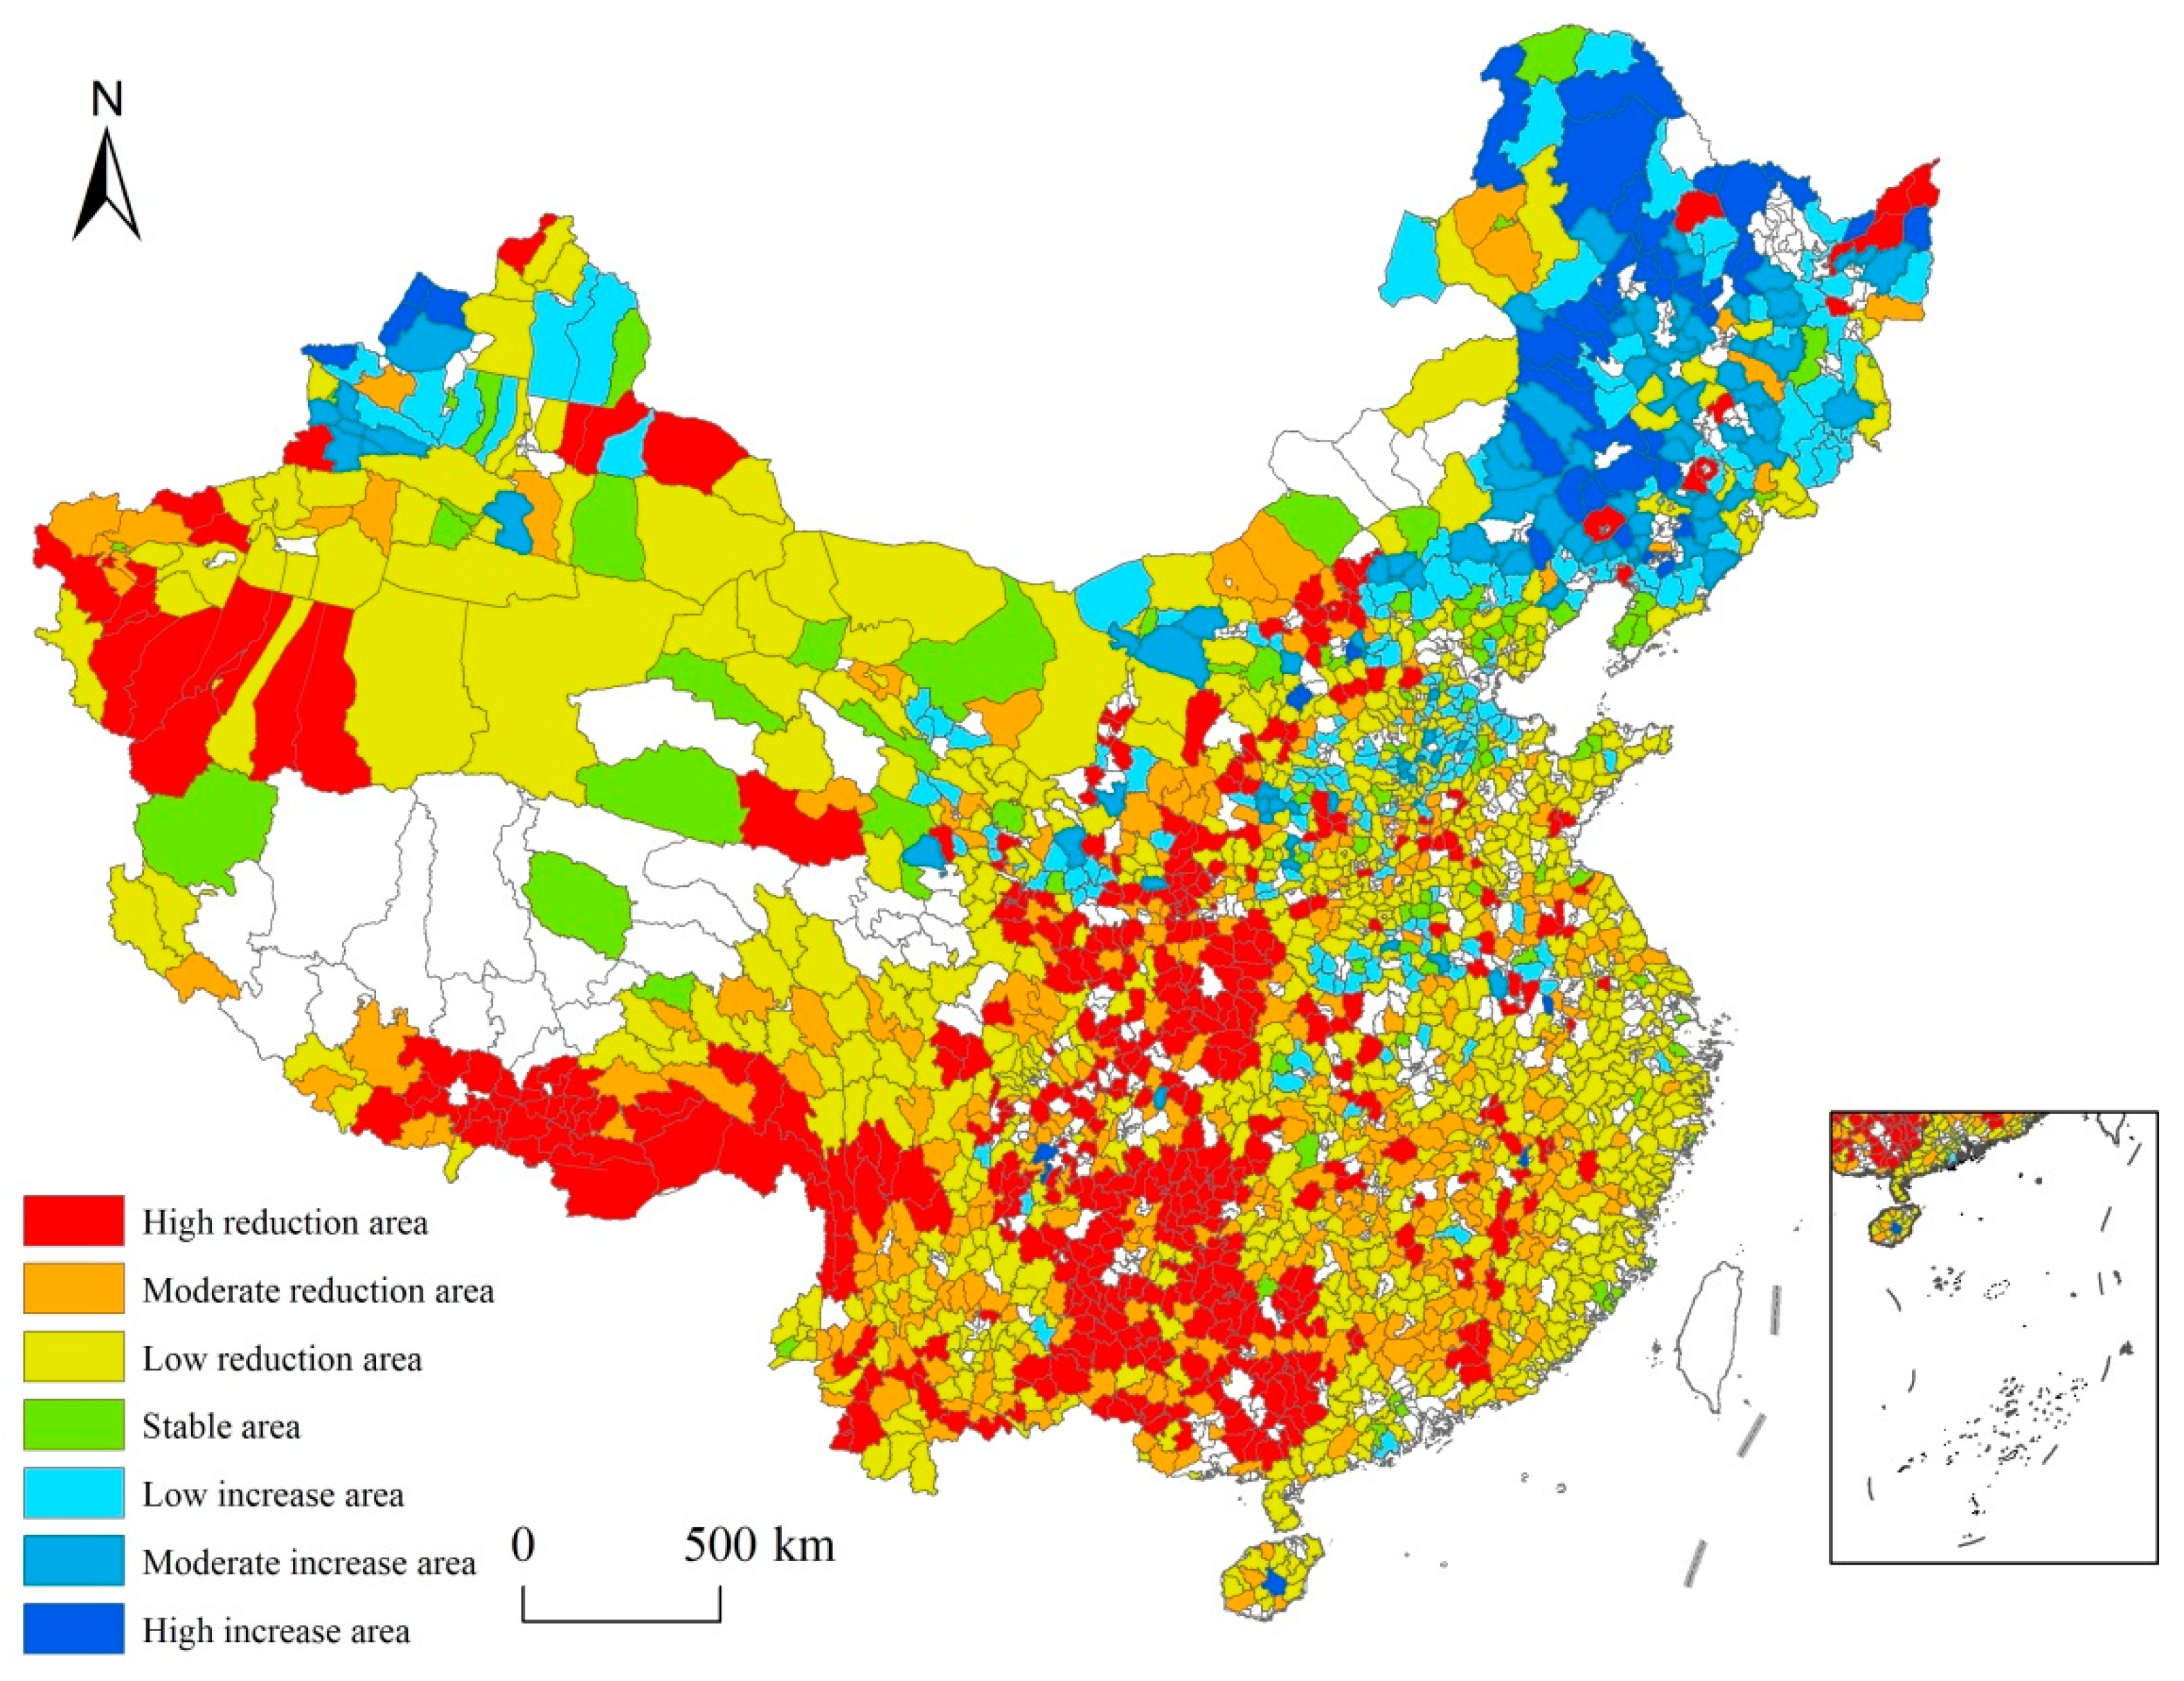
According to the proximity of gravity centers at adjacent levels on the gravity centers curve, the thematic map series of CGE index were merged slightly and the number of change levels was reduced from the original 16 to 7 in order to form a new change level diagram of the CGE index (Figure 8). Based on the division of 7 change levels, the change types of China’s CGE index could be divided into high reduction areas, moderate reduction areas, low reduction areas, stable areas, low increase areas, moderate increase areas and high increase areas.
Figure 8 shows that many counties experienced a reduction in their CGE index and these were widely distributed, covering most areas in the eastern, central and western regions. The 258 counties with the greatest reduction in their CGE index were concentrated in Guizhou, Guangxi, Tibet and Sichuan in the southwestern region and counties sporadically distributed around the northwestern borderland in Xinjiang. This rapid economic development was the primary cause for the reduction in the CGE index in these areas. Meanwhile, their grain yields were reduced due to structural adjustment within the agriculture industry [38,39]. Counties with moderate reduction in their CGE index were distributed at the perimeter of the areas with the greatest reduction, mainly in the central and western regions. Counties with a low reduction in their CGE index were widely distributed in the eastern, central and western regions. Since 2000, numerous Chinese counties have seen increased development and many economic agglomeration levels have improved thanks to the economic development [40]. The 143 counties with a basically unchanged CGE index were sporadically distributed around Hebei, Henan, Inner Mongolia, Liaoning, etc. It was mainly in the northwestern region that the CGE index values increased and this phenomenon was most prominent in the northeast region, where the number of counties showing an increasing trend in their CGE index accounted for 72% of total number of counties nationwide. In the northeastern region, where rural development is centered especially on agriculture, originally cultivated land resources are a key outstanding resource, with this being one of the regions with the greatest quantity of surplus grain in China [41]. Therefore, the grain agglomeration level in these counties far exceeded the economic agglomeration level in this region.
4. Discussion
4.1. Pattern and Causes of China’s Grain Production and Economic Development and Its Change over Time
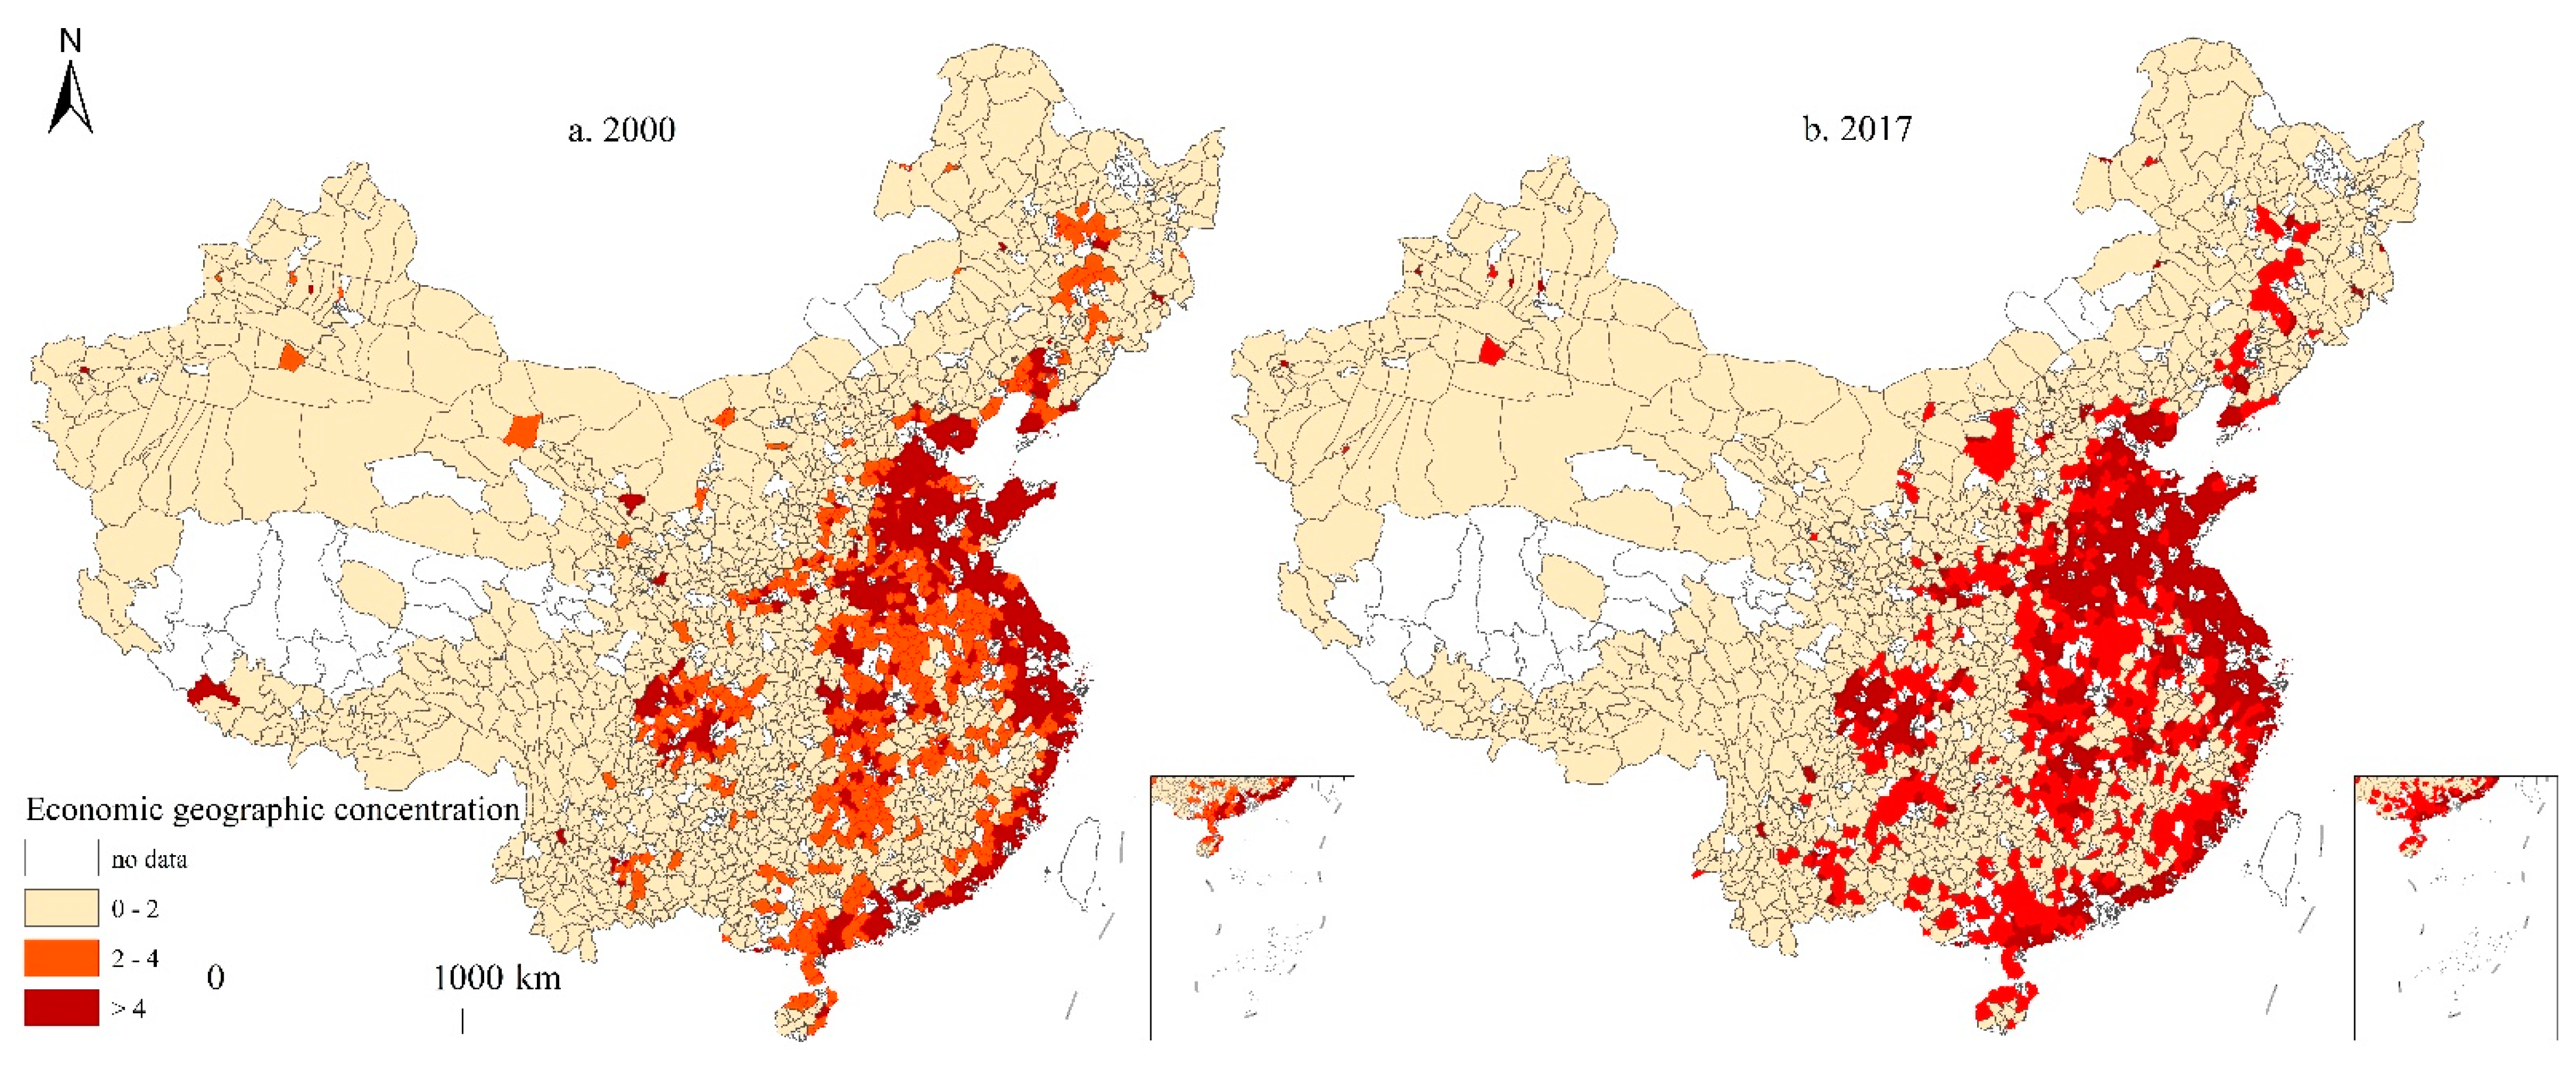
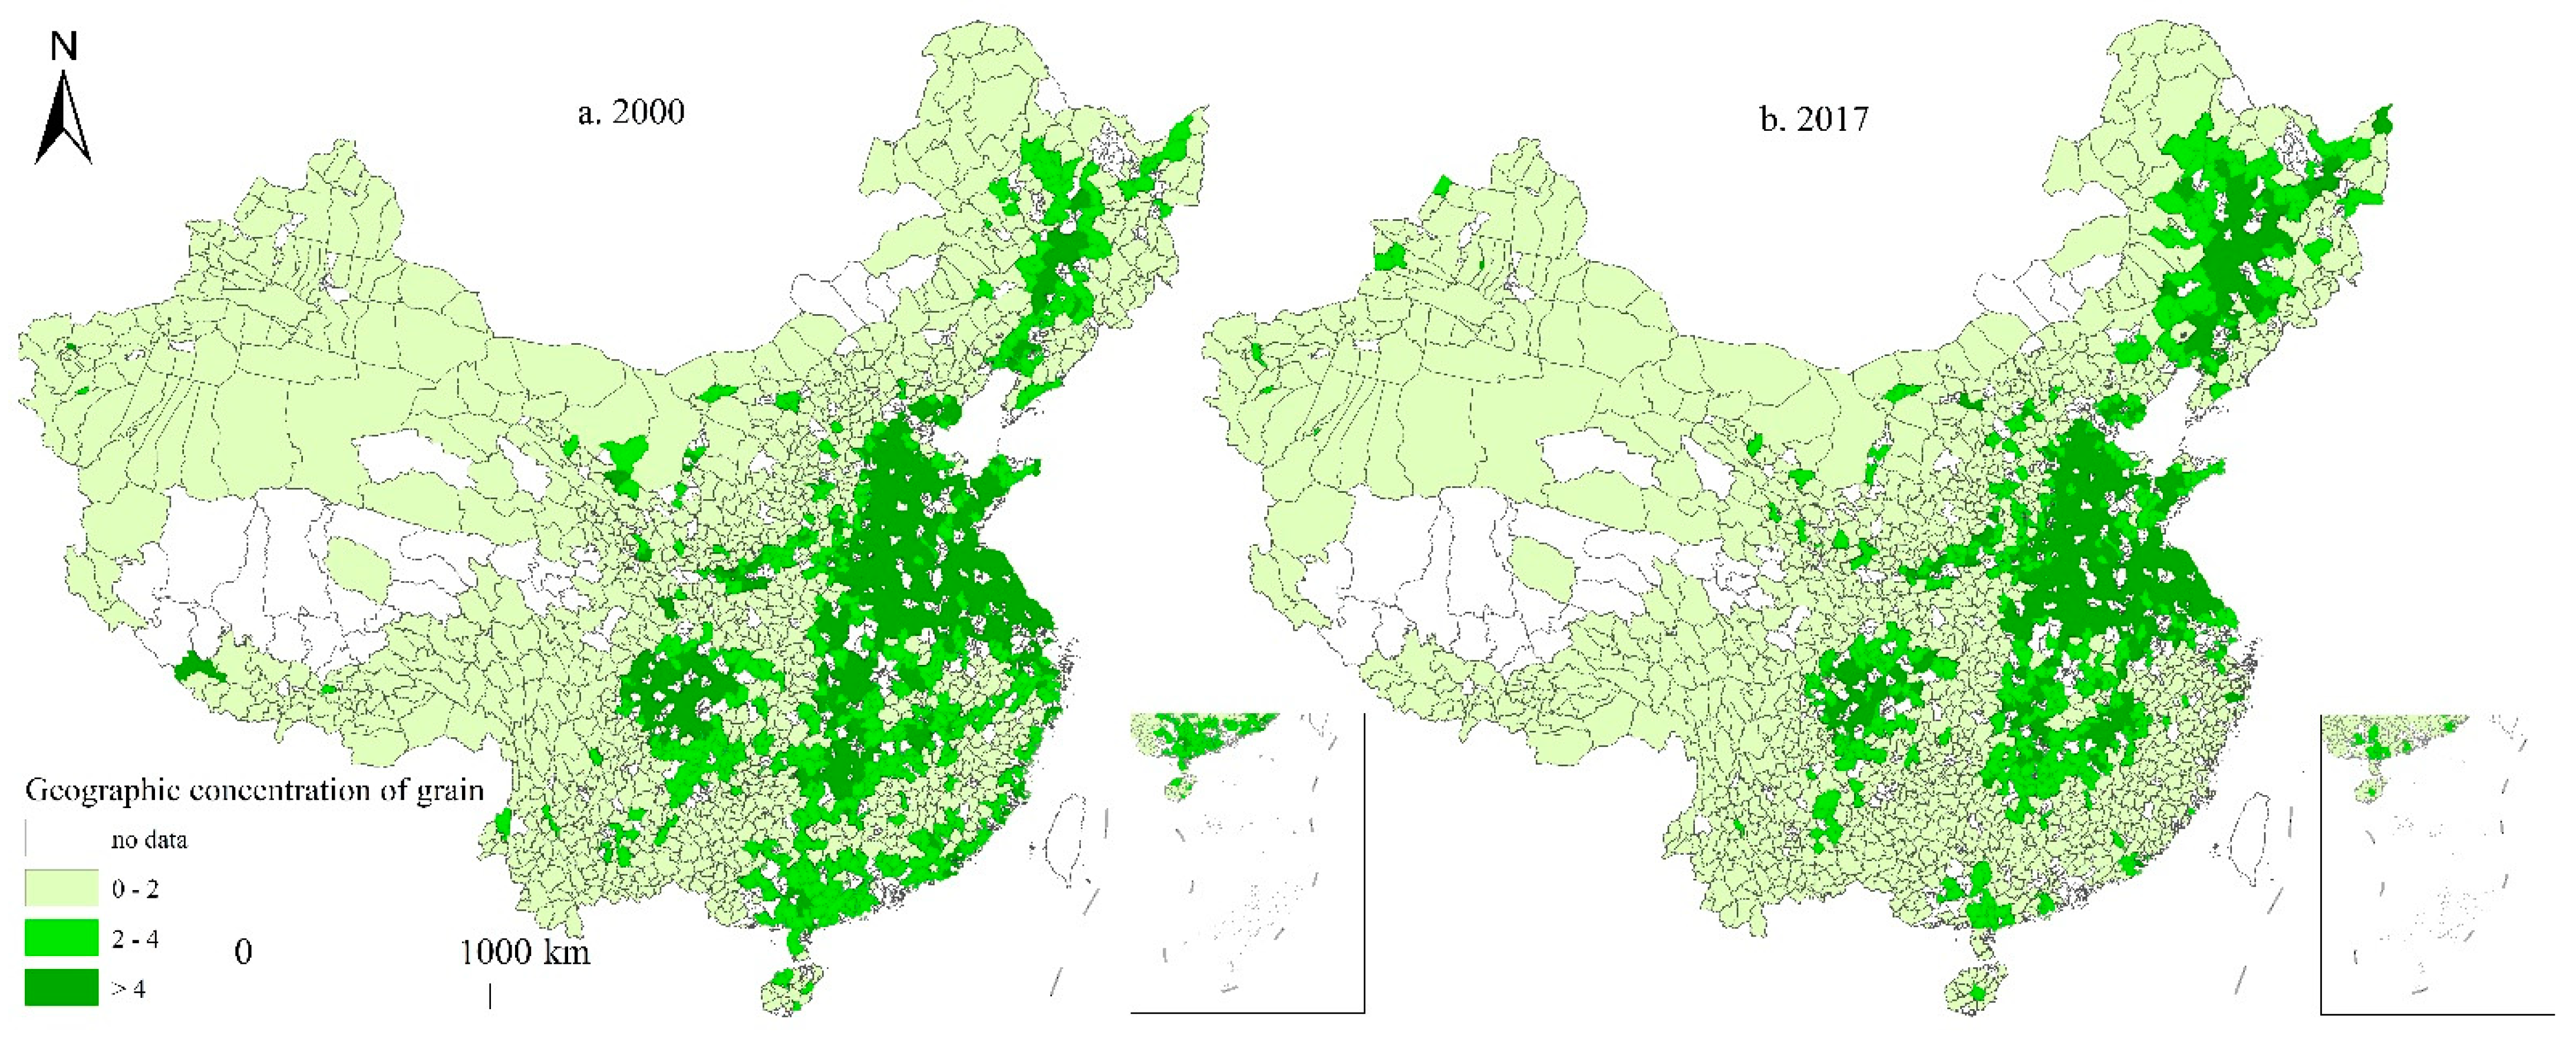
This study has shown that China’s grain production has a weak coordination with the economic development during the period between 2000–2017. This spatial pattern is related to China’s overall grain production and economic development pattern. From the perspective of industrial agglomeration, agro-industrial agglomeration is initially highly dependent on natural resources. From the perspective of the geographic concentration of economic development (Figure 9), economic agglomeration was concentrated in the eastern regions, especially in the Yangtze River Delta, Pearl River Delta and Beijing–Tianjin–Hebei Region. These areas have attracted a large amount of labor, capital and a rapid transfer of land resources to industry and tertiary industries. Due to the cumulative circular effect and industrial linkage effect, economic center was formed in these regions. Meanwhile, the northeastern, central and western regions have become relatively marginal areas. The secondary and tertiary industries in these areas are underdeveloped and the arable land resources are less occupied by industrial land, which provides the necessary land resources for agricultural development. Especially, the middle and lower reaches of the Yangtze River Plain and the North China Plain in the central and northeastern regions with favorable natural conditions have become a natural center of grain production in China for a long time. Therefore, these areas with high grain yield have formed the concentrated areas of grain production (Figure 10). In particular, the number of high grain geographical concentration in the northeast region has increased from 65 in 2000 to 89 in 2017. Furthermore, studies have pointed out that the increase in grain production in Northeast China is closely related to climate warming in the region [42].
This study also revealed that the central and western regions tend toward a grain–economy equilibrium, which may be attributed to policies adopted in China intended to narrow the gaps between levels in the eastern and western regions. The development of the central and western regions integrates certain advantages thanks to the Great Western Development, the revitalization of the Old Northeast Industrial Base and the Rise of Central China, all of which were carried out successively during 2000–2004. Therefore, the geographical concentration of the economy in the central region was increased (Figure 9) and grain production and economic development tended to be coordinated.
4.2. Policy Enlightenment
Since the nationwide functional area planning effort began in China in 2011, different regions have clarified their respective development directions. In this study, the regions that featured a significantly lower grain agglomeration level than the economic agglomeration level were mostly prioritized development zones in China’s strategic plans, such as the Beijing–Tianjin–Hebei Region and Shandong Peninsula in the eastern China. As highlighted by the Chinese government, these regions were bound to lead national socioeconomic development and to become economic regions participating in the international division of labor with global influence at high levels in China [43]. Grain production in these regions has given way to economic development. However, grain consumption increased rapidly in these regions due to economic agglomeration. Nevertheless, grain production has been low in these regions and it has been necessary to import grain, which takes time. Therefore, importance should be attached to the grain circulation problem in these regions. More specifically, the key nodes in the grain transportation network should be further identified, railway and waterway construction should be accelerated, grain logistics and warehousing infrastructure should be optimized, the reform modes of grain logistics should be strengthened and emergency grain logistics mechanisms should be perfected in order to jointly safeguard smooth grain circulation.
We found in this study that areas with a higher grain agglomeration level than the economic agglomeration level were concentrated in major grain-producing areas, such as the northeastern and central regions. The government emphasized that these areas should put their efforts into protecting cultivated land, stabilizing grain production and ensuring national grain and food security [43]. In this way, they forwent other opportunities with greater economic benefits for the sake of grain production. Therefore, in these regions, efforts must be made to increase farmers’ income on the precondition of improved grain security, rather than simply increasing yield without elevating farming income, or even increasing yields at the expense of income. Compared with industry and service industries, the benefits of agriculture are very distinct from one another. For example, the “Food Security Act” and the “Food, Agriculture, Conservation and Trade Act” in the United States have undergone adjustments in terms of price support from agricultural production and income subsidies, which are maintained through continuous adjustments and new policies [44]. The UK’s initial agricultural laws implemented price subsidies. Later, with the surplus of agricultural production and damage to the environment, the scope and scale of agricultural subsidies began to be reduced. With accession to the EU Common Agricultural Policy, agricultural subsidies were changed for the purposes of environmental protection, food safety and labor conditions [45]. These experiences are highly relevant for China, which should develop an accurate benefit compensation system for its main grain-producing areas [28]. This is especially true under the current system of farmer stratification, which it should refine. China must prioritize the layout of agricultural products for intensive processing projects in these areas, support leading grain processing enterprises by taking the opportunity for the supply-side reform of agricultural products. This should include brand promotion and the transformation of the relative advantages in terms of grain production into economic advantages. Meanwhile, China should implement strict cultivated land protection policies, restrain non-agricultural uses of cultivated land and prevent non-grain-producing uses of cultivated land.
In key areas experiencing rapid changes in grain production and economic development, such as Guizhou, Guangxi, Tibet and Sichuan in the southwestern region, economic and agricultural development levels are relatively lower than those in the central region, which results from their economic development foundation, agricultural production conditions and their deteriorating agro-ecological environment. The EU conducts its agricultural development with a high level of ecological protection. Its agriculture and countryside are not only places for agricultural production, but also meet the multiple needs of society in terms of agriculture, rural livability and other aspects of land multi-functionality. The agricultural development level and economic level of its member countries are, thus, very high. Therefore, when China develops grain production in ecologically fragile areas. These areas should pay close attention to the ecological protection, the adjustment of agricultural structure, the promotion of rural revitalization and the promotion of coordinated development in terms of agro-ecological, social and economic systems.
4.3. Limitation and Future Work
Our research has contributed to the advancement of research on the relationship between agriculture and the economy. The novelty of this article is as follows: First, it analyzes the relationship between China’s grain production and economic development at the county scale and it addresses the disagreement in the conclusions of the previous studies. Second, when talking about industrial agglomeration in the past, most studies have focused on the agglomeration of industrial activities, there are fewer studies comparing the regional patterns of agricultural agglomeration at the regional scale. This article uses geographic concentration to construct a grain economy consistency index (CEG) and it discusses the relationship between China’s grain and economic development.
However, this study is lacking in some areas. Due to the data limitations, only two indexes—grain yield and GDP—were used to measure the county-scale grain production and economic development levels in this study. Meanwhile, it lacks a more in-depth analysis on the factors influencing grain production and economic development. Further research is needed to reveal the factors that affect grain agglomeration and especially the influence of the natural environment, transportation conditions, levels of investment and labor force. At the same time, further discussions of the interaction between grain production and economic development will continue. Such research may provide points of reference from case studies in the European Union, APEC and many other countries.
5. Conclusions
This study analyzed the spatial relationship between grain production and economic development in these Chinese counties between 2000–2017. We found that:
Grain production was weakly coordinated with the economic development in China and this coordination was higher in 2017 compared with that in 2000. The conversion type of China’s grain production and economic development was mainly from types characterized by very high levels of grain agglomeration than the economic agglomeration level, which are mainly located in the central and western regions. The northeastern region has a strong trend toward grain agglomeration, while the central and western regions tend toward a grain-economy equilibrium and the eastern region apparently favors economic agglomeration. The increase of China’s CGE gradually increased from the southwest to northeast. Therefore, different regions have different grain production strategies. For regions in the east where the level of grain concentration is much lower than the level of economic concentration, the focus should be on grain circulation. The main grain-producing areas in the central region should develop an accurate benefit compensation system, support leading grain processing enterprises and implement strict cultivated land protection policies in order to ensure national food security.
Author Contributions
K.X.: Conceptualization, methodology, visualization, writing—original draft, writing—review and editing. M.D.: Funding acquisition, supervision, conceptualization, writing—review and editing. J.Z.: Writing—review and editing. L.C.: Writing—review and editing. All authors have read and agreed to the published version of the manuscript.
Funding
This work was supported by the National Natural Science Foundation of China (Grant Nos. 41761020 and 41440004).
Institutional Review Board Statement
Not applicable.
Informed Consent Statement
Not applicable.
Data Availability Statement
Not applicable.
Acknowledgments
We are grateful to Lanhui Li from Xiamen University of Technology for revising the paper and polishing the language.
Conflicts of Interest
The authors declare no conflict of interest.
References
- Marques, A.C.; Fuinhas, J.A.; Pais, D. Economic growth, sustainable development and food consumption: Evidence across different income groups of countries. J. Clean. Prod. 2018, 196, 245–258. [Google Scholar] [CrossRef]
- Gardebroek, C.; Reimer, J.J.; Baller, L. The Impact of Biofuel Policies. J. Agric. Econ. 2017, 68, 839–860. [Google Scholar] [CrossRef]
- Lencucha, R.; Pal, N.E.; Appau, A.; Thow, A.; Drope, J. Government policy and agricultural production: A scoping review to inform research and policy on healthy agricultural commodities. Glob. Health 2020, 16, 11. [Google Scholar] [CrossRef] [PubMed] [Green Version]
- Sokolova, E.; Kirovski, P.; Ivanov, B. The role of EU direct payments for production decision-making in Bulgarian agriculture. Agric. For. 2015, 61, 145–152. [Google Scholar] [CrossRef] [Green Version]
- Ministry of Agriculture, Forestry and Fisheries of Japan. 2018. Available online: https://www.maff.go.jp/ (accessed on 5 October 2021).
- Yang, J.; Zheng, X.G.; Wu, Z.P.; Qian, T.T.; Zhao, J.Y. Foreign experience of agricultural and rural development in the process of urbanization. Acta Agric. Shanghai 2019, 35, 106–114. (In Chinese) [Google Scholar] [CrossRef]
- Gao, J.B.; Qiao, W.F.; Liu, Y.S.; Li, Y.R.; Tu, W.; Zhang, Y.X. The higher grain production, the more social deprivation? A case study of Henan province in traditional agricultural areas of China. J. Mt. Sci. 2018, 15, 167–180. [Google Scholar] [CrossRef]
- Liu, Y.; Xiao, C.W.; Li, P.; Jiang, L.G. Relationship of grain output and economic development from 1978 to 2013 in the major grain producing area of China. Resour. Sci. 2015, 37, 1891–1901. (In Chinese) [Google Scholar]
- Du, S.; Shi, P.; Van Rompaey, A. The Relationship between Urban Sprawl and Farmland Displacement in the Pearl River Delta, China. Land 2014, 3, 34–51. [Google Scholar] [CrossRef] [Green Version]
- Zhang, S.Y.; Deng, W.; Peng, L.; Zhou, P.; Liu, Y. Has rural migration weakened agricultural cultivation? Evidence from the mountains of Southwest China. Agriculture 2020, 10, 63. [Google Scholar] [CrossRef] [Green Version]
- He, C.Y.; Liu, Z.F.; Xu, M.; Ma, Q.; Dou, Y.Y. Urban expansion brought stress to food security in China: Evidence from decreased cropland net primary productivity. Sci. Total Environ. 2017, 576, 660–670. [Google Scholar] [CrossRef]
- Xu, M.; He, C.Y.; Liu, Z.F.; Dou, Y.Y. How Did Urban Land Expand in China between 1992 and 2015? A Multi-Scale Landscape Analysis. PLoS ONE 2016, 11, e154839. [Google Scholar] [CrossRef] [Green Version]
- Ge, D.Z.; Long, H.L.; Zhang, Y.N.; Tu, S.S. Analysis of the coupled relationship between grain yields and agricultural labor changes in China. J. Geogr. Sci. 2018, 28, 93–108. [Google Scholar] [CrossRef] [Green Version]
- Deng, W.; Zhang, S.Y.; Zhou, P.; Peng, L.; Liu, Y.; Wan, J.J. Spatiotemporal Characteristics of Rural Labor Migration in China: Evidence from the Migration Stability under New-type Urbanization. Chin. Geogr. Sci. 2020, 30, 749–764. [Google Scholar] [CrossRef]
- Krugman, P. Geography and Trade; MIT Press: Cambridge, MA, USA, 1991; pp. 26–83. [Google Scholar]
- Fujita, M.; Krugman, P.; Venables, A.J. The Spatial Economy; MIT Press: Cambridge, MA, USA, 1999. [Google Scholar]
- Martin, P.; Ottaviano, G.I.P. Growth and Agglomeration. Int. Econ. Rev. 2001, 42, 947–968. [Google Scholar] [CrossRef]
- Martin, P.; Rogers, C.A. Industrial Location Public Infrastructure. J. Int. Econ. 1995, 39, 335–351. [Google Scholar] [CrossRef]
- Lanaspa, L.F.; Pueyo, F.; Sanz, F. The Public Sector and Core-PeripheryModels. Urban Stud. 2001, 38, 1639–1649. [Google Scholar] [CrossRef]
- Hanson, G.H. Market Potential, Increasing Return, and Geographic concentration. J. Int. Econ. 2005, 67, 1–24. [Google Scholar] [CrossRef] [Green Version]
- Rosenthal, S.S.; Strange W, C. The Determinants of Agglomeration. J. Urban Econ. 2001, 50, 191–229. [Google Scholar] [CrossRef] [Green Version]
- Kaldor, N. A Model of Economic Growth. Econ. J. 1957, 67, 591–624. [Google Scholar] [CrossRef]
- Ge, D.Z.; Long, H.L.; Ma, L.; Zhang, Y.N.; Tu, S.S. Analysis Framework of China’s Grain Production System: A Spatial Resilience Perspective. Sustainability 2017, 9, 2340. [Google Scholar] [CrossRef] [Green Version]
- Xu, S.W.; Wu, J.Z.; Song, W.; Li, Z.Q.; Li, Z.M.; Kong, F.T. Spatial-Temporal Changes in Grain Production, Consumption and Driving Mechanism. J. Integr. Agric. 2013, 12, 374–385. [Google Scholar] [CrossRef]
- Fan, J.; Wang, Y.X.; Liang, B. The evolution process and regulation of China’s regional development pattern. Acta Geogr. Sin. 2019, 74, 2437–2454. (In Chinese) [Google Scholar] [CrossRef]
- Bian, H.Y.; Gao, J.; Wu, J.G.; Sun, X.; Du, Y. Hierarchical analysis of landscape urbanization and its impacts on regional sustainability: A case study of the Yangtze River Economic Belt of China. J. Clean. Prod. 2020, 279, 123267. [Google Scholar] [CrossRef]
- Ye, Y.J.; Qi, Q.W.; Jiang, L.L.; Li, X.F. Spatial-temporal changes in grain input-output and the driving mechanism in China since 1985. Int. J. Agric. Sustain. 2017, 15, 445–456. [Google Scholar] [CrossRef]
- Ma, B.; Chen, L. Analysis of the “scissors gap” between grain production and economic development in major grain-producing regions. Rural Econ. 2019, 5, 51–59. (In Chinese) [Google Scholar]
- Yin, W.; Yao, C.S.; Huang, L. Spatial-temporal Evolution of Coupling Coordination of Grain Production and Economic Development in China. Chin. J. Agric. Resour. Reg. Plan. 2020, 41, 110–121. (In Chinese) [Google Scholar] [CrossRef]
- Qi, H.; Wu, L. Analysis on Coordination Degree of Grain Production Pattern and Income Level in Main Producing Areas of China. Econ. Geogr. 2017, 37, 156–163. (In Chinese) [Google Scholar] [CrossRef]
- Mocanu, I.; Grigorescu, I.; Mitrică, B.; Popovici, E.A.; Dumitrascu, M. Regional disparities related to socio-economic determinants of agriculture in the Romanian Plain. J. Urban Reg. Anal. 2018, 10, 79–99. [Google Scholar] [CrossRef]
- Feng, Z.M.; Liu, X.N. Multi-scale Studies on the Space Consistency between Population Distribution and Economic Development in China. Popul. Econ. 2013, 2, 3–11. (In Chinese) [Google Scholar]
- Ge, M.L.; Feng, Z.M. Population Distribution of China Based on GIS: Classification of Population Densities and Curve of Population Gravity Centers. Acta Geogr. Sin. 2009, 64, 202–210. (In Chinese) [Google Scholar]
- Miller, H.J. Tobler’s First Law and Spatial Analysis. Ann. Assoc. Am. Geogr. 2004, 94, 284–289. [Google Scholar] [CrossRef]
- Yu, X.; Sun, J.X.; Sun, S.K.; Yang, F.; Lu, Y.J.; Wang, Y.B.; Wu, F.J.; Liu, P. A comprehensive analysis of regional grain production characteristics in China from the scale and efficiency perspectives. J. Clean. Prod. 2019, 212, 610–621. [Google Scholar] [CrossRef]
- Liang, B.Y.; Liu, H.Y.; Quine, T.A.; Chen, X.Q.; Hallett, P.D.; Cressey, E.L.; Zhu, X.R.; Cao, J.; Yang, S.H.; Wu, L.; et al. Analysing and simulating spatial patterns of crop yield in Guizhou Province based on artificial neural networks. Prog. Phys. Geogr. 2021, 45, 33–52. [Google Scholar] [CrossRef]
- Jiang, H.P. The Implementation of Grain Policy and Its Involving Effect from 2013 to 2017. Reform 2018, 2, 64–74. (In Chinese) [Google Scholar]
- Gao, Y.H.; Zhang, Y.S.; Yang, M.J. 20 Years of China’s Western Development: A Comparison of the Northwest Regions and Southwest Regions. Reg. Econ. Rev. 2020, 5, 36–51. (In Chinese) [Google Scholar] [CrossRef]
- Li, P.; Tian, Y.; Wu, J.J.; Xu, W.C. The Great Western Development Policy: How it Affected Grain Crop Production, Land Use and Rural Poverty in Western China. China Agric. Econ. Rev. 2021, 13, 319–348. [Google Scholar] [CrossRef]
- Hou, M.Y.; Deng, Y.J.; Yao, S.B. Spatial Agglomeration Pattern and Driving Factors of Grain Production in China since the Reform and Opening Up. Land 2021, 10, 10. [Google Scholar] [CrossRef]
- Wang, J.Y.; Zhang, Z.W.; Liu, Y.S. Spatial shifts in grain production increases in China and implications for food security. Land Use Policy 2018, 74, 204–213. [Google Scholar] [CrossRef]
- Liu, Y.J.; Lin, E.D. Effects of climate change on agriculture in different regions of China. Adv. Clim. Chang. Res. 2007, 3, 229–233. [Google Scholar]
- The State Council of China. 2010. Available online: http://www.gov.cn/zwgk/2011-06/08/content_1879180.htm (accessed on 7 October 2021).
- Kirwan, B.E. U.S. farm dynamics and the distribution of U.S. agricultural subsidies. Appl. Econ. Lett. 2017, 24, 207–209. [Google Scholar] [CrossRef]
- Alons, G. Environmental policy integration in the EU’s common agricultural policy: Greening or greenwashing? J. Eur. Public Policy 2017, 24, 1604–1622. [Google Scholar] [CrossRef] [Green Version]
Figure 1.
Division of the four regions in mainland China.

Figure 2.
Spatial patterns of different coordination types between grain production and economic development in China between 2000–2017.
Figure 2.
Spatial patterns of different coordination types between grain production and economic development in China between 2000–2017.

Figure 3.
Conversion types between China’s grain production and economic development between 2000–2017.
Figure 3.
Conversion types between China’s grain production and economic development between 2000–2017.

Figure 4.
Conversion of counties with a significantly higher grain agglomeration level than economic agglomeration level into other types.
Figure 4.
Conversion of counties with a significantly higher grain agglomeration level than economic agglomeration level into other types.

Figure 5.
Change of China’s CGE index between 2000–2017.

Figure 6.
Hierarchical thematic map series of change intensity in China’s CGE index.

Figure 7.
Gravity center shift of changes in China’s CGE index between 2000–2017.

Figure 8.
Spatial distribution of changes in China’s CGE index.

Figure 9.
Spatial patterns of geographic concentration of economic development in China between 2000–2017.
Figure 9.
Spatial patterns of geographic concentration of economic development in China between 2000–2017.

Figure 10.
Spatial patterns of geographic concentration of grain in China between 2000–2017.


Table 1.
Different coordination types between grain production and economic development in China between 2000–2017 (%).
Table 1.
Different coordination types between grain production and economic development in China between 2000–2017 (%).
| 2000 | 2017 | |||||||||
|---|---|---|---|---|---|---|---|---|---|---|
| Nation | Eastern Region | Central Region | Western Region | Northeastern Region | Nation | Eastern Region | Central Region | Western Region | Northeastern Region | |
| I | 9.00 | 21.26 | 3.81 | 5.94 | 10.67 | 29.82 | 53.26 | 13.83 | 30.73 | 12.00 |
| II | 7.01 | 15.22 | 3.81 | 5.01 | 6.00 | 16.40 | 13.77 | 16.03 | 13.50 | 6.67 |
| III | 12.38 | 22.71 | 11.42 | 7.68 | 9.33 | 17.10 | 12.80 | 23.65 | 17.35 | 6.00 |
| IV | 25.20 | 27.29 | 30.06 | 21.42 | 19.33 | 17.20 | 10.87 | 25.65 | 19.91 | 5.33 |
| V | 46.42 | 13.53 | 50.90 | 59.95 | 54.67 | 19.48 | 8.94 | 20.84 | 18.51 | 70.00 |
Note: Type I: Grain agglomeration much lower than the economic agglomeration; Type II: Grain agglomeration slightly lower than the economic agglomeration; Type III: Grain agglomeration basically coordinated with the economic agglomeration; Type IV: Grain agglomeration slightly higher than the economic agglomeration; Type V: Grain agglomeration much higher than the economic agglomeration.
Table 2.
The number of counties of conversion types for grain production and economic development in China between 2000–2017.
Table 2.
The number of counties of conversion types for grain production and economic development in China between 2000–2017.
| Type | I | II | III | IV | V |
|---|---|---|---|---|---|
| I | 165 | 8 | 3 | 0 | 5 |
| II | 110 | 14 | 7 | 4 | 6 |
| III | 123 | 64 | 29 | 21 | 12 |
| IV | 122 | 113 | 125 | 86 | 61 |
| V | 80 | 81 | 178 | 259 | 336 |
Note: Type I: Grain agglomeration much lower than the economic agglomeration; Type II: Grain agglomeration slightly lower than the economic agglomeration; Type III: Grain agglomeration basically coordinated with the economic agglomeration; Type IV: Grain agglomeration slightly higher than the economic agglomeration; Type V: Grain agglomeration much higher than the economic agglomeration.
Publisher’s Note: MDPI stays neutral with regard to jurisdictional claims in published maps and institutional affiliations. |
© 2021 by the authors. Licensee MDPI, Basel, Switzerland. This article is an open access article distributed under the terms and conditions of the Creative Commons Attribution (CC BY) license (https://creativecommons.org/licenses/by/4.0/).
Share and Cite
MDPI and ACS Style
Xie, K.; Ding, M.; Zhang, J.; Chen, L. Trends towards Coordination between Grain Production and Economic Development in China. Agriculture 2021, 11, 975. https://doi.org/10.3390/agriculture11100975
AMA Style
Xie K, Ding M, Zhang J, Chen L. Trends towards Coordination between Grain Production and Economic Development in China. Agriculture. 2021; 11(10):975. https://doi.org/10.3390/agriculture11100975
Chicago/Turabian StyleXie, Kun, Mingjun Ding, Jianrong Zhang, and Liwen Chen. 2021. "Trends towards Coordination between Grain Production and Economic Development in China" Agriculture 11, no. 10: 975. https://doi.org/10.3390/agriculture11100975
Note that from the first issue of 2016, this journal uses article numbers instead of page numbers. See further details here.