
Impact of COVID-19 Lockdown on Anthropometric Variables, Blood Pressure, and Glucose and Lipid Profile in Healthy Adults: A before and after Pandemic Lockdown Longitudinal Study

 , , ,
, , ,
Abstract
:1. Introduction
2. Materials and Methods
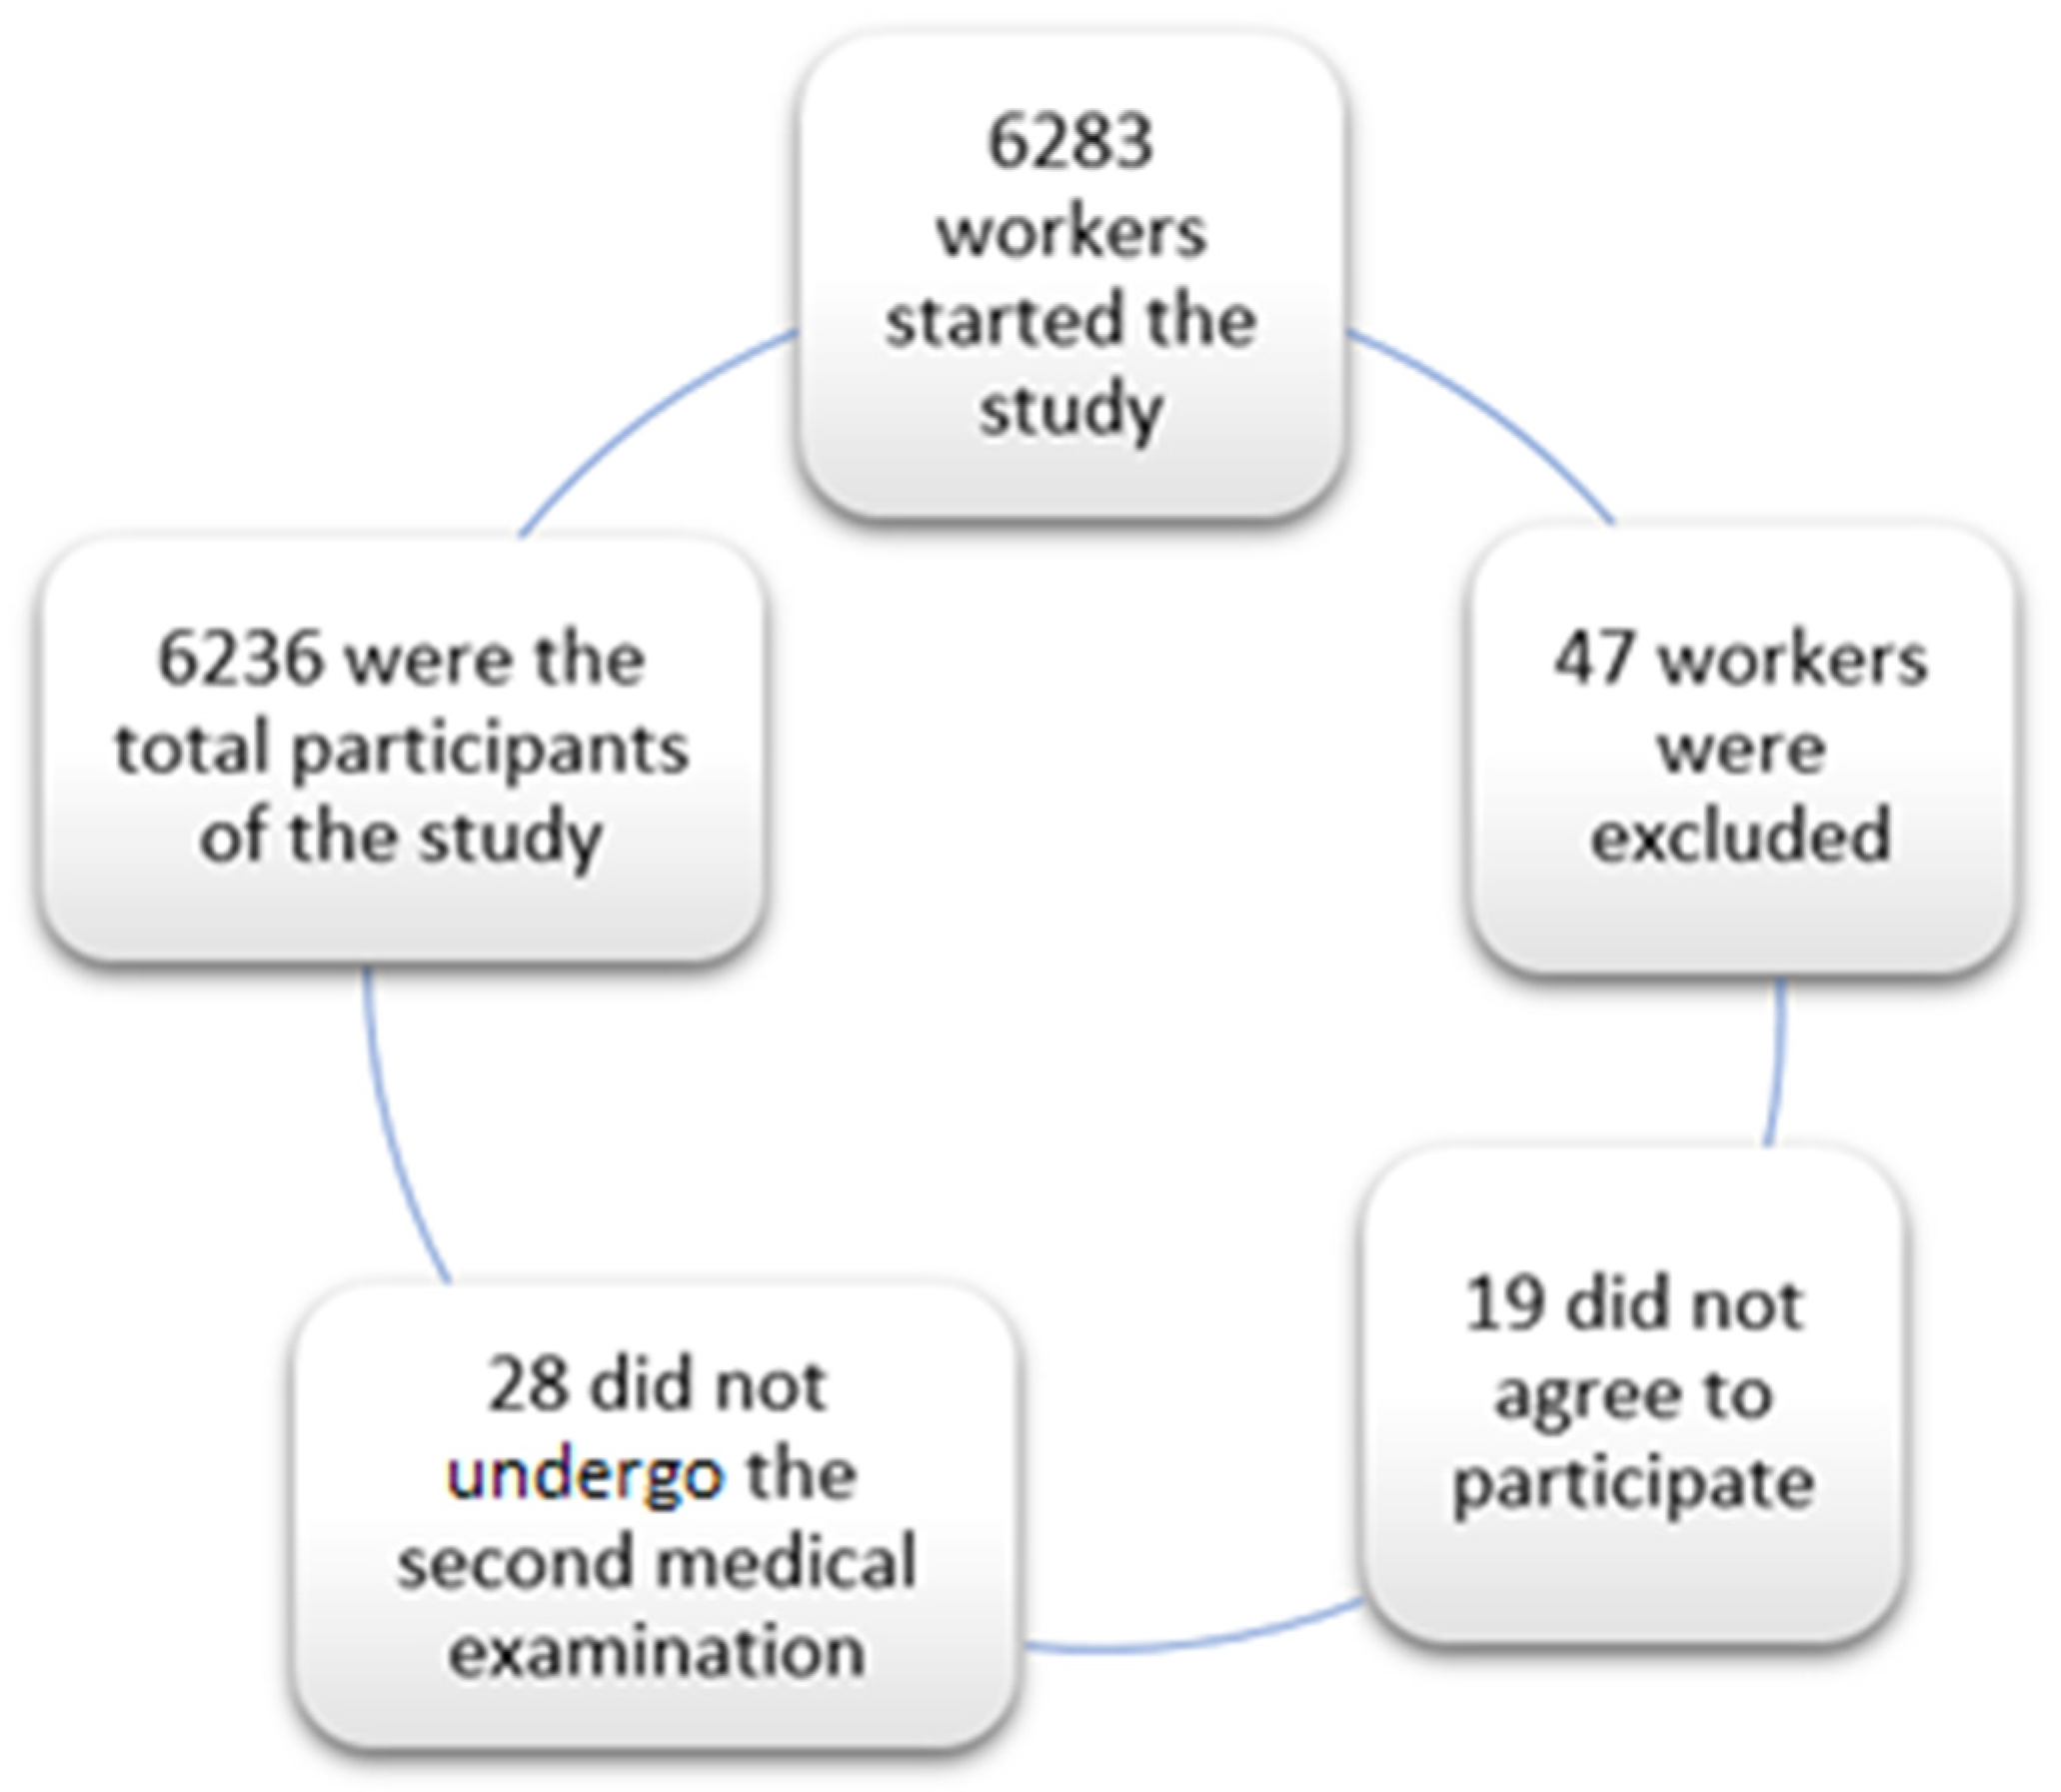
- -
- Aged between 18 and 69 years;
- -
- Being an active worker;
- -
- Healthy population, without underlying diseases that do not allow passing the annual medical check-up;
- -
- Belonging to one of the companies collaborating in the study;
- -
- Agreeing to participate in the study.
2.1. Statistical Analysis
2.2. Ethical Considerations and Aspects
3. Results
4. Discussion
5. Strengths and Limitations
6. Conclusions
Author Contributions
Funding
Institutional Review Board Statement
Informed Consent Statement
Data Availability Statement
Conflicts of Interest
References
- Chen, N.; Zhou, M.; Dong, X.; Qu, J.; Gong, F.; Han, Y.; Qiu, Y.; Wang, J.; Liu, Y.; Wei, Y.; et al. Epidemiological and clinical characteristics of 99 cases of 2019 novel coronavirus pneumonia in Wuhan, China: A descriptive study. Lancet 2020, 395, 507–513. [Google Scholar] [CrossRef] [Green Version]
- Wuhan Seafood Market Pneumonia Virus Isolate Wuhan-Hu-1, Complete Genome. 23 January 2020; [citado 7 February 2020]. Available online: http://www.ncbi.nlm.nih.gov/nuccore/MN908947.3 (accessed on 2 November 2021).
- Huang, C.; Wang, Y.; Li, X.; Ren, L.; Zhao, J.; Hu, Y.; Zhang, L.; Fan, G.; Xu, J.; Gu, X.; et al. Clinical features of patients infected with 2019 novel coronavirus in Whuam, China. Lancet 2020, 395, 497–506. [Google Scholar] [CrossRef] [Green Version]
- Galanopoulos, M.; Gkeros, F.; Doukatas, A.; Karianakis, G.; Pontas, C.; Tsoukalas, N.; Viazis, N.; Liatsos, C.; Mantzaris, G.J. COVID-19 pandemic: Pathophysiology and manifestations from the gastrointestinal tract. World J. Gastroenterol. 2020, 26, 4579–4588. [Google Scholar] [CrossRef] [PubMed]
- Guan, W.-J.; Ni, Z.-Y.; Hu, Y.; Liang, W.-H.; Ou, C.-Q.; He, J.-X.; Liu, L.; Shan, H.; Lei, C.-l.; Hui, D.S.C.; et al. Clinical Characteristics of Coronavirus Disease 2019 in China. N. Engl. J. Med. 2020, 382, 1708–1720. [Google Scholar] [CrossRef]
- Centers for Disease Control and Prevention. Coronavirus Disease 2019 (COVID-19)—Cases, Data, & Surveillance. Available online: https://www.cdc.gov/coronavirus/2019-ncov/cases-updates/cases-in-us.html (accessed on 16 November 2021).
- Wu, F.; Zhao, S.; Yu, B.; Chen, Y.-M.; Wang, W.; Song, Z.-G.; Hu, Y.; Tao, Z.-W.; Tian, J.-H.; Pei, Y.-Y.; et al. A new coronavirus associated with human respiratory disease in China. Nature 2020, 579, 265–269. [Google Scholar] [CrossRef] [Green Version]
- Zhang, G.; Zhang, J.; Wang, B.; Zhu, X.; Wang, Q.; Qiu, S. Analysis of clinical characteristics and laboratory findings of 95 cases of 2019 novel coronavirus pneumonia in Wuhan, China: A retrospective analysis. Respir. Res. 2020, 21, 1–10. [Google Scholar] [CrossRef] [Green Version]
- Pollard, C.A.; Morran, M.P.; Nestor-Kalinoski, A.L. The COVID-19 pandemic: A global health crisis. Physiol. Genom. 2020, 52, 549–557. [Google Scholar] [CrossRef]
- Ward, M.P.; Li, X.; Tian, K. Novel coronavirus 2019, an emerging public health emergency. Transbound. Emerg. Dis. 2020, 67, 469–470. [Google Scholar] [CrossRef]
- Koh, D. COVID-19 lockdowns throughout the world. Occup. Med. 2020, 70, 322. [Google Scholar] [CrossRef]
- Real Decreto 463/2020, de 14 de Marzo, por el que se Declara el Estado de Alarma para la Gestión de la Situación de crisis Sanitaria Ocasionada por el COVID-19. Available online: https://www.boe.es/buscar/doc.php?id=BOE-A-2020-3692 (accessed on 2 February 2022).
- Owen, A.J.; Tran, T.; Hammarberg, K.; Kirkman, M.; Fisher, J.; The COVID-19 Restrictions Impact Research Group. Poor appetite and overeating reported by adults in Australia during the coronavirus-19 disease pandemic: A population-based study. Public Health Nutr. 2021, 24, 275–281. [Google Scholar] [CrossRef]
- Constandt, B.; Thibaut, E.; De Bosscher, V.; Scheerder, J.; Ricour, M.; Willem, A. Exercising in times of lockdown: An analysis of the impact of COVID-19 on levels and patterns of exercise among adults in Belgium. Int. J. Environ. Res. Public Health 2020, 17, 4144. [Google Scholar] [CrossRef]
- Levi, S. The Pandemic Has More Than Doubled Food-Delivery Apps’ Business. Now What? 2020. Available online: https://www.marketwatch.com/story/the-pandemic-has-more-than-doubled-americans-use-of-food-delivery-apps-but-that-doesnt-mean-the-companies-are-making-money-11606340169 (accessed on 20 November 2021).
- Skotnicka, M.; Karwowska, K.; Kłobukowski, F.; Wasilewska, E.; Małgorzewicz, S. Dietary Habits before and during the COVID-19 Epidemic in Selected European Countries. Nutrients 2021, 13, 1690. [Google Scholar] [CrossRef]
- Di Renzo, L.; Gualtieri, P.; Pivari, F.; Soldati, L.; Attinà, A.; Cinelli, G.; Leggeri, C.; Caparello, G.; Barrea, L.; Scerbo, F.; et al. Eating habits and lifestyle changes during COVID-19 lockdown: An Italian survey. J. Transl. Med. 2020, 18, 229. [Google Scholar] [CrossRef]
- Bennett, G.; Young, E.; Butler, I.; Coe, S. The Impact of Lockdown During the COVID-19 Outbreak on Dietary Habits in Various Population Groups: A Scoping Review. Front. Nutr. 2021, 8, 53. [Google Scholar] [CrossRef]
- Son, C.; Hegde, S.; Smith, A.; Wang, X.; Sasangohar, F. Effects of COVID-19 on College Students’ Mental Health in the United States: Interview Survey Study. J. Med. Internet Res. 2020, 22, e21279. [Google Scholar] [CrossRef]
- Shah, M.; Sachdeva, M.; Johnston, H. Eating disorders in the age of COVID-19. Psychiatry Res. 2020, 290, 113122. [Google Scholar] [CrossRef]
- Rodríguez-Pérez, C.; Molina-Montes, E.; Verardo, V.; Artacho, R.; García-Villanova, B.; Guerra-Hernández, E.J.; Ruíz-López, M.D. Changes in Dietary Behaviours during the COVID-19 Outbreak Confinement in the Spanish COVIDiet Study. Nutrients 2020, 12, 1730. [Google Scholar] [CrossRef]
- Bakaloudi, D.R.; Jeyakumar, D.T.; Jayawardena, R.; Chourdakis, M. The impact of COVID-19 lockdown on snacking habits, fast-food and alcohol consumption: A systematic review of the evidence. Clin. Nutr. 2021, 17, S0261-5614(21)00212-0. [Google Scholar] [CrossRef]
- Deschasaux-Tanguy, M.; Druesne-Pecollo, N.; Esseddik, Y.; de Edelenyi, F.S.; Allès, B.; Andreeva, V.A.; Baudry, J.; Charreire, H.; Deschamps, V.; Egnell, M.; et al. Diet and physical activity during the coronavirus disease 2019 (COVID-19) lockdown (March–May 2020): Results from the French NutriNet-Santé cohort study. Am. J. Clin. Nutr. 2021, 113, 924–938. [Google Scholar] [CrossRef]
- Pinto, J.; van Zeller, M.; Amorim, P.; Pimentel, A.; Dantas, P.; Eusébio, E. Sleep quality in times of COVID-19 pandemic. Sleep Med. 2020, 74, 81–85. [Google Scholar] [CrossRef]
- Kumar, N.; Gupta, R. Disrupted Sleep During a Pandemic. Sleep Med. Clin. 2022, 17, 41–52. [Google Scholar] [CrossRef]
- Gualano, M.R.; Lo Moro, G.; Voglino, G.; Bert, F.; Siliquini, R. Effects of COVID-19 Lockdown on Mental Health and Sleep Disturbances in Italy. Int. J. Environ. Res. Public Health 2020, 17, 4779. [Google Scholar] [CrossRef]
- Manz, K.; Mensink, G.B.M.; Finger, J.D.; Haftenberger, M.; Brettschneider, A.-K.; Lage Barbosa, C. Associations between physical activity and food intake among children and adolescents: Results of KiGGS Wave 2. Nutrients 2019, 11, 1060. [Google Scholar] [CrossRef] [Green Version]
- Taeymans, J.; Luijckx, E.; Rogan, S.; Haas, K.; Baur, H. Physical Activity, Nutritional Habits, and Sleeping Behavior in Students and Employees of a Swiss University During the COVID-19 Lockdown Period: Questionnaire Survey Study. JMIR Public Health Surveill. 2021, 7, e26330. [Google Scholar] [CrossRef]
- Fernandez-Rio, J.; Cecchini, J.A.; Mendez-Gimenez, A.; Carriedo, A. Weight changes during the COVID-19 home confinement. Effects on psychosocial variables. Obes. Res. Clin. Pract. 2020, 14, 383–385. [Google Scholar] [CrossRef]
- Singu, S.; Acharya, A.; Challagundla, K.; Byrareddy, S.N. Impact of Social Determinants of Health on the Emerging COVID-19 Pandemic in the United States. Front. Public Health 2020, 8, 406. [Google Scholar] [CrossRef]
- Shivalkar, S.; Pingali, M.S.; Verma, A.; Singh, A.; Singh, V.; Paital, B.; Das, D.; Varadwaj, P.K.; Samanta, S.K. Outbreak of COVID-19: A Detailed Overview and Its Consequences. Adv. Exp. Med. Biol. 2021, 1353, 23–45. [Google Scholar] [CrossRef]
- Pal, A.; Ahirwar, A.K.; Sakarde, A.; Asia, P.; Gopal, N.; Alam, S.; Kaim, K.; Ahirwar, P.; Sorte, S.R. COVID-19 and cardiovascular disease: A review of current knowledge. Horm. Mol. Biol. Clin. Investig. 2021, 42, 99–104. [Google Scholar] [CrossRef]
- López-González, A.A.; Ramírez Manent, J.I.; Vicente-Herrero, M.T.; García Ruiz, E.; Albaladejo Blanco, M.; López Safont, N. Prevalence of diabesity in the Spanish working population: Influence of sociodemographic variables and tobacco consumption. An. Sist. Sanit. Navar. 2021. online ahead of print. [Google Scholar] [CrossRef]
- Lee, P.H.; Macfarlane, D.J.; Lam, T.H.; Stewart, S.M. Validity of the international physical activity questionnaire short form (IPAQ-SF): A systematic review. Int. J. Behav. Nutr. Phys. Act. 2011, 8, 115. [Google Scholar] [CrossRef] [Green Version]
- White, A. Men and COVID-19: The aftermath. Postgrad. Med. 2020, 132, 18–27. [Google Scholar] [CrossRef] [PubMed]
- Guzik, T.J.; Mohiddin, S.A.; DiMarco, A.; Patel, V.; Savvatis, K.; Marelli-Berg, F.M.; Madhur, M.S.; Tomaszewski, M.; Maffia, P.; D’Acquisto, F.; et al. COVID-19 and the cardiovascular system: Implications for risk assessment, diagnosis, and treatment options. Cardiovasc. Res. 2020, 116, 1666–1687. [Google Scholar] [CrossRef] [PubMed]
- Lima-Martínez, M.M.; Boada, C.C.; Madera-Silva, M.D.; Marín, W.; Contreras, M. COVID-19 and diabetes: A bidirectional relationship. Clínica e Investigación en Arteriosclerosis (Engl. Ed.) 2021, 33, 151–157. [Google Scholar] [CrossRef] [PubMed]
- Beran, D.; Perone, S.A.; Perolini, M.C.; Chappuis, F.; Chopard, P.; Haller, D.M.; Bausch, F.J.; Maisonneuve, H.; Perone, N.; Gastaldi, G. Beyond the virus: Ensuring continuity of care for people with diabetes during COVID-19. Prim. Care Diabetes 2021, 15, 16–17. [Google Scholar] [CrossRef]
- Martínez-Quintana, E.; Vega-Acedo, L.D.C.; Santana-Herrera, D.; Pérez-Acosta, C.; Medina-Gil, J.M.; Muñoz-Díaz, E.; Rodríguez-González, F. Mental well-being among patients with congenital heart disease and heart failure during the COVID-19 pandemic. Am. J. Cardiovasc. Dis. 2021, 11, 618–623. [Google Scholar]
- Sohn, M.; Koo, B.K.; Yoon, H.I.; Song, K.-H.; Kim, E.S.; Bin Kim, H.; Lim, S. Impact of COVID-19 and Associated Preventive Measures on Cardiometabolic Risk Factors in South Korea. J. Obes. Metab. Syndr. 2021, 30, 248–260. [Google Scholar] [CrossRef]
- Kaufman-Shriqui, V.; Navarro, D.A.; Raz, O.; Boaz, M. Multinational dietary changes and anxiety during the coronavirus pan-demic-findings from Israel. Isr. J. Health Policy Res. 2021, 10, 28. [Google Scholar] [CrossRef]
- Kriaucioniene, V.; Bagdonaviciene, L.; Rodríguez-Pérez, C.; Petkeviciene, J. Associations between Changes in Health Behav-iours and Body Weight during the COVID-19 Quarantine in Lithuania: The Lithuanian COVIDiet Study. Nutrients 2020, 12, 3119. [Google Scholar] [CrossRef]
- He, M.; Xian, Y.; Lv, X.; He, J.; Ren, Y. Changes in Body Weight, Physical Activity, and Lifestyle During the Semi-lockdown Period After the Outbreak of COVID-19 in China: An Online Survey. Disaster Med. Public Health Prep. 2021, 15, e23–e28. [Google Scholar] [CrossRef]
- Robinson, E.; Boyland, E.; Chisholm, A.; Harrold, J.; Maloney, N.G.; Marty, L.; Mead, B.R.; Noonan, R.; Hardman, C.A. Obesity, eating behavior and physical activity during COVID-19 lockdown: A study of UK adults. Appetite 2021, 156, 104853. [Google Scholar] [CrossRef]
- Ammar, A.; Brach, M.; Trabelsi, K.; Chtourou, H.; Boukhris, O.; Masmoudi, L.; Bouaziz, B.; Bentlage, E.; How, D.; Ahmed, M.; et al. Effects of COVID-19 Home Confinement on Eating Behaviour and Physical Activity: Results of the ECLB-COVID19 International Online Survey. Nutrients 2020, 12, 1583. [Google Scholar] [CrossRef]
- Paltrinieri, S.; Bressi, B.; Costi, S.; Mazzini, E.; Cavuto, S.; Ottone, M.; De Panfilis, L.; Fugazzaro, S.; Rondini, E.; Rossi, P.G. Beyond Lockdown: The potential side effects of the SARS-CoV-2 pandemic on public health. Nutrients 2021, 13, 1600. [Google Scholar] [CrossRef]
- Palmer, K.; Monaco, A.; Kivipelto, M.; Onder, G.; Maggi, S.; Michel, J.-P.; Prieto, R.; Sykara, G.; Donde, S. The potential long-term impact of the COVID-19 outbreak on patients with non-communicable diseases in Europe: Consequences for healthy ageing. Aging Clin. Exp. Res. 2020, 32, 1189–1194. [Google Scholar] [CrossRef]
- Mattioli, A.V.; Sciomer, S.; Cocchi, C.; Maffei, S.; Gallina, S. Quarantine during COVID-19 outbreak: Changes in diet and physical activity increase the risk of cardiovascular disease. Nutr. Metab. Cardiovasc. Dis. 2020, 30, 1409–1417. [Google Scholar] [CrossRef]
- Flanagan, E.W.; Beyl, R.A.; Fearnbach, S.N.; Altazan, A.D.; Martin, C.K.; Redman, L.M. The Impact of COVID-19 Stay-At-Home Orders on Health Behaviors in Adults. Obesity 2021, 29, 438–445. [Google Scholar] [CrossRef]
- Bakaloudi, D.R.; Barazzoni, R.; Bischoff, S.C.; Breda, J.; Wickramasinghe, K.; Chourdakis, M. Impact of the first COVID-19 lockdown on body weight: A combined systematic review and a meta-analysis. Clin. Nutr. 2021, 20, S0261-5614(21)00207-7. [Google Scholar] [CrossRef]
- Bhutani, S.; Vandellen, M.; Cooper, J. Longitudinal Weight Gain and Related Risk Behaviors during the COVID-19 Pandemic in Adults in the US. Nutrients 2021, 13, 671. [Google Scholar] [CrossRef]
- Alshahrani, S.M.; Alghannam, A.F.; Taha, N.; Alqahtani, S.S.; Al-Mutairi, A.; Al-Saud, N.; Alghnam, S. The Impact of COVID-19 Pandemic on Weight and Body Mass Index in Saudi Arabia: A Longitudinal Study. Front. Public Health 2022, 9, 775022. [Google Scholar] [CrossRef]
- Jontez, N.B.; Novak, K.; Kenig, S.; Petelin, A.; Pražnikar, Z.J.; Mohorko, N. The Impact of COVID-19-Related Lockdown on Diet and Serum Markers in Healthy Adults. Nutrients 2021, 13, 1082. [Google Scholar] [CrossRef]
- Martinez-Ferran, M.; De La Guía-Galipienso, F.; Sanchis-Gomar, F.; Pareja-Galeano, H. Metabolic Impacts of Confinement during the COVID-19 Pandemic Due to Modified Diet and Physical Activity Habits. Nutrients 2020, 12, 1549. [Google Scholar] [CrossRef]
- Dehghan, M.; Mente, A.; Zhang, X.; Swaminathan, S.; Li, W.; Mohan, V.; Iqbal, R.; Kumar, R.; Wentzel-Viljoen, E.; Rosengren, A.; et al. Associations of fats and carbohydrate intake with cardiovascular disease and mortality in 18 countries from five continents (PURE): A prospective cohort study. Lancet 2017, 390, 2050–2062. [Google Scholar] [CrossRef] [Green Version]
- Aajal, A.; El Boussaadani, B.; Hara, L.; Benajiba, C.; Boukouk, O.; Benali, M.; Ouadfel, O.; Bendoudouch, H.; Zergoune, N.; Alkattan, D.; et al. The consequences of the lockdown on cardiovascular diseases. Ann. Cardiol. Angeiol. 2021, 70, 94–101. [Google Scholar] [CrossRef]
- Wu, Y.; Li, H.; Tao, X.; Fan, Y.; Gao, Q.; Yang, J. Optimised anthropometric indices as predictive screening tools for metabolic syndrome in adults: A cross-sectional study. BMJ Open 2021, 11, e043952. [Google Scholar] [CrossRef]
- Saklayen, M.G. The Global Epidemic of the Metabolic Syndrome. Curr. Hypertens. Rep. 2018, 20, 1–8. [Google Scholar] [CrossRef] [Green Version]
- Bovolini, A.; Garcia, J.; Andrade, M.A.; Duarte, J.A. Metabolic Syndrome Pathophysiology and Predisposing Factors. Int. J. Sports Med. 2021, 42, 199–214. [Google Scholar] [CrossRef] [PubMed]
- Yanai, H. Metabolic Syndrome and COVID-19. Cardiol. Res. 2020, 11, 360–365. [Google Scholar] [CrossRef] [PubMed]
- Bansal, R.; Gubbi, S.; Muniyappa, R. Metabolic Syndrome and COVID 19: Endocrine-Immune-Vascular Interactions Shapes Clinical Course. Endocrinology 2020, 161, bqaa112. [Google Scholar] [CrossRef] [PubMed]
- Stefan, N.; Birkenfeld, A.L.; Schulze, M.B. Global pandemics interconnected—Obesity, impaired metabolic health and COVID-19. Nat. Rev. Endocrinol. 2021, 17, 135–149. [Google Scholar] [CrossRef]
- Li, B.; Yang, J.; Zhao, F.; Zhi, L.; Wang, X.; Liu, L.; Bi, Z.; Zhao, Y. Prevalence and impact of cardiovascular metabolic diseases on COVID-19 in China. Clin. Res. Cardiol. 2020, 109, 531–538. [Google Scholar] [CrossRef]
- Chiu, T.-H.; Huang, Y.-C.; Chiu, H.; Wu, P.-Y.; Chiou, H.-Y.C.; Huang, J.-C.; Chen, S.-C. Comparison of Various Obesity-Related Indices for Identification of Metabolic Syndrome: A Population-Based Study from Taiwan Biobank. Diagnostics 2020, 10, 1081. [Google Scholar] [CrossRef]
- Gonzalez-Chávez, A.; Chávez-Fernández, J.A.; Elizondo-Argueta, S.; González-Tapia, A.; Leon-Pedroza, J.I.; Ochoa, C. Metabolic Syndrome and Cardiovascular Disease: A Health Challenge. Arch. Med Res. 2018, 49, 516–521. [Google Scholar] [CrossRef]
- Xu, Q.; Wang, L.; Ming, J.; Cao, H.; Liu, T.; Yu, X.; Bai, Y.; Liang, S.; Hu, R.; Chen, C.; et al. Using noninvasive anthropometric indices to develop and validate a predictive model for metabolic syndrome in Chinese adults: A nationwide study. BMC Endocr. Disord. 2022, 22, 53. [Google Scholar] [CrossRef]
- Delgado-Floody, P.; Álvarez, C.; Cadore, E.L.; Flores-Opazo, M.; Caamaño-Navarrete, F.; Izquierdo, M. Preventing metabolic syndrome in morbid obesity with resistance training: Reporting interindividual variability. Nutr. Metab. Cardiovasc. Dis. 2019, 29, 1368–1381. [Google Scholar] [CrossRef]
- Myers, J.; Kokkinos, P.; Nyelin, E. Physical Activity, Cardiorespiratory Fitness, and the Metabolic Syndrome. Nutrients 2019, 11, 1652. [Google Scholar] [CrossRef] [Green Version]
- Pinto, A.J.; Dunstan, D.W.; Owen, N.; Bonfa, E.; Gualano, B. Combating physical inactivity during the COVID-19 pandemic. Nat. Rev. Rheumatol. 2020, 16, 347–348. [Google Scholar] [CrossRef]
- Xie, Y.; You, Q.; Wu, C.; Cao, S.; Qu, G.; Yan, X.; Han, X.; Wang, C.; Zhang, H. Impact of Cardiovascular Disease on Clinical Characteristics and Outcomes of Coronavirus Disease 2019 (COVID-19). Circ. J. 2020, 84, 1277–1283. [Google Scholar] [CrossRef]
- Lavie, C.J.; Ozemek, C.; Carbone, S.; Katzmarzyk, P.T.; Blair, S.N. Sedentary Behavior, Exercise, and Cardiovascular Health. Circ. Res. 2019, 124, 799–815. [Google Scholar] [CrossRef]
- Hendren, N.; De Lemos, J.; Ayers, C.; Das, S.; Rao, A.; Carter, S.; Rosenblatt, A.; Walcho, J.; Omar, W.; Khera, R.; et al. Association of Body Mass Index and Age with Morbidity and Mortality in Patients Hospitalized with COVIS-19: Results From the American Heart Association COVID-19 Cardiovascular Disease Registry. Circulation 2021, 143, 135–144. [Google Scholar] [CrossRef]
- Hu, L.; Huang, X.; You, C.; Li, J.; Hong, K.; Li, P.; Wu, Y.; Wu, Q.; Wang, Z.; Gao, R.; et al. Prevalence of overweight, obesity, abdominal obesity and obesity-related risk factors in southern China. PLoS ONE 2017, 12, e0183934. [Google Scholar] [CrossRef]
- García-Tascón, M.; Sahelices-Pinto, C.; Mendaña-Cuervo, C.; Magaz-González, A.M. The Impact of the COVID-19 Confinement on the Habits of PA Practice According to Gender (Male/Female): Spanish Case. Int. J. Environ. Res. Public Health 2020, 17, 6961. [Google Scholar] [CrossRef]
- Wunsch, K.; Kienberger, K.; Niessner, C. Changes in Physical Activity Patterns Due to the COVID-19 Pandemic: A Systematic Review and Meta-Analysis. Int. J. Environ. Res. Public Health 2022, 19, 2250. [Google Scholar] [CrossRef] [PubMed]
- Castañeda-Babarro, A.; Arbillaga-Etxarri, A.; Gutiérrez-Santamaría, B.; Coca, A. Physical Activity Change during COVID-19 Confinement. Int. J. Environ. Res. Public Health 2020, 17, 6878. [Google Scholar] [CrossRef] [PubMed]
- Violant-Holz, V.; Gallego-Jiménez, M.G.; González-González, C.S.; Muñoz-Violant, S.; Rodríguez, M.J.; Sansano-Nadal, O.; Guerra-Balic, M. Psychological Health and Physical Activity Levels during the COVID-19 Pandemic: A Systematic Review. Int. J. Environ. Res. Public Health 2020, 17, 9419. [Google Scholar] [CrossRef] [PubMed]
- De Rubies, V.; Lee, J.; Anwer, M.S.; Yoshida-Montezuma, Y.; Andreacchi, A.; Stone, E.; Iftikhar, S.; Motgenstern, J.; Rebinsky, R.; Neil-Sztramlo, S.; et al. Impact of disasters, including pandemics, on cardiometabolic outcomes across the life-course: A systematic review. BMJ Open 2021, 11, e047152. [Google Scholar] [CrossRef]


| Year 2018 | Year 2019 | Year 2020 | ||
|---|---|---|---|---|
| N = 6236 | Mean ± SD | Mean ± SD | Mean ± SD | p-Value |
| Age (years) | 41.1 ± 9.9 | 42.1 ± 9.9 | 43.1 ± 9.9 | <0.001 |
| Weight (kg) | 71.7 ± 16.3 | 72.2 ± 16.4 | 73.8 ± 16.5 | <0.001 |
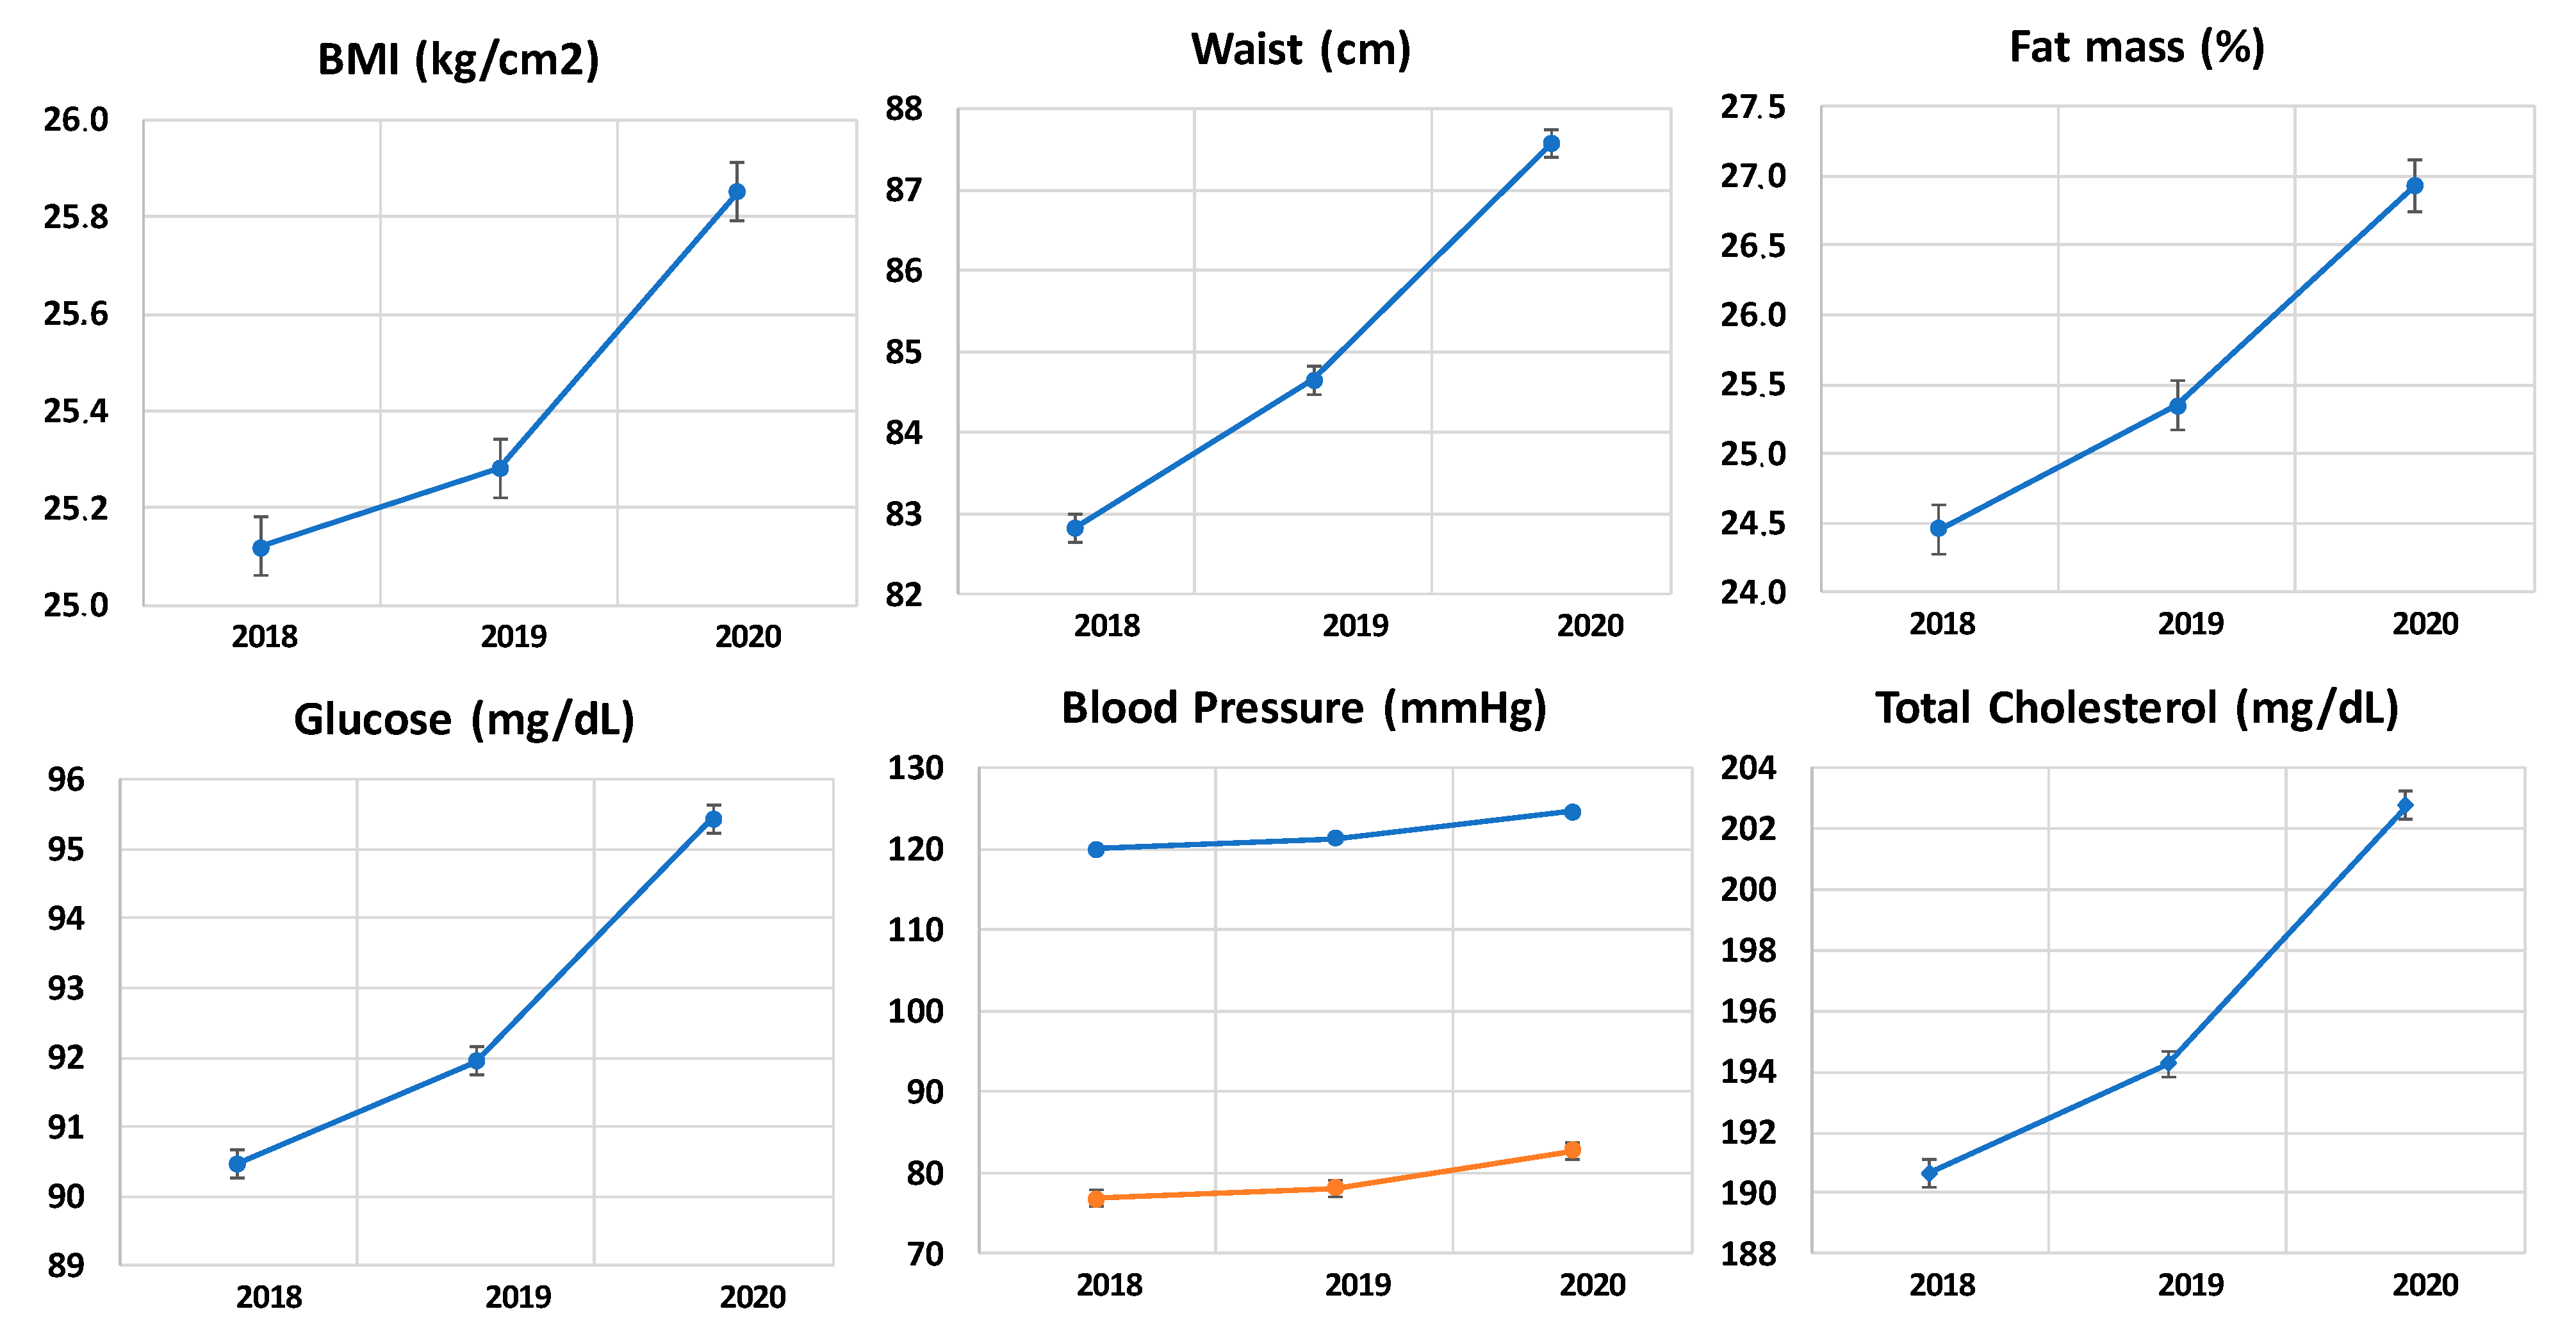
| BMI (kg/m2) | 25.1 ± 4.7 | 25.3 ± 4,7 | 25.9 ± 4.7 | <0.001 |
| Waist circumference (cm) | 82.8 ± 14.0 | 84.6 ± 14.1 | 87.6 ± 14.1 | <0.001 |
| Hip circumference (cm) | 98.7 ± 9.4 | 99.8 ± 9.4 | 101.5 ± 9.5 | <0.001 |
| Waist to Height ratio | 0.49 ± 0.08 | 0.50 ± 0.08 | 0.52 ± 0.08 | <0.001 |
| Waist to hip ratio | 0.84 ± 0.10 | 0.85 ± 0.09 | 0.86 ± 0.09 | <0.001 |
| Body fat (%) | 24.5 ± 9.1 | 25.3 ± 8.7 | 26.9 ± 8.8 | <0.001 |
| SBP (mmHg) | 120.0 ± 16.8 | 121.3 ± 16.3 | 124.6 ± 16.3 | <0.001 |
| DBP (mmHg) | 76.9 ± 10.7 | 78.2 ± 10.5 | 82.8 ± 10.6 | <0.001 |
| Glycaemia (mg/dL) | 90.5 ± 16.4 | 91.9 ± 15.7 | 95.4 ± 15.8 | <0.001 |
| Total cholesterol (mg/dL) | 190.7 ± 37.3 | 194.3 ± 35.3 | 202.8 ± 35.7 | <0.001 |
| HDL-c (mg/dL) | 53.9 ± 13.7 | 53.1 ± 13.4 | 50.7 ± 13.7 | <0.001 |
| LDL-c (mg/dL) | 117.4 ± 40.3 | 121.4 ± 38.5 | 131.0 ± 39.0 | <0.001 |
| Triglycerides (mg/dL) | 96.8 ± 79.2 | 98.7 ± 78.5 | 105.8 ± 78.9 | <0.001 |
| N (%) | N (%) | N (%) | p-value | |
| Smokers | 1176 (18.9) | 1202 (19.3) | 1302 (20.9) | <0.001 |
| Physical exercise | 2732 (43.8) | 2600 (41.7) | 2044 (32.8) | <0.001 |
| Normal weight | 3500 (56.1) | 3398 (54.5) | 3085 (49.5) | <0.001 |
| Overweight | 1890 (30.3) | 1978 (31.7) | 2144 (34.4) | |
| Obesity | 846 (13.6) | 860 (13.8) | 1007 (16.1) | |
| Waist to height ratio high | 2526 (40.5) | 2826 (45.3) | 3368 (54.0) | <0.001 |
| Waist to hip ratio high | 1460 (23.4) | 1612 (25.8) | 1944 (31.2) | <0.001 |
| Body fat normal | 4115 (66.0) | 3996 (64.1) | 3722 (59.7) | <0.001 |
| Body fat high | 1394 (22.4) | 1428 (22.9) | 1466 (23.5) |
| 2018–2019 Change | 2019–2020 Change | |
|---|---|---|
| Weight (kg) | 0.47 ± 1.04 | 1.61 ± 1.28 |
| BMI (kg/m2) | 0.16 ± 0.37 | 0.57 ± 0.46 |
| Waist circumference (cm) | 1.82 ± 4.87 | 2.92 ± 1.17 |
| Hip circumference (cm) | 1.14 ± 0.85 | 1.69 ± 1.15 |
| Waist to Height ratio | 0.01 ± 0.03 | 0.02 ± 0.01 |
| Waist to hip ratio | 0.01 ± 0.05 | 0.01 ± 0.02 |
| Body fat (%) | 0.88 ± 2.14 | 1.58 ± 1.68 |
| SBP (mmHg) | 1.28 ± 4.08 | 3.26 ± 3.68 |
| DBP (mmHg) | 1.35 ± 1.48 | 4.62 ± 1.82 |
| Glycaemia (mg/dL) | 1.47 ± 5.16 | 3.49 ± 2.30 |
| Total cholesterol (mg/dL) | 3.59 ± 17.30 | 8.52 ± 13.40 |
| HDL-c (mg/dL) | −0.82 ± 3.97 | −2.44 ± 1.78 |
| LDL-c (mg/dL) | 4.04 ± 17.64 | 9.54 ± 13.41 |
| Triglycerides (mg/dL) | 1.83 ± 8.74 | 7.09 ± 4.63 |
| BMI | Glucemic Status | Blood Pressure | Waist | Fat Mass | ||||||||||||
|---|---|---|---|---|---|---|---|---|---|---|---|---|---|---|---|---|
| RR | (95% CI) | p-Value of Interaction | RR | (95% CI) | p-Value of Interaction | RR | (95% CI) | p-Value of Interaction | RR | (95% CI) | p-Value of Interaction | RR | (95% CI) | p-Value of Interaction | ||
| Age | <0.001 | <0.001 | <0.001 | <0.001 | 0.907 | |||||||||||
| <35 | 1.008 | (1.001–1.014) | 1.010 | (1.001–1.019) | 1.223 | (1.186–1.261) | 1.009 | (0.997–1.020) | 1.084 | (1.062–1.106) | ||||||
| 35–40 | 1.021 | (1.012 1.030) | 1.021 | (1.008–1.035) | 1.287 | (1.234–1.343) | 1.013 | (1.000–1.027) | 1.037 | (1.015–1.060) | ||||||
| 40–50 | 1.020 | (1.013–1.028) | 1.022 | (1.011–1.034) | 1.323 | (1.283–1.365) | 1.017 | (1.004–1.029) | 1.022 | (1.007–1.037) | ||||||
| >50 | 1.029 | (1.018–1.041) | 1.021 | (1.004–1.038) | 1.284 | (1.235–1.336) | 0.999 | (0.975–1.023) | 1.064 | (1.042–1.087) | ||||||
| Gender | 0.453 | <0.001 | <0.001 | <0.001 | <0.001 | |||||||||||
| man | 1.024 | (1.017–1.031) | 1.022 | (1.011–1.033) | 1.372 | (1.335–1.411) | 1.002 | (0.991–1.013) | 0.971 | (0.957–0.985) | ||||||
| women | 1.015 | (1.010–1.021) | 1.014 | (1.007–1.021) | 1.212 | (1.186–1.238) | 1.022 | (1.011–1.032) | 1.125 | (1.112–1.139) | ||||||
| BMI | 0.241 | <0.001 | <0.001 | 0.704 | ||||||||||||
| Normal | - | 0.986 | (1.007–1.021 | 1.230 | (1.204–1.257) | 1.008 | (1.004–1.011) | 1.075 | (1.061–1.089) | |||||||
| Overweight | - | 0.998 | (0.980–1.024) | 1.293 | (1.252–1.335) | 1.044 | (1.022–1.066) | 1.009 | (0.993–1.025) | |||||||
| Obesity | - | 0.968 | (1.019–1.045) | 1.516 | (1.431–1.606) | 0.954 | (0.927–0.982) | 1.038 | (1.014–1.063) | |||||||
| Glucemic status | 0.065 | 0.004 | 0.001 | 0.235 | 0.013 | |||||||||||
| NORMAL | 1.015 | (1.011–1.020) | (-) | 1.061 | (1.050–1.073) | 1.017 | (1.009–1.025) | 1.029 | (1.016–1.043) | |||||||
| prediabetes | 1.041 | (1.027–1.055) | (-) | 0.989 | (0.967–1.011) | 0.977 | (0.954–1.002) | 1.028 | (1.001–1.056) | |||||||
| diabetes | 1.031 | (0.996–1.067) | (-) | 0.993 | (0.934–1.056) | 1.050 | (0.978–1.129) | 1.070 | (0.979–1.170) | |||||||
| Blood Pressure | <0.001 | 0.280 | <0.001 | <0.001 | ||||||||||||
| normal | 1.011 | (1.006 1.017) | 1.015 | (1.004 1.025 | (-) | 1.018 | (1.005 1.031) | 1.102 | 1.085 1.119 | |||||||
| preHTA | 1.023 | (1.016–1.030) | 1.016 | (1.007–1.025) | (-) | 1.016 | (1.005–1.028) | 1.033 | (1.019–1.048) | |||||||
| HTA 1 | 1.019 | (1.007–1.030) | 1.021 | (1.004–1.038) | (-) | 0.990 | (0.972–1.009) | 0.994 | (0.970–1.019) | |||||||
| HTA 2 | 1.033 | (1.008–1.059) | 1.042 | (1.010–1.073) | (-) | 1.002 | (0.964–1.042) | 1.026 | (0.983–1.072) | |||||||
| Total Cholesterol | HDL | LDL | TG | ||||||||||
|---|---|---|---|---|---|---|---|---|---|---|---|---|---|
| RR | (95% CI) | p-Value of Interaction | RR | (95% CI) | p-Value of Interaction | RR | (95% CI) | p-Value of Interaction | RR | (95% CI) | p-Value of Interaction | ||
| Age | 0.001 | 0.958 | <0.001 | 0.902 | |||||||||
| <35 | 1.049 | (1.020–1.139) | 1.047 | (1.027–1.068) | 1.047 | (1.025–1.069) | 1.012 | (1.004–1.021) | |||||
| 35–40 | 1.049 | (1.021–1.078) | 1.028 | (0.998–1.059) | 1.017 | (0.991–1.044) | 1.004 | (0.994–1.015) | |||||
| 40–50 | 1.089 | (1.066–1.113) | 1.028 | (1.011–1.046) | 1.048 | (1.026–1.069) | 0.999 | (0.994–1.004) | |||||
| >50 | 1.008 | (0.982–1.035) | 1.044 | (1.022–1.068) | 0.982 | (0.955–1.011) | 1.000 | (0.990–1.010) | |||||
| Gender | <0.001 | 0.000 | 0.040 | 0.643 | |||||||||
| Men | 1.061 | (1.044–1.080) | 1.078 | (1.059–1.097) | 1.018 | (1.001–1.035) | 0.999 | (0.993–1.006) | |||||
| Women | 1.081 | (1.062–1.099) | 1.002 | (0.990–1.014) | 1.041 | (1.024–1.058) | 1.008 | (1.003–1.012) | |||||
| BMI category | 0.027 | 0.000 | 0.327 | 0.220 | |||||||||
| Normal | 1.092 | (1.074–1.110) | 1.046 | (1.033–1.060) | 1.040 | (1.024–1.057) | 1.004 | (0.999–1.010) | |||||
| Overweight | 1.049 | (1.027–1.071) | 0.989 | (0.958–1.021) | 1.011 | (0.979–1.045) | 1.006 | (0.999–1.013) | |||||
| Obesity | 1.041 | (1.007–1.075) | 1.038 | (1.017–1.060) | 1.011 | (0.979–1.045) | 0.995 | (0.984–1.006) | |||||
| Glucemic status | 0.113 | 0.015 | 0.003 | 0.596 | |||||||||
| Normal | 1.066 | (1.052–1.080) | 1.004 | (1.000–1.009) | 1.277 | (1.253–1.301) | 1.034 | (1.023–1.046) | |||||
| prediabetes | 1.111 | (1.079–1.143) | 0.996 | (0.987–1.006) | 1.299 | (1.237–1.365) | 1.066 | (1.033–1.099) | |||||
| diabetes | 1.002 | (0.932–1.077) | 1.042 | (1.001–1.084) | 1.506 | (1.272–1.783) | 0.866 | (0.774–0.969) | |||||
| Blood Pressure | <0.001 | 0.006 | 0.072 | 0.036 | |||||||||
| normal | 1.106 | (1.081–1.132) | 1.005 | 0.987 1.024 | 1.040 | (1.018 1.062) | 1.004 | 0.996 1.013 | |||||
| preHTA | 0.545 | (0.464–0.641) | 1.055 | (1.039–1.071) | 1.026 | (1.009–1.044) | 1.007 | (1.001–1.012) | |||||
| HTA 1 | 0.639 | (0.478–0.853) | 1.059 | (1.030–1.089) | 1.022 | (0.992–1.053) | 0.997 | (0.990–1.004) | |||||
| HTA 2 | 1.053 | (0.620–1.787) | 1.003 | (0.955–1.053) | 1.023 | (0.979–1.069) | 0.999 | (0.981–1.017) | |||||
| Year 2018 | Year 2019 | Year 2020 | p-Value | |
|---|---|---|---|---|
| Women non physical exercise | 57.0 | 57.4 | 69.2 | <0.0001 |
| Women yes physical exercise | 43.0 | 42.6 | 30.8 | |
| Men non physical exercise | 55.3 | 59.3 | 65.1 | <0.0001 |
| Men yes physical exercise | 44.7 | 40.7 | 34.9 |
Publisher’s Note: MDPI stays neutral with regard to jurisdictional claims in published maps and institutional affiliations. |
© 2022 by the authors. Licensee MDPI, Basel, Switzerland. This article is an open access article distributed under the terms and conditions of the Creative Commons Attribution (CC BY) license (https://creativecommons.org/licenses/by/4.0/).
Share and Cite
Ramírez Manent, J.I.; Altisench Jané, B.; Sanchís Cortés, P.; Busquets-Cortés, C.; Arroyo Bote, S.; Masmiquel Comas, L.; López González, Á.A. Impact of COVID-19 Lockdown on Anthropometric Variables, Blood Pressure, and Glucose and Lipid Profile in Healthy Adults: A before and after Pandemic Lockdown Longitudinal Study. Nutrients 2022, 14, 1237. https://doi.org/10.3390/nu14061237
Ramírez Manent JI, Altisench Jané B, Sanchís Cortés P, Busquets-Cortés C, Arroyo Bote S, Masmiquel Comas L, López González ÁA. Impact of COVID-19 Lockdown on Anthropometric Variables, Blood Pressure, and Glucose and Lipid Profile in Healthy Adults: A before and after Pandemic Lockdown Longitudinal Study. Nutrients. 2022; 14(6):1237. https://doi.org/10.3390/nu14061237
Chicago/Turabian StyleRamírez Manent, José Ignacio, Bárbara Altisench Jané, Pilar Sanchís Cortés, Carla Busquets-Cortés, Sebastiana Arroyo Bote, Luis Masmiquel Comas, and Ángel Arturo López González. 2022. "Impact of COVID-19 Lockdown on Anthropometric Variables, Blood Pressure, and Glucose and Lipid Profile in Healthy Adults: A before and after Pandemic Lockdown Longitudinal Study" Nutrients 14, no. 6: 1237. https://doi.org/10.3390/nu14061237