Modeling the Pumping Behavior of Macroscopic Lead Structures on Shaft Counterfaces of Rotary Shaft Seals


Institute of Machine Components, University of Stuttgart, 70569 Stuttgart, Germany
*
Author to whom correspondence should be addressed.
Lubricants 2023, 11(11), 495; https://doi.org/10.3390/lubricants11110495
Submission received: 18 October 2023
/
Revised: 11 November 2023
/
Accepted: 16 November 2023
/
Published: 20 November 2023
Abstract
:The leak tightness of the sealing system rotary shaft seal is based on the formation of an active back-pumping effect of the sealing ring. Here, the sealing ring pumps the fluid in the sealing gap back into the housing. However, this active sealing mechanism is disturbed by so-called “lead structures”. Lead structures include all types of directional structures on the sealing counterface which create rotation-dependent axial fluid pumping. Lead-affected sealing counterfaces can thus cause leakage or insufficient lubrication of the sealing contact. To ensure leak tightness, lead must be avoided or tolerated. This article investigates how different structural characteristics of lead affect the amount of fluid pumped by the shaft surface. For this purpose, 26 shafts are subjected to surface analyzing methods and an experimental pumping rate test. The interaction of various geometric features of the lead structures and their combined effect on the pumping capacity is modeled based on the measured data. Appropriated correlation models are discussed and relationships between shaft lead and its pumping effect are shown. The aim is to estimate shaft pumping rates based on surface measurements in future. The results contribute to the derivation of measurable tolerance values for lead and to the prevention of leakage.
1. Introduction
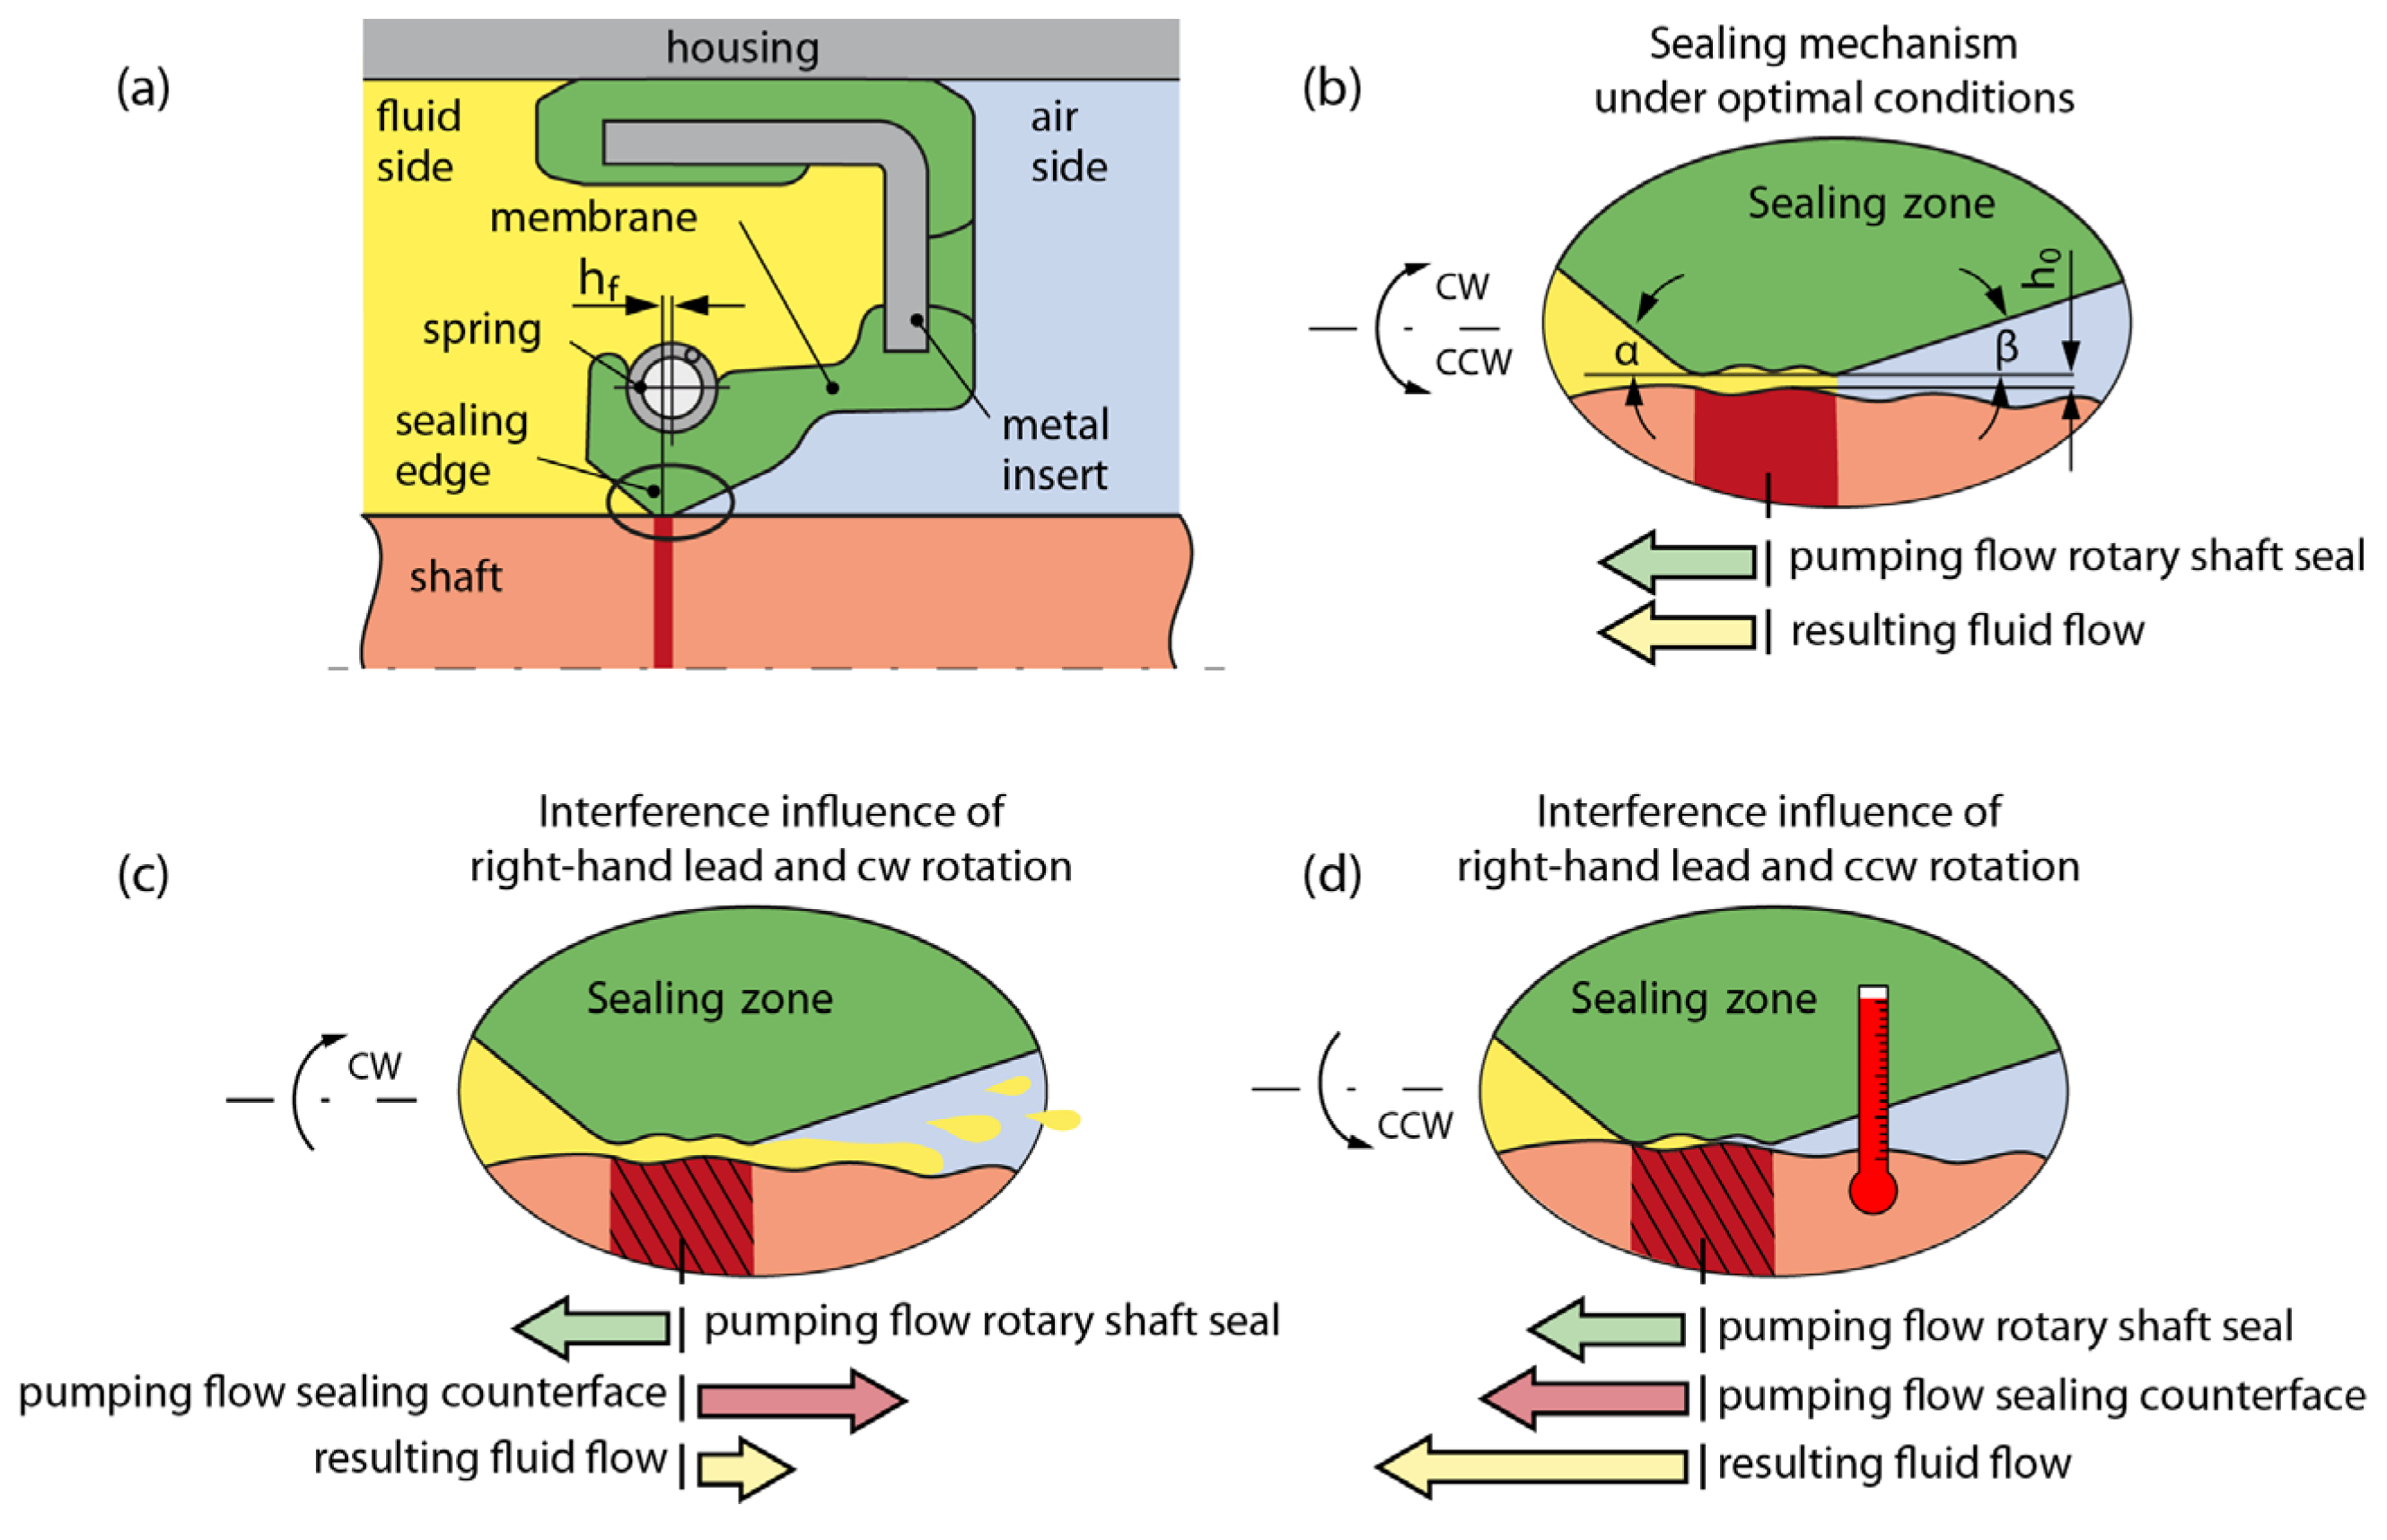
Rotary shaft seals are active sealing elements that prevent fluid leakage at the passages of rotating shafts from housings. Technical applications and a summary on the subject of rotary shaft sealings can be found in [1]. Figure 1a shows the three components of the tribological system “rotary shaft seal”, the rotary shaft seal (green), the shaft with the sealing counterface (red) and the fluid to be sealed (yellow). The elastomeric sealing ring is a standardized machine element according to [2,3]. Usually, an oil is sealed that lubricates the components in the housing, such as gears and bearings. Static tightness of a rotary shaft seal is achieved by a radial contact force of the elastomeric sealing edge on the shaft surface. This force is applied by an overlap between the sealing edge diameter and the shaft diameter. Additionally, the sealing edge is reinforced by a spring. When the shaft rotates, the sealing edge lifts off and floats on a thin fluid film. Leaking fluid through the sealing gap of a rotary shaft seal is prevented by an active sealing mechanism, illustrated in Figure 1b. This back-pumping effect is based on functional principles that are explained in more detail in [1,4,5], for example. Fundamental for the active sealing mechanism is an asymmetrical pressure distribution between the sealing edge and the shaft surface in the sealing contact. This condition is achieved by the geometry of the sealing edge, described by the different flank angles α and β. The rotary shaft seal pumps fluid from the side with the smaller flank angle β to the side with the larger flank angle α, as shown in Figure 1b.
The surface properties of the sealing counterface are decisive for the sealing function and are specified in various standards [2,3,6,7]. In addition to the surface roughness [8,9,10], the problem “lead” became increasingly important for the sealing capability of radial shaft seals. So called “lead structures” on the sealing counterface influence the fluid flow in the sealing gap by superimposing a self-formed pumping flow on the pumping flow of the seal ring [11,12]. Lead structures are anisotropic depressions in the shaft surface, which are predominantly oriented to deviate from the circumferential direction. When the shaft rotates, lead structures act similarly to a screw pump and transport the fluid to be sealed in the axial direction through the sealing gap. The pumping direction depends on the preferred orientation of the lead structures in combination with the direction of rotation of the shaft. Figure 1c,d show the two failure modes which can result from lead-affected sealing counterfaces. In the following examples, lead is considered to be a kind of right-hand thread on the surface. In the case of right-hand lead and negative shaft rotation direction (cw), as shown in Figure 1c, fluid is pumped into the sealing gap. If more fluid is pumped by the counterface into the sealing gap than the sealing ring can pump back, leakage occurs. A positive direction of rotation (ccw) causes both the rotary shaft seal and the counterface to pump fluid into the housing. This can reduce the sealing gap height and the lubricating effect to a point where there is solid contact between the sealing edge and the shaft surface, shown in Figure 1b. Increased wear, increased sealing gap temperature and, consequently, thermal damage to the sealing edge are the result. This also inevitably leads to leakage, as the sealing ring can no longer form its active sealing mechanism. Rotary sealing systems can therefore fail due to lead structures on sealing counterfaces, causing high repair costs and environmental damage.
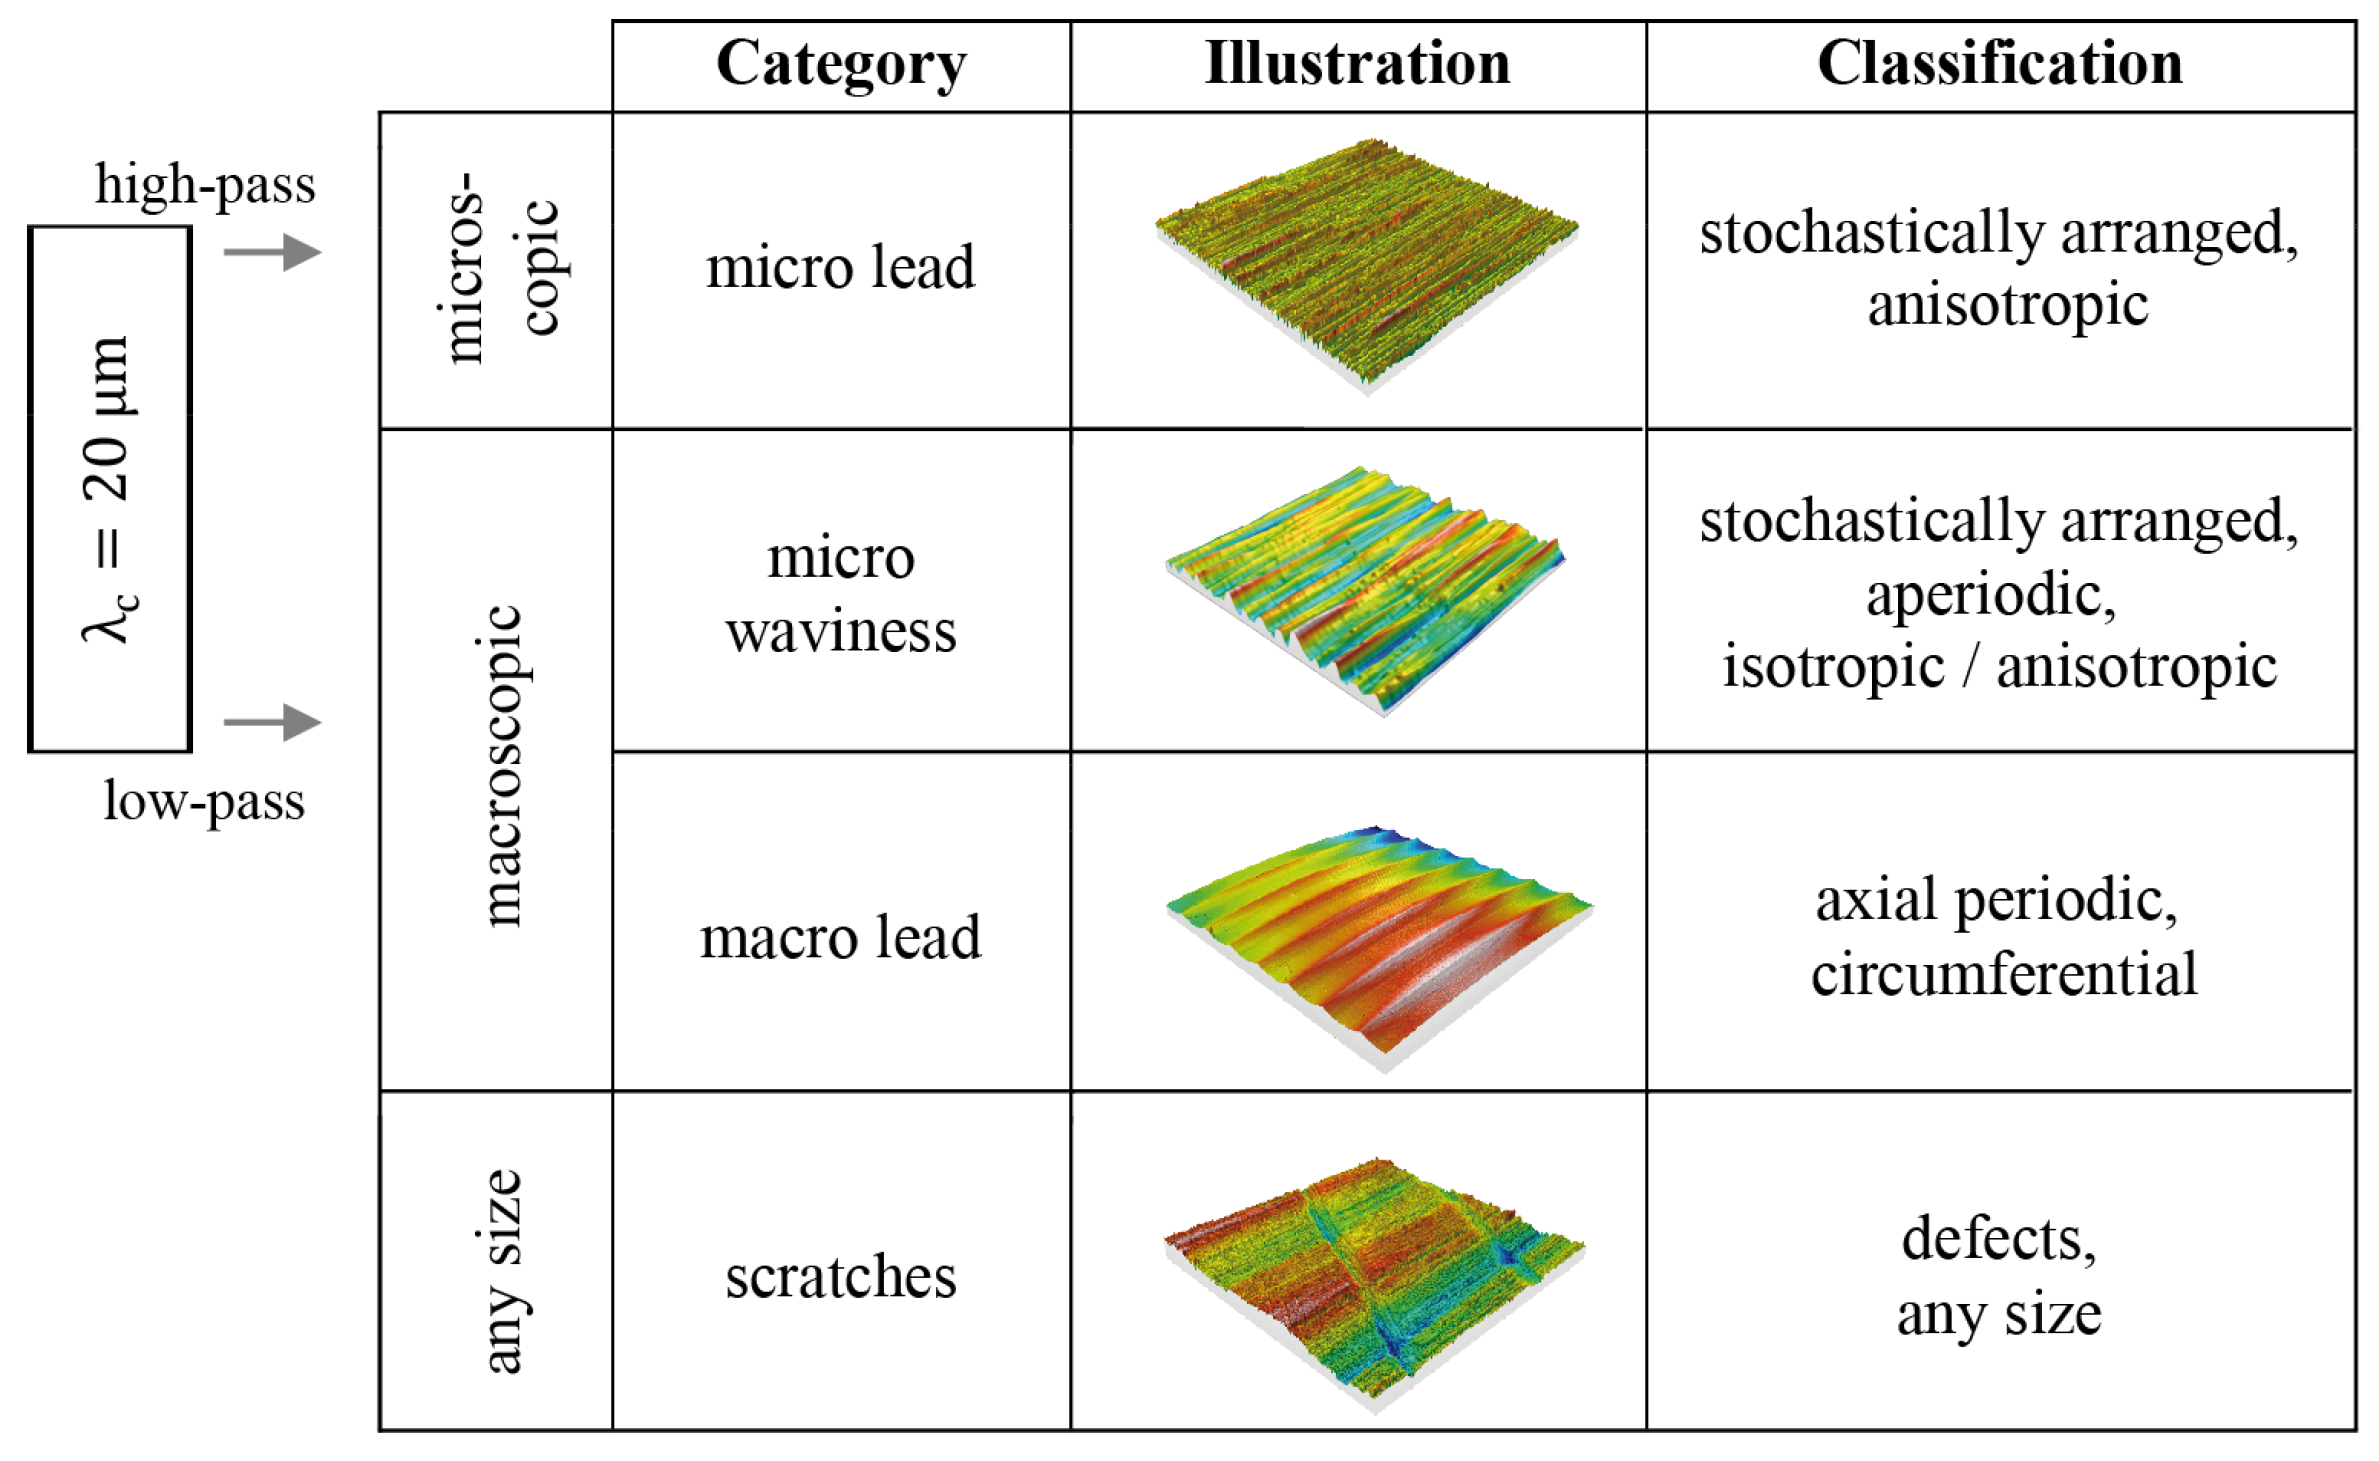
Lead structures occur not only thread-like, as shown in Figure 1, but in a variety of sizes, shapes and types of origin. Figure 2 illustrates a classification according to [13]. While scratches are caused by improper handling, micro lead, macro lead and micro waviness are created during the manufacturing process of the shaft. The formation processes of lead are also part of previous and current research [11,14,15,16]. This study considers manufacturing-related macroscopic lead structures of the categories “micro waviness” and “macro lead”. Macroscopic lead structures range in their structure widths from micro lead ( [17]) to regular waviness ( [18])). Micro waviness and macro lead are distinguished by their structure’s arrangements on the surface and their geometric shapes. Axially periodic circumferential structures form the macro lead [19]. In contrast, micro waviness includes non-periodic and stochastically arranged structures of macroscopic size.
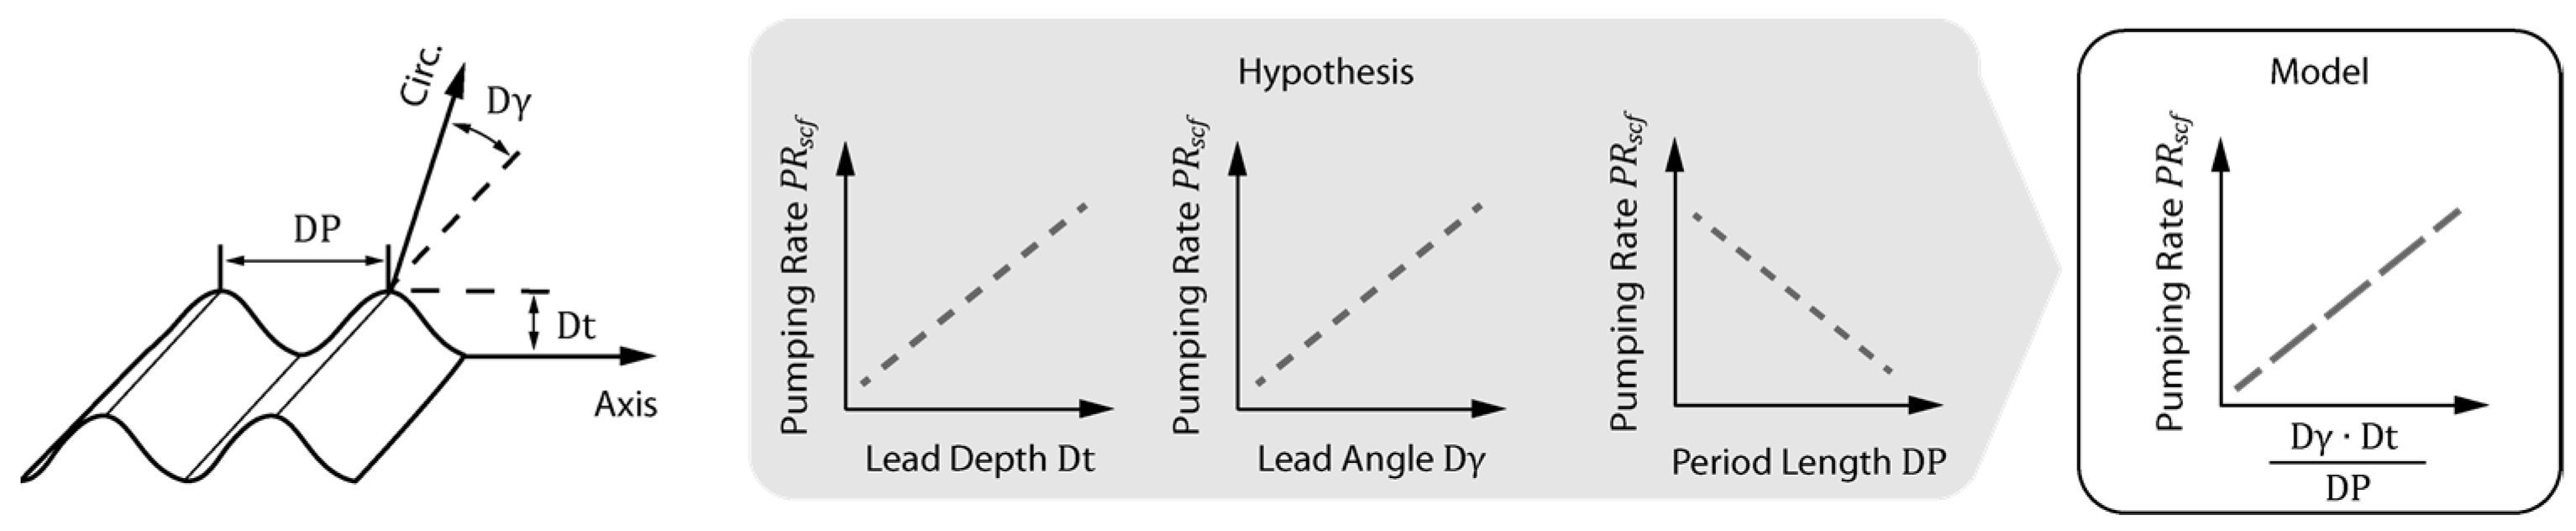
Previous studies have already investigated the effect of various lead characteristics on the pumping behavior of sealing counterfaces of rotary shaft seals [17,20,21,22,23,24,25,26]. A measure for the pumping capacity in the sealing system is the pumping rate , which can be determined experimentally for the rotary shaft seal () and the sealing counterface (). Lead characteristics are defined by geometrical features of lead structures. Lead parameters, as results of lead analysis methods, describe these geometrical features. The combination of selected parameters through mathematical operators results in models that reflect the interaction of the features in an overall effect. The suitability of a model to predict the pumping rate can be evaluated by correlation studies to measure pumping rates. Ref. [25] presents a first approach to model the pumping rate of macro lead-affected sealing counterfaces. A method according to the Mercedes-Benz standard (MBN) 31007-7 [27] was used here for the lead measurement and description. This frequency-based method assumes the shaft surface as a kind of screw thread. The describing parameters are, among others, the lead depth , lead angle and period length . Based on these three parameters and the results of experimental pumping rate measurements, three hypotheses and a resulting model were made about the shaft pumping rate; see Figure 3.
The first hypothesis states that the shaft pumping rate increases with the lead depth . According to the second hypothesis, the larger the lead angle , the higher the shaft pumping rate. The number of lead structures in sealing contact can be indirectly described by the thread’s period length, leading to the third hypothesis. This implies that lower period lengths cause higher pumping rate values. Based on these three hypotheses, the lead parameter combination in Equation (1) was set up as a model for the pumping rate:
The results of [25] prove a linear relationship between the model in Equation (1) and the measured shaft pumping rates. However, the authors have already noted that the field of experimentation needs to be expanded.
The capabilities of macro lead analysis have evolved in the last few years. For example, refs [28,29] examined the characterization of shaft lead using 3D parameters according to ISO 25178-2 [30]. A novel structure-based approach for the analysis of shaft lead using optically measured topography data is introduced in [13]. This approach serves as an advanced method for detecting and describing lead structures. Correlations between certain surface characteristics and the leakage of the sealing system are analyzed by [31].
In summary, surface characteristics of ground shaft counterfaces causing leakage of rotary shaft seals are still an issue and part of current research. This article focuses on describing the functional behavior of lead structures which are a cause of leakage. First, the model according to Equation (1) [25] is verified by an extended test field. Subsequently, improved shaft pumping rate models with structure-based parameters according to [13] are formed and investigated. Geometric features of macroscopic lead structures, which show strong correlations with measured shaft pumping rates, are identified and discussed. The results provide a basis for the development of upcoming models that can estimate or even calculate the pumping rate of the sealing counterface of rotary shaft seals on the basis of the surface analysis. If lead can be accurately described by parameters and its pumping behavior can be modeled, the risk of leakage for the entire sealing system can be evaluated.
2. Methods
The experimental basis of this study is 26 different shaft surfaces. They are taken from a study on the simulation of the manufacturing process of various macro lead characteristics [15]. These shafts are characterized by a wide range of structural properties. The procedure of this study is divided into the surface analysis part and the experimental part of the pumping rate measurements.
2.1. Measuring and Analysis Methods for Lead Structures
In order to determine the characteristics of the macroscopic lead structures, the shaft surfaces were examined before the pumping rate measurements using three different lead analysis methods. Macroscopic lead characteristics were investigated with the macro lead measurement according to MBN 31007-7 [27] and the novel IMA (Machine Components at the University of Stuttgart) macro lead analysis according to [13]. Micro lead was analyzed using the IMA micro lead analysis [32]. Micro lead-free shaft surfaces are a prerequisite to exclude superimposed pumping effects of micro lead from the pumping rate test. A confocal measuring device was used for all surface measurements carried out.
2.1.1. Macro Lead Measurement According to MBN 31007-7
The macro lead measurement according to the Mercedes-Benz standard MBN 31007-7 [27] (MBN method) is a widely used and established method for measuring and describing axial periodic macroscopic structures on sealing counterfaces. The current status of the measurement and evaluation procedure is described in [33]. The sealing counterface is measured in two measuring grids, consisting of axial profile measurements on the shaft circumference at defined angular intervals. A total of 72 profiles are each measured over the entire shaft circumference in 5° steps and over a range of 36° in 0.5° steps. The MBN method is originally based on tactile measurements, but optical measurement systems can also be used, which offer time benefits [34]. Periodic structures are identified in the measurement data using a Fast Fourier Transform (FFT). The results of the computation procedure are two mathematical surfaces that are approximated to the data of the 360° and 36° measurement grids. The lead parameters according to MBN 31007-7 are calculated from these approximated surfaces. They are listed in Table 1 and are provided twice, once for the 360° measurement and once for the 36° measurement.
2.1.2. Structure-Based Macro Lead Analysis (IMA 3D Macro Lead Analysis)
The IMA 3D macro lead analysis is used within this study for the structure-based lead analysis. It is based on a novel approach to localize lead structures as individual elements in high-resolution topography measurement data. The motivation for this type of evaluation is feature-based surface characterization, described, among others, in [35,36]. The structure-based lead analysis requires optical measurement data which provide high-resolution topographies and form the basis for the further application of segmentation algorithms. A detailed description of the evaluation procedure can be found in [13]. It is built on the watershed transformation (WST) according to ISO 25178-2 [30], which is applied to the topographies in the first step. In the further process, over-segmented features, which are initially the result of the segmentation with WST, are merged into relevant structures. A relevant structure is considered as a delimited deepening in the surface topography, to which a fluid pumping effect is attributed. The shape of every individual detected structure is described by six geometrical feature parameters. To characterize a sealing counterface, the totality of all individual structures is considered statistically. Table 2 presents the related structure-based macro lead parameters. The statistical parameters are the mean and the standard deviation of all values per geometrical feature class. To ensure comparability with other studies, the number of structures is normalized to the area of the measurement field. The normalized number of structures is the associated lead parameter.
In order to obtain precise statistical parameter values by detecting a sufficient number of structures, the shaft surfaces are measured at several circumferential and axial positions. The results of this study are based on a measurement grid that consists of nine circumferential positions at a distance of 40°, each with three axial positions at a distance of 2 mm. Five overlapping measurements in circumferential direction are performed at each measuring position. A total of 135 topography measurements are included in the evaluation of one sealing counterface.
2.2. Pumping Rate Measurement
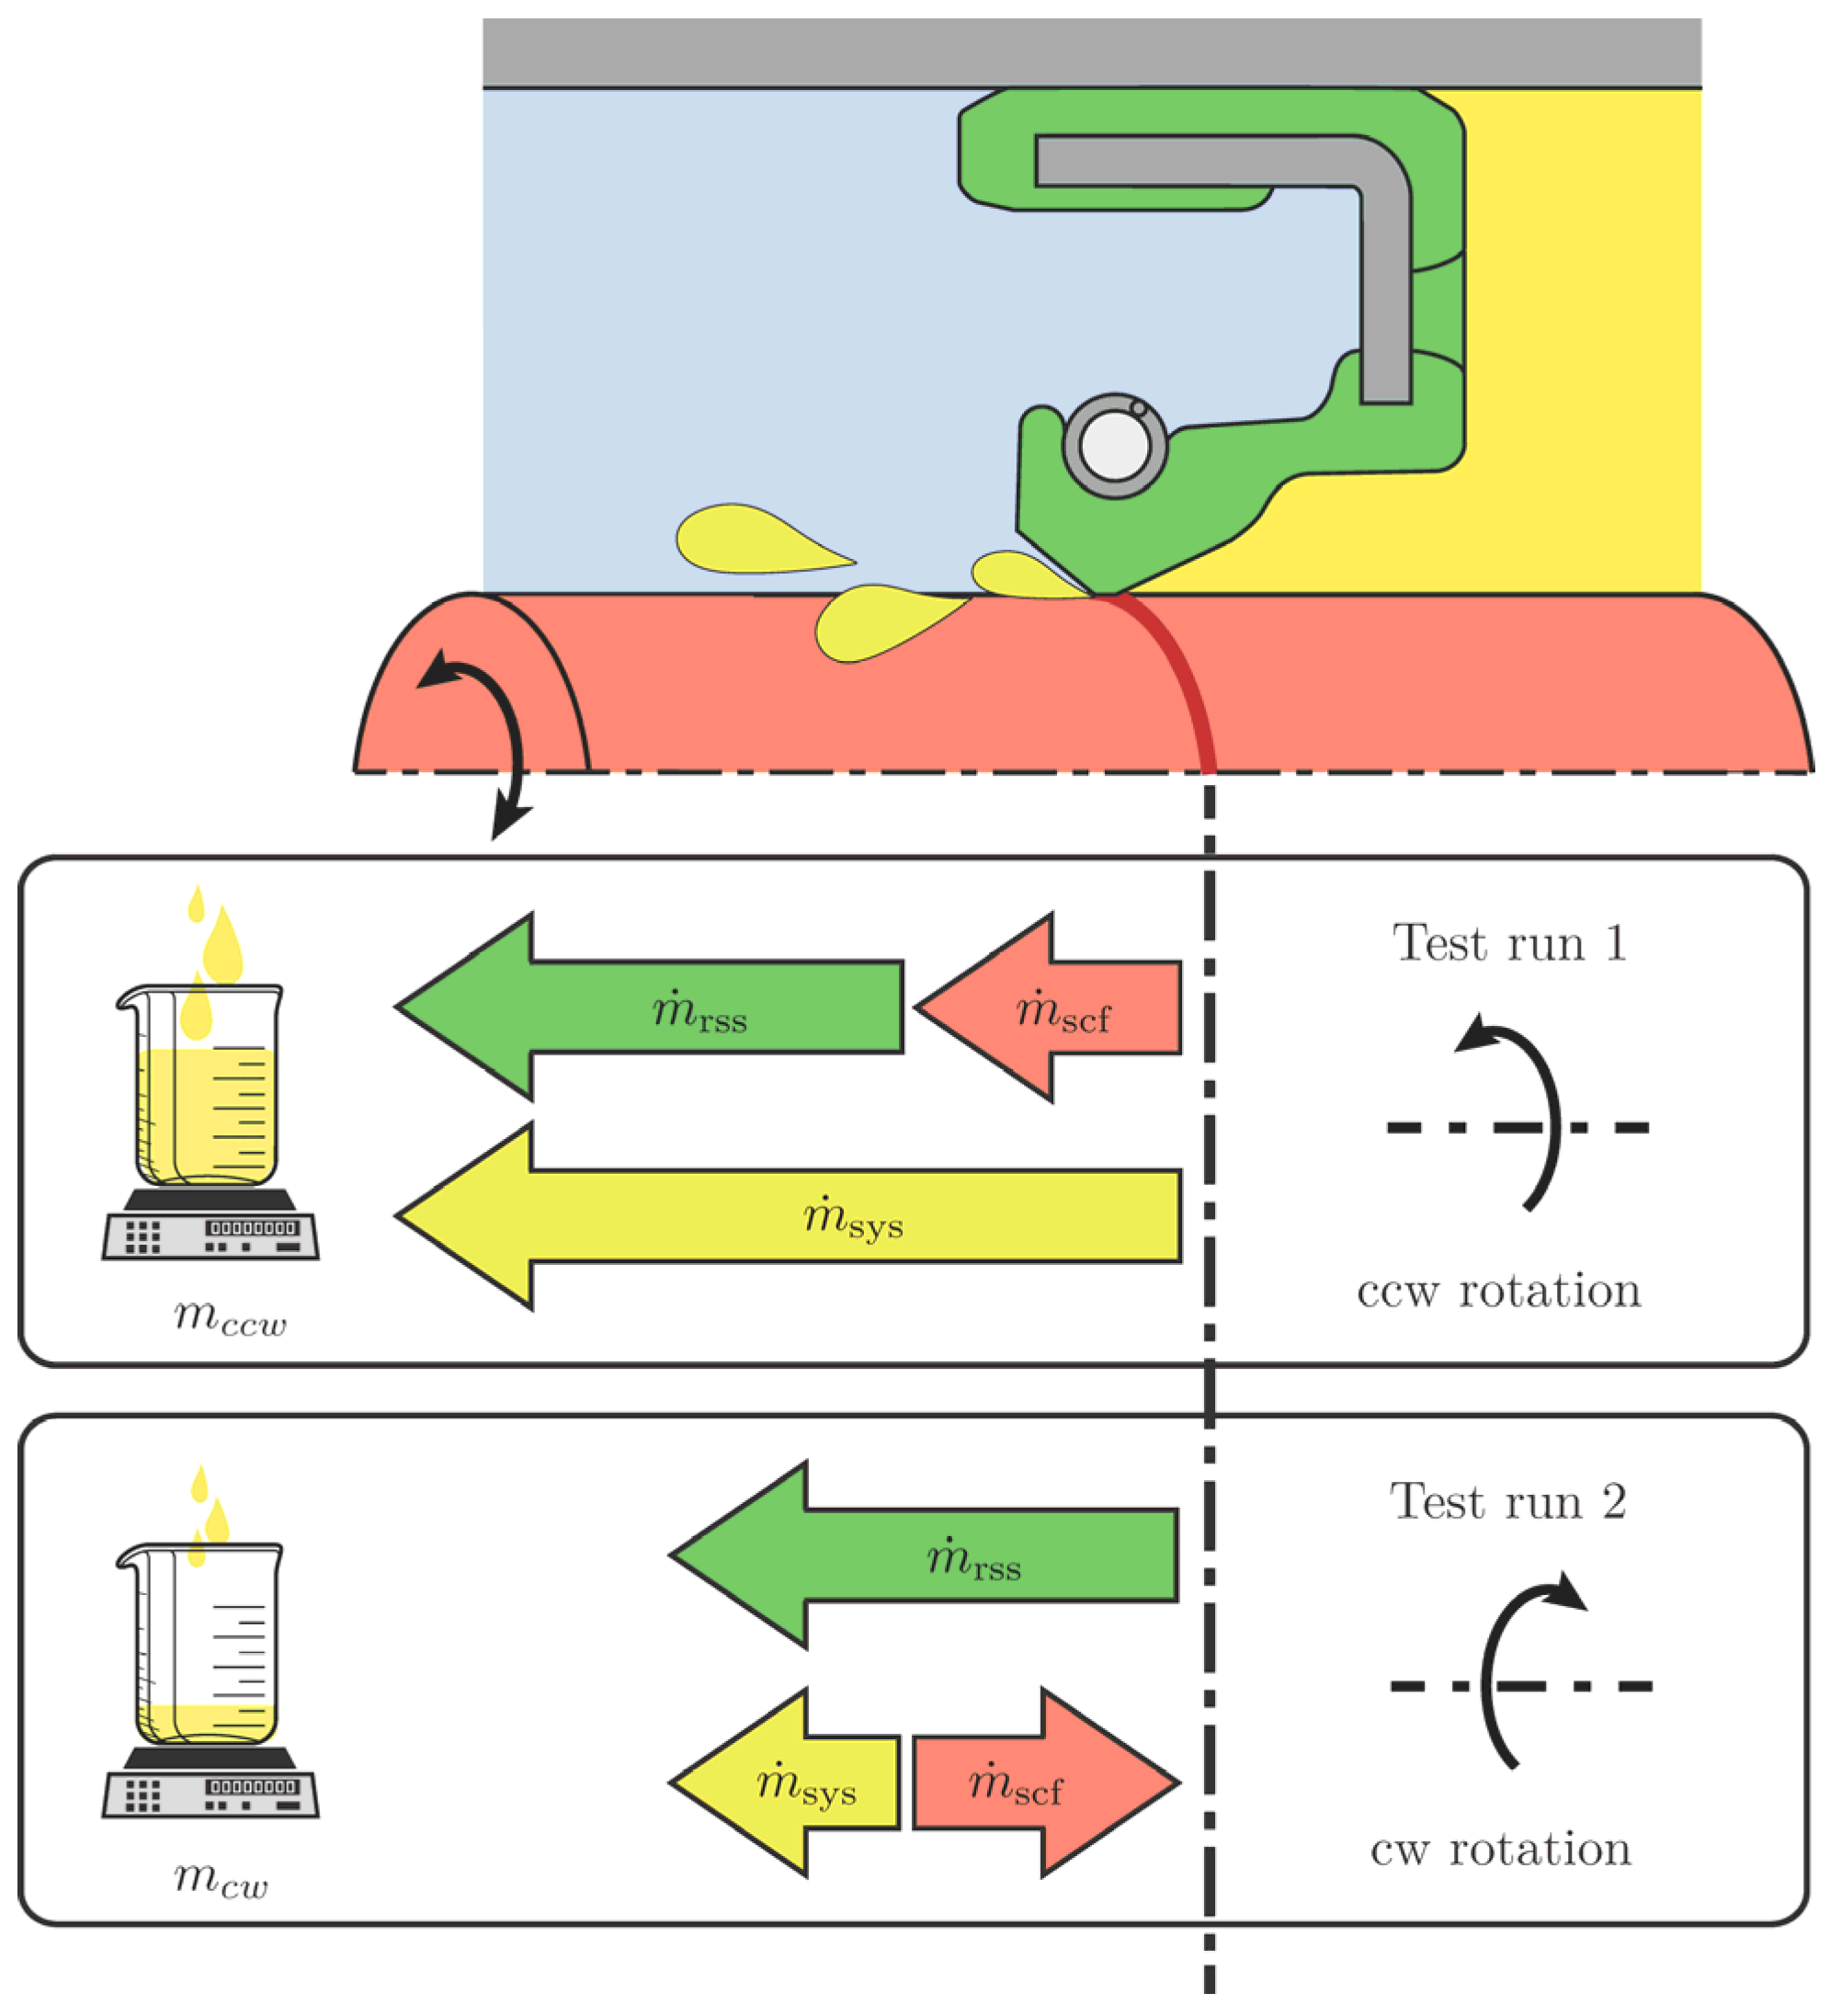
The pumping rate measurement is originally an experimental method to quantify the leak-tightness of a rotary shaft seal [37,38]. Assuming that the sealing counterface also pumps fluid, a distinction must be made between the pumping rate of the rotary shaft seal , the pumping rate of the sealing counterface and the system pumping rate resulting from their superposition. A measurement method for quantifying the pumping rate of the sealing counterface was developed by RAAB [39]. Figure 4 illustrates a scheme of the method. The measuring procedure consists of two parts with a defined duration . In the first test run, the shaft is rotated clockwise (cw), in the second test run it is rotated counterclockwise (ccw). Both were carried out on the same shaft track with the same rotary shaft seal. In the test setup, the rotary shaft seal is mounted in the housing with the larger flank angle α toward the outside, contrary to the illustrations in Figure 1. The pumping flow of the rotary shaft seal is thus directed from the inside to the outside of the housing regardless of the direction of rotation of the shaft. However, the pumping flow of a lead-affected sealing counterface changes its direction with the changing direction of rotation. Depending on the structure’s orientation, the shaft pumps once outwards and once inwards. The system fluid flow is a superimposition of the pumping flow of the rotary shaft seal and the pumping flow of the sealing counterface If the rotary shaft seal pumps a higher amount of fluid than the sealing counterface, the system fluid flow points to the outside in both directions of rotation. This allows the system fluid flow to be collected in both cases and weighed as the leakages and in the duration . Both weighted oil quantities after ccw rotation and cw rotation are required to calculate the pumping rate of the sealing counterface via balancing according to the following:
The value of the pumping rate refers to the amount of pumped oil in grams per hour. This calculation is based on the following assumptions:
- pumping fluid flow of the rotary shaft seal always points to the outside;
- ;
- and are constant in time over the measurement period.
The experimental conditions for pumping rate measurement are summarized in Table 3.
3. Results
This chapter presents the measurement results which form the basis and input for the correlation studies and discussion in Section 4.
3.1. Results of the Surface Analysis
Table A1 in Appendix A shows the results of the 360° and the 36° macro lead measurement according to the MBN 31007-7. Differences between the results of the 360° and 36° measurements result from the different resolutions in the circumferential direction of both measuring grids. For the investigated shafts, the 36° measurement grids achieve more plausible or the same results compared to the 360° grids. For this reason, only the lead parameters of the 36° measurements are considered in the correlation studies.
The results of the structure-based macro lead analysis are shown in Table A2 in Appendix A. The statistical parameters according to Table 2 are listed.
3.2. Results of the Experimental Pumping Rate Measurements
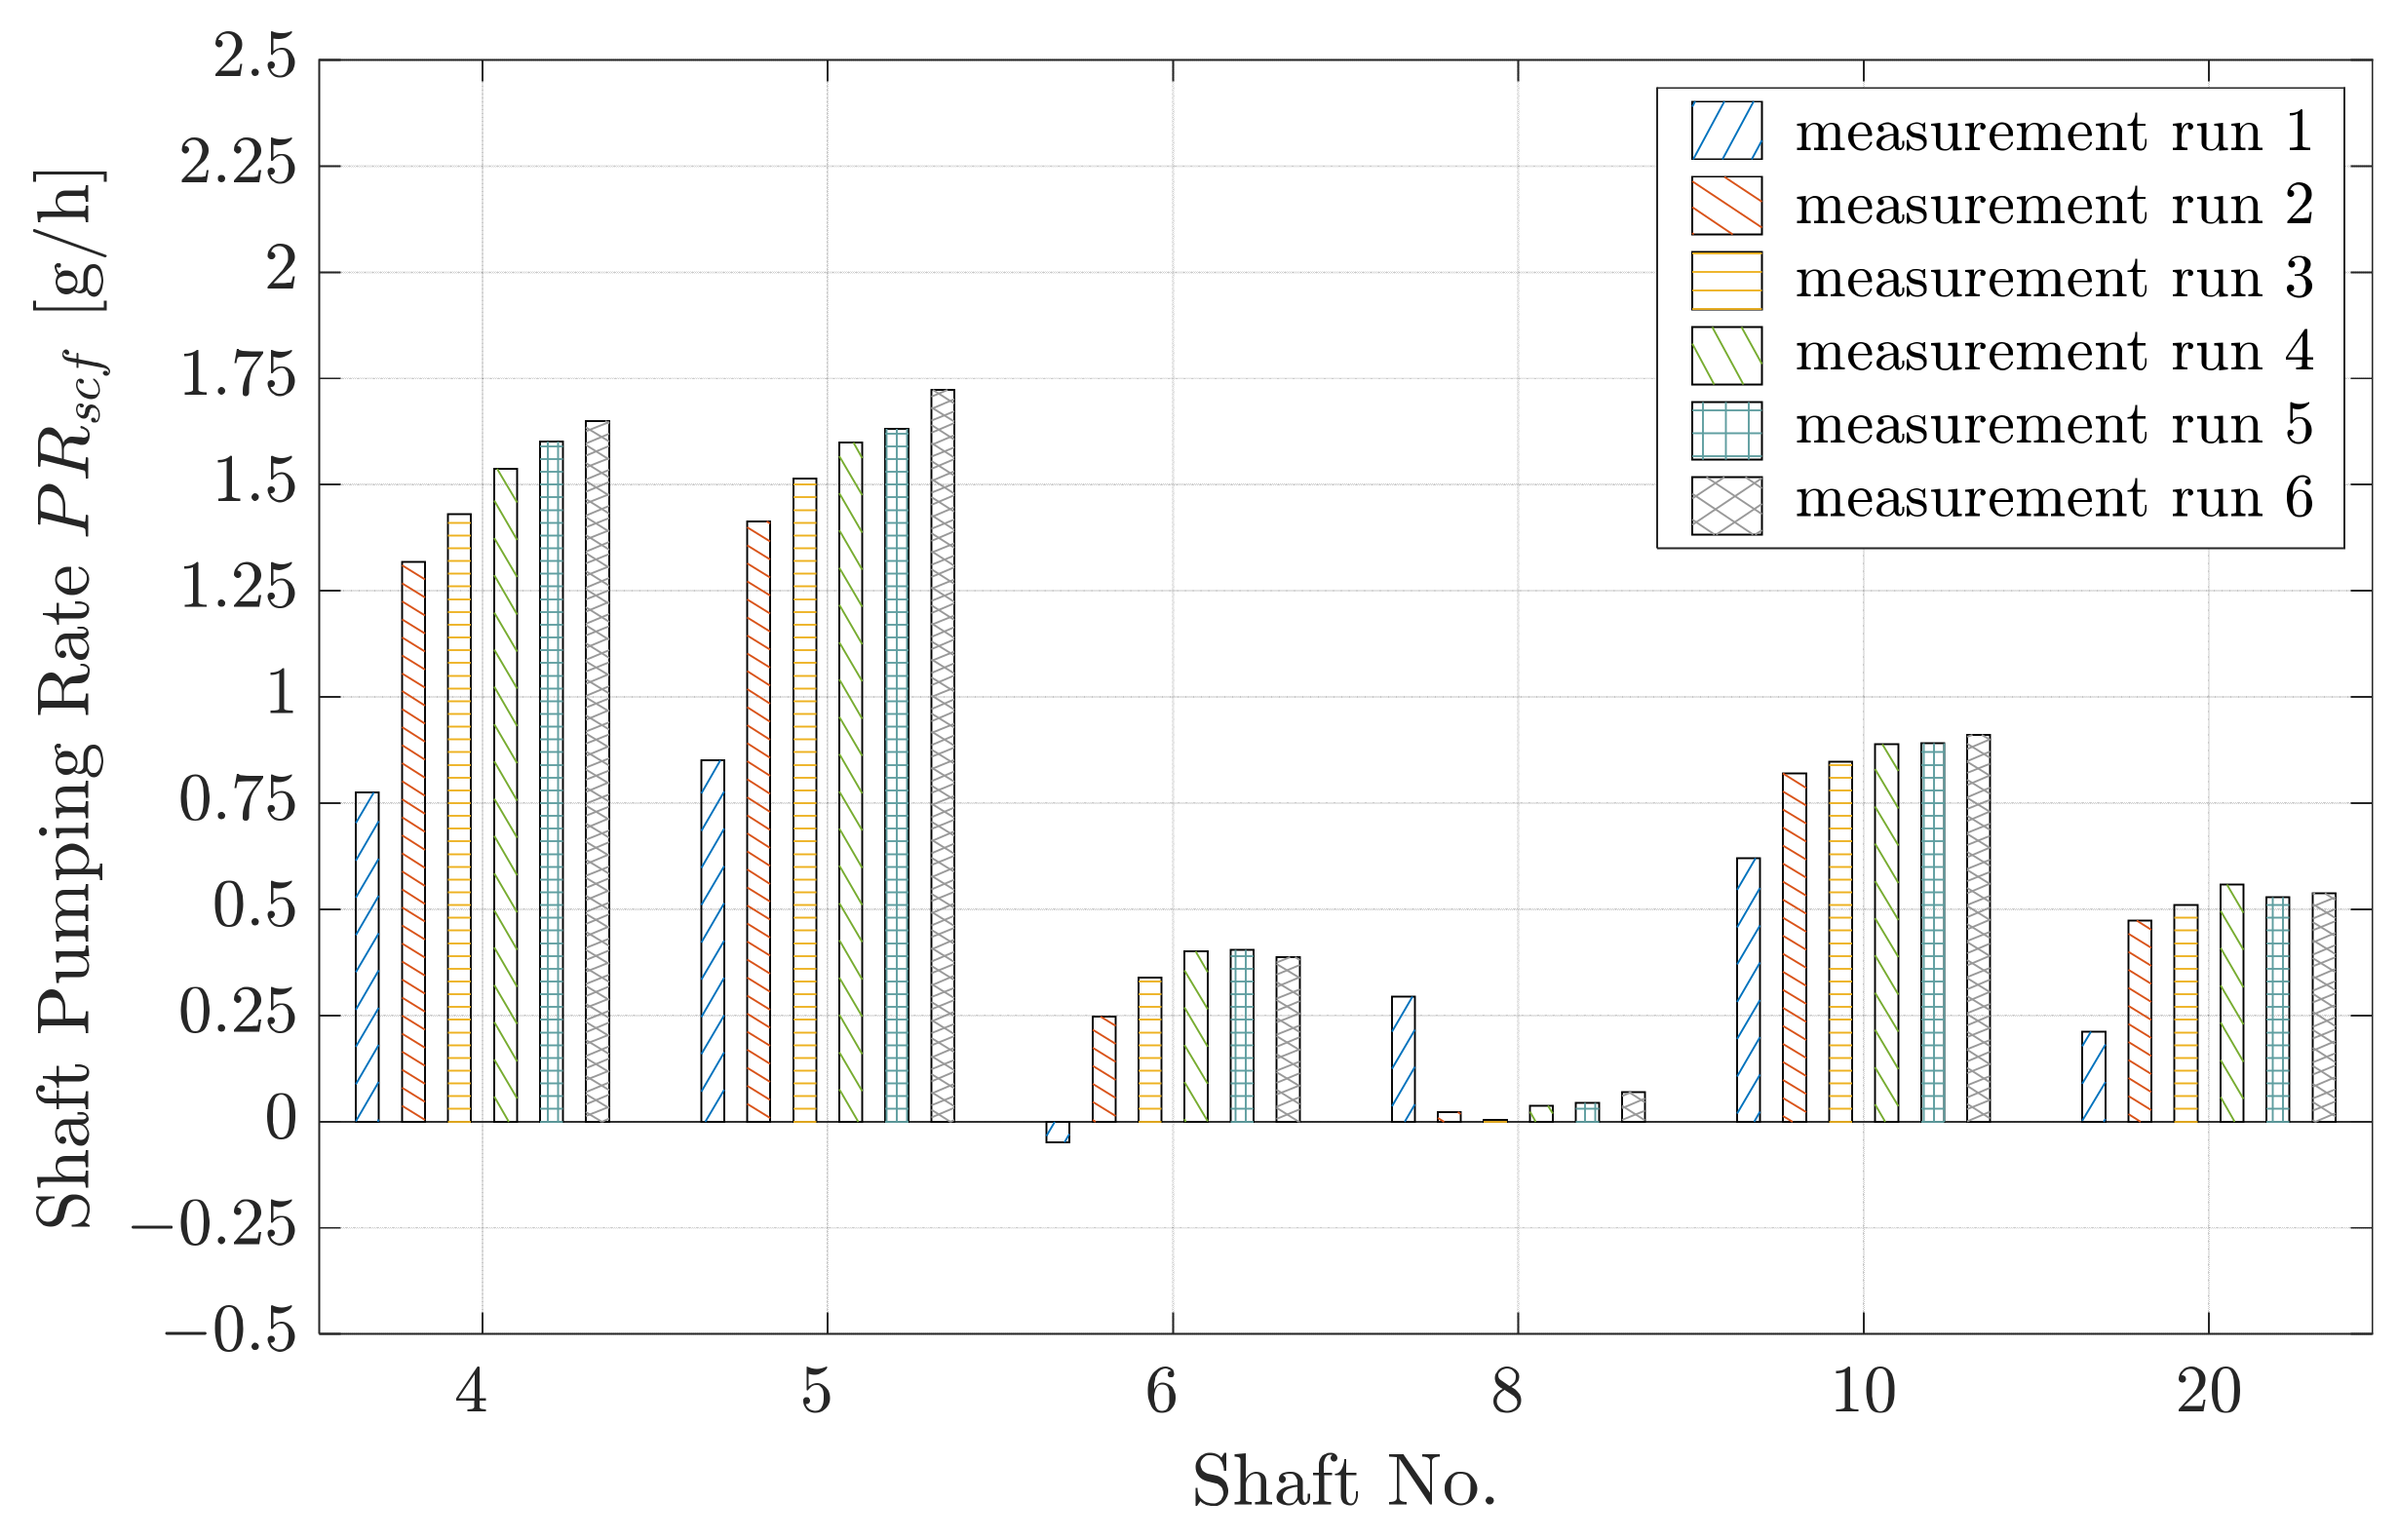
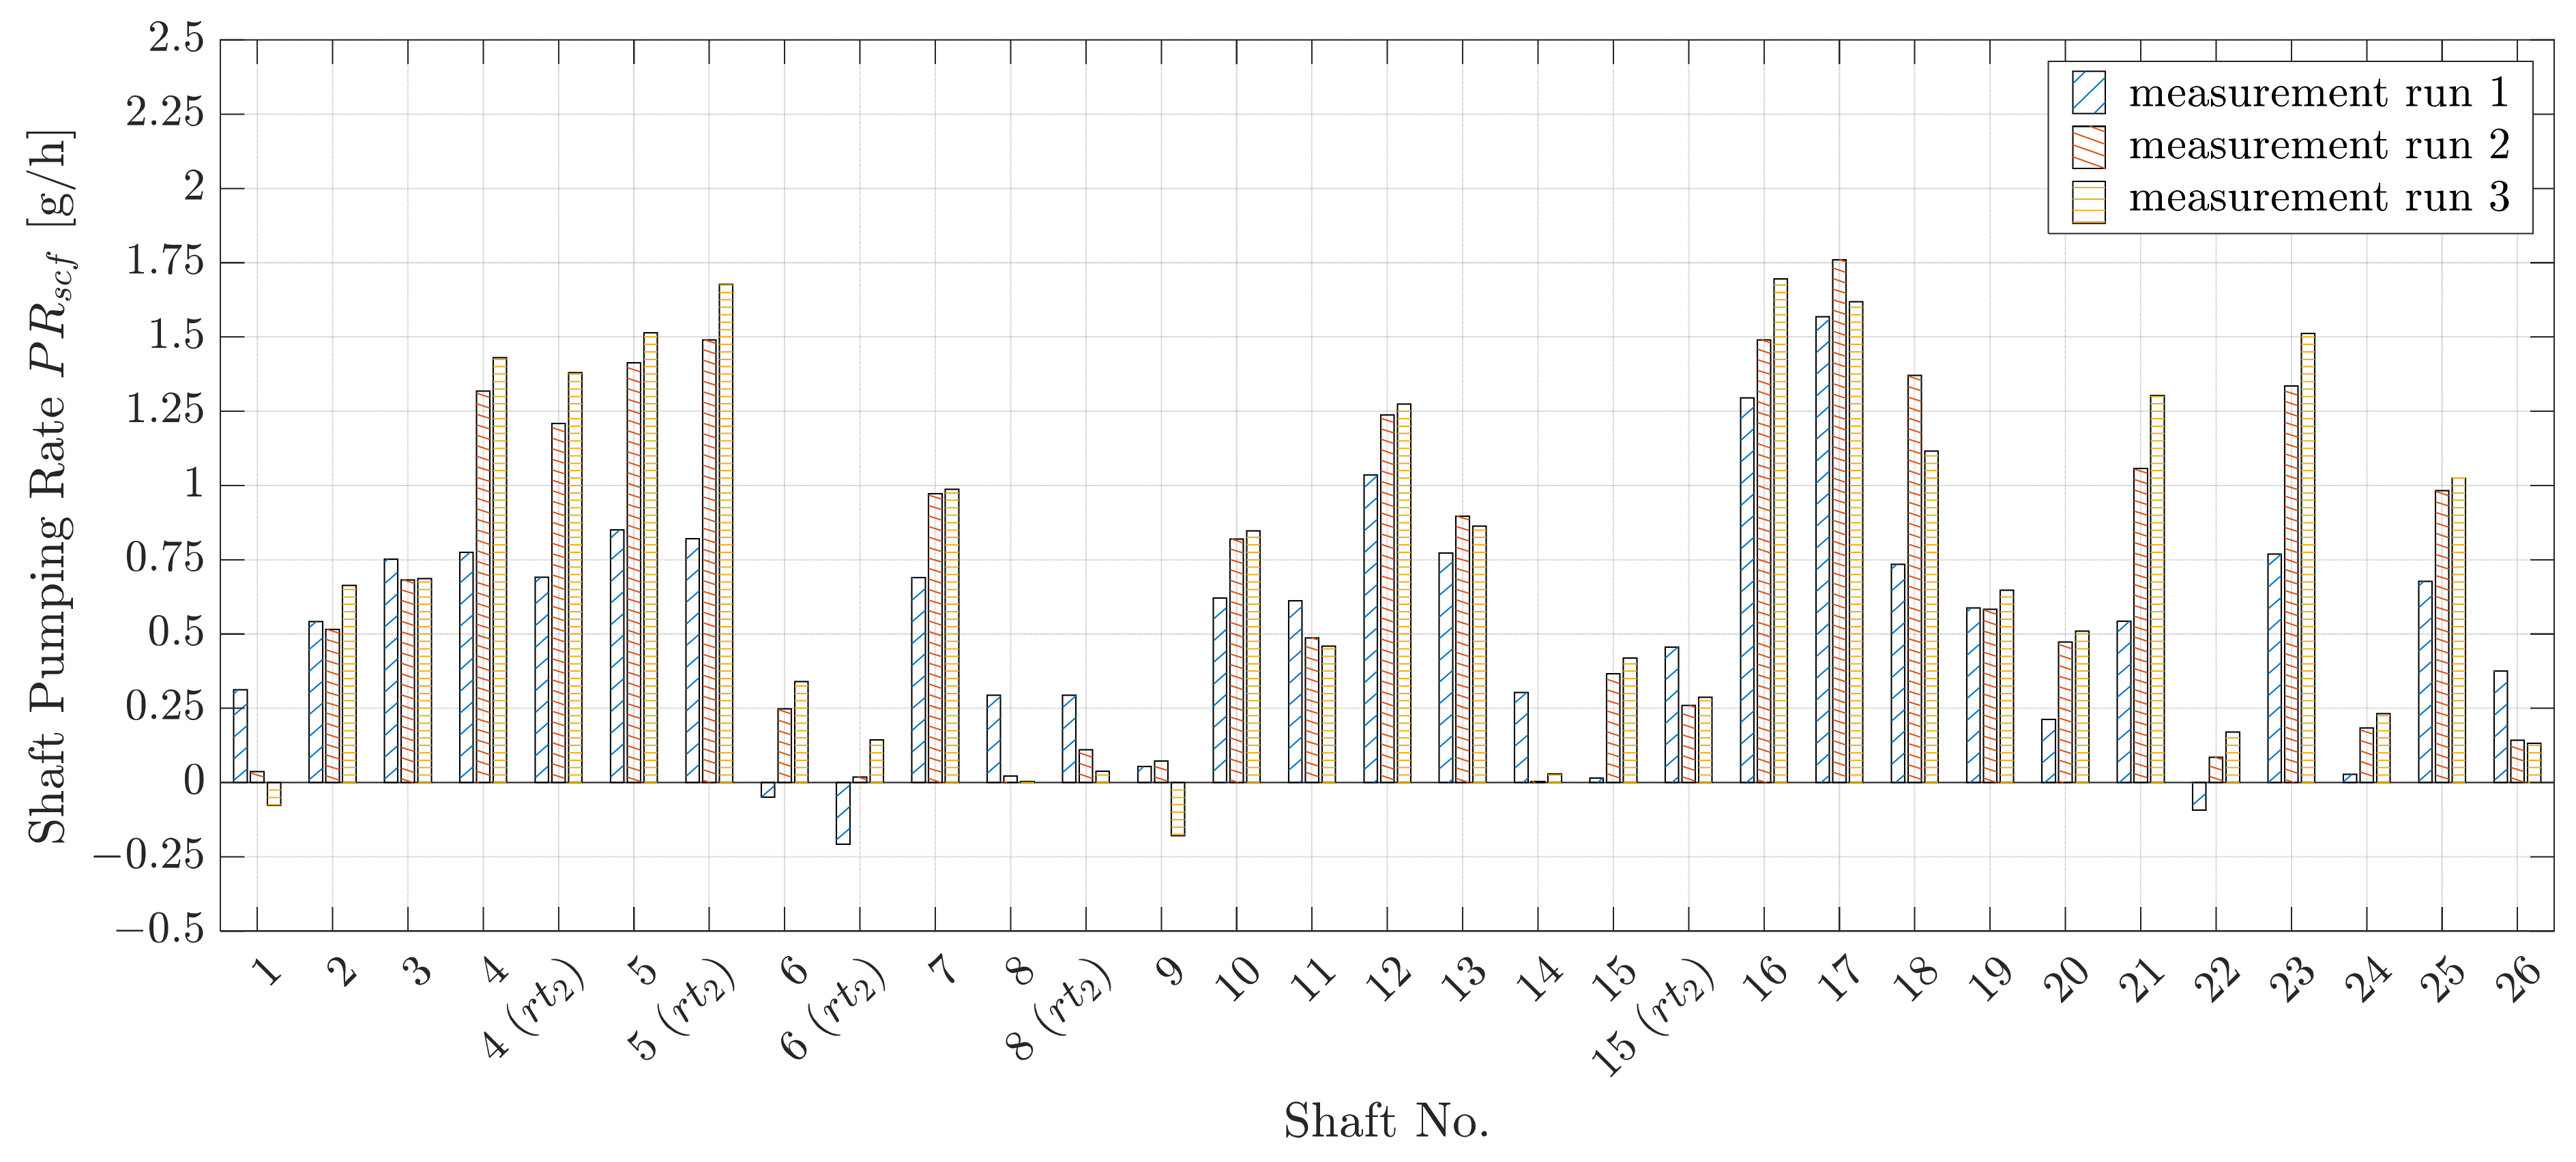
Table A3 in Appendix A lists the results of the experimental shaft pumping rate measurements. In the first step, it is investigated whether a single pumping rate measurement run provides a representative value for the pumping rate of a sealing counterface. For this purpose, measurement series with two up to five repetitions of the measurement runs according to Table 3 have been carried out. Each measurement series was performed on the same run track on the shaft. In addition, a further measurement series of three repetitions was carried out for five shafts on a second run track (shafts no. 6, 7, 8, 11, 17). These series are marked with (). The graphs in Figure 5 and Figure 6 depict the corresponding results. A bar represents the shaft pumping rate of a single measurement run calculated according to Equation (2) performed under the conditions in Table 3.
Figure 5 illustrates the measurement series of five repetitions carried out on the shafts 4, 5, 6, 8, 10 and 20. Shaft 4, 5 and 10 show an upward trend of the shaft pumping rate with an increasing number of repetitions. The values of shaft 6, 8 and 20 are not subjected to a systematic dispersion. However, in all four experiments, it is noticeable that the pumping rates of the first measurement run (first bar of each group) show the greatest deviation from the others.
On the other shafts, the measurement series were performed with two repetitions, as shown in Figure 6. In most cases, the first pumping rate also shows a large deviation from the values of the first and second measurement runs.
The preliminary investigations show that the determined pumping rate of the first measurement run is not comparable with the subsequent measurements. An explanation for this phenomenon is that the pumping rate of the rotary shaft seal is likely to change significantly over the time of the first measurement run compared to the subsequent measurement runs. In order to obtain a certain degree of statistical certainty and comparability of the pumping rate measurements, it is decided within this study that the mean of the values of the second and third measurement runs is the representative value of the shaft pumping rate:
The representative value of the shafts which were examined on a second run track in addition to the first results from the mean of the values according to Equation (3) of both run tracks:
In the following correlation studies, the representative value , according to Equations (3) and (4), is always considered as the pumping rate of a shaft.
4. Correlation Studies and Discussion
This section deals with model representations that describe the interaction of geometrical lead features in terms of their effect on the pumping rate of the sealing counterface. The models are based on the connection of parameters via mathematical operations. Correlation studies are used to assess the quality of the model. If a model representation is appropriate, its correlation to the pumping rates is high. A dimensionless value for assessing the goodness of linear correlation is the coefficient of determination , which is the square of the coefficient of correlation , according to Pearson’s correlation coefficient [40]:
With the measured data series … , where the variable represents the model values for each shaft, the variable represents the pumping rates and corresponds to the number of examined shafts. For illustration purposes, shaft pumping rates are plotted against the model values. High correlations are characterized by all data points following a straight line with a low dispersion. In addition to the data points, the straight line of the linear regression is shown to depict the deviation.
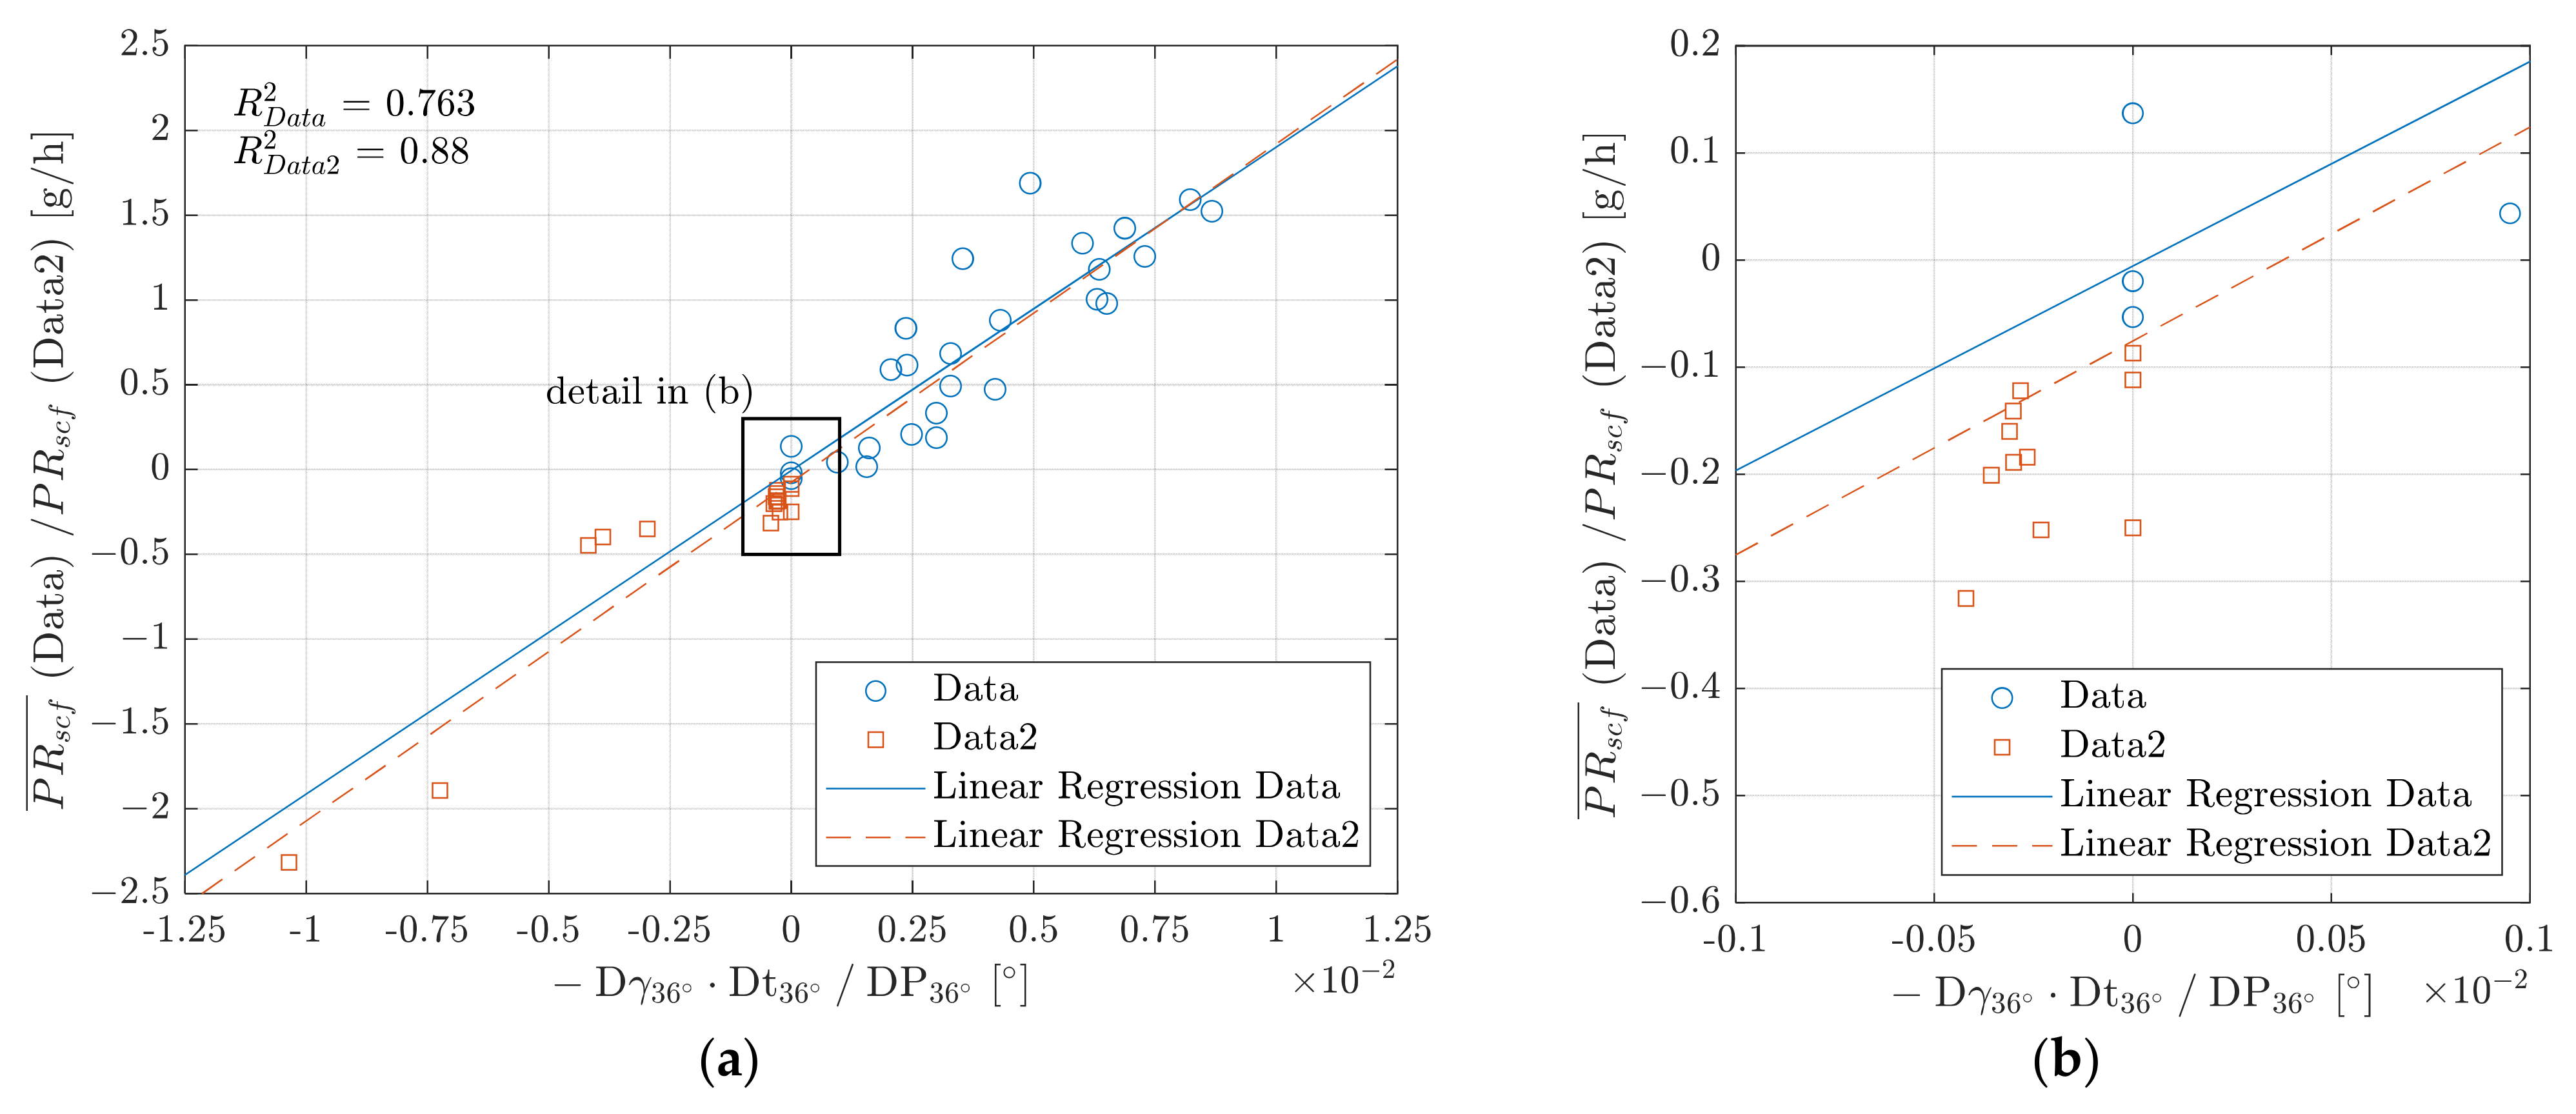
4.1. Verification of Existing Model Approach with Frequency-Based Lead Analysis
The first step is to verify if the extended test field and different measurement approach of this study fits the model in Equation (1). It is composed of the macro lead parameter combination of lead angle multiplied by lead depth and divided by period length . The graphs in Figure 7 illustrate the shaft pumping rates of the present investigations (blue circle) and of [25] (orange crosses) versus the model . Both studies show high correlations, with of the present investigations and of the former investigations [25]. In comparison, the higher value is due to the smaller number of support points of the regression line. In particular, this is because most of the 16 support points of study [25] are located near to the origin (see Figure 7b). In the present investigation, importance was attached to a broad and diverse test field, which is reflected in an even distribution of data points along the axis. This makes the current correlation study more meaningful. Nevertheless, both regression lines show almost the same course. Thus, the current results support the established model as well as the hypotheses of [25].
4.2. Modeling the Shaft Pumping Rate with Structure-Based Lead Analysis
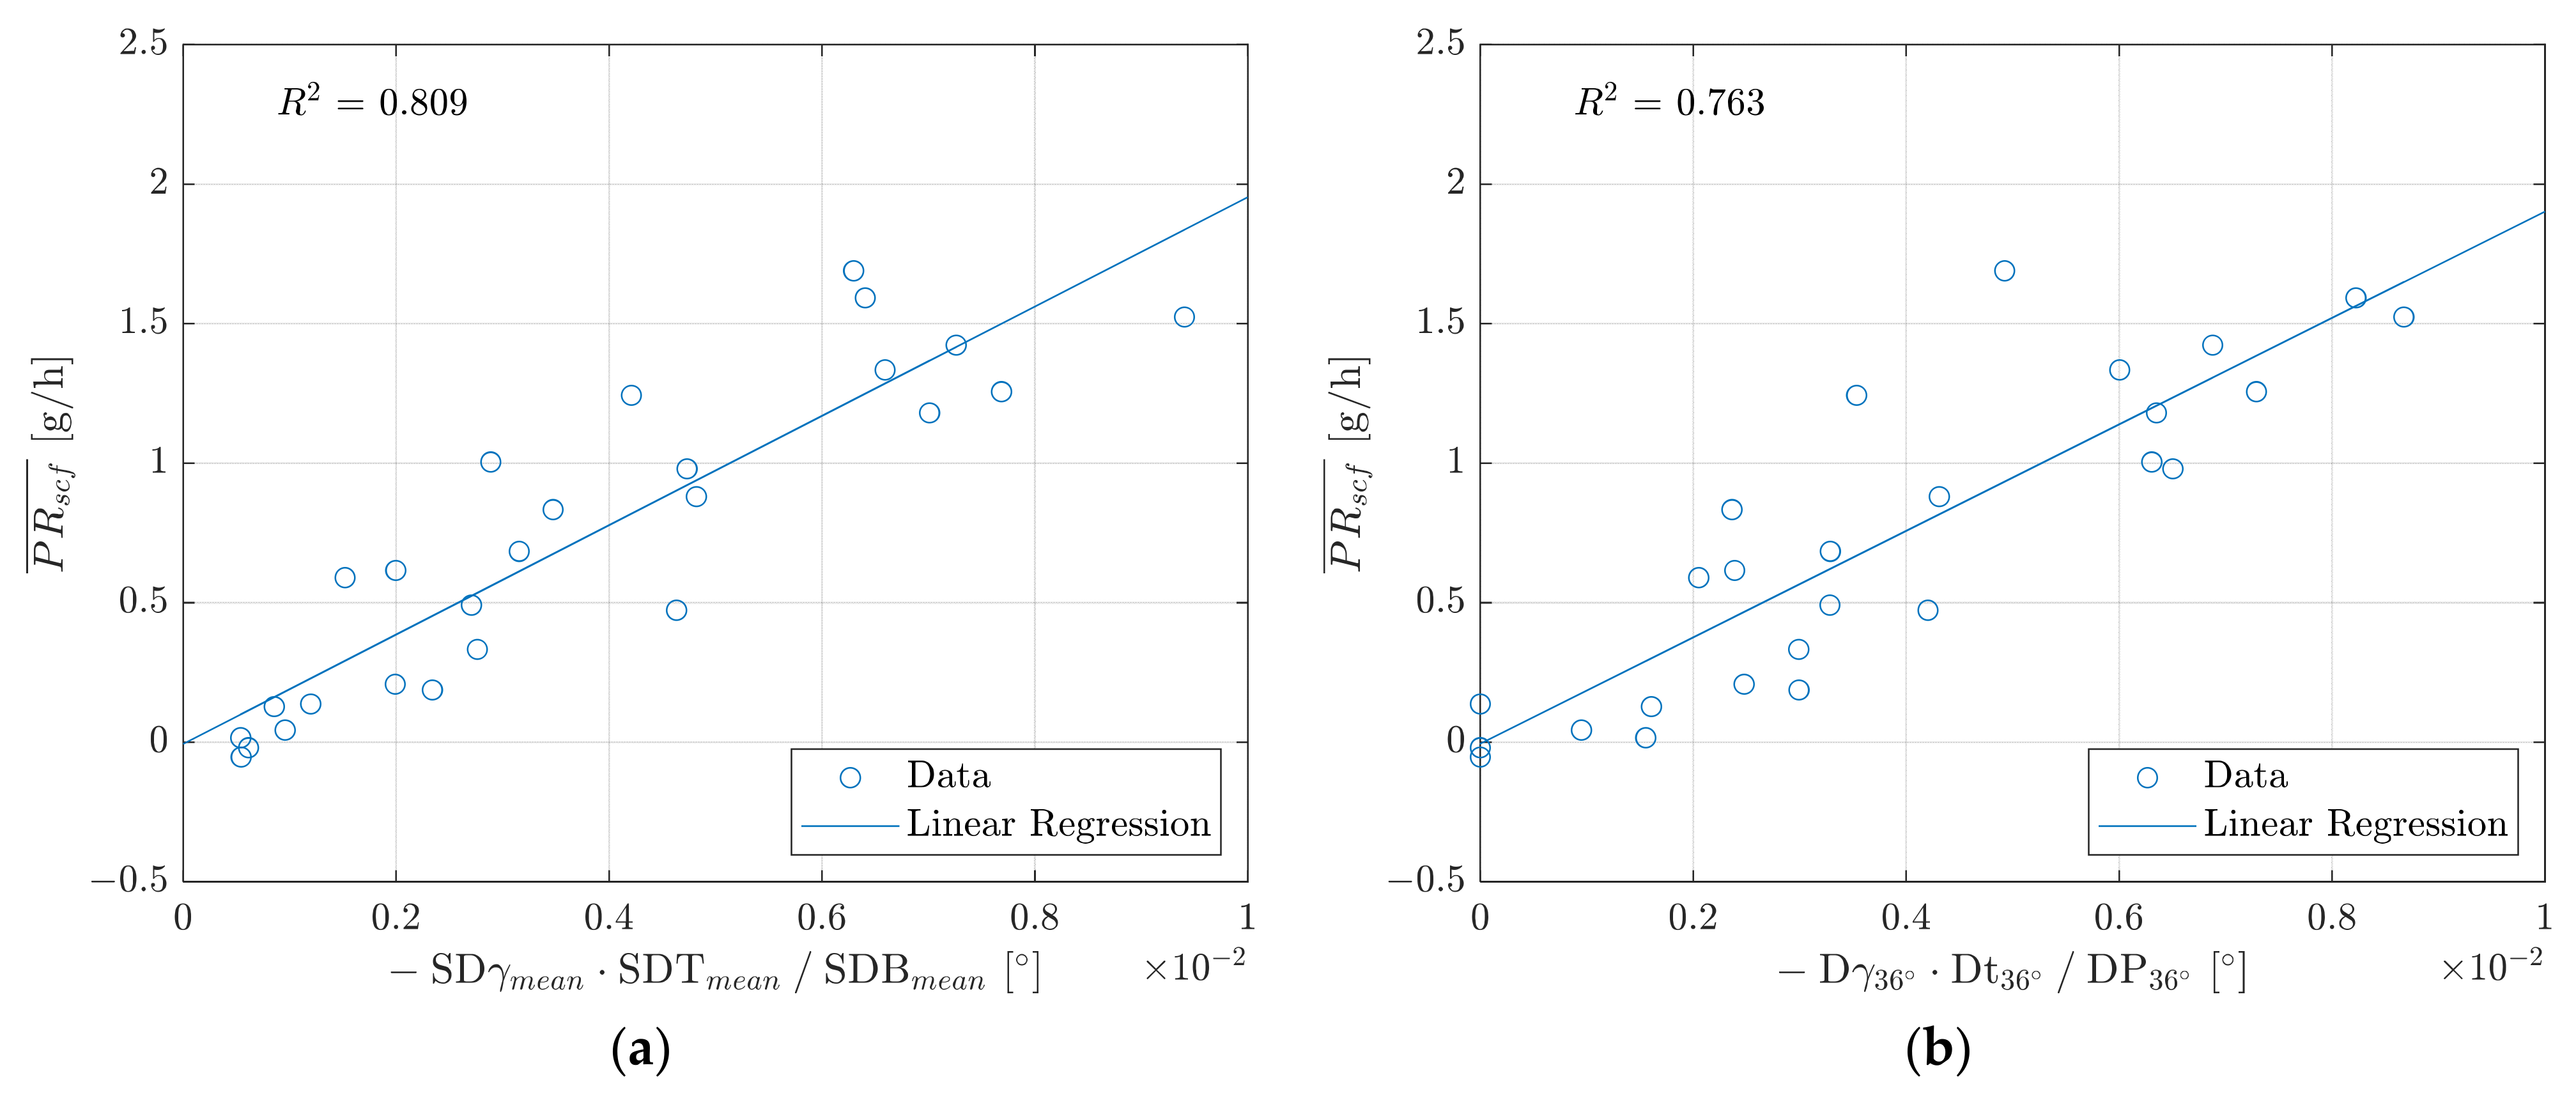
Since the structure-based method provides quantitative results even for aperiodic surface structures, the comparable model with the structure-based lead parameters in Equation (6) is expected to correlate better with the measured pumping rates.
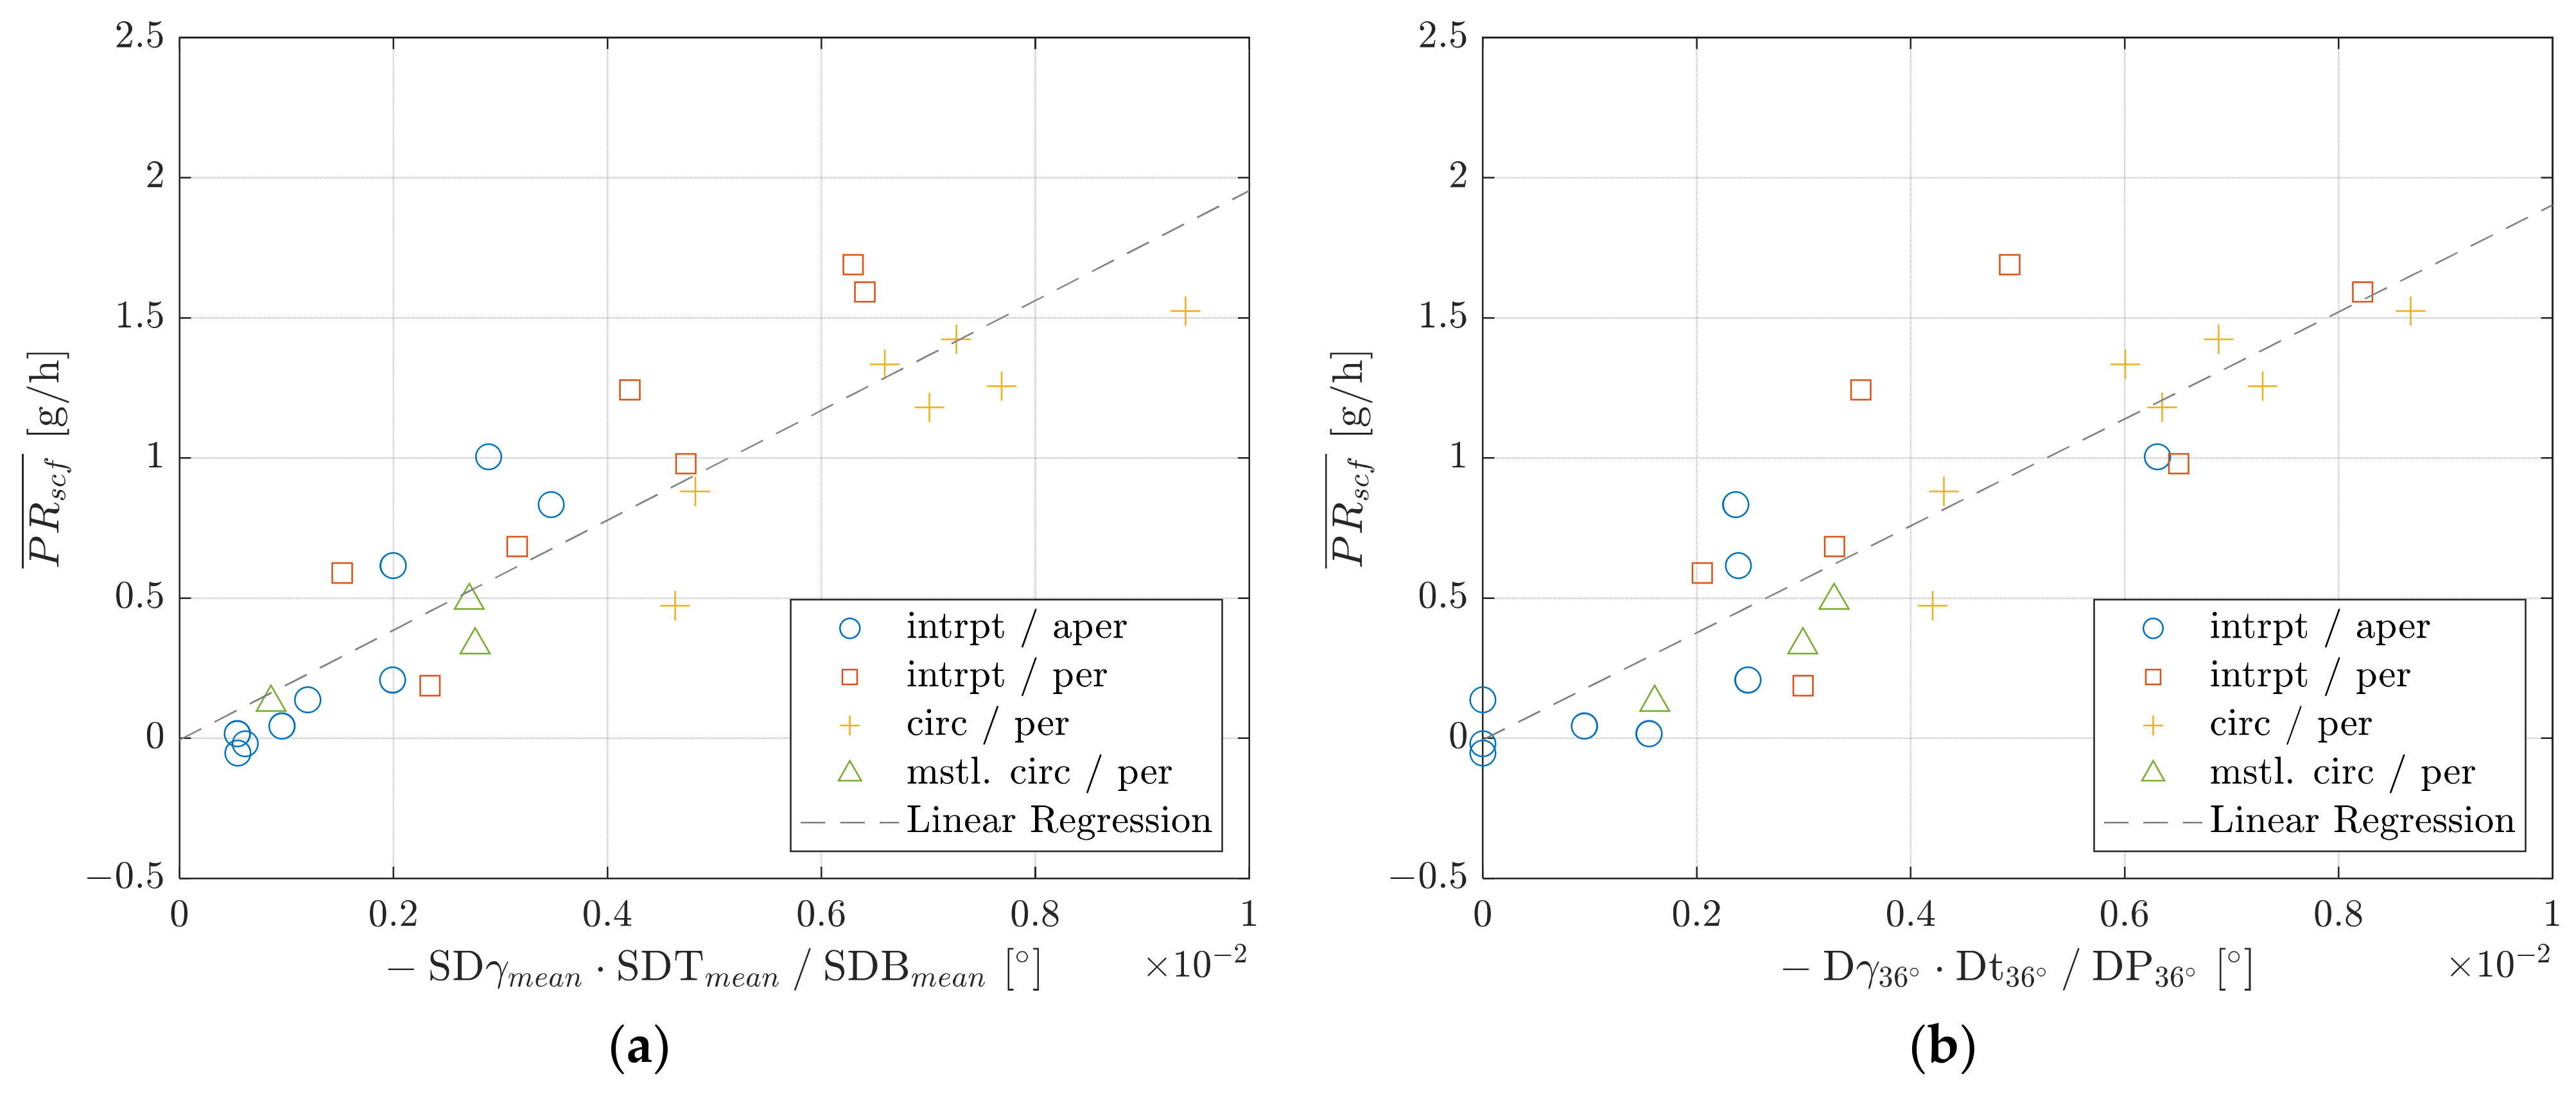
Figure 8 confirms this by comparing the linear correlation of the model (a) based on a structure-based approach and (b) with the frequency-based approach behind it. The improvement of the structure-based model representation is reflected in the lower scatter, especially in the x-value range . This leads to a higher and an improved model prediction of the shaft pumping rate.
The improvement in the model by means of structure-based parameters to is partly due to the fact that the structure-based lead analysis describes lead structures without mathematical approximation. The statistical consideration of the actually measured structures describes the functional behavior of the sealing counterfaces closer to reality. Furthermore, quantitative results are provided for all types of macroscopic lead. Periodic, aperiodic, interrupted and circulating structures are equally evaluated and described with the structure-based analysis. To show this, the investigated shafts are divided into the four classes (1)–(4) in Table 4. The classification is based on the combination of the characteristic structural properties “periodic”, “aperiodic”, “interrupted”, “almost circumferential” and “circumferential”. Table 4 also lists the criteria for the classification and an example topography. The criterion concerning “interrupted”, “almost circumferential” and “circumferential” refers to the average normalized structure length . Its value can be understood as a percentage of circumferentially continuous structures on the shaft surface. The calculation results from the ratio of the average structure length and the topography field length in circumferential direction are as follows:
The criterion for the evaluation of axial periodicity concerns the coefficient of variation of the structure widths. It indicates the dispersion of the structure widths with respect to the mean value and is calculated as follows:
Figure 9 represents the relationships of the pumping rates and the models and with marked structure classes. The markers of all four structure classes follow a similar trend in the structure-based model , as shown in Figure 8a. This is shown by a uniformly distributed scatter of all markers around the regression line. In contrast, the model in Figure 8b shows increased scatter of the markers around the regression line for the classes “interrupted/aperiodic” and “interrupted/periodic” compared to the classes “mostly circumferential/periodic” and “circumferential/periodic”. In the structure-based model in Figure 8a, there is also no cluster at the model value 0. For these shaft surfaces, the frequency-based MBN method detects incorrect or just qualitative lead patterns with the lead angle . In this case, qualitative means that no pronounced periodicity is detected. In contrast, the structure-based method is able to localize aperiodic structures and describe the stochastic nature of their surface on a statistical basis. Overall, this provides better correlations of the structure-based parameter combination with the pumping rates and thus the functional behavior of the sealing counterface.
Continuing the approach in [25], the current results also confirm that the term of structure angle multiplied by structure depth divided by structure width can be used to model the pumping rate of a macro lead-affected sealing counterface. But the structure width, or the period length , as a quotient in the term results from the consideration of the number of structures with effect in the sealing contact. With the lead parameters of the frequency-based method according to MBN [27] used so far, this detour is necessary. The structure-based lead analysis method, on the other hand, offers advanced approaches for modeling the shaft pumping rate.
4.3. Advanced Approach to Modeling the Shaft Pumping Rate
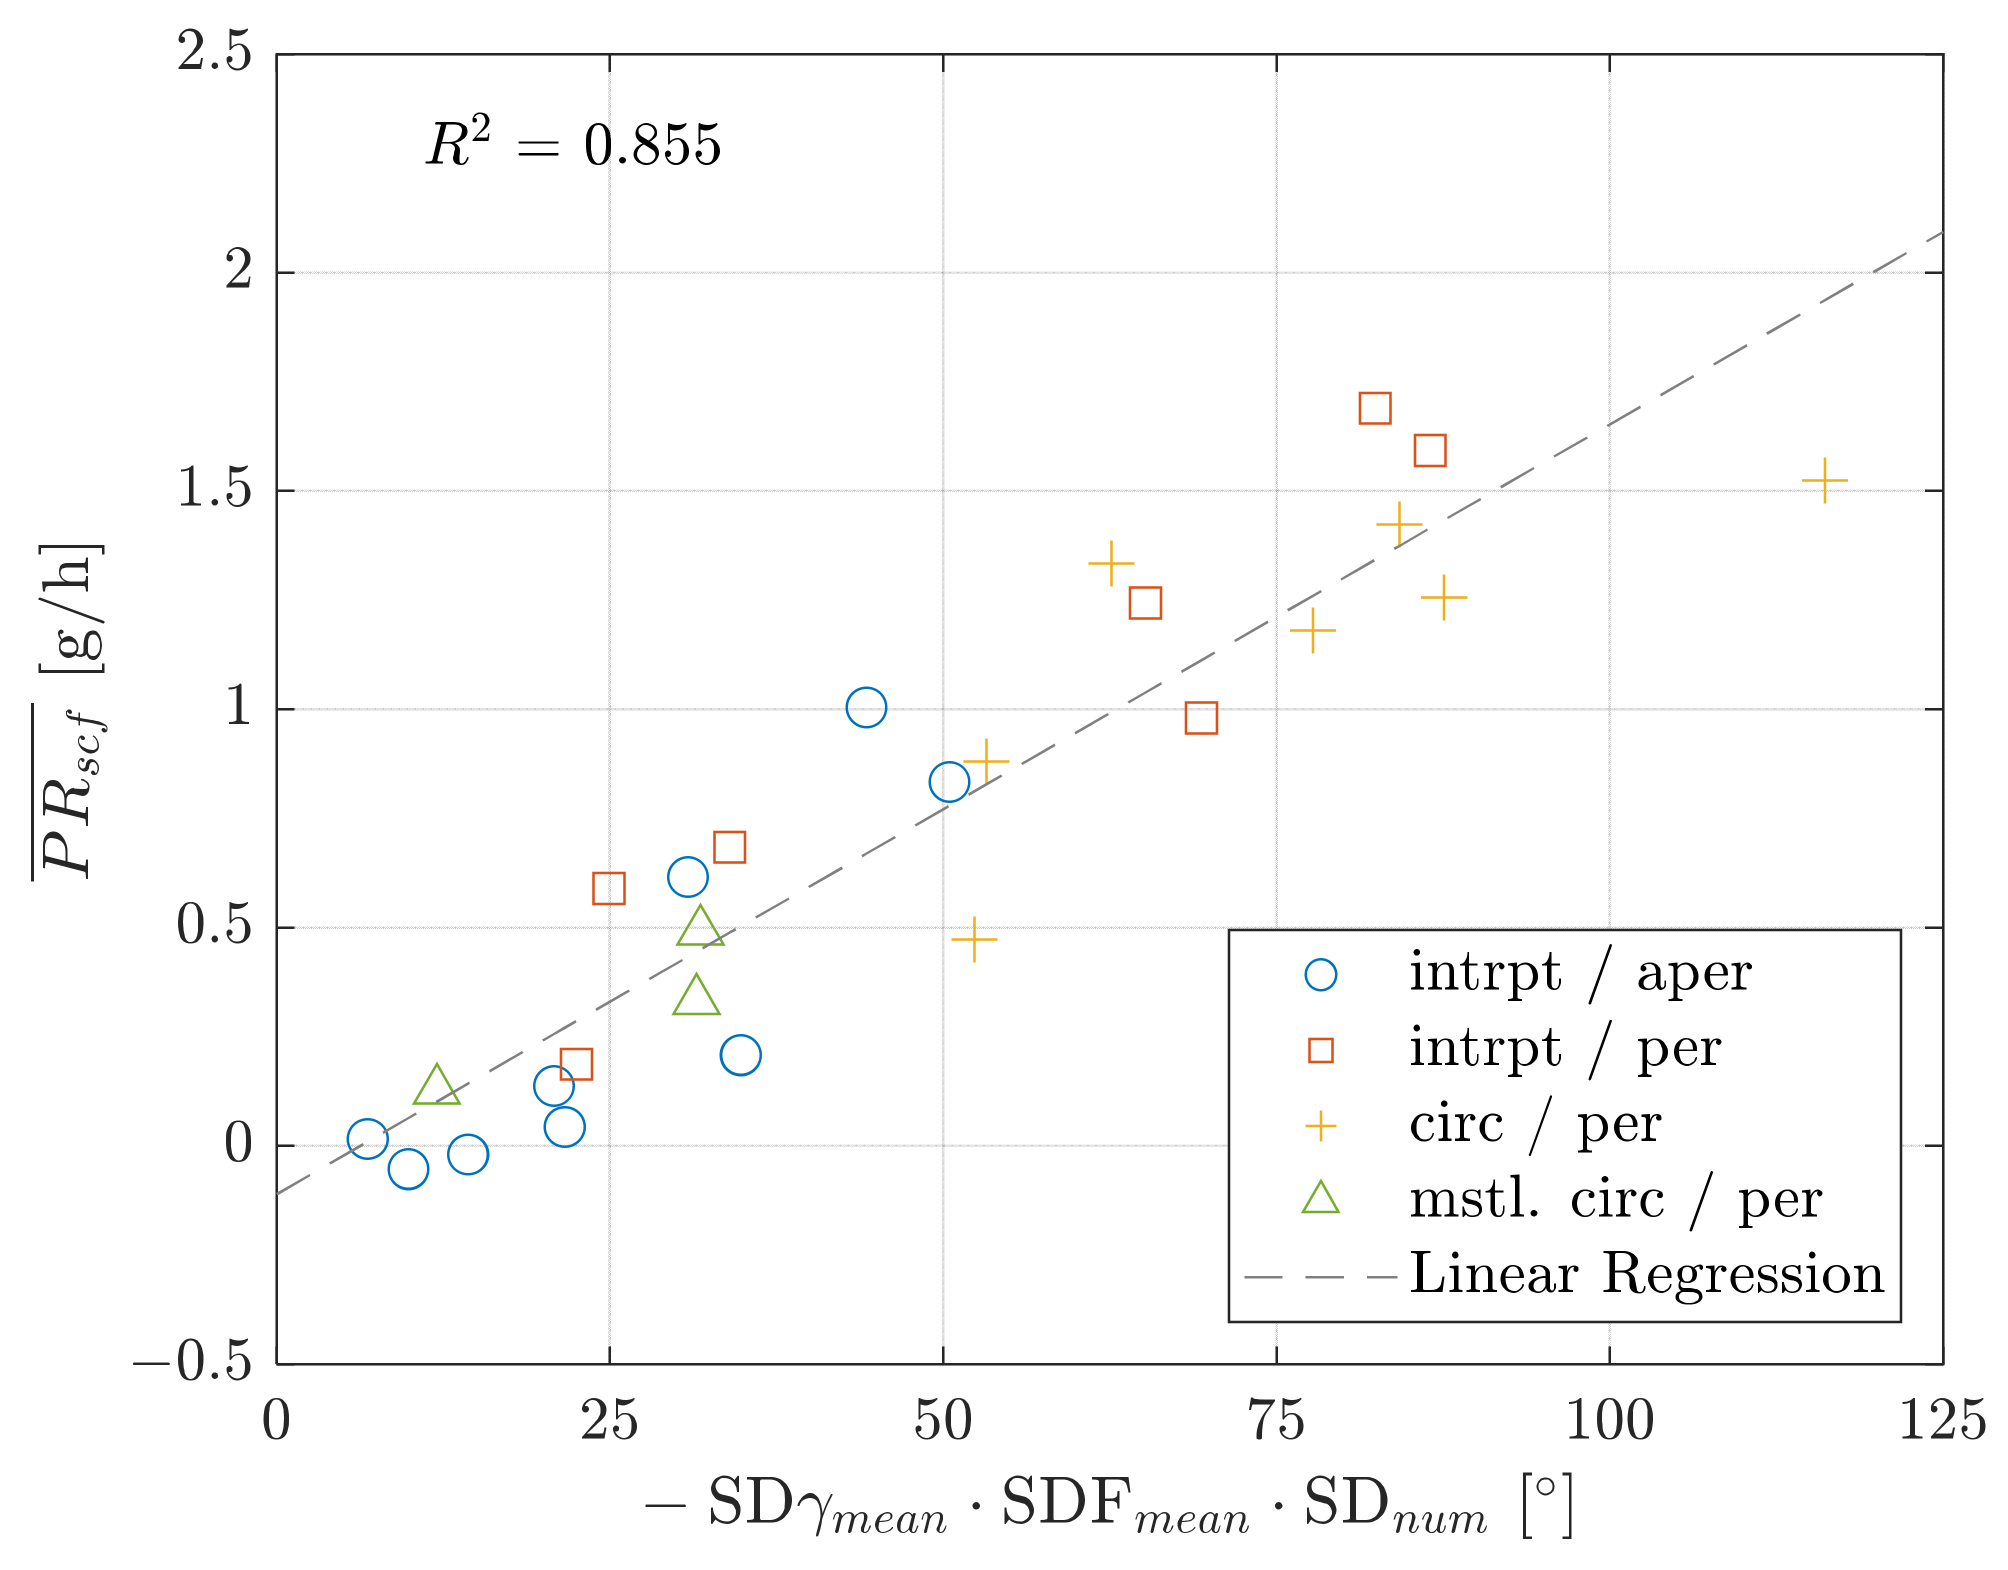
A physically motivated approach for a new model based on the structure-based macro lead parameters listed in Table 2 is to multiply the average cross-section of the structures by the structure number per square millimeter . The product represents a reference for the average pumping effective cross-section. Assuming a linear relationship of the pumping rate to the average structure angle , the following model equation is the result:
Figure 10 shows the shaft pumping rates over the model values of . The linear correlation of the model values and shaft pumping rates is high, with . The points within the structure classes show a uniform scattering along the regression line. The model represents the relationship between the geometric shapes of the lead structures and their pumping behavior even better than the model . The average structure cross-section and the normalized structure number are thus well suited as a reference value for the amount of fluid absorbed by the structures in the sealing contact. Investigations on other shaft surfaces with various structural properties are necessary to support this model. Computational simulation models such as [41,42] can also be considered to validate and improve parameter-based shaft flow rate models.
The shaft pumping rate models of this study are based on the experimental conditions in Table 3. Other influences on the pumping capacity of sealing counterfaces which occur especially under extended operating conditions are to be expected. These conditions can be, for example, varying rotational speeds, different oil temperatures or pressure loads. It should be noted that large changes, such as pressure loads, affect all components of the sealing system and therefore affect the evaluation of the influence of surface structures alone. Further work concerns the gradual identification of additional influences and their integration into improved models.
5. Conclusions
The present study deals with the determination of models describing the fluid pumping behavior of lead structures. Focus lies on macroscopic lead structures on shaft sealing counterfaces of rotary shaft seals. A model is considered as a combination of certain lead parameters, each of which describes a geometric feature of the lead structures. In this way, the interaction between individual geometric features of lead structures and their overall effect on the pumping behavior is represented in a model score. Correlation studies of the models with measured shaft pumping rates show their suitability for predicting the shaft pumping rates under the given conditions. The following findings were obtained within these investigations:
- A linear relationship can be shown between a model composed of lead structure angle (pumping direction) multiplied by lead structure depth (pumping amount) divided by lead structure width (indirect representation of the structure number) and the shaft pumping rate. The results correspond to former investigations [25]. Basically, the macro lead parameters according to the frequency-based MBN method [27] and the structure-based lead parameters according to [13] are suitable for the input of this kind of model.
- Structure-based lead parameters describe shaft surfaces with aperiodic structures or less pronounced periodicity in a quantitative way. The structure-based model correlates therefore better with the functional behavior of the sealing counterfaces than the comparable frequency-based model.
- A new model is introduced that is based only on structure-based lead parameters. It is composed of the multiplication of average structure cross-section , normalized structure number and average structure angle . This parameter combination represents an average pumping effective cross-section and a preferred pumping direction of the lead structures. A high linear correlation of this model exists with the measured shaft pumping rates of this study.
In conclusion, the results of this study show a strong linear relationship between the shaft pumping rate and lead parameters representing a pumping quantity and a directional character. This article thus forms the foundation for further research on the influence of structural characteristics of lead on shaft pumping performance. Extended operating conditions such as increased rotation speed may require the inclusion of further influencing factors. The next steps to improve the model and to determine further influences include expanding the experimental field and performing sealing gap simulations.
Author Contributions
Methodology, M.E.; Investigation, M.E. and G.H.; Writing—original draft, M.E.; Writing—review & editing, M.E., G.H., M.B. and F.B.; Visualization, M.E. All authors have read and agreed to the published version of the manuscript.
Funding
This research was funded by the German Research Foundation (DFG) grant “Open Access Publication Funding / 2023-2024 / University of Stuttgart“ (512689491).
Data Availability Statement
Data is contained within the article.
Conflicts of Interest
The authors declare no conflict of interest.
Nomenclature
| Symbols | ||
| α | Larger flank angle of sealing edge | [°] |
| β | Smaller flank angle of sealing edge | [°] |
| Coefficient of variation of the structure widths | [-] | |
| Theo. supply cross-section | [µm2] | |
| Num. of threads over 360° | [-] | |
| Period length | [mm] | |
| Lead depth | [µm] | |
| Lead angle | [°] | |
| Topography field length in axial direction | [µm | |
| Topography field length in circumferential direction | [µm | |
| Filter cutoff wavelength | [µm] | |
| Leakage in counterclockwise test run | [g] | |
| Leakage in clockwise test run | [g] | |
| Pumping flow of the rotary shaft seal | [g/h] | |
| Pumping flow of the sealing counterface | [g/h] | |
| Pumping flow of the system | [g/h] | |
| Number | [-] | |
| Pumping rate of the rotary shaft seal | [g/h] | |
| Pumping rate of the sealing counterface | [g/h] | |
| Representative value of the pumping rate of the rotary shaft seal | [g/h] | |
| Pumping rate of the system | [g/h] | |
| Coefficient of correlation | [-] | |
| Coefficient of determination | [-] | |
| Running track on the shaft | [-] | |
| Structure width | [µm | |
| Structure cross-section | [µm2] | |
| Structure length | [µm | |
| Structure depth | [µm | |
| Structure volume | [µm3] | |
| Structure angle | [°] | |
| Average normalized structure length | [-] | |
| Normalized Structure Number | [-] | |
| Duration per direction of rotation (pumping rate measurement) | [s] | |
| Abbreviations | ||
| 3D | Three-dimensional | |
| ccw | Counterclockwise | |
| cw | Clockwise | |
| FFT | Fast Fourier Transform | |
| IMA | Institute of Machine Components | |
| ISO | International Standards Organization | |
| MBN | Mercedes-Benz Factory Standard | |
| WST | Watershed transformation | |
Appendix A

Table A1.
Lead analysis results of the macro lead measurement according to MBN 31007-7 [27].
Table A1.
Lead analysis results of the macro lead measurement according to MBN 31007-7 [27].
| Shaft | Lead Angle /° | Period Length /mm | Lead Depth /µm | Theo. Supply Cross-Section /µm2 | Num. of Threads | |||||
|---|---|---|---|---|---|---|---|---|---|---|
| 360° | 36° | 360° | 36° | 360° | 36° | 360° | 36° | 360° | 36° | |
| 1 | 0.00 | 0.00 | 0.241 | 0.241 | 0.20 | 0.17 | 28.27 | 26.57 | 0 | 0 |
| 2 | −0.15 | −0.15 | 0.065 | 0.065 | 0.90 | 0.90 | 28.89 | 28.85 | −10 | −10 |
| 3 | −0.12 | −0.12 | 0.053 | 0.053 | 1.41 | 1.42 | 39.05 | 39.87 | −10 | −10 |
| 4 | −0.25 | −0.25 | 0.110 | 0.110 | 2.64 | 2.63 | 165.20 | 163.95 | −10 | −10 |
| 5 | −0.35 | −0.35 | 0.152 | 0.152 | 3.77 | 3.81 | 311.54 | 314.40 | −10 | −10 |
| 6 | −0.13 | −0.13 | 0.058 | 0.058 | 1.27 | 1.31 | 36.81 | 38.38 | −10 | −10 |
| 7 | 0.00 | −0.35 | 0.171 | 0.073 | 0.50 | 1.38 | 44.29 | 52.12 | 0 | −21 |
| 8 | −0.16 | −0.16 | 0.072 | 0.072 | 0.39 | 0.42 | 9.77 | 10.30 | −10 | −10 |
| 9 | 0.00 | 0.00 | 0.151 | 0.151 | 0.57 | 0.53 | 29.37 | 28.61 | 0 | 0 |
| 10 | 0.00 | −0.30 | 0.155 | 0.133 | 0.30 | 1.04 | 28.32 | 62.29 | 0 | −10 |
| 11 | −0.32 | −0.32 | 0.139 | 0.139 | 1.76 | 1.84 | 129.32 | 136.96 | −10 | −10 |
| 12 | −0.34 | −0.34 | 0.150 | 0.150 | 3.18 | 3.20 | 238.72 | 240.80 | −10 | −10 |
| 13 | −0.31 | −0.31 | 0.137 | 0.137 | 1.87 | 1.89 | 148.30 | 148.87 | −10 | −10 |
| 14 | 0.00 | −0.33 | 0.157 | 0.069 | 0.28 | 0.32 | 16.49 | 11.28 | 0 | −21 |
| 15 | −0.30 | −0.30 | 0.133 | 0.133 | 1.33 | 1.31 | 84.55 | 84.69 | −10 | −10 |
| 16 | 0.00 | −0.31 | 0.266 | 0.065 | 0.59 | 1.72 | 81.48 | 62.68 | 0 | −21 |
| 17 | −0.31 | −0.31 | 0.137 | 0.137 | 2.20 | 2.16 | 118.85 | 117.41 | −10 | −10 |
| 18 | −0.30 | −0.30 | 0.130 | 0.130 | 1.52 | 1.55 | 96.29 | 98.33 | −10 | −10 |
| 19 | −0.30 | −0.30 | 0.130 | 0.130 | 1.04 | 1.05 | 56.82 | 57.33 | −10 | −10 |
| 20 | −0.30 | −0.30 | 0.133 | 0.133 | 1.44 | 1.44 | 108.78 | 109.19 | −10 | −10 |
| 21 | −0.31 | −0.31 | 0.135 | 0.135 | 2.85 | 2.79 | 205.03 | 198.60 | −10 | −10 |
| 22 | −0.33 | −0.33 | 0.147 | 0.147 | 0.65 | 0.71 | 57.09 | 61.23 | −10 | −10 |
| 23 | −0.35 | −0.35 | 0.151 | 0.151 | 2.87 | 3.02 | 226.63 | 236.92 | −10 | −10 |
| 24 | 0.00 | −0.35 | 0.173 | 0.049 | 0.37 | 0.35 | 27.23 | 7.33 | 0 | −31 |
| 25 | 0.00 | −0.32 | 0.162 | 0.035 | 0.49 | 0.69 | 33.57 | 12.56 | 0 | −40 |
| 26 | 0.00 | 0.00 | 0.162 | 0.162 | 0.47 | 0.48 | 38.75 | 37.85 | 0 | 0 |
Table A2.
Structure-based macro lead analysis results 1.
| Shaft | /mm−2 | /° | /µm | /µm | Structure Depth /µm2 | Cross-Section /µm2 | Volume /µm3 | ||||||
|---|---|---|---|---|---|---|---|---|---|---|---|---|---|
| mean | std | mean | std | mean | std | mean | std | mean | std | mean | std | ||
| 1 | 14.5 | −0.07 | 1.62 | 55.99 | 17.50 | 1.00 × 10³ | 5.10 × 10² | 0.52 | 0.15 | 15.04 | 8.38 | 1.66 × 10⁴ | 1.68 × 10⁴ |
| 2 | 8.4 | −0.11 | 0.52 | 61.80 | 9.52 | 1.64 × 10³ | 1.15 × 10³ | 0.88 | 0.22 | 27.79 | 9.28 | 4.98 × 10⁴ | 4.89 × 10⁴ |
| 3 | 8.2 | −0.11 | 0.23 | 50.42 | 7.16 | 2.11 × 10³ | 1.33 × 10³ | 1.43 | 0.32 | 37.33 | 13.09 | 8.62 × 10⁴ | 7.87 × 10⁴ |
| 4 | 1.5 | −0.25 | 0.06 | 107.56 | 3.69 | 5.12 × 10³ | 5.21 × 10² | 2.89 | 0.27 | 166.30 | 16.14 | 8.52 × 10⁵ | 1.20 × 10⁵ |
| 5 | 1.0 | −0.35 | 0.07 | 150.06 | 4.40 | 5.23 × 10³ | 1.57 × 10 | 4.07 | 0.32 | 320.50 | 26.25 | 1.68 × 10⁶ | 1.37 × 10⁵ |
| 6 | 6.3 | −0.11 | 0.18 | 54.41 | 5.87 | 2.57 × 10³ | 1.49 × 10³ | 1.18 | 0.24 | 33.02 | 8.85 | 9.03 × 10⁴ | 6.70 × 10⁴ |
| 7 | 6.2 | −0.22 | 0.52 | 67.45 | 11.46 | 1.98 × 10³ | 1.23 × 10³ | 1.48 | 0.39 | 52.11 | 19.98 | 1.16 × 10⁵ | 1.17 × 10⁵ |
| 8 | 10.3 | −0.10 | 1.35 | 64.72 | 23.06 | 1.20 × 10³ | 7.26 × 10² | 0.62 | 0.17 | 20.97 | 14.42 | 2.80 × 10⁴ | 3.65 × 10⁴ |
| 9 | 7.2 | −0.04 | 1.24 | 68.19 | 24.11 | 1.55 × 10³ | 8.97 × 10² | 0.94 | 0.28 | 34.44 | 21.98 | 6.33 × 10⁴ | 7.77 × 10⁴ |
| 10 | 6.9 | −0.19 | 0.84 | 63.41 | 16.79 | 1.82 × 10³ | 1.07 × 10³ | 1.17 | 0.33 | 38.83 | 20.53 | 8.22 × 10⁴ | 9.28 × 10⁴ |
| 11 | 1.2 | −0.32 | 0.12 | 137.05 | 8.96 | 5.05 × 10³ | 6.73 × 10² | 1.98 | 0.25 | 140.42 | 20.36 | 7.12 × 10⁵ | 1.46 × 10⁵ |
| 12 | 1.0 | −0.34 | 0.08 | 149.07 | 5.07 | 5.23 × 10³ | 1.41 × 10 | 3.38 | 0.23 | 251.29 | 20.15 | 1.31 × 10⁶ | 1.05 × 10⁵ |
| 13 | 1.2 | −0.31 | 0.10 | 133.56 | 9.93 | 5.22 × 10³ | 1.29 × 10 | 2.08 | 0.25 | 148.16 | 21.93 | 7.73 × 10⁵ | 1.15 × 10⁵ |
| 14 | 5.6 | −0.04 | 0.85 | 67.52 | 21.97 | 2.09 × 10³ | 1.09 × 10³ | 0.81 | 0.27 | 27.23 | 16.32 | 6.43 × 10⁴ | 6.75 × 10⁴ |
| 15 | 1.4 | −0.23 | 0.35 | 127.80 | 13.32 | 4.47 × 10³ | 1.31 × 10³ | 1.53 | 0.26 | 95.05 | 19.75 | 4.32 × 10⁵ | 1.67 × 10⁵ |
| 16 | 6.9 | −0.22 | 0.45 | 61.41 | 9.86 | 2.00 × 10³ | 1.23 × 10³ | 1.77 | 0.47 | 56.40 | 21.67 | 1.26 × 10⁵ | 1.20 × 10⁵ |
| 17 | 6.3 | −0.27 | 0.30 | 62.93 | 7.15 | 2.08 × 10³ | 1.58 × 10³ | 1.47 | 0.46 | 48.27 | 19.96 | 1.24 × 10⁵ | 1.47 × 10⁵ |
| 18 | 8.1 | −0.21 | 0.63 | 61.93 | 11.49 | 1.68 × 10³ | 1.14 × 10³ | 1.22 | 0.33 | 37.93 | 15.95 | 7.06 × 10⁴ | 7.39 × 10⁴ |
| 19 | 7.4 | −0.12 | 0.71 | 64.75 | 18.78 | 1.69 × 10³ | 1.17 × 10³ | 1.08 | 0.30 | 35.04 | 19.22 | 6.83 × 10⁴ | 8.55 × 10⁴ |
| 20 | 1.5 | −0.20 | 0.38 | 120.76 | 22.33 | 4.46 × 10³ | 1.20 × 10³ | 1.66 | 0.34 | 106.59 | 34.09 | 4.97 × 10⁵ | 2.25 × 10⁵ |
| 21 | 1.2 | −0.31 | 0.05 | 132.23 | 3.65 | 5.22 × 10³ | 1.56 × 10 | 2.97 | 0.25 | 207.81 | 20.74 | 1.09 × 10⁶ | 1.08 × 10⁵ |
| 22 | 1.5 | −0.11 | 0.82 | 132.17 | 30.59 | 3.84 × 10³ | 1.43 × 10³ | 1.01 | 0.30 | 71.81 | 32.64 | 3.01 × 10⁵ | 2.05 × 10⁵ |
| 23 | 1.0 | −0.33 | 0.17 | 147.64 | 11.08 | 5.23 × 10³ | 1.34 × 10 | 3.25 | 0.26 | 248.75 | 22.79 | 1.30 × 10⁶ | 1.19 × 10⁵ |
| 24 | 8.9 | −0.17 | 1.29 | 61.23 | 22.00 | 1.40 × 10³ | 8.83 × 10² | 0.72 | 0.26 | 23.01 | 17.01 | 3.95 × 10⁴ | 5.81 × 10⁴ |
| 25 | 15.9 | −0.18 | 0.96 | 43.29 | 13.24 | 1.10 × 10³ | 6.90 × 10² | 0.71 | 0.24 | 15.94 | 9.81 | 2.09 × 10⁴ | 2.97 × 10⁴ |
| 26 | 11.2 | −0.11 | 1.32 | 54.85 | 20.84 | 1.23 × 10³ | 7.89 × 10² | 0.62 | 0.20 | 17.49 | 12.95 | 2.62 × 10⁴ | 4.03 × 10⁴ |
1 parametrization according to [13]: projected segment length , percentage of the core height , percentage of the average projected area and contact band width .
Table A3.
Pumping rates measurement results.
| Shaft | Shaft Pumping Rate According to Equation (2) and Table 3 | * According to Equations (3) and (4) | |||||
|---|---|---|---|---|---|---|---|
| Number of the Measurement Series | |||||||
| 1 | 2 | 3 | 4 | 5 | 6 | ||
| 1 | 0.31 | 0.04 | −0.08 | - | - | - | −0.02 |
| 2 | 0.54 | 0.52 | 0.66 | - | - | - | 0.59 |
| 3 | 0.75 | 0.68 | 0.69 | - | - | - | 0.69 |
| 4 | 0.78 | 1.32 | 1.43 | 1.54 | 1.60 | 1.65 | 1.33 |
| 4 (rt2) | 0.69 | 1.21 | 1.38 | - | - | - | |
| 5 | 0.85 | 1.41 | 1.51 | 1.60 | 1.63 | 1.72 | 1.52 |
| 5 (rt2) | 0.82 | 1.49 | 1.68 | - | - | - | |
| 6 | −0.05 | 0.25 | 0.34 | 0.40 | 0.40 | 0.39 | 0.18 |
| 6 (rt2) | −0.21 | 0.02 | 0.14 | - | - | - | |
| 7 | 0.69 | 0.97 | 0.99 | - | - | - | 0.98 |
| 8 | 0.29 | 0.02 | 0.00 | 0.04 | 0.04 | 0.07 | 0.05 |
| 8 (rt2) | 0.29 | 0.11 | 0.04 | - | - | - | |
| 9 | 0.05 | 0.07 | −0.18 | - | - | - | −0.06 |
| 10 | 0.62 | 0.82 | 0.85 | 0.89 | 0.89 | 0.91 | 0.83 |
| 11 | 0.61 | 0.49 | 0.46 | - | - | - | 0.48 |
| 12 | 1.04 | 1.24 | 1.27 | - | - | - | 1.26 |
| 13 | 0.77 | 0.90 | 0.86 | - | - | - | 0.88 |
| 14 | 0.30 | 0.00 | 0.03 | - | - | - | 0.02 |
| 15 | 0.46 | 0.26 | 0.29 | - | - | - | 0.33 |
| 15 (rt2) | 0.02 | 0.37 | 0.42 | - | - | - | |
| 16 | 1.29 | 1.49 | 1.70 | - | - | - | 1.60 |
| 17 | 1.57 | 1.76 | 1.62 | - | - | - | 1.69 |
| 18 | 0.73 | 1.37 | 1.12 | - | - | - | 1.25 |
| 19 | 0.59 | 0.58 | 0.65 | - | - | - | 0.62 |
| 20 | 0.21 | 0.47 | 0.51 | 0.56 | 0.53 | 0.54 | 0.49 |
| 21 | 0.54 | 1.06 | 1.30 | - | - | - | 1.18 |
| 22 | −0.09 | 0.09 | 0.17 | - | - | - | 0.13 |
| 23 | 0.77 | 1.34 | 1.51 | - | - | - | 1.43 |
| 24 | 0.03 | 0.18 | 0.23 | - | - | - | 0.21 |
| 25 | 0.68 | 0.98 | 1.03 | - | - | - | 1.01 |
| 26 | 0.38 | 0.14 | 0.13 | - | - | - | 0.14 |
* representative value for the pumping rate of a sealing counterface .
References
- Bauer, F. Federvorgespannte-Elastomer-Radial-Wellendichtungen: Grundlagen der Tribologie & Dichtungstechnik, Funktion und Schadensanalyse; Springer Vieweg: Wiesbaden, Germany, 2021; ISBN 978-3-658-32922-8. [Google Scholar]
- DIN 3760:1996-09; Radial-Wellendichtringe. Deutsches Institut für Normung e.V.: Berlin, Germany, 1996.
- ISO 6194-1:2007-09; Rotary Shaft Lip-Type Seals Incorporating Elastomeric Sealing Elements—Part 1: Nominal Dimensions and Tolerances. International Organization for Standardization: Geneva, Switzerland, 2007.
- Kammüller, M. Zum Abdichtverhalten Von Radial-Wellendichtringen. Ph.D. Thesis, Universität Stuttgart, Stuttgart, Germany, 1986. [Google Scholar]
- Müller, H.K. Concepts of Sealing Mechanism of Rubber Lip Type Rotary Shaft Seals. In Proceedings of the 11th International Conference on Fluid Sealing. 11th International Conference on Fluid Sealing, Cannes, France, 8–10 April 1987; Nau, B.S., Ed.; Elsevier: London, UK; New York, NY, USA, 1987; pp. 698–709, ISBN 9781851661008. [Google Scholar]
- RMA OS-1-1; Shaft Finish Requirements for Radial Lip Seals. Rubber Manufacturers Association: Washington, DC, USA, 2004.
- DIN 3761-2:1983-11; Radial-Wellendichtringe Für Kraftfahrzeuge—Anwendungshinweise. Deutsches Institut für Normung e.V.: Berlin, Germany, 1983.
- Lines, D.J.; O’Donoghue, J.P. The effect of surface roughness and thermal operating conditions on the under-lip temperature of a rotary shaft seal. In Proceedings of the 8th International Conference on Fluid Sealing, University of Durham, Durham, UK, 11–13 September 1978; British Hydromechanics Research Association: Cranfield, UK, 1978. ISBN 9780900983931. [Google Scholar]
- Kozuch, E.; Nomikos, P.; Rahmani, R.; Morris, N.; Rahnejat, H. Effect of Shaft Surface Roughness on the Performance of Radial Lip Seals. Lubricants 2018, 6, 99. [Google Scholar] [CrossRef]
- Jagger, E.T. Rotary Shaft Seal Some Effects of Shaft Surface Finish. In Proceedings of the 1st International Conference on Fluid Sealing; British Hydromechanics Research Association, Ashford, UK, 17–19 April 1961. Paper A1. [Google Scholar]
- Kersten, G. Optische und Antastende Prüfung Der Gegenlauffläche Von Radial-Wellendichtringen; VDI Verlag: Düsseldorf, Germany, 1992; ISBN 3-18-148102-5. [Google Scholar]
- Jackowski, R. Shaft Finish Requirements for Rotary Lip Seals; SAE Paper Nr. 1999-01-0888; SAE: Warrendale, PA, USA, 1999. [Google Scholar]
- Engelfried, M.; Baumann, M.; Bauer, F. Three-dimensional structure-based approach for the analysis of macroscopic lead structures on sealing counterfaces. Int. J. Metrol. Qual. Eng. 2022, 13, 2. [Google Scholar] [CrossRef]
- Kundrák, J.; Gyáni, K.; Felhő, C.; Markopoulos, A.P.; Deszpoth, I. Analysis of lead twist in modern high-performance grinding methods. IOP Conf. Ser. Mater. Sci. Eng. 2016, 161, 012005. [Google Scholar] [CrossRef]
- Haffner, G.; Baumann, M.; Schmuker, S.; Bauer, F. Approach to the Description of Macro Lead Formation by Means of a Kinematics Simulation Model. Tribol. Trans. 2022, 65, 749–761. [Google Scholar] [CrossRef]
- Röttger, J.; Bergs, T.; Barth, S.; Baumann, M.; Bauer, F. Influence of dressing parameters on the formation of micro lead on shaft sealing counterfaces during external cylindrical plunge grinding. Adv. Ind. Manuf. Eng. 2022, 5, 100098. [Google Scholar] [CrossRef]
- Baumann, M. Abdichtung Drallbehafteter Dichtungsgegenlaufflächen—Messung, Analyse, Bewertung und Grenzen. Ph.D. Thesis, Universität Stuttgart, Stuttgart, Germany, 2017. [Google Scholar]
- DIN EN ISO 12085:1998-05; Geometrische Produktspezifikation (GPS)—Oberflächenbeschaffenheit: Tastschnittverfahren. Motifkenngrößen; Deutsches Institut für Normung e.V.: Berlin, Germany, 1998.
- Seewig, J.; Hercke, T. Lead characterisation by an objective evaluation method. Wear 2009, 266, 530–533. [Google Scholar] [CrossRef]
- Buhl, S. Wechselbeziehungen im Dichtsystem Von Radial-Wellendichtring. Ph.D. Thesis, Universität Stuttgart, Stuttgart, Germany, 2006. [Google Scholar]
- Baitinger, G. Multiskalenansatz Mit Mikrostrukturanalyse Zur Drallbeurteilung Von Dichtungsgegenlaufflächen. Ph.D. Thesis, Universität Stuttgart, Stuttgart, Germany, 2011. [Google Scholar]
- Jung, S. Beitrag Zum Einfluss Der Oberflächencharakteristik Von Gegenlaufflächen Auf Das tribologische System Radial-Wellendichtung. Ph.D. Thesis, Universität Stuttgart, Stuttgart, Germany, 2013. [Google Scholar]
- Matus, M. Stochastische Strukturen: Auswirkung Stochastischer Strukturen Von Gegenlaufflächen Auf Die Funktion Von Radialwellendichtringen; Abschlussbericht FVA Vorhaben Nr. 706 I, IGF-Nr. 17812 N; FVA: Frankfurt am Main, Germany, 2016. [Google Scholar]
- Fehrenbacher, C.; Haas, W. 3D-Kennwerte: 3D-Oberflächenkennwerte Für Dichtflächen; Abschlussbericht FVA Vorhaben Nr. 674 I; FVA: Frankfurt am Main, Germany, 2015. [Google Scholar]
- Schiefer, F.; Baumann, M.; Bauer, F. Untersuchung des Förderverhaltens makrodrall-behafteter Dichtungsgegenlaufflächen. In Proceedings of the 20th International Sealing Conference (ISC), Stuttgart, Germany, 10–11 October 2018; Fachverband Fluidtechnik im VDMA e.V: Frankfurt am Main, Germany, 2018; pp. 301–312, ISBN 978-3-8163-0727-3. [Google Scholar]
- Thielen, S.; Magyar, B.; Sauer, B.; Schneider, F.; Mayer, P.; Kirsch, B.; Müller, R.; Harbou, E.v.; Aurich, J.C. Functional investigation of zero lead radial shaft seal counter-surfaces turned with a special method. Tribol. Int. 2017, 118, 442–450. [Google Scholar] [CrossRef]
- MBN 31007-7; Geometrische Produktspezifikationen (GPS)—Oberflächenbeschaffenheit Mess-Und Auswerteverfahren Zur Bewertung Von drallreduzierten Dynamischen Dichtflächen. Mercedes-Benz: Stuttgart, Germany, 2008.
- Fehrenbacher, C. Förderverhalten Im Dichtsystem Radial-Wellendichtung. Ph.D. Thesis, Universität Stuttgart, Stuttgart, Germany, 2018. [Google Scholar]
- de Groot, P.J.; Schmidt, M.; Deck, L.L. Optical measurement of ground cylinder lead angle. In Optical Measurement Systems for Industrial Inspection XI; Lehmann, P., Osten, W., Albertazzi Gonçalves, A., Eds.; SPIE: Munich, Germany, 2019; p. 32. ISBN 9781510627918. [Google Scholar]
- DIN 25178-2:2012-09; Geometrische Produktspezifikation (GPS)—Oberflächenbeschaffenheit: Flächenhaft; Teil 2: Begriffe Und Oberflächen-Kenngrößen. Deutsches Institut für Normung e.V.: Berlin, Germany, 2012.
- Nomikos, P.; Rahmani, R.; Morris, N.; Rahnejat, H. An investigation of oil leakage from automotive driveshaft radial lip seals. Proc. Inst. Mech. Eng. Part D J. Automob. Eng. 2023, 237, 3108–3124. [Google Scholar] [CrossRef]
- Universität Stuttgart, Institut für Maschinenelemente. IMA-Mikrodrall®Analyse; IMA-TechSheet #104140: Stuttgart, Germany, 2022; Available online: https://www.ima.uni-stuttgart.de/dokumente/forschung/dichtungstechnik/dienstleistungen/en/104140en.pdf (accessed on 18 September 2023).
- Seewig, J.; Hercke, T. 2nd Generation Lead Measurement. In Proceedings of the XIX IMEKO World Congress, Fundamental and Applied Metrology, Lisbon, Portugal, 6–11 September 2009; ISBN 9781615675937. [Google Scholar]
- Seewig, J.; Jordan, H.-J.; Hercke, T.; Volk, R. Optical High Speed Twist Characterisation. In Proceedings of the XII. International Colloquium on Surfaces. XII, Chemnitz, Germany, 28–29 January 2008. [Google Scholar]
- Blateyron, F. The Areal Feature Parameters. In Characterisation of Areal Surface Texture; Leach, R., Ed.; Springer: Berlin/Heidelberg, Germany, 2013; pp. 45–65. ISBN 978-3-642-36457-0. [Google Scholar]
- Jiang, X.; Senin, N.; Scott, P.J.; Blateyron, F. Feature-based characterisation of surface topography and its application. CIRP Annals 2021, 70, 681–702. [Google Scholar] [CrossRef]
- Kawahara, Y.; Abe, M. Effect of Surface Condition of Lip on Sealing Phenomena of Oil Seals. In Proceedings of the Automotive Engineering Congress and Exposition, Detroit, MI, USA, 27 February 1978; SAE International: Warrendale, PA, USA, 1978. [Google Scholar]
- Hermann, W.; Seffler, H.-W. Neue Erkenntnisse für den Abdichtmechanismus von Radial-Wellendichtringen. ATZ Automob. Z. 1985, 87, 475–484. [Google Scholar]
- Raab, H. Wellenlaufflächen: Einfluß Der Wellenlauffläche Auf Das Dichtverhalten Von Radial-Wellendichtringen; Abschlussbericht FKM Vorhaben Nr. 211, AiF-Nr. 10670; FKM: Frankfurt am Main, Germany, 1998. [Google Scholar]
- Bewersdorff, J. STATISTIK—Wie Und Warum Sie Funktioniert: Ein Mathematisches Lesebuch; Vieweg + Teubner: Wiesbaden, Germany, 2011; ISBN 978-3-8348-1753-2. [Google Scholar]
- Thielen, S.; Subramanian, T.; Sauer, B.; Koch, O.; Börner, R.; Junge, T.; Schubert, A. Characterisation of the conveying effect of turned radial shaft seal counter-surfaces using a simplified hydrodynamic simulation model. Fors. Ingenieurw. 2023, 87, 655–671. [Google Scholar] [CrossRef]
- Jia, X.; Jung, S.; Haas, W.; Salant, R.F. Numerical simulation and experimental study of shaft pumping by plunge ground shafts with rotary lip seals. Tribol. Int. 2012, 48, 155–161. [Google Scholar] [CrossRef]
Figure 1.
Rotary shaft sealing and the influence of shaft lead; (a) description of the components of the sealing system; (b) schematic illustration of the back pumping of the rotary shaft seal, (c) leakage caused by lead; (d) dry running caused by lead.
Figure 1.
Rotary shaft sealing and the influence of shaft lead; (a) description of the components of the sealing system; (b) schematic illustration of the back pumping of the rotary shaft seal, (c) leakage caused by lead; (d) dry running caused by lead.

Figure 2.
Classification of lead structures on sealing counterfaces for rotary shaft seals.

Figure 3.
Approach to model the shaft pumping rate.

Figure 4.
Pumping rate measurement.

Figure 5.
Preliminary study on the of the statistical significance of shaft pumping rate measurements with five repetitions.
Figure 5.
Preliminary study on the of the statistical significance of shaft pumping rate measurements with five repetitions.

Figure 6.
Pumping rate measurements with two repetitions of the measurement procedure on the same shaft run track; () on a second shaft run track.
Figure 6.
Pumping rate measurements with two repetitions of the measurement procedure on the same shaft run track; () on a second shaft run track.

Figure 7.
Comparison of shaft pumping rates of Data from the current study and of Data2 from the previous study [25] versus the macro lead parameter combination ; (a) entire range; (b) range enlarged around the origin.
Figure 7.
Comparison of shaft pumping rates of Data from the current study and of Data2 from the previous study [25] versus the macro lead parameter combination ; (a) entire range; (b) range enlarged around the origin.

Figure 8.
Comparison of the correlations of the models (a) (structure-based approach) and (b) (frequency-based approach).
Figure 8.
Comparison of the correlations of the models (a) (structure-based approach) and (b) (frequency-based approach).

Figure 9.
Models (a) (structure-based approach) and (b) (frequency-based approach) with marked structure classes (see Table 4).
Figure 9.
Models (a) (structure-based approach) and (b) (frequency-based approach) with marked structure classes (see Table 4).

Figure 10.
Shaft pumping rates versus the structure-based parameter combination with marked structure classes.
Figure 10.
Shaft pumping rates versus the structure-based parameter combination with marked structure classes.

Table 1.
Lead parameters according to MBN 31007-7 [27].
Table 1.
Lead parameters according to MBN 31007-7 [27].
| Sign | Designation |
|---|---|
| /° | Lead Angle |
| /mm | Period Length |
| /µm | Lead Depth |
| /µm2 | Theo. Supply Cross-Section |
| /- | Num. of Threads over 360° |
Table 2.
Structure-based macro lead parameters according to [13].
Table 2.
Structure-based macro lead parameters according to [13].
| Type | Sign | Designation |
|---|---|---|
| Geometrical Feature Classes | /° | Structure Angle |
| /µm | Structure Width | |
| /µm | Structure Length | |
| /µm2 | Structure Depth | |
| /µm2 | Structure Cross-Section | |
| /µm3 | Structure Volume | |
| Statistical Parameters | Normalized Structure Number | |
| Mean Value per Class | ||
| Standard Deviation per Class |
Table 3.
Experimental conditions of the pumping rate measurement.
| Test Conditions | |
|---|---|
| Rotary shaft seal type: | FKM BAUM5X7 |
| Oil type: | FVA 3 (oil level in the center of the shaft) |
| Diameter of the sealing counterface: | 80 mm |
| Oil sump temperature/pressure: | 80 °C/ambient pressure |
| Shaft rotation speed: | 1000 min−1 ≙ 4.2 m/s |
| Duration per direction of rotation : | 10 h |
Table 4.
Classification of the shaft surfaces according to characteristic structural properties.
| Class | Criteria | Example * |
|---|---|---|
| (1) Interrupted (intrpt.) and aperiodic (aper.) | ; |  |
| (2) Interrupted and periodic (per.) | ; |  |
| (3) Mostly circumferential (mstl. circ) and periodic | ; |  |
| (4) Circumferential (circ) and periodic | ; |  |
* Stitched topography with (axial) × (circumferential); shaft number from top to bottom: 1, 18, 22, 23.
Disclaimer/Publisher’s Note: The statements, opinions and data contained in all publications are solely those of the individual author(s) and contributor(s) and not of MDPI and/or the editor(s). MDPI and/or the editor(s) disclaim responsibility for any injury to people or property resulting from any ideas, methods, instructions or products referred to in the content. |
© 2023 by the authors. Licensee MDPI, Basel, Switzerland. This article is an open access article distributed under the terms and conditions of the Creative Commons Attribution (CC BY) license (https://creativecommons.org/licenses/by/4.0/).
Share and Cite
MDPI and ACS Style
Engelfried, M.; Haffner, G.; Baumann, M.; Bauer, F. Modeling the Pumping Behavior of Macroscopic Lead Structures on Shaft Counterfaces of Rotary Shaft Seals. Lubricants 2023, 11, 495. https://doi.org/10.3390/lubricants11110495
AMA Style
Engelfried M, Haffner G, Baumann M, Bauer F. Modeling the Pumping Behavior of Macroscopic Lead Structures on Shaft Counterfaces of Rotary Shaft Seals. Lubricants. 2023; 11(11):495. https://doi.org/10.3390/lubricants11110495
Chicago/Turabian StyleEngelfried, Maximilian, Georg Haffner, Matthias Baumann, and Frank Bauer. 2023. "Modeling the Pumping Behavior of Macroscopic Lead Structures on Shaft Counterfaces of Rotary Shaft Seals" Lubricants 11, no. 11: 495. https://doi.org/10.3390/lubricants11110495
Note that from the first issue of 2016, this journal uses article numbers instead of page numbers. See further details here.