
Simplified Approach for Parameter Selection and Analysis of Carbon and Glass Fiber Reinforced Composite Beams


Department of Mechanical Engineering, University of Saskatchewan, Saskatoon, SK S7N 5A9, Canada
*
Author to whom correspondence should be addressed.
J. Compos. Sci. 2021, 5(8), 220; https://doi.org/10.3390/jcs5080220
Submission received: 24 July 2021
/
Revised: 9 August 2021
/
Accepted: 12 August 2021
/
Published: 18 August 2021
(This article belongs to the Special Issue Carbon Fiber Composites)
Abstract
:In this study, a simplified approach that can be used for the selection of the design parameters of carbon and glass fiber reinforced composite beams is presented. Important design parameters including fiber angle orientation, laminate thickness, materials of construction, cross-sectional shape, and mass are considered. To allow for the integrated selection of these parameters, structural indices and efficiency metrics are developed and plotted in design charts. As the design parameters depend on mode of loading, normalized structural metrics are defined for axial, bending, torsional, and combined bending-torsional loading conditions. The design charts provide designers with an accurate and efficient approach for the determination of stiffness parameters and mass of laminated composite beams. Using the design charts, designers can readily determine optimum fiber direction, number of layers in a laminate, cross-sectional shape, and materials that will provide the desired mass and stiffness. The laminated composite beams were also analyzed through a detailed finite element analysis study. Three-dimensional solid elements were used for the finite element modelling of the beams. To confirm design accuracy, numerical results were compared with close-form solutions and results obtained from the design charts. To show the effectiveness of the design charts, the simplified method was utilized for increasing the bending and torsional stiffness of a laminated composite robotic arm. The results show that the proposed approach can be used to accurately and efficiently analyze composite beams that fall within the boundaries of the design charts.
1. Introduction
Numerous researchers have spent a significant amount of effort to study the behavior of composite beams and structures when subjected to various loading conditions [1,2,3,4,5,6,7,8,9,10]. These studies have included a wide range of composite materials ranging from laminated polymer matrix composites [1,2,3,4] to steel reinforced grout composite-concrete structures [9,10]. The studies outlined in [5,6,7,8] have considered the static and dynamic behavior, vibration of composite structures, damping characteristics of composite materials, thermal effects, and effects of boundary conditions such as bolted joints. As part of the extensive research effort regarding structures constructed using composite materials, several approaches and methodologies have been proposed for the selection of the parameters and variables that are important in their design. These parameters include fiber angle orientation, layup sequence, layer thickness, number of layers, geometrical dimensions, and constituent material properties. Various approaches including two and three-dimensional finite element analysis (FEA), genetic algorithm (GA), and particle swarm optimization (PSO) have been utilized for the selection of the optimal parameters of composite beams and structures [11,12,13]. It should be noted that, even though these methods can be used for determining the optimal design variables and parameters, the methods are time-consuming, computationally expensive, and can be difficult to implement. The development of a simplified approach and design charts will allow engineers and scientists to more readily observe the impact of the numerous parameters that govern the static and dynamic performance of composite structures.
A simplified approach using beam elements and finite element (FE) modelling for the analysis and design of thin-walled T-joint connections has been proposed by Moazed et al. [14,15]. In their studies, the authors considered the behavior of the T-joints subjected to in-plane and out-of-plane loading conditions. It was shown that, with the use of certain normalized correction factors, one-dimensional beam elements can be used to accurately predict all the important information regarding the structural performance of these connections. Important information of the structural analysis included the stresses, deformations, reaction forces, and natural frequencies. Without the proposed correction factors, scientists and engineers need to develop complicated and computationally expensive FE models using two-dimensional plate and shell elements and three-dimensional solid elements. Other studies that have considered proposing simplified approaches for structural analysis include Pasini [16] and Ashby [17,18]. In Ashby’s study, it is shown that structural properties can be mapped, displaying the ranges of static and dynamic performance that they offer. In each map, some spaces are filled, and some gaps exist. These gaps can be further investigated for developing materials with new properties [18]. It should be noted that the proposed approaches in the above-mentioned studies have been limited to structures made of traditional isotropic materials.
Studies and research work by Kollar et al. [19] provide an extensive evaluation of the mechanics of composite structures and the parameters that impact the structural performance of laminated composite beams. These parameters include the layup sequence, number of plies, cross-sectional shape, and materials of construction. Based on the works of [19], An et al. [20] and Pasini [21] provide structural efficiency metrics for the integrated selection of layup, materials, and cross-sectional shape of laminated composite beam structures. These authors have developed selection graphs for laminated composite beams subjected to bending and torsional loading. The performance selections graphs were used to study the strength of the structures using the Tsai–Wu failure criterion [20]. Buckney et al. [22] studied the behavior of members subjected to asymmetric bending and showed that shape factors are a useful tool to assess the structural efficiency of various structural shapes. Wanner [23] developed a systematic materials selection procedure for spatially limited, light-weight structural components. This approach led to a specific class of objective equations and performance indices. Pasini [24] introduced a material and shape selection method to reduce the challenges and effort involved in the selection of materials and cross-sectional shapes in applications involving flexural vibrations. The author developed certain parameters such as shape transformers and performance indices to map the beams’ mechanical properties. This method was used to assess flexural vibrations in multilayered resonators (MRs). The developed shape transformers can be used to predict the impact of cross-sectional shape, symmetry, number of layers, and material properties on the vibration of MRs [24]. In future studies, the authors devised shape transformers for different loading scenarios such as bending, torsion, shear, and combined loading [25]. The methods and charts were generalized for single and multi-criteria selection of light-weight shafts subjected to a combination of bending, shear, and torsional loading [26].
Laminated composite beams have been used in structures as well as mechanical systems. Application of composite beams in the construction of mechanisms includes linkages of robotic manipulators. Robotic manipulators can perform repetitive work at much higher speeds and efficiency than human operators [27]. The steel and aluminum manipulator designed by Zhang et al. [28] has a maximum reach of 3 m and can carry weights of up to 15 kg. Even though manipulators constructed using conventional materials (e.g., aluminum and steel) benefit from a high, axial, bending, and torsional stiffness, the mass of the manipulator is also typically high. The mass of the robot linkages affects the mechanism’s dynamic performance and a higher mass results in larger motor power consumption. Utilizing thin-walled members and lighter materials of construction (with high specific strength and stiffness ratios) for the robot’s structure can improve the robot’s dynamic performance and lower the power consumption requirements. Materials with a high specific strength and specific stiffness include polymer matrix composites (PMCs) such as glass fiber reinforced plastic (GFRP) and carbon fiber reinforced plastic (CFRP). These materials have been used for the construction of robotic manipulators to successfully reduce the weight by up to 70% compared with steel materials [29,30]. Other researchers such as Yin et al. [31] have designed hybrid structures for manipulators using composites and aluminum beams. The manufactured prototype of the manipulator in [31] showed that the hybrid structure has a higher operational speed and lower settling time in start-stop operations. Lee et al. [32] designed a composite wrist to replace the aluminum version. The intent of the study was to design the composite wrist such that the dynamic performance is improved, and deflection and mass are minimized.
In this study, the recent research works performed by An et al. [20] have been further extended to include design charts for two different envelopes. The first envelope has a square shape, and the second envelope has a rectangular shape. Compared with the envelopes used in the studies performed by [20], these envelopes allow for the assessment of a larger number of cross-sectional types and sizes. In this paper, the behavior of laminated composite beams subjected to axial and bending loadings (about the two principal directions Y and Z) and torsional loadings are considered. The works performed by [20] were also limited to single cell beams. In this paper, in additional to single open and close-loop cross sections, the applicability of the developed design charts for multi-cell beam design is investigated. The results of the study show that the proposed axial and bending design charts can also be used for the parameter selection and design of multi-cell laminated composite beams. The effects of beam thin-walledness are also studied in this paper. For this purpose, the bending and shear deformation effects are considered, and the effects of different boundary conditions are investigated. A detailed three-dimensional FEA using solid elements is performed. The results of the numerical simulations are compared to the analytical results and those predicted by the design charts for various loading conditions. Finally, the design charts are used to design the linkages of a robotic manipulator using thin-walled laminated composite beams. It is shown that the simplified approach and design charts can be an effective tool for the design of laminated composite beam structures. The proposed charts help in reducing the inherent complexity involved in the selection of the numerous design variables of laminated composite beams. The simplified approach also allows the designer to accurately predict the deflections and rotations of the aforementioned beams without the need to develop detailed and computationally expensive FE models.
2. Laminated Composite Beams—Structural Efficiency Metrics and Performance Indices
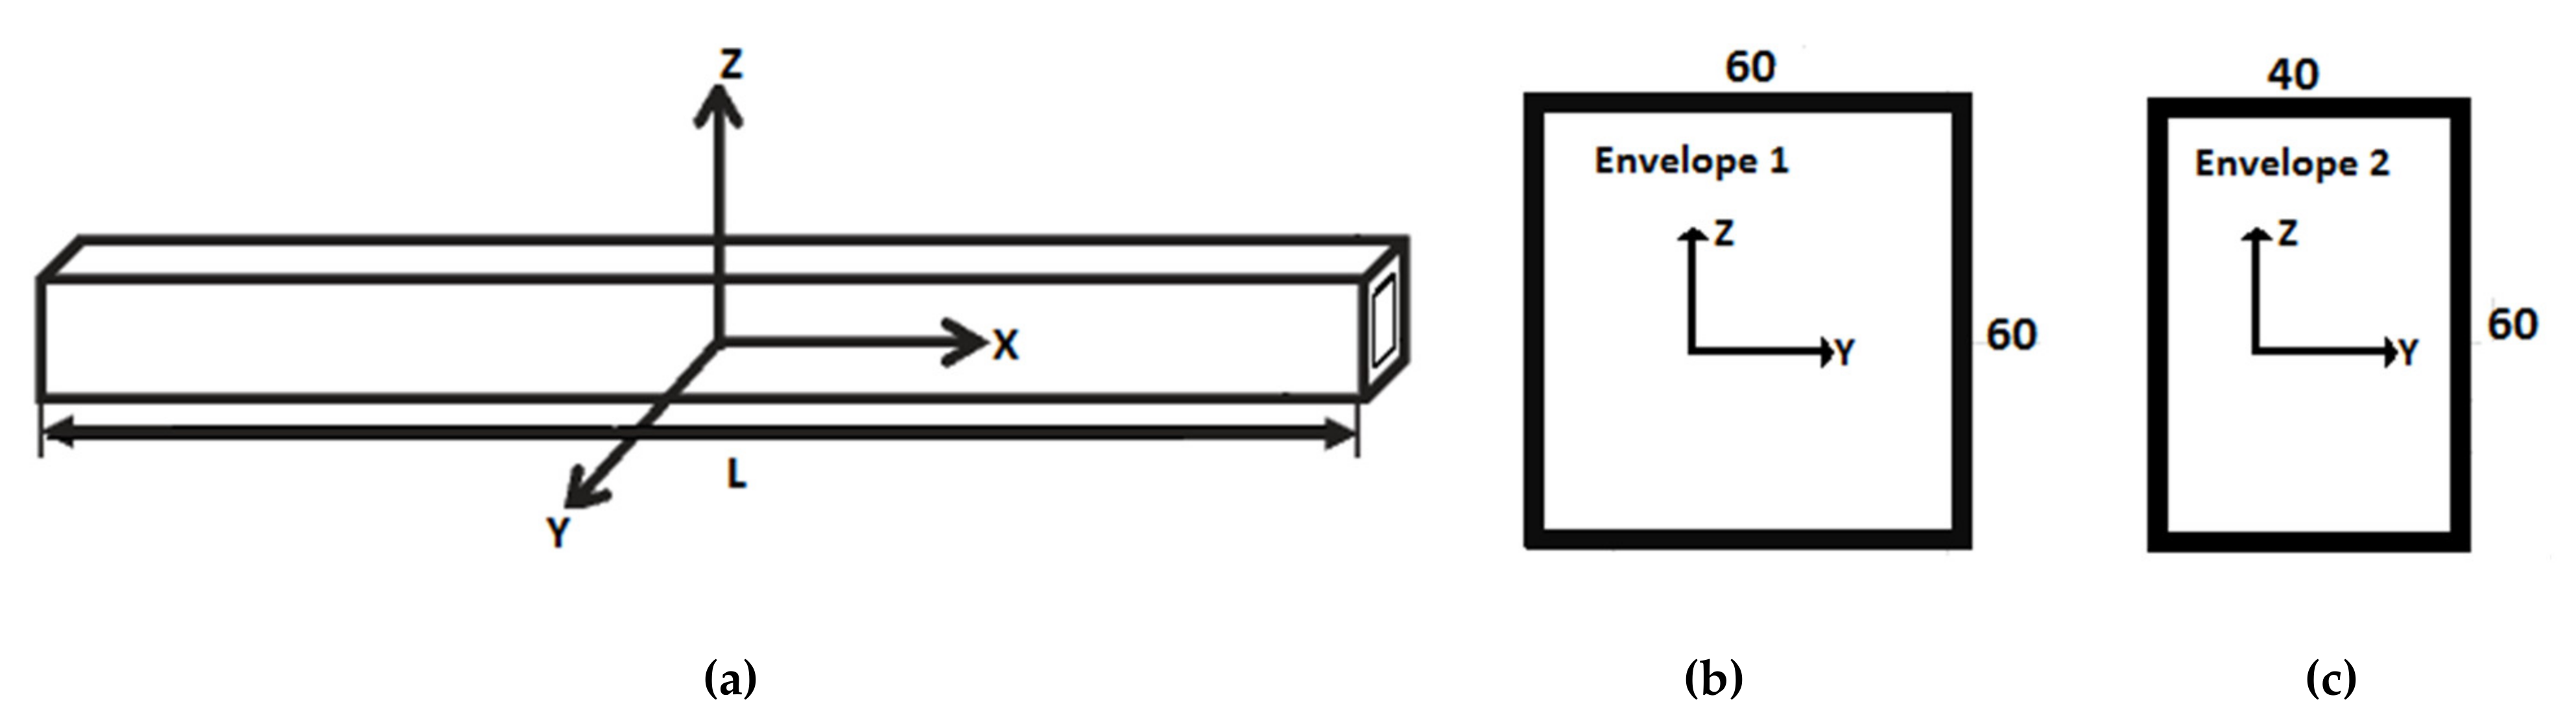
The static and dynamic performance of a given laminated composite prismatic beam (e.g., shown in Figure 1a) depends on the number of layers, fiber angle orientation, layup sequence, materials of construction (e.g., CFRP, GFRP), the cross-section shape (open or closed section), and the geometrical dimensions. By assigning the elastic material properties to the composite beam, normalized shape transformer parameters can be defined for a given geometric quantity (G). These geometric quantities can include parameters such as area (A), volume (V), and the second moment of area (I). For example, is the second moment of area transformer, where is the second moment of area of the cross-section and is the second moment of area of a defined reference envelope. Equations (1) to (4) present the normalized axial stiffness (), bending stiffness (), torsional stiffness (), and mass ratio index ().
In Equations (1)–(4), subscript (Ref) indicates the reference beam properties and subscript (θ) indicates the beam with a certain fiber angle direction. That is, is the reference beam’s equivalent axial stiffness, () is the reference beam’s equivalent bending stiffness, is the reference beam’s equivalent torsional stiffness, and is the reference beam’s mass. In turn, ,, and are the axial, bending, torsional stiffnesses, and mass of the cross-section under consideration, respectively. In this study, the fiber angle direction is assumed to be constant for all laminae. The square and rectangular envelopes utilized in this study are presented in Figure 1b,c. For the square envelope, the bending stiffness in the Y-direction and, for rectangular envelope, the bending stiffnesses in the Y and Z directions are analyzed. All of the parameters are normalized to a reference cross section; for the square envelope, the reference beam is a CFRP hollow square beam made of 16 plies with fibers oriented in the 0° direction (measured from the X-axis). Similarly, for the rectangular envelope, the reference cross-section is a CFRP hollow rectangular beam with 16 plies in the 0° direction (measured from the X-axis). The equivalent axial, bending, and torsional stiffnesses in Equations (1)–(4) are calculated using the close-form equations provided in Table A1 in the appendices. This applies to the reference composite beam cross sections as well as sections with various ply angles. Interested readers are referred to the works of [19,20] for more details and derivation of these equations. Several performance parameters corresponding to different loading conditions are defined for the purpose of developing design charts and comparing the structural and mechanical performance of the composite beams. These performance indices are outlined in Equations (5)–(8) as follows:
The performance index for axial stiffness:
The performance index for bending stiffness:
The performance index for torsional stiffness:
The performance index for combined torsional-bending stiffness:
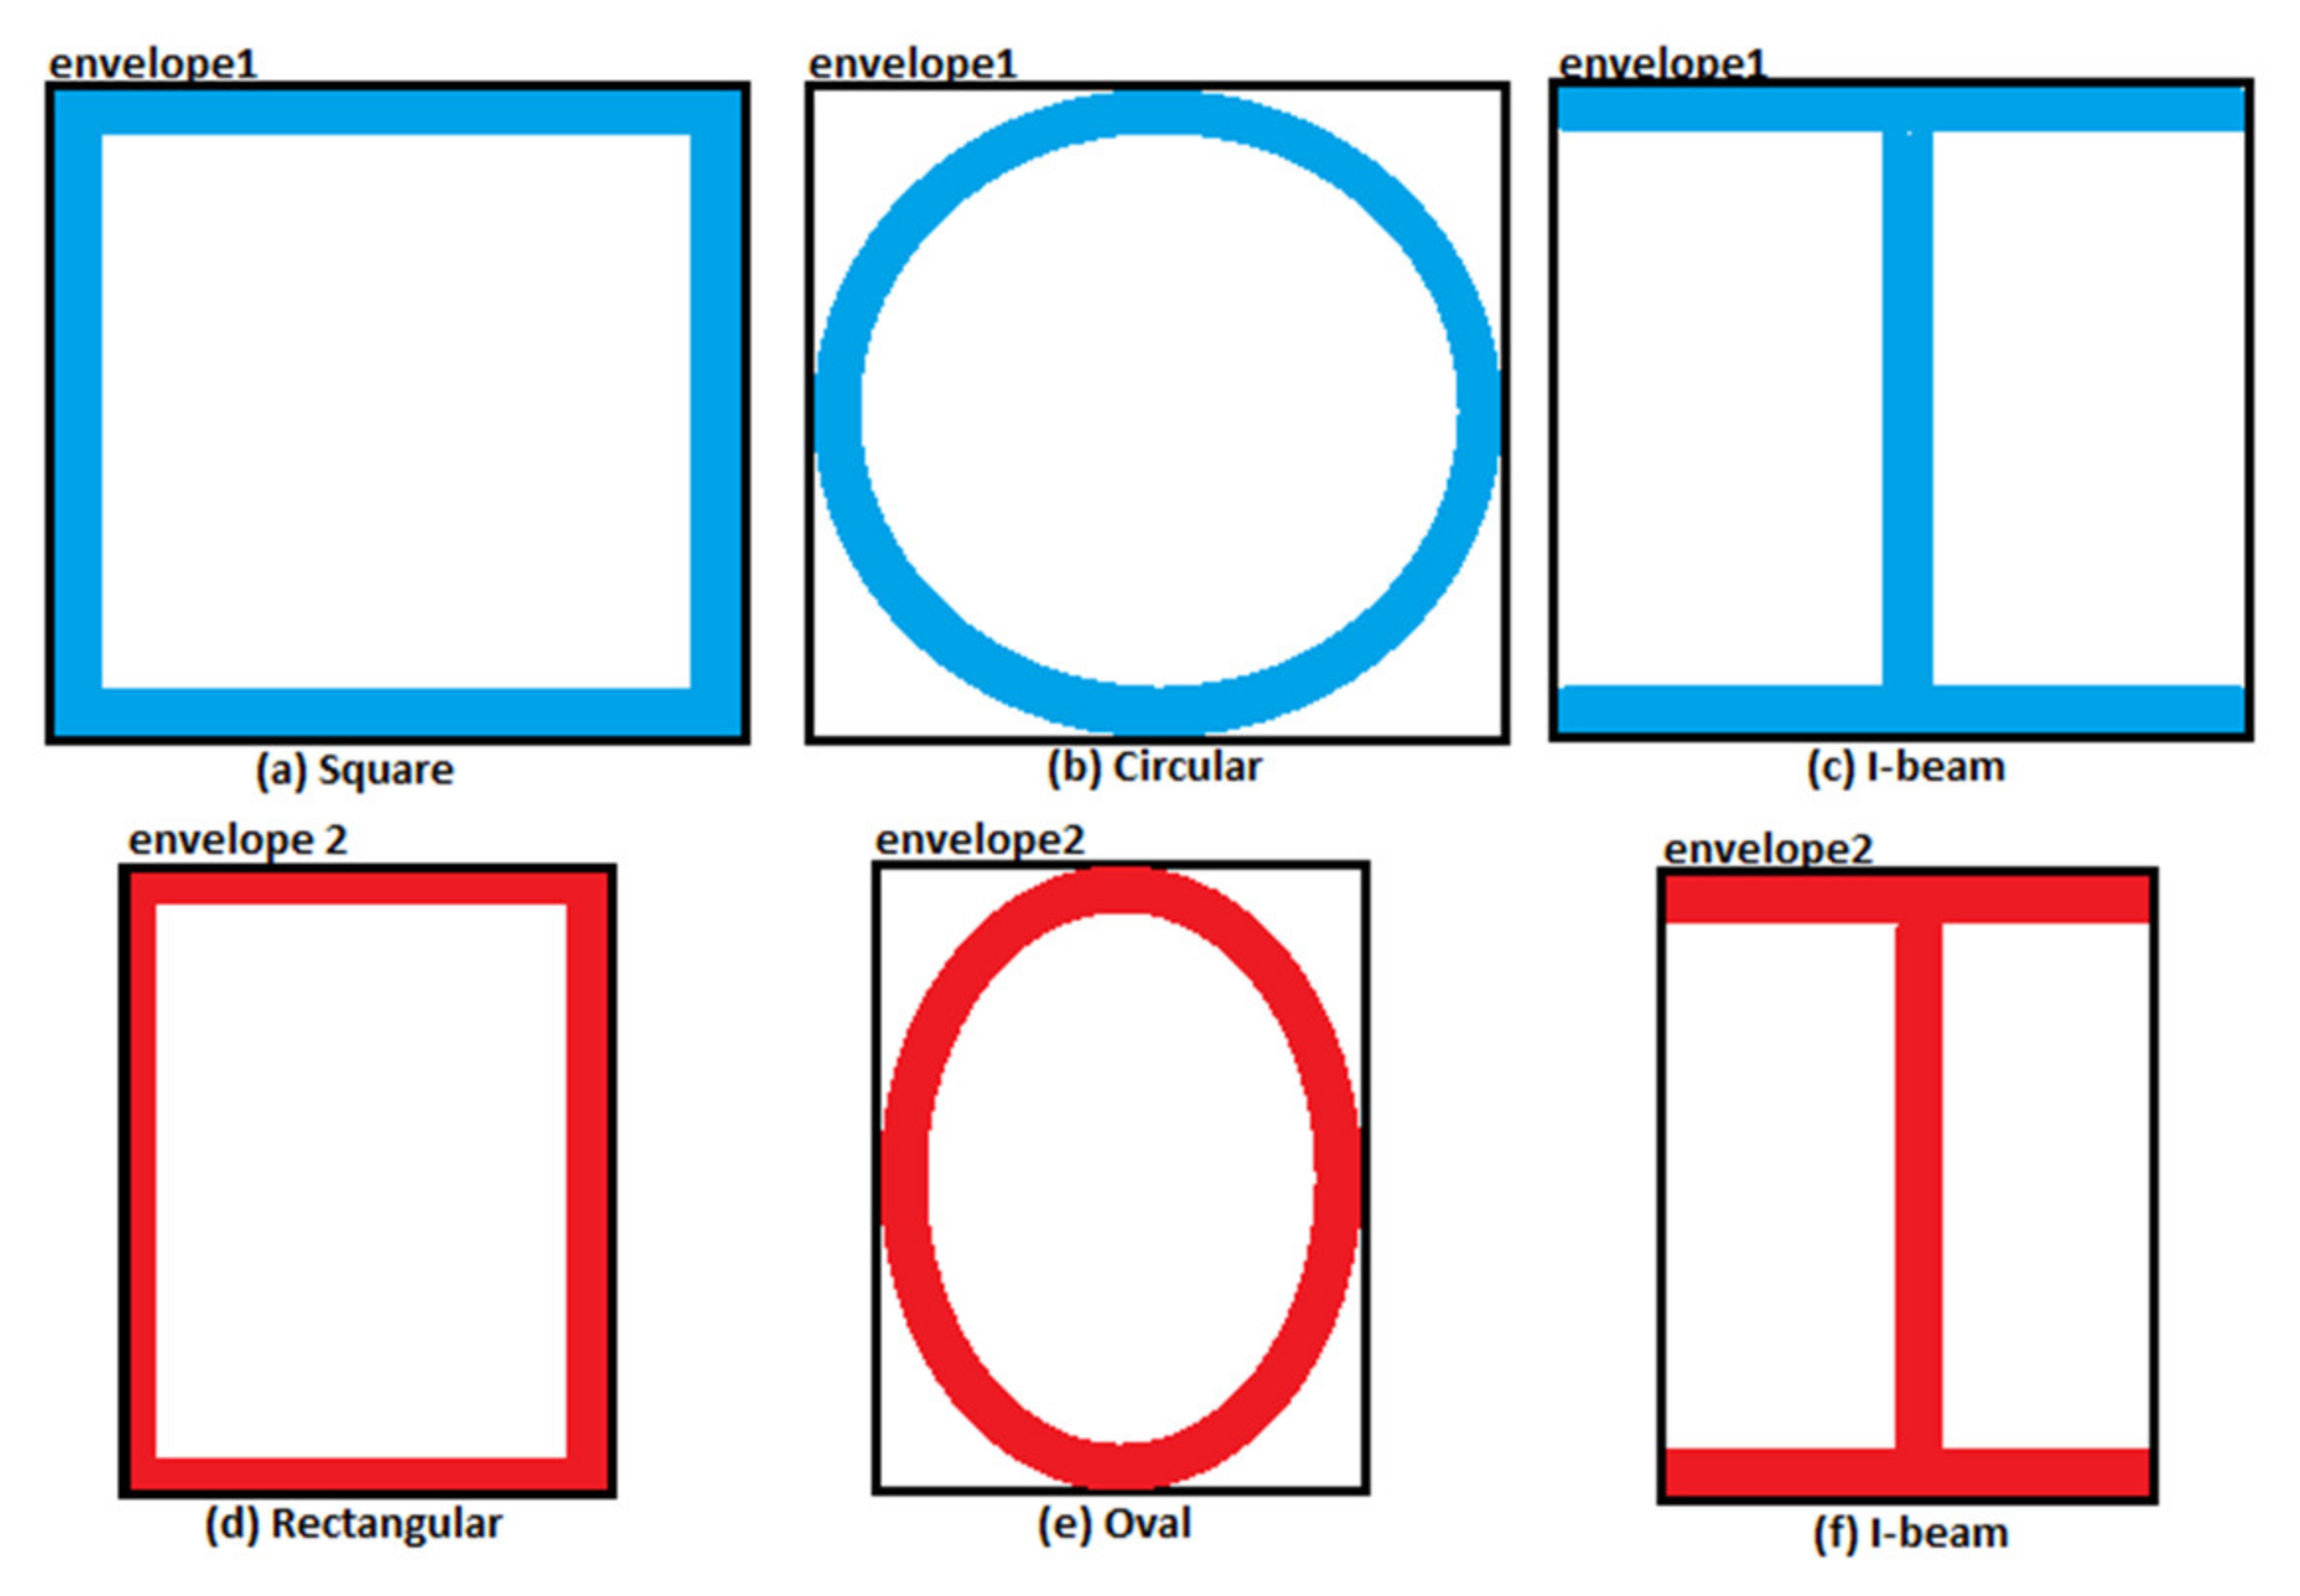
Equations (5)–(8) are used in the next section to map the structural and mechanical performance indices of six types and sizes of laminated composite beams. The corresponding beam cross sections are shown in Figure 2. As mentioned above, two envelopes were considered for mapping the performance indices. The envelope sizes are 60 mm × 60 mm for the square envelope, which is larger than the 50 mm × 50 mm envelope size proposed by An et al. [20]. This will allow for the application of the design charts to beams with larger cross sections. To study beams of various cross sections and sizes, a second envelope was also introduced in this study. This envelope has a rectangular geometry with dimensions of 40 mm × 60 mm. The dimensions of this envelope were chosen to correspond with the dimensions of the aluminum beams used in the robotic manipulator presented in [28].
In Section 3, design charts are developed for laminated composite beams with ply numbers ranging from 4 to 24 with a symmetric and balanced layup.
3. Thin-Walled Laminated Composite Beam Design Charts
The in-plane and out-plane behavior of beams, more specifically their static and dynamic response, strongly depends on their stiffness and mass. In beams constructed using traditional isotropic materials (e.g., steel, aluminum, and other metals), the relevant stiffnesses can readily be determined using standard engineering formulas. However, for beams constructed using laminated composite materials, the designer must select several parameters that govern the final stiffnesses of the beams. This can be a challenging and cumbersome engineering effort. The design charts presented in this section were developed to provide engineers and scientists with a means to easily observe the effect of these parameters on the stiffness and mass of composite beams. For this purpose, design charts for axial stiffness, bending stiffness, and torsional stiffness were developed and the results are presented in Figure 3, Figure 4, Figure 5 and Figure 6. Each point on these charts corresponds to a laminated composite beam with a defined number of layers, fiber orientation, mass, and a specific loading condition. For ease of reference to the design points, the following labeling format is used throughout this paper: where “X” refers to the cross-sectional shape; “FD” refers to the fiber direction; and “N” and “M” present the number of layers and materials, respectively. Moreover, for labeling the cross-sectional shapes, the letter “R” refers to a rectangular beam, “I” to an I-beam, “O” to an oval beam, “S” to a square beam, and “C” to the circular beam. All material properties (e.g., CFRP and GFRP) are provided in Table A2 in the appendices. It should be noted that the developed design charts apply to thin-walled beams (for which shear deformation effects are small), assuming linear elastic material models and small deformations (i.e., geometric and material nonlinearities are not considered).
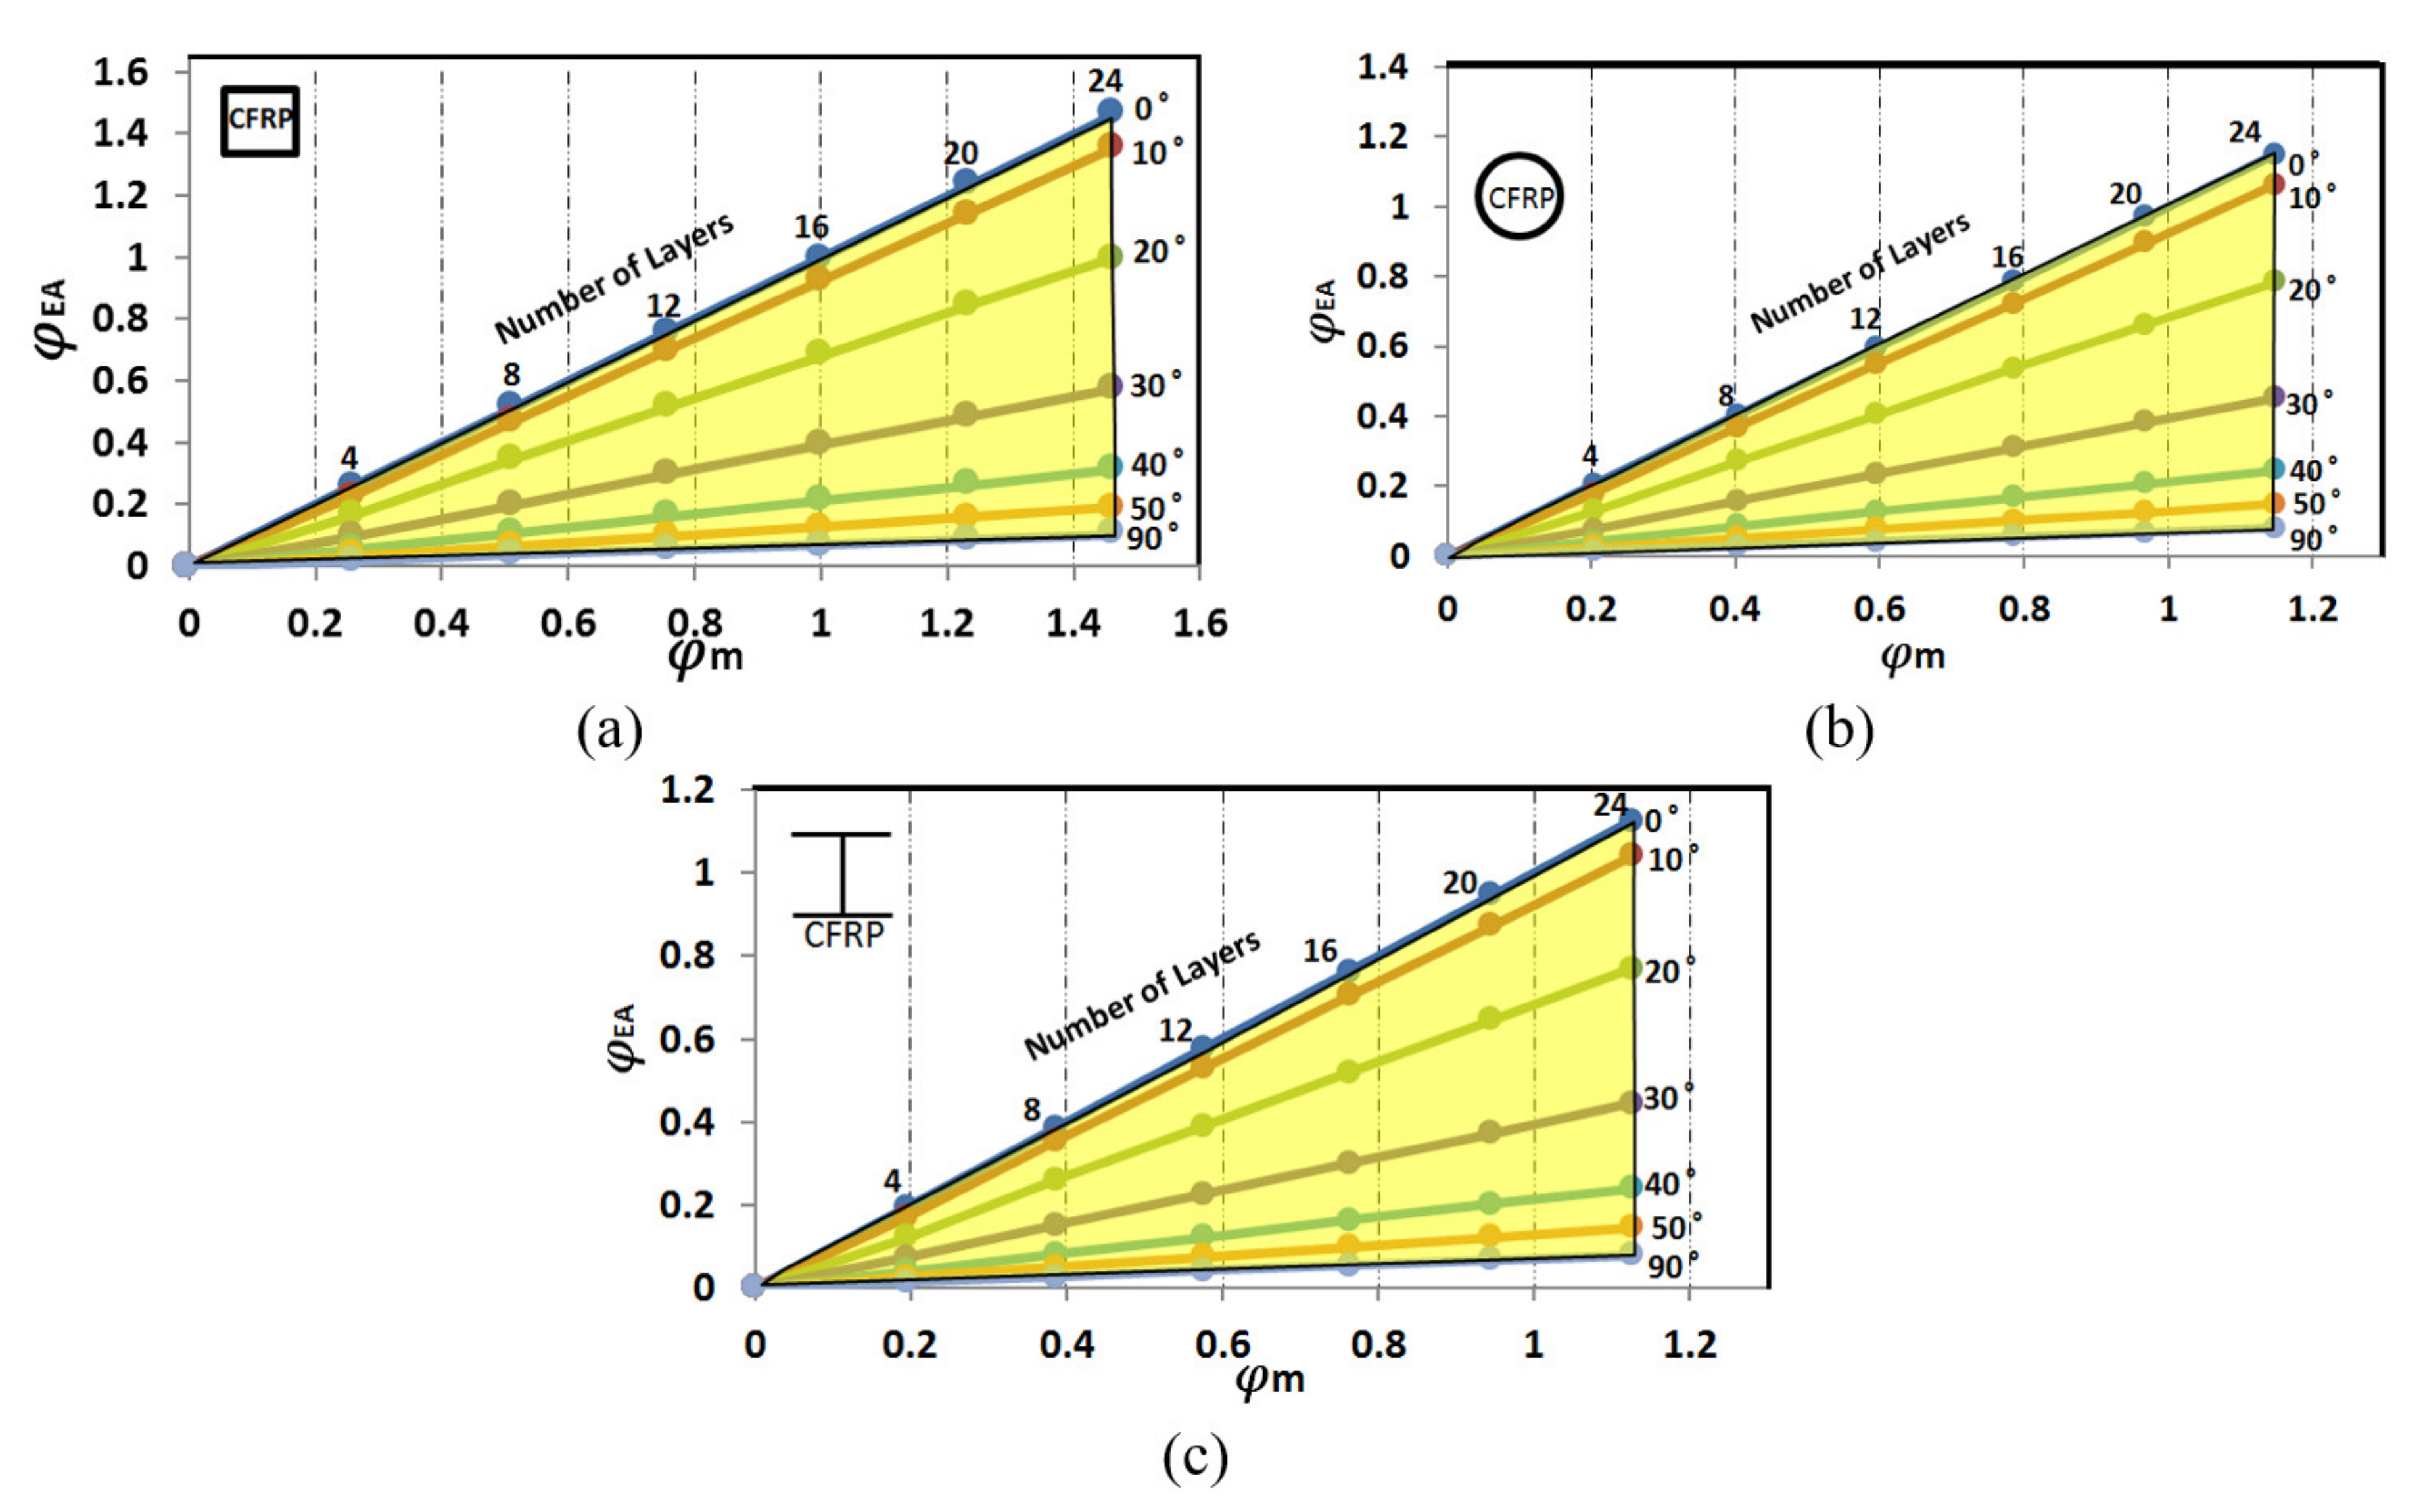
Figure 3a–c depict the normalized axial stiffness versus the mass ratio index for the square, circular, and I-beam cross sections. The results in these figures show that the square cross section has a higher axial efficiency ( when compared with the circular tube (, and the I-beam ( is the least efficient beam when subjected to axial loading. As expected, the axial stiffness performance index (and off-axis strength) decreases by increasing the fiber direction from 0° to 90°, and a rapid decrease in axial stiffness is observed between the 10° to 40° fiber orientation. A further increase in fiber angle orientation (i.e., between 40° and 90°) does not result in a significant decrease is the axial stiffness. This behavior shows that the optimum values for designing a laminated composite beam subjected to axial loading conditions is for a fiber angle orientation between 0° and 10°, where a significant decrease in axial stiffness is not observed.
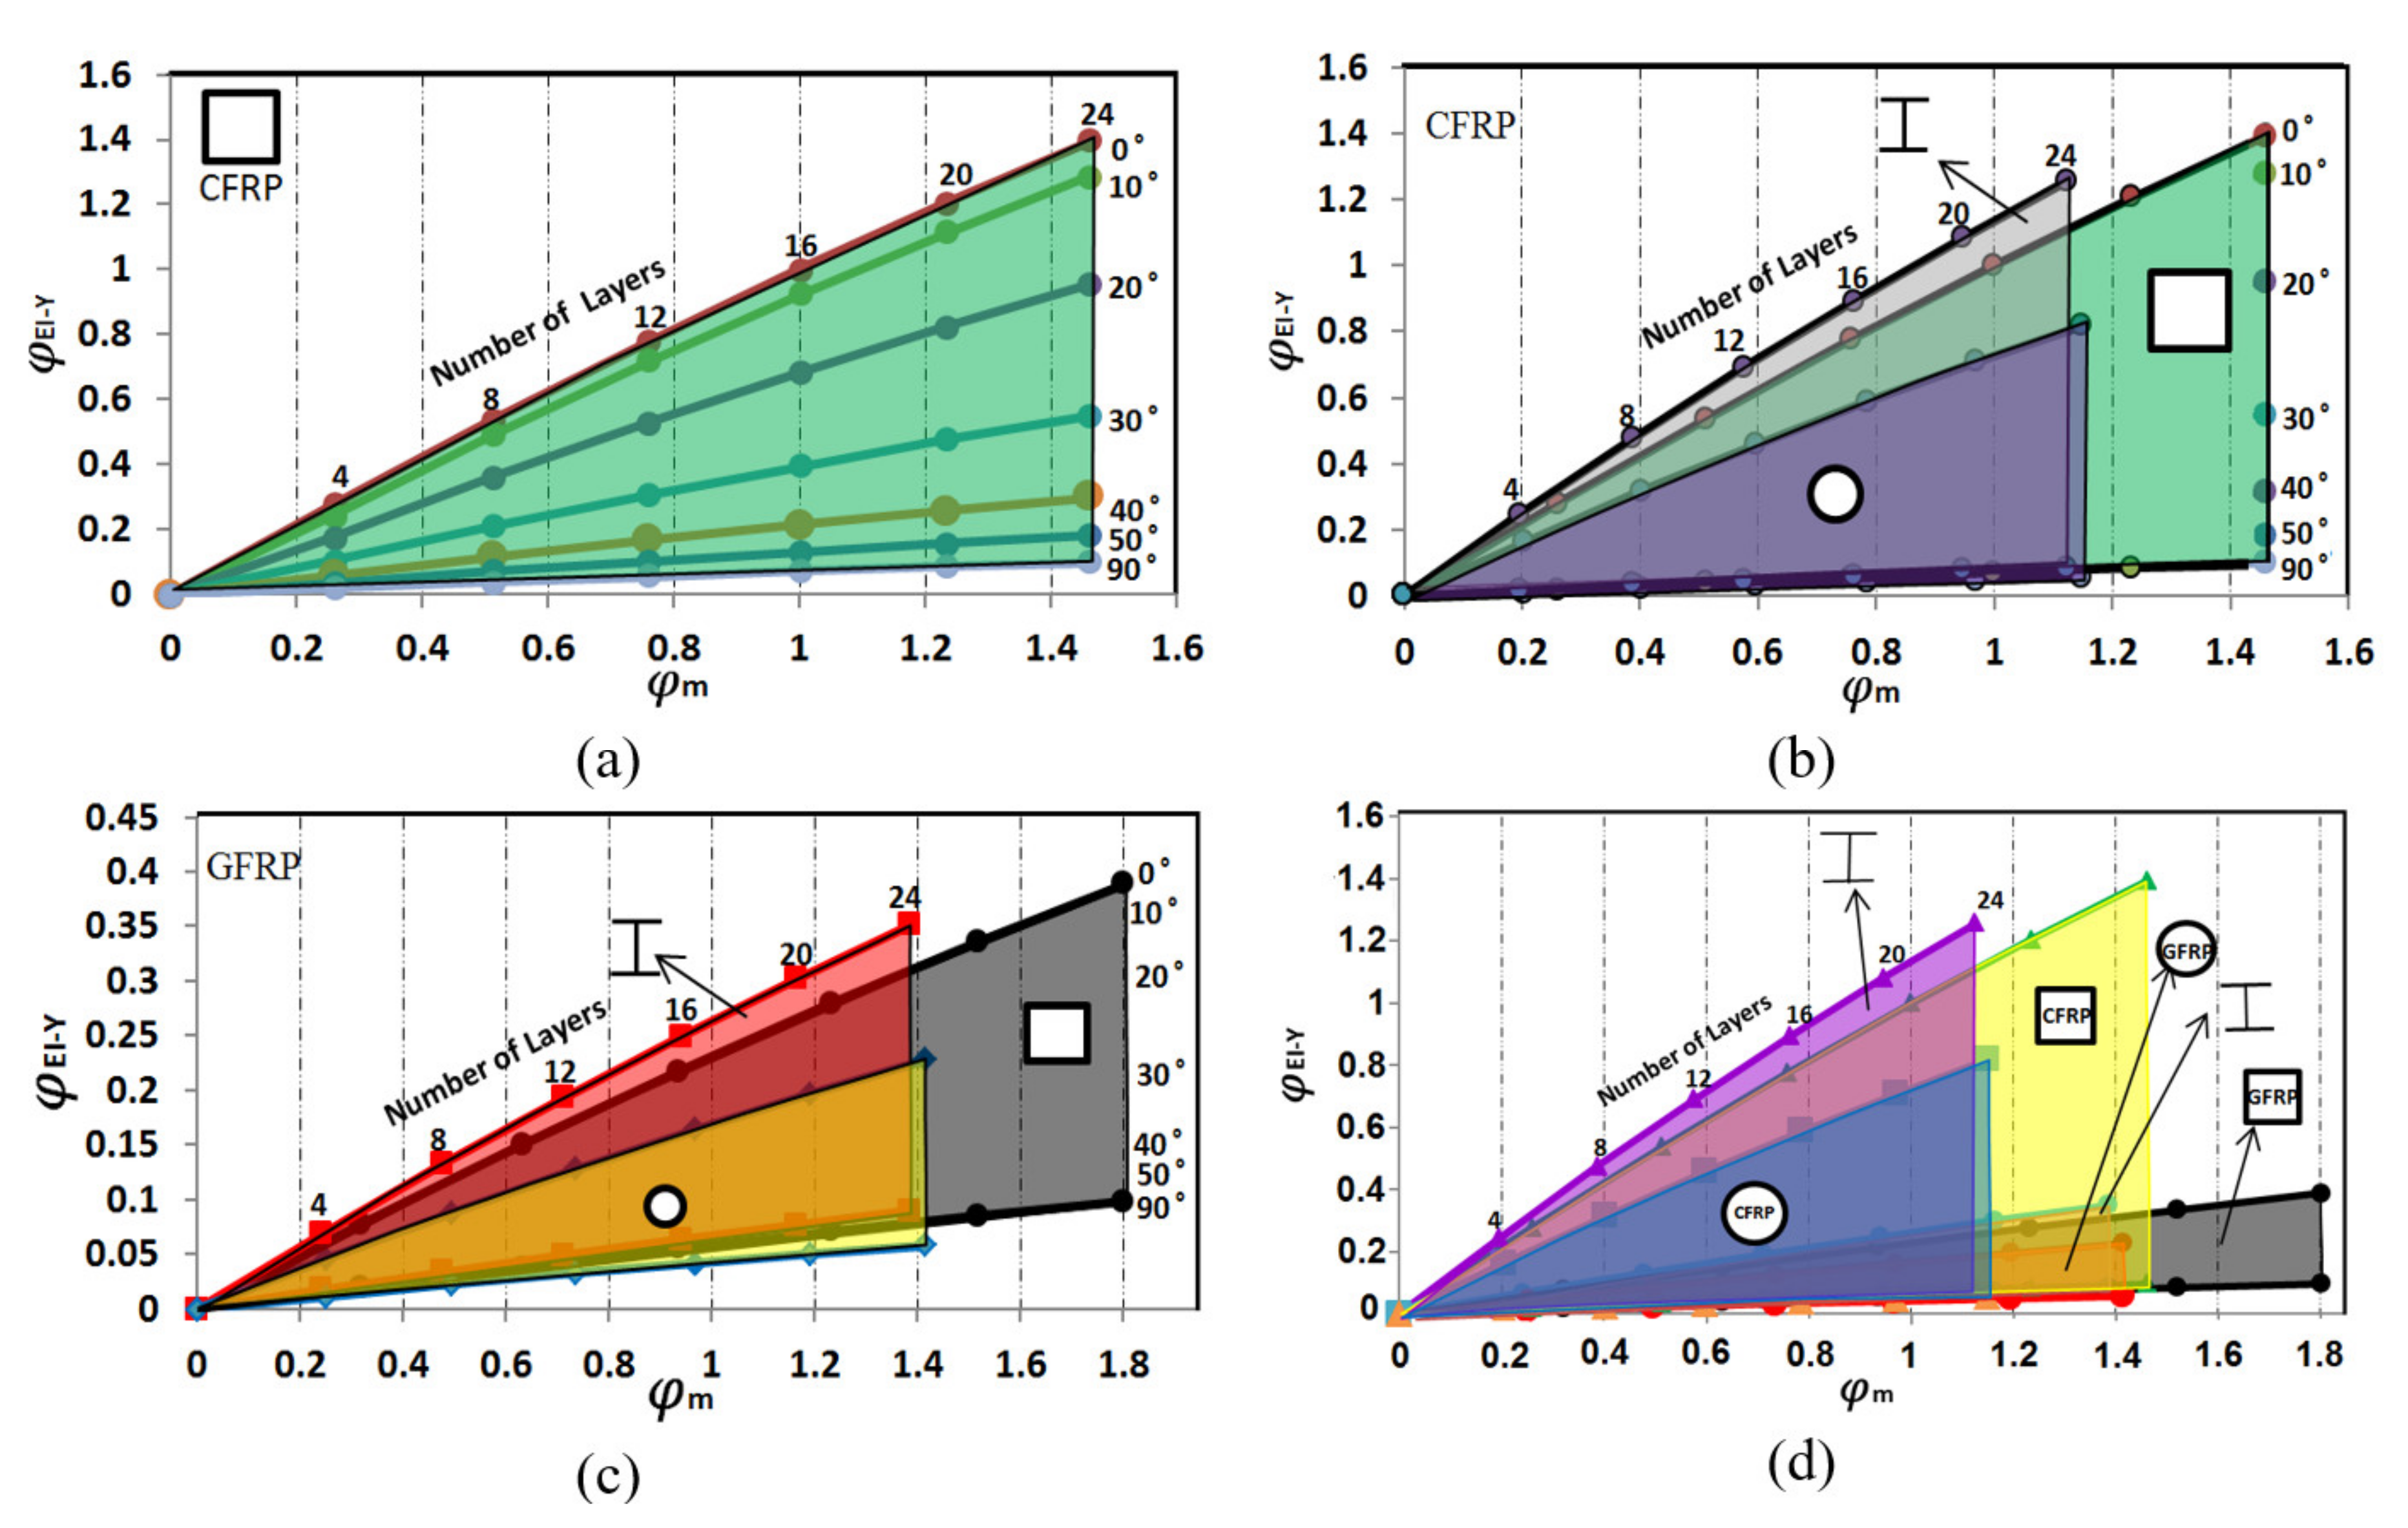
Figure 4a shows the normalized bending ratio versus the mass ratio index for the square cross section. A similar trend to that observed for the axial loading conditions and axial stiffness can be seen. By increasing the fiber angle from 0° to 50°, the normalized bending stiffness changes from 1.39 to 0.18, which is a decrease of approximately 90%.
For ease of comparison and owing to space limitations and constraints, except for the results shown in Figure 4a for the square cross section, the results for the other cross sections are grouped into the same design charts. For example, Figure 4b provides the results for the I-beam, square, and circular cross sections with CFRP material properties. Plotting the results for the different cross sections on the same charts also allows the designer to select the cross-sectional shape of the beam while simultaneously considering parameters such as number of layers, fiber orientation, materials of construction, and mass. The results in Figure 4b show that has the highest normalized bending stiffness ratio in comparison with and . More specifically, is 1.11 times stiffer and 1.30 times heavier than and 1.71 times stiffer and 1.28 times heavier than . Depending on the beam selection criteria (e.g., lower deflection vs. lower mass), the designer can readily choose the most appropriate beam for the application. For example, the beam will have a higher stiffness and hence lower deflection, but at the same time, will have a larger mass. Using the results from Figure 4b, the designer can also determine the “family” of cross sections and parameters that provide the desired normalized bending stiffness. For example, if a normalized bending stiffness of 0.6 is desired, the following beams can readily be identified: , , , , and . Similarly, if the designer is concerned about the mass of the beams, the mass ratio index () can be specified. For example, if a mass ratio index of 0.8 is desired, the following beams have the closest values: , , , , and , and all satisfy the design criteria.
Figure 4c,d show the effect of materials of construction (GFRP vs. CFRP) on the normalized bending stiffness and mass ratios. In Figure 4c, the same parameters as that of Figure 4b are used, but the CFRP material properties are replaced with GFRP material properties. The figures show that, for identical parameters, beams with GFRP material properties are significantly heavier and less stiff than the corresponding beams fabricated using CFRP materials. For instance, the normalized bending stiffness and mass ratios for are equal to 1.39 and 1.46, respectively. The corresponding values for are 0.38 and 1.8, respectively. This shows that is 3.66 times stiffer and 1.23 lighter than . Considering that lower deflection and weight are important factors in material selection, the developed design charts can serve as a valuable tool in the design of laminated composite beams.
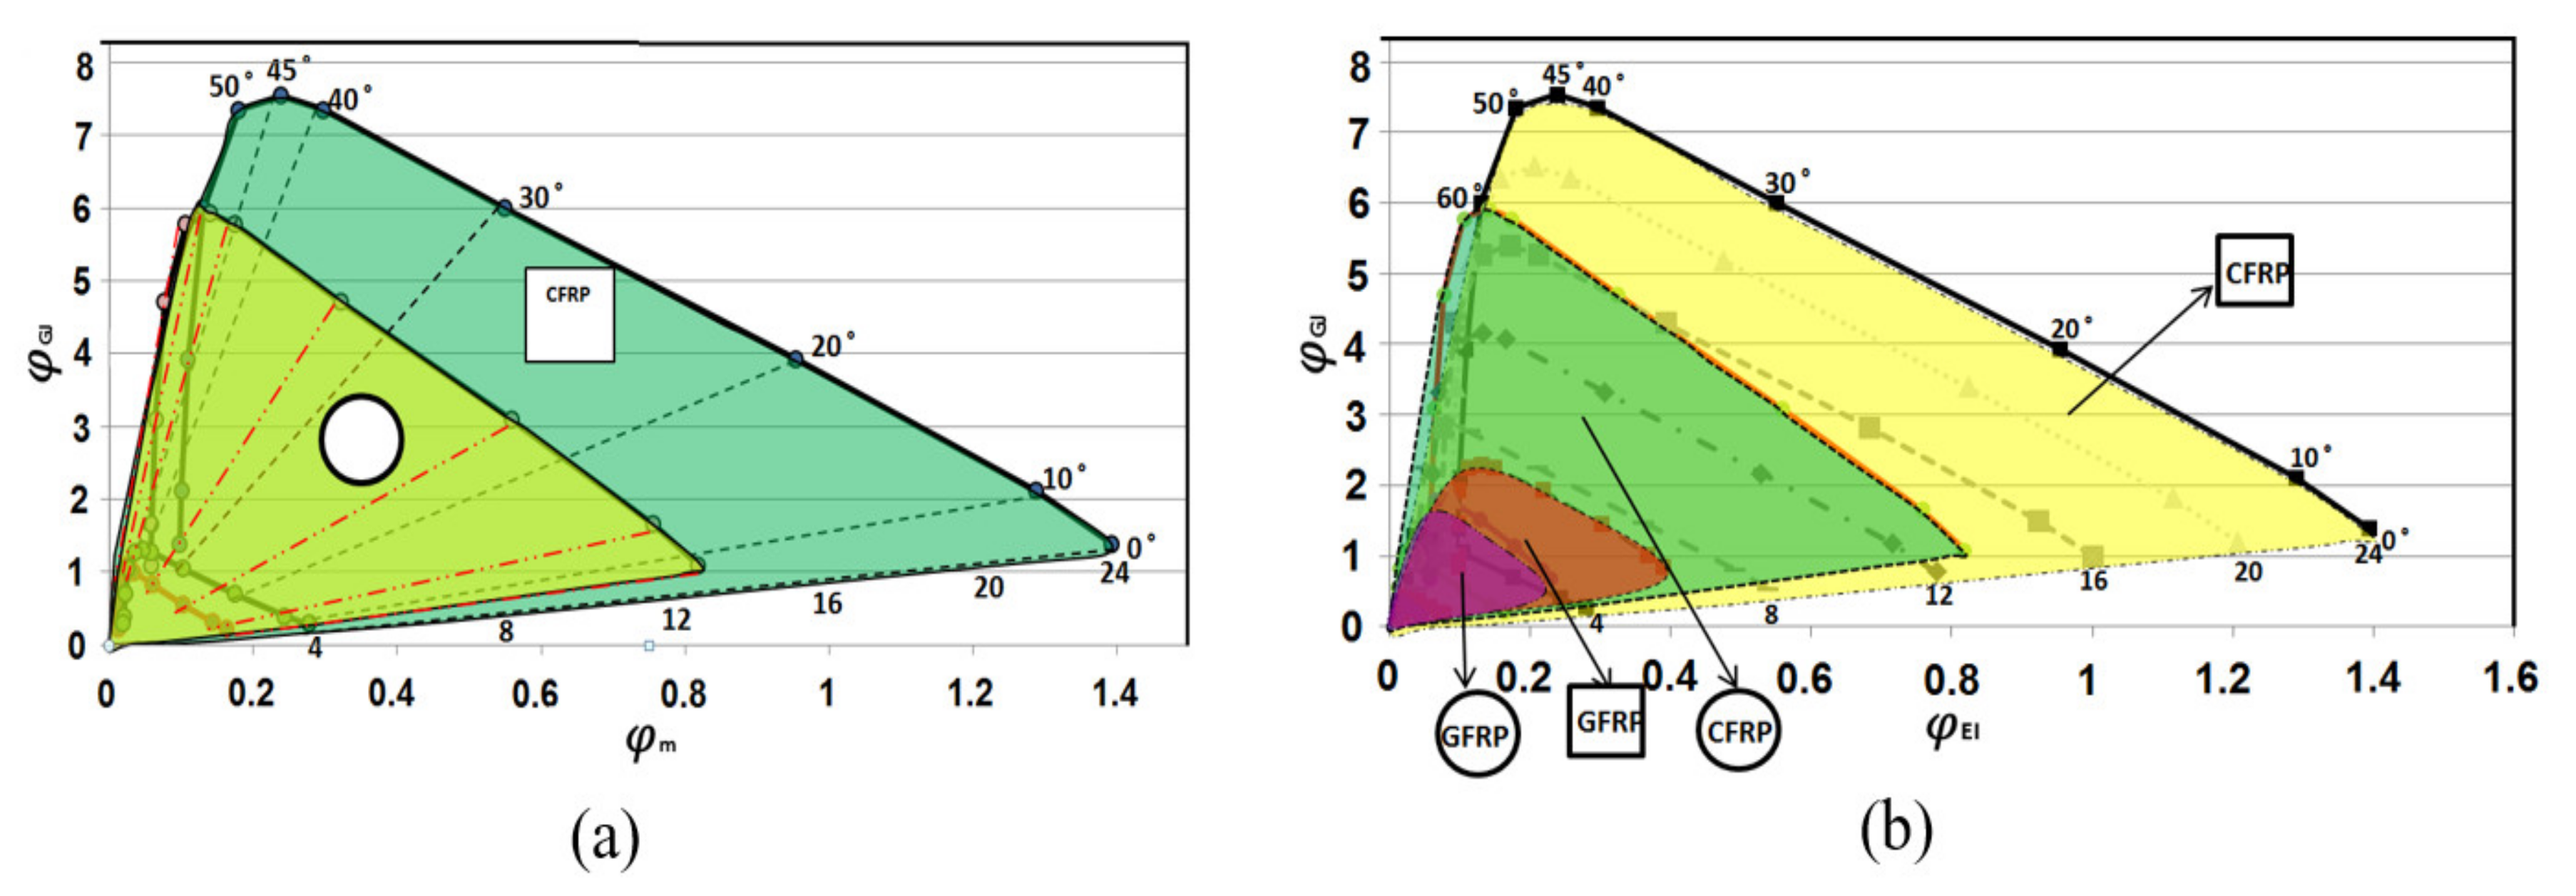
The normalized torsional stiffness versus mass index ratio and the performance index for combined torsional-bending stiffness are shown in Figure 5a,b, respectively. The design charts were developed for the closed cross sections using the square envelope with CFRP and GFRP materials properties. A general observation from the design charts is that square cross sections have a better torsional performance than circular cross sections when subjected to pure torsion as well as combined torsional-bending loading. As expected, the highest torsional efficiency is achieved when the fiber direction is 45°. For design points with a constant fiber direction, increasing the number of layers from 0 to 24 will result in an increase in . Another observation is that, as the fiber orientation increases from 0° to 45°, the normalized torsional stiffness and torsional-bending performance index also increase. As the fiber orientation is further increased from 45° to 90°, there is a rapid reduction of the normalized torsional stiffness and . Consequently, for design purposes, these design charts can be separated into two sections, namely, the section to the right of 45° and the section to left. In the case that the composite beam will be subjected to torsional loading, design points in the left section of these charts should be avoided owing to the rapid decrease in the values of and .
A further observation that can be made based on the results presented in Figure 4 and Figure 5 is that and have the highest torsional efficiency, while and have the highest bending efficiency. The torsional stiffness for is 7.54 higher than the reference cross section (i.e., ). Regarding the performance of CFRP and GFRP composite beams subjected to combined torsional and bending loads, Figure 5b shows that the torsional efficiency of is 3.3 times higher than that of .
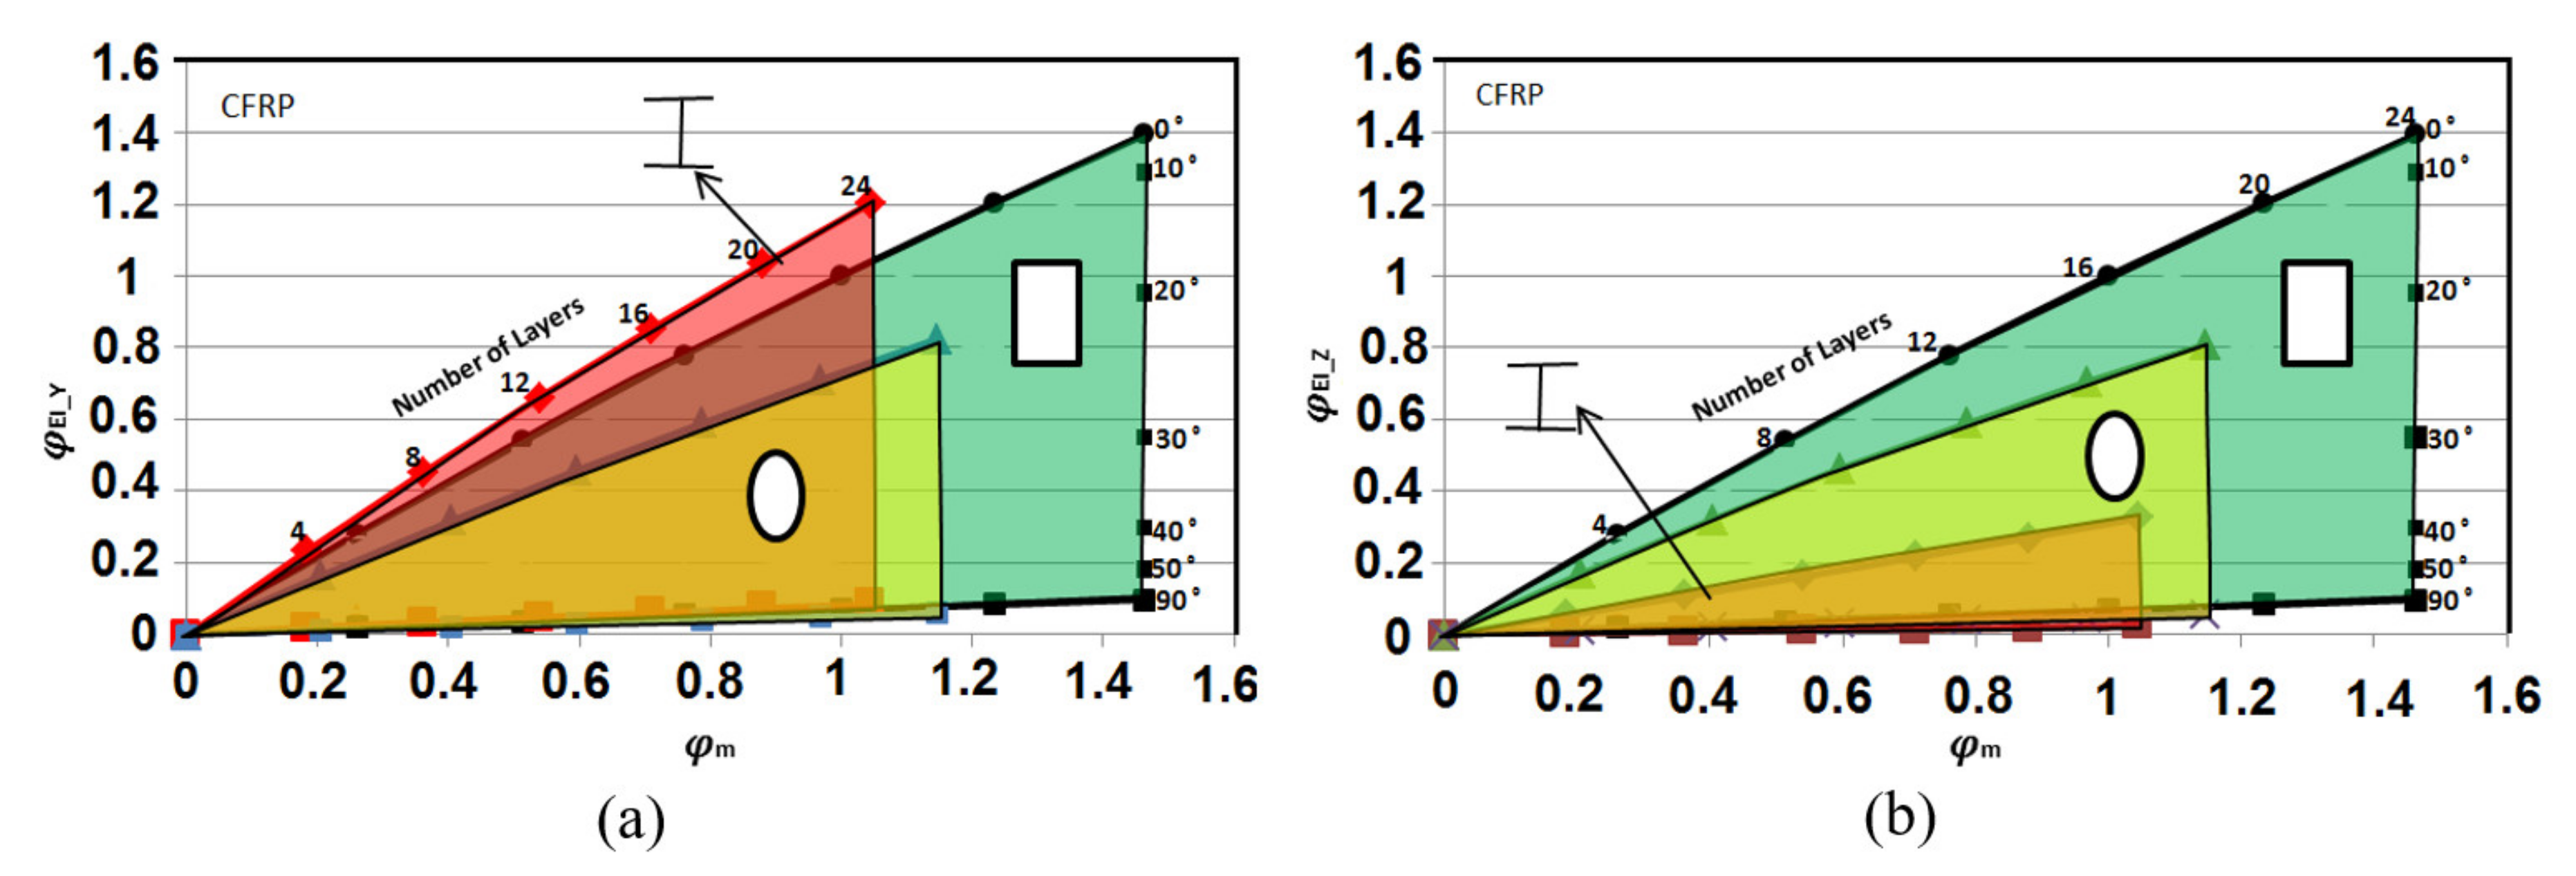
The rectangular envelope of was used to develop design charts for rectangular, oval, and I-beams with unequal flange and web dimensions. For these beams, the bending stiffness is different in the cross-section’s principal directions (i.e., Y and Z directions). Figure 6a,b show the normalized bending stiffness in the Y and Z directions versus the mass index ratio.
4. Three-Dimensional Finite Element Analysis and Numerical Simulations
In this section, the results obtained analytically using the equations provided in Table A1 [19] (and plotted in the design charts) are compared with the FEA results. It should be noted that the analytical solutions and design charts do not take into account shear and warping deformations, while the developed FE models include the effects of shear and warping deformations due to torsion.
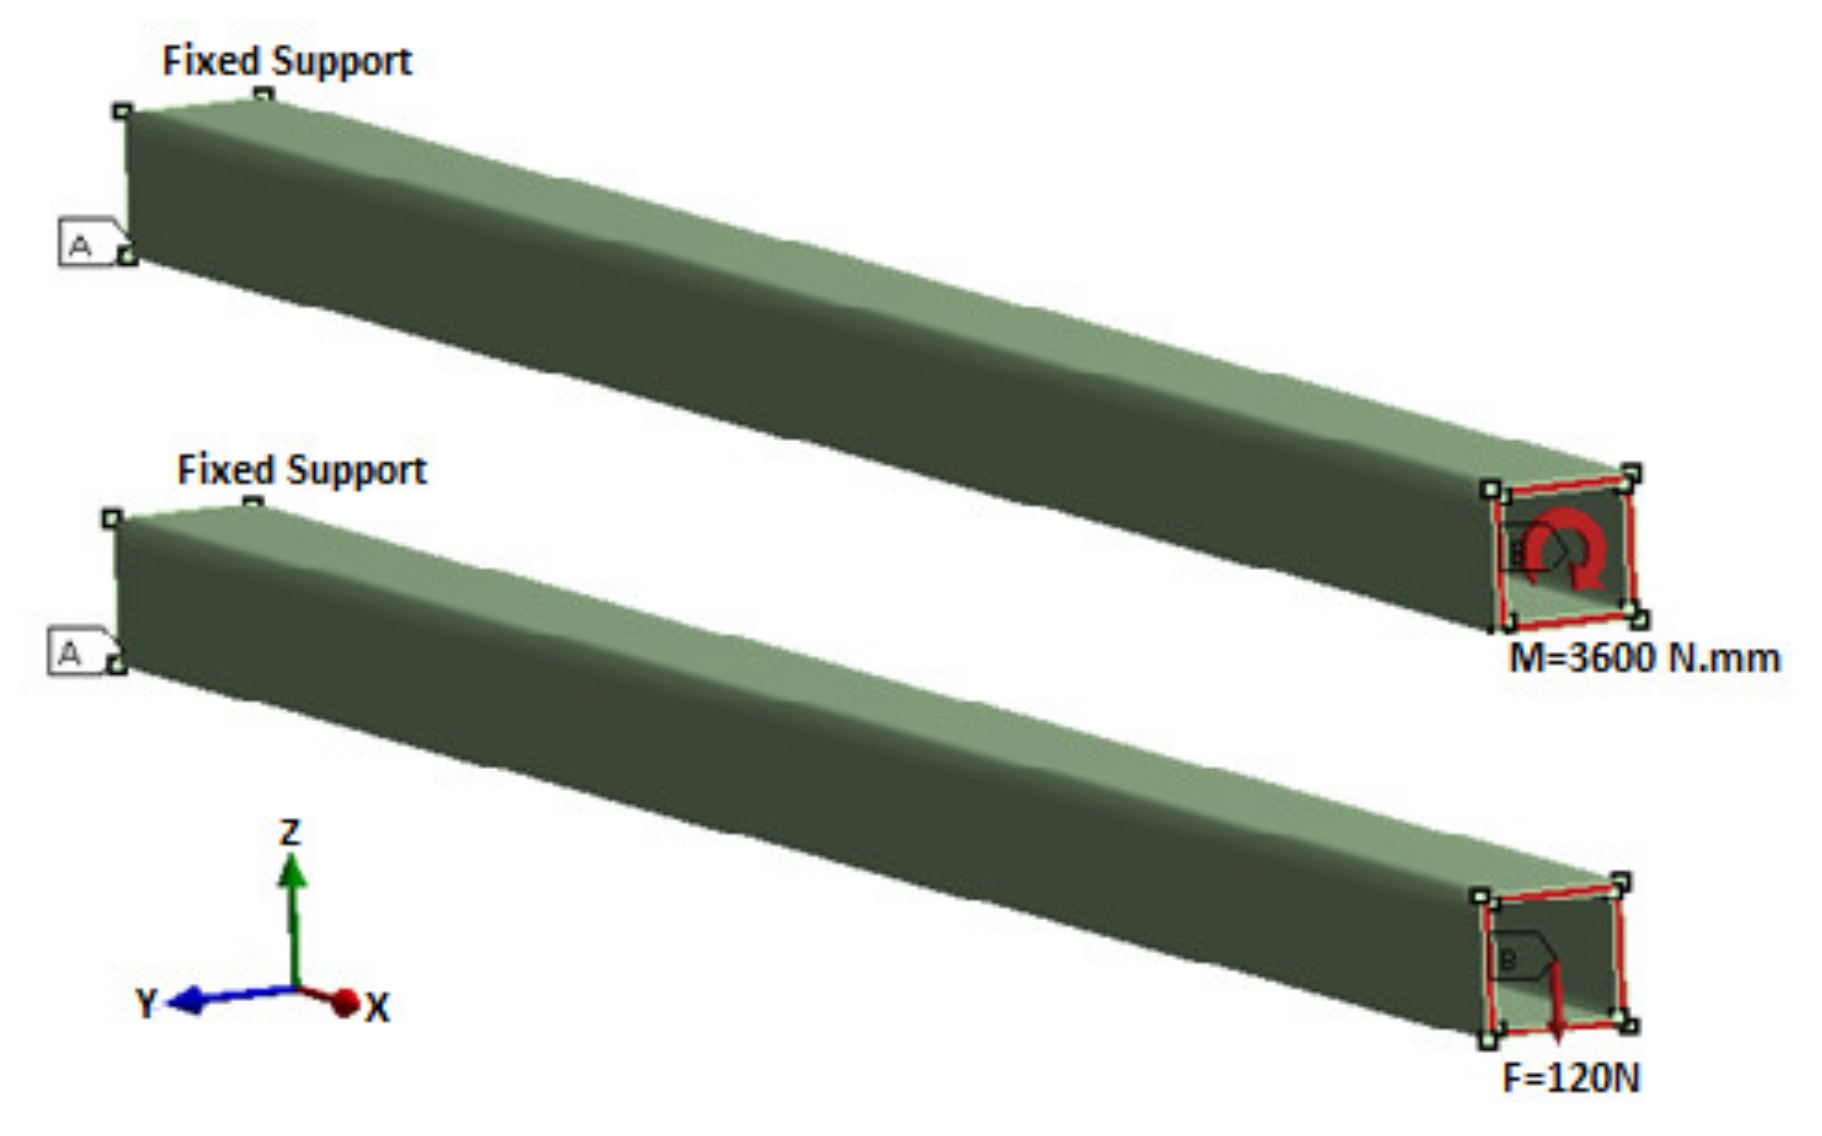
The numerical modelling of the composite beams is performed using the commercial finite element analysis package, ANSYS [33]. The developed FE model geometry, applied loading, and boundary conditions are shown in Figure 7. The cantilever beam shown in this figure is 1200 mm long and has a square cross section with dimensions of 60 mm × 60 mm (corresponding to the square envelope). A concentrated load of 120 N in the Z-direction and a torque moment of 3600 N.mm were applied at the free end of the cantilever. The developed FE models are based on linear elastic material models, static loading conditions, and small deformations (i.e., geometric and material nonlinearities were not considered). Quadratic and linear solid elements were used for the meshing of the composite beams. More specifically, Solid185 and Solid186 from the FEA software element library were selected. These elements are three-dimensional elements and have been shown [14,15] to be effective for the three-dimensional modeling of structures. The elements have three degrees of freedom at each node: translations in the nodal x, y, and z directions, and are either linear and defined by eight nodes (Solid 185) or are higher order (i.e., quadratic) defined by 20 nodes (Solid 186).
For the purposes of comparison, the maximum deflection in the Z-direction ( and angle of twist around the X-direction () were obtained from the FEA. The normalized bending and torsional numerical stiffness ratios obtained from the FEA are defined as and and are calculated as follows:
The analytical and finite element analysis results and normalized stiffness ratios that are defined in Equations (9) and (10) are summarized in Table 1, Table 2 and Table 3. The results are presented for fiber directions of 0°, 10°, and 20° with the number of layers ranging from 8 to 24. The results for other fiber directions were also obtained but are not presented here. In the tables, the following equations are used to analytically determine the deflections and rotations for further confirmation of the FEA results:
The deflections calculated using Equation (11) include only the deformation due to bending. In this equation, P is the applied load, L is the length, and EI is the equivalent bending stiffness of the composite beam.
Equation (12) is used to determine the rotations (i.e., angle of twist) and includes the effects of warping [34]. In this equation, T is the applied torque; GJ is the equivalent torsional stiffness; L is the length of the beam; X is the distance from the fixed support boundary condition; and, for the case of a square cross-section, , where E is the equivalent elastic modulus and a is the dimension of the side length of the square section [34].
The results presented in Table 1, Table 2 and Table 3 show that the FEA results are in close agreement with the results obtained from closed form analytical solutions that take into account the effects of warping. The close agreement between the analytical and FEA results validate the developed FE model.
The difference between the design charts and FEA results is summarized in Table 4. The % difference values were determined as follows:
In Table 4, , , and correspond to the percent differences between the normalized torsional stiffness values for the 0°, 10°, and 20° fiber orientations obtained using the FEA and analytical approaches. In turn, , , and correspond to the percent differences between the normalized bending stiffness values for the 0°, 10°, and 20° fiber orientations, respectively, obtained using the FEA and analytical approaches.
The values for the % difference provided in Table 4 range from nearly zero up to 6.31%. These differences are due to some of the assumptions that are inherently included in the design charts. For instance, the design charts do not take into account the effects of shear and warping deformations. In using the design charts, designers should remind themselves that the results and graphs are provided for thin-walled beams, and the underlying assumption is that the layer thickness is small. For reference, the individual lamina thicknesses used in this study were taken as 0.18 mm.
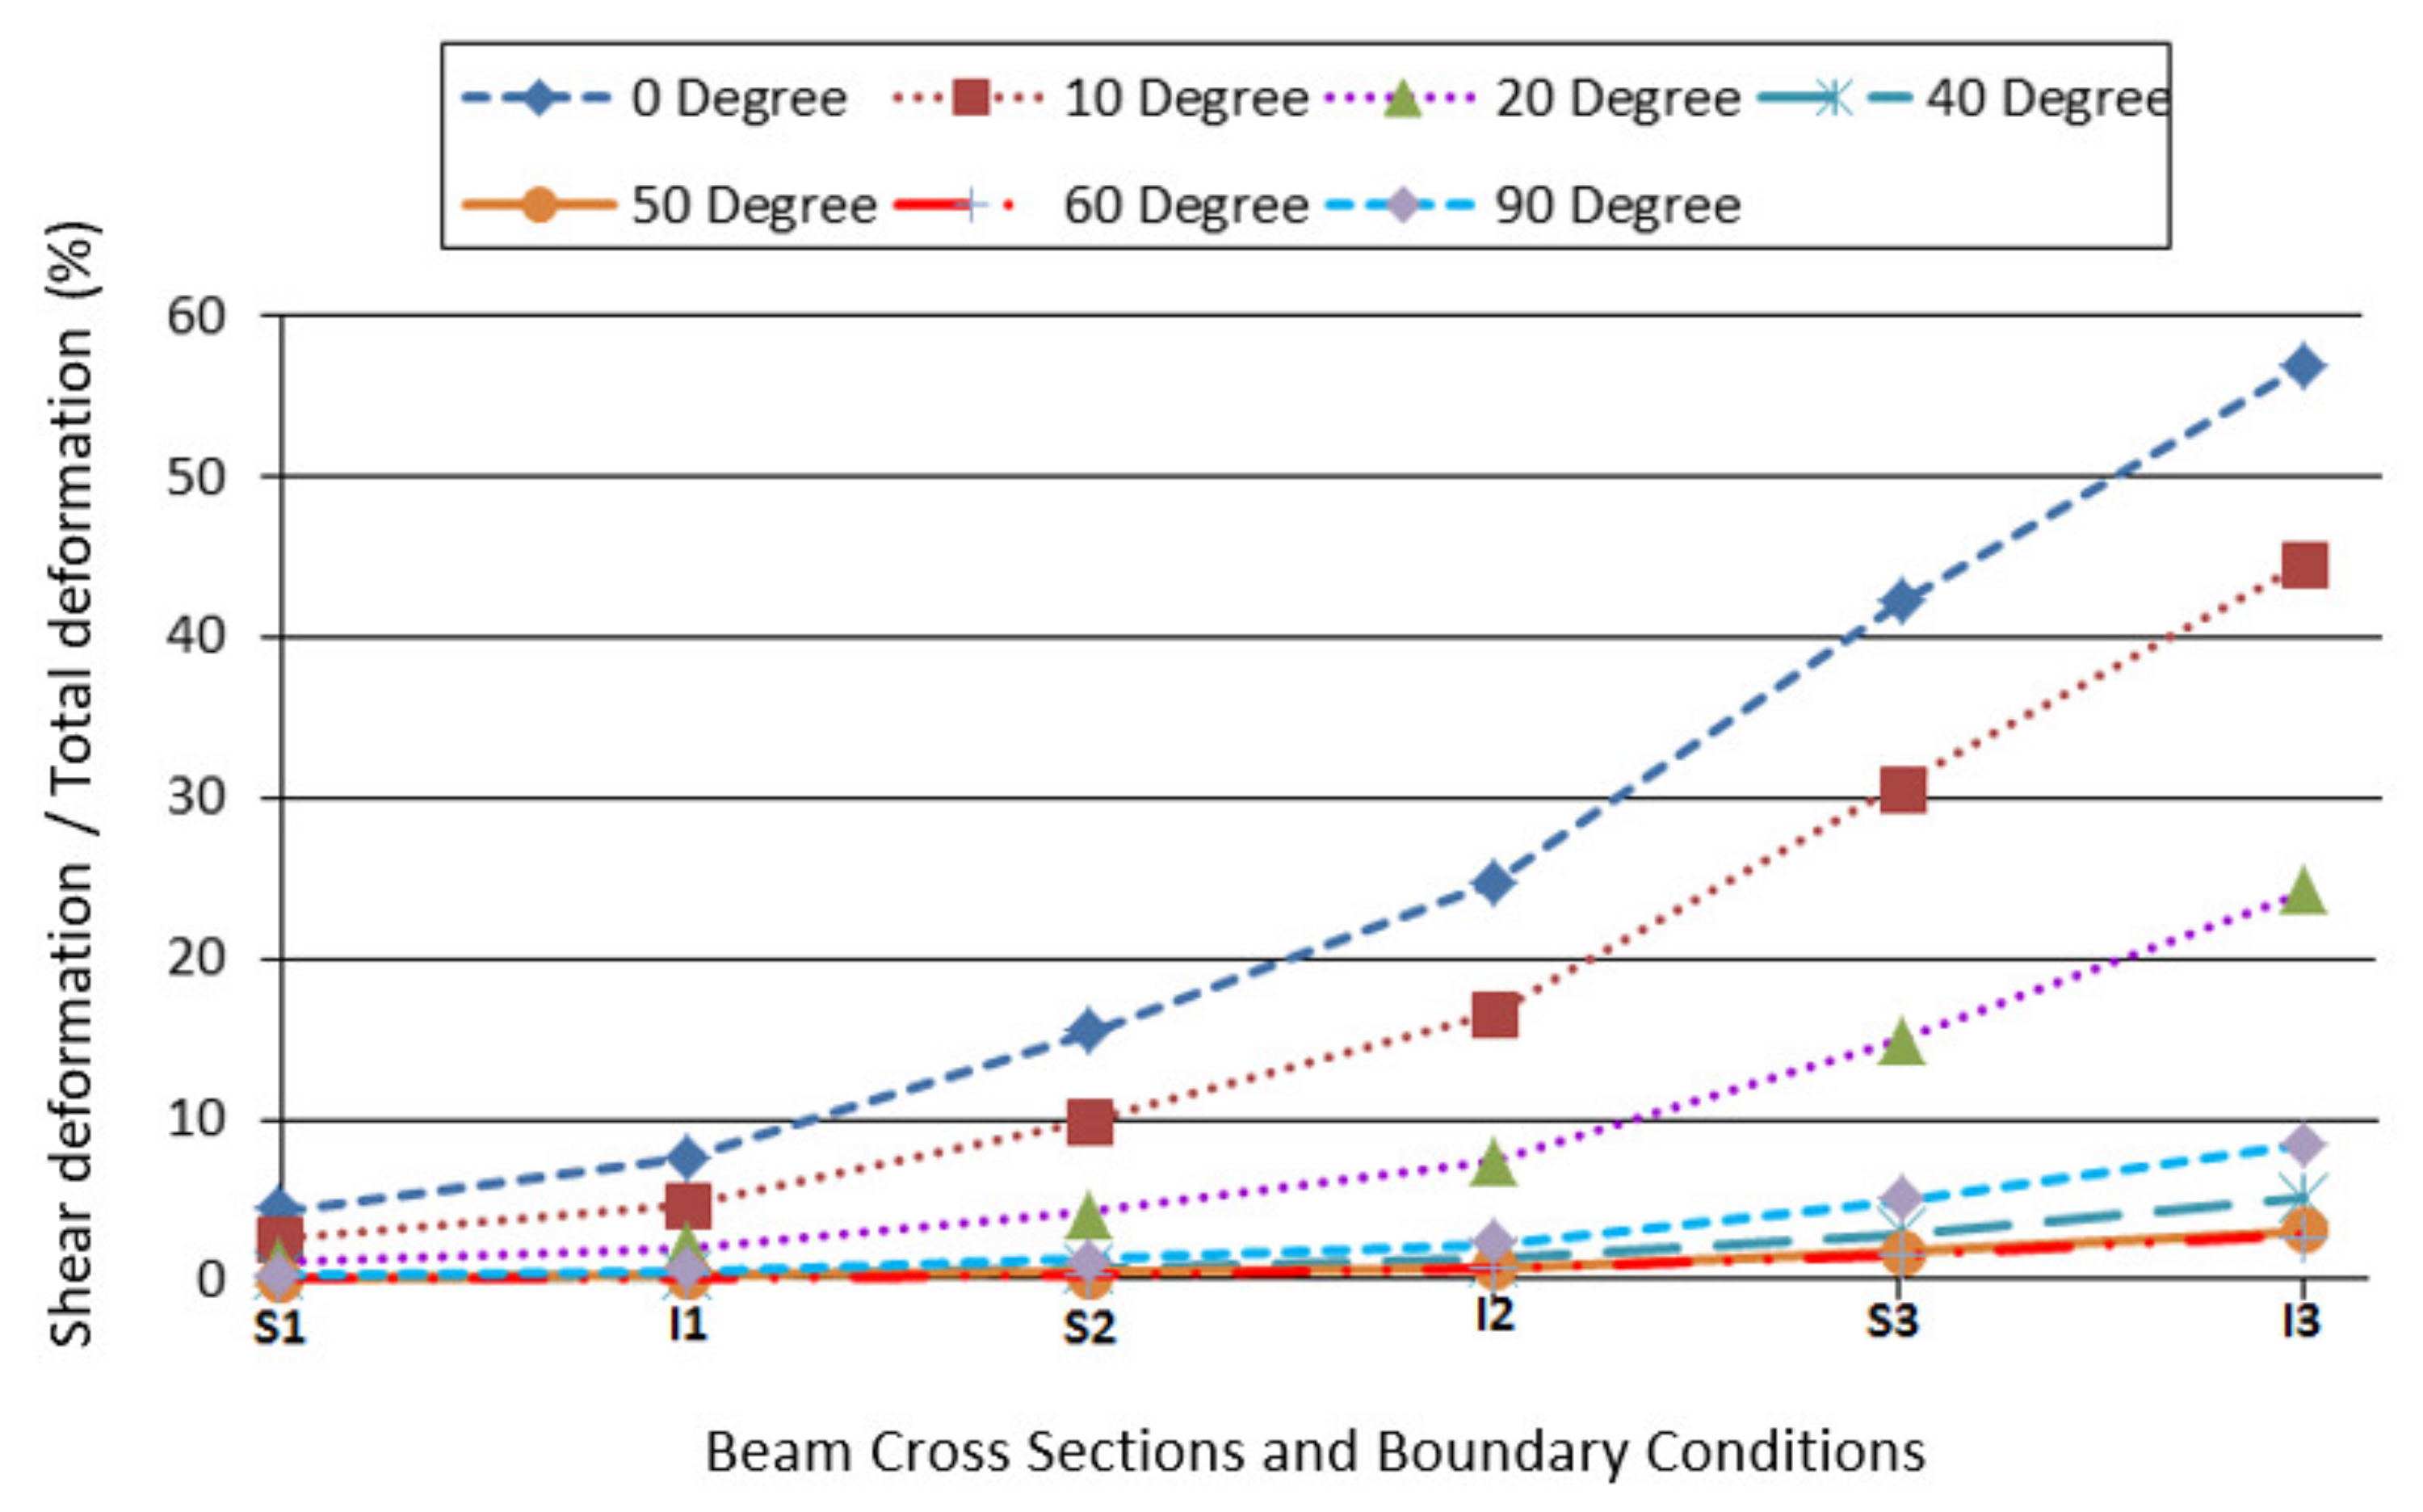
To investigate the effects of shear deformation on the design charts, the shear deformation () and bending deformation () were determined using the equations provided in Table A3 in Appendix B. As can be seen in the table, in addition to the geometric parameters of the beam, shear deformation effects (and their contribution to the total deformation) also depend on the beam end boundary conditions. The results reported here correspond to the laminated composite hollow square beam and I-beam with 24 layers and fiber orientation ranging from 0° to 90°. Figure 7 and S1–S3 refer to the square beam with boundary conditions corresponding to cases 1, 2, and 3 in Table A3, respectively. In turn, I1, I2, and I3 refer to an I-beam with boundary conditions corresponding to cases, 1, 2, and 3 in Table A3, respectively.
From Figure 8, it is observed that, for beams with angle ply layup and fiber angle direction ranging between approximately 30° and 60°, the effect of shear deformation is lower than that of fiber angle orientations between 0° and 30°. This is expected as the shear stiffness has higher values when the fiber orientation is between 30° and 60°. On the other hand, for angle ply layups with fibers oriented between approximately 0° and 30°, the shear deformation effect is significantly higher. The same observations can be made for both the square and I-beam cross sections. Furthermore, observations from Figure 8 show that the effects of shear deformation are significant for boundary conditions other than cantilever beams (Case 1) and lower fiber angle orientations. That is, the effect of shear deformation contribution for fiber orientations between approximately 0° and 30° and simply-simply supported boundary conditions (case 2) and clamped-clamped boundary conditions (case 3) can be close to 60%.
The results presented in this section show that the developed design charts can be used for the design of laminated composite beams if the effects of shear deformation are not significant (i.e., less than approximately 10%). The designers can use the results of Figure 8 (and similar plots) to determine the percent contribution of shear deformation. In the case that the shear deformation contribution is larger than 10%, the design charts can have significant inaccuracies and should not be used. The use of the design charts for the design of laminated composite beams is investigated in Section 7, Section 8 and Section 9 of this paper.
5. Application of Design Charts for the Analysis of Multi-Cell Beams
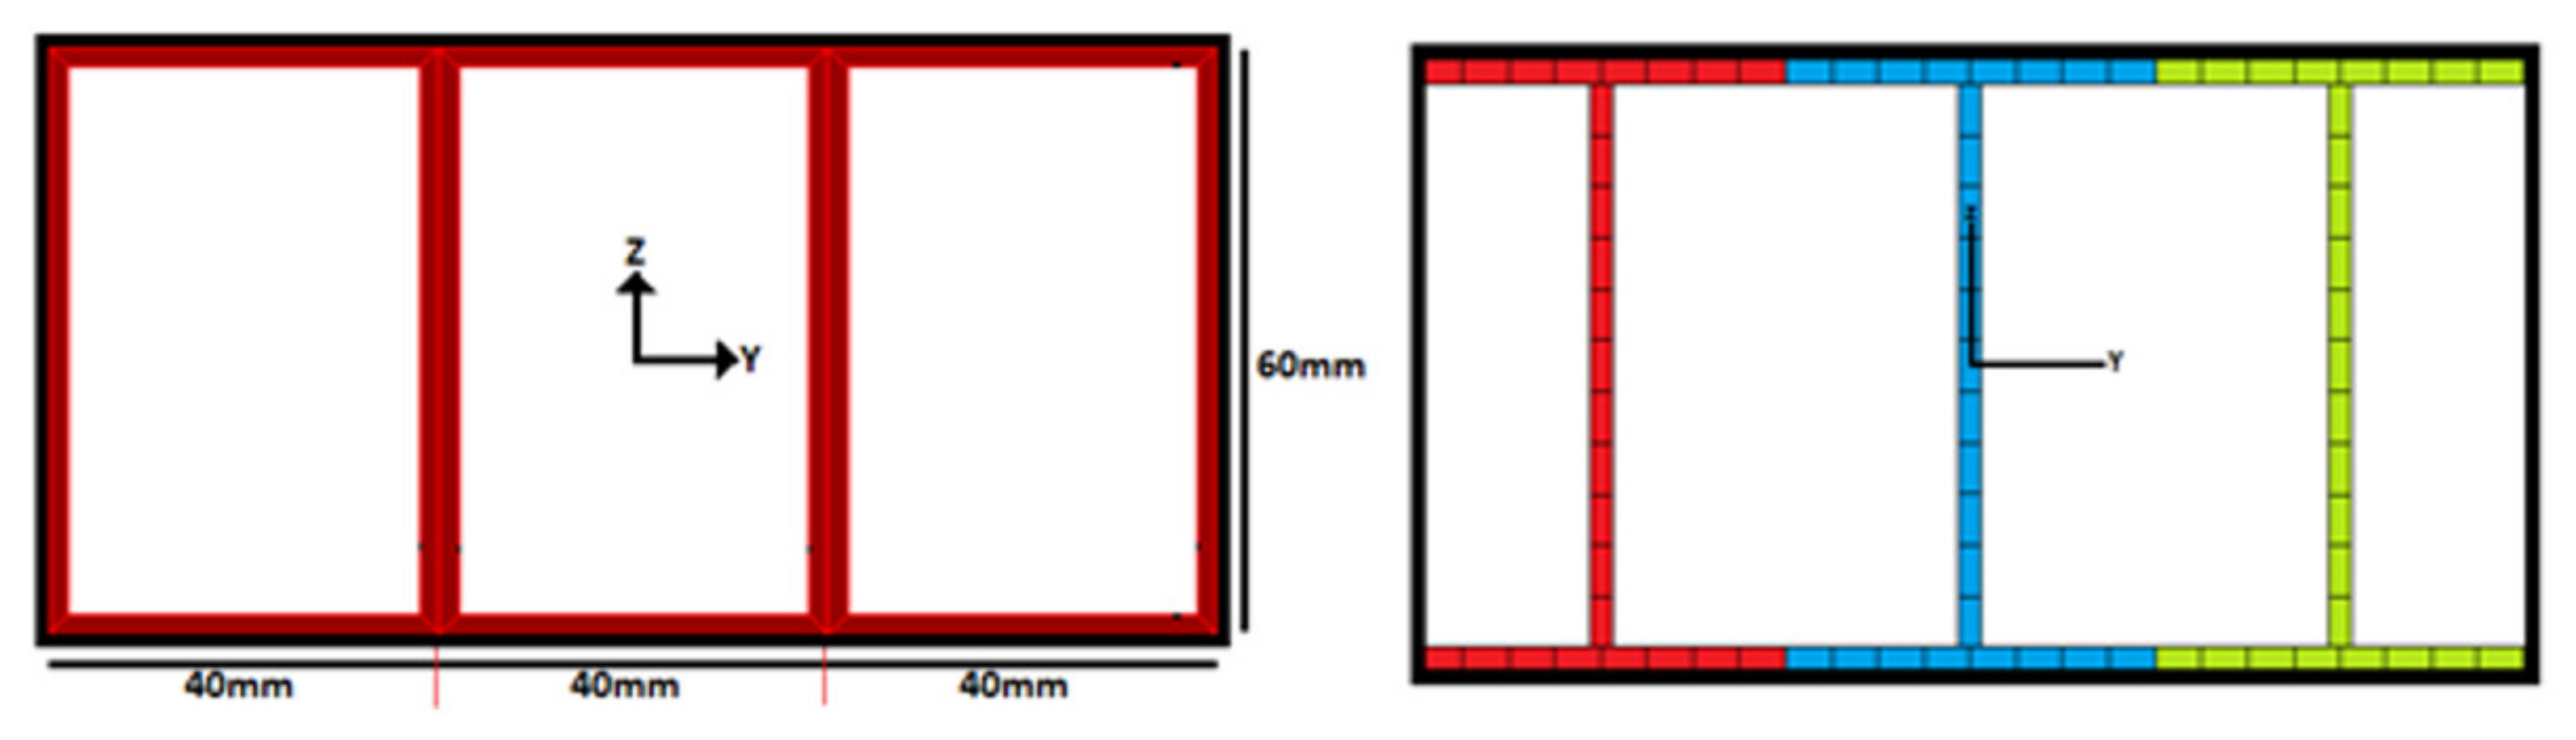
Laminated composite beams with closed cross-sections that have more than one cell occur in many engineering applications, including aircrafts, ships, and oil rigs, as well as robotic manipulators. Two composite beams with rectangular and I cross sections that fit within the rectangular envelope presented in Section 2 are shown in Figure 9. The cross sections were used to create a three-cell composite beam. These thin-walled multi-cell beams can be analyzed by an extension of the single-cell analysis approach and design charts described in the previous sections. For a multi-cell composite beam, the equivalent normalized bending ratio can be calculated using Equation (14) as follows:
where is the equivalent bending stiffness for each cell with respect to the Y-axis and is the equivalent bending stiffness of the reference beam. It is assumed that all cells have the same geometrical sizes, number of laminae, thicknesses, and material properties, that is, . Therefore, . Similarly, we can write the denominator of Equation (14) as . Substituting these expressions back into Equation (14), the following equation is obtained:
Equation (15) shows that a multi-cell beam’s bending stiffness ratio is equal to the beam bending efficiency ratio with respect to the Y-axis (defined in Section 2). Therefore, the bending efficiency design charts can be applied to multi-cell beams with the same limitations and constraints that govern their use for single cell sections.
Similarly, the mass ratio index for single cell beams can be extended to multi-cell beams as follows:
The same conclusions do not apply to the cross-sectional properties with respect to the Z-axis (e.g., Z-direction bending stiffness), because the centroidal Z-axis of each cell does not coincide with the centroidal Z-axis of the multi-cell cross section. As a result, in the Z-direction, the design charts for a single cell beam cannot be used for the design of multi-cell beams. This also applies to the torsional stiffness as the shear center for each cell does not coincide with the shear center of the multi-cell beam. However, the axial stiffness plots can be used for the analysis of the multi-cell beams subjected to axial loading.
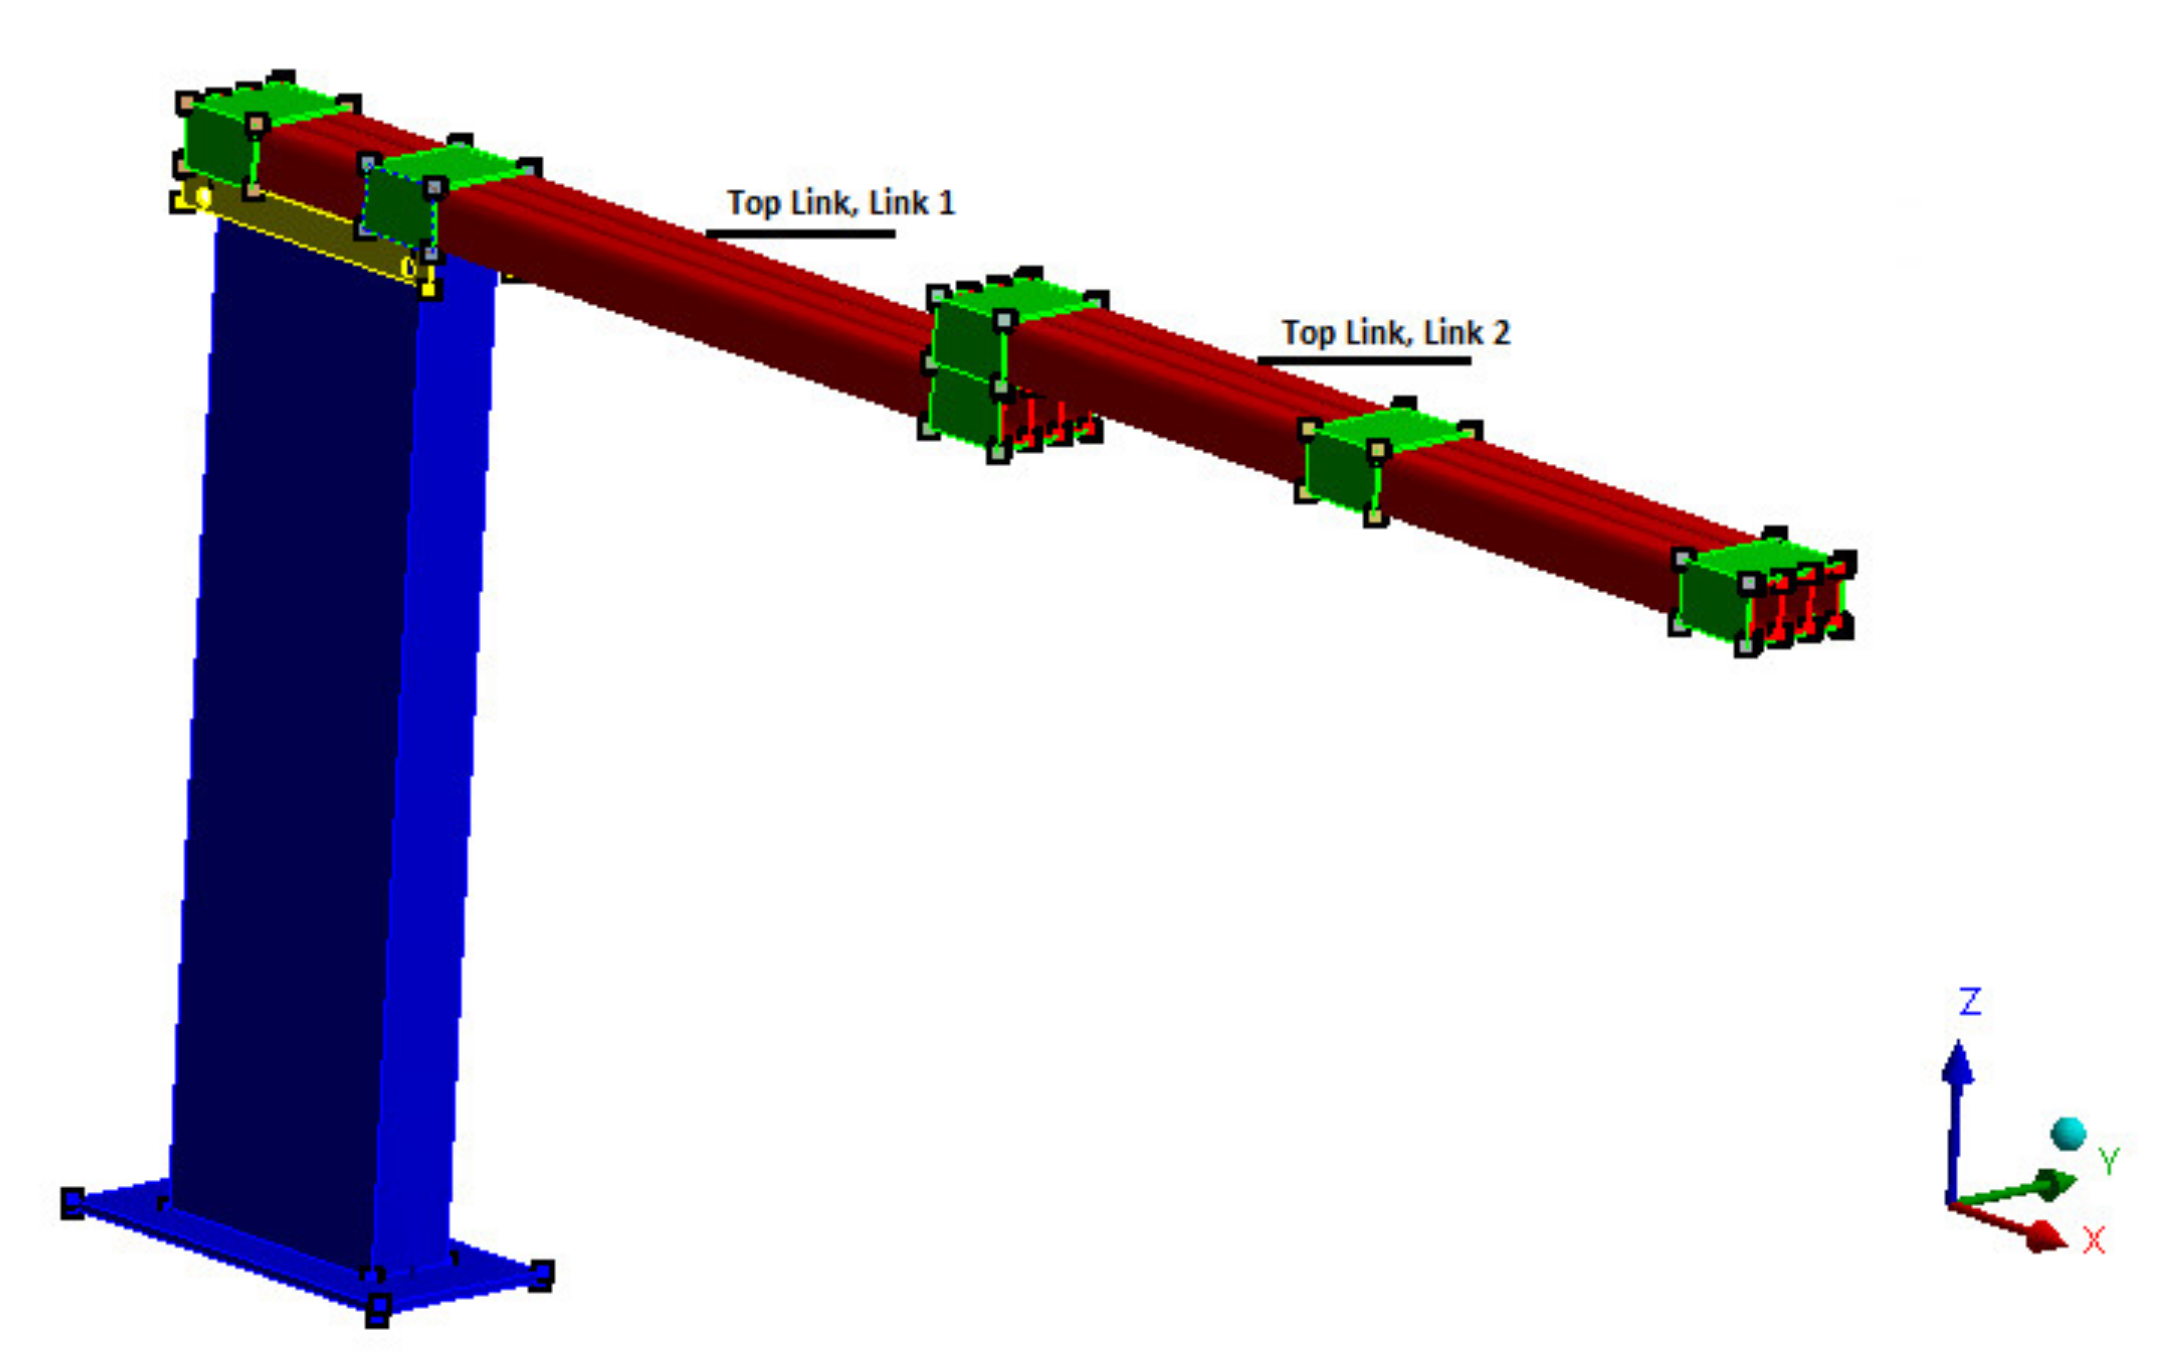
An example of multi-cell beams used in robotic applications is the plant phenotyping robot, which is partially shown in Figure 10 [28]. The robot is only partially shown as it is currently being patented. The robot is a long-reach 5-DOF manipulator and is designed and manufactured at the University of Saskatchewan. The robot has one prismatic joint that extends its reach to approximately three (3) meters. Each of the two top links are made of three aluminum beams with L = 1200 mm and with a rectangular cross section of 40 × 60 mm. Therefore, the resulting multi-cell beam has dimensions of 120 × 60 mm. The robot carries several sensors with a total mass of 15 kg at its end-effector. The manipulator’s tip displacement at the end effector affects the sensors’ performance; therefore, the designer is concerned with designing a robot with minimum tip deflections. As mentioned previously, the robot in [28] was fabricated using aluminum and steel materials. To reduce the mass of the structure and beam deflections (i.e., manipulator’s tip deflections), in this study, the authors have examined the effectiveness of using laminated composite beams for the materials of the manipulator. The design charts presented in the previous sections were utilized for this purpose. Results of this work are presented in Section 7 and Section 9.
6. Simplified Approach and Methodology for Utilizing the Design Charts
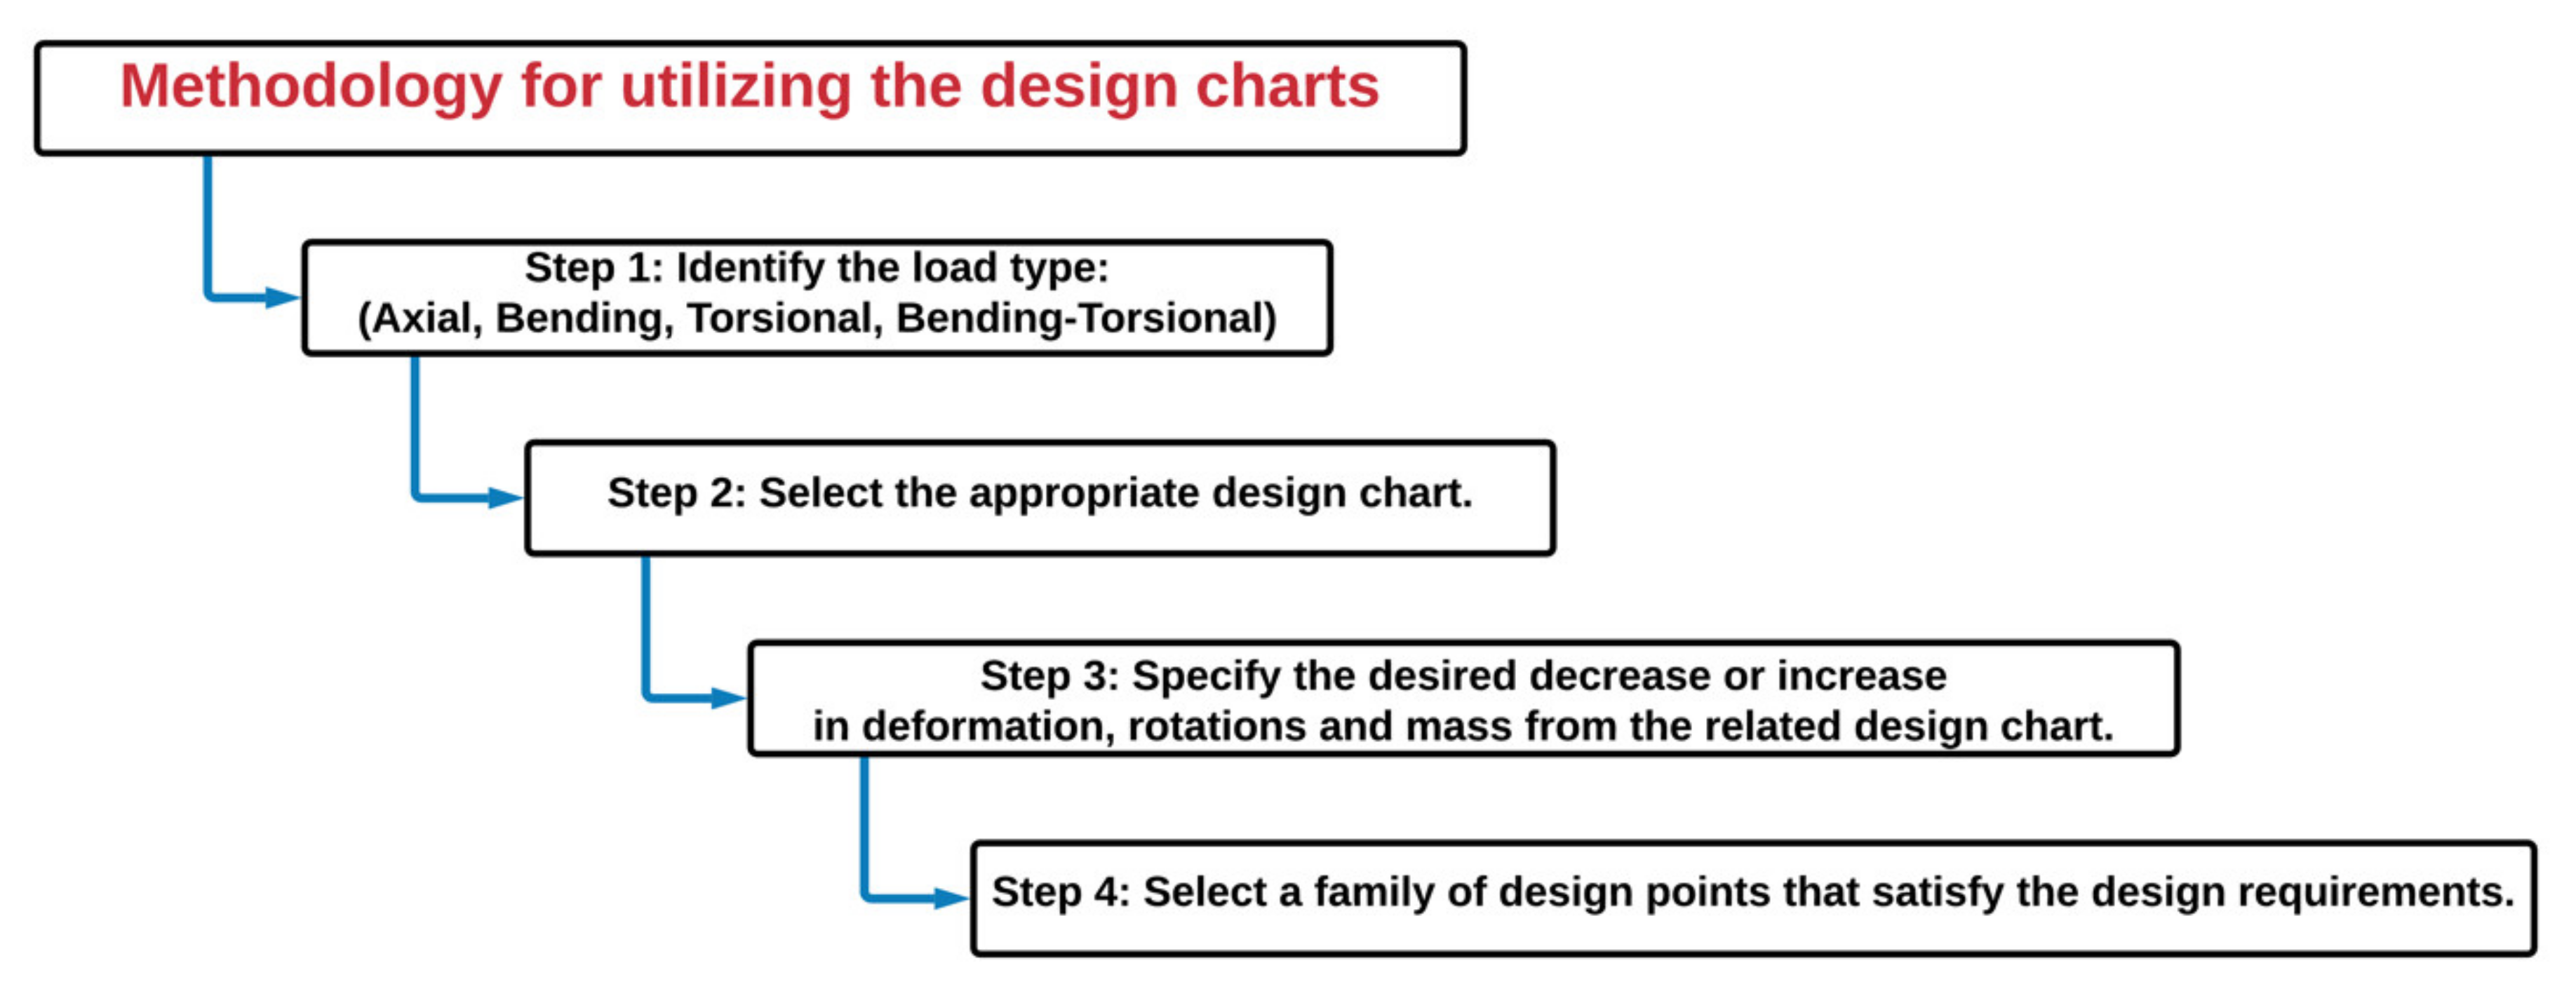
This section outlines the simplified approach and methodology for using the design charts. The methodology can be itemized as follows:
- 1.
- Select appropriate design chart—As there are different design charts corresponding to the different modes of loading, the designer must first determine the type of loading so that the appropriate design chart(s) can be utilized. The design charts were developed for axial, bending, torsional, and bending-torsional loadings.
- 2.
- Calculate mass, deflections, and rotations of reference beam—Once the type of loading is identified, the designer must then calculate the mass and deflections/rotations when the reference beam is subjected to the applied loadings. The reference beam(s) utilized for the development of the design charts are presented and discussed in Section 2. It should be noted that beams other than the reference beam can be used for these calculations. That is, any beam that corresponds to a design point on the design charts can be used for this purpose.
- 3.
- Specify desired decrease in mass, deflections, and rotations—Once the deflections and rotations of the reference beam have been determined, the designer must then specify the desired decrease in deformations and rotations (i.e., increase in axial, bending, or torsional stiffness) or reduction in mass relative to the reference beam(s). That is, the designer specifies the desired normalized axial stiffness (), bending stiffness (), torsional stiffness (), and mass ratio index () as appropriate.
- 4.
- Select a “family” of design points that satisfy requirements—Based on the desired normalized parameters in step 3, a “family” of cross sections with the number of layers, fiber angle orientation, mass, and materials of construction that satisfy the design criteria can readily be determined from the design charts.
Figure 11 is a flow chart depicting the required steps for utilizing the design charts.
To determine the number of layers, the designer can select any arbitrary lamina thickness for the individual plies. That is, there are no constraints regarding the individual lamina thicknesses as long as the laminated composite beam remains thin-walled and the design chart assumptions discussed in Section 4 are not violated (e.g., shear deflection contribution remains lower than approximately 10%).
In the next sections, the above design methodology is utilized to determine the appropriate cross-sectional shape, layup, and fiber angle orientations for laminated composite beams. Three general case studies were completed. More specifically, in the first case study, the design charts corresponding to the rectangular envelope are used for the design of multi-cell beams for the robotic arm shown in Figure 10. In the second case study, the design charts corresponding to the square envelope are examined. The laminated composite beams are subjected to bending loads in both case studies. In the third case study, tortional loads are applied to the laminated composite beam made up of a single cell rectangular cross section.
It should be noted that the aluminum robotic arm presented in Figure 10 has a maximum deflection of 2 mm when subjected to a 150 N force in the negative Z-direction at its tip [28]. To improve the performance of the robot and accuracy of sensor measurements, designers can consider increasing the beam stiffness while decreasing the mass using the design charts provided in this paper.
7. Case Study 1
In the first case study, a concentrated load of 150 N is applied to the free end of a multi-cell laminated composite beam. As the beam is subjected to in-plane bending, the bending efficiency design charts will have to be utilized. The design aims to decrease the beam tip deflection by increasing the laminated composite beam’s Y-direction equivalent stiffness. The notation used to identify the multi-cell beams will be as follows: three rectangular beams (RRR), three oval beams (OOO), and three I-beams (III). The following design point was selected as the starting design beam and used to calculate the relevant information. It should be noted that any other point on the design charts could have been chosen for this purpose. From Figure 6a, this beam has a bending efficiency of 0.53. To utilize the design charts, two design scenarios are considered. In the first scenario, is increased from 0.53 to 0.8, and in the second scenario, it is increased from 0.53 to 1.2. Using the design charts provided in Figure 6a, the design points for scenario one can be , , , and , and those for scenario two can be , , and . Therefore, using the design charts provided in Figure 6a, the designer can estimate the decrease in deflection without performing a detailed and computationally expensive FEA as follows:
For purposes of verification and comparison, a detailed FEA of the beams corresponding to the selected design points from the design charts was completed in Ansys. The beams were meshed using the Solid 185 (8-noded linear) element from the FEA software element library. For the purposes of verifying the convergence of the FE results, the beams were also meshed using Solid 186 (20-noded quadratic) element. Figure 12 shows the loading and boundary conditions on these multi-cell beams. The FE models consist of up to ~168,000 nodes and ~158,500 elements depending on the number of layers and laminate thickness.
The numerical results and corresponding percent difference with the results obtained using the design charts are summarized in Table 5. As can be observed, there is a very close agreement between the design charts and the deflections predicted by the detailed three-dimensional FEA. It can be seen that, for all of the proposed multi-cell cross sections, the difference between the deflections predicted by the design charts and FEA is less than 8%, which is reasonable. The differences between the results obtained using the design charts and FEA are due to some of the assumptions and limitations of the design charts. For instance, as discussed previously, the design charts do not take into account the effects of shear deformations. In using the design charts, designers should keep in mind that the results and performance indices are provided for thin-walled beams, and the underlying assumption is that shear deformations are negligible.
8. Case Study 2
In this case study, the effectiveness of the design charts developed using the square envelope are examined. The same loading and applied boundary conditions as that of case study 1 are considered. However, laminated composite beams with square and circular cross-sections that fit the square envelope are examined. The same approach as that of case study 1 was followed to utilize the design charts shown in Figure 4. The notation used to identify the multi-cell beams is as follows: three square beams (SSS), three circular beams (CCC), and three I-beams (III). The following design point was arbitrarily selected with a bending efficiency of 0.25. To utilize the design charts, two design scenarios are considered. In the first scenario, is increased from 0.25 to 0.4, and in the second scenario, it is increased from 0.25 to 0.8. Using the design charts provided in Figure 4a, the design points for scenario one can be , , and , and those for scenario two can be and . Similar to the first case study, the designer can estimate the decrease in deflection without performing a detailed and time-consuming FEA as follows (using design charts in Figure 4):
A detailed FEA of the beams corresponding to the selected design points from the design charts was also completed. Table 6 shows the FEA results. It can be seen that, for all of the proposed square and circular multi-cell cross sections, there is a good agreement between the deflections predicted by the design charts and FEA.
9. Case Study 3
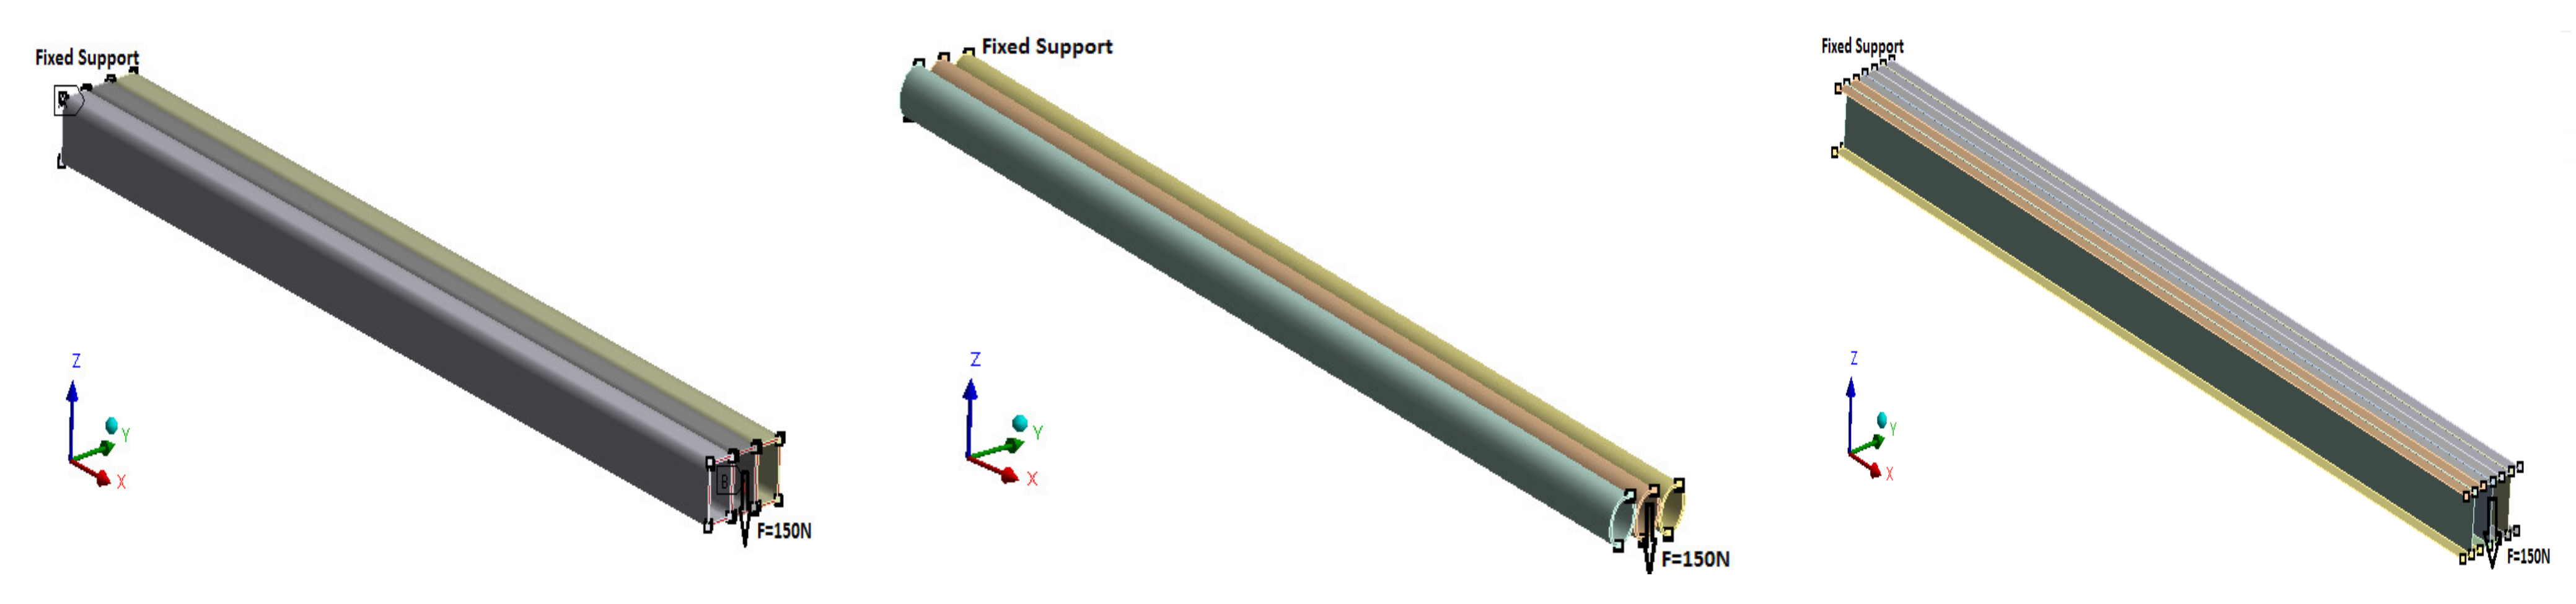
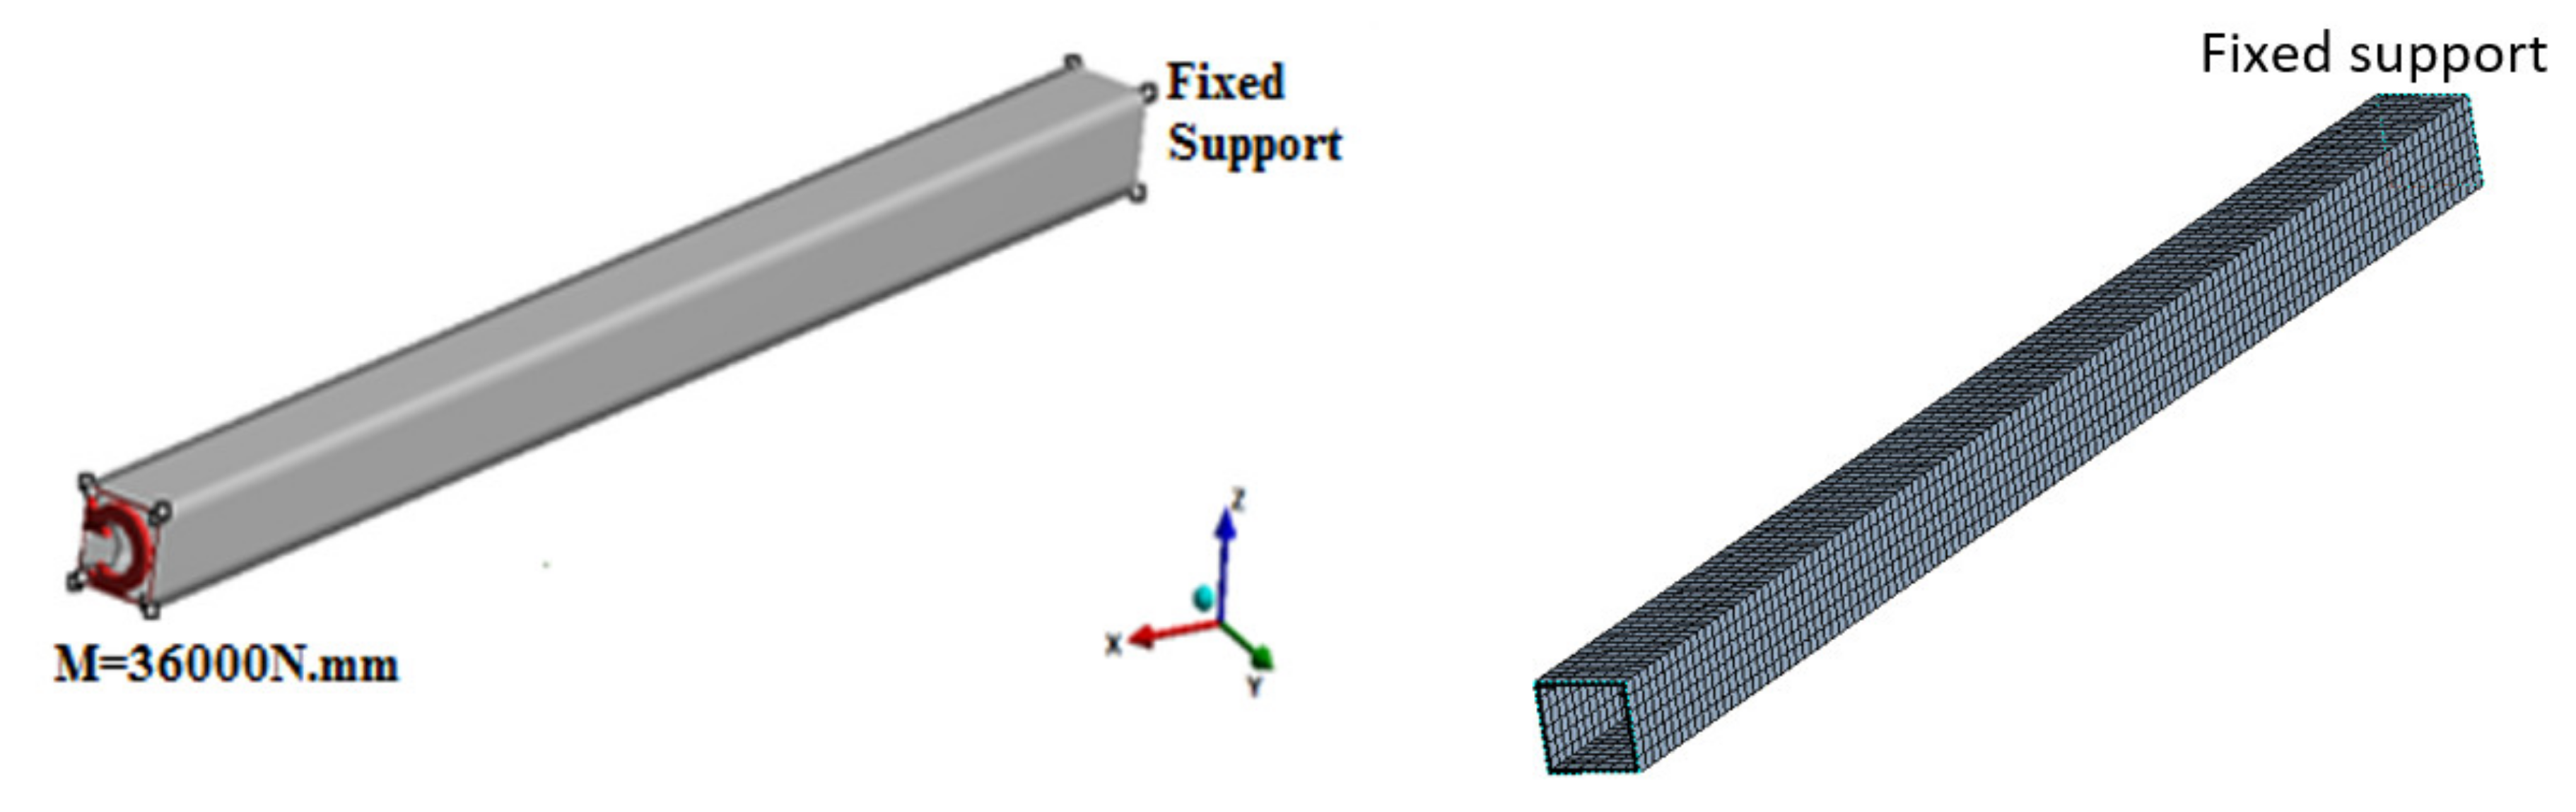
In addition to bending loads, the laminated composite beams in structures and mechanisms can be subjected to torsional loads. For instance, if the sensors at the tip of the beam are installed at a location that is not in-line with the shear center of the cross section of the beam, the beam will be subjected to torsional loading. In this section, the torsional efficiency design charts for the square envelope were used to increase the torsional stiffness of the beam, and hence decrease the angle of twist of the beam. For this purpose, a torsional moment of 36,000 N.mm. was applied at the free end of a cantilever beam with a length of 1200 mm. The cross-sectional dimensions of this beam are such that it fills the square envelope defined in Section 2. A detailed FEA was also completed on the beam to determine the angle of twist. The developed FE model, meshing, applied boundary conditions, and loading are shown in Figure 13.
As the developed torsional efficiency design charts cannot be applied to multi-cell beams, only single cell beams are considered here. To utilize the design charts, several design points are considered. The beam corresponding to the design point with of 1.2 was arbitrarily selected as the starting beam. The aim is to choose a laminated composite beam with a certain fiber angle orientation, mass, and cross section that can provide the required stiffness and normalized mass index ratio , without performing a detailed and time-consuming FEA on numerous laminated composite beams. The design charts provided in Figure 5 are utilized using the same approach as that in case studies 1 and 2 to determine the angle of twist for various beams with higher stiffness than the starting reference beam. These beam cross sections are outlined in Table 7. In practice, the desired angle of twist (and mass) will be specified, and the designer can readily choose a laminated composite beam from the design charts that will provide the require stiffness (and mass) to meet the specified criteria.
The results obtained from the designed charts and FEA are shown in Table 7. Note that the difference between the angles of twist calculated using the design charts versus FEA is less than 10% for all cases.
As can be observed, the design charts can be a very useful tool for determining a “family” of possible beams with the desired stiffness that meet the deflection or rotation criteria. The final selection of an appropriate beam from the range of possible options depends on application, ease of fabrication, costs, and available manufacturing machines and technologies. Regarding the robotic arm, it can be observed how the design charts can aid in selecting a laminated composite beam with similar or better structural performance than the aluminum beam (e.g., higher stiffness and lower mass).
10. Conclusions
In this study, structural efficiency metrics and performance indices were defined for the integrated selection of the design parameters that govern the static and dynamic performance of laminated thin-walled composite beams. Important parameters in the design of laminated composite beams include the number of layers, thickness of laminate, fiber angle orientation, materials of construction, and cross-sectional shape. Based on these design parameters, performance indices such as normalized axial stiffness, bending stiffness, torsional stiffness, combined torsional-bending stiffness, and the mass index ratio were defined and are summarized in design charts. The developed design charts are a useful tool for comparing the structural performance of laminated composite beams of various cross-sections, fiber angle orientation, and materials. To analyze cross sections of various types and sizes, results are generated for two envelopes. The proposed charts assist the designer in the design variable selection process and analysis of beams with square, rectangular, circular, oval, and I-beam cross sections. In addition to single cell beams, the application of the design charts was extended to multi-cell beams for certain loading conditions.
Three-dimensional finite element models using linear and quadratic solid elements were developed and the numerical simulation results were compared to the closed form solution and design chart results. It was observed that the design charts can be used to assist engineers and researchers to accurately and efficiently predict the structural behavior (e.g., stiffnesses, deflections, and rotations) of laminated composite beams that fall within the boundaries of the design charts. It was observed that the two main factors that impact the accuracy of the results predicted by the design charts are shear deformation and warping effects. The results show that, for cases where the shear deformation contribution to total deformation is below 10%, the design charts provide an accurate prediction of the behavior of the composite beam.
The simplified approach for parameter selection and analysis of laminated composite beams was summarized in a series of steps. The design charts and simplified approach were then used as a tool for selecting laminated composite beam(s) with the required stiffness and mass to replace an aluminum robotic arm. It was observed that the proposed approach can be used in the design of laminated composite beams without the need to create detailed FE models that are time-consuming to develop and computationally expensive.
Author Contributions
The Phenotyping robot (hardware and software parts) was developed by the Robotics Lab at the University of Saskatchewan over a period of four years; Conceptualization, M.A.K. and R.M.; methodology, R.M., M.A.K. and R.F.; software, M.A.K.; validation, R.M., M.A.K. and R.F.; formal analysis, M.A.K. and R.M.; investigation, M.A.K., R.M. and R.F.; resources, R.F.; data curation, R.M. and M.A.K.; writing—original draft preparation, M.A.K.; writing—review and editing, R.M. and R.F.; visualization, M.A.K. and R.M.; supervision, R.M. and R.F.; project administration, R.M. and R.F.; funding acquisition, R.F. All authors have read and agreed to the published version of the manuscript.
Funding
This work is supported by the Canada First Research Excellence Fund (CFREF) through the Global Institute for Food Security (GIFS), University of Saskatchewan, Canada. Also, funding was provided by an NSERC-CRD grant of R.F.
Data Availability Statement
Not applicable.
Conflicts of Interest
The authors declare no conflict of interest.
Appendix A. Equivalent Axial, Bending, and Torsional Stiffness Equations and Material Properties

Table A1.
Equivalent axial, bending, and torsional stiffnesses [19].
Table A1.
Equivalent axial, bending, and torsional stiffnesses [19].
 | |
 | |
 | |
 |
Table A2.
Properties for the CFRP and GFRP lamina, values adopted from [33].
Table A2.
Properties for the CFRP and GFRP lamina, values adopted from [33].
| Property | CFRP | GFRP |
| Density, p, g/cm3 | 1.60 | 1.97 |
| Longitudinal modulus, E1, GPa | 147.0 | 41.0 |
| Transverse in-plane modulus, E2,GPa | 10.3 | 10.4 |
| Transverse out-of-plane modulus, E3,GPa | 10.3 | 10.4 |
| In-plane shear modulus, G12,GPa | 7.00 | 4.30 |
| Out-of-plane shear modulus, G23,GPa | 3.70 | 3.50 |
| Out-of-plane shear modulus, G13,GPa | 7.00 | 4.30 |
| Major in-plane Poisson’s ratio, v12 | 0.27 | 0.28 |
| Out-of-plane Poisson’s ratio, v23 | 0.54 | 0.50 |
| Out-of-plane Poisson’s ratio, v13 | 0.27 | 0.28 |
Appendix B. Comparison of FEA Results and Shear to Bending Deformation Ratios
Table A3.
Bending and shear deformation equations, formula adopted from [19].
Table A3.
Bending and shear deformation equations, formula adopted from [19].
| Boundary Conditions | Bending Deformation | ||
|---|---|---|---|
Case 1 | |||
Case 2 | |||
Case 3 |
References
- Carrera, E.; Filippi, M.; Mahato, P.K.; Pagani, A. Advanced models for free vibration analysis of laminated beams with compact and thin-walled open/closed sections. J. Compos. Mater. 2015, 49, 2085–2101. [Google Scholar] [CrossRef] [Green Version]
- Jun, L.; Jin, X. Coupled Bending-Torsional Dynamic Response of Axially Loaded Slender Composite Thin-Walled Beam with Closed Cross-Section. J. Compos. Mater. 2004, 38, 515–534. [Google Scholar] [CrossRef]
- Infante, V.; Madeira, J.; Ruben, R.B.; Moleiro, F.; de Freitas, S.T. Characterization and optimization of hybrid carbon–glass epoxy composites under combined loading. J. Compos. Mater. 2019, 53, 2593–2605. [Google Scholar] [CrossRef]
- Rozylo, P.; Teter, A.; Debski, H.; Wysmulski1, P.; Falkowicz, K. Experimental and Numerical Study of the Buckling of Composite Profiles with Open Cross Section under Axial Compression. Appl. Compos. Mater. 2017, 24, 1251–1264. [Google Scholar] [CrossRef] [Green Version]
- Pan, S.; Dai, Q.; Safaei, B.; Qin, Z.; Chu, F. Damping characteristics of carbon nanotube reinforced epoxy nanocomposite beams. Thin-Walled Struct. 2021, 166, 108127. [Google Scholar] [CrossRef]
- Dai, Q.; Qin, Z.; Chu, F. Parametric study of damping characteristics of rotating laminated composite cylindrical shells using Haar wavelets. Thin-Walled Struct. 2021, 161, 107500. [Google Scholar] [CrossRef]
- Li, H.; Lv, H.; Gu, J.; Xiong, J.; Han, Q.; Liu, J.; Qin, Z. Nonlinear vibration characteristics of fibre reinforced composite cylindrical shells in thermal environment. Mech. Syst. Signal Process. 2021, 156, 107665. [Google Scholar] [CrossRef]
- Li, H.; Lv, H.; Sun, H.; Qin, Z.; Xiong, J.; Han, Q.; Liu, J.; Wang, X. Nonlinear vibrations of fiber-reinforced composite cylindrical shells with bolt loosening boundary conditions. J. Sound Vib. 2021, 496, 115935. [Google Scholar] [CrossRef]
- D’Antino, T.; Sneed, L.H.; Carloni, C.; Pellegrino, C. Effect of the inherent eccentricity in single-lap direct-shear tests of PBO FRCM-concrete joints. Compos. Struct. 2016, 142, 117–129. [Google Scholar] [CrossRef]
- Ombres, L.; Verre, S. Experimental and numerical investigation on the steel reinforced grout (SRG) composite-to-concrete bond. J. Compos. Sci. 2020, 4, 182. [Google Scholar] [CrossRef]
- Gillet, A.; Francescato, P.; Saffre, P. Single- and Multi-objective Optimization of Composite Structures: The Influence of Design Variables. J. Compos. Mater. 2010, 44, 457–480. [Google Scholar] [CrossRef]
- Walker, M.; Smith, R.E. A Technique for the Multi-objective Optimization of Laminated Composite Structures using Genetic Algorithms and Finite Element Analysis. Compos. Struct. 2003, 62, 123–128. [Google Scholar] [CrossRef]
- Feil, R.; Pflumm, T.; Bortolotti, P.; Morandini, M. A Cross-Sectional Aeroelastic Analysis and Structural Optimization Tool for Slender Composite Structures. Compos. Struct. 2020, 253, 112755. [Google Scholar] [CrossRef]
- Moazed, R.; Fotouhi, R.; Szyszkowski, W. Out-of-plane Behaviour and FE Modeling of a T-Joint Connection of Thin-Walled Square Tubes. Thin-Walled Struct. 2012, 51, 87–98. [Google Scholar] [CrossRef]
- Moazed, R.; Fotouhi, R.; Szyszkowski, W. The In-Plane Behaviour and FE Modeling of a T-Joint Connection of Thin-Walled Square Tubes. Thin-Walled Struct. 2009, 47, 816–825. [Google Scholar] [CrossRef]
- Pasini, D. Shape transformers for material and shape selection of lightweight beams. Mater. Des. 2007, 28, 2071–2079. [Google Scholar] [CrossRef] [Green Version]
- Ashby, M.F. Overview No. 92: Materials and Shape. Acta Metall. Mater. 1991, 39, 1025–1039. [Google Scholar] [CrossRef]
- Ashby, M.F.; Bréchet, Y.J.M. Designing Hybrid Materials. Acta Mater. 2003, 51, 5801–5821. [Google Scholar] [CrossRef]
- Kollár, L.; Springer, G. Mechanics of Composite Structures; Cambridge University Press: Cambridge, UK, 2003. [Google Scholar] [CrossRef]
- An, H.; Singh, J.; Pasini, D. Structural Efficiency Metrics for Integrated Selection of Layup, Material, and Cross-Section Shape in Laminated Composite Structures. Compos. Struct. 2017, 170, 53–68. [Google Scholar] [CrossRef] [Green Version]
- Pasini, D. A New Theory for Modeling the Mass-Efficiency of Material, Shape and Form. Ph.D. Thesis, University of Bristol, Bristol, UK, 2003. [Google Scholar]
- Buckney, N.; Pirrera, A.; Weaver, P.M. Structural Efficiency Measures for Sections Under Asymmetric Bending. ASME. J. Mech. Des. 2015, 137, 011405. [Google Scholar] [CrossRef]
- Wanner, A. Minimum-Weight Materials Selection for Limited available Space. Mater. Des. 2010, 31, 2834–2839. [Google Scholar] [CrossRef]
- Pasini, D. Shape and Material Selection for Optimizing Flexural Vibrations in Multilayered Resonators. J. Microelectromech. Syst. 2006, 15, 1745–1758. [Google Scholar] [CrossRef]
- Amany, A.; Pasini, D. Material and Shape Selection for Stiff Beams Under Non-Uniform Flexure. Mater. Des. 2009, 30, 1110–1117. [Google Scholar] [CrossRef] [Green Version]
- Singh, J.; Mirjalili, V.; Pasini, D. Integrated shape and material selection for single and multi-performance criteria. Mater. Des. 2011, 32, 2909–2922. [Google Scholar] [CrossRef]
- Lewis, F.L.; Dawson, D.M.; Abdallah, C.T. Robot Manipulator Control: Theory and Practice; CRC Press: Boca Raton, FL, USA, 2003. [Google Scholar] [CrossRef]
- Zhang, Q.-W.; Fotouhi, R.; Cote, J.; Pour, M.K. Lightweight Long-Reach 5-DOF Robot Arm for Farm Application. In Proceedings of the ASME 2019 International Design Engineering Technical Conferences and Computers and Information in Engineering Conference, Anaheim, CA, USA, 18–21 August 2019. IDETC2019-98366. [Google Scholar]
- Ghazavi, A.; Gordaninejad, F.; Chalhoub, N.G. Dynamic Analysis of a Composite-Material Flexible Robot Arm. Comput. Struct. 1993, 49, 315–327. [Google Scholar] [CrossRef]
- Caprino, G.; Langella, A. Optimization of robotic arms made of composite materials for maximum fundamental frequency. Compos. Struct. 1995, 31, 1–8. [Google Scholar] [CrossRef]
- Yin, H.; Liu, J.; Yang, F. Hybrid Structure Design of Lightweight Robotic Arms Based on Carbon Fiber Reinforced Plastic and Aluminum Alloy. IEEE Access. 2019, 7, 64932–64945. [Google Scholar] [CrossRef]
- Lee, C.S.; Lee, D.G.; Oh, J.H.; Kim, H.S. Composite Wrist Blocks for Double Arm Type Robots for Handling Large LCD Glass Panels. Compos. Struct. 2002, 57, 345–355. [Google Scholar] [CrossRef]
- Ansys Version 18.1 Standard User’s Manual. 2018. Available online: www.ansys.com (accessed on 17 August 2021).
- Pluzsik, A.; Kollár, L.P. Effects of Shear Deformation and Restrained Warping on the Displacements of Composite Beams. J. Reinf. Plast. Compos. 2002, 21, 1517–1541. [Google Scholar] [CrossRef]
Figure 1.
(a) Prismatic Beam, (b) square envelope, and (c) rectangular envelope. Note: all dimensions are in mm.
Figure 1.
(a) Prismatic Beam, (b) square envelope, and (c) rectangular envelope. Note: all dimensions are in mm.

Figure 2.
Beam cross sections used to fill the square and rectangular envelopes.

Figure 3.
Normalized axial stiffness versus mass ratio index for CFRP materials of construction: (a) square beam, (b) circular tube, and (c) I-beam.
Figure 3.
Normalized axial stiffness versus mass ratio index for CFRP materials of construction: (a) square beam, (b) circular tube, and (c) I-beam.

Figure 4.
Normalized bending performance index: (a) square CFRP cross section, (b) performance comparison for different cross-sectional shapes using CFRP materials, (c) performance comparison for different cross-sectional shapes using GFRP materials, and (d) performance comparison for various cross-sections constructed from CFRP and GFRP materials.

Figure 5.
Normalized torsional performance index: (a) comparison of square and circular cross-sections using CFRP and (b) comparison of square and circular cross sections with CFRP and GFRP materials.
Figure 5.
Normalized torsional performance index: (a) comparison of square and circular cross-sections using CFRP and (b) comparison of square and circular cross sections with CFRP and GFRP materials.

Figure 6.
Normalized bending stiffness versus mass ratio: (a) in the Y-direction and (b) in the Z-direction.
Figure 6.
Normalized bending stiffness versus mass ratio: (a) in the Y-direction and (b) in the Z-direction.

Figure 7.
Finite element model geometry, applied loading, and boundary conditions (developed FE models consist of up to ~72,000 nodes and ~68,000 elements depending on laminate thickness).
Figure 7.
Finite element model geometry, applied loading, and boundary conditions (developed FE models consist of up to ~72,000 nodes and ~68,000 elements depending on laminate thickness).

Figure 8.
Ratio of shear deformation to total deformation.

Figure 9.
Multi-cell composite beams with rectangular and I-beam cross sections. Each of the single cells has the dimensions of the rectangular envelope (40 mm by 60 mm).
Figure 9.
Multi-cell composite beams with rectangular and I-beam cross sections. Each of the single cells has the dimensions of the rectangular envelope (40 mm by 60 mm).

Figure 10.
5-DOF robot manipulator used in plant phenotyping.

Figure 11.
Methodology for utilizing the design charts.

Figure 12.
Proposed multi-cell beams (based on the design charts) subjected to bending loads. Cross sections are three rectangular beams (RRR), three oval beams (OOO), and three I-beams (III).
Figure 12.
Proposed multi-cell beams (based on the design charts) subjected to bending loads. Cross sections are three rectangular beams (RRR), three oval beams (OOO), and three I-beams (III).

Figure 13.
Applied boundary conditions and loading of beam subjected to torsional loading (FE models consist of up to ~61,000 nodes and ~57,400 elements depending on laminate thickness).
Figure 13.
Applied boundary conditions and loading of beam subjected to torsional loading (FE models consist of up to ~61,000 nodes and ~57,400 elements depending on laminate thickness).

Table 1.
Bending and torsional results obtained using analytical and FEA approaches (FD = 0°).
| No. of Layers | FEA (rad) | FEA (mm) | Analytical (rad) | Analytical (mm) | FEA | Design Charts | DEA | Design Charts |
|---|---|---|---|---|---|---|---|---|
| 8 | 2.17 × 10⁻³ | 2.80 | 1.99 × 10⁻³ | 2.43 | 0.5 | 0.53 | 0.50 | 0.53 |
| 12 | 1.43 × 10⁻³ | 1.87 | 1.37 × 10⁻³ | 1.68 | 0.76 | 0.77 | 0.75 | 0.77 |
| 16 | 1.09 × 10⁻³ | 1.41 | 1.07 × 10⁻³ | 1.31 | 1 | 1 | 1 | 1 |
| 20 | 9.04 × 10⁻⁴ | 1.16 | 8.92 × 10⁻⁴ | 1.08 | 1.21 | 1.20 | 1.21 | 1.21 |
| 24 | 7.76 × 10⁻⁴ | 0.99 | 7.72 × 10⁻⁴ | 0.94 | 1.4 | 1.38 | 1.42 | 1.39 |
Table 2.
Bending and torsional results obtained using analytical and FEA approaches (FD = 10°).
| No. of Layers | FEA (rad) | FEA (mm) | Analytical (rad) | Analytical (mm) | FEA | Design Charts | FEA | Design Charts |
|---|---|---|---|---|---|---|---|---|
| 8 | 1.44 × 10⁻³ | 2.94 | 1.35 × 10⁻³ | 2.66 | 0.75 | 0.80 | 0.48 | 0.49 |
| 12 | 9.81 × 10⁻⁴ | 1.95 | 9.27 × 10⁻⁴ | 1.83 | 1.11 | 1.17 | 0.72 | 0.71 |
| 16 | 7.44 × 10⁻⁴ | 1.49 | 7.20 × 10⁻⁴ | 1.42 | 1.47 | 1.51 | 0.94 | 0.92 |
| 20 | 6.10 × 10⁻⁴ | 1.23 | 5.97 × 10⁻⁴ | 1.17 | 1.79 | 1.82 | 1.14 | 1.11 |
| 24 | 5.23 × 10⁻⁴ | 1.06 | 5.17 × 10⁻⁴ | 1.01 | 2.08 | 2.10 | 1.33 | 1.28 |
Table 3.
Bending and torsional results obtained using analytical and FEA approaches (FD = 20°).
| No. of Layers | FEA (rad) | FEA (mm) | Analytical (rad) | Analytical (mm) | FEA | Design Charts | FEA | Design Charts |
|---|---|---|---|---|---|---|---|---|
| 8 | 7.80 × 10⁻⁴ | 3.77 | 7.48 × 10⁻⁴ | 3.63 | 1.40 | 1.48 | 0.37 | 0.36 |
| 12 | 5.32 × 10⁻⁴ | 2.54 | 5.09 × 10⁻⁴ | 2.48 | 2.05 | 2.18 | 0.55 | 0.52 |
| 16 | 4.10 × 10⁻⁴ | 1.96 | 3.94 × 10⁻⁴ | 1.92 | 2.66 | 2.81 | 0.71 | 0.68 |
| 20 | 3.37 × 10⁻⁴ | 1.61 | 3.27 × 10⁻⁴ | 1.59 | 3.23 | 3.39 | 0.87 | 0.82 |
| 24 | 2.88 × 10⁻⁴ | 1.39 | 2.82 × 10⁻⁴ | 1.37 | 3.78 | 3.92 | 1.01 | 0.95 |
Table 4.
Difference between the FEA and analytical method.
| Layers | (% Difference) | (% Difference) | (% Difference) | (% Difference) | (% Difference) | (% Difference) |
|---|---|---|---|---|---|---|
| 8 | 5.66 | 6.25 | 5.40 | 5.66 | 2.04 | 2.77 |
| 12 | 1.29 | 5.12 | 5.96 | 5.60 | 1.40 | 5.76 |
| 16 | 0 | 2.64 | 5.33 | 0 | 2.17 | 5.88 |
| 20 | 0.83 | 1.64 | 4.72 | 0 | 2.70 | 6.10 |
| 24 | 1.45 | 0.95 | 3.57 | 2.15 | 3.9 | 6.31 |
Table 5.
FEA results—maximum deflections under bending loading for the proposed multi-cell beams (using rectangular envelope).
Table 5.
FEA results—maximum deflections under bending loading for the proposed multi-cell beams (using rectangular envelope).
| 1.51% difference 3.79% difference 3.79% difference 0.76% difference | 7.95% difference 2.27% difference 3.41% difference |
Table 6.
FEA results—maximum deflections under bending loading for the proposed multi-cell beams (using square envelope).
Table 6.
FEA results—maximum deflections under bending loading for the proposed multi-cell beams (using square envelope).
| 0.76% difference 0.76% difference 5.34% difference | 3.08% difference 6.15% difference |
Table 7.
Maximum angle of twist for single cell beam subjected to torsion.
| Beam Cross-Section and Layup | Angle of Twist—Design Chart (rad) | Angle of Twist—FEA (rad) | % Difference | ||
|---|---|---|---|---|---|
| 7.35 | 1.46 | 1.50 × 10⁻³ | 1.60 × 10⁻³ | 6.67 | |
| 5.00 | 0.96 | 2.10 × 10⁻³ | 2.30 × 10⁻³ | 9.52 | |
| 4.29 | 1 | 2.50 × 10⁻³ | 2.70 × 10⁻³ | 8.00 | |
| 2.61 | 0.59 | 4.10 × 10⁻³ | 4.30 × 10⁻³ | 4.88 | |
| 1.20 | 1.23 | 8.90 × 10⁻³ | 9.00 × 10⁻³ | 1.12 |
Publisher’s Note: MDPI stays neutral with regard to jurisdictional claims in published maps and institutional affiliations. |
© 2021 by the authors. Licensee MDPI, Basel, Switzerland. This article is an open access article distributed under the terms and conditions of the Creative Commons Attribution (CC BY) license (https://creativecommons.org/licenses/by/4.0/).
Share and Cite
MDPI and ACS Style
Moazed, R.; Khozeimeh, M.A.; Fotouhi, R. Simplified Approach for Parameter Selection and Analysis of Carbon and Glass Fiber Reinforced Composite Beams. J. Compos. Sci. 2021, 5, 220. https://doi.org/10.3390/jcs5080220
AMA Style
Moazed R, Khozeimeh MA, Fotouhi R. Simplified Approach for Parameter Selection and Analysis of Carbon and Glass Fiber Reinforced Composite Beams. Journal of Composites Science. 2021; 5(8):220. https://doi.org/10.3390/jcs5080220
Chicago/Turabian StyleMoazed, Reza, Mohammad Amir Khozeimeh, and Reza Fotouhi. 2021. "Simplified Approach for Parameter Selection and Analysis of Carbon and Glass Fiber Reinforced Composite Beams" Journal of Composites Science 5, no. 8: 220. https://doi.org/10.3390/jcs5080220