Annexin A1 May Induce Pancreatic Cancer Progression as a Key Player of Extracellular Vesicles Effects as Evidenced in the In Vitro MIA PaCa-2 Model System

 , , ,
, , ,  ,
, 
 , and
, and 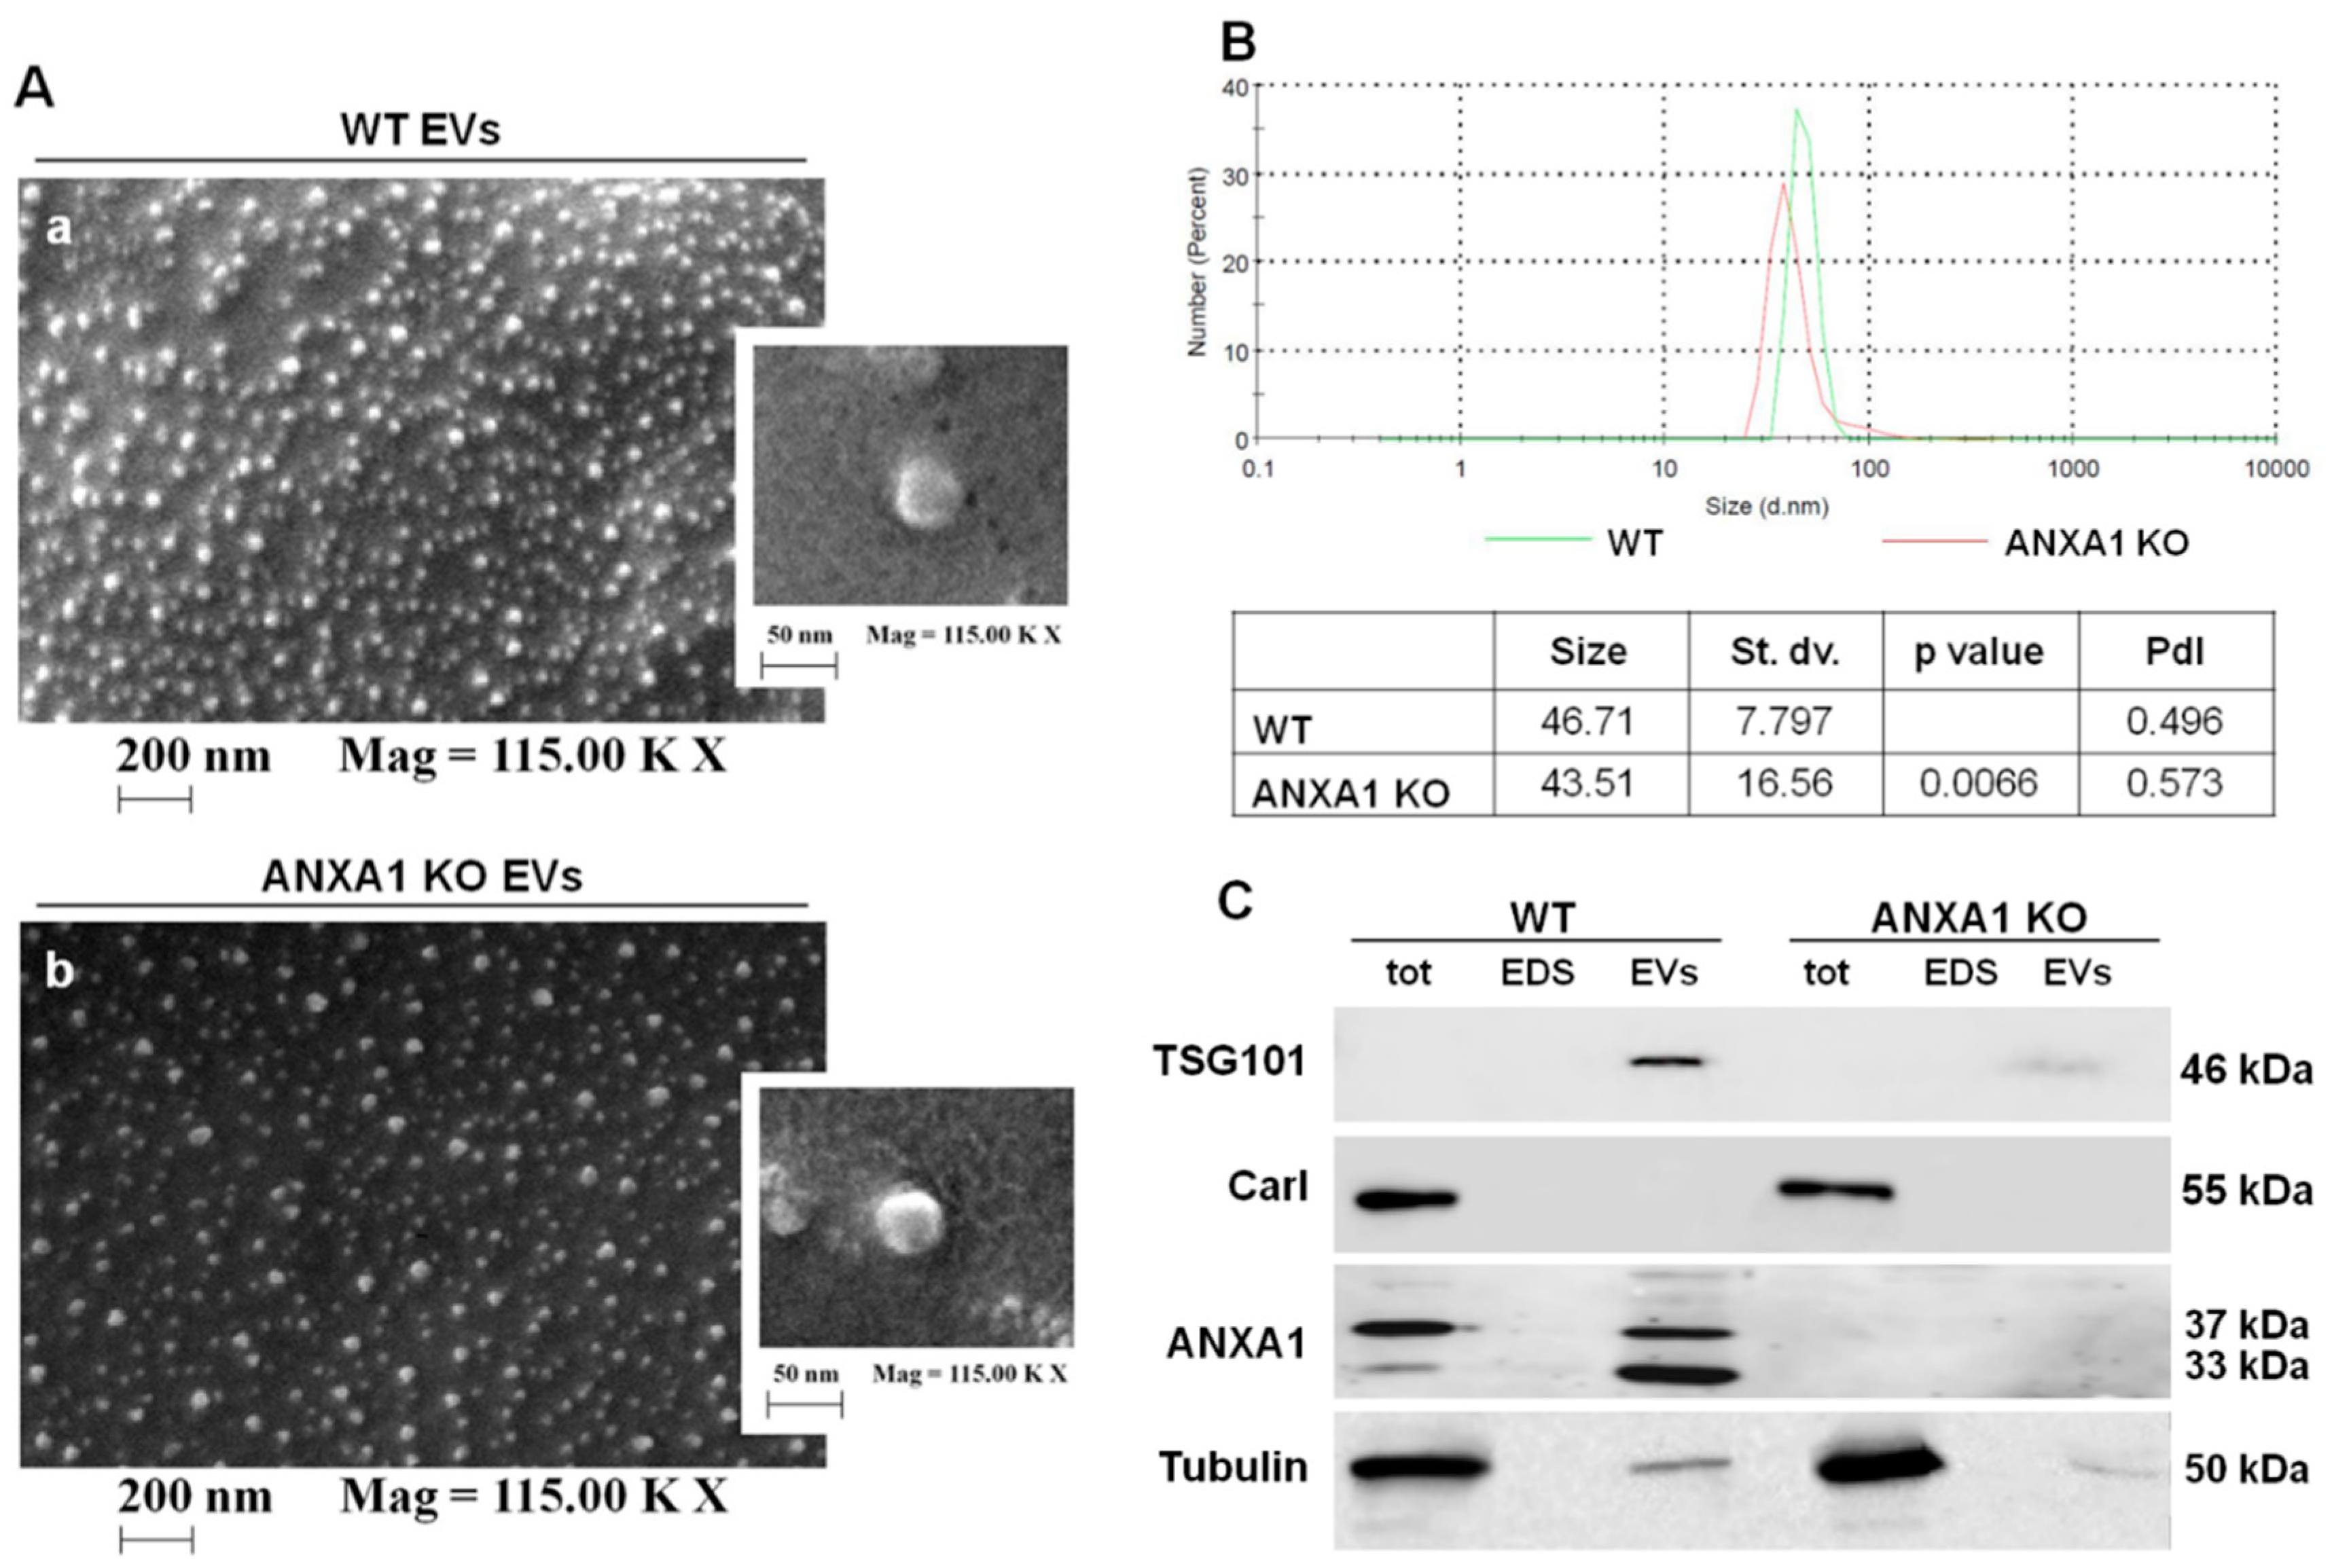
Abstract
:1. Introduction
2. Results
2.1. Characterization of EVs Released from WT and ANXA1 KO MIA PaCa-2 Cells
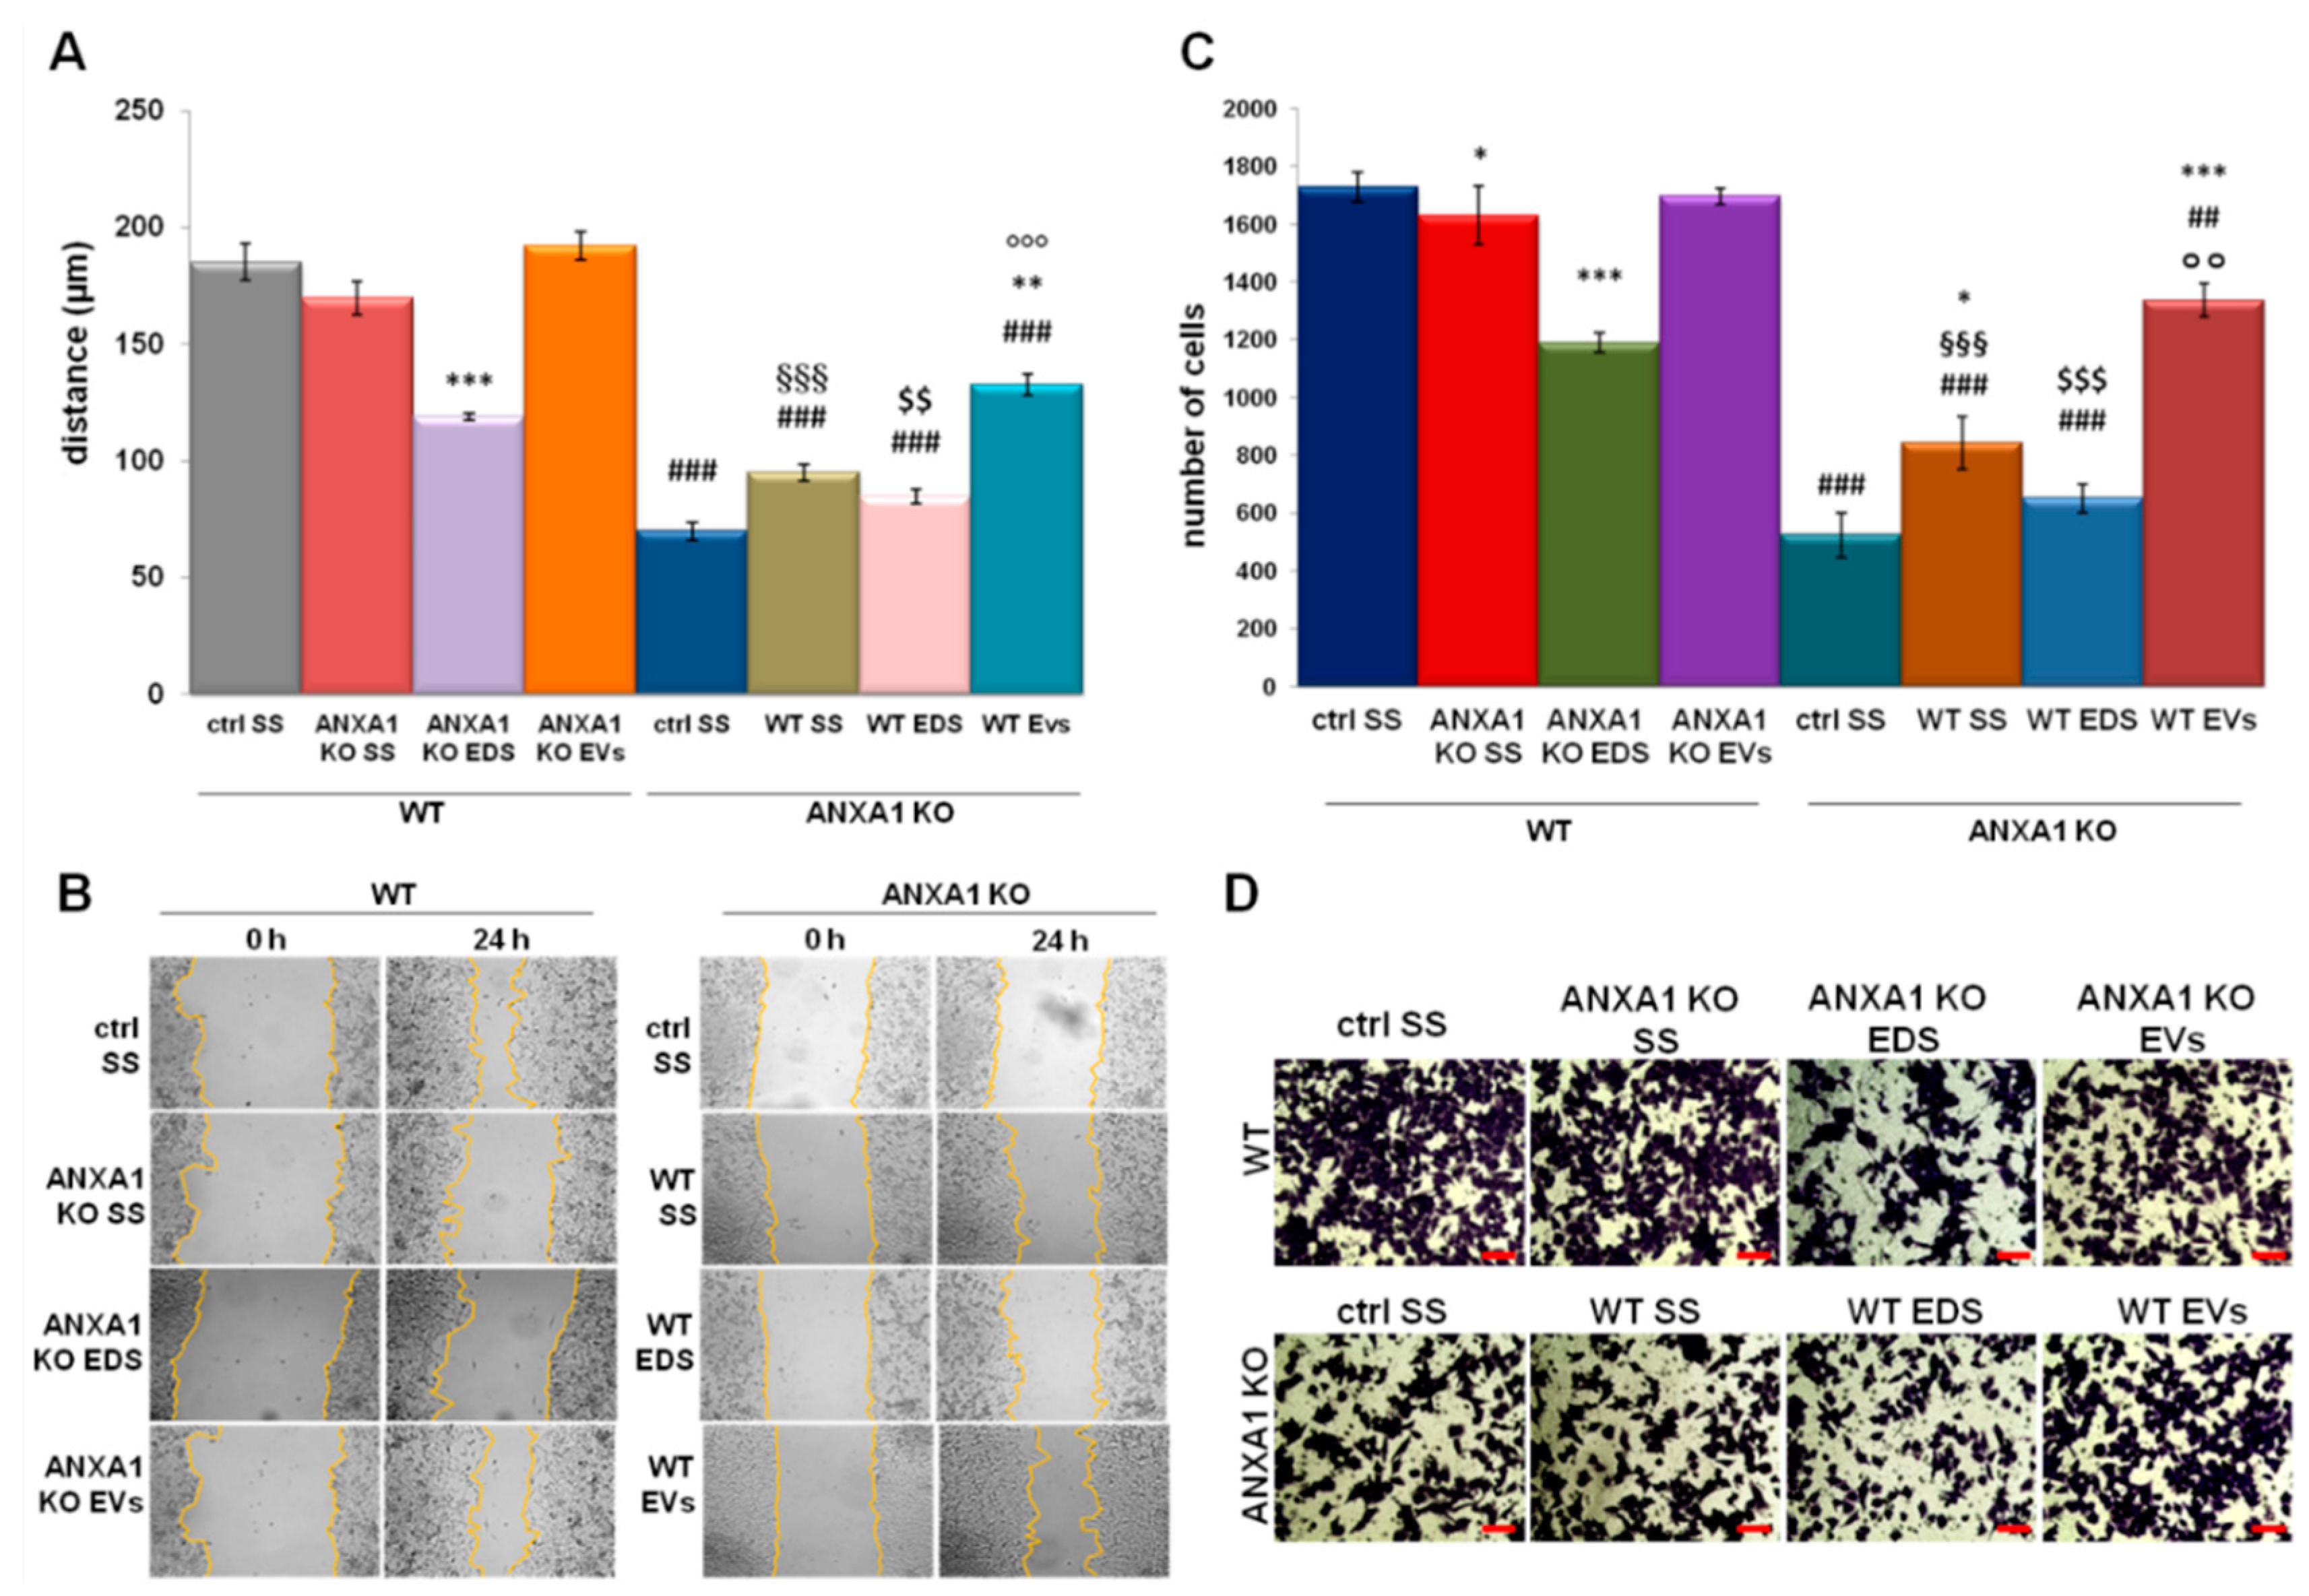
2.2. EVs Isolated from WT MIA PaCa-2 Cells Increase Cell Migration and Invasion Rate
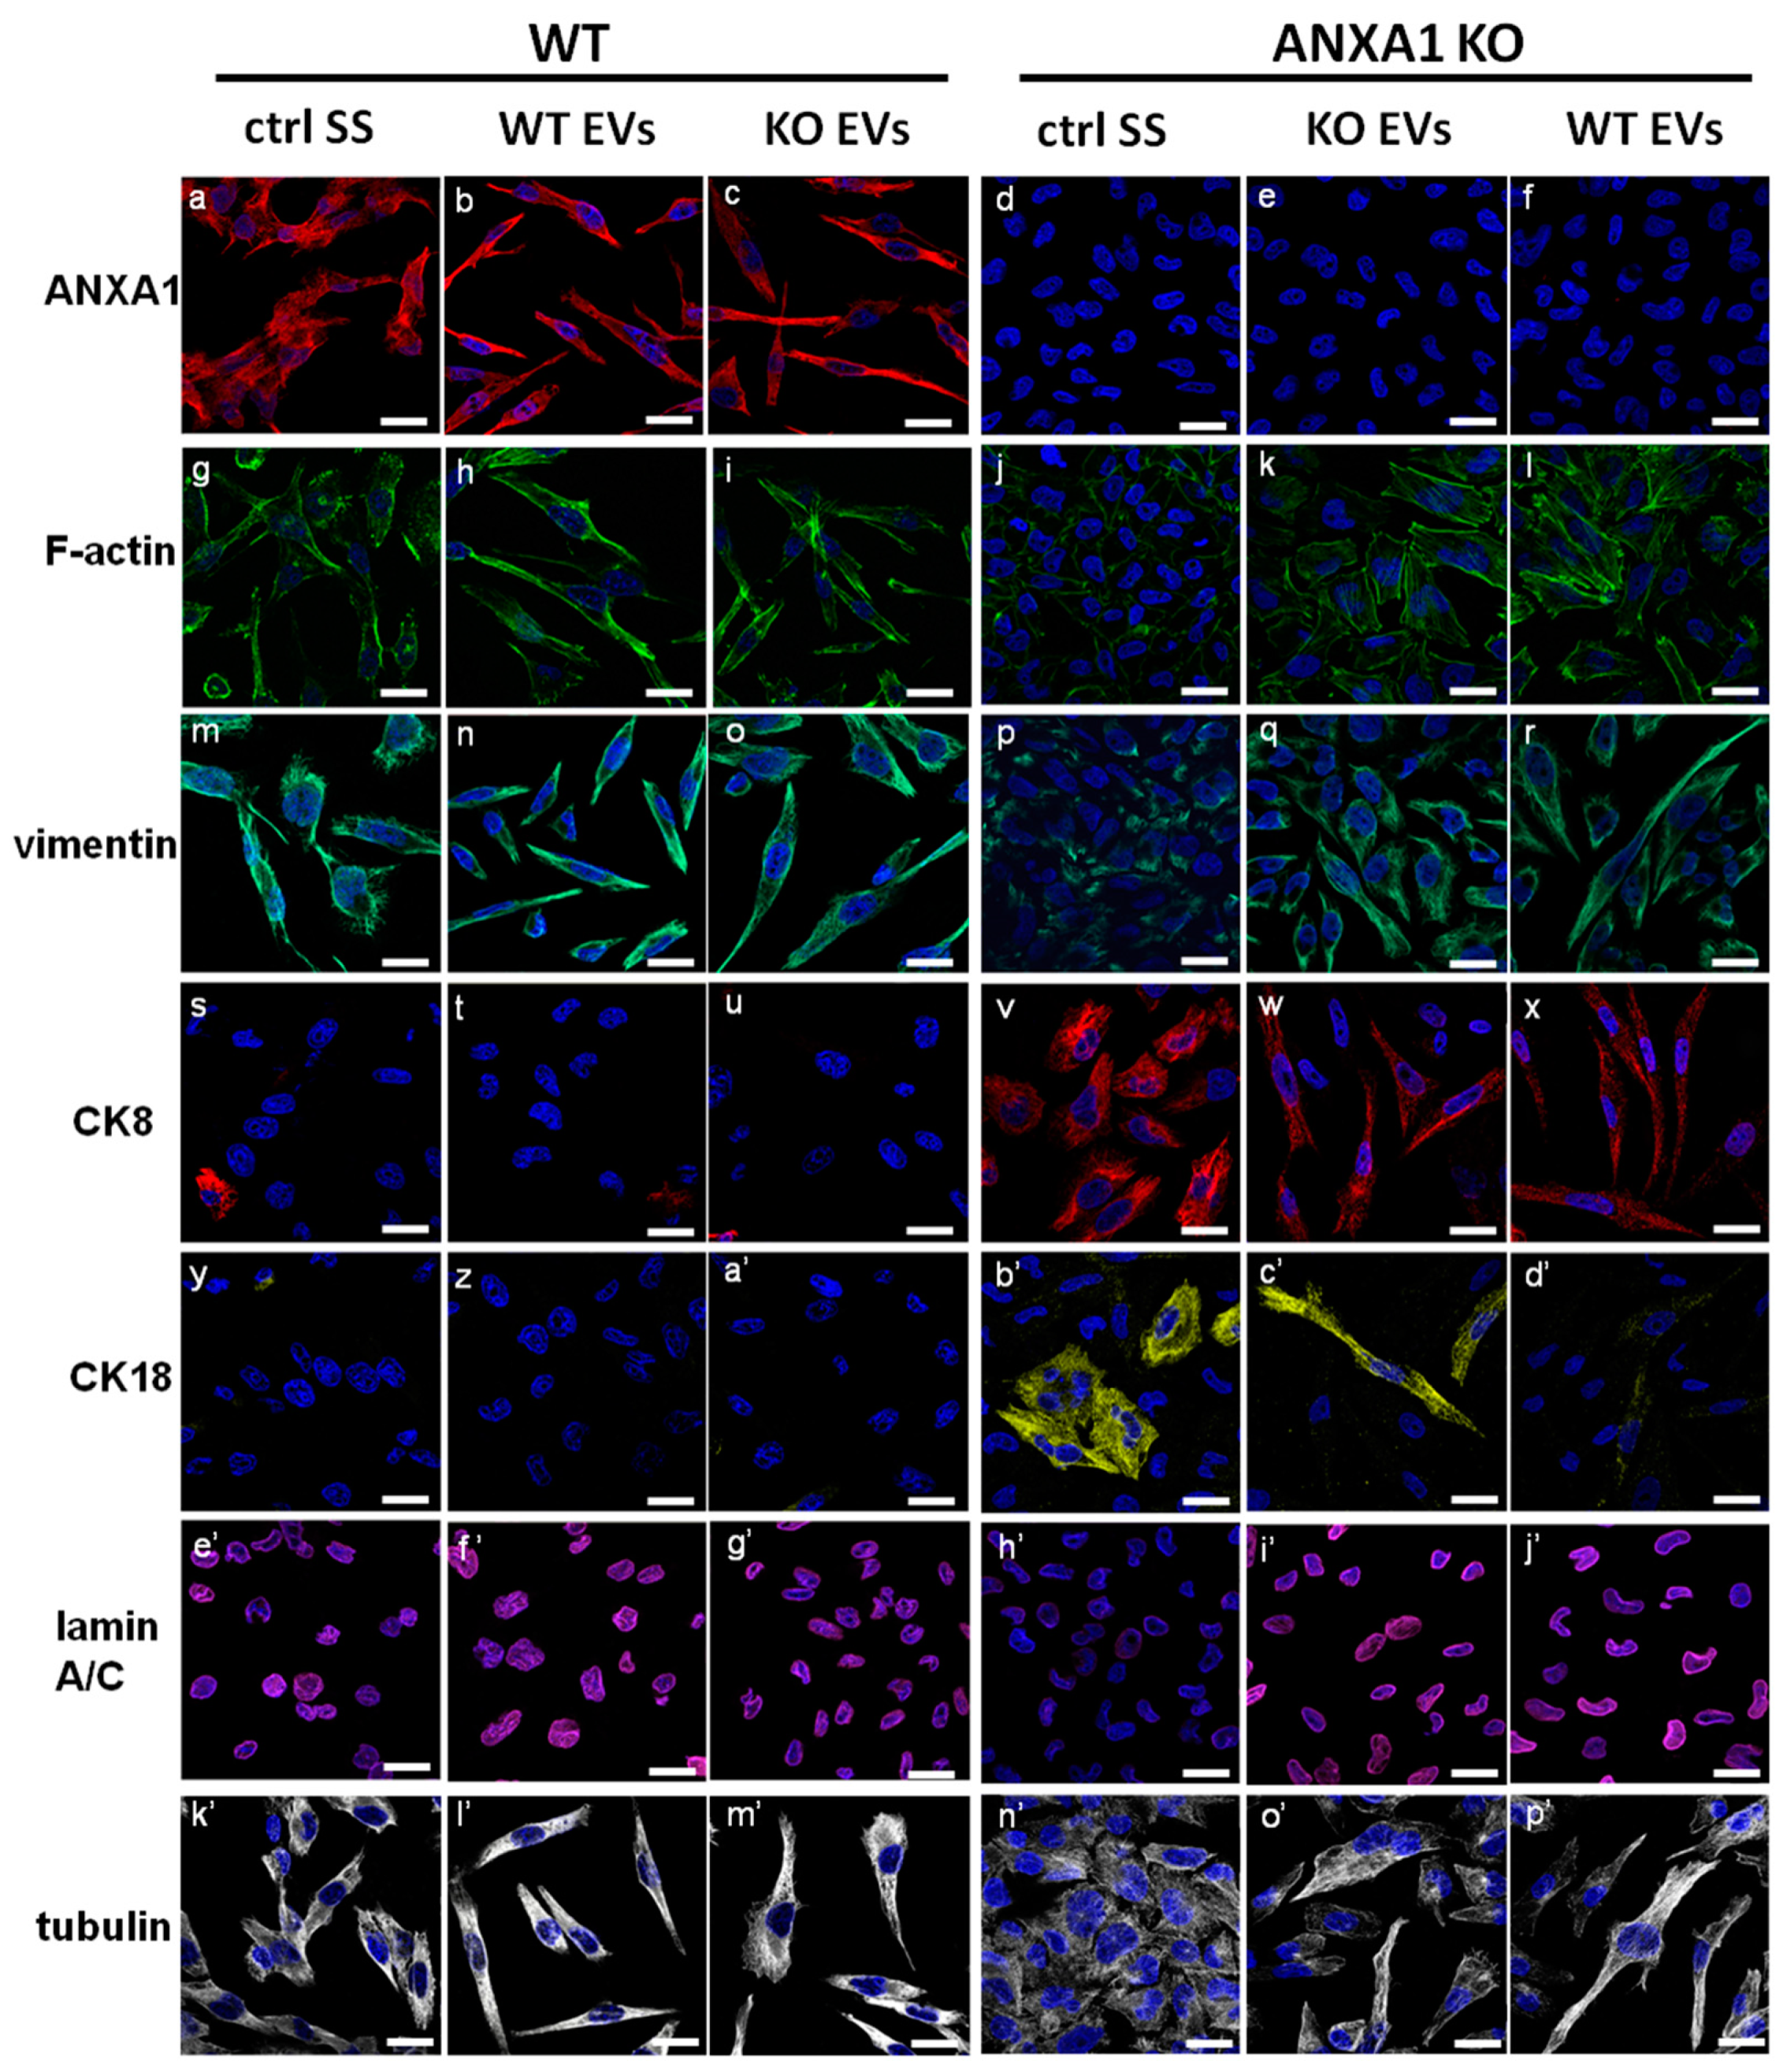
2.3. ANXA1-Containing EVs Induce a Switch of Phenotype in PC Cells
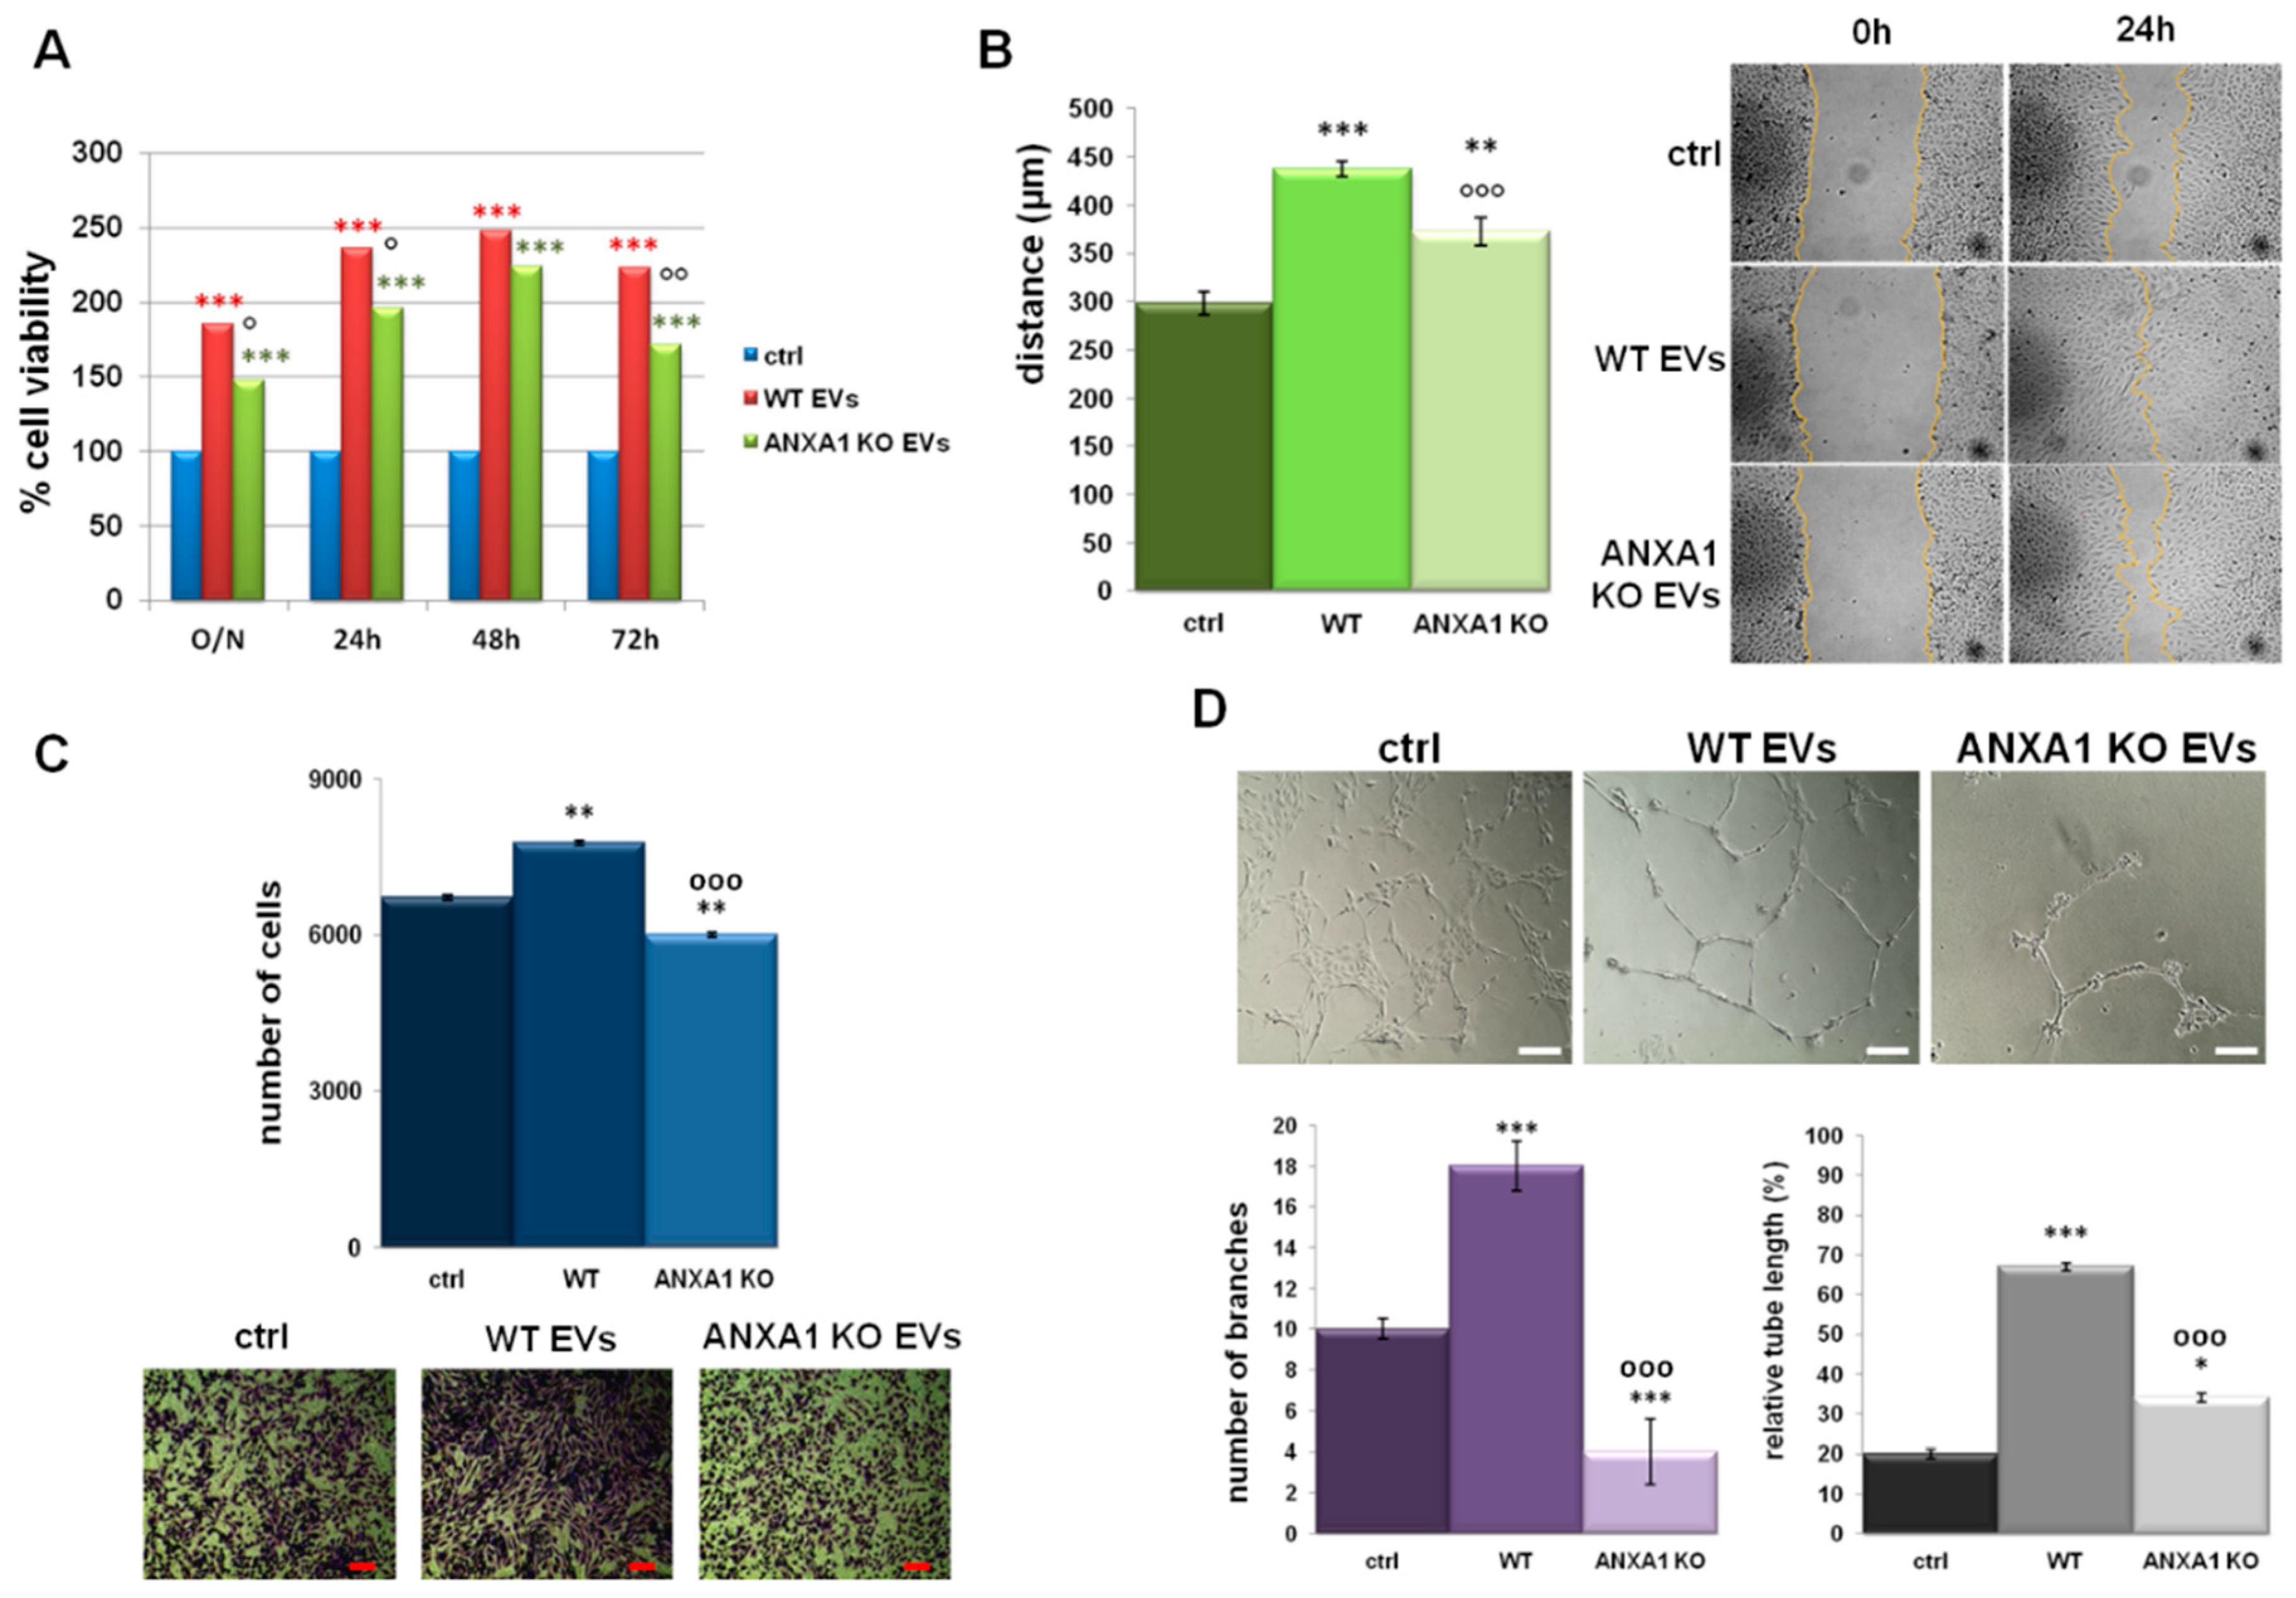
2.4. Effects of EVs on Endothelial Cell Activation
3. Discussion
4. Material and Methods
4.1. Cell Culture
4.2. Exosomes Enrichment
4.3. Field Emission-Scanning Electron Microscope (FE-SEM) Analysis
4.4. Dynamic Light Scattering (DLS) Analysis
4.5. Western Blotting
4.6. Wound-Healing Assay
4.7. Invasion Assay
4.8. MTT Assay
4.9. Confocal Microscopy
4.10. Tube Formation Assay
4.11. Statistical Analysis
5. Conclusions
Supplementary Materials
Author Contributions
Funding
Conflicts of Interest
References
- Lim, L.H.; Pervaiz, S. Annexin 1: The new face of an old molecule. FASEB J. 2007, 21, 968–975. [Google Scholar] [CrossRef] [PubMed]
- Bizzarro, V.; Petrella, A.; Parente, L. Annexin A1: Novel roles in skeletal muscle biology. J. Cell Physiol. 2012, 227, 3007–3015. [Google Scholar] [CrossRef] [PubMed]
- Boudhraa, Z.; Bouchon, B.; Viallard, C.; D’Incan, M.; Degoul, F. Annexin A1 localization and its relevance to cancer. Clin. Sci. (Lond.) 2016, 130, 205–220. [Google Scholar] [CrossRef] [PubMed]
- Guo, C.; Liu, S.; Sun, M.Z. Potential role of Anxa1 in cancer. Future Oncol. 2013, 9, 1773–1793. [Google Scholar] [CrossRef] [PubMed]
- Ye, R.D.; Boulay, F.; Wang, J.M.; Dahlgren, C.; Gerard, C.; Parmentier, M.; Serhan, C.N.; Murphy, P.M. International Union of Basic and Clinical Pharmacology. LXXIII. Nomenclature for the formyl peptide receptor (FPR) family. Pharmacol. Rev. 2009, 61, 119–161. [Google Scholar] [CrossRef] [PubMed]
- Bizzarro, V.; Belvedere, R.; Milone, M.R.; Pucci, B.; Lombardi, R.; Bruzzese, F.; Popolo, A.; Parente, L.; Budillon, A.; Petrella, A. Annexin A1 is involved in the acquisition and maintenance of a stem cell-like/aggressive phenotype in prostate cancer cells with acquired resistance to zoledronic acid. Oncotarget 2015, 6, 25076–25092. [Google Scholar] [CrossRef] [PubMed] [Green Version]
- Belvedere, R.; Bizzarro, V.; Popolo, A.; Dal Piaz, F.; Vasaturo, M.; Picardi, P.; Parente, L.; Petrella, A. Role of intracellular and extracellular annexin A1 in migration and invasion of human pancreatic carcinoma cells. BMC Cancer 2014, 14, 961. [Google Scholar] [CrossRef] [PubMed]
- Bai, X.F.; Ni, X.G.; Zhao, P.; Liu, S.M.; Wang, H.X.; Guo, B.; Zhou, L.P.; Liu, F.; Zhang, J.S.; Wang, K.; et al. Overexpression of annexin 1 in pancreatic cancer and its clinical significance. World J. Gastroenterol. 2004, 10, 1466–1470. [Google Scholar] [CrossRef]
- Chen, C.Y.; Shen, J.Q.; Wang, F.; Wan, R.; Wang, X.P. Prognostic significance of annexin A1 expression in pancreatic ductal adenocarcinoma. Asian Pac. J. Cancer Prev. 2012, 13, 4707–4712. [Google Scholar] [CrossRef]
- Komoto, M.; Nakata, B.; Nishii, T.; Kawajiri, H.; Shinto, O.; Amano, R.; Yamada, N.; Yashiro, M.; Hirakawa, K. In vitro and in vivo evidence that a combination of lapatinib plus S-1 is a promising treatment for pancreatic cancer. Cancer Sci. 2010, 101, 468–473. [Google Scholar] [CrossRef] [Green Version]
- Belvedere, R.; Bizzarro, V.; Forte, G.; Dal Piaz, F.; Parente, L.; Petrella, A. Annexin A1 contributes to pancreatic cancer cell phenotype, behaviour and metastatic potential independently of Formyl Peptide Receptor pathway. Sci Rep. 2016, 14, 29660. [Google Scholar] [CrossRef] [PubMed]
- Belvedere, R.; Saggese, P.; Pessolano, E.; Memoli, D.; Bizzarro, V.; Rizzo, F.; Parente, L.; Weisz, A.; Petrella, A. miR-196a Is Able to Restore the Aggressive Phenotype of Annexin A1 Knock-Out in Pancreatic Cancer Cells by CRISPR/Cas9 Genome Editing. Int. J. Mol. Sci. 2018, 19, 1967. [Google Scholar] [CrossRef] [PubMed]
- Greening, D.W.; Gopal, S.K.; Mathias, R.A.; Liu, L.; Sheng, J.; Zhu, H.J.; Simpson, R.J. Emerging roles of exosomes during epithelial-mesenchymal transition and cancer progression. Semin. Cell Dev. Biol. 2015, 40, 60–71. [Google Scholar] [CrossRef] [PubMed]
- Kowal, J.; Arras, G.; Colombo, M.; Jouve, M.; Morath, J.P.; Primdal-Bengtson, B.; Dingli, F.; Loew, D.; Tkach, M.; Théry, C. Proteomic comparison defines novel markers to characterize heterogeneous populations of extracellular vesicle subtypes. Proc. Natl. Acad. Sci. USA 2016, 113, E968–E977. [Google Scholar] [CrossRef] [PubMed] [Green Version]
- Kahlert, C.; Kalluri, R. Exosomes in Tumor Microenvironment Influence Cancer Progression and Metastasis. J. Mol. Med. (Berl.) 2014, 91, 431–437. [Google Scholar] [CrossRef] [PubMed]
- Rahbari, M.; Rahbari, N.; Reissfelder, C.; Weitz, J.; Kahlert, C. Exosomes: Novel implications in diagnosis and treatment of gastrointestinal cancer. Langenbecks Arch. Surg. 2016, 401, 1097–1110. [Google Scholar] [CrossRef] [PubMed]
- Costa-Silva, B.; Aiello, N.M.; Ocean, A.J.; Singh, S.; Zhang, H.; Thakur, B.K.; Becker, A.; Hoshino, A.; Mark, M.T.; Molina, H.; et al. Pancreatic cancer exosomes initiate pre-metastatic niche formation in the liver. Nat. Cell Biol. 2015, 17, 816–826. [Google Scholar] [CrossRef] [Green Version]
- Armstrong, E.A.; Beal, E.W.; Chakedis, J.; Paredes, A.Z.; Moris, D.; Pawlik, T.M.; Schmidt, C.R.; Dillhoff, M.E. Exosomes in Pancreatic Cancer: From Early Detection to Treatment. J. Gastrointest. Surg. 2018, 22, 737–750. [Google Scholar] [CrossRef]
- Yan, Y.; Fu, G.; Ming, L. Role of exosomes in pancreatic cancer. Oncol. Lett. 2018, 15, 7479–7488. [Google Scholar] [CrossRef]
- White, I.J.; Bailey, L.M.; Aghakhani, M.R.; Moss, S.E.; Futter, C.E. EGF stimulates annexin 1-dependent inward vesiculation in a multivesicular endosome subpopulation. EMBO J. 2006, 25, 1–12. [Google Scholar] [CrossRef]
- Leoni, G.; Neumann, P.A.; Kamaly, N.; Quiros, M.; Nishio, H.; Jones, H.R.; Sumagin, R.; Hilgarth, R.S.; Alam, A.; Fredman, G.; et al. Annexin A1-containing extracellular vesicles and polymeric nanoparticles promote epithelial wound repair. J. Clin. Investig. 2015, 125, 1215–1227. [Google Scholar] [CrossRef] [PubMed]
- Mallawaaratchy, D.M.; Hallal, S.; Russell, B.; Ly, L.; Ebrahimkhani, S.; Wei, H.; Christopherson, R.I.; Buckland, M.E.; Kaufman, K.L. Comprehensive proteome profiling of glioblastoma-derived extracellular vesicles identifies markers for more aggressive disease. J. Neurooncol. 2017, 131, 233–244. [Google Scholar] [CrossRef] [PubMed]
- Raulf, N.; Lucarelli, P.; Thavaraj, S.; Brown, S.; Vicencio, J.M.; Sauter, T.; Tavassoli, M. Annexin A1 regulates EGFR activity and alters EGFR-containing tumour-derived exosomes in head and neck cancers. Eur. J. Cancer 2018, 102, 52–68. [Google Scholar] [CrossRef] [PubMed]
- Kruger, S.; Abd Elmageed, Z.Y.; Hawke, D.H.; Wörner, P.M.; Jansen, D.A.; Abdel-Mageed, A.B.; Alt, E.U.; Izadpanah, R. Molecular characterization of exosome-like vesicles from breast cancer cells. BMC Cancer 2014, 14, 44. [Google Scholar] [CrossRef] [PubMed]
- Willms, E.; Johansson, H.J.; Mäger, I.; Lee, Y.; Blomberg, K.E.; Sadik, M.; Alaarg, A.; Smith, C.I.; Lehtiö, J.; El Andaloussi, S.; et al. Cells release subpopulations of exosomes with distinct molecular and biological properties. Sci. Rep. 2016, 6, 22519. [Google Scholar] [CrossRef] [PubMed] [Green Version]
- Jeppesen, D.K.; Hvam, M.L.; Primdahl-Bengtson, B.; Boysen, A.T.; Whitehead, B.; Dyrskjøt, L.; Orntoft, T.F.; Howard, K.A.; Ostenfeld, M.S. Comparative analysis of discrete exosome fractions obtained by differential centrifugation. J. Extracell. Vesicles 2014, 3, 25011. [Google Scholar] [CrossRef] [PubMed] [Green Version]
- Burke, B.; Stewart, C.L. The nuclear lamins: Flexibility in function. Nat. Rev. Mol. Cell Biol. 2013, 14, 13–24. [Google Scholar] [CrossRef] [PubMed]
- Yi, M.; Schnitzer, J.E. Impaired tumor growth, metastasis, angiogenesis and wound healing in annexin A1-null mice. Proc. Natl. Acad. Sci. USA 2009, 106, 17886–17891. [Google Scholar] [CrossRef] [Green Version]
- Lacerda, J.Z.; Drewes, C.C.; Mimura, K.K.O.; Zanon, C.F.; Ansari, T.; Gil, C.D.; Greco, K.V.; Farsky, S.H.P.; Oliani, S.M. Annexin A12-26 Treatment Improves Skin Heterologous Transplantation by Modulating Inflammation and Angiogenesis Processes. Front. Pharmacol. 2018, 9, 1015. [Google Scholar] [CrossRef]
- Sung, B.H.; Ketova, T.; Hoshino, D.; Zijlstra, A.; Weaver, A.M. Directional cell movement through tissues is controlled by exosome secretion. Nat. Commun. 2015, 6, 7164. [Google Scholar] [CrossRef]
- Tkach, M.; Théry, C. Communication by Extracellular Vesicles: Where We Are and Where We Need to Go. Cell 2016, 164, 1226–1232. [Google Scholar] [CrossRef] [PubMed]
- Yu, Z.; Zhao, S.; Ren, L.; Wang, L.; Chen, Z.; Hoffman, R.M.; Zhou, J. Pancreatic cancer-derived exosomes promote tumor metastasis and liver pre-metastatic niche formation. Oncotarget 2017, 8, 63461–63483. [Google Scholar] [CrossRef] [PubMed] [Green Version]
- Salas-Cortes, L.; Ye, F.; Tenza, D.; Wilhelm, C.; Theos, A.; Louvard, D.; Raposo, G.; Coudrier, E. Myosin Ib modulates the morphology and the protein transport within multi-vesicular sorting endosomes. J. Cell Sci. 2005, 118 Pt 20, 4823–4832. [Google Scholar] [CrossRef] [PubMed] [Green Version]
- Rosengarth, A.; Gerke, V.; Luecke, H. X-ray structure of full-length annexin 1 and implications for membrane aggregation. J. Mol. Biol. 2001, 306, 489–498. [Google Scholar] [CrossRef] [PubMed]
- Théry, C.; Zitvogel, L.; Amigorena, S. Exosomes: Composition, biogenesis and function. Nat. Rev. Immunol. 2002, 2, 569–579. [Google Scholar] [CrossRef] [PubMed]
- Vong, L.; D’Acquisto, F.; Pederzoli-Ribeil, M.; Lavagno, L.; Flower, R.J.; Witko-Sarsat, V.; Perretti, M. Annexin 1 cleavage in activated neutrophils: A pivotal role for proteinase 3. J. Biol. Chem. 2007, 282, 29998–30004. [Google Scholar] [CrossRef] [PubMed]
- Blume, K.E.; Soeroes, S.; Keppeler, H.; Stevanovic, S.; Kretschmer, D.; Rautenberg, M.; Wesselborg, S.; Lauber, K. Cleavage of annexin A1 by ADAM10 during secondary necrosis generates a monocytic “find-me” signal. J. Immunol. 2012, 188, 135–145. [Google Scholar] [CrossRef]
- Pederzoli-Ribeil, M.; Maione, F.; Cooper, D.; Al-Kashi, A.; Dalli, J.; Perretti, M.; D’Acquisto, F. Design and characterization of a cleavage-resistant Annexin A1 mutant to control inflammation in the microvasculature. Blood 2010, 116, 4288–4296. [Google Scholar] [CrossRef] [Green Version]
- Vago, J.P.; Tavares, L.P.; Sugimoto, M.; Lima, G.L.; Galvão, I.; de Caux, T.R.; Lima, K.M.; Ribeiro, A.L.; Carneiro, F.S.; Nunes, F.F.; et al. Proresolving Actions of Synthetic and Natural Protease Inhibitors Are Mediated by Annexin A1. J. Immunol. 2016, 196, 1922–1932. [Google Scholar] [CrossRef] [Green Version]
- Beuran, M.; Negoi, I.; Paun, S.; Ion, A.D.; Bleotu, C.; Negoi, R.I.; Hostiuc, S. The epithelial to mesenchymal transition in pancreatic cancer: A systematic review. Pancreatology 2015, 15, 217–225. [Google Scholar] [CrossRef]
- Boudhraa, Z.; Merle, C.; Mazzocut, D.; Chezal, J.M.; Chambon, C.; Miot-Noirault, E.; Theisen, M.; Bouchon, B.; Degoul, F. Characterization of pro-invasive mechanisms and N-terminal cleavage of ANXA1 in melanoma. Arch. Dermatol. Res. 2014, 306, 903–914. [Google Scholar] [CrossRef] [PubMed]
- Chiba, M.; Kubota, S.; Sato, K.; Monzen, S. Exosomes released from pancreatic cancer cells enhance angiogenic activities via dynamin-dependent endocytosis in endothelial cells in vitro. Sci. Rep. 2018, 8, 11972. [Google Scholar] [CrossRef] [PubMed]
- Rajagopal, C.; Harikumar, K.B. The Origin and Functions of Exosomes in Cancer. Front. Oncol. 2018, 8, 66. [Google Scholar] [CrossRef] [PubMed]
- Ludwig, N.; Yerneni, S.S.; Razzo, B.M.; Whiteside, T.L. Exosomes from HNSCC Promote Angiogenesis through Reprogramming of Endothelial Cells. Mol. Cancer Res. 2018. [Google Scholar] [CrossRef] [PubMed]
- Ludwig, N.; Whiteside, T.L. Potential roles of tumor-derived exosomes in angiogenesis. Expert. Opin. Ther. Targets 2018, 22, 409–417. [Google Scholar] [CrossRef] [PubMed]
- Todorova, D.; Simoncini, S.; Lacroix, R.; Sabatier, F.; Dignat-George, F. Extracellular Vesicles in Angiogenesis. Circ. Res. 2017, 120, 1658–1673. [Google Scholar] [CrossRef] [PubMed] [Green Version]
- Belvedere, R.; Bizzarro, V.; Parente, L.; Petrella, F.; Petrella, A. The Pharmaceutical Device Prisma® Skin Promotes in Vitro Angiogenesis through Endothelial to Mesenchymal Transition during Skin Wound Healing. Int. J. Mol. Sci. 2017, 18, 1614. [Google Scholar] [CrossRef]
- Théry, C.; Amigorena, S.; Raposo, G.; Clayton, A. Isolation and characterization of exosomes from cell culture supernatants and biological fluids. Curr. Protoc. Cell Biol. 2006, 30, 3–22. [Google Scholar] [CrossRef]
- Belvedere, R.; Bizzarro, V.; Parente, L.; Petrella, F.; Petrella, A. Effects of Prisma® Skin dermal regeneration device containing glycosaminoglycans on human keratinocytes and fibroblasts. Cell Adhes. Migr. 2018, 12, 168–183. [Google Scholar] [CrossRef]
- Bizzarro, V.; Belvedere, R.; Migliaro, V.; Romano, E.; Parente, L.; Petrella, A. Hypoxia regulates ANXA1 expression to support prostate cancer cell invasion aSnd aggressiveness. Cell Adhes. Migr. 2017, 11, 247–260. [Google Scholar] [CrossRef]


© 2018 by the authors. Licensee MDPI, Basel, Switzerland. This article is an open access article distributed under the terms and conditions of the Creative Commons Attribution (CC BY) license (http://creativecommons.org/licenses/by/4.0/).
Share and Cite
Pessolano, E.; Belvedere, R.; Bizzarro, V.; Franco, P.; De Marco, I.; Porta, A.; Tosco, A.; Parente, L.; Perretti, M.; Petrella, A. Annexin A1 May Induce Pancreatic Cancer Progression as a Key Player of Extracellular Vesicles Effects as Evidenced in the In Vitro MIA PaCa-2 Model System. Int. J. Mol. Sci. 2018, 19, 3878. https://doi.org/10.3390/ijms19123878
Pessolano E, Belvedere R, Bizzarro V, Franco P, De Marco I, Porta A, Tosco A, Parente L, Perretti M, Petrella A. Annexin A1 May Induce Pancreatic Cancer Progression as a Key Player of Extracellular Vesicles Effects as Evidenced in the In Vitro MIA PaCa-2 Model System. International Journal of Molecular Sciences. 2018; 19(12):3878. https://doi.org/10.3390/ijms19123878
Chicago/Turabian StylePessolano, Emanuela, Raffaella Belvedere, Valentina Bizzarro, Paola Franco, Iolanda De Marco, Amalia Porta, Alessandra Tosco, Luca Parente, Mauro Perretti, and Antonello Petrella. 2018. "Annexin A1 May Induce Pancreatic Cancer Progression as a Key Player of Extracellular Vesicles Effects as Evidenced in the In Vitro MIA PaCa-2 Model System" International Journal of Molecular Sciences 19, no. 12: 3878. https://doi.org/10.3390/ijms19123878