Sustainability Assessment of Second Use Applications of Automotive Batteries: Ageing of Li-Ion Battery Cells in Automotive and Grid-Scale Applications

 ,
,
Abstract
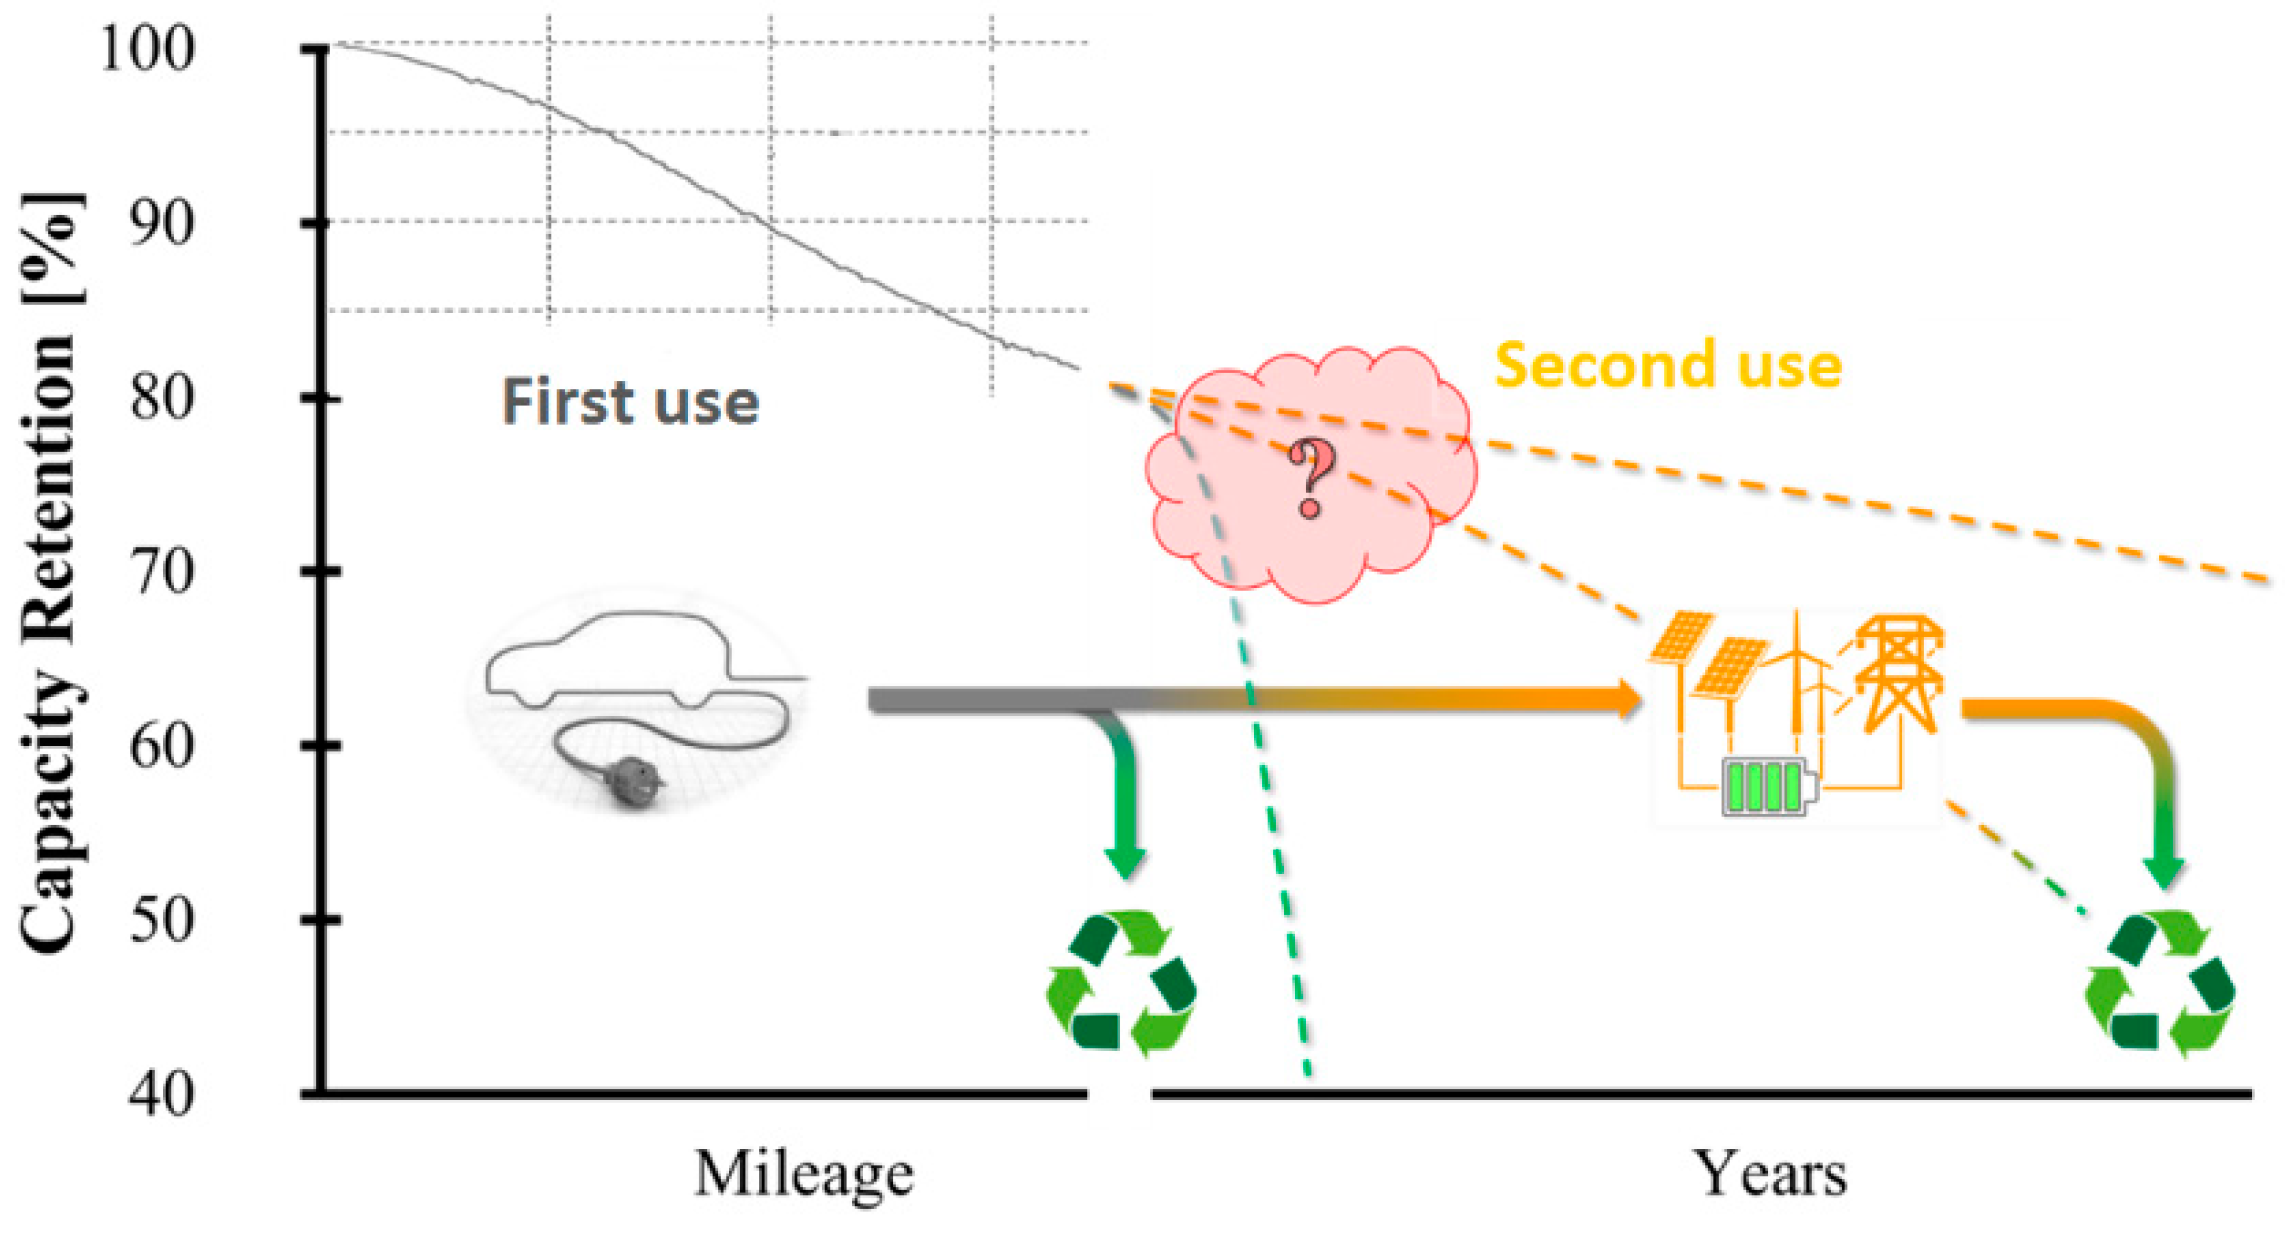
:1. Introduction
2. Mapping of Second Use Activities/Projects/Research Studies
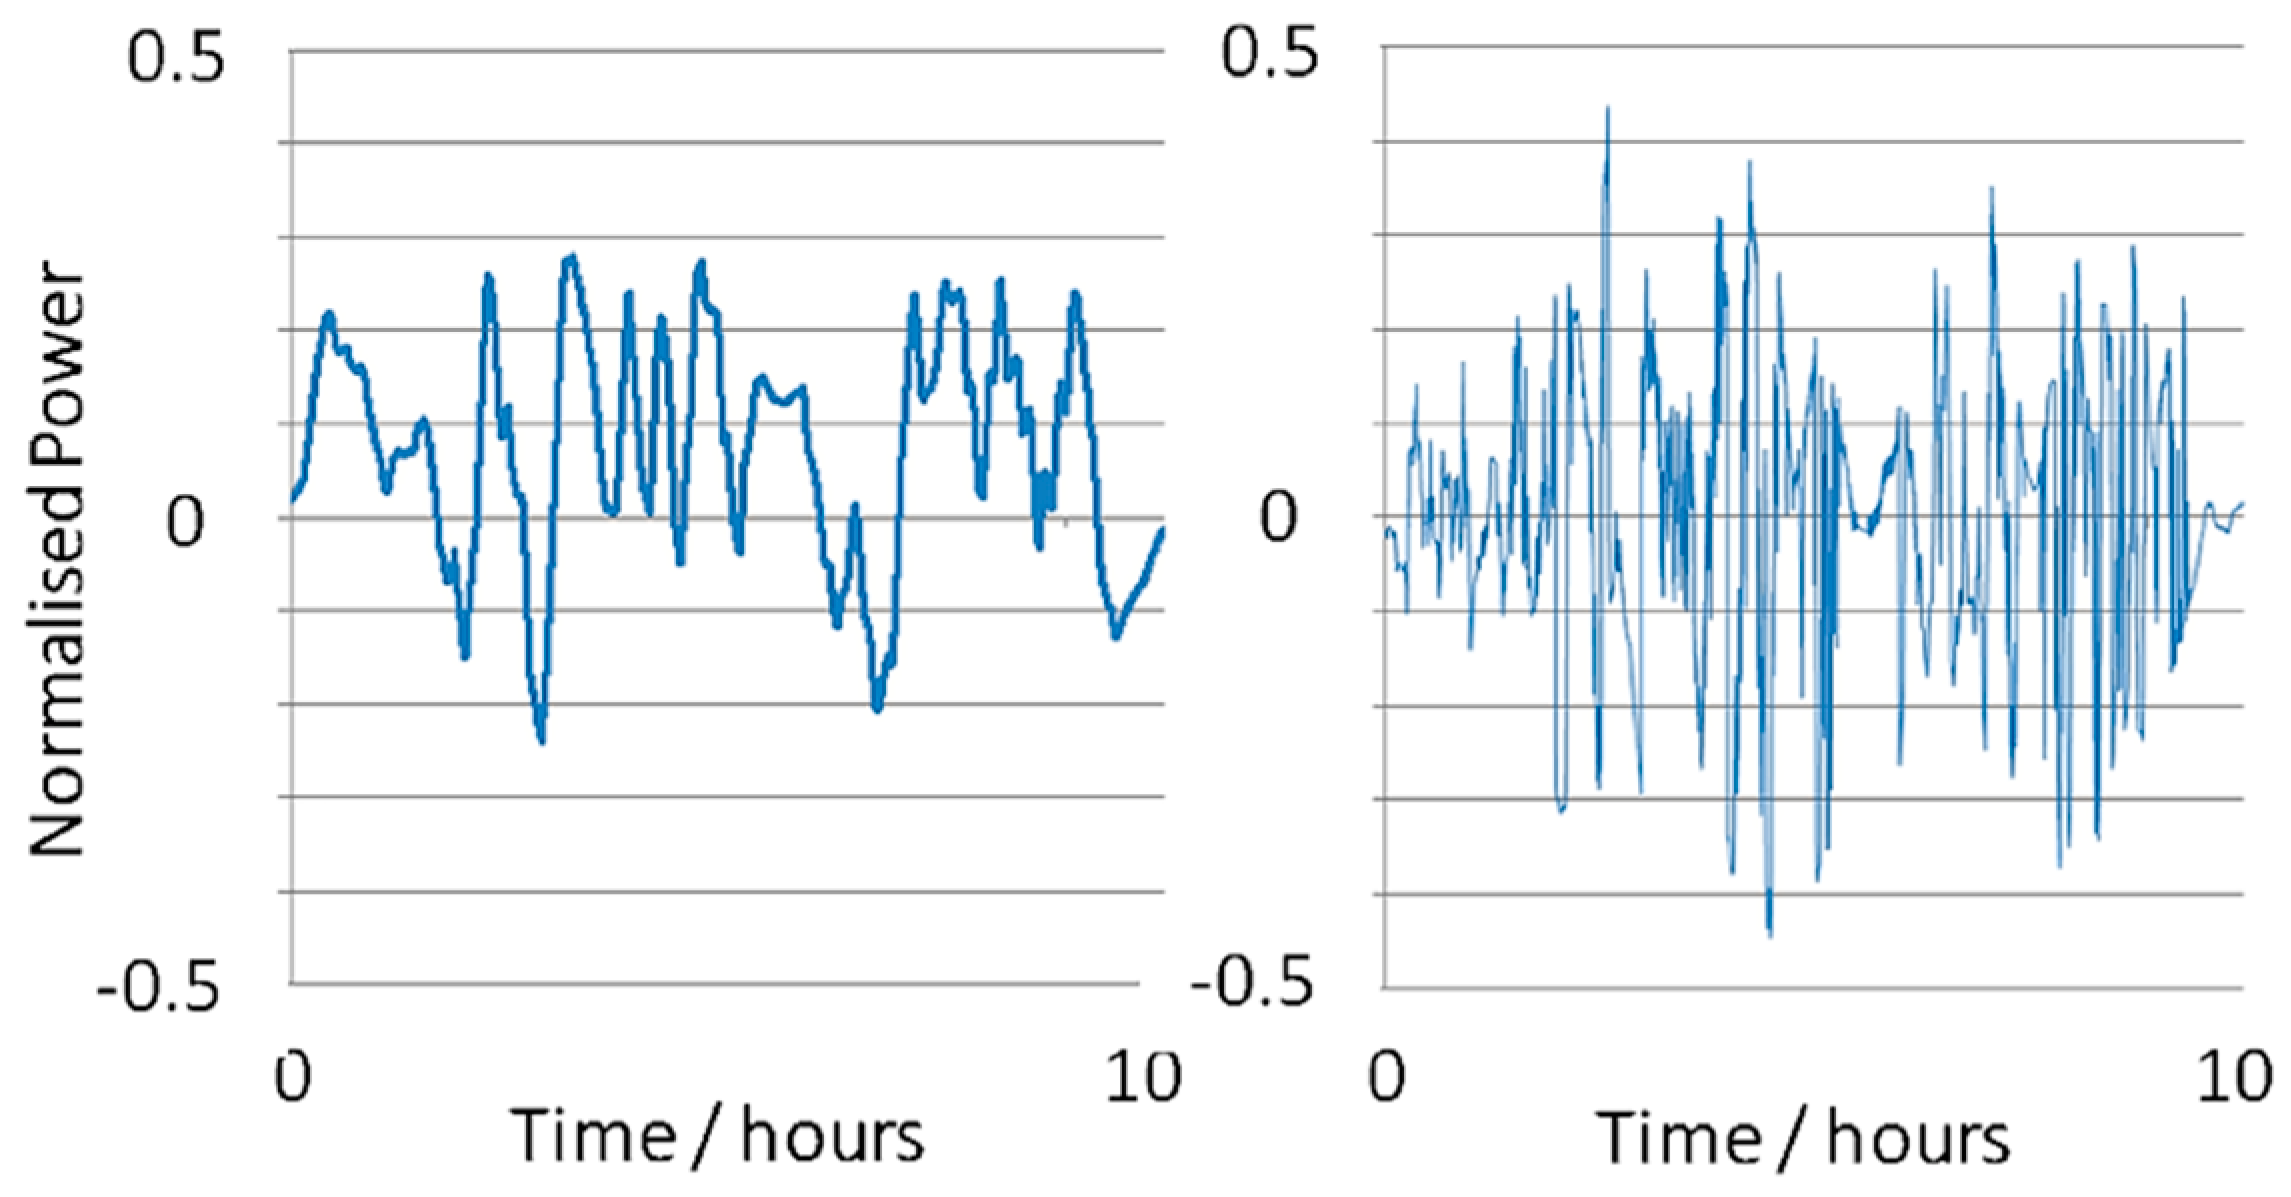
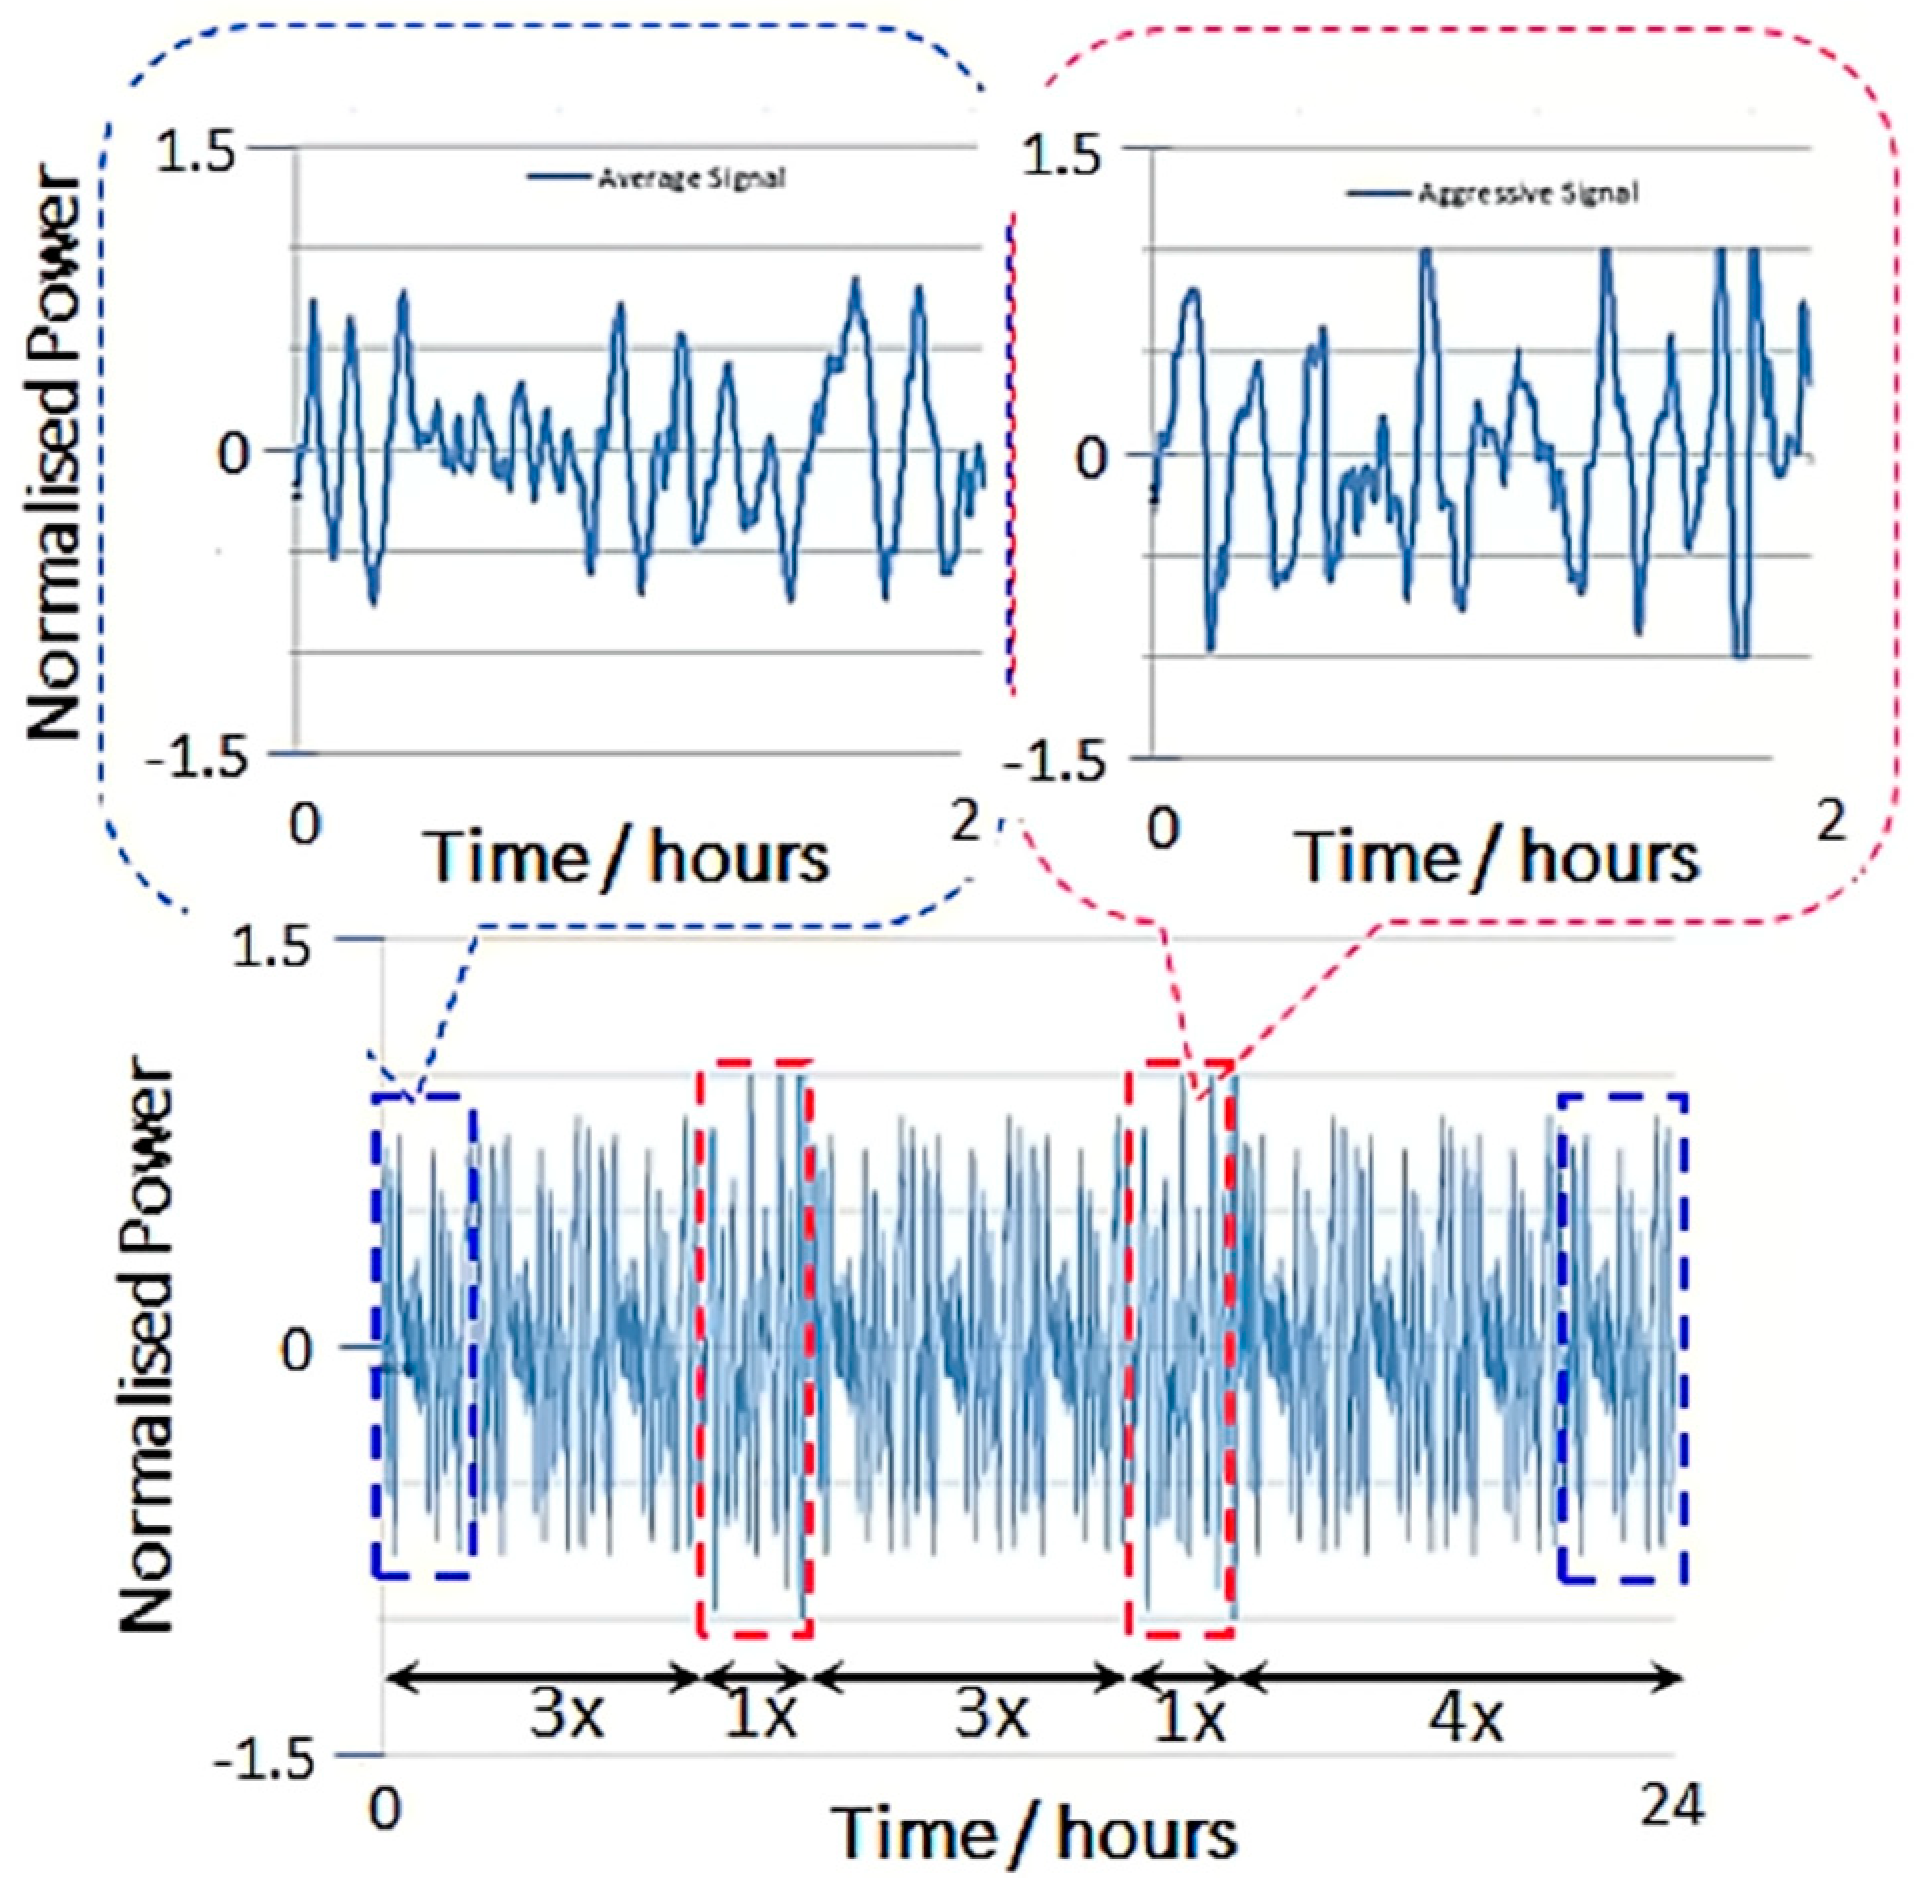
3. Second Use Applications and Duty Cycles
4. Experimental Assessment of LIB’s Ageing in First and Second Use
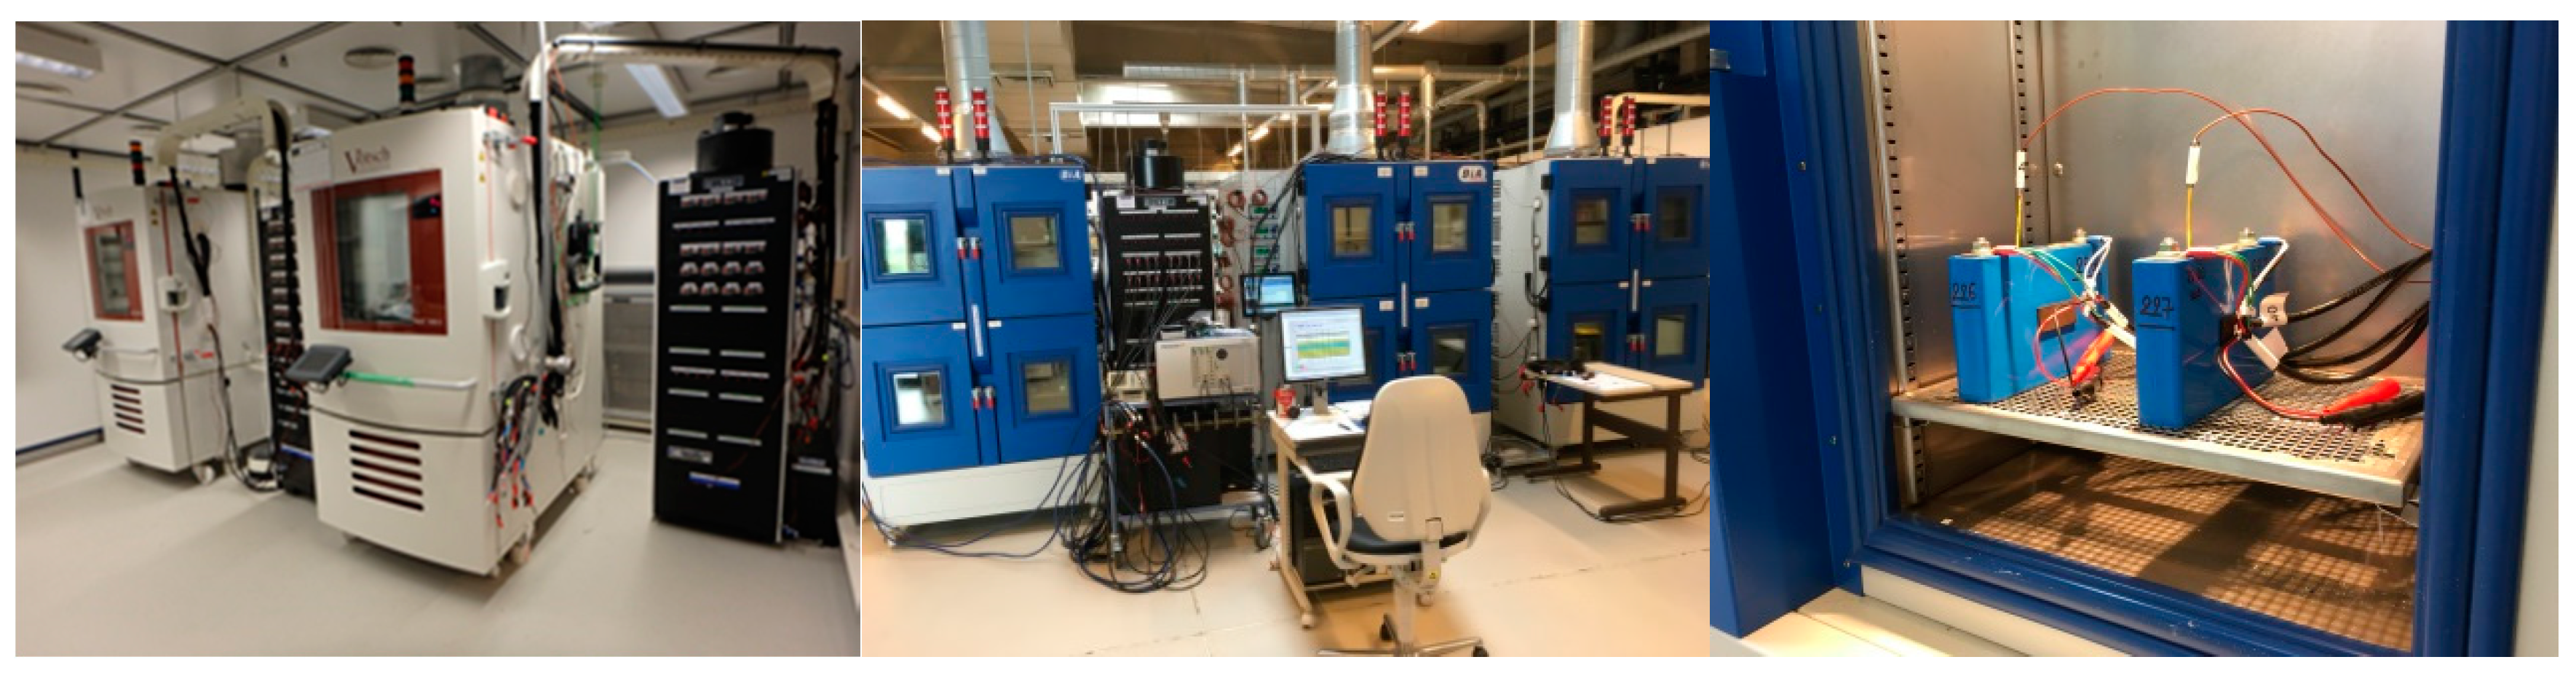
4.1. Materials and Testing Equipment
4.2. Ageing Tests
4.3. Performance Tests
5. Results and Discussion
6. Conclusions and Outlook
Author Contributions
Funding
Acknowledgments
Conflicts of Interest
References
- Lebedeva, N.; Di Persio, F.; Boon-Brett, L. Lithium Ion Battery Value Chain and Related Opportunities for Europe; European Commission: Petten, The Netherlands, 2016. [Google Scholar]
- Directive 2000/53/EC on End-of-Life Vehicles. Available online: http://ec.europa.eu/environment/waste/elv/legislation_en.htm (accessed on 17 April 2017).
- Directive 2006/66/EC on Batteries and Accumulators and Waste Batteries and Accumulators and Repealing Directive 91/157/EEC. Available online: http://ec.europa.eu/environment/waste/batteries/legislation.htm (accessed on 17 April 2017).
- Neubauer, J.; Wood, E.; Pesaran, A. A Second Life for Electric Vehicle Batteries: Answering Questions on Battery Degradation and Value. SAE Int. J. Mater. Manuf. 2015, 8, 21–23. [Google Scholar] [CrossRef]
- Neubauer, J.; Pesaran, A. The ability of battery second use strategies to impact plug-in electric vehicle prices and serve utility energy storage applications. J. Power Sources 2011, 196, 10351–10358. [Google Scholar] [CrossRef]
- Oliveira, L.; Messagie, M.; Rangaraju, S.; Sanfelix, J.; Hernandez Rivas, M.; Van Mierlo, J. Key issues of lithium-ion batteries-From resource depletion to environmental performance indicators. J. Clean. Prod. 2015, 108, 354–362. [Google Scholar] [CrossRef]
- Peters, J.F.; Weil, M. A Critical Assessment of the Resource Depletion Potential of Current and Future Lithium-Ion Batteries. Resources 2016, 5, 46. [Google Scholar] [CrossRef]
- Podias, A.; Bobba, S.; Di Persio, F.; Messagie, M.; Tecchio, P.; Mathieux, F.; Pfrang, A. Sustainability Assessment of Second Life Applications of Automotive Batteries (SASLAB); Exploratory Research Intermediate Report 2016; European Commission: Petten, The Netherlands, 2017. [Google Scholar]
- Saez-de-Ibarra, A.; Martinez-Laserna, E.; Koch-Ciobotaru, C.; Rodriguez, P.; Stroe, D.-I.; Swierczynski, M. Second life battery energy storage system for residential demand response service. In Proceedings of the 2015 IEEE International Conference on Industrial Technology (ICIT), Seville, Spain, 17–19 March 2015; pp. 2941–2948. [Google Scholar]
- Koch-Ciobotaru, C.; Saez-de-Ibarra, A.; Martinez-Laserna, E.; Stroe, D.-I.; Swierczynski, M.; Rodriguez, P. Second life battery energy storage system for enhancing renewable energy grid integration. In Proceedings of the 2015 IEEE Energy Conversion Congress and Exposition (ECCE), Montreal, QC, Canada, 20–24 September 2015; IEEE: New York, NY, USA, 2015; pp. 78–84. [Google Scholar] [Green Version]
- Smith, K.; Earleywine, M.; Wood, E.; Neubauerand, J.; Pesaran, A. Comparison of Plug—In Hybrid Electric Vehicle Battery Life across Geographies and Drive Cycles; SAE Technical Paper 2012-01-0666; SAE: Detroit, MI, USA, 2012. [Google Scholar]
- Neubauer, J. Battery Lifetime Analysis and Simulation Tool (BLAST) Documentation, NREL/TP-5400-63246, December 2014. Available online: http://www.nrel.gov/docs/fy15osti/63246.pdf (accessed on 16 December 2016).
- DOE Global Energy Storage Database, Sandia National Laboratories. Available online: http://www.energystorageexchange.org/projects (accessed on 16 December 2016).
- Reid, J.; Julve, G. Second Life-Batteries as Flexible Storage for Renewables Energies, Report Commissioned by the Federal Association for Renewable Energy (BundesverbandesErneuerbareEnergie e.V.) and the Hanover Fair (Hannover Messe), Berlin, Germany, April 2016. Available online: https://www.bee-ev.de/fileadmin/Publikationen/Studien/201604_Second_Life-Batterien_als_flexible_Speicher.pdf (accessed on 23 September 2016).
- Fitzgerald, G.; Mandel, J.; Morris, J.; Hervé, T. The Economics of Battery Energy Storage: How Multi-Use, Customer-Sited Batteries Deliver the Most Services and Value to Customers and the Grid; Rocky Mountain Institute (RMI): Snowmass, CO, USA, 2015; Available online: http://www.rmi.org/electricity_battery_value (accessed on 23 September 2016).
- Conover, D.R.; Crawford, A.J.; Fuller, J.; Gourisetti, S.N.; Viswanathan, V.; Ferreira, S.R.; Schoenwald, D.A.; Rosewater, D.M. Protocol for Uniformly Measuring and Expressing the Performance of Energy Storage Systems, PNNL-22010 Rev 2/SAND2016-3078 R, Pacific Northwest National Laboratory, and Sandia National Laboratories, Richland, Washington, and Albuquerque. New Mexico (USA), April 2016. Available online: http://www.sandia.gov/ess/publications/SAND2016-3078R.pdf (accessed on 16 December 2016).
- Schoenwald, D.; Ellison, J. Determination of Duty Cycle for Energy Storage Systems in a Renewables (Solar) Firming Application, SAND2016-3636, Sandia National Laboratories, Albuquerque, New Mexico 87185 and Livermore, California 94550 (USA), April 2016. Available online: http://www.sandia.gov/ess/publications/SAND2016-3636.pdf (accessed on 16 December 2016).
- Schoenwald, D.; Ellison, J. Determination of Duty Cycle for Energy Storage Systems in a PV Smoothing Application, SAND2016-3474, Sandia National Laboratories, Albuquerque, New Mexico 87185 and Livermore, California 94550 (USA), April 2016. Available online: http://www.sandia.gov/ess/publications/SAND2016-3474.pdf (accessed on 16 December 2016).
- International Standard IEC 62660-1:2010. Secondary Lithium-Ion Cells for the Propulsion of Electric Road Vehicles—Part 1: Performance Testing; IEC: Geneva, Switzerland, 2010; ISBN 978-2-88912-308-7. [Google Scholar]
- Tutuianu, M.; Marotta, A.; Steven, H.; Ericsson, E.; Haniu, T.; Ichikawa, N.; Ishii, H. Development of a Worldwide Harmonized Light-Duty Vehicles Driving Test Cycle (WLTC), Tech. Report, UN/ECE/WP.29/GRPE/WLTP-IG, DHC Subgroup. 2013. Available online: https://www.unece.org/fileadmin/DAM/trans/doc/2014/wp29grpe/GRPE-68-03e.pdf (accessed on 16 December 2016).
- International Standard ISO 12405-1. Electrically Propelled Road Vehicles—Test Specification for Lithium-Ion Battery Packs and Systems—Part1: High-Power Applications; IEC: Geneva, Switzerland, 2010. [Google Scholar]
- International Standard ISO 12405-2. Electrically Propelled Road Vehicles—Test Specification for Lithium-Ion Battery Packs and Systems—Part 2: High-Energy Applications; IEC: Geneva, Switzerland, 2010. [Google Scholar]
- International Standard IEC 61427-1. Secondary Cells and Batteries for Renewable Energy Storage—General Requirements and Methods of Test—Part 1: Photovoltaic off-Grid Application, 1st ed.; IEC: Geneva, Switzerland, 2013; ISBN 978-2-83220-763-5. [Google Scholar]
- International Standard IEC 61427-2. Secondary Cells and Batteries for Renewable Energy Storage—General Requirements and Methods of Test—Part 2: On-Grid Applications, 1st ed.; IEC: Geneva, Switzerland, 2015; ISBN 978-2-8322-2881-4. [Google Scholar]
- Mettlach, H.; Delcorso, F.; Gosso, M.; Warm, A.; Porcellato, D.; Bryngelsson, H.; Sarrazin, C.; Conte, M.; Binotto, C.; Doering, H. Initial Cycling & Calendar Ageing Test Procedures and Checkup Tests for High Energy Li-Ion Battery Cells, Project HELIOS—High Energy Lithium-Ion Storage Solutions—Cell Test Specification, October 2012. Available online: www.helios-eu.org (accessed on 23 September 2016).
- Atkinson, A.C.; Donev, A.N.; Tobias, R.D. Optimum Experimental Designs, with SAS; Oxford University Press: Oxford, UK, 2007; ISBN 978-0-19-929660-6. [Google Scholar]
- Stoynov, Z.; Grafov, B.; Savova-Stoynova, B.; Elkin, V. Electrochemical Impedance; Publishing House Science: Moscow, Russia, 1991. [Google Scholar]
- Barsukov, E.; Ross Macdonald, J. Impedance Spectroscopy: Theory, Experiment, and Applications, 2nd ed.; Wiley-Interscience: New York, NY, USA, 2005. [Google Scholar]
- Schuster, S.F.; Bach, T.; Fleder, E.; Muller, J.; Brand, M.; Sextl, G.; Jossen, A. Nonlinear aging characteristics of lithium-ion cells under different operational conditions. J. Energy Storage 2015, 1, 44–53. [Google Scholar] [CrossRef]
- Burns, J.C.; Kassam, A.; Sinha, N.N.; Downie, L.E.; Solnickova, L.; Way, B.M.; Dahn, J.R. Predicting and Extending the Lifetime of Li-ion Batteries. J. Electrochem. Soc. 2013, 160, A1451–A1456. [Google Scholar]
- Wright, R.B.; Motloch, C.G.; Belt, J.R.; Chrostophersen, J.P.; Ho, C.D.; Richardson, R.A.; Bloom, I.; Jones, S.A.; Battaglia, V.S.; Henriksen, G.L.; et al. Calendar- and cycle-life studies of advanced technology development program generation 1 lithium-ion batteries. J. Power Sources 2002, 110, 445–470. [Google Scholar] [CrossRef]
- Wohlfahrt-Mehrens, M.; Vogler, C.; Garche, J. Aging mechanisms of lithium cathode materials. J. Power Sources 2004, 127, 58–64. [Google Scholar] [CrossRef]
- Vetter, J.; Novak, P.; Wagner, M.R.; Veit, C.; Moeller, K.-C.; Besenhard, J.O.; Winter, M.; Wohlfahrt-Mehrens, M.; Vogler, C.; Hammouche, A. Ageing mechanisms in lithium-ion batteries. J. Power Sources 2005, 147, 269–281. [Google Scholar] [CrossRef]
- Lithium Energy Japan. Safety Data Sheet LEV40-8 Lithium-Ion Battery; D Revision; Lithium Energy Japan: Ritto, Japan, 2016. [Google Scholar]
- Dubarry, M.; Svoboda, V.; Hwu, R.; Liaw, B.Y. Incremental Capacity Analysis and Close-to-Equilibrium OCV measurements to quantify capacity fade in commercial rechargeable lithium batteries. Electrochem. Solid-State Lett. 2006, 9, A454–A457. [Google Scholar] [CrossRef]
- Smith, A.J.; Dahn, J.R. Delta Differential Capacity Analysis. J. Electrochem. Soc. 2012, 159, A290–A293. [Google Scholar] [CrossRef]
- Dubarry, M.; Liaw, B.Y. Identify capacity fading mechanism in a commercial LiFePO4 cell. J. Power Sources 2009, 194, 541–549. [Google Scholar] [CrossRef]
- Weng, C.; Cui, Y.; Sun, J.; Peng, H. On-board state of health monitoring of lithium-ion batteries using incremental capacity analysis with support vector regression. J. Power Sources 2013, 235, 36–44. [Google Scholar] [CrossRef]
- Bobba, S.; Pfrang, A.; Ardente, F.; Blengini, G.A.; Podias, A.; Mathieux, F.; Cusenza, M.A. Life Cycle Assessment of repurposed electric vehicles batteries: An adapted method based on modelling of energy flows. J. Energy Storage 2018. accepted. [Google Scholar]
- Cusenza, M.A.; Bobba, S.; Ardente, F.; Cellura, M.; Di Persio, F. Energy and environmental assessment of a traction lithium-ion battery pack for plug-in hybrid electric vehicles. J. Clean. Prod. 2018. under review. [Google Scholar]
- Bobba, S.; Podias, A.; Di Persio, F.; Messagie, M.; Tecchio, P.; Cusenza, M.A.; Eynard, U.; Mathieux, F.; Pfrang, A. Sustainability Assessment of Second Life Applications of Automotive Batteries (SASLAB); Final Technical Report; European Commission: Petten, The Netherlands, 2018. [Google Scholar]
- Chiang, Y.-H.; Sean, W.-Y.; Ke, J.-C. Online estimation of internal resistance and open-circuit voltage of lithium-ion batteries in electric vehicles. J. Power Sources 2011, 196, 3921–3932. [Google Scholar] [CrossRef]


| EV Company (Project Start) | Energy Company | Project Description |
|---|---|---|
| Europe | ||
| BMW (2016) | Vattenfall/Bosch (system integrator) | Pilot energy storage project with a power output of 2 MW and installed capacity of 2.8 MWh. It consists of 2600 modules from over 100 BMW’s electric cars (ActiveE and i3 models). |
| Daimler (2016) | GETEC/The Mobility House Remondis/EnBW | World’s largest second use battery storage unit with a total capacity of 13 MWh using EV batteries from Daimler’s EVs. |
| Mitsubishi Motors Corporation/PSA Peugeot Citroën (2015) | Forsee Power/Electricité de France (EDF)/Mitsubishi Corporation | Demonstration project, using battery packs from Peugeot Ion, Citroen C-Zero, and Mitsubishi i-MiEV, to deliver an optimised smart grid and energy management system. |
| International | ||
| Nissan (2014) | Sumitomo Corporation | Nissan and the Sumitomo Corporation founded 4R Energy Corporation (Yokohama, Japan) in September 2010 as a joint venture to conduct research and repurpose second-life Nissan Leaf battery packs. The world’s first large-scale power storage system, a second use prototype system (600 kW/400 kWh) uses 16 Nissan LEAF lithium-ion batteries to test the smoothing effect on the power output from a wind farm in Yume-shima island, Osaka, Japan in 2014. |
| Project Title/Website/Timeframe | Description/Results |
|---|---|
| Europe | |
| Batteries2020: Towards realistic EU competitive automotive batteries http://www.batteries2020.eu/ 1 September 2013–31 August 2016 | An EU-funded Framework Programme 7 (FP7) project. Assessment of second life post-EV batteries in renewable energy applications took place among other activities. LCA was also conducted to provide an environmental impact of the project-developed prototype lithium nickel manganese cobalt oxide (NMC) cells not only during the manufacturing process, but also during their use in an EV and later during second life and final recycling processes. Two second use applications were considered: (a) a low-demand one [9], with low C-rates and low DoD cycles: a Spanish residential household, which was composed of residential loads, a roof-mounted photovoltaic (PV) system, and a second life battery energy storage system (ESS); and (b) a high-demand application, especially in terms of C-rate, DoD, and number of cycles per year: a second life battery ESS to mitigate the power variability of a grid-scale PV plant [10]. |
| Energy Local Storage Advanced system (ELSA) http://www.elsa-h2020.eu/ 1 April 2015–31 March 2018 | An EU-funded Horizon2020 (H2020) project, aiming at enabling the integration of distributed small/medium size storage solutions into the energy system and their commercial use by combining second use batteries with a local ICT-based energy management system. ELSA’s ESSs are being applied in six demonstration sites in five EU countries, that include buildings, districts, and distribution grids, covering services such as grid congestion relief, local grid balancing, peak shaving, voltage support, and frequency regulation. Initial results can be retrieved at http://www.elsa-h2020.eu/Results.html. |
| International | |
| Battery second use (B2U) United States Department of Energy’s (U.S. DoE)/National Renewable Energy Laboratory (NREL) https://www.nrel.gov/transportation/battery-second-use.html 2010-; (ongoing) | The U.S. DoE Vehicle Technologies Office has funded NREL to investigate the feasibility of, and major barriers to the B2U of modern LIBs. NREL suggested that B2U could become an important part of both the automotive and electricity industries. The economic margins that make second use viable are often small; thus several factors could affect this conclusion [5]. Availability of on-board diagnostics data and accurate assessments of automotive and second use battery degradation are considered of outmost importance [4]. Within the B2U project, a methodology and the tools to answer B2U-related questions were developed, including a semi-empirical life model [11] that accounts for both capacity and resistance effects induced by cycling-based and calendar-based mechanisms (nonlinear effects of time, temperature, DoD, and SoC are included), and the Battery Lifetime Simulation Tool (BLAST) [12]. The B2U project has also highlighted the need for additional research and development work to make B2U strategies a reality. NREL is conducting battery life evaluation (in house research), and has partnered with the Center for Sustainable Energy (CSE) and the University of California, San Diego to install a flexible second-use field test bed on a microgrid. CSE studied the baseline health of four EV batteries and developed a long-term testing protocol to track battery performance over time under second use application cycling. |
| (A) Calendar Ageing | (B) Automotive Use Cycle Ageing | ||||
|---|---|---|---|---|---|
| Temperature [°C] | SoC | Cell (Fresh or Aged in EV) | Temperature [°C] | Cycling Profile Charge/Discharge | Cell (Fresh or Aged in EV) |
| 45 | 100 | Aged | 45 | CC-CV/CC | Fresh |
| 50 | Fresh | CC-CV/CC | Fresh | ||
| 50 | Aged | WLTC | Fresh | ||
| 50 | Aged | CC-CV/CC | Aged | ||
| 50 | Fresh | WLTC | Aged | ||
| 100 | Fresh | WLTC | Aged | ||
| 25 | 100 | Aged | 25 | CC-CV/CC | Fresh |
| 100 | Fresh | WLTC | Fresh | ||
| 50 | Aged | WLTC | Fresh | ||
| 100 | Fresh | CC-CV/CC | Aged | ||
| 50 | Fresh | CC-CV/CC | Aged | ||
| 100 | Aged | WLTC | Aged | ||
© 2018 by the authors. Licensee MDPI, Basel, Switzerland. This article is an open access article distributed under the terms and conditions of the Creative Commons Attribution (CC BY) license (http://creativecommons.org/licenses/by/4.0/).
Share and Cite
Podias, A.; Pfrang, A.; Di Persio, F.; Kriston, A.; Bobba, S.; Mathieux, F.; Messagie, M.; Boon-Brett, L. Sustainability Assessment of Second Use Applications of Automotive Batteries: Ageing of Li-Ion Battery Cells in Automotive and Grid-Scale Applications. World Electr. Veh. J. 2018, 9, 24. https://doi.org/10.3390/wevj9020024
Podias A, Pfrang A, Di Persio F, Kriston A, Bobba S, Mathieux F, Messagie M, Boon-Brett L. Sustainability Assessment of Second Use Applications of Automotive Batteries: Ageing of Li-Ion Battery Cells in Automotive and Grid-Scale Applications. World Electric Vehicle Journal. 2018; 9(2):24. https://doi.org/10.3390/wevj9020024
Chicago/Turabian StylePodias, Andreas, Andreas Pfrang, Franco Di Persio, Akos Kriston, Silvia Bobba, Fabrice Mathieux, Maarten Messagie, and Lois Boon-Brett. 2018. "Sustainability Assessment of Second Use Applications of Automotive Batteries: Ageing of Li-Ion Battery Cells in Automotive and Grid-Scale Applications" World Electric Vehicle Journal 9, no. 2: 24. https://doi.org/10.3390/wevj9020024