
Multi-System Coupling DMi Hybrid Vehicle Modeling and Its Performance Analysis Based on Simulation


BYD Auto Engineering Research Institute, BYD Auto Industry Company Ltd., Shenzhen 518118, China
*
Author to whom correspondence should be addressed.
World Electr. Veh. J. 2021, 12(4), 215; https://doi.org/10.3390/wevj12040215
Submission received: 23 August 2021
/
Revised: 28 September 2021
/
Accepted: 30 September 2021
/
Published: 1 November 2021
(This article belongs to the Special Issue Towards Intelligent E-Mobility—Selected Papers from The 34th International Electric Vehicles Symposium and Exhibition (Nanjing, China))
Abstract
:Key subsystems, such as driving resistance, component performance, and energy management strategy, determine the power performance and energy consumption of hybrid electric vehicles. Qin Plus performs excellently in fuel consumption due to its low driving resistance, high thermal efficiency of the engine, and multi-factor multi-mode energy management strategy. This article aims to explain the outstanding energy consumption of DMi vehicles by analyzing the driving resistance, component parameters of Qin Plus and introducing the drive modes selection and vehicle energy management strategy through multi-system modeling and simulation. The ultra-low fuel consumption of 3.8 L is obtained under the NEDC driving cycle and evaluated by the corresponding experiment.
1. Introduction
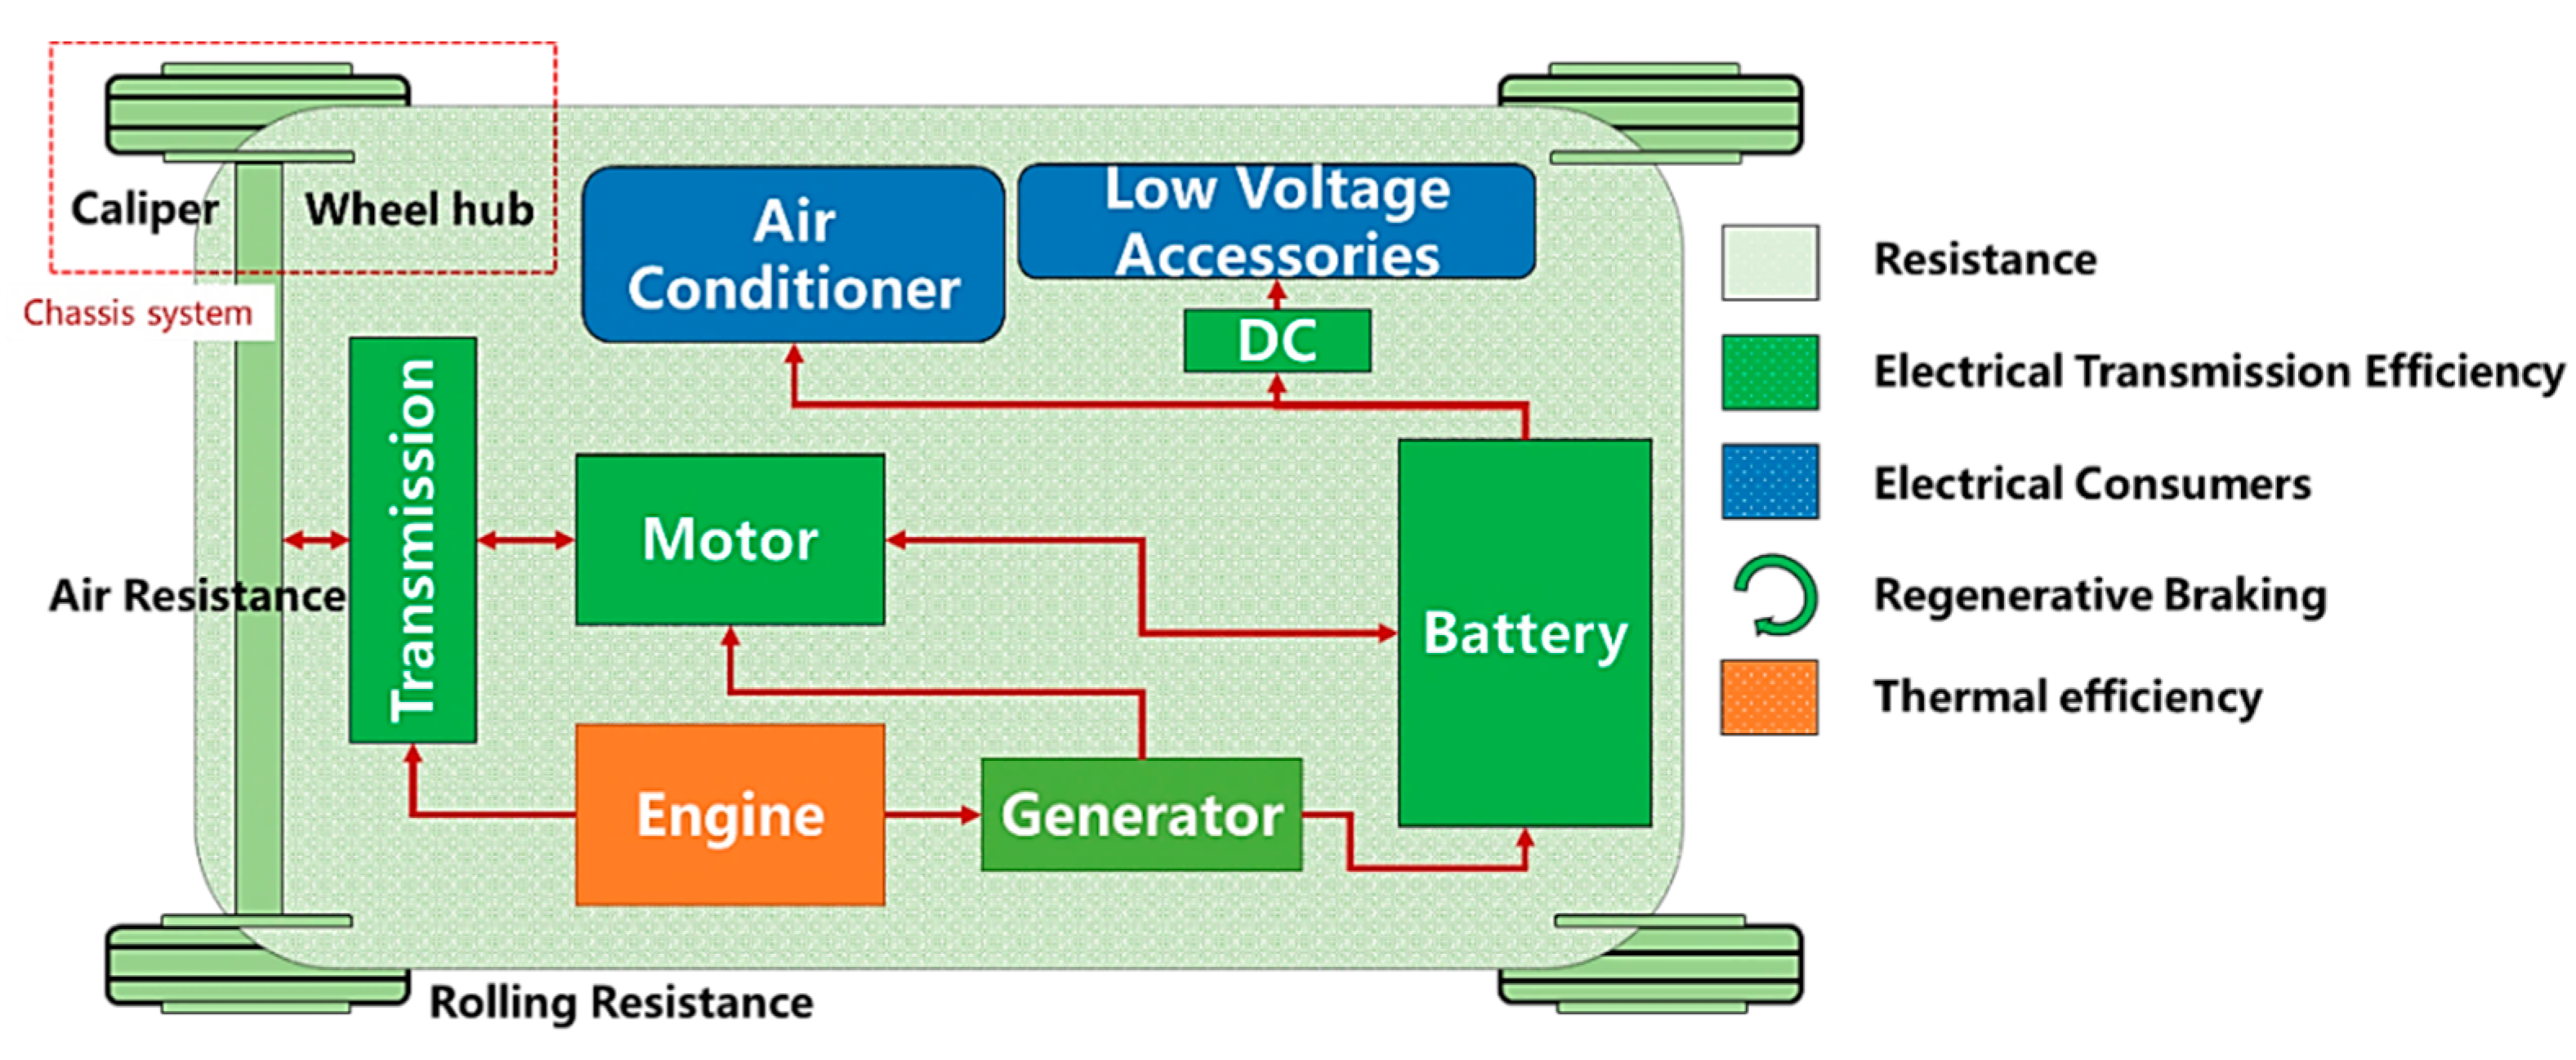
PHEVs (Plugin hybrid vehicles) are generally recognized as having a vital role in the new energy vehicle industry for their better power performance than traditional fuel vehicles and longer driving range than current pure electric vehicles. Driving resistance, component performance, and energy management strategy are the major subsystems that determine the power performance and energy consumption of the vehicle with a fixed powertrain structure. The neo-generation hybrid system of BYD, DMi (Dual Model intelligent), adopted the series-parallel structure [1,2], which enables three driving modes and the regenerative braking modes, their structure is reflected in Figure 1.
To reduce the energy consumption, some of the existing literature discuss the vehicle driving resistance and the corresponding decomposed index [3], and some other research attempts to study the technology on component performance improvement [4,5]. On the other hand, with the development of information technology and machine learning methods, some researchers tend to evaluate the real-world energy consumption by statistical characteristics but not the origin physical index [6]. Energy management has become a prevalent and hot research topic of hybrid systems with the booming of information technology and algorithm design [7,8]. However, from the perspective of vehicle integration, EMR (Energetic Macroscopic Representation) is a typical methodology applied for vehicle energy flow analysis, and some articles presented the energy consumption of i-MMD vehicles and vehicles equipped with THS [9,10].
This article strives to present the outstanding energy consumption of DMi vehicles by multi-system coupling analysis of the representative vehicle. Qin Plus includes its driving resistance decomposition, driving modes and component parameters display, and strategy design of modes selection and energy management based on simulation. Furthermore, various research tends to solve the energy management problem with control objectives, including the performance of energy consumption [11], drivability [12,13], and battery health [14,15], and research considering the NVH (noise, vibration, and harshness) performance usually focuses on the mode shifting problem [16] but not the speed and torque control. Academic studies hope to model the problem with one or two specific objectives optimization; however, the manufacturers view it as a performance integration issue that needs to be considered as comprehensively as possible, and the strategy should ensure the vehicles possess the charge sustaining capability [17,18] simultaneously. The problems related usually do not occur in the standard test cycles, such as NEDC, while this capability is extremely important for performance in harsh driving conditions. In our study, a practical strategy to optimize the energy consumption with the constraints by considering drivability, charge sustaining capability, and NVH is employed for the DMi vehicles, which may provide an insight into how to deal with the energy management problem from the perspective of vehicle performance integration.
2. Resistance Decomposition and EV Mode Energy Consumption Analysis
To better specify how the systematic resistance optimization works on DMi vehicles, we tend to figure out details by analyzing EV mode energy consumption. Resistance decomposition into components or systems is a necessary step to understand the driving power requirement in different operating conditions. In general, rolling resistance, aerodynamic drag, and the resistance of the chassis system are vital factors that should be considered for vehicle development, especially for the target setting of energy consumption [19,20]. According to the relationship between the variation of each system-level indicator unit and the corresponding variation of resistance, we can simply understand the energy consumption of the vehicle under the current vehicle attributes through index-level analysis. To better understand the dynamic influence of each system or component in a fixed road spectrum, we build the vehicle model by the simulation software AVL Cruise and analyze the systematic resistance improvement and the corresponding energy consumption optimization.
To further decompose the contributions of each system or component, we compare the resistance index of each system with Qin Pro and supply the improvement information to make a comprehensive analysis. As reflected in Table 1, the improvement of rolling resistance, caliper drag, and powertrain efficiency are the primary factors that contribute to energy consumption reduction. The resistance change of each system is validated by the resistance decomposition test, and we retest the resistance of the vehicle on the chassis after disassembling each component system one by one. After processing the data and identifying the resistance contribution of each part, we compare our theoretical resistance model with the test data at different speed points ranging from 20 to 120 km/h. The result shows that the error is less than 5 N on average and the maximum error is less than 10 N. By comparing the input data from the battery side, and the output data from the wheel side of the bench energy consumption experiment, the efficiency improvement of the powertrain is validated. In total, the energy consumption of Qin Plus reduces 2.8 Kwh/100 km in the NEDC test compared with Qin Pro (DM3.0). The simulation result is 2.82 Kwh/100 km, and its accuracy is evaluated. Other DMi vehicles adopted the same technology, such as the low rolling resistance tire and the low drag calipers. The benefit from this is the total driving resistance is reduced by more than 13%. Moreover, the BYD EHS (Electric Hybrid System) designed for DMi vehicles achieved higher efficiency, which contributes to 0.8 kWh/100 km electricity consumption reduction.
3. Driving Modes Overview
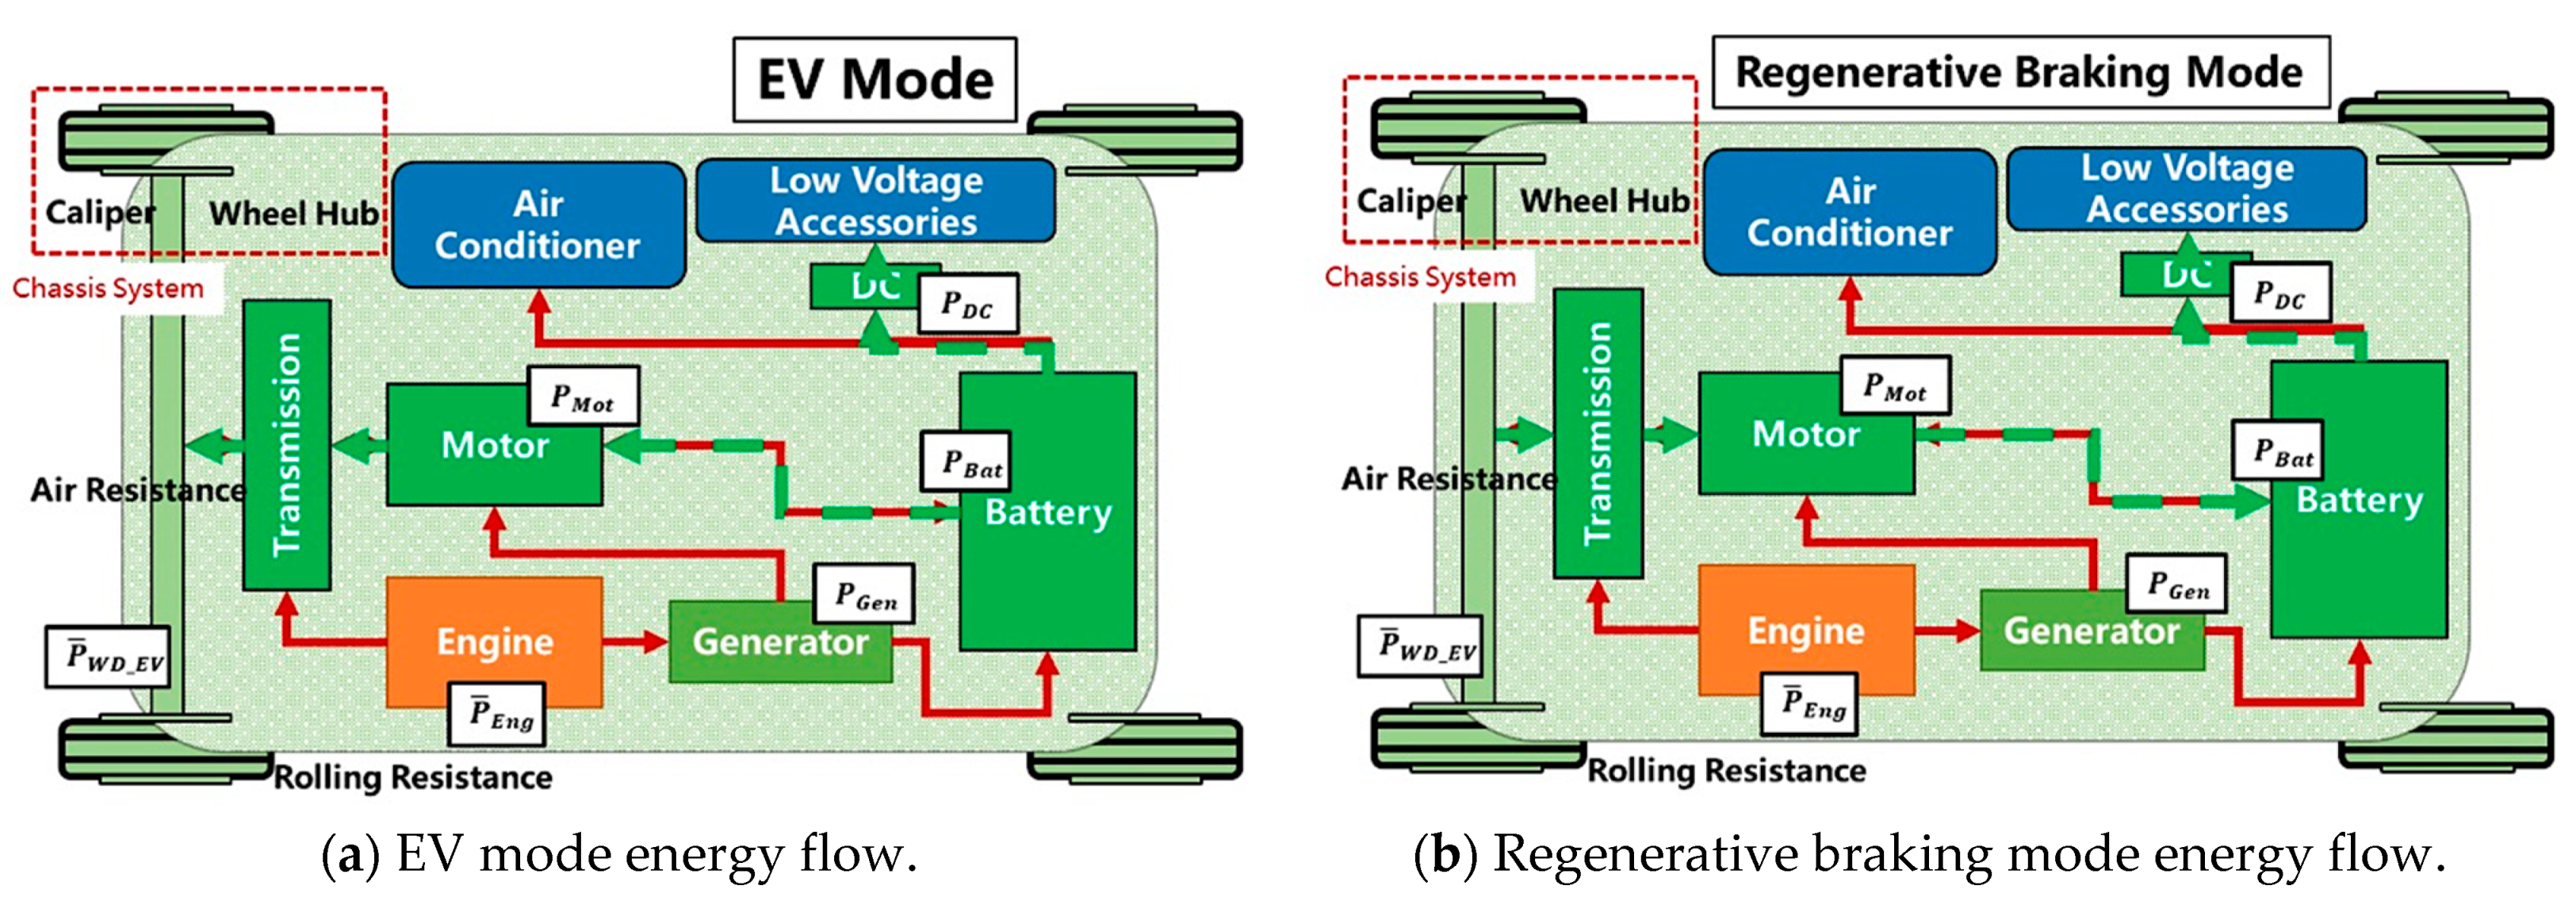
EHS enables 11 driving modes in different working conditions, and we strive to explain the four primary modes in this section. As a PHEV, Qin Plus can drive by the electric assembly solely (EV mode and regenerative braking mode) in the CD (charge depleting) part process.
Figure 2 shows the EV mode energy flows in each component. In the basic EMR topology, the red lines present the electrical/mechanical connections between the components, and the arrow indicates the direction of energy. As we can see, the green flows show the operative components included in these two modes are the transmission, the motor, the DCDC, the low voltage accessories, and the battery. In EV mode, the battery provides the energy for driving and the low voltage accessories; however, the energy recovered from the wheel end flow to the low voltage accessories and the battery in the regenerative braking mode. Formulas (1) and (2) explained the process, where indicates the electrical power of each component, indicates the mechanical power, presents the efficiency, presents the efficiency of the motor, and presents the transmission efficiency in the EV mode. In this expression, we use the positive and negative power values to express the inflow and outflow of energy. For example, when a battery is charged, the power is negative, and when a battery is discharged, the power is positive.
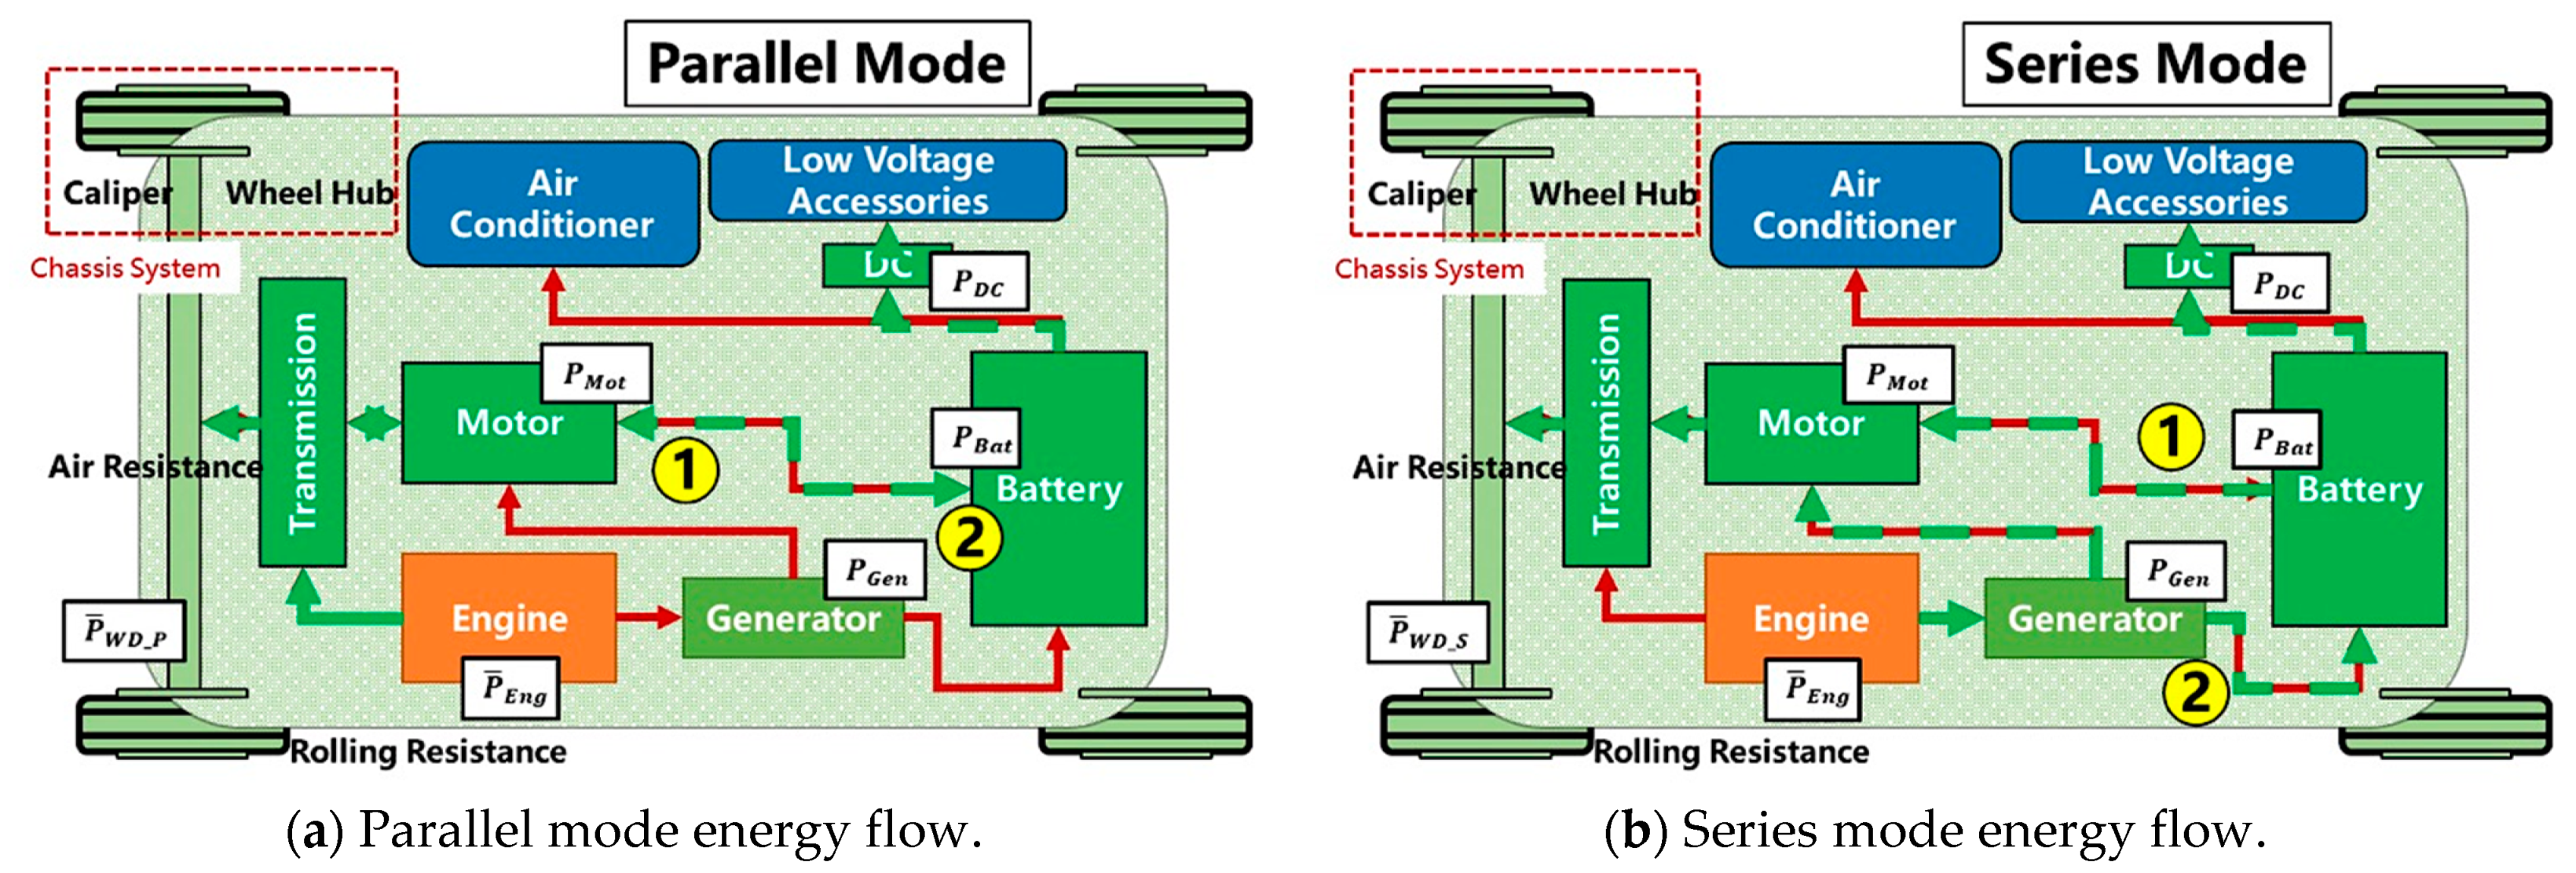
For the reason that Qin Plus adopts the series-parallel hybrid structure, which has only one transmission ratio for parallel mode drive, this mode operates when the velocity is higher than 60 km/h. This is very distinct from Qin Pro. The previous generation powertrain is equipped with a DCT (Dual Clutch Transmission) gearbox so that it can complete the direct drive of the engine to the wheel end in any state. As shown in Figure 3a, in parallel drive mode, the 1.5 L high-efficiency engine plays the protagonist, and the motor drives simultaneously when the vehicle meets a high-power demand from the wheel end (path 1). Conversely, the engine can charge the battery through the motor if the engine power in the eco area is higher than the power demand from the wheel end (path 2). Formulas (3) and (4) describe how the energy flows and splits between components.
In the series mode demonstrated in Figure 3b, the engine plays the role of a range extender. The motor is the only component coupled with the wheel end. Similar to the parallel mode, the series mode has two paths: the battery is charging with a low-power demand while discharging with a high-power demand. Formulas (5) and (6) illustrate the energy flow and show that the battery may not work if the wheel end demands fit the power output in the eco area for both of the two HEV modes.
4. Component Parameters and Power Performance
EHS designed for DMi vehicles adopts the classical series-parallel hybrid structure; hence, components selection and matching should follow related logic. Firstly, the drive motor needs to meet the sufficient power output to ensure the performance of the EV mode and series mode drives in low SOC statuses. Secondly, the engine output power can cover or almost cover the rest of the motor with different battery outputs to ensure the consistency of power performance. Lastly, the external characteristics of the engine and the generator should meet with each other. EHS has two fundamental configurations for Class A/A+ vehicles and Class B/B+ vehicles separately. Qin Plus is equipped with a configuration that focuses more on energy consumption; however, power performance and its consistency in different vehicle statuses should get noticed to a large extent. Furthermore, how to balance the charge sustaining capability in harsh driving conditions and the fuel-saving capability in routine driving conditions is a crucial issue. To better figure out a proper solution, we established the data set that consists of three standard test cycles (NEDC, WLTC, and CLTC) and another 15 customized cycles that cover the road spectrums in separate conditions, including high speed overtaking, mountain climbing, and urban congestion, which are collected by the BYD road test evaluation team. The dataset is introduced in our simulation model to extract the dynamic power demand comprehensively. After evaluating the performance with this data set and components and system matching, a parameters list is showed in Table 2. Here, we may specify some basic logic of the powertrain parameters setting. Initially, the motor power can be confirmed by the acceleration performance. Qin Plus earns the 0–100 km acceleration of 7.5 s with the series mode. The motor operates with its maximum power of 145 kW, where 70 kW is from the power generating by the engine, and the rest is provided by the battery. Secondly, we select a 1.5 L engine for its high thermal efficiency and the requirement of the power performance of Qin Plus. Meanwhile, considering the efficiency of the series mode transmission (the transmission between the engine and the generator) and the efficiency of the generator itself, the maximum power of the generator and the maximum power of the engine is totally matched. Thirdly, the transmission ratios are set after analyzing the maximum speed of each component and the vehicle’s maximum speed requirement. For instance, the maximum speed of the engine is 6000 rpm, and the maximum speed of the generator is 13,000 rpm due to its characteristics. Thus, the series mode transmission ratio should be about 2.1. Lastly, unlike the count of EV battery cells that is relatively high to reach the nominal voltage of the motor, the capacity of the cell should be designed to meet the requirement of different packs. This is because the count of batteries directly determines the voltage of the pack, which may be much lower than the nominal voltage of the motor. Although there is a boost if DC connects the battery and the motor, charging and discharging with a smaller current is more friendly to the safety of high-voltage systems.
Table 3 explains the characteristics of batteries with different materials. Compared with the NCM/NCA battery solution, which is applied in the previous generation of DM vehicles, the blade battery equipped on DMi vehicles performs much better in cycle life, safety, cost, and environmental friendliness. However, usually, the low energy density is a key drawback, making auto manufacturers find it hard to choose the LFP battery solution. By utilizing new technologies, the blade battery further improves safety and increases the energy density in the meantime. Consequently, DMi vehicles make the solution feasible by the integration of the blade battery package, resistance reduction scheme, and lightweight scheme.
5. Driving Modes Selection and Energy Management
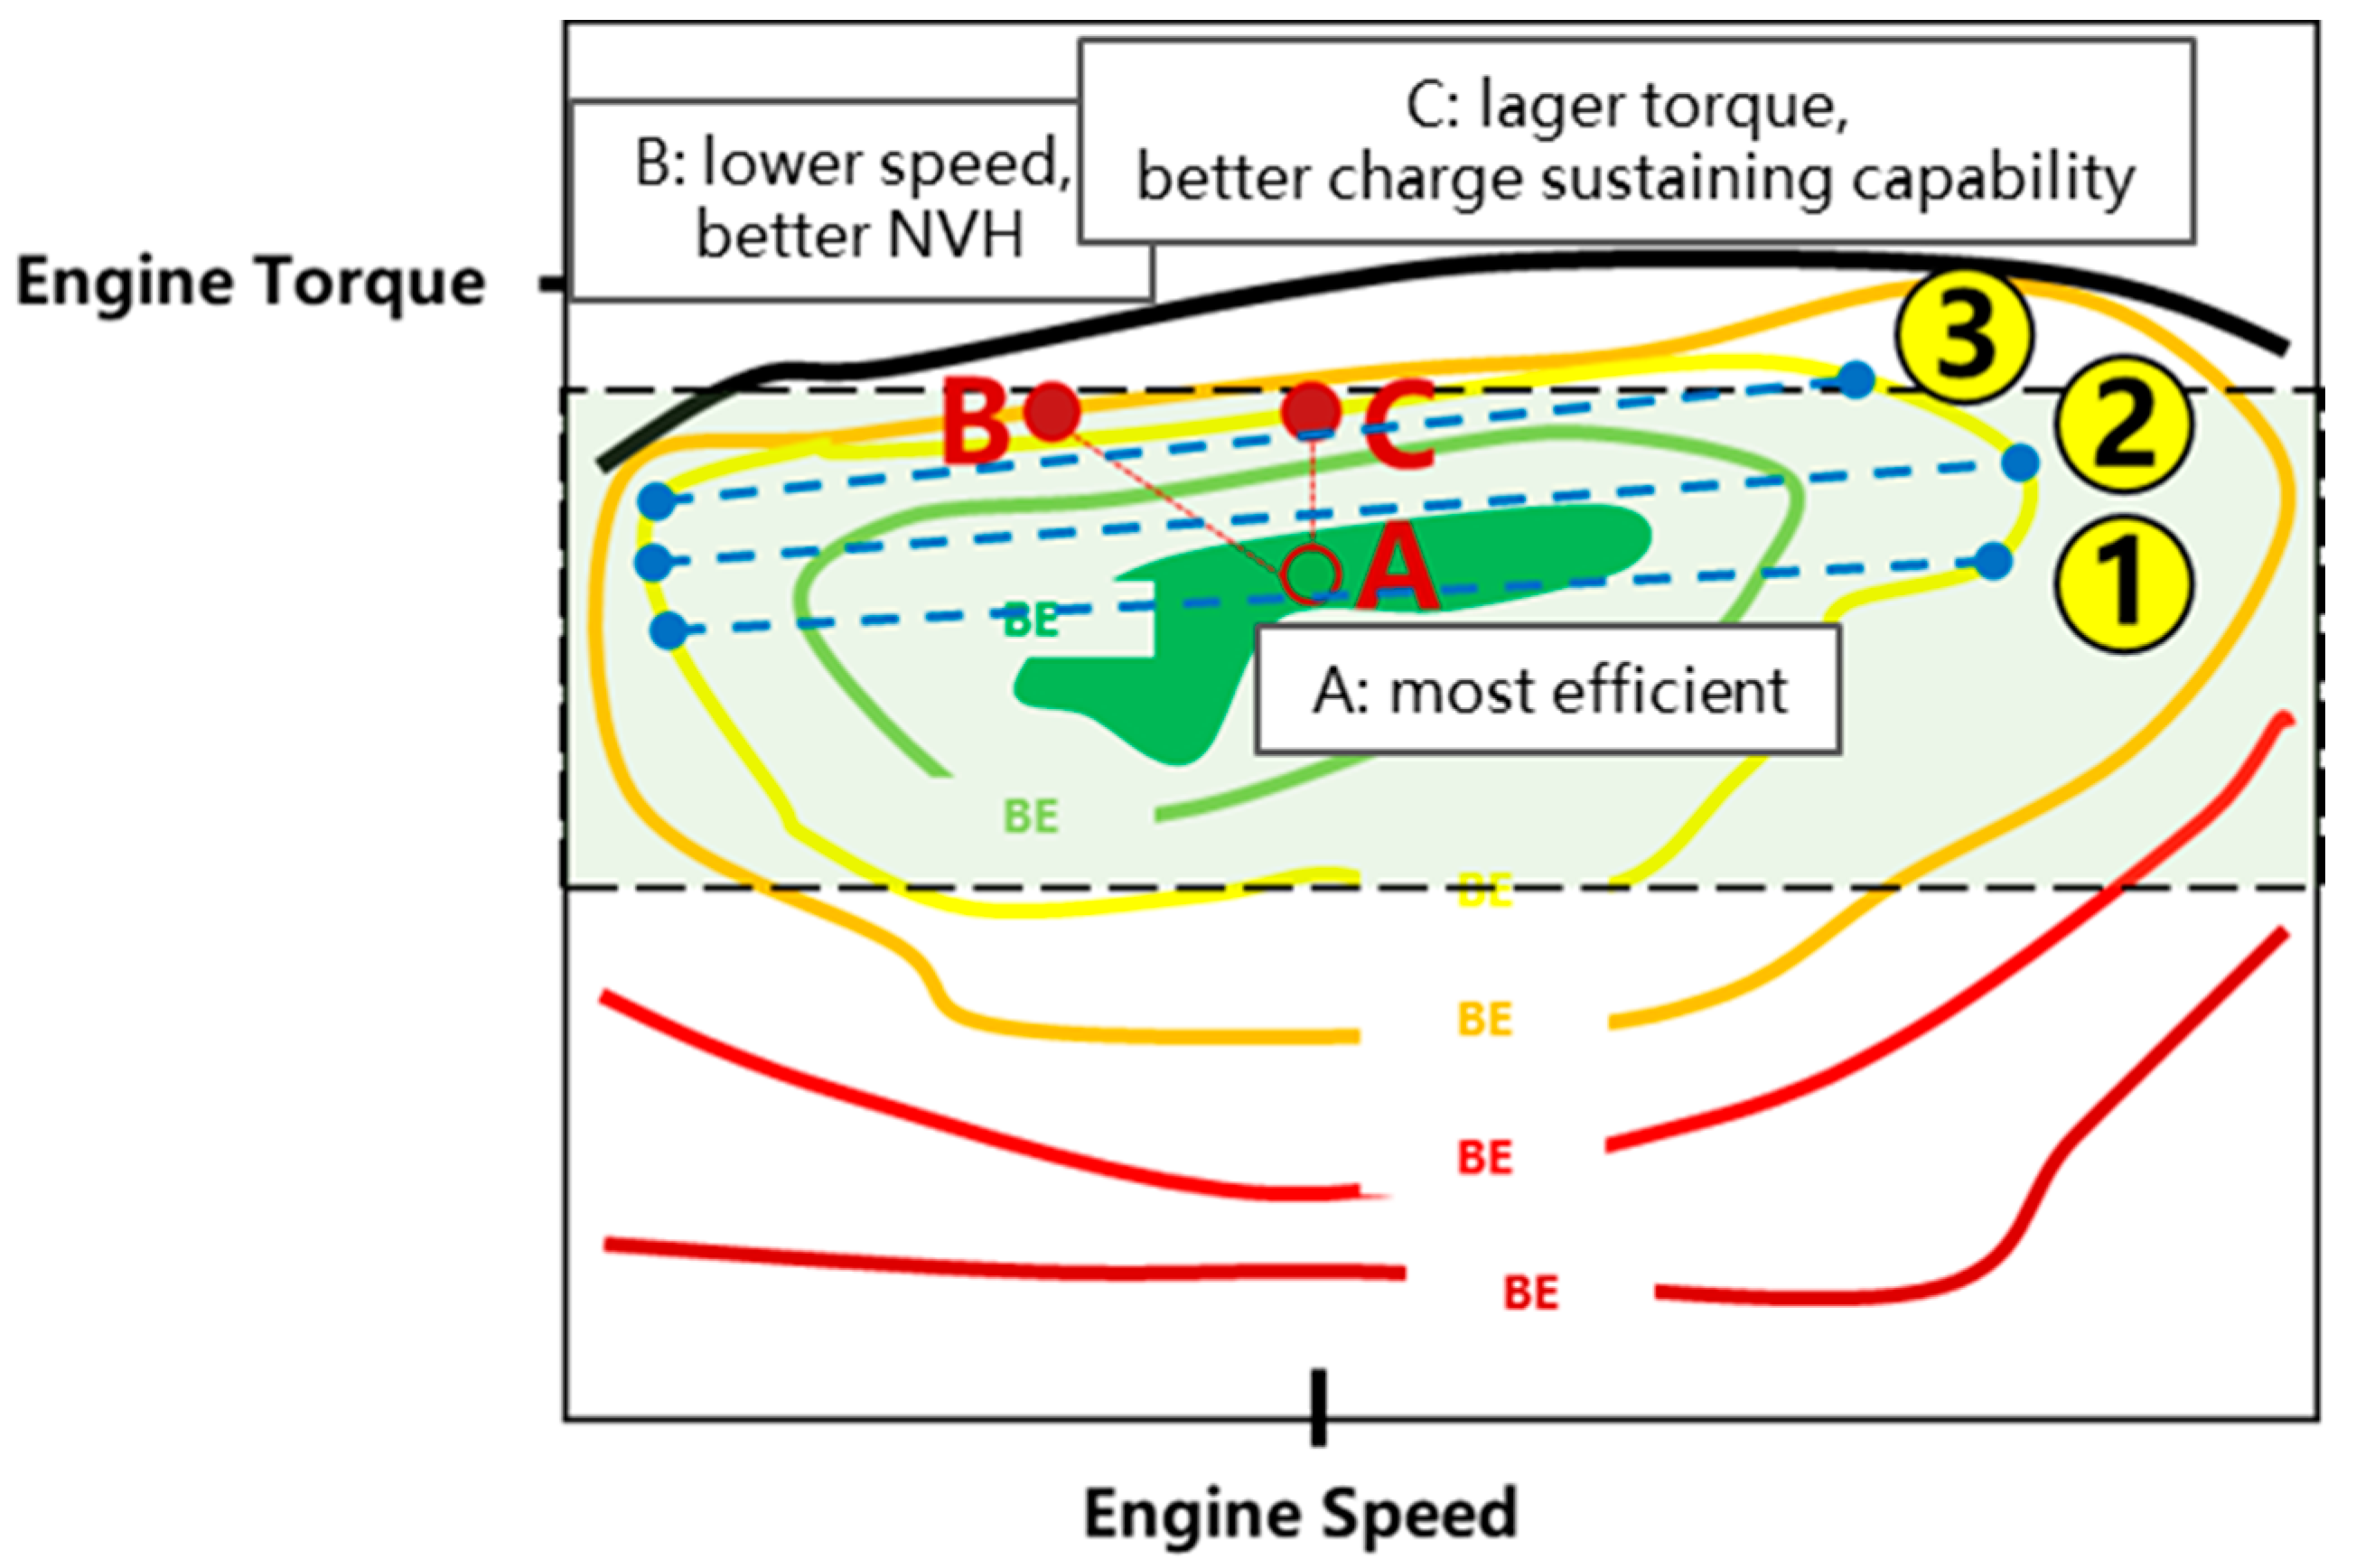
We illustrated the primary driving modes of a DMi vehicle in Section 2. To ensure the powertrain works efficiently, we studied the mode selection and energy management strategy in this section. Due to the large efficient area of the 1.5 L engine, the strategy could be implemented flexibly, which loosens the restriction of engine speed for better NVH performance and enhances the charging capability in the series mode. As Figure 4 shows, the engine works most efficiently at point A; however, we may move it to point B with the same output power if the engine speed is limited. Analogously, the working point could be moved to point C with the increase of the power requirement, which directly improves the charge sustaining capability. The parallel mode is a relatively efficient HEV mode because it only goes through the conversion process from chemical energy to thermal energy to mechanical energy, and the energy flow passes through relatively few components. However, since the engine speed cannot be decoupled from the wheel end, the joint control of the speed dimension and the torque dimension cannot be achieved. Therefore, the most economical method is to achieve line control through torque distribution. Similarly, there can be multiple such lines, which are represented by the blue dash lines in Figure 4, to meet the sub-optimal solution under different charging demand and wheel-end demand. From a certain perspective, this is a multi-objective optimization problem, which is to seek the best solution that achieves a balance of system efficiency, engine power generating capability, and engine speed performance. The balance point should be located on the eco area of the engine efficiency map. Thus, the strategy implemented in the simulation model obeys some basic principles [21] and other rules:
- The remaining electricity is a prerequisite for entering EV mode.
- The power demand under different SOC is a prerequisite for engine start.
- Velocity is a prerequisite for entering parallel mode.
- The engine speed is limited by the acceleration pedal depth and the velocity after considering the NVH requirement.
- The engine torque is located at the ‘eco area’ and determined by the current status of the acceleration pedal depth and SOC.
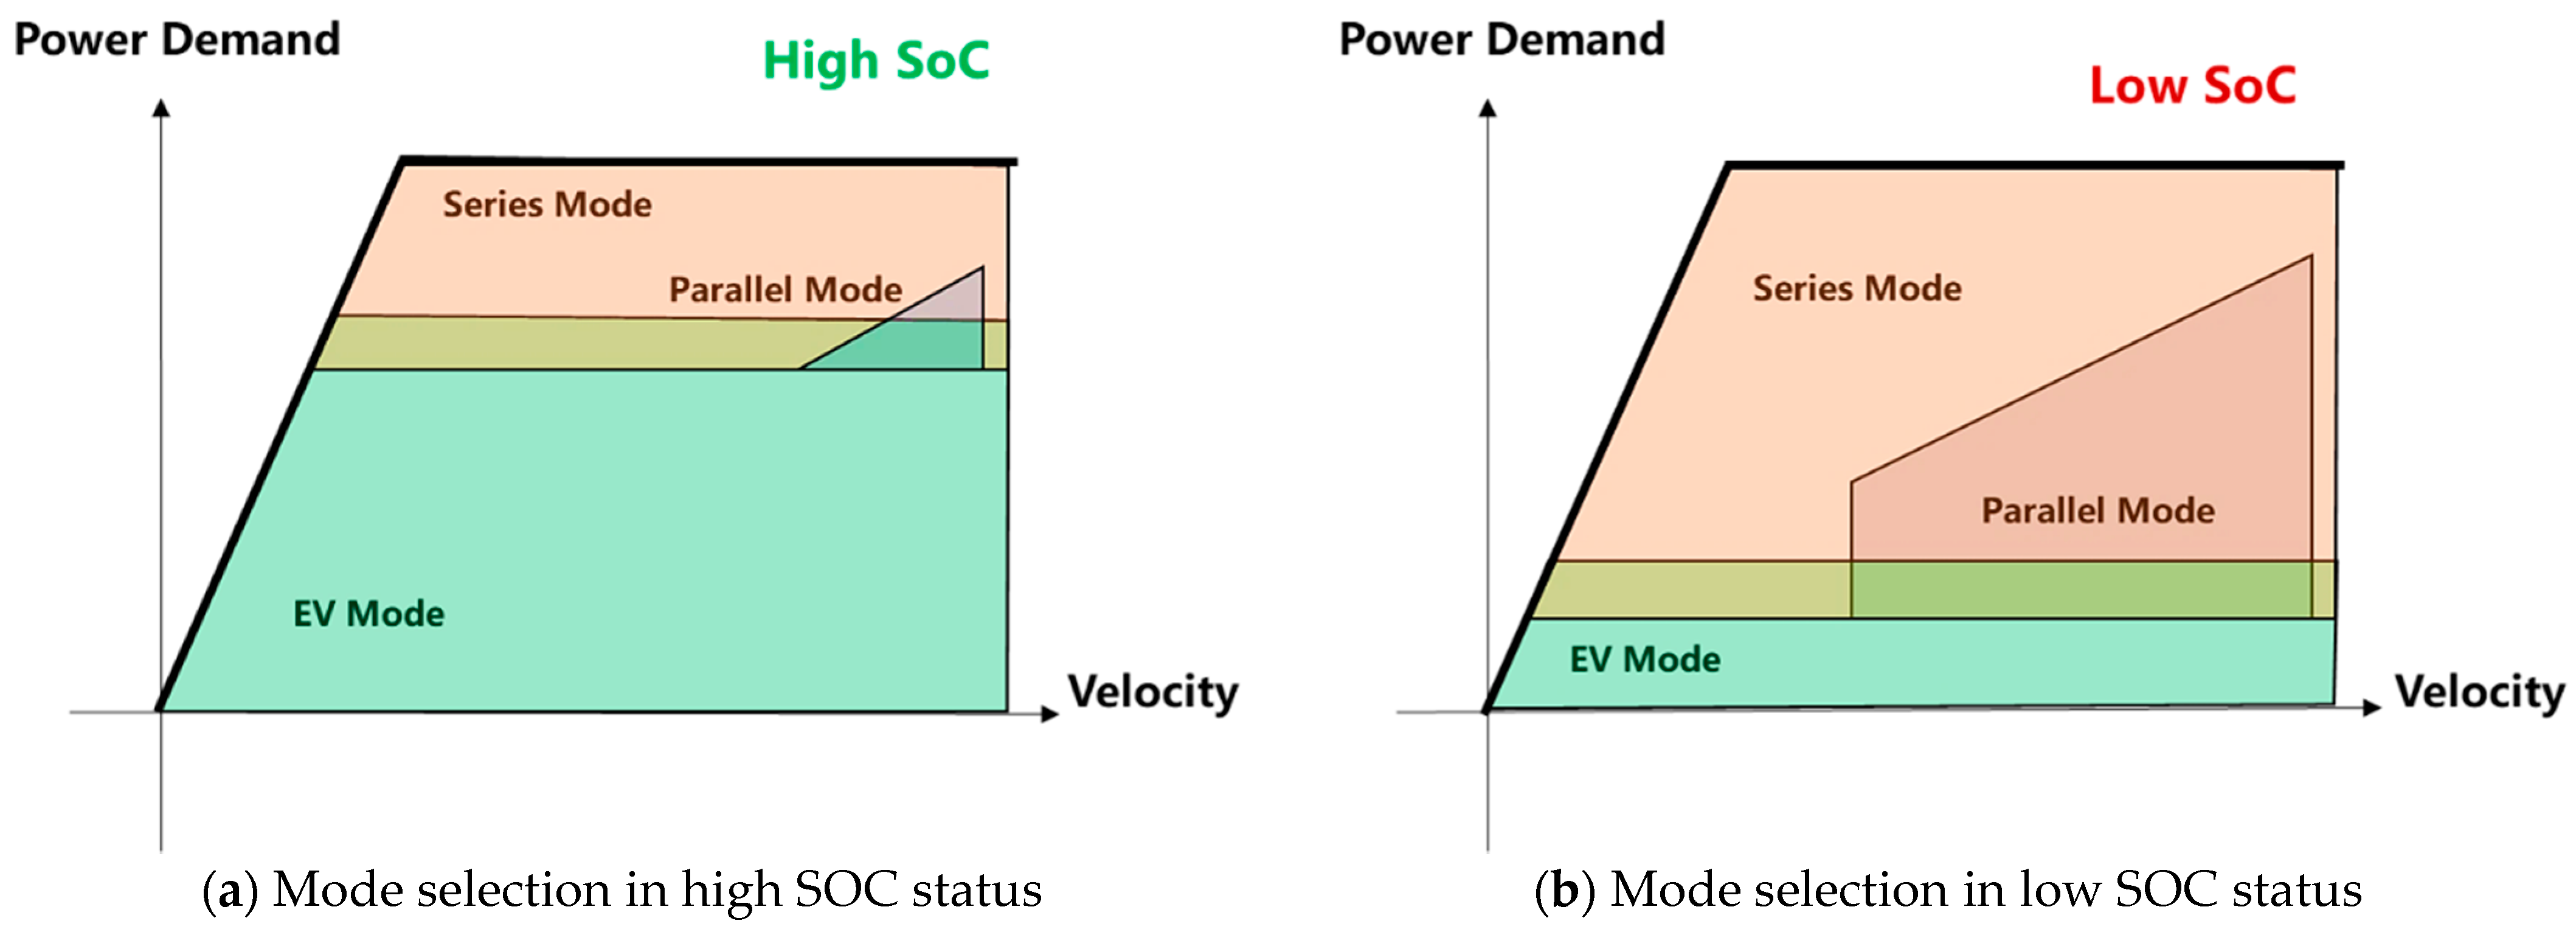
Under the guidance of these principles, we propose the basic strategy logic of DMi mode selection; Figure 5 reflects on two dimensions: power demand and velocity. Similar to what we mentioned in the last section, the drive motor can exert its maximum power in series mode; therefore, the EHS should enter the series mode when the power demand exceeds the threshold, and SOC is a constraint to adjust the threshold to ensure the charging sustaining capability.
In Figure 5, we can see that the threshold is relatively high in the full charge state; however, it drops to a tiny value in the charge sustaining process. The threshold setting also follows the first principle, and the EHS tends to use the battery as the only energy source in most driving conditions in the charge-depleting process. As the velocity increases to a certain value, which is higher than the velocity matching the engine idle speed, the EHS is able to enter the parallel mode. Due to the limitation of engine speed and wheel-end coupling, it is difficult for the engine to reach a high-power state in parallel mode. Thus, the parallel mode can only work in a range of power demands at different vehicle velocities. As Figure 5 shows, the EHS can find it hard to enter the parallel mode in the full charge state, but this mode works in high-velocity cruising or slow acceleration conditions when SOC is low. One point to note is that the process of mode switching is not triggered by a single boundary condition but is decided by the dynamic states of variables. It is necessary to consider retaining a ‘transition zone’ in strategy design to prevent the frequent starting and stopping of components. Hence, we can find some areas covered by two or even three modes.
6. Simulation Model and Fuel Consumption Analysis
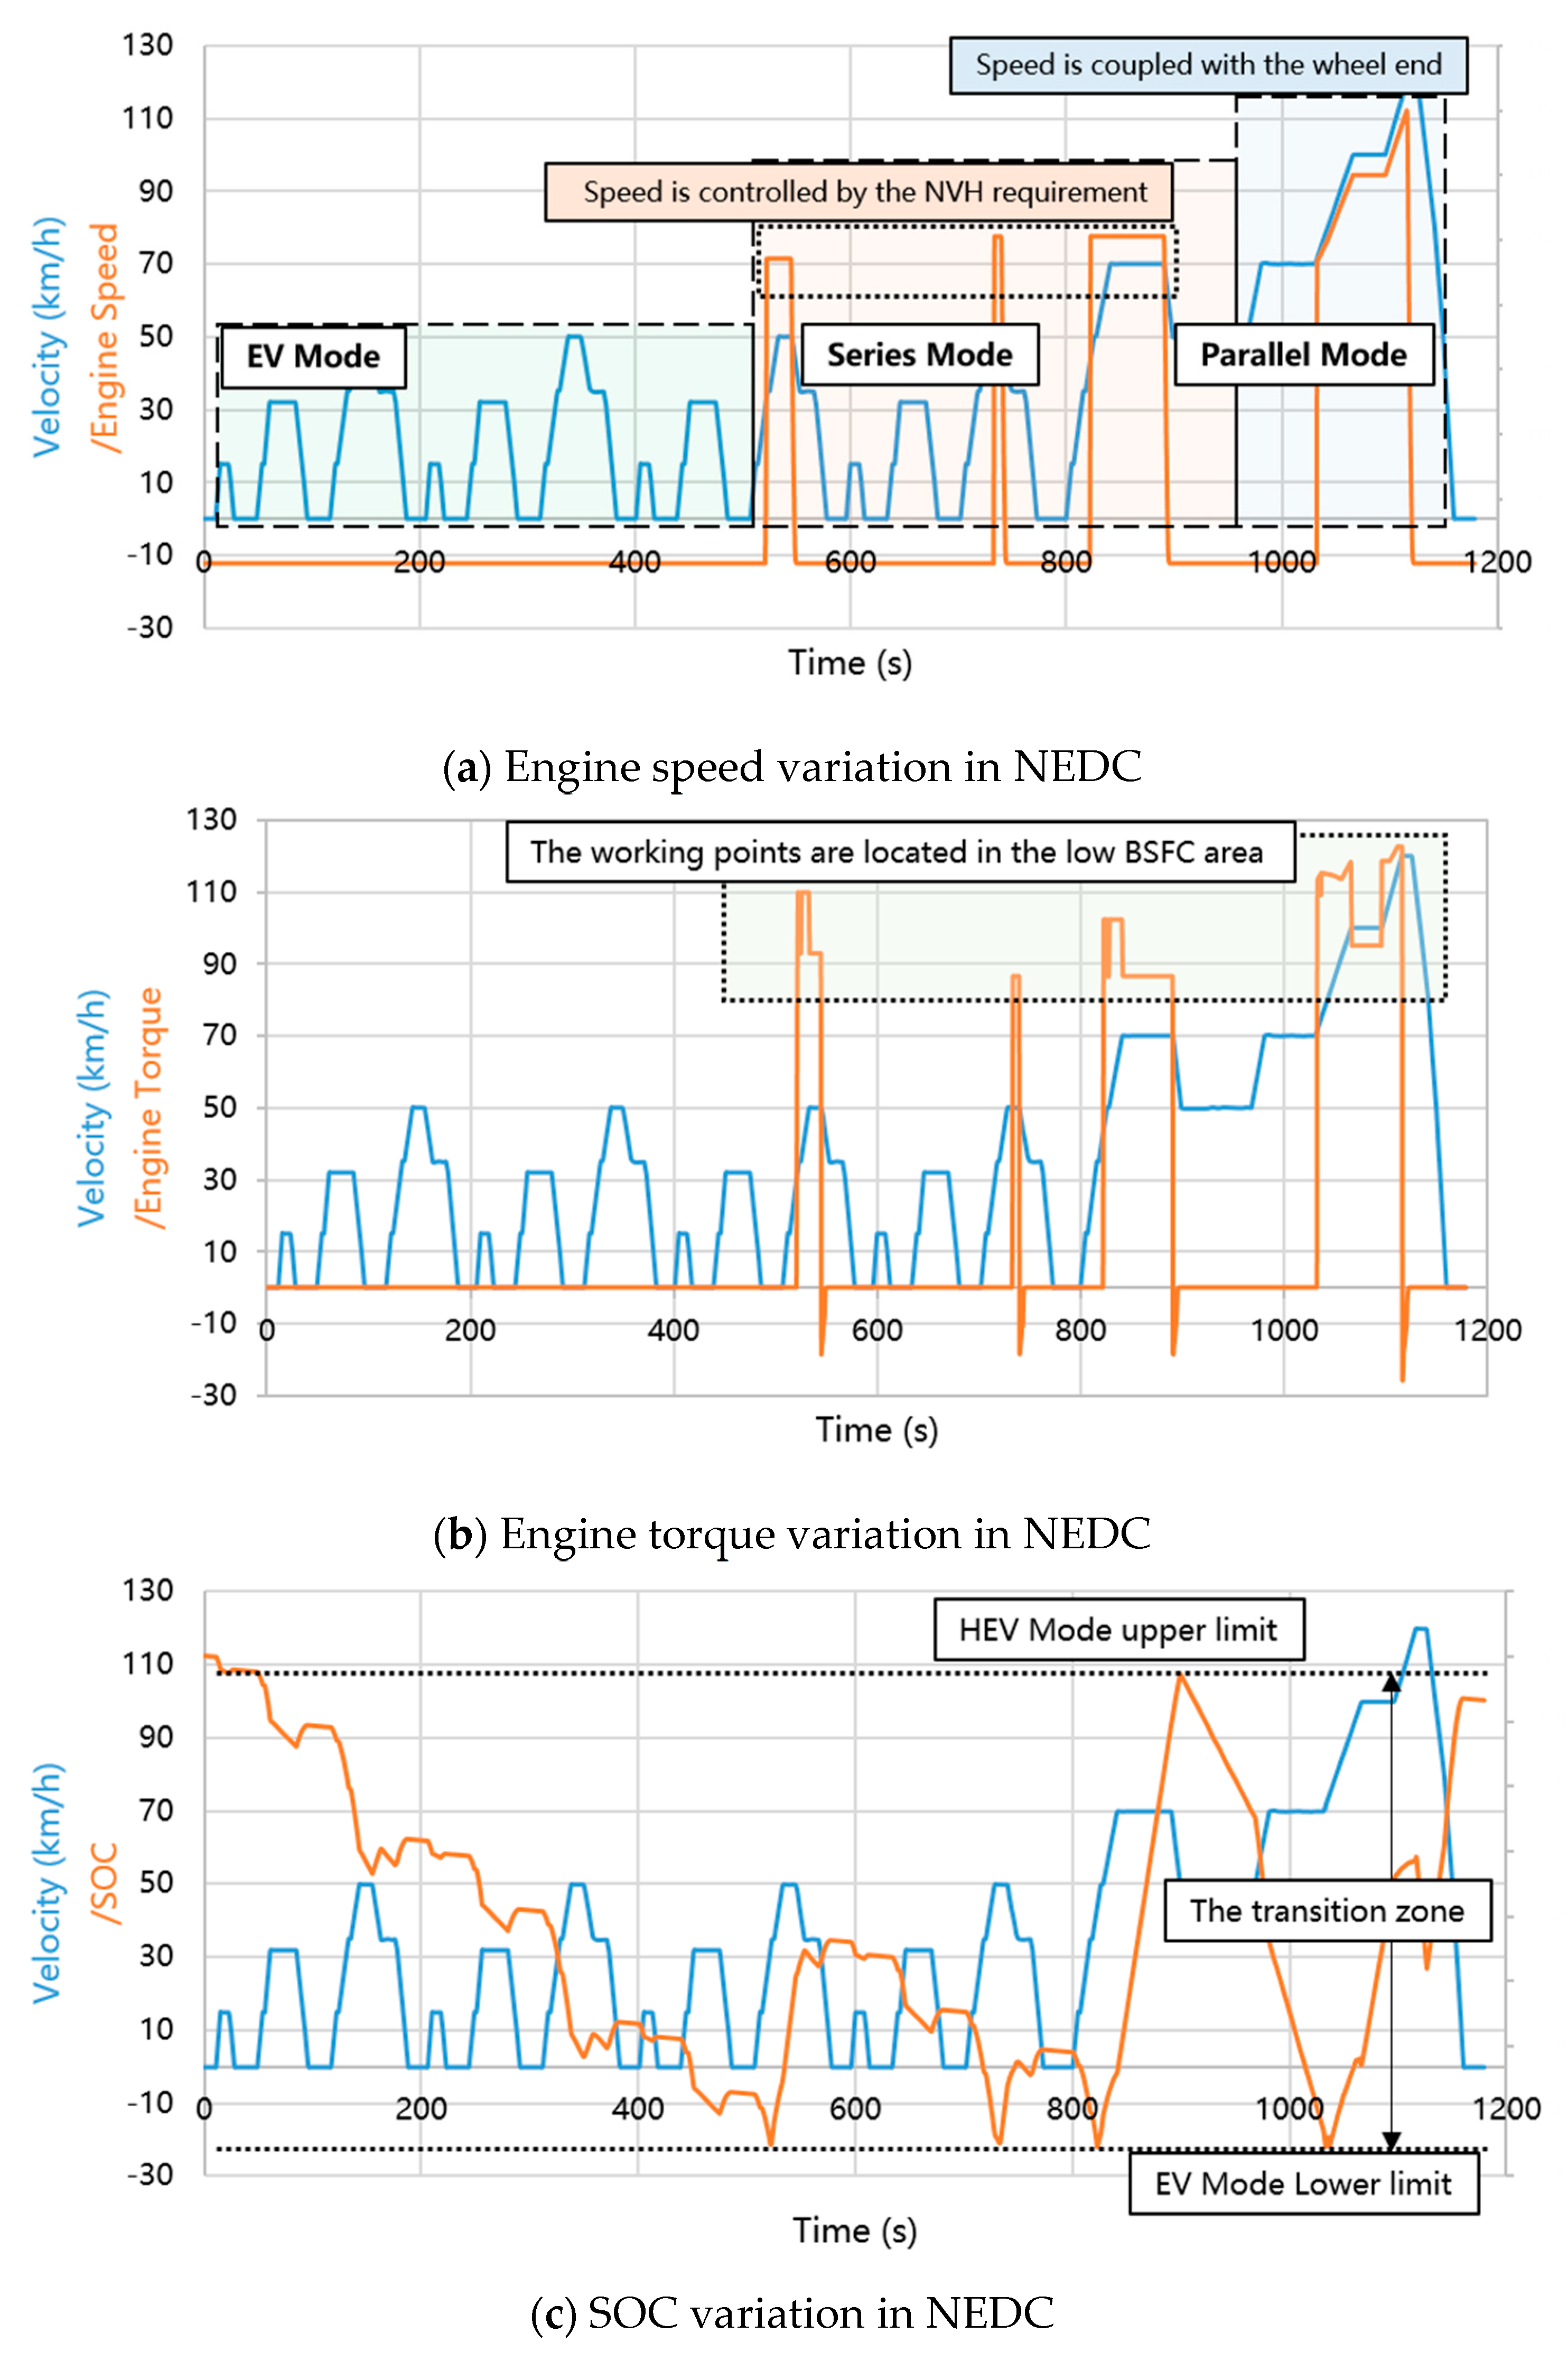
As mentioned in Section 2, we built the vehicle simulation model by AVL Cruise. After filling the parameters and coding the discussed strategy with function components, we conducted the simulation with the cycle dataset mentioned in Section 4. To better declare how the EHS works on Qin Plus, we select a relatively clear and simple cycle, NEDC, for further analysis. Figure 6 shows the status of the engine and the battery in the ‘balance’ cycle in the charge sustaining process. Figure 6a shows the engine speed variation during this cycle, and we can see that the engine speed is limited in the series mode by considering the NVH performance. In Figure 6b, the engine torque is controlled in a relatively narrow interval to ensure the engine works efficiently, and we can easily find the transition zone by analyzing the SOC variation in Figure 6c, which is mentioned in the last section. To better decipher this dynamic process, a description of the driving condition is required. In the first two urban road conditions (low-speed conditions), because SOC is high enough so that the mode switching threshold is not triggered, the vehicle keeps driving in the EV mode. In the last two city road conditions and the medium speed part of suburban conditions, the battery consumes more energy, and the vehicle accelerates. At this time, there is a relatively large power demand while the velocity is not matching the entering threshold of the parallel mode. Thus, the vehicle enters the series mode driving until it has to brake. In the high-speed section of the suburban working conditions, with both the SOC and power demand conditions being triggered, the whole vehicle enters the parallel mode. The engine speed is coupled with the wheel-end velocity. The engine torque is slightly increased compared to the series mode, but it still works in the eco area. In this NEDC cycle, Qin Plus basically reaches charge balance [22] (in this study, we set the actual difference between the initial SOC and the terminal SOC to be less than 0.25%), and the simulated fuel consumption result is 3.75 L/100 km, which is consistent with the corresponding experiment. As for the other DMi vehicles, we also conducted the simulation with this model and fulfilled the property parameters of each mode; the results indicate that the error of CD energy consumption calculation is less than ±0.3 k Wh 100 km, and the error of CS fuel consumption is less than ±0.15 L/100 km. Aside from the difference between the real world road sliding resistance and the theoretical resistance obtained by our model, and the precision of the calibration efficiency MAP data, the small amount of charge and discharge of the battery (for example, in simulation, the battery may be charged with 0.02 kWh while it may discharge 0.05 kWh in the balance cycle of the test) may cause a tiny variation. Moreover, we can find that the engine has only four start-stop cases in this NEDC cycle. Compared with the experiment, the simulation result has fewer engine start and stop times, which is related to the initial value of the current cycle SOC and the start-stop trigger strategy. Although this has no direct effect on fuel consumption, fewer driving mode shifts provide better drivability and NVH performance [13,16].
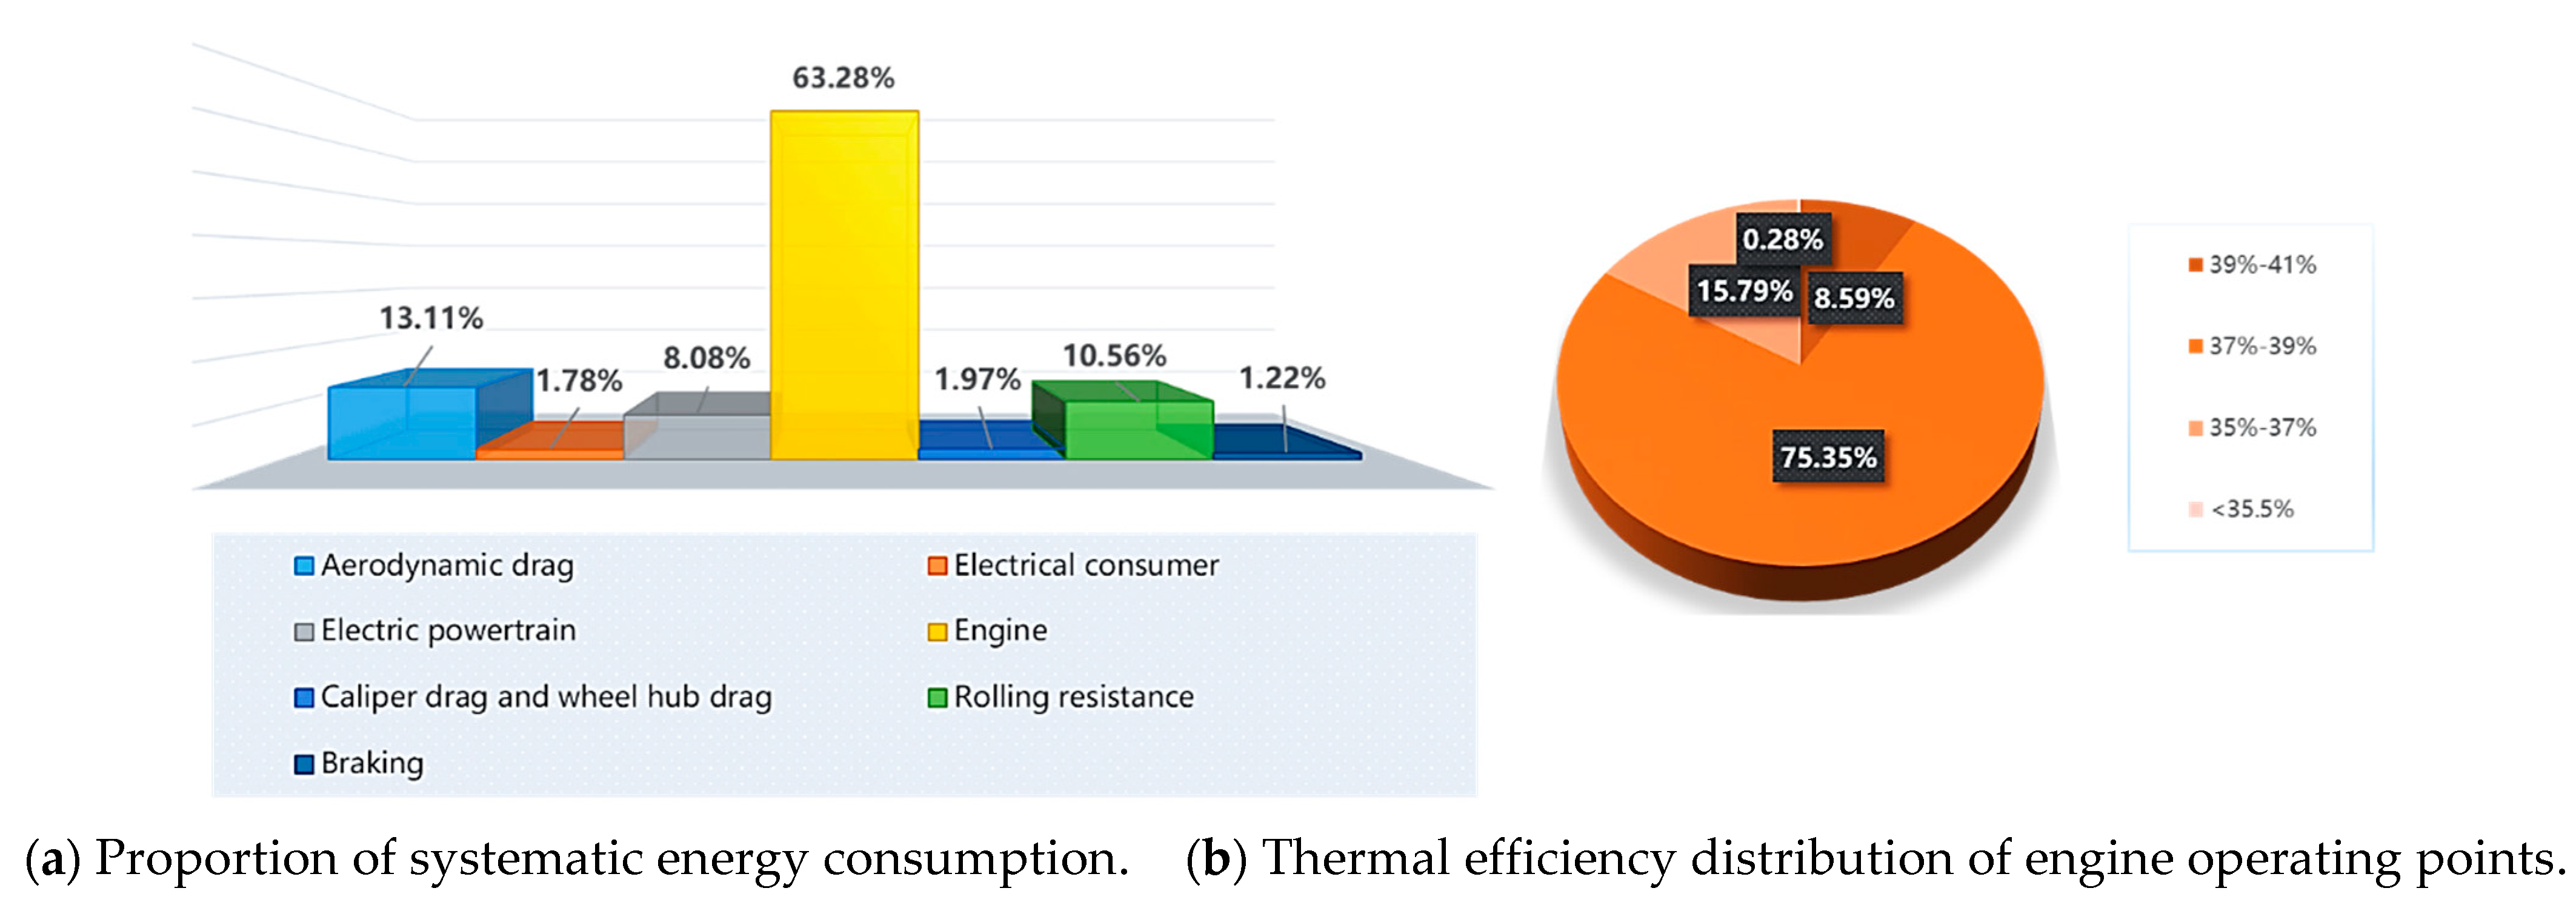
Figure 7 shows the systematic decomposition of the fuel consumption performance of Qin Plus. Aerodynamic drag, rolling resistance, and powertrain efficiency are the highest energy consumption factors in addition to engine heat loss. As specified in the part of the resistance decomposition, the rolling resistance and efficiency of the powertrain have been greatly optimized. The potential optimization of the resistance and the energy consumption lies in aerodynamic drag reduction. We conduct the statistical analysis of thermal efficiency distribution to judge whether the high-efficiency area of the 1.5 L engine is fully utilized. It can be seen from the right half of Figure 7 that close to 10% of the operating points fall in the most efficient region with a thermal efficiency range from 39% to 41%, and the thermal efficiency of more than 80% of operating points exceeds 37%. That is to say the energy management strategy ensures that the engine always works in the eco area.
7. Conclusions
This work introduces the DMi vehicles’ performance by the multi-system coupling analysis of Qin Plus. Qin Plus can achieve excellent energy consumption on account of its optimization of driving resistance, the selection and matching of the powertrain and its components, and the realization of the energy management strategy. This paper specifies these major subsystems and how they influence the power performance and energy consumption of the vehicle and tries to clarify the influence by simulation. The simulation results show that the resistance optimization of Qin Plus ensures its low energy consumption in EV mode. Moreover, the EHS fully utilizes the high efficiency of the 1.5 L engine with the energy management strategy to obtain the excellent fuel consumption performance.
Author Contributions
Conceptualization, S.L. and P.W.; methodology, P.W.; software, P.W.; validation, D.Z. and S.L.; formal analysis, S.L. and L.Y.; investigation, P.W. and W.P.; data curation, L.Y. and W.P.; writing—original draft preparation, P.W.; writing—review and editing, S.L; supervision, D.Z. and S.L. All authors have read and agreed to the published version of the manuscript.
Funding
This research received no external funding.
Acknowledgments
We want to thank BYD Auto Engineering Research Institute. We also want to thank MDPI publisher.
Conflicts of Interest
The authors declare no conflict of interest. All authors are employees of BYD Auto Industry Company Ltd. The paper reflects the views of the scientists, and not the company.
References
- Vidyanandan, K.V. Overview of electric and hybrid vehicles. Energy Scan. 2018, 3, 7–14. [Google Scholar]
- Sabri, M.F.M.; Danapalasingam, K.A.; Rahmat, M.F. A review on hybrid electric vehicles architecture and energy management strategies. Renew. Sustain. Energy Rev. 2016, 53, 1433–1442. [Google Scholar] [CrossRef]
- Rievaj, V.; Stopka, O.; Vrabel, J.; Mokrickova, L.; Schmidt, C. The Impact of Air Resistance on the Fuel Consumption in Real Conditions within the Transport Operation. Commun. Sci. Lett. Univ. Zilina 2016, 18, 57–61. [Google Scholar]
- Zhang, H.; Tolbert, L.M.; Ozpineci, B. Impact of SiC devices on hybrid electric and plug-in hybrid electric vehicles. IEEE Trans. Ind. Appl. 2010, 47, 912–921. [Google Scholar] [CrossRef]
- Bozza, F.; De Bellis, V.; Teodosio, L. Potentials of cooled EGR and water injection for knock resistance and fuel consumption improvements of gasoline engines. Appl. Energy 2016, 169, 112–125. [Google Scholar] [CrossRef]
- Yuan, X.; Zhang, C.; Hong, G.; Huang, X.; Li, L. Method for evaluating the real-world driving energy consumptions of electric vehicles. Energy 2017, 141, 1955–1968. [Google Scholar] [CrossRef]
- Zhang, J.; Inuzuka, S.; Kojima, T.; Shen, T.; Kako, J. Dynamical model of HEV with two planetary gear units and its application to optimization of energy consumption. Sci. China Inf. Sci. 2019, 62, 222203. [Google Scholar] [CrossRef] [Green Version]
- Zhang, L.P.; Qi, B.N.; Zhang, R.S.; Liu, J.; Wang, L. Powertrain design and energy management of a novel coaxial series-parallel plug-in hybrid electric vehicle. Sci. China Tech. Sci. 2016, 59, 618–630. [Google Scholar] [CrossRef]
- Ide, H.; Sunaga, Y.; Higuchi, N. Development of SPORT HYBRID i-MMD control system for 2014 model year accord. Honda R D Tech. Rev. 2013, 25, 32–40. [Google Scholar]
- Chen, K.; Trigui, R.; Bouscayrol, A.; Vinot, E.; Lhomme, W.; Berthon, A. A common model validation in the case of the Toyota Prius II. In Proceedings of the 2010 IEEE Vehicle Power and Propulsion Conference, IEEE, Dearborn, MI, USA, 7–11 September 2009; pp. 1–5. [Google Scholar]
- Son, H.; Kim, H. Development of near optimal rule-based control for plug-in hybrid electric vehicles taking into account drivetrain component losses. Energies 2016, 9, 420. [Google Scholar] [CrossRef] [Green Version]
- Vidal-Naquet, F.; Zito, G. Adapted optimal energy management strategy for drivability. In Proceedings of the IEEE Vehicle Power and Propulsion Conference, Seoul, Korea, 9–12 October 2012; pp. 358–363. [Google Scholar]
- Wang, H.; Hanfei, W. Implementation of an energy management strategy with drivability constraints for a dual-motor electric vehicle. World Electr. Veh. J. 2019, 10, 28. [Google Scholar] [CrossRef] [Green Version]
- Wang, Y.; Jiao, X.; Sun, Z.; Li, P. Energy management strategy in consideration of battery health for PHEV via stochastic control and particle swarm optimization algorithm. Energies 2017, 10, 1894. [Google Scholar] [CrossRef] [Green Version]
- Du, A.; Chen, Y.; Zhang, D.; Han, Y. Multi-Objective Energy Management Strategy Based on PSO Optimization for Power-Split Hybrid Electric Vehicles. Energies 2021, 14, 2438. [Google Scholar] [CrossRef]
- Zhuang, W.; Zhang, X.; Li, D.; Wang, L.; Yin, G. Mode shift map design and integrated energy management control of a multi-mode hybrid electric vehicle. Appl. Energy 2017, 204, 476–488. [Google Scholar] [CrossRef]
- Ahmadi, S.; Bathaee, S.M.T.; Amir, H. Hosseinpour. Improving fuel economy and performance of a fuel-cell hybrid electric vehicle (fuel-cell, battery, and ultra-capacitor) using optimized energy management strategy. Energy Convers. Manag. 2018, 160, 74–84. [Google Scholar] [CrossRef]
- Chan, C.C. The state of the art of electric and hybrid vehicles. Proc. IEEE 2002, 90, 247–275. [Google Scholar] [CrossRef] [Green Version]
- Zhao, C.; Gong, G.; Yu, C.; Liu, Y.; Zhong, S.; Song, Y.; Ye, H. Research on Key Factors for Range and Energy Consumption of Electric Vehicles; SAE Technical Paper; SAE International: Warrendale, PA, USA, 2019. [Google Scholar]
- Gong, G.; Zhao, C.; Zhou, X.; Deng, C.; Jiang, H.; Yu, C.; Zhou, A. Research on Factors to Influence Coasting Resistance for Electric Vehicles; SAE Technical Paper; SAE International: Warrendale, PA, USA, 2020. [Google Scholar]
- Xue, Q.; Zhang, X.; Teng, T.; Zhang, J.; Feng, Z.; Lv, Q. A Comprehensive Review on Classification, Energy Management Strategy, and Control Algorithm for Hybrid Electric Vehicle. Energies 2020, 13, 5355. [Google Scholar] [CrossRef]
- Bianchi, D.; Rolando, L.; Serrao, L.; Onori, S.; Rizzoni, G.; Al-Khayat, N.; Kang, P. A rule-based strategy for a series/parallel hybrid elecstric vehicle: An approach based on dynamic programming. In Proceedings of the Dynamic Systems and Control Conference, Cambridge, MA, USA, 12–15 September 2010; Volume 44175, pp. 507–514. [Google Scholar]
Figure 1.
Simple structure of the series-parallel hybrid system.

Figure 2.
DMi EV modes.

Figure 3.
DMi HEV modes.

Figure 4.
Basic strategy logic of DMi energy management.

Figure 5.
Basic strategy logic of DMi mode selection.

Figure 6.
Qin Plus charge sustaining process simulation.

Figure 7.
CS energy consumption and engine performance of NEDC.


Table 1.
Systematic contributions to EV modes energy consumption reduction.
| System | Improvement | Energy Consumption Reduction (kWh/100 km) | Contributions |
|---|---|---|---|
| Aerodynamic drag | 2.18% | 0.13 | 4.49% |
| Rolling resistance | 20.12% | 0.83 | 29.35% |
| Caliper drag | 85.24% | 0.81 | 28.87% |
| Low voltage accessories | 31.20% | 0.25 | 8.88% |
| Powertrain | 5.88% | 0.8 | 28.41% |
| Total (kWh) | 2.82 (Experimental result 2.8) |
Table 2.
Component’s parameters.
| Component | Parameter | Unit | Value |
|---|---|---|---|
| Engine | Engine displacement | L | 1.5 |
| Maximum power | kW | 81 | |
| Maximum torque | Nm | 135 | |
| Maximum thermal efficiency (Calibration) | % | 43 | |
| Motor | Maximum power | kW | 145 |
| Maximum torque | Nm | 325 | |
| Maximum speed | rpm | 16,000 | |
| Generator | Maximum power | kW | 70 |
| Nominal power | kW | 55 | |
| Maximum speed | rpm | 13,000 | |
| Transmission | EV mode transmission ratio | - | 10.126 |
| Parallel mode transmission ratio | - | 2.875 | |
| Series mode transmission ratio | - | 2.07 | |
| Battery | Voltage | V | 3.2 |
| Capacity | Ah | 41 |
Table 3.
Batteries comparison.
| NCM/NCA | LFP | BYD Blade Battery | |
|---|---|---|---|
| Energy density | high | low | normal |
| Cycle life | normal | long | long |
| Safety | low | high | ultra-high |
| Cost | high | low | low |
| Environmental friendliness | poisonous | non-poisonous | non-poisonous |
Publisher’s Note: MDPI stays neutral with regard to jurisdictional claims in published maps and institutional affiliations. |
© 2021 by the authors. Licensee MDPI, Basel, Switzerland. This article is an open access article distributed under the terms and conditions of the Creative Commons Attribution (CC BY) license (https://creativecommons.org/licenses/by/4.0/).
Share and Cite
MDPI and ACS Style
Li, S.; Wang, P.; Zeng, D.; Peng, W.; Yang, L. Multi-System Coupling DMi Hybrid Vehicle Modeling and Its Performance Analysis Based on Simulation. World Electr. Veh. J. 2021, 12, 215. https://doi.org/10.3390/wevj12040215
AMA Style
Li S, Wang P, Zeng D, Peng W, Yang L. Multi-System Coupling DMi Hybrid Vehicle Modeling and Its Performance Analysis Based on Simulation. World Electric Vehicle Journal. 2021; 12(4):215. https://doi.org/10.3390/wevj12040215
Chicago/Turabian StyleLi, Song, Puxi Wang, Dong Zeng, Wenjie Peng, and Liu Yang. 2021. "Multi-System Coupling DMi Hybrid Vehicle Modeling and Its Performance Analysis Based on Simulation" World Electric Vehicle Journal 12, no. 4: 215. https://doi.org/10.3390/wevj12040215