Article

Evaluation of Freshwater Provisioning for Different Ecosystem Services in the Upper Mississippi River Basin: Current Status and Drivers

1
College of Water Resources and Architectural Engineering, Northwest A&F University, 23 Weihui Road, Yangling 712100, Shaanxi, China
2
Department of Earth, Atmospheric, and Planetary Sciences, Purdue University, 550 Stadium Mall Drive, West Lafayette, IN 47907, USA
3
Department of Agriculture and Biological Engineering, Purdue University, 225 South University Street, West Lafayette, IN 47907, USA
4
Graham Sustainability Institute, University of Michigan, 214 S. State Street, Ann Arbor, MI 48104, USA
*
Author to whom correspondence should be addressed.
Water 2016, 8(7), 288; https://doi.org/10.3390/w8070288
Submission received: 9 March 2016 / Revised: 24 June 2016 / Accepted: 1 July 2016 / Published: 13 July 2016

Abstract

:
With the high demand for freshwater and its vital role in sustaining multiple ecosystem services, it is important to quantify and evaluate freshwater provisioning for various services (e.g., drinking, fisheries, recreation). Research on ecosystem services has increased recently, though relatively fewer studies apply a data driven approach to quantify freshwater provisioning for different ecosystem services. In this study, freshwater provisioning was quantified annually from 1995 to 2013 for 13 watersheds in the Upper Mississippi River Basin (UMRB). Results showed that the annual freshwater provision indices for all watersheds were less than one indicating that freshwater provisioning is diminished in the UMRB. The concentrations of sediment and nutrients (total nitrogen, and total phosphorus) are the most sensitive factors that impact freshwater provisioning in the UMRB. A significant linear relationship was observed between precipitation and freshwater provisioning index. During wet periods freshwater provisioning generally decreased in the study watersheds, primarily because of relatively high concentrations and loads of sediment and nutrients delivered from nonpoint sources. Results from this study may provide an insight, as well as an example of a data-driven approach to enhance freshwater provisioning for different ecosystem services and to develop a sustainable and integrated watershed management approach for the UMRB.

1. Introduction

Consideration of ecosystem services has recently emerged as an important tool in developing systems-based watershed management strategies. The Millennium Ecosystem Assessment (MEA) (2005) defines ecosystem services as “the benefits humans derive from ecosystems”. These benefits can be classified into four categories: provisioning services such as provision of food, freshwater, fiber; regulating services such as climate regulation, flood protection, and water purification; cultural services including aesthetic and recreational values; and supporting services such as nutrient cycling and soil formation [1,2]. Freshwater is an important component of human well-being and economic development. Humans rely on ecosystems to provide many water-related services, such as water supply for drinking, irrigation, hydropower production and industrial use as well as recreation, fisheries, etc. These water-related ecosystem services are derived from freshwater and are commonly referred to as freshwater (or hydrological) ecosystem services [3,4,5,6].
There are many natural and anthropogenic influences that affect freshwater provisioning for different ecosystem services. Natural factors include biophysical properties and climatic drivers, and anthropogenic drivers include land use and land management [7,8]. Climate change may alter the hydrological cycle on both local and global levels through increases in temperature and changes in the intensity, duration, and frequency of extreme precipitation events. Land management can directly modify components of the hydrologic cycle that affect freshwater provisioning for different ecosystem services, e.g., through overusing water supplies via irrigation and degrading water quality through the losses of fertilizers and pesticides to streams [9,10]. Given the interconnectedness between freshwater availability and many ecosystem services, it is important to quantify freshwater provisioning and evaluate those factors influencing it so that effective watershed management strategies can be developed. Leh et al. [11] and Egoh et al. [12] assessed multiple ecosystem services (surface water supply, carbon storage, nutrient and sediment retention, etc.) by using the Integrated Valuation of Ecosystem Services and Tradeoffs (InVEST) tool in West Africa and South Africa, respectively. Terrado et al. [9] and Bangash et al. [13] analyzed the current status of freshwater provisioning and erosion control service by using InVEST model and evaluated how these services are expected to change under different climate extremes in a Mediterranean river basin. Few studies have even been done to evaluate factors influencing flow availability and water quality in the Upper Mississippi River Basin (UMRB). For example, Frans et al. [14] and Schilling et al. [15] assessed the streamflow implications of climate and land use/land cover changes in the UMRB using the Variable Infiltration Capacity (VIC) model and statistical analysis. Demissie et al. [16] and Wu et al. [17] used the Soil and Water Assessment Tool (SWAT) to evaluate the impact of biofuel production on regional water resource and water quality in the UMRB. These studies utilized model-based methods to evaluate flow and water quality in the UMRB. However, no study in this basin has evaluated freshwater provisioning and its driving factors by applying an ecosystem service-based approach. The ecosystem service concept provides a way for people to understand the sometimes negative feedback loop that is generated when they consume goods and services from ecosystems. It is important to apply the ecosystem service concept to land management, economic and policy decisions. The UMRB provides an interesting case study as it has been affected by various anthropogenic activities, including sustained and intensive row crop production. Extensive conversion of the historic prairie and forest landscape to agriculture and the alteration of the rivers for navigation and flood control have adversely impacted the ecological integrity and ecosystem structures in the basin [14,18,19].
For these reasons, we selected the UMRB as our study area. We mainly evaluate freshwater provisioning for different ecosystem services with a synthesized index considering both water quantity and water quality simultaneously. Freshwater provisioning is defined in this study as the quantity of freshwater which can be provided for multiple uses (drinking, fisheries, recreation, and survival conditions for aquatic lives) in the case that water conditions simultaneously meet the environmental flow requirements and water quality standards. Thus, the major objectives of this study are to (1) quantify freshwater provisioning for multiple uses in the UMRB; and (2) evaluate the drivers that influence patterns on freshwater provisioning in the basin.

2. Materials and Methods

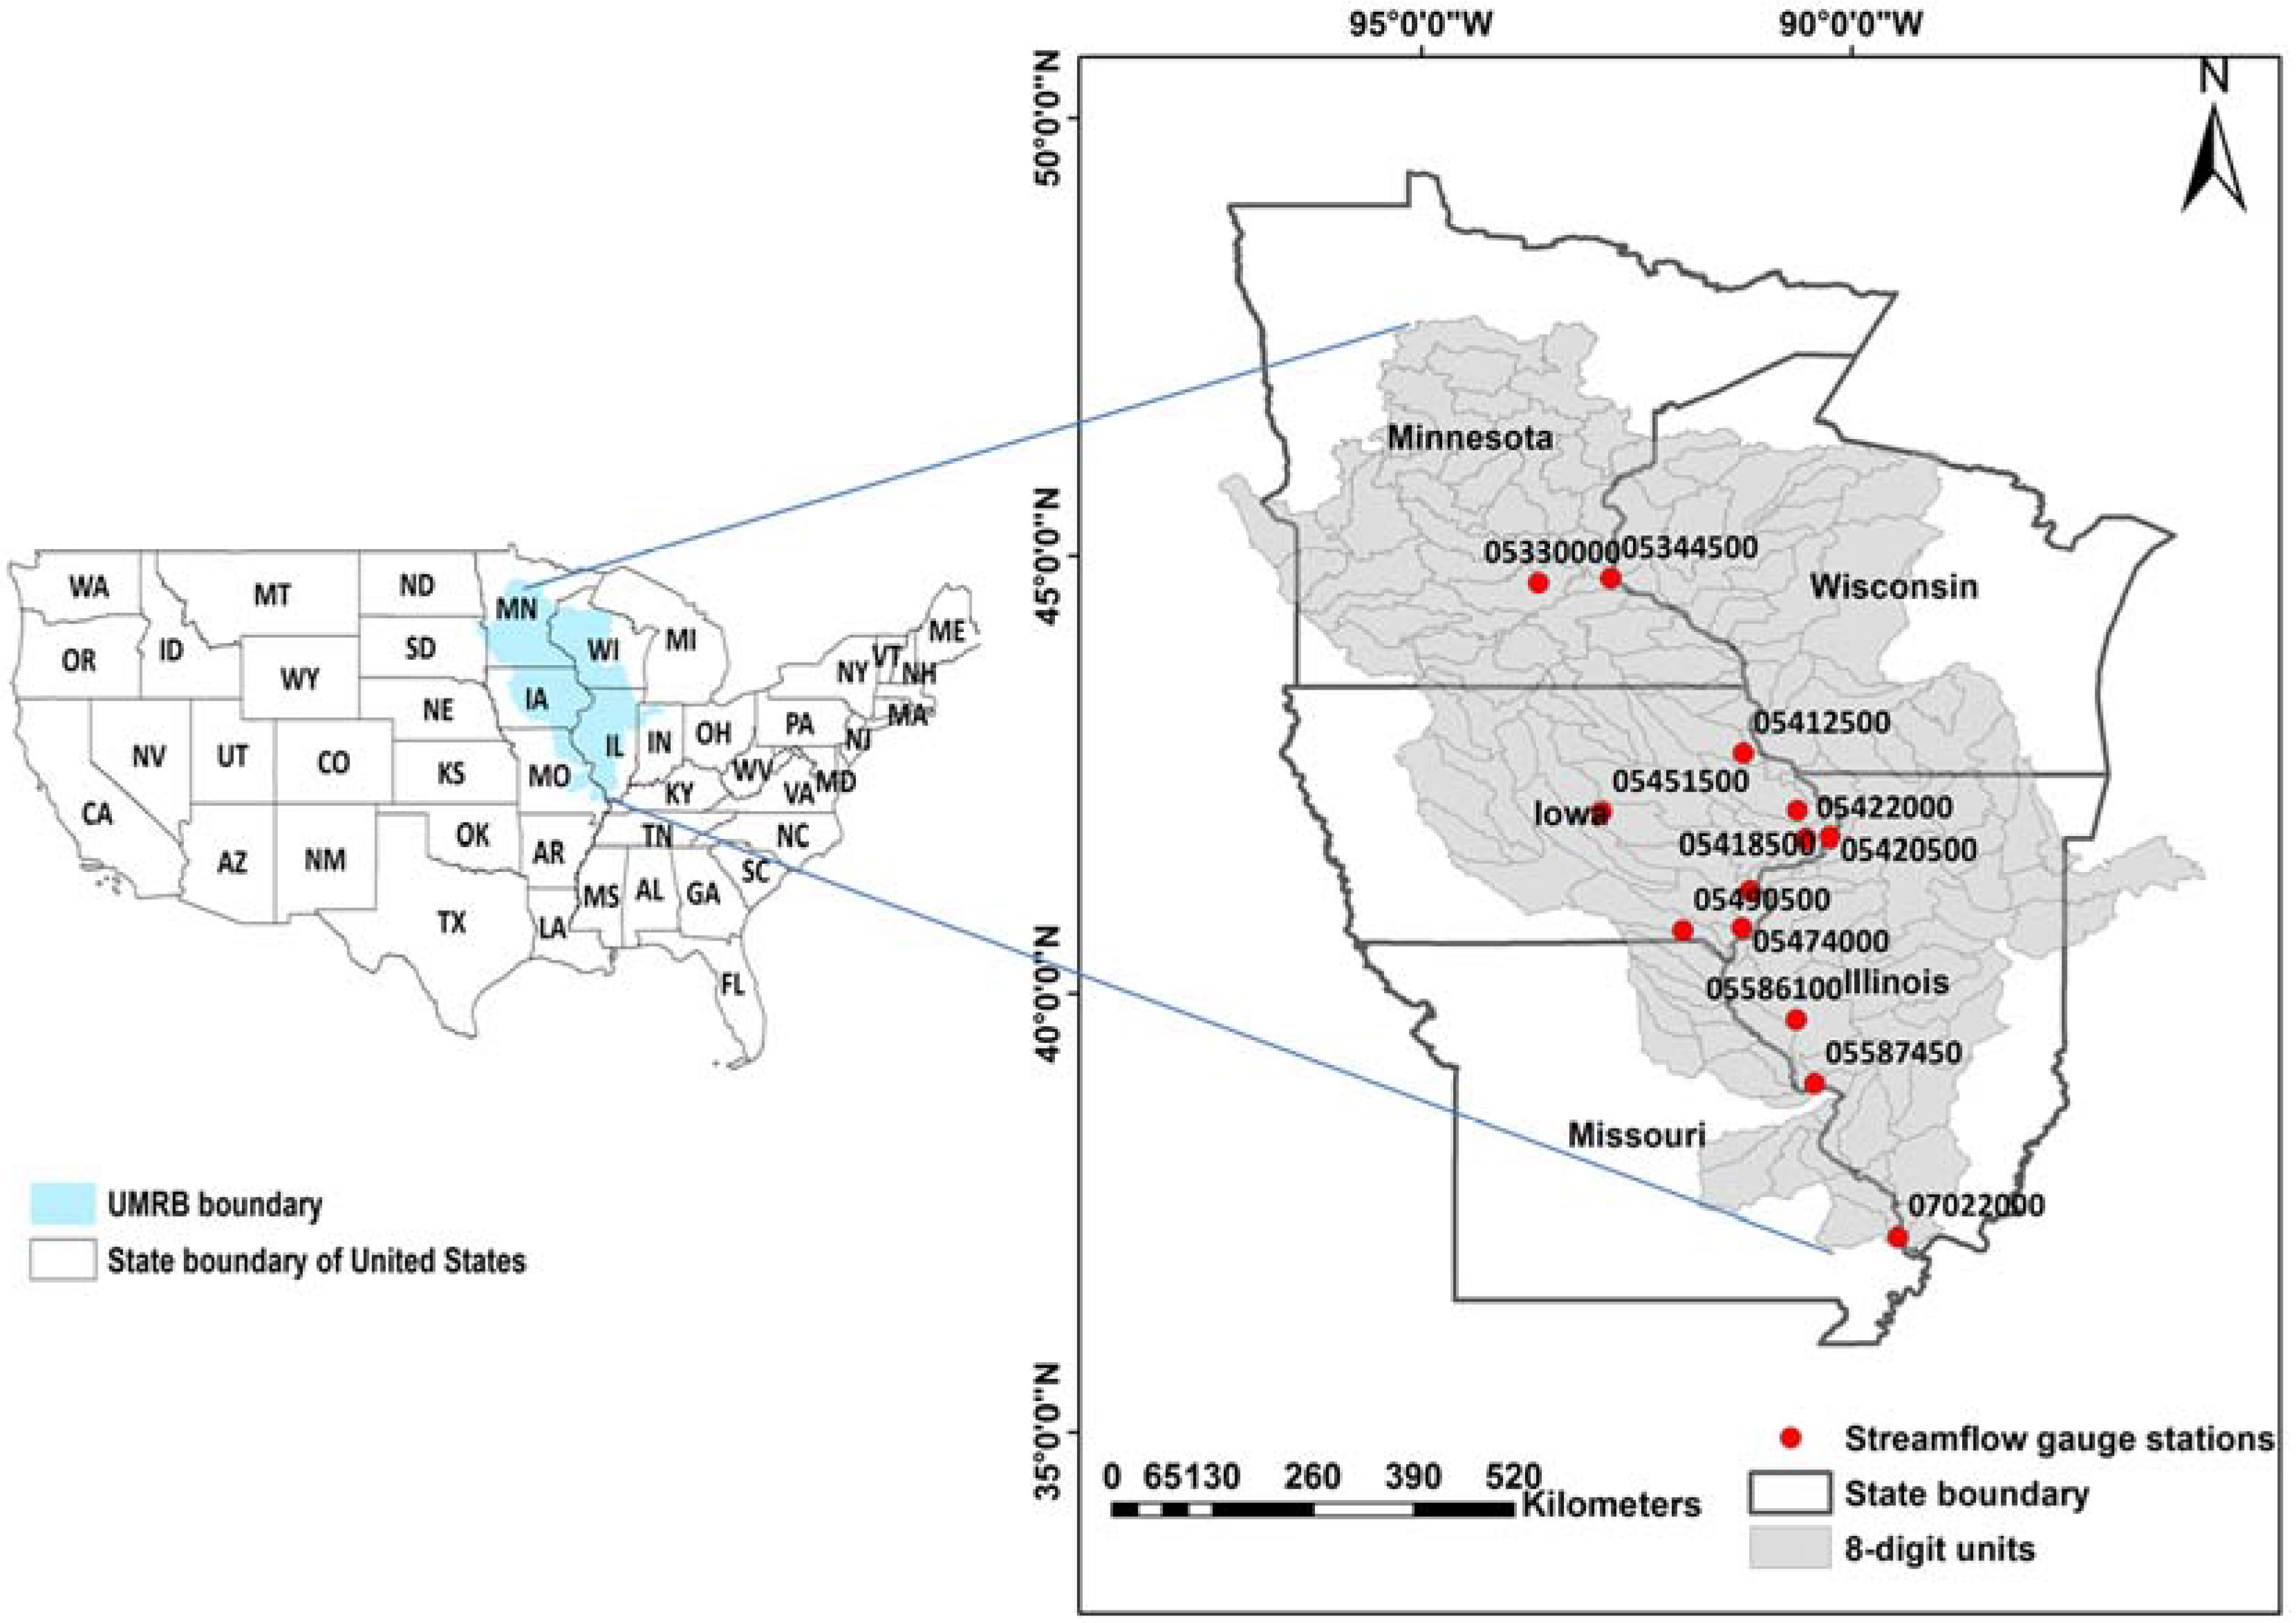
2.1. The Upper Mississippi River Basin

The UMRB encompasses the headwaters of the Mississippi River, which is the largest river in North America (Figure 1). The Upper Mississippi River flows about 2100 km and stretches from Lake Itasca in Minnesota to the confluence with the Ohio River just north of Cairo in Illinois. The total drainage area of UMRB is approximately 492,000 km2, and covers large sections of Minnesota, Wisconsin, Iowa, Illinois and Missouri [20]. The latitude of the basin ranges from 37° N to 47° N and the longitude from 87° W to 97° W. Due to the north-south flow across the temperate zone of North America, climate conditions in the basin vary considerably. The average annual air temperature in the basin ranges from 3 °С in the north to 15 °С in the south. Similarly, the average annual precipitation is approximately 900 mm based on monitoring data from the last four decades, and ranges from 600 mm/year in the north to 1220 mm/year in the southern parts of the basin [18,19]. The primary land uses in the basin are agriculture, forest, wetlands, lakes, prairies, and urban areas. As an agriculturally-dominated river basin, over 60% of land use in the UMRB is cropland or pasture with the major cash crops being corn and soybeans. The river system of UMRB is not only a nationally important ecosystem, but it is also a commercial navigation system. The river water is primarily used for drinking purposes and industrial applications [21,22,23]. Despite its ecological significance, the conservation status and the ecological integrity of UMRB have been heavily impacted due to various anthropogenic activities, including land use changes to support extensive agricultural production, and hydrologic modification of rivers for navigation and flood control [14,18,19].

2.2. Data Sources

The representative stations used for freshwater provisioning evaluation in this study were chosen because they were located on or near main streams and preferably near the basin outlet. We also only considered stations where measured flow and water quality data were available for the recent 30 years. A total of 13 stream gauges were selected that met these two conditions and were used to calculate and analyze freshwater provisioning for multiple uses (Table 1). The daily streamflow data with the time period ranging from 1 January 1995 to 31 December 2013 were retrieved from the United States Geological Survey (USGS) national water information system (NWIS) database. Water quality data were sparser and not available at a daily time scale. Regardless, all available water quality data including concentrations of total nitrogen (TN), total phosphorus (TP) and total suspended solids (TSS) for the same period were also obtained from the USGS. In addition, TN, TP and TSS data for station S002-548 were retrieved from the United Stated Environmental Protection Agency (EPA) STOrage and RETrieval (STORET) Data Warehouse.

2.3. Methods

2.3.1. Freshwater Provisioning Calculation

Various methods for quantification of freshwater provisioning have been developed recently. The most popular approach is to use models, typically those categorized as traditional hydrological models (e.g., SWAT [24] or VIC [25]) and/or ecosystem services tools (e.g., InVEST [6,26] or Artificial Intelligence for Ecosystem Services or ARIES [27]). The hydrological models are complex and can be difficult to set up, often requiring large amounts of data, extensive calibration, and/or significant user training. ARIES is a more user-friendly web-based model which can be used to evaluate the trade-offs among ecosystem services. One limitation of ARIES is that the model code is not transparent and its complicated approach makes it difficult to understand the relationships used in the model [28]. Another more simplistic and user-friendly ecosystem service model, InVEST, has been widely used to simulate ecosystem services in different landscapes, but it can currently simulate only one ecosystem service at a time. This makes it difficult to understand the interactions and interdependencies among various ecosystem services [29,30]. In this study, an index-based quantification method developed by Logsdon and Chaubey [29] was employed to analyze freshwater provisioning for different ecosystem services of 13 watersheds in the UMRB. This approach is capable of using either simulated outputs from hydrological models, or observed data, enabling any user to make assessments, regardless of their modeling experience.
Freshwater provisioning can be evaluated using the quantity of freshwater provision (FWP, Equation (1)) and the freshwater provision index (FWPI, Equation (2))—A unitless number that can be used to compare freshwater provisioning for multiple ecosystem services. Ecosystems control the phase, quality and quantity of the renewable freshwater resources [1]. The water quantity and water quality are both critical components of freshwater provisioning for various uses including drinking, fisheries, recreation, and survival conditions of aquatic biota [3,31]. Freshwater provisioning is a function of the quantity and quality of freshwater provided [28,29]. The water quantity component (FWPIqt) accounts for the flow variability in meeting the environmental flow requirements. The water quality component (FWPIwqt) accounts for the water quality variability considering requirements for multiple uses including drinking, fishing, and contact recreation.
F W P t = Q t × F W P I t  
F W P I t = F W P I q t × F W P I w q t  
F W P I q t = M F t / M F E F ( M F t / M F E F + q n e t / n t )  
F W P I w q t = W Q I a v g , t ( 1 + e t / n t )  
W Q I = exp ( W 1 + W 2 + + W n ) e x p [ ( W 1 × C 1 / C 1 s t d   ) + ( W 2 × C 2 / C 2 s t d ) + + ( W n × C n / C n s t d ) ]  
where FWPt is the quantity of freshwater provision in time step (m3); Qt is the total flow in time step (m3); FWPIt is the freshwater provision index in time step; FWPIqt is the water quantity component of FWPI in time step; FWPIwqt is the water quality component of FWPI in time step. MF is the mean flow in time step (m3/s); MFEF is the long-term environmental flow requirements (m3/s); qnet is the number of times that the flow is below the long-term environmental flow requirements in time step; n is the number of units in time step (i.e., 365/366 if FWP is calculated for the year on a daily basis); WQIavg,t is the average water quality index in time step; e is the number of times that the WQI is below one in time step. C1, C2 … Cn are concentrations of water quality constituents in water bodies; w1, w2 … wn are the weights for nutrients concentrations; a std subscript represents the water quality standard for different nutrients; a t subscript denotes the time step. The annual time step was selected for FWP&FWPI calculation and analysis in this study. The daily streamflow and daily nutrients concentration data are required inputs. It is worth noting that variables (FWPt, FWPIt, FWPIqt, FWPIwqt, WQIavg,t) in equations were calculated annually except three variables (WQI, qnet and et) that were calculated daily.
Using this method, if the mean flow meets or exceeds the environmental flow requirements throughout the time period, the quantity term will be equal to one. Similarly, if the nutrient concentrations are equal to their standard limits throughout the time period, the water quality term will be equal to one. A value greater than one for FWPI indicates an excellent freshwater provisioning. Conversely, if the long-term environmental flow requirements and/or water quality standards are not met, the FWPI will be less than one, resulting in FWP to be less than the total quantity of water provided. This indicates that freshwater provisioning is diminished during this time period [29].

2.3.2. Determination of Environmental Flow Requirements MFEF

The environmental flow requirements mentioned in Equation (3) can be defined as the water requirements needed to protect the structure and function of the watershed ecosystem and its dependent species [31]. Many researchers have developed methods to establish environmental flow requirements. One of the most widely used methods in North America is the Montana Method proposed by Tennant [32,33,34]. This method is based on historical records of discharge and has been successfully applied in the Midwest, Great Plains, and Intermountain West of the US [33]. As recommended by Tennant, 30% of the mean flow is a base flow requirement to provide good survival conditions for most aquatic life and general recreation. Additionally, 10% of the mean flow is a minimum instantaneous flow suggested to provide short-term survival conditions for most aquatic life. Considering these definitions, the long-term environmental flow requirement (MFEF) used in this study was 30% of average annual flow. Additionally, two seasonal environmental flow values (October–March and April–September) were used to calculate the annual qne values and were determined as 10% of average seasonal flow [29].

2.3.3. Determination of Water Quality Criteria

Three water quality constituents (total nitrogen: TN, total phosphorus: TP and total suspended solids: TSS) were selected for FWP/FWPI calculations in this project, primarily because they are widely used indicators for water quality in the Midwest. The water quality standards that have been developed by different states are mainly to protect the freshwater resources’ beneficial uses for drinking water, fisheries, and recreation [35]. As the watersheds evaluated in this study lie within three states (Minnesota, Illinois and Iowa), the water quality criteria for each constituent were determined by individual state standards. The criteria for different water quality constituents are provided in Table 2. Most criteria values are acquired from State Nutrient Reduction Strategy. As the TN criteria for Illinois and Minnesota are not available in these documents, these were referenced by water quality criteria in different ecoregions proposed by the EPA. The TN criteria for Illinois was calculated as an average value of ecoregion VI (2.18 mg/L) and ecoregion IX (0.69 mg/L); The TN criteria for Minnesota was calculated as an average value of ecoregion VI (2.18 mg/L) and ecoregion VII (0.54 mg/L) [35].
In order to make FWP calculation results comparable among watersheds, the same criteria values of TN, TP and TSS in these three states (Minnesota, Illinois and Iowa) were adopted: TN was 3 mg/L, TP was 0.1 mg/L, and TSS was 38 mg/L.

2.3.4. Determination of FWP and FWPI in the UMRB

The FWP and FWPI were calculated from 1995 to 2013 based on the observed daily streamflow data and water quality concentration data. As the daily concentration data of TN, TP and TSS for all stations were discontinuous, the USGS Load Estimator (LOADEST) regression model was used to interpolate the missing daily data. LOADEST is a FORTRAN program that estimates constituent loads based on streamflow data [36]. Then, daily concentration dataset for TN, TP and TSS from 1 January 1995 to 31 December 2013 was generated for each station by using daily flow and the available discrete concentration data. The annual FWP and FWPI from 1995 to 2013 were then calculated for each of the 13 watersheds in the UMRB by using equations described above (1–5). Given that the starting years of concentration data in the Lower Minnesota watershed and the Turkey watershed are 1999 and 2004 respectively, the FWPI and FWP calculations in these two watersheds began in their respective starting years.

2.3.5. Sensitivity Analysis

Ecosystems involve a set of interconnected, non-linear systems and are affected by various natural and anthropogenic forces. The MF, MFEF and concentrations of water quality constituents (C1, C2 … Cn) (Equations (2)–(5)) are the primary factors affecting FWP. One-parameter-at-A-Time (OAT) sensitivity analysis was done to determine the sensitivity of these factors. The OAT method is one of the simplest and very commonly used methods for sensitivity analysis. In this method, the effect of variation in each uncertain input parameter on the model’s output is determined by changing one parameter while keeping other parameters at a constant level. Relative sensitivity coefficients are unitless and can be used to compare sensitivity among multiple parameters [37].
Three watersheds (Lower Minnesota, Skunk, Lower Des Moines) were selected as representative watersheds for sensitivity analysis. Relative sensitivity coefficients (Sr) for each input parameter from 1995 to 2013 were calculated using two change rates for each parameter (Δp = 5%; Δp = 10%).
The MF, MFEF and concentrations of TN, TP and TSS are the primary drivers of FWPI and FWP. However, some external influences related to climate and land use changes can also affect freshwater provisioning. For example, precipitation is one of the most important climate factors impacting both flow and water quality. The annual precipitation from 1995 to 2013 for 13 watersheds were calculated using Thiessen polygon method, based on the monthly data collected for 103 precipitation gauge stations from the National Climate Data Center (NCDC) website [38,39]. We also evaluated the impacts of precipitation on FWP in these watersheds. The Pearson product moment correlation coefficients of precipitation and FWPI were calculated for each watershed to evaluate the relationship between these two variables under different flow conditions.

3. Results

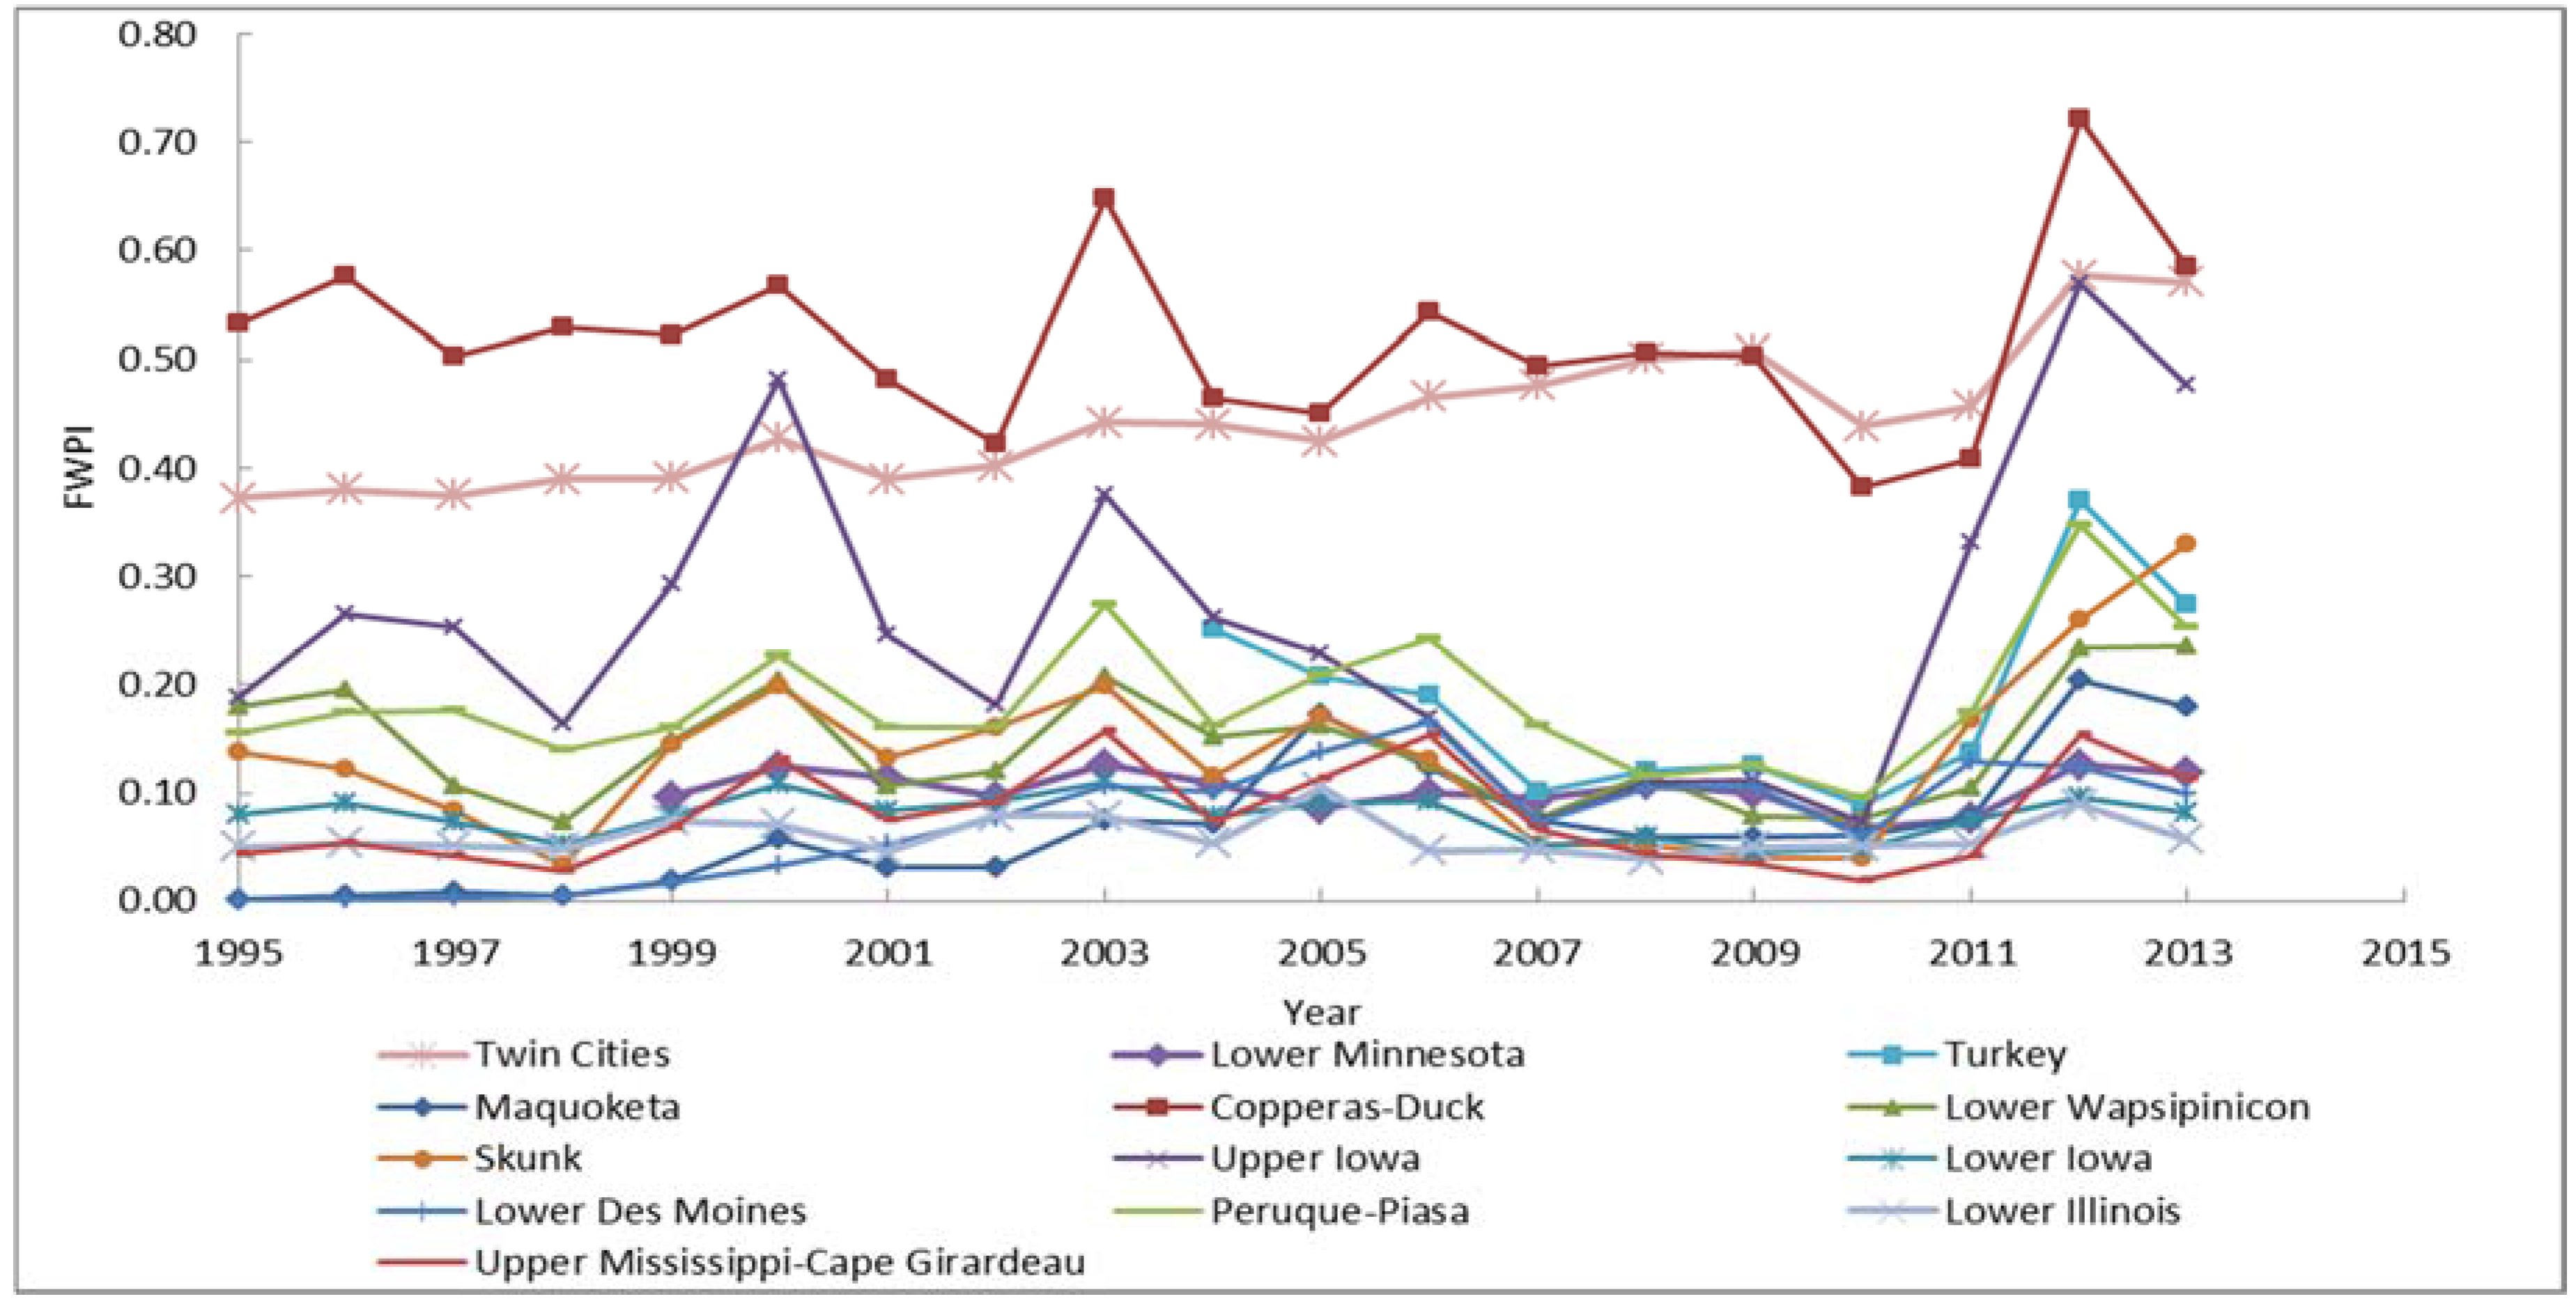
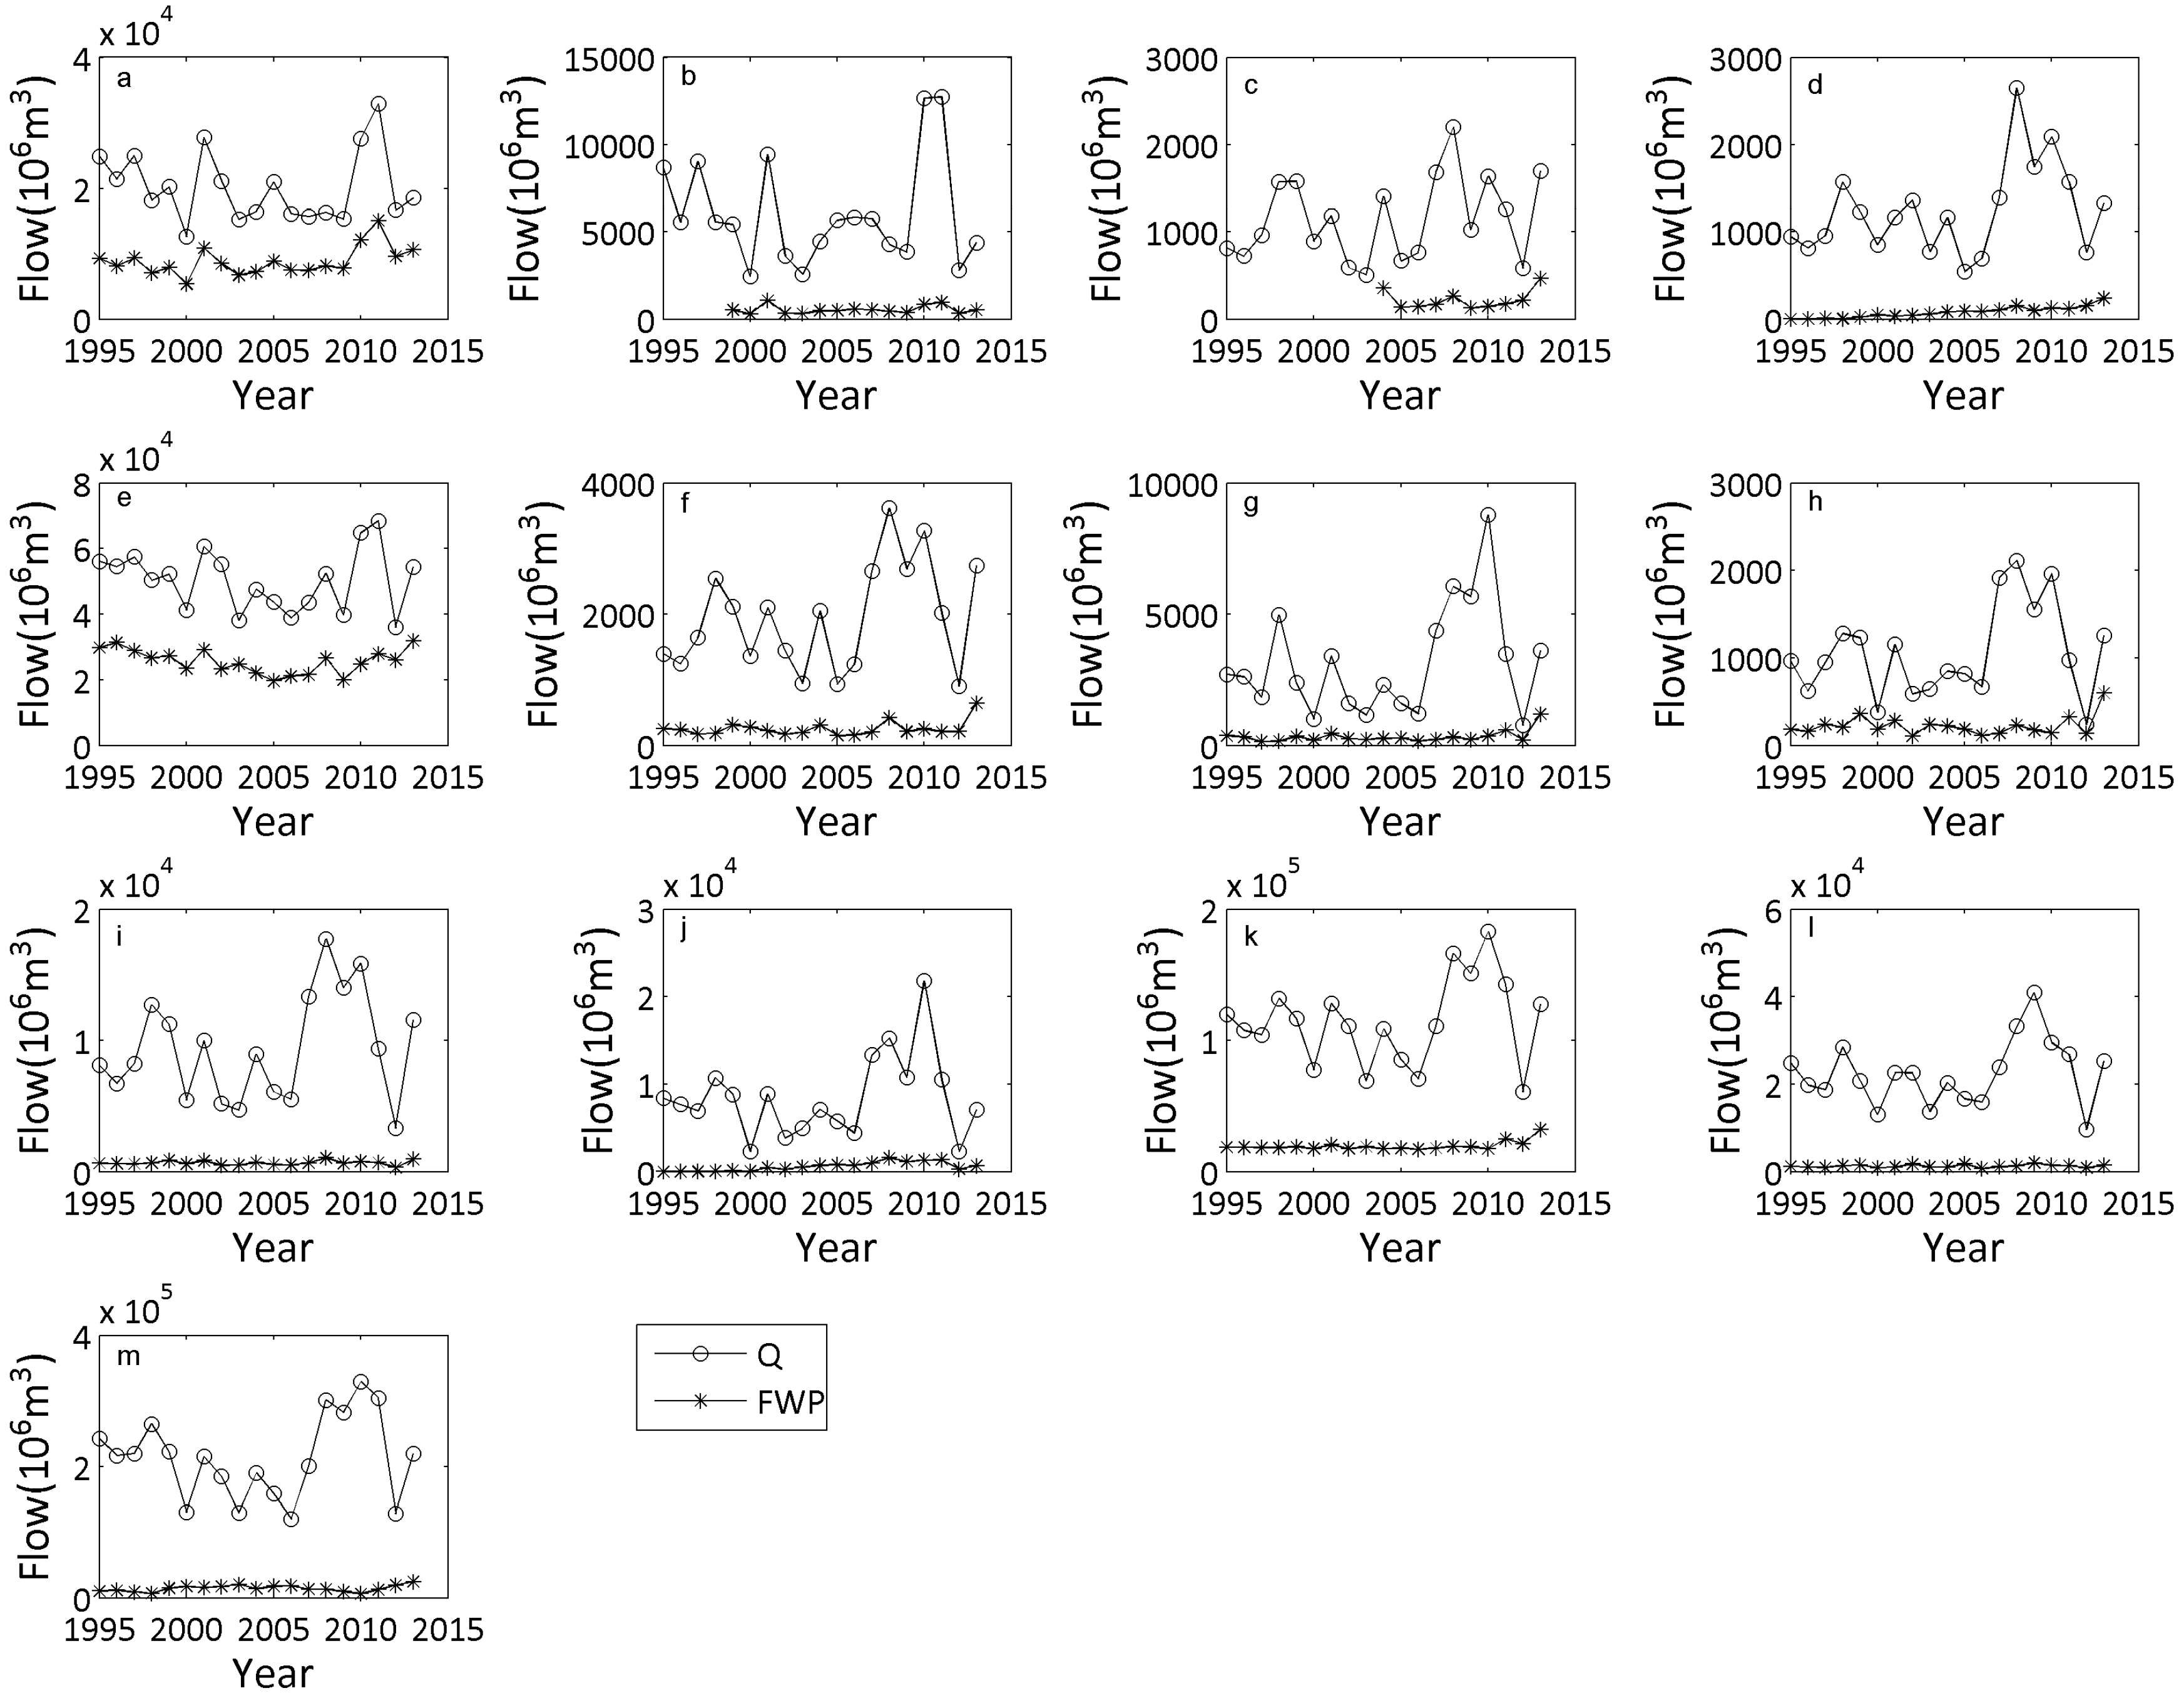
3.1. FWPI & FWP Calculations

The annual FWPI was always less than one from 1995 to 2013 for all 13 watersheds in the UMRB (Figure 2). The annual FWP was less than the annual total flow (Q) (Figure 3) indicating that the annual freshwater provisioning was diminished within this time period for all 13 watersheds. Annual variations in FWPI among watersheds are different. The Copperas-Duck watershed had the greatest overall mean FWPI (0.518). The maximum and minimum FWPI for this watershed were 0.721 and 0.383, which occurred in 2012 and 2010, respectively. The relatively higher annual FWPI in this watershed indicates that freshwater provisioning was less diminished compared to other watersheds. The Twin Cities watershed had the second greatest mean FWPI (0.444) with maximum value of 0.576 in 2012 and minimum value of 0.373 in 1995. The Lower Illinois watershed had the lowest average FWPI (0.06) with the maximum of 0.105 in 2005 and the minimum of 0.038 in 2008. The average FWPI for the Maquoketa watershed, Lower Iowa watershed, Lower Des Moines watershed and Upper Mississippi-Cape Girardeau watershed with values of 0.069, 0.078, 0.073, 0.079, respectively, were very similar to one another and were only slightly greater than that for Lower Illinois watershed. The relatively lower FWPI in these watersheds indicates that freshwater provisioning was greatly diminished at these locations.
The annual FWPI had a non-significant variability from 1995 to 2013 for most watersheds (Figure 2). However, the annual FWPI for the Upper Iowa watershed had a substantial interannual variability. The annual FWPI for the Twin Cities watershed exhibits a gentle increase from 0.37 (1995) to 0.57 (2013) indicating less diminished FWP in 2013 than that in 1995. The Copperas-Duck watershed had the greatest FWPI in all but three years (2009, 2010 and 2011). Across all watersheds, the maximum FWPI generally happened in 2012 while the minimum FWPI occurred in 2010, which indicates that freshwater provisioning in 2012 was less diminished than that in 2010.
The annual freshwater provision (FWP) quantities were markedly less than the annual total flow (Q) between 1995 and 2013 (Figure 3). Particularly, the annual FWP for watersheds Maquoketa, Lower Iowa, Lower Des Moines, Lower Illinois and Upper Mississippi-Cape Girardeau were close to zero during this time period, indicating that freshwater provisioning was diminished significantly in these watersheds. For other watersheds such as Twin Cities and Copperas-Duck, the freshwater provisioning was also diminished, even though it was to a lesser degree than some of the other watersheds.

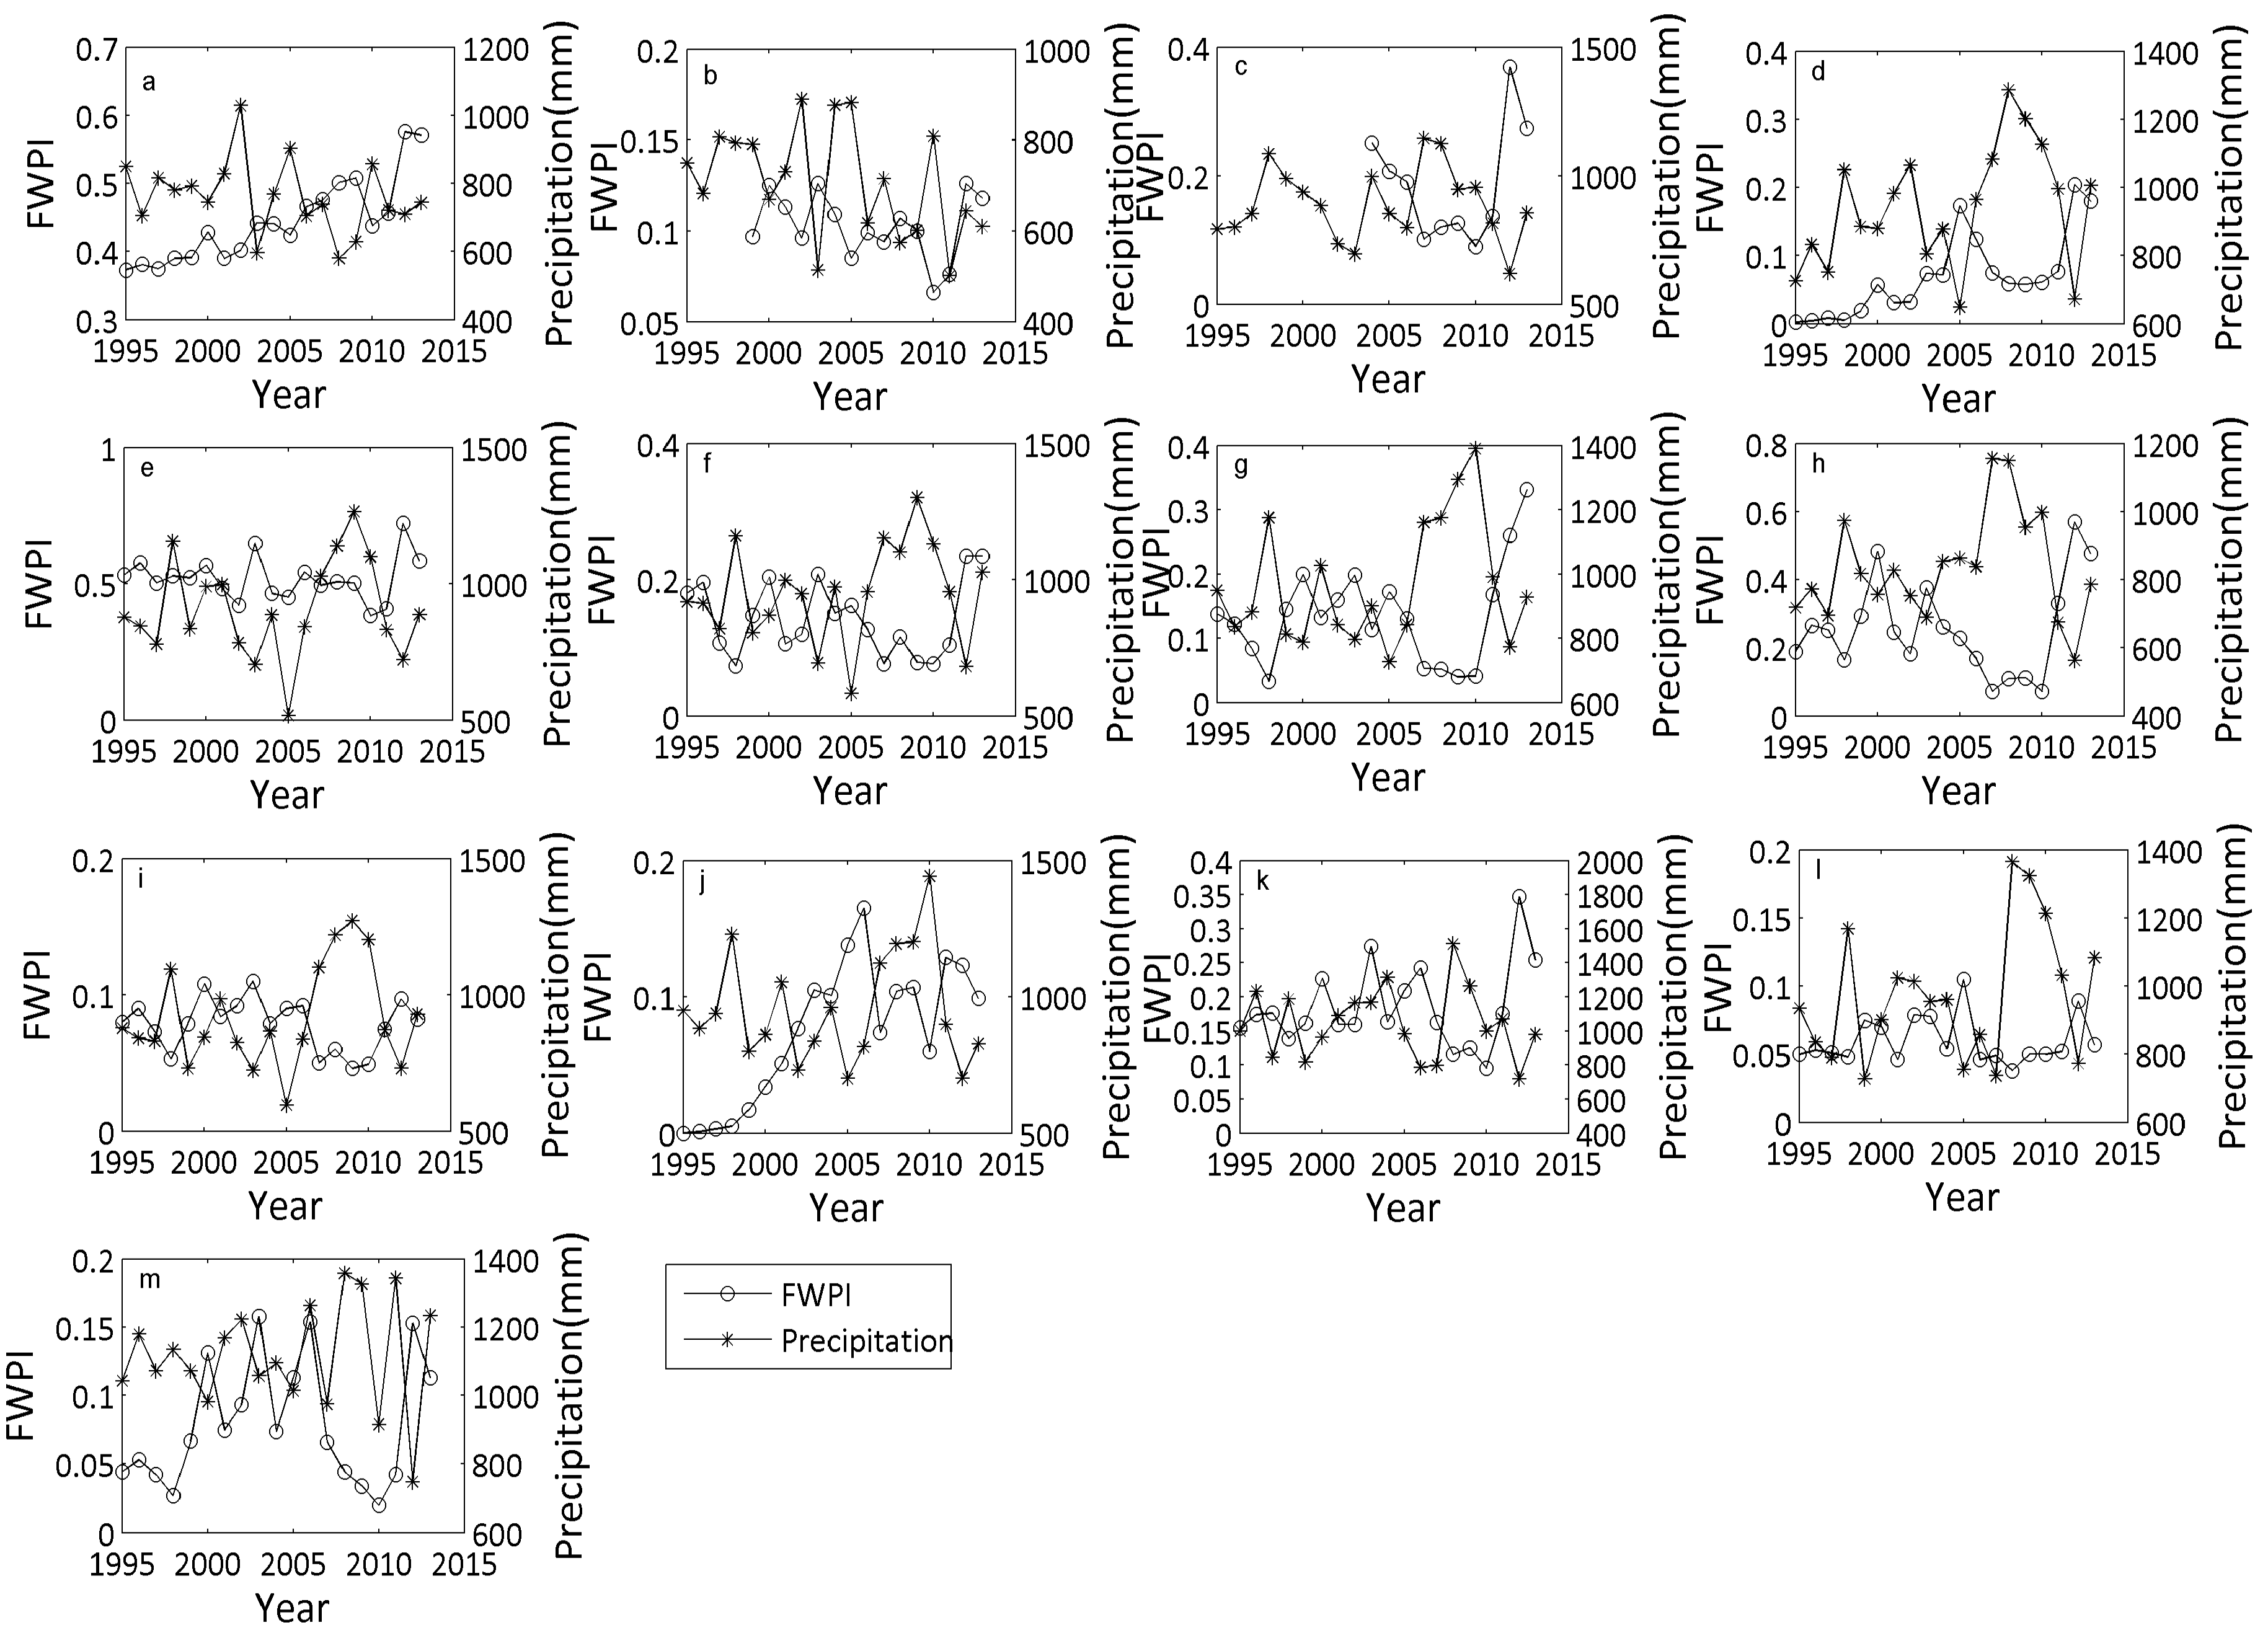
3.2. Evaluating Driving Factors of FWP and FWPI in the UMRB

Sensitivity analysis results using two change rates (ΔP = 5%, ΔP = 10%) indicated that concentration of water quality constituents (CTN, CTP, CTSS) has the greatest impacts on freshwater provisioning (Table 3). In other words, Sr (CTN, CTP, CTSS) > Sr (MF) > Sr (MFEF) indicated that water quality has the greatest influence on freshwater provisioning. Thus, in any watershed, the FWPI will be highly affected by the concentrations of water quality constituents (CTN, CTP, CTSS).
Precipitation is one of the most important climate drivers that can impact both flow and water quality. A comparison between the annual precipitation and FWPI (Figure 2) indicated that the maximum FWPI generally appeared in 2012 for most watersheds, even though the precipitation in 2012 for these watersheds was low. Similarly, the minimum FWPI happened in 2010 for many watersheds, while the precipitation values were generally high. The annual time series of precipitation and FWPI for each watershed displayed that FWPI generally increased with a decrease in precipitation (Figure 4). In order to further evaluate this relationship, the correlation coefficients (r) between FWPI and precipitation were obtained through linear regression. The results show that the correlation between FWPI and precipitation were 0.5 in eight watersheds (Twin Cities, Turkey, Lower Wapsipinicon, Skunk, Upper Iowa, Lower Iowa, Peruque-Piasa, Lower Illinois). The maximum correlation was 0.83 in the Lower Iowa watershed. The results of F test and T test were both significant at 0.05 levels in each of these watersheds. This further supports the result that precipitation was negatively related to the FWPI in these watersheds.
As discussed above, the FWPI is composed of both water quantity (FWPIq) and water quality (FWPIwq) (Equation (2)) with a greater sensitivity to the water quality constituents than water quantity. In order to explain this significant relationship between precipitation and freshwater provisioning, the precipitation, FWPI, FWPIwq, FWPIq in 2012 and 2010 were compared to those average values between 1995 and 2013. The change rates for these elements were calculated separately (Table 4). The precipitation in 2012 for each watershed was reduced (−7% to −32.9%) compared to the average precipitation between 1995 and 2013. A reduced precipitation in 2012 resulted in a decreased FWPIq ranging from −0.4% to −32.1%. Concurrently, the FWPIwq in 2012 for all watersheds increased ranging from 27.2% to 211.8%. According to Equations (4) and (5), the FWPIwq is a function of concentrations of TN, TP and TSS. Loads and the concentrations in 2012 were consistently reduced for all three water quality constituents for almost all watersheds (Figure 5). The concentration of TN for each watershed was reduced ranging from −3.45% to −75.55%; the concentration of TP for most watersheds was reduced ranging from −3.72% to −69.14%, while the concentration of TSS for each watershed decreased ranging from −0.67% to −77.01%. The reduced concentrations of TN, TP and TSS led to the increased FWPIwq in 2012. Since the increase in FWPIwq was greater than those for FWPIq, the FWPI increased overall during this year.
As opposed to the results in 2012, the precipitation in 2010 for most watersheds increased ranging from 7.4% to 51%, as compared to the average annual precipitation for the last 30 years (Table 4). However, the FWPI in 2010 was reduced for each watershed. This is mainly because even though the FWPIq for some watersheds increased compared to the average value, the FWPIwq during the same year decreased ranging from −1.3% to −75.1%. The decreased FWPIwq was primarily due to the increased loads and concentrations of TN, TP and TSS (Figure 5). The concentration of TN for most watersheds increased ranging from 1.53% to 48.86%; the concentration of TP for most watersheds increased ranging from 7.32% to 61.22%, while the concentration of TSS for all watersheds increased ranging from 0.01% to 147.01%. A relatively larger decrease in FWPIwq than those for FWPIq resulted in an overall diminished FWPI in 2010.

4. Discussion

The results from this study indicate that freshwater provisioning for different ecosystem services (e.g., drinking, recreation, fisheries and survival conditions for aquatic lives) was diminished in all 13 watersheds located in the UMRB. Widespread agricultural intensification has occurred in the UMRB since the mid-1800s. The extensive land use/land cover change from grasslands and forests to annual row crops, such as maize and soybean, has caused many hydrology and water quality alterations in the basin. The time series of streamflow show a slight increasing trend for most watersheds evaluated (Figure 3). The average streamflow at the outlet station (#05587450) of UMRB for the period assessed in this study (1995–2013) slightly increased from 3800.2 m3/s to 4041.3 m3/s. This is consistent with several studies that have shown an increasing trend in the annual streamflow in the UMRB since the 1940s [14,15,40,41]. However, freshwater provisioning is not necessarily improved with the increased streamflow. As proposed by Logsdon and Chaubey (2013), freshwater provisioning is a function of both water quantity (FWPIq) and water quality (FWPIwq) with water quality having greater influence. Depending on the final ecosystem service, this could change; a hydropower facility for example may only be interested in water quantity, thus the FWPI may then be more influenced by the quantity portion. However, intensive and extensive agricultural production in the UMRB has led to reduced water quality conditions, thus diminishing freshwater provisioning for ecosystem services such as drinking water and recreation. The average FWPIwq between 1995 and 2013 was less than one for all watersheds evaluated in this study, with a maximum value of 0.52 (Copperas-Duck watershed) and minimum value of 0.06 (Lower Illinois watershed). Even though the water quantity part of freshwater provisioning (FWPIq) for most watersheds were close to 1, overall FWPI was consistently less than one for each watershed suggesting that freshwater provisioning was reduced primarily due to poor water quality. Widespread fertilizer application to support intensive row crop production along with increased subsurface drainage has transformed the nitrogen and phosphorus cycles and increased the nitrogen (especially nitrate) fluxes in the basin. A recent study suggests that the UMRB accounts for 43% of total nitrogen to the Gulf of Mexico [15]. It has also been suggested that multiple water quality problems exist in many areas of the UMRB. Many water bodies in the basin are classified as impaired because of high nitrogen and phosphorus concentrations, primarily from agricultural nonpoint source pollution [17,42,43]. For example, Iowa and Illinois have the most intensive corn-soybean cropping systems and the highest total nitrogen fertilizer use in the UMRB [44,45]. The associated watersheds in these two states thus have high contributions from nonpoint source pollution. The diminished water quality conditions have resulted into diminished freshwater provisioning for various ecosystem services.
The relationships between freshwater provisioning and other ecosystem services are complex and poorly understood. Trade-offs and synergies usually exist among different ecosystem services. Trade-offs will occur when one service increases and another one decreases, while synergies will happen when both services either increase or decrease. This may be due to the interactions among two services or be caused by the same driver effects [1,46]. Precipitation is one of the key drivers for freshwater provisioning and erosion control as well as food provisioning. Some studies have concluded that the erosion control will improve in dry years and increase in wet years, since high precipitation combined with a decline in vegetation cover during wet years will enhance the soil erosion and make the erosion control more valuable under future climate change [9,13]. Similarly, in wet years with high precipitation, a relatively greater amount of plant water could be available to potentially enhance crop production. As a result, food provision may be improved. In addition to precipitation, the water quality also plays an important role in freshwater provisioning. Although the increasing fertilizer use can improve food production, it may simultaneously lead to a decline in surface water and groundwater quality. The diminished water quality conditions will negatively affect freshwater provisioning [47,48]. The load and the concentrations of TN, TP, and TSS consistently reduced in 2012 (dry year) and increased in 2010 (wet year) for almost all watersheds. Consequently, freshwater provisioning increased in a dry year and decreased in a wet year. These results are somewhat counter intuitive as freshwater provisioning should generally increase with an increase in precipitation. However, our results show that in nonpoint source dominated watersheds where most of the high concentrations and loads of sediment and nutrients are driven by high precipitation values, freshwater provisioning will decrease unless attention is paid to improve water quality. Particularly, in agriculturally dominated basins such as the UMRB, the increasing agricultural production can benefit the food security and economic growth, however, other important ecosystem services such as freshwater provisioning and cultural services (e.g., recreation & tourism) will possibly be lost [47]. Although this study focus on evaluating freshwater provisioning for different services (e.g., drinking, recreation, fisheries and survival conditions for aquatic lives), it is important to quantify multiple ecosystem services simultaneously and to identify the trade-offs and the synergies among them, so that effective watershed management strategies could be developed to enhance these multiple ecosystem services [26,46].

5. Conclusions

Through analysis of annual FWP and FWPI from 1995 to 2013 for 13 watersheds in the UMRB, the annual FWPI was determined to be always less than one for all watersheds during these 19 years. The Copperas-Duck watershed had the greatest overall mean FWPI (0.518), while the Lower Illinois watershed had the lowest average FWPI (0.06). The annual FWP was reduced and markedly less than the annual total flow. The mean flow, concentrations of TN, TP, TSS and the long-term environmental flow requirements are three primary factors determining the FWPI and FWP. The sensitivity analysis results suggest that the most sensitive element of FWPI is the concentrations of TN, TP and TSS. MF is a moderately sensitive factor, while MFEF is the least sensitive component. A significant relationship between precipitation and FWPI was observed for 13 watersheds evaluated in this study. The annual FWP and FWPI decreased while the annual precipitation increased primarily due to an increase in concentration and load of precipitation-driven nonpoint source pollutants in the study watersheds. The results from this study indicate a need to improve water quality in intensively managed agricultural watersheds if the watershed management goal is to increase freshwater provisioning. This study is limited to quantifying freshwater provisioning for different ecosystem services. Future research should be conducted on quantifying multiple ecosystem services and exploring the trade-offs and synergies among them so that holistic watershed management strategies can be developed to protect and enhance the ecosystem services.

Acknowledgments

This study was supported by the China Scholarship Council (CSC) program and the Department of Earth, Atmospheric, and Planetary Sciences at Purdue University. The authors would like to thank two anonymous reviewers for their precious comments and suggestions to improve the manuscript.

Author Contributions

Ping Li completed data computing and analysis and prepared the draft of manuscript. Indrajeet Chaubey supervised the research about data processing and result analysis and edited the manuscript. Rebecca A Logsdon edited the paper and improved the manuscript writing. Xiaomei Wei directed the research.

Conflicts of Interest

The authors declare no conflict of interest.

References

  1. Millennium Ecosystem Assessment (MEA). Ecosystem Services and Human Well-Being: Synthesis; Island Press: Washington, DC, USA, 2005. [Google Scholar]
  2. Bouma, J.A.; Beukering, P.J.H.V. Ecosystem Services from Concept to Practice; Cambridge University Press: Cambridge, UK, 2015. [Google Scholar]
  3. Brauman, K.A.; Daily, G.C.; Duarte, T.K.; Mooney, H.A. The Nature and Value of Ecosystem Services: An Overview Highlighting Hydrologic Services. Annu. Rev. Environ. Resour. 2007, 32, 67–98. [Google Scholar] [CrossRef]
  4. Dodds, W.K.; Perkin, J.S.; Gerken, J.E. Human Impact on Freshwater Ecosystem Services: A Global Perspective. Environ. Sci. Technol. 2013, 47, 9061–9068. [Google Scholar] [CrossRef] [PubMed]
  5. Marquès, M.; Bangash, R.F.; Kumar, V.; Sharp, R.; Schuhmacher, M. The impact of climate change on water provision under a low flow regime: A case study of the ecosystems services in the Francoli river basin. J. Hazard. Mater. 2013, 263, 224–232. [Google Scholar] [CrossRef] [PubMed]
  6. Dennedy-Frank, P.J.; Muenich, R.L.; Chaubey, I.; Ziv, G. Comparing two tools for ecosystem service assessments regarding water resources decisions. J. Environ. Manag. 2016, 177, 331–340. [Google Scholar] [CrossRef] [PubMed]
  7. Ausseil, A.-G.E.; Dymond, J.R.; Kirschbaum, M.U.F.; Andrew, R.M.; Parfitt, R.L. Assessment of multiple ecosystem services in New Zealand at the catchment scale. Environ. Model. Softw. 2013, 43, 37–48. [Google Scholar] [CrossRef]
  8. Foley, J.A.; DeFries, R.; Asner, G.P.; Barford, C.; Bonan, G.; Carpenter, S.R.; Chapin, F.S.; Coe, M.T.; Daily, G.C.; Gibbs, H.K.; et al. Global consequences of land use. Science 2005, 309, 570–574. [Google Scholar] [CrossRef] [PubMed]
  9. Terrado, M.; Acuña, V.; Ennaanay, D.; Tallis, H.; Sabater, S. Impact of climate extremes on hydrological ecosystem services in a heavily humanized Mediterranean basin. Ecol. Indic. 2014, 37, 199–209. [Google Scholar] [CrossRef]
  10. Willaarts, B.A.; Volk, M.; Aguilera, P.A. Assessing the ecosystem services supplied by freshwater flows in Mediterranean agroecosystems. Agric. Water Manag. 2012, 105, 21–31. [Google Scholar] [CrossRef]
  11. Leh, M.D.K.; Matlock, M.D.; Cummings, E.C.; Nalley, L.L. Quantifying and mapping multiple ecosystem services change in West Africa. Agric. Ecosyst. Environ. 2013, 165, 6–18. [Google Scholar] [CrossRef]
  12. Egoh, B.; Reyers, B.; Rouget, M.; Richardson, D.M.; Le Maitre, D.C.; van Jaarsveld, A.S. Mapping ecosystem services for planning and management. Agric. Ecosyst. Environ. 2008, 127, 135–140. [Google Scholar] [CrossRef]
  13. Bangash, R.F.; Passuello, A.; Sanchez-Canales, M.; Terrado, M.; López, A.; Elorza, F.J.; Ziv, G.; Acuña, V.; Schuhmacher, M. Ecosystem services in Mediterranean river basin: Climate change impact on water provisioning and erosion control. Sci. Total Environ. 2013, 458–460, 246–255. [Google Scholar] [CrossRef] [PubMed]
  14. Frans, C.; Istanbulluoglu, E.; Mishra, V.; Munoz-Arriola, F.; Lettenmaier, D.P. Are climatic or land cover changes the dominant cause of runoff trends in the Upper Mississippi River Basin?: CLIMATE AND LAND USE CHANGE IN THE UMRB. Geophys. Res. Lett. 2013, 40, 1104–1110. [Google Scholar] [CrossRef]
  15. Schilling, K.E.; Chan, K.-S.; Liu, H.; Zhang, Y.-K. Quantifying the effect of land use land cover change on increasing discharge in the Upper Mississippi River. J. Hydrol. 2010, 387, 343–345. [Google Scholar] [CrossRef]
  16. Demissie, Y.; Yan, E.; Wu, M. Assessing Regional Hydrology and Water Quality Implications of Large-Scale Biofuel Feedstock Production in the Upper Mississippi River Basin. Environ. Sci. Technol. 2012, 46, 9174–9182. [Google Scholar] [CrossRef] [PubMed]
  17. Wu, M.; Demissie, Y.; Yan, E. Simulated impact of future biofuel production on water quality and water cycle dynamics in the Upper Mississippi river basin. Biomass Bioenergy 2012, 41, 44–56. [Google Scholar] [CrossRef]
  18. Delong, M.D. Upper Mississippi River Basin. In Rivers of Northamerica; Benke, A.C., Cushing, C.E., Eds.; Elsevier Academic Press: New York, NY, USA, 2005; pp. 327–361. [Google Scholar]
  19. Panagopoulos, Y.; Gassman, P.W.; Arritt, R.W.; Herzmann, D.E.; Campbell, T.D.; Jha, M.K.; Kling, C.L.; Srinivasan, R.; White, M.; Arnold, J.G. Surface water quality and cropping systems sustainability under a changing climate in the Upper Mississippi River Basin. J. Soil Water Conserv. 2014, 69, 483–494. [Google Scholar] [CrossRef]
  20. Gassman, P.W.; Secchi, S.; Jha, M.; Kurkalova, L. Upper Mississippi River Basin modeling system part 1: SWAT input data requirements and issues. Coast. Hydrol. Process. 2006, 103–115. Available online: http://citeseerx.ist.psu.edu/viewdoc/download?doi=10.1.1.493.7997&rep=rep1&type=pdf (accessed on 12 July 2016). [Google Scholar]
  21. Jha, M. Impacts of climate change on streamflow in the Upper Mississippi River Basin: A regional climate model perspective. J. Geophys. Res. 2004, 109. [Google Scholar] [CrossRef]
  22. Srinivasan, R.; Zhang, X.; Arnold, J. SWAT ungauged: Hydrological budget and crop yield predictions in the Upper Mississippi River Basin. Trans. ASABE 2010, 53, 1533–1546. [Google Scholar] [CrossRef]
  23. O’Donnell, T.K.; Galat, D.L. River enhancement in the Upper Mississippi River Basin: Approaches based on river uses, alterations, and management agencies. Restor. Ecol. 2007, 15, 538–549. [Google Scholar] [CrossRef]
  24. Gassman, P.W.; Reyes, M.R.; Green, C.H.; Arnold, J.G. The Soil and Water Assessment Tool: Historical Development, Applications, and Future Research Directions. Trans. ASABE 2007, 50, 1211–1250. [Google Scholar] [CrossRef]
  25. Xu, L.; Wood, E.F.; Lettenmaier, D.P. Surface soil moisture parameterization of the VIC-2L model: Evaluation and modification. Glob. Planet. Chang. 1996, 13, 195–206. [Google Scholar]
  26. Nelson, E.; Mendoza, G.; Regetz, J.; Polasky, S.; Tallis, H.; Cameron, D.R.; Chan, K.M.; Daily, G.C.; Goldstein, J.; Kareiva, P.M.; et al. Modeling multiple ecosystem services, biodiversity conservation, commodity production, and tradeoffs at landscape scales. Front. Ecol. Environ. 2009, 7, 4–11. [Google Scholar] [CrossRef]
  27. Bagstad, K.J.; Johnson, G.W.; Voigt, B.; Villa, F. Spatial dynamics of ecosystem service flows: A comprehensive approach to quantifying actual services. Ecosyst. Serv. 2013, 4, 117–125. [Google Scholar] [CrossRef]
  28. Vigerstol, K.L.; Aukema, J.E. A comparison of tools for modeling freshwater ecosystem services. J. Environ. Manag. 2011, 92, 2403–2409. [Google Scholar] [CrossRef] [PubMed]
  29. Logsdon, R.A.; Chaubey, I. A quantitative approach to evaluating ecosystem services. Ecol. Model. 2013, 257, 57–65. [Google Scholar] [CrossRef]
  30. Tallis, H.T.; Ricketts, T.; Guerry, A.D.; Nelson, E.; Ennaanay, D.; Wolny, S.; Olwero, N.; Vigerstol, K.; Pennington, D.; Mendoza, G.; et al. InVEST 2.1 Beta User’s Guide; The Natural Capital Project: Stanford, CA, USA, 2011. [Google Scholar]
  31. Vörösmarty, C.J.; Bos, R.; Balvanera, P. Fresh Water. Ecosyst. Hum. Well- Curr. State Trends Find. Cond. Trends Work. Group 2005, 1, 165. [Google Scholar]
  32. Tennant, D.L. Instream Flow Regimens for Fish, Wildlife, Recreation and Related Environmental Resources. Fisheries 1976, 1, 6–10. [Google Scholar] [CrossRef]
  33. Orth, D.J. Evaluation of the “Montana Method” for recommending instream flows in Oklahoma streams. Proc. Okla. Acad. Sci. 1981, 61, 62–66. [Google Scholar]
  34. Xia, J.; Feng, H.L.; Zhan, C.S.; Niu, C.W. Determination of a Reasonable Percentage for Ecological Water-Use in the Haihe River Basin, China. Pedosphere 2006, 16, 33–42. [Google Scholar] [CrossRef]
  35. Ice, G.; Binkley, D. Forest streamwater concentrations of nitrogen and phosphorus: A comparison with EPA’s proposed water quality criteria. J. For. 2003, 101, 21–28. [Google Scholar]
  36. Runkel, R.L.; Crawford, C.G.; Cohn, T.A. Load Estimator (LOADEST): A FORTRAN Program for Estimating Constituent Loads in Streams and Rivers; U.S. Geological Survey Techniques and Methods Book 4, Chapter A5; U.S. Geological Survey: Reston, VA, USA, 2004.
  37. Haan, C.T. Statistical Methods in HYDROLOGY, 2nd ed.; Iowa State Press: Ames, IA, USA, 2002. [Google Scholar]
  38. Boots, B.N. Voronoi (Thiessen) Polygons (Concepts and Techniques in Modern Geography); Geo Books: Norwich, UK, 1986. [Google Scholar]
  39. Thiessen, A.H. Precipitation average for large areas. Mon. Weather Rev. 1911, 39, 1082–1084. [Google Scholar] [CrossRef]
  40. Tran, L.T.; O’Neill, R.V. Detecting the effects of land use/land cover on mean annual streamflow in the Upper Mississippi River Basin, USA. J. Hydrol. 2013, 499, 82–90. [Google Scholar] [CrossRef]
  41. Zhang, Y.-K.; Schilling, K.E. Increasing streamflow and baseflow in Mississippi River since the 1940s: Effect of land use change. J. Hydrol. 2006, 324, 412–422. [Google Scholar] [CrossRef]
  42. Rabotyagov, S.; Campbell, T.; Jha, M.; Gassman, P.; Arnold, J.; Kurkalova, L.; Secchi, S.; Feng, H.L.; Kling, C. Least-Cost control of agricultural nutrient contributions to the Gulf of Mexico hypoxic zone. Ecol. Appl. 2010, 20, 1542–1555. [Google Scholar] [CrossRef] [PubMed]
  43. Secchi, S.; Gassman, P.; Jha, M.; Kurkalova, L.; Kling, C. Potential water quality changes due to corn expansion in the Upper Mississippi River Basin. Ecol. Appl. 2011, 21, 1068–1084. [Google Scholar] [CrossRef] [PubMed]
  44. Goolsby, D.A.; Battaglin, W.A. Long-Term changes in concentrations and flux of nitrogen in the Mississippi River Basin, USA. Hydrol. Process. 2001, 15, 1209–1226. [Google Scholar] [CrossRef]
  45. Keeney, D. Reducing nonpoint nitrogen to acceptable levels with emphasis on the Upper Mississippi River Basin. Estuaries 2002, 25, 862–868. [Google Scholar] [CrossRef]
  46. Bennett, E.M.; Peterson, G.D.; Gordon, L.J. Understanding relationships among multiple ecosystem services: Relationships among multiple ecosystem services. Ecol. Lett. 2009, 12, 1394–1404. [Google Scholar] [CrossRef] [PubMed]
  47. Gordon, L.J.; Finlayson, C.M.; Falkenmark, M. Managing water in agriculture for food production and other ecosystem services. Agric. Water Manag. 2010, 97, 512–519. [Google Scholar] [CrossRef]
  48. Easterling, D.R.; Karl, T.R. Potential consequences of climate variability and change for the Midwestern United States. In Climate Change Impacts on the United States: The Potential Consequences of Climate Variability and Change: Foundation; National Assessment Synthesis Team (U.S.), Ed.; Cambridge University Press: Cambridge, UK; New York, NY, USA, 2001. [Google Scholar]
Figure 1. Location of the UMRB displaying 8-digit Hydrological Unit Codes (HUCs) or watersheds and streamflow gauge stations used in this study.
Water 08 00288 g001
Figure 2. Freshwater Provision Index (FWPI) from 1995 to 2013 for 13 watersheds in the UMRB.
Water 08 00288 g002
Figure 3. Freshwater provision versus total flow between 1995 and 2013 for 13 watersheds in UMRB: Twin Cities (a); Lower Minnesota (b); Turkey (c); Maquoketa (d); Copperas-Duck (e); Lower Wapsipinicon (f); Skunk (g); Upper Iowa (h); Lower Iowa (i); Lower Des Moines (j); Peruque-Piasa (k); Lower Illinois (l); Upper Mississippi-Cape Girardeau (m).
Water 08 00288 g003
Figure 4. Freshwater provision index (FWPI) versus precipitation between 1995 and 2013 for 13 watersheds in the UMRB: Twin Cities (a); Lower Minnesota (b); Turkey (c); Maquoketa (d); Copperas-Duck (e); Lower Wapsipinicon (f); Skunk (g); Upper Iowa (h); Lower Iowa (i); Lower Des Moines (j); Peruque-Piasa (k); Lower Illinois (l); Upper Mississippi-Cape Girardeau (m).
Water 08 00288 g004
Figure 5. Relative changes in water quality concentrations and loads (TN, TP, TSS) in 2012 and 2010 compared to average values between 1995 and 2013: concentration of TN (CTN) (a); concentration of TP (CTP) (b); concentration of TSS (CTSS) (c); load of TN (LTN) (d); load of TP (LTP) (e); load of TSS (LTSS) (f). The number (1–13) in X-axis denotes 13 watersheds: Twin Cities (1), Lower Minnesota (2), Turkey (3), Maquoketa (4), Copperas-Duck (5), Lower Wapsipinicon (6), Skunk (7), Upper Iowa (8), Lower Iowa (9), Lower Des Moines (10), Peruque-Piasa (11), Lower Illinois (12), Upper Mississippi-Cape Girardeau (13).
Water 08 00288 g005
Table 1. Details of the 13 watersheds in the UMRB included in this study, along with information on their flow and water quality gauges and data availability.
Watershed Name8-Digit HUC #Drainage Area (km2)USGS Streamflow Gauge #Water Quality Site #Streamflow Time PeriodTotal Number of Water Quality Samples Within 1 January 1995–31 December 2013
TNTPTSS
Twin Cities07010206115,98705344500053315801995–2013118137138
Lower Minnesota0702001241,94205330000S002-5481995–2013453635
Turkey07060004400005412500054125001995–2013119121112
Maquoketa07060006402105418500054186001995–2013119123112
Copperas-Duck07080101221,61805420500054205001995–2013396401375
Lower Wapsipinicon07080103604805422000054220001995–2013156161149
Skunk0708010711,16405474000054740001995–20132652682284
Upper Iowa07080207396605451500054512101995–2013152280279
Lower Iowa0708020932,36305465500054655001995–20133523851272
Lower Des Moines0710000936,34405490500054905001995–2013155156154
Peruque-Piasa07110009443,49605587450055874551995–2013287287180
Lower Illinois0713001169,23805586100055861001995–20134324751274
Upper Mississippi-Cape Girardeau071401051,846,47507022000070220001995–2013531542447
Table 2. Water quality criteria of different water quality constituents in three states.
State NameWater Quality Constituents
TNTPTSS
Iowa3 mg/L0.1 mg/L
Illinois1.44 mg/L0.05 mg/L
Minnesota1.36 mg/L0.1 mg/L15 mg/L in North, 30 mg/L in center, 65 mg/L in south
Table 3. Average Sr between 1995 and 2013 for MF, MFEF and concentrations of water quality constituents (CTN, CTP, CTSS).
Watershed NameRateSr (MF)Sr (CTN, CTP, CTSS)Sr (MFEF)
Lower MinnesotaΔP = 5%0.031−2.57−0.028
ΔP = 10%0.038−2.593−0.035
SkunkΔP = 5%0.143−2.029−0.14
ΔP = 10%0.147−2.041−0.145
Lower Des MoinesΔP = 5%0.123−3.102−0.12
ΔP = 10%0.127−3.195−0.126
Table 4. Relative changes in precipitation, FWPI, FWPIwq, FWPIq in 2012 and 2010 compared to average values between 1995 and 2013.
Watershed NameTwin CitiesLower MinnesotaTurkeyMaquoketaCopperas-DuckLower WapsipiniconSkunkUpper IowaLower IowaLower Des MoinesPeruque-PiasaLower IllinoisUpper Mississippi-Cape Girardeau
2012 (dry)Precipitation (%)−7.0−9.1−30.3−28.4−20.1−28.0−19.6−32.3−20.2−26.5−31.3−20.4−32.9
FWPI (%)29.822.497.6195.739.365.292.4123.323.868.587.549.093.9
FWPIwq (%)29.827.297.6195.739.373.8153.5211.830.1121.988.349.093.9
FWPIq (%)0.0−3.40.00.00.0−5.3−28.2−32.1−5.8−26.2−0.40.00.0
2010 (wet)Precipitation (%)12.214.27.420.021.519.544.419.831.651.0−4.525.0−18.0
FWPI (%)−1.3−35.9−52.1−11.8−26.2−45.9−69.9−71.6−36.9−18.4−48.4−16.0−75.1
FWPIwq (%)−1.3−36.5−52.1−11.8−26.2−46.3−73.6−73.9−37.7−24.6−48.4−16.0−75.1
FWPIq (%)0.01.40.00.00.00.37.93.40.35.20.00.00.0

