Article

Dissolved Trace Metals and Organic Matter Distribution in the Northern Adriatic, an Increasingly Oligotrophic Shallow Sea

1
Division of Marine and Environmental Research, Ruđer Bošković Institute, POB 108, HR-10002 Zagreb, Croatia
2
Center for Marine Research, Ruđer Bošković Institute, G. Paliaga 5, HR-52210 Rovinj, Croatia
*
Authors to whom correspondence should be addressed.
Water 2022, 14(3), 349; https://doi.org/10.3390/w14030349
Submission received: 2 November 2021 / Revised: 3 January 2022 / Accepted: 20 January 2022 / Published: 25 January 2022

Abstract

:
We report a monthly distribution of Zn, Cd, Pb, Cu, Ni and Co, biologically relevant trace metals (TMs), within one year, in the productive surface layer at two stations with different trophic characters in the northern Adriatic (NA). The TM data was accompanied by a multivariable dataset, including dissolved organic carbon (DOC), surface-active organic substances (SAS), nitrogen-containing polymeric organic material (N-POM), nutrients, pH, dissolved O2, chlorophyll a (Chl a), seawater temperature, and the Po River discharge rate. At the eu- to mesotrophic station 108, the concentrations of dissolved TMs were 5–116 nM for Zn, 0.04–0.18 nM for Cd, 0.05–0.63 nM for Pb, 3–17 nM for Cu, 4–11 nM for Ni, and 0.2–1.2 nM for Co, while at the oligotrophic station 107, they were 6–224 nM for Zn, 0.03–0.16 nM for Cd, 0.05–1.25 nM for Pb, 3–17 nM for Cu, 4–19 nM for Ni, and 0.1–0.7 nM for Co. The characterization of organic matter (OM) in conjunction with the analysis of correlations with TMs indicated that the OM–TMs interactions differed between the two stations; namely, the freshly produced OM detected at station 108 was probably involved in the complexation of Cu, Co, Cd, and Ni, whereas at station 107, such complexation processes were not present. Accumulation of DOC was observed during the summer months at both stations. Our results present a significant contribution to biogeochemical studies in the NA by focusing on the complexity of TM–OM interactions, which is a prerequisite for interpretation of their responses to local and global changes.

Graphical Abstract

1. Introduction

Trace metals (TMs), such as Zn, Cu, Co, Fe, Ni, Cd etc., are considered important micronutrients that affect marine productivity and plankton community composition [1]. Zn, Cu, Co, Ni, and Cd play a role in enzymatic activities of microorganisms [2,3,4], while some TMs, including Pb and Hg, have been recognized as toxic and may be indicators of anthropogenic activities [5]. Trace metals are necessary for the uptake and metabolism of macronutrients: C, N, P and Si [6] are thus indirectly involved in the global carbon cycle. The distribution, bioavailability and toxicity of TMs are determined by their concentrations, but also by their forms, with TMs in the dissolved fraction having a higher potential to become bioavailable. This is highly dependent on various environmental parameters, from pH to the availability of complexing ligands [7]. In its effort to utilize TMs or protect itself from their potentially toxic effects, phytoplankton regulate the distribution, chemical speciation and cycling of TMs through cellular uptake and recycling processes, downward flux of biogenic particles, mediation of redox reactions and biological release of organic ligands [1,8].
The chemical speciation of micronutrients in natural waters is extremely important in the direct regulation of their bioavailability. At low micronutrient concentrations, which usually limit phytoplankton production [9], complexation by organic ligands can increase their uptake and regulation of essential metal supply [10]. In addition, complexation of TMs with dissolved organic matter (DOM) minimizes the loss of these micronutrients by particle scavenging and thus increases their residence time in surface waters [1]. The interactions between phytoplankton and TMs are particularly dynamic in shallow coastal areas such as the northern Adriatic (NA), which owes its biological activity mainly to the Po River inflow in its western part, supplying the basin with nutrients and TMs [11]. However, given the expected global temperatures increase and changes in the precipitation regime, models suggest that the duration of the Po River low flow periods in summer will increase, leading to an overall decrease in water availability [12]. The area is also subject to strong anthropogenic influences, including heavy shipping traffic and atmospheric deposition from mainland Europe [13], shows signs of oligotrophication, especially in the eastern part [14,15], and there is evidence of increase in surface temperatures [16]. All these factors strongly affect the concentrations and distribution of TMs in the NA and consequently the aquatic community. Surprisingly, in contrast to several long-term studies addressing organic matter (OM) and macronutrient distribution and their biogeochemical cycling in the NA [14,16,17,18], published data on TMs in the area are limited and mainly focused on sediment and biota research [19,20,21,22,23,24]. Recent papers by Pavoni et al. [25] and Illuminati et al. [26], present a step forward in TM studies in the area, focusing on the speciation of several TMs in the Isonzo/Soča River mouth, and along the Po River plume, respectively.
To expand the understanding of the biogeochemistry of TMs in this shallow marine environment under riverine influence, we focused on the dissolved fraction of six biologically relevant trace metals—Zn, Cu, Cd, Co, Ni, and Pb—by tracking their monthly distribution in the productive upper 10 m of the water column at two stations of different trophic characteristics, while also performing a comprehensive organic matter (OM) characterization. By exploring the links between TM and OM, we aim to highlight the importance of studying inorganic–organic feedbacks in the marine environment. We hypothesized that the already observed and reported impacts of global change on the oligotrophication of the NA will also impact TM distribution in the area, which in turn will have implications for the microbial community. With this in mind, a multi-methodological approach was used, combining the analysis of TMs with the determination of nutrients (N, P, Si), chlorophyll a (Chl a), dissolved organic carbon (DOC), surface-active organic substances (SAS), nitrogen-containing polymeric organic material (N-POM), and physico-chemical parameters (pH, dissolved O2, seawater temperature, Po River discharge rate), which provided valuable information on the TM biogeochemical cycling in the area.

2. Materials and Methods

2.1. Study Area and Sampling

The NA is the shallowest part of the Adriatic Sea, with a maximum depth of less than 50 m. It is under the strong influence of the Po River, which accounts for about 49% of the total riverine inputs into the Adriatic Sea [27]. Two stations, 108 and 107, were selected because of their contrasting trophic characteristics. Station 108 (44°45′24″ N, 12°45′0″ E), located 25 km from the Po River mouth, is considered eu- to mesotrophic, while station 107 (45°2′52″ N, 13°19′0″ E), located about 25 km from the Croatian coast (eastern Adriatic), is considered oligotrophic [28] (Figure 1). Seawater samples were collected approximately monthly between November 2016 and October 2017 at depths of 0, 5 and 10 m using 5 L Niskin bottles from the R/V “Vila Velebita”.

2.2. Physico-Chemical Parameters

Seawater temperature, salinity, dissolved O2 concentration and pH were measured with a CTD (conductivity, temperature, depth) profiling system (Seabird SBE 25, Sea-Bird Electronics Inc., Bellevue, WA, USA). Daily values of the Po River discharge rate were retrieved from data collected at the Pontelagoscuro station (50 km from the delta). The data were provided by Assessorato Programazione, Piafinicazione e Ambinete of the Emilia Romagna Region (Italy) (http://www.arpa.emr.it/, accessed on 15 October 2019).

2.3. Nutrient and Chlorophyll a Analysis

Determination of nitrates (NO3), nitrites (NO2), orthosilicates (SiO44−), orthophosphates (PO43−) and organic phosphorus (Org P) concentrations were made on board immediately after sample collection by spectrophotometric methods according to Parsons et al. [29,30], with a modified technique of the indophenol-blue method used for ammonia (NH4+) determination [31]. Concentration of Org P was determined by subtracting the concentration of PO43− from total phosphorus. The absorbance readings for all nutrients were made on a UV-Mini 1240 spectrophotometer (Shimadzu, Japan) with 10 cm quartz cuvettes. Method accuracies for NO3, NO2, NH4+, PO43− and SiO44− are ±3%, ±3%, ±5%, ±3% and ±6%, respectively, and limits of detection (LOD) are 0.05 µmol L−1, 0.01 µmol L−1, 0.1 µmol L−1, 0.02 µmol L−1, and 0.05 µmol L−1, respectively. The detection limits were calculated from analytical blank values measured during calibration and during routine analyses for each nutrient separately, according to the following formula: LOD = 3 × SB/b, where SB is standard deviation of the blank, and b is slope of the calibration curve.
Subsamples for the determination of Chl a concentrations were filtered through a 200 µm mesh to remove zooplankton and then through glass filters GF/F grade (Whatman, UK) with pore diameter of 0.7 µm. After extraction in 90% acetone for 3 h (in the dark, with grinding), Chl a concentrations were determined on a Turner TD–700 fluorometer (Turner Designs, San Jose, CA, USA) [29].

2.4. Organic Matter Characterization

Organic matter analysis included measurements of DOC, SAS, and N-POM.
A carbon analyzer model TOC-VCPH (Shimadzu, Japan) with a platinum silica catalyst and a nondispersive infrared (NDIR) detector for CO2 was used for measurements of DOC. Concentrations were calculated as the average of three replicates. The mean of the instrument and ultrapure water (Milli-Q, Merck, Burlington, MA, USA) blank corresponds to 0.03 mg L−1 (n = 33) with high reproducibility (1.6%). The method is accredited according to the standard HRN EN ISO/IEC 17025 for the determination of DOC in surface, groundwater, transitional, coastal waters, and the seawater (https://akreditacija.hr/registar/, accessed on 4 February 2020).
Alternating current voltammetry (ACV) was used for SAS determination. This method allows independent measurement of faradaic and capacitive currents as a function of electrode potential by changing the phase angle (φ) [32]. We applied the phase-out mode (φ = 90°) to record capacitive currents generated by adsorption/desorption processes of SAS in a hanging mercury drop electrode (HMDE) double layer. The measurement conditions were: accumulation potential, EA = −0.6 V, accumulation time, tA = 60 s, step potential, Es = 10 mV, amplitude, a = 10 mV, and frequency, f = 77.35 Hz. The adsorption of SAS on the HMDE surface causes a decrease of the capacitive current below the value of the pure electrolyte. The amount of SAS in the samples was quantified as the equivalent of the concentration of Triton-X-100 (Merck, Burlington, MA, USA), the nonionic surfactant usually used as a model for calibration of SAS [33]. LOD for T-X-100 was 0.039 mg L−1. Each sample was analyzed in three consecutive measurements.
N-POM was detected using the constant current chronopotentiometric stripping (CPS) method [34]. N-POM comprises protein-like material and is part of the SAS. Only the protein-like molecules present in seawater enable a specific catalytic hydrogen evolution reaction when adsorbed on the HMDE surface [35]. Consequently, a catalytic peak H was recorded in CPS. The N-POM concentration was expressed in equivalents of human serum albumin (HSA, Merck, Burlington, MA, USA), a model protein, according to the linear plot: peak H height (dE/dt)−1 vs. HSA concentration. CPS conditions were: EA = −0.6 V, tA = 60 s, equilibration time = 5 s, stripping current Istr = −1 µA, maximum measurement time = 5 s. LOD for HSA detection was 0.003 mg L−1.

2.5. Trace Metal Analysis

Samples for TM analysis were collected using Niskin bottles and immediately transferred to Nalgene® fluoropolymer (FEP) bottles, which were thoroughly pre-cleaned with 10% nitric acid and rinsed with Milli-Q water before sampling. Total TM concentrations were measured in unfiltered water samples, while dissolved metal fractions (hereafter named dissolved) were determined after sample filtration through 0.45 µm cellulose nitrate membrane filters (Sartorius, Göttingen, Germany) [36,37]. Prior to voltammetric analysis, unfiltered and filtered water samples were acidified with nitric acid (Suprapur® grade, Merck, Darmstadt, Germany) to a pH < 2 and UV irradiated for 24 h (150 W mercury lamp, Hanau, Germany) to decompose OM that complexes and stabilizes TMs in seawater. The measurements of TM concentration were performed using the ECO Chemie μAUTOLAB multimode potentiostat (Utrecht, The Netherlands) connected with a three-electrode system Metrohm 663 VA STAND (Herissau, Switzerland). A static mercury drop electrode (SMDE) was used as the working electrode. The electrochemical method used for Cu, Cd, Pb and Zn was differential pulse anodic stripping voltammetry (DPASV) with standard addition method. The DPASV parameters for Cd, Pb and Cu were: EA = −0.85 V, tA = 600 s, Es = 2 mV, pulse amplitude (a) = 20 mV, and for Zn: EA = −1.1 V, tA = 120 s, Es = 2 mV, a = 20 mV. The limits of quantification (LOQ) determined in acidic Milli-Q water were 0.01, 0.01, 0.08, and 0.15 nM for Cd, Pb, Cu, and Zn, respectively (based on a standard addition method and the 10σ rule for tA = 10 min). Concentrations of total and dissolved Ni and Co were measured by adsorptive cathodic stripping voltammetry (AdCSV), using the standard addition method. The AdCSV parameters for Ni and Co were: EA = −0.7 V, tA = 120 s, Es = 2 mV, a = 20 mV. LOQ for Co and Ni in acidic Milli-Q water were 0.02 and 0.17 nM, respectively. The accuracy of the voltammetric method was verified using the Open Ocean Seawater Reference Material for Trace Metals (NASS-6), of the National Research Council of Canada with TM certified values (µg L−1): Cd 0.0311 ± 0.0019, Co 0.015, Cu 0.248 ± 0.025, Pb 0.006 ± 0.002, Ni 0.301 ± 0.025 and Zn 0.257 ± 0.020. All measured metal concentrations were within 5% of the certified values.

2.6. Statistical Analysis

The Shapiro–Wilk test was used to test the data for normality. Since data was not normally distributed, the Spearman correlation coefficients were used to determine the correlations between variables. Origin 7 (Origin Lab) and CorrData (https://sites.google.com/site/daromasoft/, accessed on 17 October 2019) software were used for statistical analysis.

3. Results and Discussion

3.1. Physico-Chemical Parameters of the Northern Adriatic

Basic physico-chemical parameters, including seawater temperature, salinity, dissolved O2, Chl a concentrations, pH, and the Po River discharge, are shown in Figure 2, while all data are listed in the Supplement Information (Tables S1 and S4).
Sea surface temperature in the shallow waters of the NA exhibited a regular sinusoidal trend, ranging from 8.0 °C in January 2017 to the highest recorded temperature of 28.0 °C at station 108 in June 2017 (Figure 2a,b). Dissolved O2 concentrations ranged from 4.5 to 7.9 mL L−1 at station 108, and 4.8 to 6.7 mL L−1 at station 107, and were highest in winter/spring, with a significant decrease in summer (Figure 2g,h). At station 108, pH had a wider range of 8.2 to 8.5, while at station 107, it ranged from 8.2 to 8.3 (Figure 2i,j).
The Po River usually has two maximum discharges annually, one in spring and one in autumn [38]. We observed a maximum discharge in December 2016 and significant discharge intensity in May 2017 (http://www.arpa.emr.it/ (accessed on 15 October 2019)) (Figure 2k). The discharge seasonal cycle does not strictly follow the changes of the surface salinity, due to the important role of circulation in distributing the freshwater in the NA [14]. Salinity at station 108, ranging from 31.2–38.2, was highest in the period between late autumn-winter (November 2016 and January 2017), while at station 107, salinity varied between 36.0 and 38.2, with the highest values recorded between November 2016 and March 2017 (Figure 2c,d). During autumn/winter, the Po River freshwaters remain coastal bound and flow towards the south, with its influence not spanning far into the NA [39,40]. Due to the predominant cyclonic surface circulation, which drives oligotrophic waters from the middle Adriatic to eastern NA, a strong trophic gradient from the east to the west coast is usually formed [41]. In summer, the Po River plume extends further into the NA basin, bringing mesotrophic water with lower salinity (<35) (Chl a conc > 1 µg L−1) in an approximately 5 m thick layer [16,42]. The presence of this countercurrent, which occurs during the water column stratification, has been documented and named the Istrian Coastal Countercurrent (ICCC) [43,44]. Indeed, the lowest salinities were recorded during the period June–July 2017 at station 108, with a minimum of 31.2 in June at the surface, and during the period June–August 2017 at station 107, with a minimum of 36 in July at the surface. Precipitation in the western and eastern NA was highest in September 2017, with local maximums in November 2016, February, and May 2017, but with about twice as much precipitation in the eastern NA (Supplementary Figure S1, Supplementary Table S2a).
Phytoplankton abundance, expressed by Chl a concentrations, differed between two stations corresponding to their trophic status (Figure 2e,f). Concentrations of Chl a ranged from 0.17 to 3.09 µg L−1 (average 1.04 µg L−1) at station 108, and from 0.11 to 2.14 µg L−1 (average 0.49 µg L−1) at station 107 (Table S4). Although no correlation was found between Chl a and salinity at station 108, the Chl a peaks in March and June 2017 correspond to significant decreases in salinity, indicating freshwater origin of nutrients (Table 1) which stimulated phytoplankton blooms. However, a decrease in Chl a concentration is observed towards summer in parallel to the lower Po River discharge. Although the Po plume extends much further eastward in summer than in winter, as indicated by the salinity data, the lower river discharge results in a lower nutrient input, which are quickly assimilated by plankton, leaving the nutrient-poor freshened seawater to reach the eastern part (station 107) of the basin. Oxygen production followed photosynthetic CO2 consumption by phytoplankton, which was reflected in the increase in Chl a and pH, especially at station 108 (Figure 2e,g,i; Table 1).

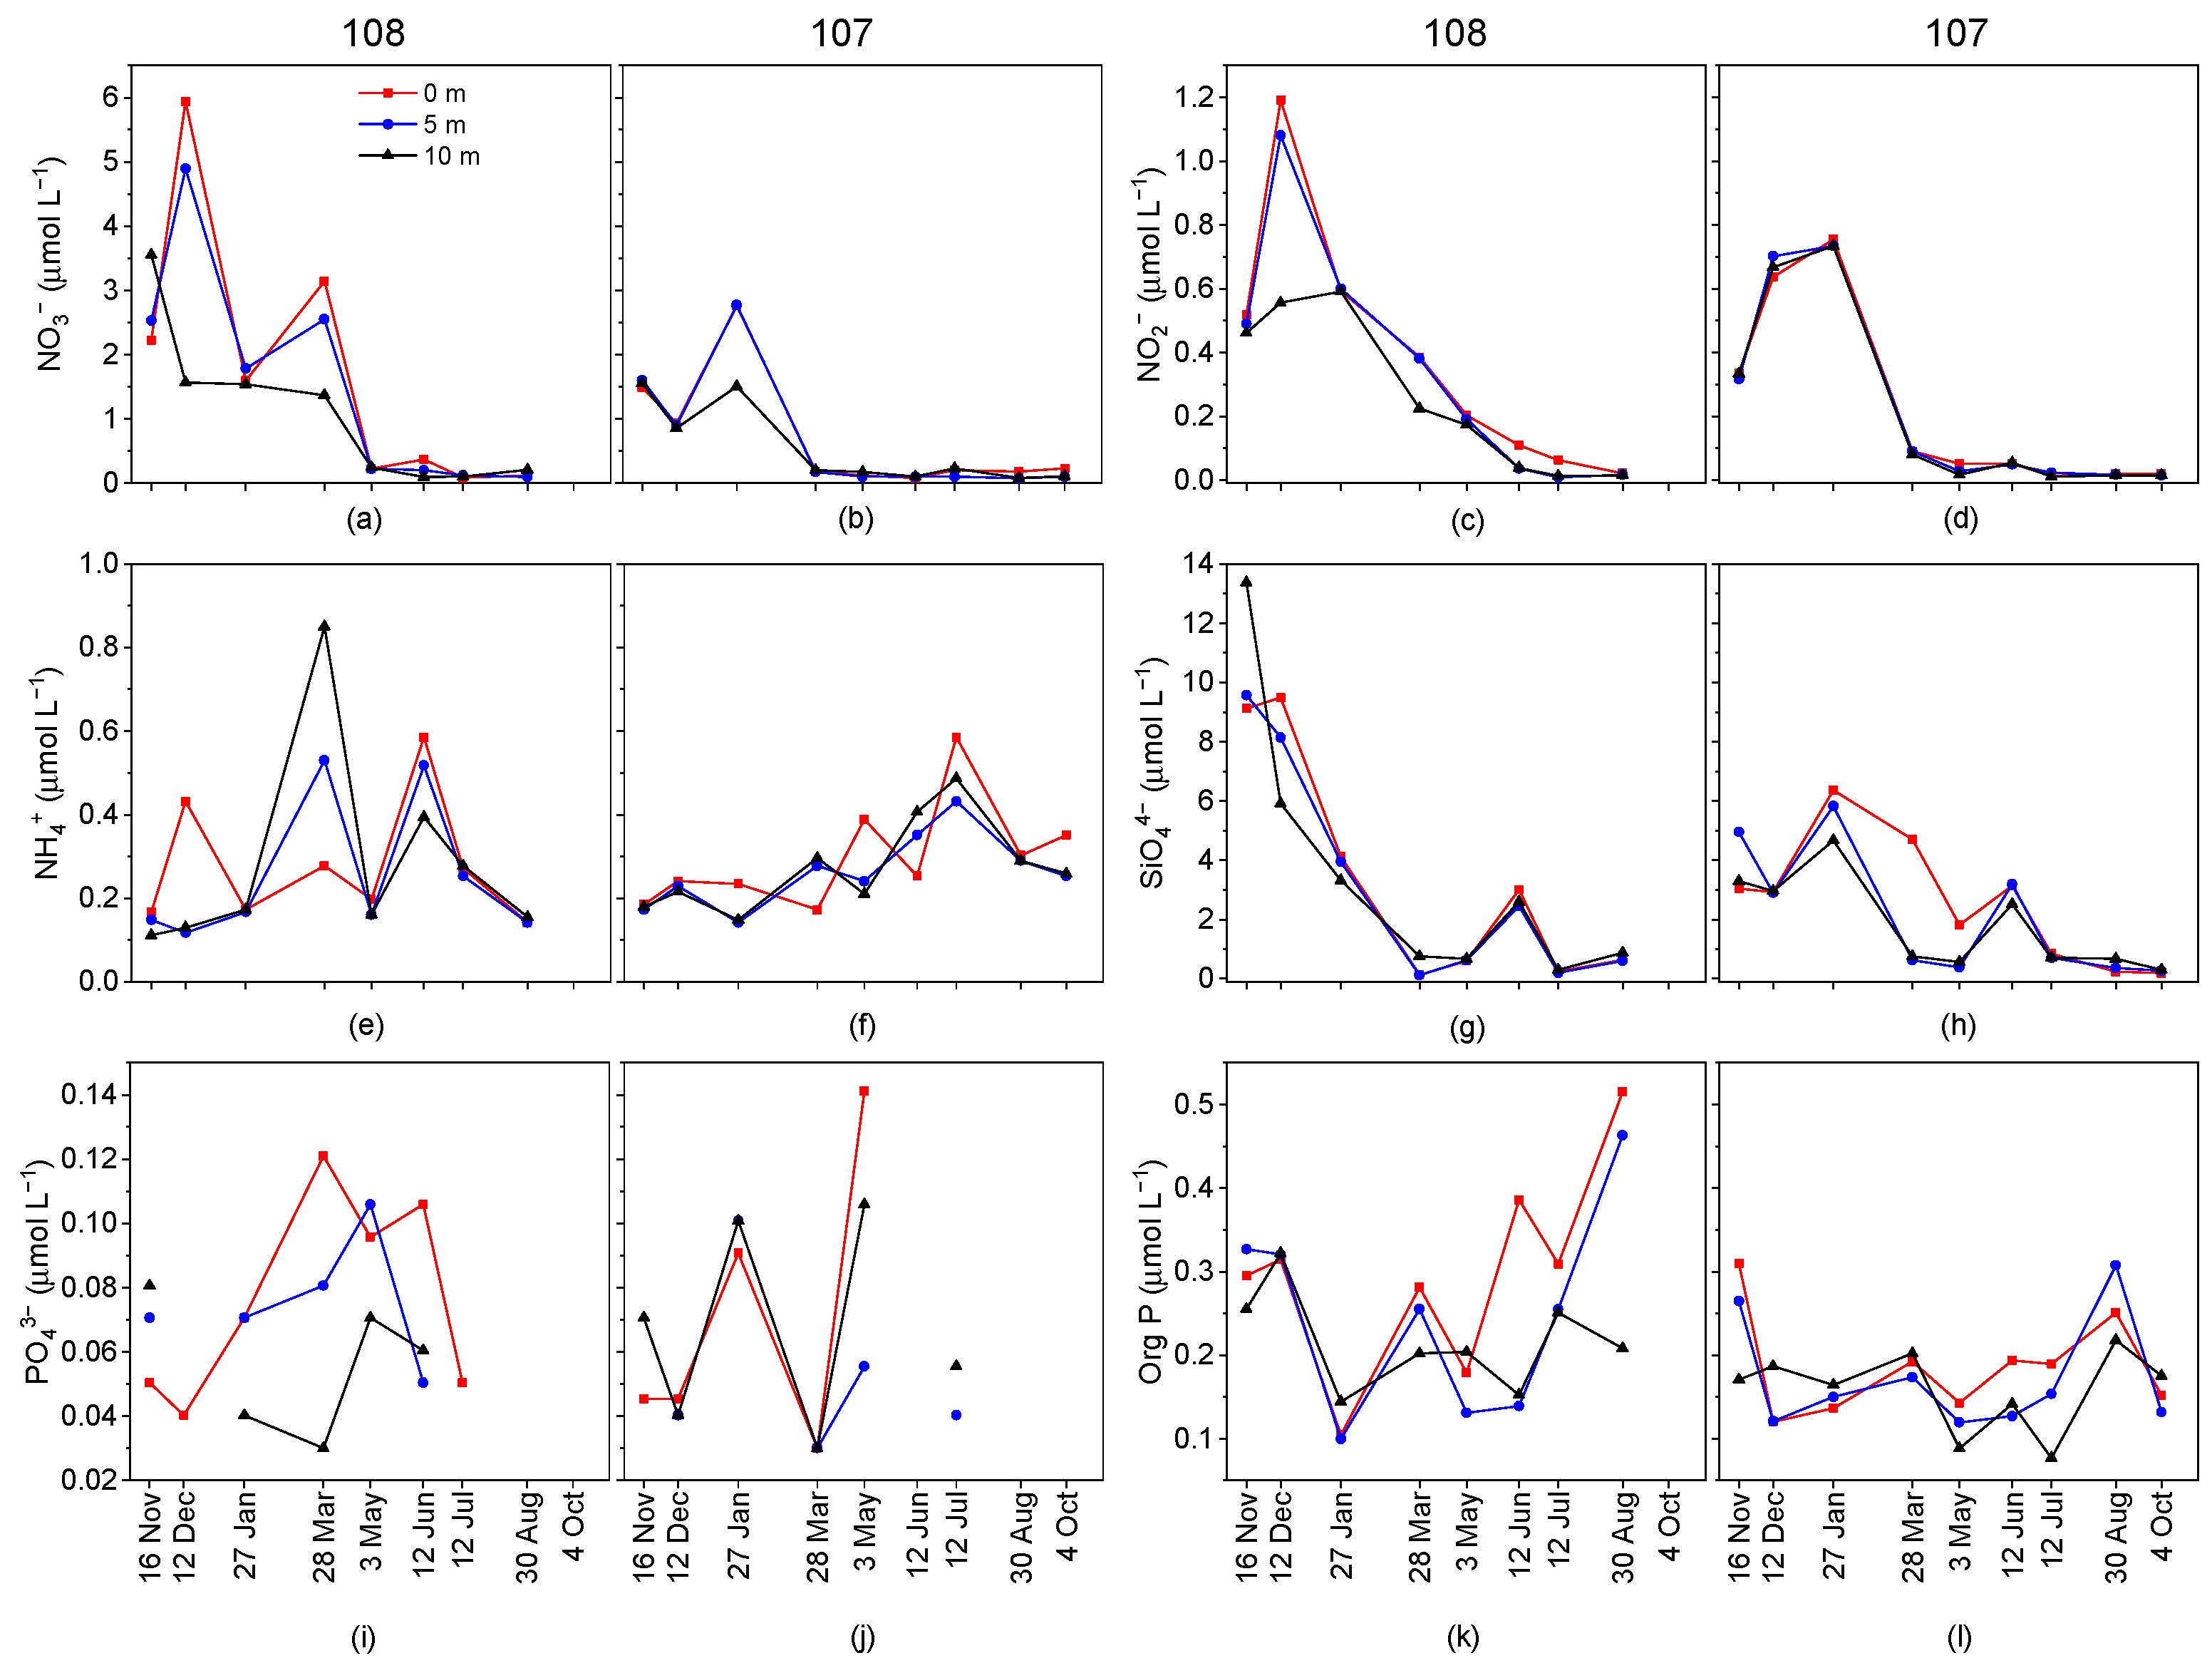
3.2. Nutrient Regime in the Northern Adriatic

The NA is considered one of the most biologically productive areas in the oligotrophic Mediterranean [11]. However, many recent studies have documented that the NA ecosystem has changed towards oligotrophy, with a marked decrease in nutrient concentrations, phytoplankton abundance and OM production, especially on the eastern side [14,18,45,46,47]. Increased seawater temperatures in the NA, and nutrient scarcity due to decreased river discharge, are forcing phytoplankton to adapt and direct primary production toward increased DOM production and plankton lipid accumulation [15,48]. All these findings suggest that the NA could be considered a hot spot for studies on environment change related to anthropogenic impacts and climate change, requiring close monitoring of biogeochemical and physico-chemical parameters in the area.
The distributions of NO3, NO2, NH4+, SiO44−, PO43−, and Org P in the first 10 m of the water column at the two sampling stations are shown in Figure 3., while all measured data are given in Table S3. Concentrations of all nutrients were generally higher at station 108 than at station 107, except PO43−, whose average concentrations were the same at both stations, and ranged from 0.3–0.14 µmol L−1 at 107 and from 0.03–0.14 µmol L−1 at 108. The statistically negative correlation observed between salinity and PO43− at both stations points to freshwater input as the source of this nutrient, although summer concentrations of PO43− at station 107, mostly below LOD, and only detected at 5 and 10 m depths in July, indicated remineralization processes as an additional source of phosphorus [49]. No PO43− was detected at 0 m at station 107 in summer, which indicates that the freshwater which reached station 107 was already nutrient depleted. Significant concentrations of PO43− detected at 5 and 10 m depth at station 108 in November point to regular water column mixing in autumn, which brings regenerated nutrients from the bottom. Accordingly, the highest concentrations at 10 m depth at station 108 were determined for NO3 (3.55 µmol L−1) and SiO44− (13.37 µmol L−1). Otherwise, NO3 concentrations at station 108 ranged from 0.08 µmol L−1 to 5.93 µmol L−1, with the highest concentration measured at the surface in December 2016, during a period of high riverine discharge (Figure 2k). At station 107, NO3 concentrations ranged from 0.07 µmol L−1 to 2.77 µmol L−1 detected in January, when a peak was observed at all three depths. This increase might have potentially been caused by freshwater influx, according to a slight observed salinity decrease and an increase in PO43− concentrations detected at all three depths in January at 107. NO2 concentrations at both stations were highest between November 2016 and January 2017, after which they decreased significantly, especially at station 107. At 108, they ranged from 0.01–1.19 µmol L−1, and at 107, from 0.01–0.75 µmol L−1. N/P averaged 58 and 39 at stations 108 and 107, respectively, indicating a nitrogen excess characteristic of the NA [50], due to the highly imbalanced inorganic N/P ratio for autotrophic demands that characterizes the Po River waters (ca. 100) [51]. The immediate PO43− assimilation by plankton is expected to lead to further nitrogen excess. At both stations, concentrations of SiO44− showed a decreasing trend from winter towards summer, and ranged from 0.11 to 13.37 µmol L−1 at station 108 and from 0.18 µmol L−1 to 6.36 µmol L−1 at station 107. A significant SiO44− concentration increase was observed in June 2017 at both stations, coinciding with a significant salinity drop at station 108, and a less pronounced one at station 107, both indicative of freshwater nutrient input. The SiO44− increase coincided with a significant increase in Chl a at station 108, which was not observed at station 107, probably due to scarcity of PO43− at the time at 107; PO43− concentrations were below LOD. Oppositely, in May, when highest concentrations of PO43− at station 107 were observed, along with a slight salinity drop, a peak of Chl a was also observed, highlighting phosphate as one of the important drivers of primary production in the area. Similarly, at station 108, peaks of PO43−, as well as NO3, NH4+, (Figure 3) and Chl a (Figure 2e), were observed at station 108 in March at 0 and 5 m depth, accompanied by a marked salinity decrease, and an increase in dissolved O2 and pH (Figure 2), indicating an influx of nutrient-rich freshwater. Apart from PO43−, NH4+ was the only nutrient that showed a statistically significant negative correlation with salinity, at both stations, pointing to its freshwater origins. Concentration ranges for NH4+ were between 0.11 µmol L−1 and 0.85 µmol L−1 at station 108, and 0.14 µmol L−1 to 0.58 µmol L−1 at station 107. In addition to freshwater inputs, high NH4+ concentrations in March and June 2017 at station 108 can be explained by the remineralization of freshly produced OM by bacterial activity [52], which is due to the concurrent phytoplankton blooms indicated by the significant Chl a levels in March and June at station 108. However, the significant increase in NH4+ in July 2017 at station 107 (0.59 µmol L−1) was not accompanied by an observable Chl a increase, although a positive statistically significant correlation between temperature and NH4+ concentrations at station 107 suggests that remineralization processes, probably due to increased bacterial activity with increasing temperatures, could strongly influence NH4+ behavior at oligotrophic station 107.
Org P from living cells is released into the water column after cell death. Due to low PO43− concentrations in the NA, Org P is an important source of phosphorus for microorganisms [30,53]. The similar trend observed for Org P and temperature, with highest Org P concentrations corresponding to highest temperatures at both stations (Figure 2a,b and Figure 3k,l), can be explained by the bacterial degradation of OM, which peaks in summer [54].
Although concentrations of total inorganic nitrogen species (TIN) and SiO44− were generally higher at station 108 than at station 107, increasing N and Si limitations were detected at both stations, as shown by comparison with NA data from a decade ago (January 2008–January 2010) (Table 2) [28]. With an exception in June 2017, Si limitations at both stations were observed between March and October. Limitations by TIN at both stations were observed in similar periods as Si limitations; at station 108 between May and August, and at 107 between March and October. Phosphorus limitation was prevalent at both stations, with the exceptions of March and June at station 108, and July and May at station 107, when concentrations of PO43− were above 0.1 µmol L−1.

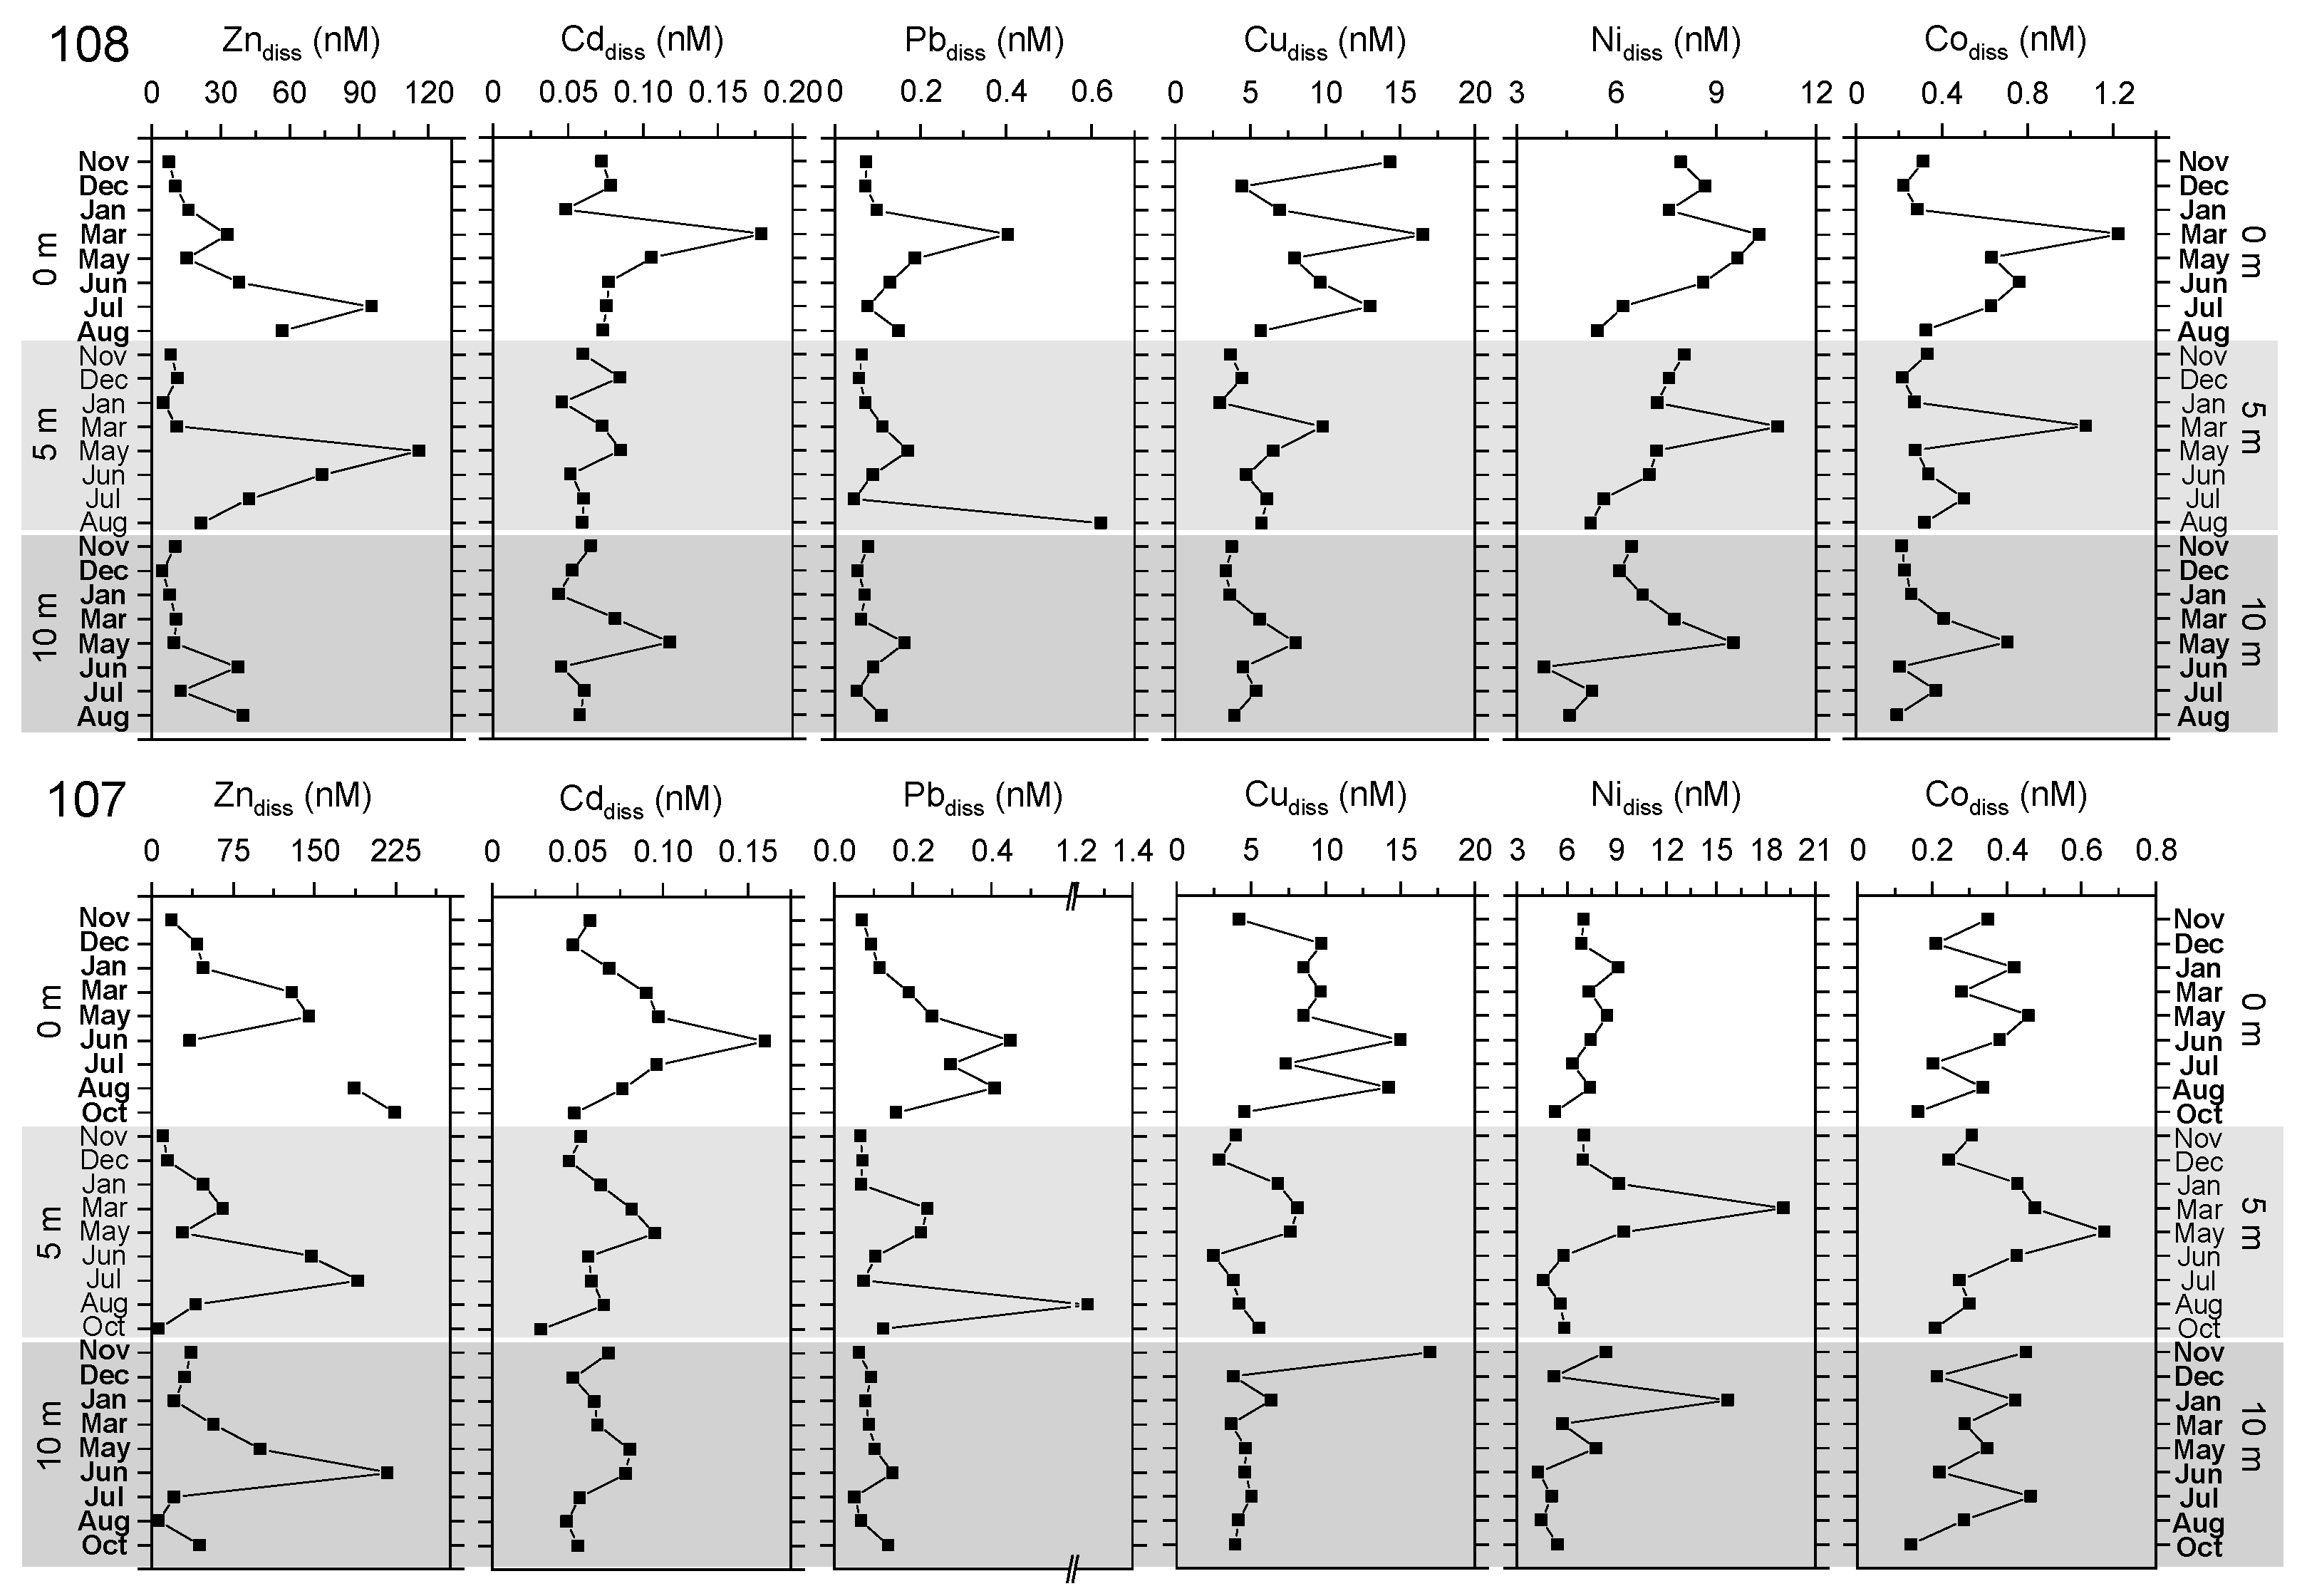
3.3. Trace Metal Distribution in the Northern Adriatic

The determined concentration ranges for dissolved TMs at the two sampling stations in the NA are listed in Table 3, and compared with the values reported for other Mediterranean areas. Annual distribution of TM concentrations for the stations 108 and 107 are shown in Figure 4. The data are listed in Supplementary Tables S6 and S7, respectively, together with the total TM concentration data.
Concentrations of all TMs were generally lower than in the Po River (Table 3), which indicated that only a portion of TMs from the river reached marine waters of stations 108 and 107. This is due to TM aggregation and adsorption onto particles, complexation with OM, and water masses circulation that affect transport to the investigated region. All TMs showed a negative correlation with salinity at station 108, statistically significant for Zn, Cu, Cd and Co (Table 1). This suggests that the low salinity waters from the Po River are a significant source of TM in the NA, especially during the summer months when water circulation allows the river plume to spread eastward. Similarly, the lowest salinity at station 107 was determined in summer and negative correlations, albeit weaker, were observed between salinity and dissolved Zn, Cd, Cu, Co and Pb concentrations at this station.
The dissolved Zn concentrations were higher than those reported for most Mediterranean sites (Table 3), but somewhat similar to coastal concentrations monitored in the Gulf of Trieste, which showed an increase in dissolved Zn levels between 1976/77 and 1992/93 [19]. At both NA stations, winter dissolved Zn concentrations were lowest throughout the water column (Figure 3), ranging from 5–16 nM (average 9 nM) at station 108, and from 10–48 nM (average 30 nM) at station 107. The concentrations of dissolved Zn showed an increase towards warmer months (June, July, and August), ranging from 13–95 nM (average 46 nM) at station 108 and from 6–217 nM (average 106 nM) at station 107. Peak values were observed at the surface in July at both stations, with the exceptionally high concentration of 1082 nM recorded at station 107. A similar trend was observed for 5 m depth, but the maximum concentration was reached in May at station 108 and in July at 107.
Dissolved Cd concentrations did not differ significantly at the two stations. The concentrations ranged from 0.04 to 0.18 nM (average 0.07 nM) at station 108, and from 0.03 to 0.16 nM (average 0.07 nM) at station 107. The highest concentrations were determined at the surface in spring at station 108 and in early summer at station 107. The detected Cd concentrations were slightly higher in the NA compared to other Mediterranean and Adriatic sites (Table 3).
At station 108, dissolved Pb concentrations ranged between 0.04 and 0.62 nM (average 0.13 nM), and at station 107, between 0.05 and 1.24 nM (average 0.19 nM). The higher average Pb concentration at station 107 is due to significantly higher concentrations measured during the warmer months. This indicates additional input of Pb at the oligotrophic station 107 during June through August. The highest concentrations were found in August at 5 m depth at both stations. Dissolved Pb concentrations in the NA were higher than in the southern Adriatic and comparable to those measured in the coastal middle Adriatic (Table 3).
Dissolved Cu concentrations at station 108 were between 3 and 17 nM (average 7 nM), and between 5 and 28 nM (average 7 nM) at station 107, with the highest values recorded at 0 m depth in March at station 108 and June at station 107, corresponding to decreases in salinity at both stations. The measured concentrations were comparable to a study by Tankere and Statham [56] conducted below the Po River estuary in the June–July period; concentrations of dissolved Cu reached 25 nM in waters down to 3 m depth, while they kept at constant value of between 5 and 10 nM at depths below 3 m. A decrease of dissolved Cu concentration with increased salinity was also reported for the area [26,54]. Dissolved copper concentrations measured in this study were slightly higher compared to other Adriatic Sea areas. The concentrations of Cu are known to increase under strong anthropogenic pressure from shipping and tourism, especially in summer, in connection with increasing maritime tourist activities [37]. Lower concentrations of Cu determined in this study, compared to data obtained by an almost 30 years old study by Reisenhofer et al. [19], potentially indicate efforts in the reduction of high Cu levels of anthropogenic origin.
Concentrations of dissolved Ni at both stations were comparable to those measured in the central and southern Adriatic and Mediterranean coastal areas (Table 3). At station 108, dissolved Ni concentrations were between 4 and 11 nM (average 7 nM), and at station 107, concentrations were between 5 and 23 nM (average 7 nM). At station 107, an increase in concentration was observed from winter to spring at all depths, while at station 108, the highest concentration was determined in spring at 5 m depth. Similar Ni concentrations and distribution at the two stations suggest a similar source and biochemical behavior.
Dissolved Co concentrations at station 108 ranged from 0.19 to 1.22 nM (average 0.43 nM). Measured concentrations were lowest in winter, followed by an increase in spring. At station 107, dissolved Co concentrations were lower, ranging from 0.14–0.66 nM (average 0.33 nM). No specific trend was observed, while the highest concentration was determined in spring at 5 m depth. The concentrations of dissolved Co in the surface layer of station 108 were higher than at station 107, while Co concentrations at 5 and 10 m depth were similar. This indicates a major input of Co to station 108 by Po River waters, shown as well by the statistically significant negative correlation with salinity observed at station 108 (Table 1). The measured Co concentrations were among the highest compared to other coastal areas of the Adriatic and Mediterranean Sea (Table 3).
Considering the vertical distribution shown in Figure 4, at station 108, the highest concentrations of all TMs, except Zn, were recorded at the surface in March. At 5 m depth, the concentrations of Cu, Co and Ni remained high in March, while the maximum concentrations of Cd and Pb shifted to May. At 10 m depth, the shift in concentration was evident for all TM except Zn, with maximum concentrations detected in May. This shift in concentration peaks from March to May with increasing depth suggests the transport of TMs to deeper layers and their subsequent release due to remineralization processes in deeper layers. Such a distribution was not observed at station 107, indicating different biogeochemical conditions at the two stations, which is further confirmed by the analysis of OM data.

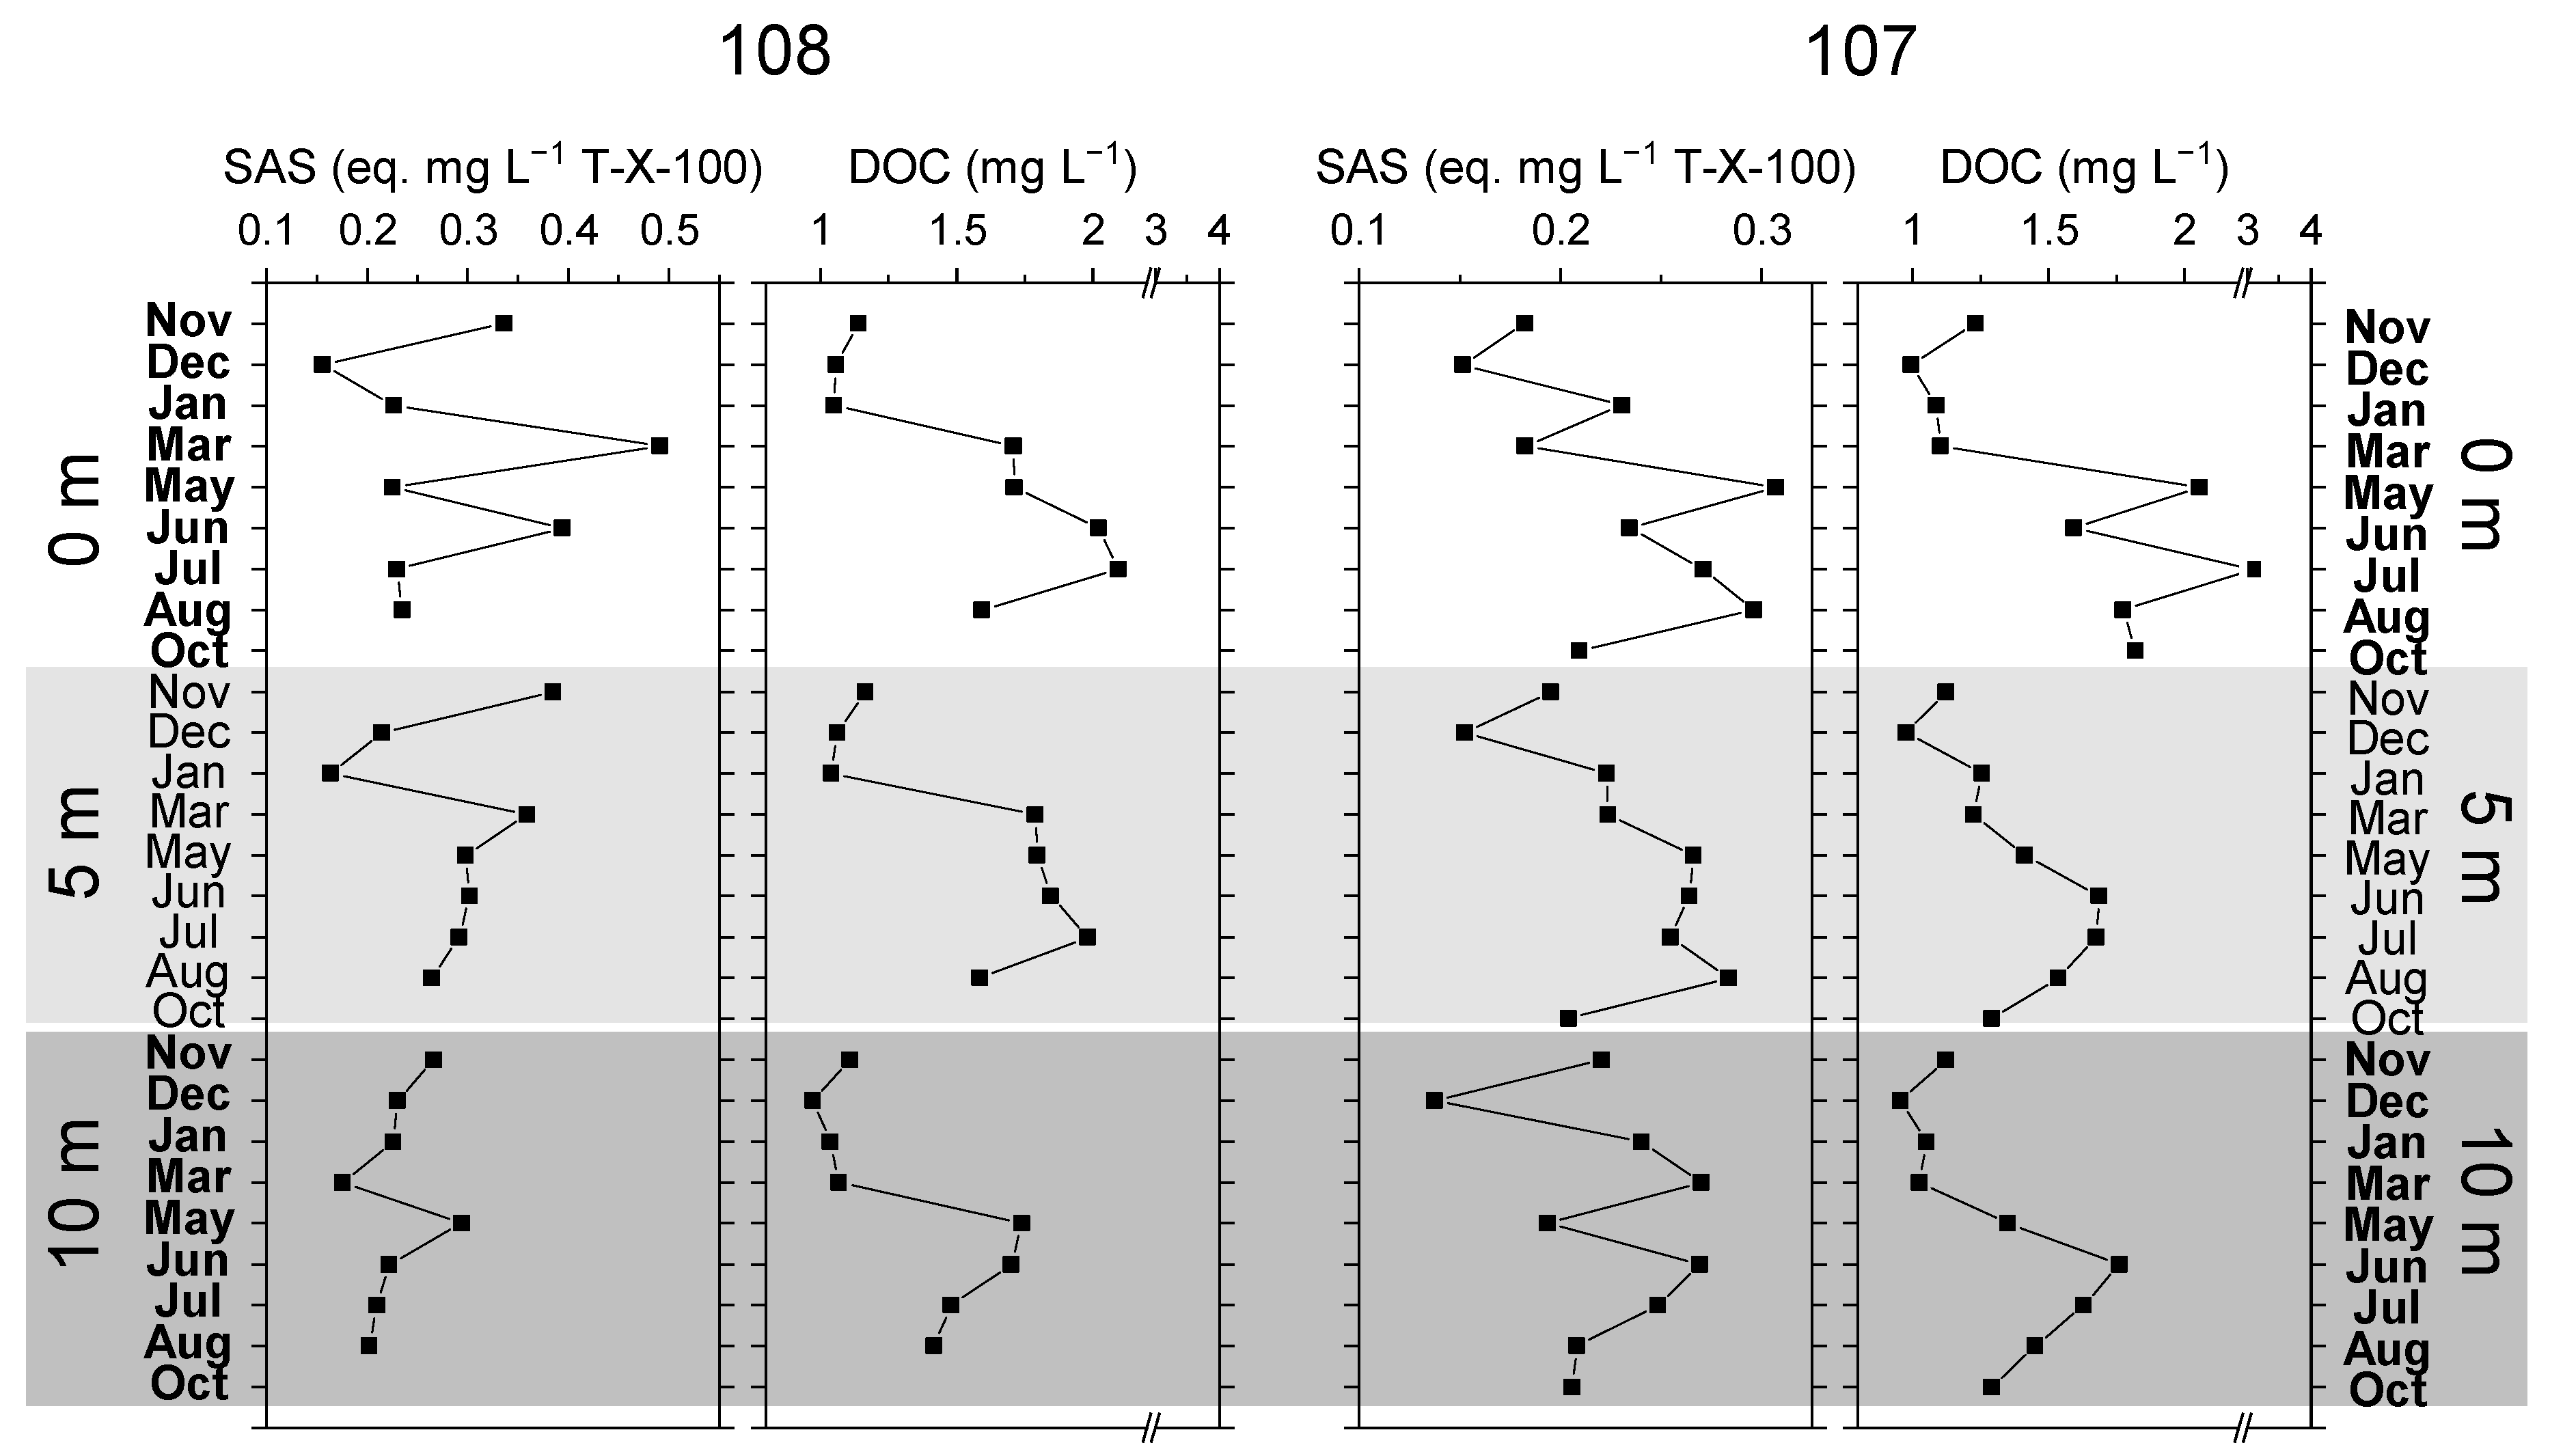
3.4. Dissolved Organic Matter Distribution in the NA

The circumstances in the NA are oceanographically dynamic, which certainly has a major impact on the TM distribution and cycling. To gain better insight into the factors affecting TM distribution, we determined DOC, expanded the characterization of the OM pool by determining SAS, a class of organic molecules that include metal complexing ligands [61], and N-POM, part of the marine proteinaceous substances, and created a correlation matrix with TM and the environmental data obtained (Table 1). Data are shown in Figure 5 and listed in Supplementary information, Tables S3–S7.
Concentrations of DOC did not differ markedly between the two stations, and the average concentrations determined were 1.47 mg C L−1 and 1.34 mg C L−1 at stations 108 and 107, respectively. In agreement with the results of a long-term study (25 years) tracking DOC concentrations in the NA [18], we observed a summer DOC accumulation, with the highest concentrations in July at 0 m depth; 2.09 mg C L−1 at station 108 and 3.09 mg C L−1 at station 107 (Figure 5, Supplementary Table S5). Novak et al. [48] explain the accumulation of DOM by environmental stress (high temperature, low nutrient availability) leading to increased primary production directed towards DOM production, while Carr et al. [62] suggest increased bacterial degradation of particulate organic matter (POM), leading to subsequent release of DOM. Our study found evidence of both processes as potential reasons for the summer DOC accumulation; the statistically significant negative correlation between DOC and dissolved O2 at station 107 (Table 1) indicated oxygen consumption by bacterial respiration [63], pointing to increased bacterial activity on OM. Furthermore, the maximum DOC concentrations determined in July at both stations at 0 m depth coincide with the highest NH4+ concentrations (Figure 3e,f), which generally result from bacterial remineralization of OM that contains N [50]. In addition, the statistically significant negative correlation among salinity, NO2, NO3 and SiO44− and DOC at both stations confirmed increased DOC production during low nutrient availability.
As a part of DOM, SAS consist of a mixture of compounds including biopolymers such as polysaccharides [64], hydrophobic lipids, humic and fulvic acids ([44,65] and references therein), and are mainly derived from phytoplankton exudates and degradation products [66]. According to Tepić et al. [64], freshly produced carbohydrates contribute the most to surfactant activity in seawater. The concentrations of SAS ranged from 0.09 to 0.30 mg L−1 eq. Triton-X 100 at station 108, and were less abundant at station 107, ranging from 0.08–0.19 mg L−1 eq. Triton-X-100 (Figure 5, Supplementary Table S5). The statistically significant positive correlation between SAS and DOC at both stations (Table 1) indicated that SAS were important components of the DOM pool. The similar distribution of Chl a and SAS concentration peaks at the surface at station 108 (Figure 2e and Figure 5) suggested phytoplankton activity as a major source of SAS. In contrast, a statistically significant negative correlation between SAS and Chl a at station 107 could indicate a different type of SAS material at the two stations. Further OM characterization, namely the determination of nitrogen-containing polymeric organic material, confirmed this assumption. N-POM at station 108 ranged from 5.55–25.51 µg L−1 eq. HSA, and from 3.61–16.07 µg L−1 eq. HSA at station 107 (Table S5). An unusually high peak of N-POM was detected at station 108 in March 2017 (0 and 5 m depth) and June 2017 (0 m depth), which coincided with the highest Chl a concentrations. This suggests that phytoplankton production is the main source of N-POM at station 108. Accordingly, analysis of linear correlations between N-POM and parameters indicative of phytoplankton activity (Chl a, O2 and pH) showed a statistically significant positive correlation for station 108 (Supplementary Figure S3). No such correlation was observed at station 107, again suggesting that the produced OM contributing to the N-POM pool at station 107 was different. At 0 m depth at station 107, maximum N-POM concentrations coincide with maximum DOC and NH4+ concentrations, suggesting bacterial OM remineralization processes as a possible source of N-POM. At both stations, N-POM correlated positively with SAS, suggesting that it was a part of the SAS pool. The concentration of N-POM was below the LOD in autumn and winter (November 2016–February 2017) at both stations.

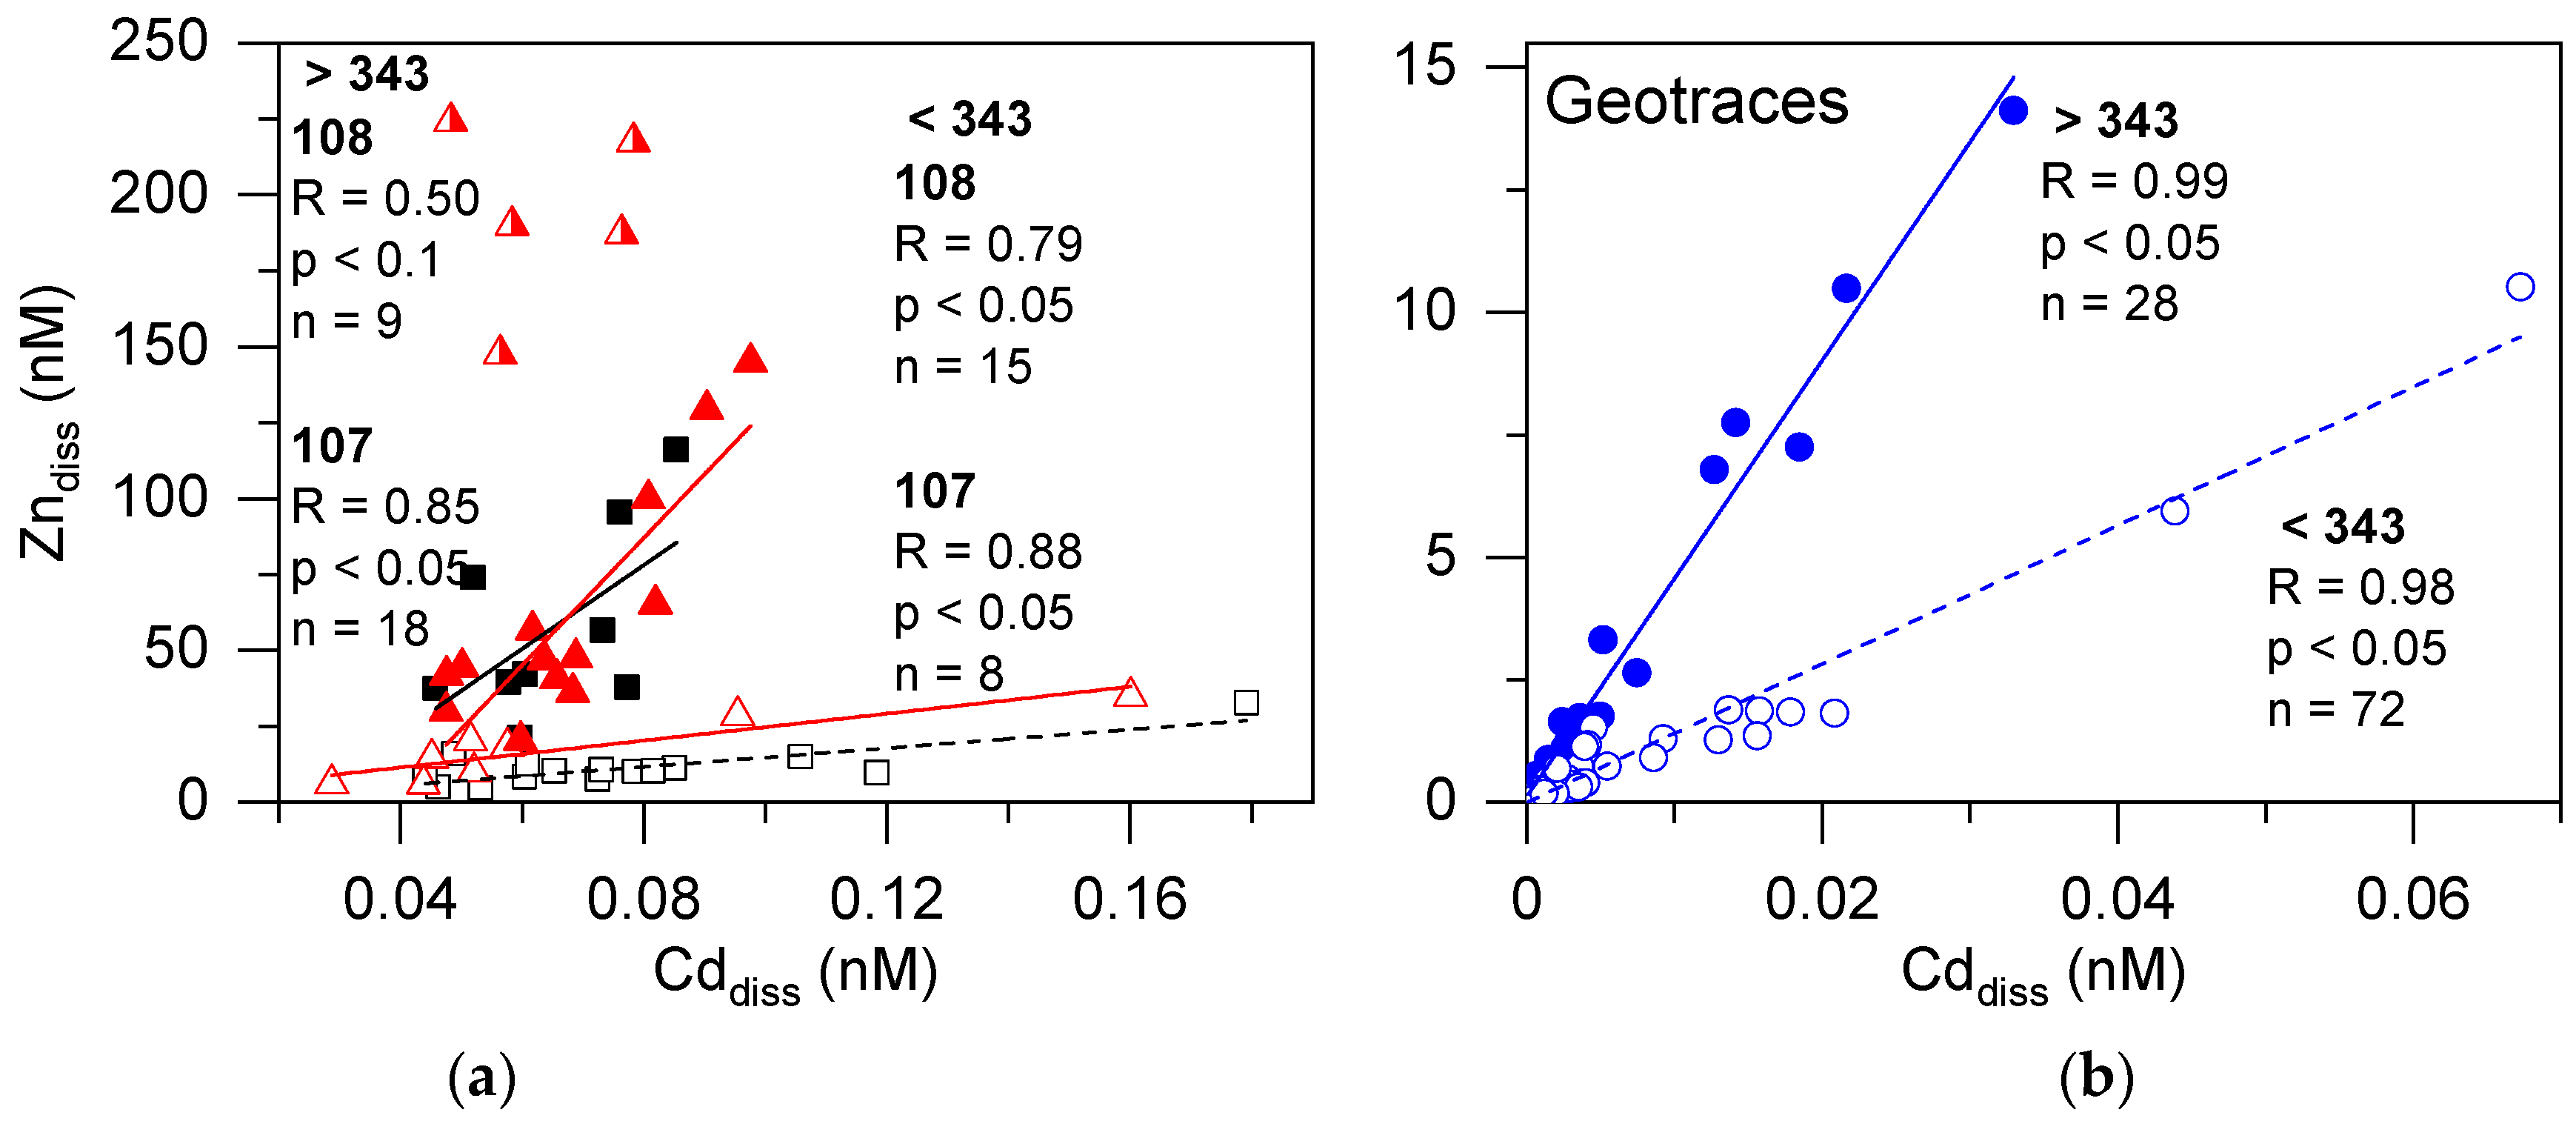
3.5. DOM Impacts on the Distribution of TMs in the Northern Adriatic

Some specific relationships between TMs and DOM can be observed by analyzing Figure 4 and Figure 5. The two highest concentrations of DOC, determined at the surface in July, were accompanied by a significant increase in Zn concentration at station 108 and the exceptionally high Zn concentration (1082 nM) at station 107. Zn in natural waters occurs as a free ion or bound in relatively weak complexes [67,68,69,70]. According to our data, Zn was mostly present in the dissolved fraction (88% at station 107 and 84% at station 108), and in the NA it was mainly complexed with DOM as well as SAS (Table 1). This could provide an additional explanation for the accumulation of DOM during summer, interpreted by the findings of Wada and Suzuki [71], who showed that Zn complexed with OM has an inhibitory effect on OM bacterial degradation processes, especially in coastal areas. Negative correlations between Zn and Chl a were found at both stations, although statistically significant only at station 108 (Table 1), reflecting the uptake of Zn during phytoplankton growth and reproduction [72]. Higher Zn concentrations at station 107, as well as more Zn in the dissolved phase compared to station 108, can be explained by the oligotrophy of the eastern side of the NA, as low phytoplankton abundance most likely facilitates slower removal of Zn through sedimentation processes and its longer residence time in the water column. Similarly, investigation of sediments in the northern Baltic Sea revealed a decrease in Zn deposition associated with oligotrophication [73]. Higher maritime traffic to the ports of Koper, Trieste, Monfalcone and Venice, as well as increased recreational boat traffic on the eastern side (station 107) compared to the western side (station 108) of the NA (Supplementary Figure S5), may have contributed to increased Zn concentrations at station 107. This is because Zn, along with Cu, is a common ingredient in antifouling paints for transport vessels and recreational boats, and the leached amounts of Zn and Cu can reach concentrations toxic to marine microorganisms in areas of high traffic density [74,75]. The significantly higher concentrations of Zn at station 107 compared to station 108, which was not observed for Cu concentrations, might be due to Cu levels in anti-fouling paint being more strongly regulated than Zn, and the leached Zn being significantly more present in the dissolved phase, compared to Cu [76]. Statistically significant positive correlations were observed between Zn, Pb and Cu at 108 (Table 1), suggesting a common origin, probably the Po River, but possibly also atmospheric deposition. Studies on aerosol and bulk deposition of TM in the NA showed that the three most abundant metals in aerosols were Zn, Pb and Cu, while the ratios between atmospheric deposition and Po River supply rates (Atm/Po) for Pb, Cu, Cd and Ni were 2, 0.7, 0.7 and 0.1, respectively [77,78]. These results highlight the importance of atmospheric deposition for marine TM supply, which is expected to become even more important in the future [79]. We also observed that rainwater can occasionally contribute significantly to the Zn pool at station 107 (Supplementary Figure S6).
Cadmium is present in marine waters mainly in the dissolved fraction with great affinity to form complexes with OM [80]. In the NA, 87% and 85% of the total Cd was in the dissolved fraction at stations 108 and 107, respectively. The statistically significant positive correlation found at station 108 between Cd and N-POM (Supplementary Figure S4) indicates a possible role of proteinaceous OM in Cd complexation processes, while a positive statistically significant correlation was found at station 107 between Cd and SAS. Despite ongoing discussions [81,82], there are indications that Cd may act as a micronutrient, usually in relation to low Zn concentrations [4]. We observed an interesting correlation between the two TMs in the NA when the datasets were split into concentration ratios Zn/Cd > 343 and Zn/Cd < 343 (Figure 6). A lower Zn/Cd ratio was observed in the periods with higher Chl a concentrations, indicating the uptake of bioavailable Zn. However, due to significantly higher Zn concentrations at station 107 throughout the sampling period, the Zn/Cd ratio was often higher than 343. We compared our results with GEOTRACES Zn and Cd data measured down to 50 m depth [83,84,85,86,87], from the Atlantic, Pacific, Southern Ocean and Mediterranean (GEOTRACES cruises GA02, GA03, GA04, GIPY02, GIPY06, GP02, GP13, GP16, GPpr02), and we observed the same bi-linear relationship between Zn and Cd (Figure 6). Given the different biogeochemical processes in the aforementioned seas, it is difficult to envision the factors driving the observed Zn/Cd relationships, and further studies are needed. Bi-linear relationships have been observed for Zn/PO43− and Cd/PO43− in the world’s oceans, often explained by the mixing of different water masses in which uptake and remineralization ratios are different [84]. However, we did not observe such relationships in our study, and can only suggest that in our method and similar systems, the Zn/Cd < 343 can be used as a rough indication of Zn consumed by phytoplankton bloom/s.
Lead has a high affinity for particulate matter, especially Fe and Mn oxyhydroxides [36,88]. This is reflected in the contribution of dissolved Pb to the total Pb concentration, which was the lowest compared to other TMs; 55% at station 107 and 45% at station 108. Dissolved Pb readily forms complexes with dissolved OM [89], indicated in our study by the statistically significant correlation with DOC at both stations and with SAS at station 107 (Table 1). According to Loaec et al. [90], Pb, as well as Zn and Cd, show affinity to bacterial exopolysaccharides, which could explain the correlation between the three TMs and SAS at station 107, presumably originating from bacterial activities.
Similarly to Pb, Cu also exhibits a significant affinity for particulate matter such as for Fe/Mn oxides [88,91]. Different oceanographic conditions, as well as different types of OM, are reflected in the contribution of dissolved Cu to total Cu (68% at station 108 and 71% at station 107) and the OM–dissolved Cu interactions at the two stations. In the dissolved fraction, up to 99.6% of Cu readily forms a variety of complexes with OM [92], and the concentration and type of Cu-binding ligands depends on environmental conditions [93,94,95,96]. Due to the higher abundance of phytoplankton at station 108, the contribution of freshly produced OM to the OM pool is larger at this station compared to station 107. Freshly released phytoplankton OM contains many specific groups with high affinity for Cu [97], such as thio and amino groups [98]. Accordingly, statistically significant positive correlations between dissolved Cu and DOC, Cu and SAS (Figure 4 and Figure 5, Table 1), and a positive correlation between Cu and N-POM, although not statistically significant (Supplementary Figure S4), were found at station 108, while no such correlations were found at station 107, pointing to different types of OM at the two stations. The results indicate that in phytoplankton richer seas, more Cu would be complexed with DOM.
Cobalt and nickel are both important industrial materials, resulting in their release into the environment [99], and the observed positive statistically significant correlation observed at both stations could indicate their similar origins. Although they are important micronutrients for marine microorganisms, like many other TMs they can become toxic at higher concentrations, and their distribution and biogeochemical behavior in the aquatic environment should therefore be closely monitored [99]. Dissolved Co accounted for about 70% of the total Co at station 108 and 72% at station 107. Cobalt forms strong complexes with organic ligands, and in some surface waters over 99% of dissolved Co may be complexed [100]. The statistically significant positive correlations among Co, DOC and SAS (Figure 4 and Figure 5, Table 1), and N-POM (Supplementary Figure S4) at station 108 confirm Co affinity for DOM, probably with the freshly produced OM [101], as the same correlations were not statistically significant at station 107, characterized with lower primary production and therefore with less fresh OM. The statistically significant positive correlation between dissolved Co and PO43− at station 107 suggests a nutrient-like behavior of Co. At station 108, the correlation between dissolved Co and PO43− was also positive but not statistically significant. However, the temporal shift of the highest concentrations detected at station 108 from 0 and 5 m depths in March to 10 m depth in May suggests a release of Co in deeper water layers due to OM degradation. Further evidence that OM remineralization may also be a source of Co comes from the statistically positive correlation of Co and NH4+, regenerated by the activity of bacteria and protozoans on OM [102].
Dissolved Ni contributed 85% to total Ni concentrations at both stations and showed a lower affinity to OM at both stations, with no correlations found between Ni and any of the analyzed OM classes. Only 30–50% of Ni is thought to form organic complexes in seawater [103,104]. Nevertheless, Ni distribution at both stations is indicative of its known role as a micronutrient. At station 108 and 107, statistically significant positive correlations were observed between dissolved Ni and Chl a, pH and dissolved O2, as well as with NO3 and NO2 at 108, and with PO43− and NO2 at 107 (Table 1). In addition to its involvement in organic nitrogen assimilation, as part of the metalloenzyme urease [105,106], diatoms, the most abundant phytoplankton group in the NA [45], were hypothesized to have a minimal basal requirement for Ni, regardless of N source [107].

4. Conclusions

The physico-chemical parameters showed that the shallow area of the NA is characterized by high temperature and salinity variations throughout the year. The Po River waters in the western part of the NA are an important source of nutrients and trace metals, especially in spring/summer, when, during the stratification period, fresh waters could spread towards the eastern NA. The observed nutrient limitations indicate increasing oligotrophication of the surface waters of the NA. Increased production of DOM was observed during the warmer period, possibly due to increased bacterial activity or environmental stress. Organic matter of different characteristics prevail in the meso- to eutrophic (western, station 108) and the oligotrophic (eastern, station 107) part of the NA, which is reflected in the distribution of TM; the higher proportion of freshly produced DOM at the meso- to eutrophic part is responsible for Zn, Pb, Cu and Co complexation, while DOM at the oligotrophic part complexed Zn, Pb and Cu. SAS determined at the meso- to eutrophic part are particularly involved in complexing Cu and Co. Different SAS from the oligotrophic part are responsible for Zn, Cd and Pb complexation. Freshly produced protein-like OM, expressed by N-POM, is important for complexation of Cd, Cu, Ni and Co. The impact of maritime traffic and potentially slower TM removal by sedimentation processes due to lower phytoplankton abundance resulted in increased dissolved concentrations of Zn in the oligotrophic environment. Several instances of significantly high concentrations of dissolved Zn point to a potential hazard to marine microorganisms, possibly due to Zn leaching from ship antifouling paints, indicating the need for closer monitoring of Zn concentrations. The observed bi-linear correlation between dissolved Zn and Cd (Zn/Cd < 343 and Zn/Cd > 343) may indicate a link in the stoichiometry of their uptake by the microbial community, raising questions about the underlying mechanisms.
Increasing oligotrophication, decreasing OM content, and reduced primary production will certainly affect the biogeochemistry of TMs in this shallow coastal area. Our dataset is just beginning to unravel the complex TM biogeochemical relationships, highlighting the importance of continued monitoring of inorganic and organic compounds in this and similar areas to understand the factors affecting TMs in coastal waters, especially in light of future climate change scenarios.

Supplementary Materials

The following are available online at https://www.mdpi.com/article/10.3390/w14030349/s1, Figure S1: Monthly rain precipitation in the northern Adriatic; Figure S2: Surface-active organic substances (SAS) (equiv. T-X-100, mg L−1) vs. dissolved organic carbon (DOC). Station 108 (■, □), station 107 (). Open squares represent high SAS vs. DOC detected at station 108. Lines represent SAS-DOC correlations for the selected model substances: humic acid, protein albumin, and high molecular acidic polysaccharide xanthan; Figure S3: Nitrogen-containing polymeric organic material (N-POM) vs. chlorophyll a, O2, pH, and surface-active organic substances (SAS) for station 108 and N-POM vs. SAS for station 107; Figure S4: Nitrogen-containing polymeric organic material (N-POM) vs. cadmium, copper, nickel and cobalt for station 108; Figure S5: Examples of marine traffic in the northern Adriatic, (a) in the period from June to September 2019. The map was provided by the Republic of Croatia, Ministry of the sea, transport and infrastructure, Navigation Safety Administration. (b) Traffic on date 27 May 2020 https://www.marinetraffic.com/en/ais/home/centerx:15.3/centery:44.4/zoom:7 (accessed on 27 May 2020); Figure S6: Dissolved Zn vs. precipitation at the surface of eastern station 107; Table S1: Physico-chemical parameters at station 108 and 107 in the northern Adriatic; Table S2: (a) Daily precipitation (mm) at the Pontelagoscuro Station (44.88° N, 11.60° E). Data obtained from “Annali Idrologici” published by Hydrographic and Mareographic National Service of Italy (SIMN) and by the Regional Environmental Protection Agency of Emilia Romagna (ARPA; http://www.arpa.emr.it/ (accessed on 15 October 2019)). (b) Daily precipitation (mm) at Rovinj Station (45.10° N, 13.63° E). Data obtained from Croatian Meteorological and hydrological service (www.meteo.hr (accessed on 20 May 2020)); Table S3: Nutrient concentrations at stations 108 and 107 in the northern Adriatic; Table S4: Chlorophyll a at stations 108 and 107 in the northern Adriatic; Table S5: Organic matter concentrations at stations 108 and 107 in the northern Adriatic: DOC, SAS, N-POM; Table S6: Concentrations of dissolved and total trace metals at station 108 at the western side of the northern Adriatic; Table S7: Concentrations of dissolved and total TM at station 107 at the eastern side of the northern Adriatic.

Author Contributions

Conceptualization and visualization: B.G., M.M. and A.P.; validation: S.S. and V.C.; formal analysis: S.S., V.C. and T.D.; resources: B.G. and M.M.; writing—original draft preparation: A.P. and B.G.; writing—review and editing: A.P., B.G., V.C., S.S., T.D. and M.M.; supervision: M.M. and V.C.; funding acquisition: B.G. and M.M. All authors have read and agreed to the published version of the manuscript.

Funding

This work was funded by the grant from the Croatian Science Foundation under the project IP-11-2013-8607.

Institutional Review Board Statement

Not applicable.

Informed Consent Statement

Not applicable.

Data Availability Statement

The raw data presented in this study are available in the Supplementary Information.

Acknowledgments

The authors would like to acknowledge Dario Omanović for his kind assistance in measuring trace metal concentrations in some of the samples, and also thank Zdeslav Zovko for DOC analysis. The authors would like to thank the crew of R/V Vila Velebita, and all the other CMR-RBI colleagues who contributed to sampling and measuring physico-chemical and biological parameters.

Conflicts of Interest

The authors declare no conflict of interest. The funders had no role in the design of the study; in the collection, analyses, or interpretation of data; in the writing of the manuscript, or in the decision to publish the results.

References

  1. Sunda, W.G. Feedback interactions between trace metal nutrients and phytoplankton in the ocean. Front. Microbiol. 2012, 3, 204. [Google Scholar] [CrossRef] [PubMed] [Green Version]
  2. Richir, J. Trace Elements in Marine Environments: Occurrence, Threats and Monitoring with Special Focus on the Coastal Mediterranean. J. Environ. Anal. Toxicol. 2016, 6, 1000349. [Google Scholar] [CrossRef] [Green Version]
  3. Wolter, K.; Rabsch, U.; Krischker, P.; Davies, A. Influence of low concentrations of cadmium, copper and zinc on phytoplankton of natural water samples. Mar. Ecol. Prog. Ser. 1984, 19, 167–173. [Google Scholar] [CrossRef]
  4. Lee, J.G.; Morel, F.M.M. Replacement of zinc by cadmium in marine phytoplankton. Mar. Ecol. Prog. Ser. 1995, 127, 305–309. [Google Scholar] [CrossRef]
  5. Mason, R.P. Trace Metals in Aquatic Systems; Wiley-Blackwell: West Sussex, UK, 2013; ISBN 9781405160483. [Google Scholar]
  6. Morel, F.M.M.; Miligan, A.J.; Saito, M.A. Marine Bioinorganic Chemistry: The Role of Trace Metals in the Oceanic Cycles of Major Nutrients. In The Oceans and Marine Geochemistry; Elderfield, H., Ed.; Elsevier: Amsterdam, The Netherlands, 2003; Volume 6, pp. 113–143. [Google Scholar]
  7. Ure, A.M.; Davidson, C.M. Introduction. In Chemical Speciation in the Environment, 2nd ed.; Wiley-Blackwell: West Sussex, UK, 2007. [Google Scholar]
  8. Balzano, S.; Sardo, A.; Blasio, M.; Chahine, T.B.; Dell’Anno, F.; Sansone, C.; Brunet, C. Microalgal Metallothioneins and Phytochelatins and Their Potential Use in Bioremediation. Front. Microbiol. 2020, 11, 517. [Google Scholar] [CrossRef]
  9. Moore, C.M.; Mills, M.M.; Arrigo, K.R.; Berman-Frank, I.; Bopp, L.; Boyd, P.W.; Galbraith, E.D.; Geider, R.J.; Guieu, C.; Jaccard, S.L.; et al. Processes and patterns of oceanic nutrient limitation. Nat. Geosci. 2013, 6, 701–710. [Google Scholar] [CrossRef] [Green Version]
  10. Semeniuk, D.M.; Bundy, R.M.; Payne, C.D.; Barbeau, K.A.; Maldonado, M.T. Acquisition of organically complexed copper by marine phytoplankton and bacteria in the northeast subarctic Pacific Ocean. Mar. Chem. 2015, 173, 222–233. [Google Scholar] [CrossRef]
  11. Zoppini, A.; Pettine, M.; Totti, C.; Puddu, A.; Artegiani, A.; Pagnotta, R. Nutrients, standing crop and primary production in western coastal waters of the adriatic sea. Estuar. Coast. Shelf Sci. 1995, 41, 493–513. [Google Scholar] [CrossRef]
  12. Vezzoli, R.; Mercogliano, P.; Pecora, S.; Zollo, A.L.; Cacciamani, C. Hydrological simulation of po river (North Italy) discharge under climate change scenarios using the RCM COSMO-CLM. Sci. Total Environ. 2015, 521–522, 346–358. [Google Scholar] [CrossRef]
  13. Rossini, P.; Guerzoni, S.; Molinaroli, E.; Rampazzo, G.; De Lazzari, A.; Zancanaro, A. Atmospheric bulk deposition to the lagoon of Venice: Part, I. Fluxes of metals, nutrients and organic contaminants. Environ. Int. 2005, 31, 959–974. [Google Scholar] [CrossRef] [Green Version]
  14. Djakovac, T.; Degobbis, D.; Supić, N.; Precali, R. Marked reduction of eutrophication pressure in the northeastern Adriatic in the period 2000–2009. Estuar. Coast. Shelf Sci. 2012, 115, 25–32. [Google Scholar] [CrossRef]
  15. Novak, T.; Godrijan, J.; Pfannkuchen, D.M.; Djakovac, T.; Medić, N.; Ivančić, I.; Mlakar, M.; Gašparović, B. Global warming and oligotrophication lead to increased lipid production in marine phytoplankton. Sci. Total Environ. 2019, 668, 171–183. [Google Scholar] [CrossRef] [PubMed]
  16. Grilli, F.; Accoroni, S.; Acri, F.; Aubry, F.B.; Bergami, C.; Cabrini, M.; Campanelli, A.; Giani, M.; Guicciardi, S.; Marini, M.; et al. Seasonal and interannual trends of oceanographic parameters over 40 years in the northern Adriatic Sea in relation to nutrient loadings using the EMODnet chemistry data portal. Water 2020, 12, 2280. [Google Scholar] [CrossRef]
  17. Gašparović, B.; Djakovac, T.; Tepić, N.; Degobbis, D. Relationships between surface-active organic substances, chlorophyll a and nutrients in the northern Adriatic Sea. Cont. Shelf Res. 2011, 31, 1149–1160. [Google Scholar] [CrossRef]
  18. Dautović, J.; Vojvodić, V.; Tepić, N.; Ćosović, B.; Ciglenečki, I. Dissolved organic carbon as potential indicator of global change: A long-term investigation in the northern Adriatic. Sci. Total Environ. 2017, 587–588, 185–195. [Google Scholar] [CrossRef]
  19. Reisenhofer, E.; Adami, G.; Favretto, A. Heavy metals and nutrients in coastal surface seawaters (Gulf of Trieste, Northern Adriatic Sea): An environmental study by factor analysis. Fresenius J. Anal. Chem. 1996, 354, 729–734. [Google Scholar] [CrossRef]
  20. Martinčič, D.; Kwokal, Ž.; Stoeppler, M.; Branica, M. Trace metals in sediments from the adriatic sea. Sci. Total Environ. 1989, 84, 135–147. [Google Scholar] [CrossRef]
  21. Martinčić, D.; Kwokal, Ž.; Branica, M. Distribution of zinc, lead, cadmium and copper between different size fractions of sediments I. The Limski Kanal (North Adriatic Sea). Sci. Total Environ. 1990, 95, 201–215. [Google Scholar] [CrossRef]
  22. Sfriso, A.A.; Chiesa, S.; Sfriso, A.; Buosi, A.; Gobbo, L.; Boscolo Gnolo, A.; Argese, E. Spatial distribution, bioaccumulation profiles and risk for consumption of edible bivalves: A comparison among razor clam, Manila clam and cockles in the Venice Lagoon. Sci. Total Environ. 2018, 643, 579–591. [Google Scholar] [CrossRef]
  23. Zago, C.; Capodaglio, G.; Barbante, C.; Giani, M.; Moret, I.; Scarponi, G.; Cescon, P. Heavy metal distribution and speciation in the northern Adriatic Sea. Chem. Ecol. 2002, 18, 39–51. [Google Scholar] [CrossRef]
  24. Zago, C.; Capodaglio, G.; Ceradini, S.; Ciceri, G.; Abelmoschi, L.; Soggia, F.; Cescon, P.; Scarponi, G. Benthic fluxes of cadmium, lead, copper and nitrogen species in the northern Adriatic Sea in front of the River Po outflow, Italy. Sci. Total Environ. 2000, 246, 121–137. [Google Scholar] [CrossRef]
  25. Pavoni, E.; Crosera, M.; Petranich, E.; Adami, G.; Faganeli, J.; Covelli, S. Partitioning and mixing behaviour of trace elements at the Isonzo/Soča River mouth (Gulf of Trieste, northern Adriatic Sea). Mar. Chem. 2020, 223, 103800. [Google Scholar] [CrossRef]
  26. Illuminati, S.; Annibaldi, A.; Truzzi, C.; Tercier-Waeber, M.L.; Nöel, S.; Braungardt, C.B.; Achterberg, E.P.; Howell, K.A.; Turner, D.; Marini, M.; et al. In-situ trace metal (Cd, Pb, Cu) speciation along the Po River plume (northern Adriatic Sea) using submersible systems. Mar. Chem. 2019, 212, 47–63. [Google Scholar] [CrossRef]
  27. Tankéré, S.P.C.; Price, N.B.; Statham, P.J. Mass balance of trace metals in the Adriatic Sea. J. Mar. Syst. 2000, 25, 269–286. [Google Scholar] [CrossRef]
  28. Gašparović, B.; Godrijan, J.; Frka, S.; Tomažić, I.; Penezić, A.; Marić, D.; Djakovac, T.; Ivančić, I.; Paliaga, P.; Lyons, D.; et al. Adaptation of marine plankton to environmental stress by glycolipid accumulation. Mar. Environ. Res. 2013, 92, 120–132. [Google Scholar] [CrossRef]
  29. Parsons, T.R.; Maita, Y.; Lalli, C.M. A Manual of Chemical and Biological Methods for Seawater Analysis; Pergamon Press: Toronto, ON, Canada, 1984. [Google Scholar]
  30. Ivančić, I.; Degobbis, D. Mechanisms of production and fate of organic phosphorus in the northern Adriatic Sea. Mar. Biol. 1987, 94, 117–125. [Google Scholar] [CrossRef]
  31. Ivančić, I.; Degobbis, D. An optimal manual procedure for ammonia analysis in natural waters by the indophenol blue method. Water Res. 1984, 18, 1143–1147. [Google Scholar] [CrossRef]
  32. Wang, J. Analytical Electrochemistry, 2nd ed.; John Wiley & Sons: New York, USA, 2000; ISBN 0471282723. [Google Scholar]
  33. Plavšić, M.; Strmečki, S. Carbohydrate polymers as constituents of exopolymer substances in seawater, their complexing properties towards copper ions, surface and catalytic activity determined by electrochemical methods. Carbohydr. Polym. 2016, 135, 48–56. [Google Scholar] [CrossRef]
  34. Strmečki, S.; Dautović, J.; Plavšić, M. Constant current chronopotentiometric stripping characterisation of organic matter in seawater from the northern Adriatic, Croatia. Environ. Chem. 2014, 11, 158–166. [Google Scholar] [CrossRef]
  35. Strmečki, S.; Pereža, L. Electrochemistry of chitosan amino-glycan and BSA protein mixture under seawater conditions. J. Electroanal. Chem. 2021, 898, 115630. [Google Scholar] [CrossRef]
  36. Cuculić, V.; Cukrov, N.; Kwokal, Ž.; Mlakar, M. Natural and anthropogenic sources of Hg, Cd, Pb, Cu and Zn in seawater and sediment of Mljet National Park, Croatia. Estuar. Coast. Shelf Sci. 2009, 81, 311–320. [Google Scholar] [CrossRef]
  37. Cindrić, A.M.; Garnier, C.; Oursel, B.; Pižeta, I.; Omanović, D. Evidencing the natural and anthropogenic processes controlling trace metals dynamic in a highly stratified estuary: The Krka River estuary (Adriatic, Croatia). Mar. Pollut. Bull. 2015, 94, 199–216. [Google Scholar] [CrossRef] [PubMed] [Green Version]
  38. Cozzi, S.; Ibáñez, C.; Lazar, L.; Raimbault, P.; Giani, M. Flow regime and nutrient-loading trends from the largest South European watersheds: Implications for the productivity of mediterranean and Black Sea’s Coastal Areas. Water 2018, 11, 1. [Google Scholar] [CrossRef] [Green Version]
  39. Cardin, V.; Ursella, L. Hydrological Characteristics and Dynamics of the Northern Adriatic during Late Summer and Autumn 1997. In Mediterranean Ecosystems: Structures and Processes; Faranda, F.M., Guglielmo, L., Spezie, G., Eds.; Springer: Milan, Italy, 2001; pp. 25–35. [Google Scholar]
  40. Franco, P. Osservazioni sull’oceanografia fisica e chimica dell’Adriatico. In Atti del Convegno-Lo stato di salute dell’Adriatico. Problemi e Prospettive; Sogesta: Urbino, Italy, 1989; pp. 21–29. [Google Scholar]
  41. Degobbis, D.; Gilmartin, M. Nitrogen, phosphorus, and biogenic silicon budgets for the northern Adriatic Sea. Oceanol. Acta 1990, 13, 31–45. [Google Scholar]
  42. Poulain, P.-M.; Kourafalou, V.H.; Cushman-Roisin, B. Northern Adriatic Sea. In Physical Oceanography of the Adriatic Sea: Past, Present and Future; Cushman-Roisin, B., Gačić, M., Poulain, P.-M., Artegiani, A., Eds.; Springer Science+Business Media: Dordrecht, The Netherlands, 2001; pp. 143–165. [Google Scholar]
  43. Supić, N.; Orlić, M.; Degobbis, D. Istrian Coastal Countercurrent and its year-to-year variability. Estuar. Coast. Shelf Sci. 2000, 51, 385–397. [Google Scholar] [CrossRef]
  44. Supić, N.; Degobbis, D.; Dakovac, T.; Krajcar, V.; Precali, R.; Orlić, M. Occurrence of the Istrian Coastal Countercurrent in 2000, a year with a mucilage event. Geofizika 2001, 18–19, 45–57. [Google Scholar]
  45. Marić, D.; Kraus, R.; Godrijan, J.; Supić, N.; Djakovac, T.; Precali, R. Phytoplankton response to climatic and anthropogenic influences in the north-eastern Adriatic during the last four decades. Estuar. Coast. Shelf Sci. 2012, 115, 98–112. [Google Scholar] [CrossRef]
  46. Gašparović, B. Decreased production of surface-active organic substances as a consequence of the oligotrophication in the northern Adriatic Sea. Estuar. Coast. Shelf Sci. 2012, 115, 33–39. [Google Scholar] [CrossRef]
  47. Giani, M.; Djakovac, T.; Degobbis, D.; Cozzi, S.; Solidoro, C.; Umani, S.F. Recent changes in the marine ecosystems of the northern Adriatic Sea. Estuar. Coast. Shelf Sci. 2012, 115, 1–13. [Google Scholar] [CrossRef]
  48. Novak, T.; Godrijan, J.; Pfannkuchen, D.M.; Djakovac, T.; Mlakar, M.; Baricevic, A.; Tanković, M.S.; Gašparović, B. Enhanced dissolved lipid production as a response to the sea surface warming. J. Mar. Syst. 2018, 180, 289–298. [Google Scholar] [CrossRef]
  49. Cozzi, S.; Lipizer, M.; Cantoni, C.; Catalano, G. Nutrient balance in the ecosystem of the North Western Adriatic Sea. Chem. Ecol. 2002, 18, 1–12. [Google Scholar] [CrossRef]
  50. Degobbis, D.; Precali, R.; Ivancic, I.; Smodlaka, N.; Fuks, D.; Kveder, S. Long-term changes in the northern Adriatic ecosystem related to anthropogenic eutrophication. Int. J. Environ. Pollut. 2000, 13, 495–533. [Google Scholar] [CrossRef]
  51. Cozzi, S.; Giani, M. River water and nutrient discharges in the northern Adriatic Sea: Current importance and long term changes. Cont. Shelf Res. 2011, 31, 1881–1893. [Google Scholar] [CrossRef]
  52. Berman, T.; Béchemin, C.; Maestrini, S.Y. Release of ammonium and urea from dissolved organic nitrogen in aquatic ecosystems. Aquat. Microb. Ecol. 1999, 16, 295–302. [Google Scholar] [CrossRef] [Green Version]
  53. Ivančić, I.; Pfannkuchen, M.; Godrijan, J.; Djakovac, T.; Marić Pfannkuchen, D.; Korlević, M.; Gašparović, B.; Najdek, M. Alkaline phosphatase activity related to phosphorus stress of microphytoplankton in different trophic conditions. Prog. Oceanogr. 2016, 146, 175–186. [Google Scholar] [CrossRef] [Green Version]
  54. Celussi, M.; Del Negro, P. Microbial degradation at a shallow coastal site: Long-term spectra and rates of exoenzymatic activities in the NE Adriatic Sea. Estuar. Coast. Shelf Sci. 2012, 115, 75–86. [Google Scholar] [CrossRef]
  55. Pettine, M.; Camusso, M.; Martinotti, W.; Marchetti, R.; Passino, R.; Queirazza, G. Soluble and particulate metals in the Po River: Factors affecting concentrations and partitioning. Sci. Total Environ. 1994, 145, 243–265. [Google Scholar] [CrossRef]
  56. Tankere, S.P.C.; Statham, P.J. Distribution of dissolved Cd, Cu, Ni and Zn in the Adriatic Sea. Mar. Pollut. Bull. 1996, 32, 623–630. [Google Scholar] [CrossRef]
  57. Cuculić, V.; Cukrov, N.; Kwokal, Ž.; Strmečki, S.; Plavšić, M. Assessing trace metal contamination and organic matter in the brackish lakes as the major source of potable water. Environ. Geochem. Health 2018, 40, 489–503. [Google Scholar] [CrossRef]
  58. Oursel, B.; Garnier, C.; Durrieu, G.; Mounier, S.; Omanović, D.; Lucas, Y. Dynamics and fates of trace metals chronically input in a Mediterranean coastal zone impacted by a large urban area. Mar. Pollut. Bull. 2013, 69, 137–149. [Google Scholar] [CrossRef]
  59. Yoon, Y.Y.; Martin, J.M.; Cotté, M.H. Dissolved trace metals in the Western Mediterranean Sea: Total concentration and fraction isolated by C18 Sep-Pak technique. Mar. Chem. 1999, 66, 129–148. [Google Scholar] [CrossRef]
  60. Chifflet, S.; Tedetti, M.; Zouch, H.; Fourati, R.; Zaghden, H.; Elleuch, B.; Quéméneur, M.; Karray, F.; Sayadi, S. Dynamics of trace metals in a shallow coastal ecosystem: Insights from the Gulf of Gabès (southern Mediterranean Sea). AIMS Environ. Sci. 2019, 6, 277–297. [Google Scholar] [CrossRef]
  61. Plavšić, M.; Ćosović, B. Influence of surface-active substances on the redox processes of metal ions: A contribution to the speciation analysis of metals in aquatic systems. Anal. Chim. Acta 1994, 284, 539–545. [Google Scholar] [CrossRef]
  62. Carr, N.; Davis, C.E.; Blackbird, S.; Daniels, L.R.; Preece, C.; Woodward, M.; Mahaffey, C. Seasonal and spatial variability in the optical characteristics of DOM in a temperate shelf sea. Prog. Oceanogr. 2018, 177, 101929. [Google Scholar] [CrossRef]
  63. Jiao, N.; Robinson, C.; Azam, F.; Thomas, H.; Baltar, F.; Dang, H.; Hardman-Mountford, N.J.; Johnson, M.; Kirchman, D.L.; Koch, B.P.; et al. Mechanisms of microbial carbon sequestration in the ocean–future research directions. Biogeosciences 2014, 11, 5285–5306. [Google Scholar] [CrossRef] [Green Version]
  64. Tepić, N.; Gašparović, B.; Ahel, M. Multivariate statistical analysis of the distribution patterns of carbohydrates and surface-active substances in the northern Adriatic Sea. Mar. Chem. 2009, 114, 37–46. [Google Scholar] [CrossRef]
  65. Gašparović, B.; Plavšić, M.; Ćosović, B.; Saliot, A. Organic matter characterization in the sea surface microlayers in the subarctic Norwegian fjords region. Mar. Chem. 2007, 105, 1–14. [Google Scholar] [CrossRef] [Green Version]
  66. Gašparović, B.; Vojvodić, V.; Ćosović, B. Excretion of Organic Matter during an Experimental Phytoplankton Bloom Followed Using o-Nitrophenol as an Electrochemical Probe. Croat. Chem. Acta 1998, 71, 271–284. [Google Scholar]
  67. Sunda, W.G. Trace metal interactions with marine phytoplankton. Biol. Oceanogr. 1988, 6, 411–442. [Google Scholar]
  68. Bruland, K.W. Complexation of zinc by natural organic ligands in the central North Pacific. Limnol. Oceanogr. 1989, 34, 269–285. [Google Scholar] [CrossRef] [Green Version]
  69. Domingos, R.F.; Gélabert, A.; Carreira, S.; Cordeiro, A.; Sivry, Y.; Benedetti, M.F. Metals in the Aquatic Environment—Interactions and Implications for the Speciation and Bioavailability: A Critical Overview. Aquat. Geochem. 2015, 21, 231–257. [Google Scholar] [CrossRef]
  70. Williams, P.M. Organic Compounds in Aquatic Environments; Faust, S.D., Hunter, J.V., Eds.; Dekker: New York, NY, USA, 1971; Chapter 7. [Google Scholar]
  71. Wada, S.; Suzuki, S. Inhibitory effect of zinc on the remineralisation of dissolved organic matter in the coastal environment. Aquat. Microb. Ecol. 2011, 63, 47–59. [Google Scholar] [CrossRef]
  72. Zhang, T.; Fiamingo, M.; Allen, H.C. Trace Metal Enrichment Driven by Phosphate Functional Group Binding Selectivity. J. Geophys. Res. Ocean. 2018, 123, 5286–5297. [Google Scholar] [CrossRef]
  73. Ingri, J.; Widerlund, A.; Suteerasak, T.; Bauer, S.; Elming, S.Å. Changes in trace metal sedimentation during freshening of a coastal basin. Mar. Chem. 2014, 167, 2–12. [Google Scholar] [CrossRef]
  74. Soon, Z.Y.; Jung, J.H.; Jang, M.; Kang, J.H.; Jang, M.C.; Lee, J.S.; Kim, M. Zinc Pyrithione (ZnPT) as an Antifouling Biocide in the Marine Environment—A Literature Review of Its Toxicity, Environmental Fates, and Analytical Methods. Water. Air. Soil Pollut. 2019, 230, 310. [Google Scholar] [CrossRef]
  75. Ytreberg, E.; Karlsson, J.; Eklund, B. Comparison of toxicity and release rates of Cu and Zn from anti-fouling paints leached in natural and artificial brackish seawater. Sci. Total Environ. 2010, 408, 2459–2466. [Google Scholar] [CrossRef]
  76. Miller, R.J.; Adeleye, A.S.; Page, H.M.; Kui, L.; Lenihan, H.S.; Keller, A.A. Nano and traditional copper and zinc antifouling coatings: Metal release and impact on marine sessile invertebrate communities. J. Nanopart. Res. 2020, 22, 129. [Google Scholar] [CrossRef]
  77. Contini, D.; Belosi, F.; Gambaro, A.; Cesari, D.; Stortini, A.M.; Bove, M.C. Comparison of PM10 concentrations and metal content in three different sites of the Venice Lagoon: An analysis of possible aerosol sources. J. Environ. Sci. 2012, 24, 1954–1965. [Google Scholar] [CrossRef] [Green Version]
  78. Rossini, P.; Guerzoni, S.; Rampazzo, G.; Quarantatto, G.; Garibbo, E.; Molinaroli, E. Atmospheric Deposition of Trace Metals in North Adriatic Sea. In Mediterranean Ecosystems; Faranda, F.M., Guglielmo, L., Spezie, G., Eds.; Springer: Milan, Italy, 2001; pp. 123–129. [Google Scholar]
  79. Heimbürger, L.E.; Migon, C.; Cossa, D. Impact of atmospheric deposition of anthropogenic and natural trace metals on Northwestern Mediterranean surface waters: A box model assessment. Environ. Pollut. 2011, 159, 1629–1634. [Google Scholar] [CrossRef] [Green Version]
  80. Bruland, K.W. Complexation of cadmium by natural organic ligands in the central North Pacific. Limnol. Oceanogr. 1992, 37, 1008–1017. [Google Scholar] [CrossRef]
  81. Horner, T.J.; Lee, R.B.Y.; Henderson, G.M.; Rickaby, R.E.M. Nonspecific uptake and homeostasis drive the oceanic cadmium cycle. Proc. Natl. Acad. Sci. USA 2013, 110, 2500–2505. [Google Scholar] [CrossRef] [PubMed] [Green Version]
  82. Morel, F.M.M. The oceanic cadmium cycle: Biological mistake or utilization? Proc. Natl. Acad. Sci. USA 2013, 110, 2013. [Google Scholar] [CrossRef] [PubMed] [Green Version]
  83. Schlitzer, R.; Anderson, R.F.; Masferrer Dodas, E.; Lohan, M.; Geibert, W.; Tagliabue, A.; Bowie, A.; Jeandel, C.; Maldonado, M.T.; Landing, W.M.; et al. The GEOTRACES Intermediate Data Product 2017. Chem. Geol. 2018, 493, 210–223. [Google Scholar] [CrossRef]
  84. Middag, R.; van Heuven, S.M.A.C.; Bruland, K.W.; de Baar, H.J.W. The relationship between cadmium and phosphate in the Atlantic Ocean unravelled. Earth Planet. Sci. Lett. 2018, 492, 79–88. [Google Scholar] [CrossRef] [Green Version]
  85. Vance, D.; Little, S.H.; Archer, C.; Cameron, V.; Andersen, M.B.; Rijkenberg, M.J.A.; Lyons, T.W. The oceanic budgets of nickel and zinc isotopes: The importance of sulfidic environments as illustrated by the Black Sea. Philos. Trans. Royal Soc. A 2016, 374, 20150294. [Google Scholar] [CrossRef]
  86. Hassler, C.S.; Ridgway, K.R.; Bowie, A.R.; Butler, E.C.V.; Clementson, L.A.; Doblin, M.A.; Davies, D.M.; Law, C.; Ralph, P.J.; van der Merwe, P.; et al. Primary productivity induced by iron and nitrogen in the Tasman Sea: An overview of the PINTS expedition. Mar. Freshw. Res. 2014, 65, 517–537. [Google Scholar] [CrossRef] [Green Version]
  87. Xie, R.C.; Galer, S.J.G.; Abouchami, W.; Rijkenberg, M.J.A.; de Baar, H.J.W.; De Jong, J.; Andreae, M.O. Non-Rayleigh control of upper-ocean Cd isotope fractionation in the western South Atlantic. Earth Planet. Sci. Lett. 2017, 471, 94–103. [Google Scholar] [CrossRef]
  88. Farkas, A.; Erratico, C.; Viganò, L. Assessment of the environmental significance of heavy metal pollution in surficial sediments of the River Po. Chemosphere 2007, 68, 761–768. [Google Scholar] [CrossRef]
  89. Sánchez-Marín, P.; Lorenzo, J.I.; Blust, R.; Beiras, R. Humic acids increase dissolved lead bioavailability for marine invertebrates. Environ. Sci. Technol. 2007, 41, 5679–5684. [Google Scholar] [CrossRef]
  90. Loaëc, M.; Olier, R.; Guezennec, J. Chelating properties of bacterial exopolysaccharides from deep-sea hydrothermal vents. Carbohydr. Polym. 1998, 35, 65–70. [Google Scholar] [CrossRef]
  91. Croot, P.L.; Hunter, K.A. Trace metal distributions across the continental shelf near Otago Peninsula, New Zealand. Mar. Chem. 1998, 62, 185–201. [Google Scholar] [CrossRef]
  92. Whitby, H.; Posacka, A.M.; Maldonado, M.T.; van den Berg, C.M.G. Copper-binding ligands in the NE Pacific. Mar. Chem. 2018, 204, 36–48. [Google Scholar] [CrossRef]
  93. Moffett, J.W.; Brand, L.E. Production of strong, extracellular Cu chelators by marine cyanobacteria in response to Cu stress. Limnol. Oceanogr. 1996, 41, 388–395. [Google Scholar] [CrossRef]
  94. Sunda, W.G.; Hanson, P.J. Chemical speciation of copper in river water—Effects of total copper, pH, carbonate, and dissolved organic matter. In Chemical Modeling in Aqueous Systems; Jenne, E.A., Ed.; American Chemical Society: Washington, DC, USA, 1979; pp. 147–180. [Google Scholar]
  95. Kozarac, Z.; Plavŝić, M.; Ćosović, B.; Viliĉić, D. Interaction of cadmium and copper with surface-active organic matter and complexing ligands released by marine phytoplankton. Mar. Chem. 1989, 26, 313–330. [Google Scholar] [CrossRef]
  96. Plavšić, M.; Kwokal, Ž.; Strmečki, S.; Peharec, Ž.; Omanović, D.; Branica, M. Determination of the copper complexing ligands in the Krka River estuary. Fresenius Environ. Bull. 2009, 18, 327–334. [Google Scholar]
  97. Plavšić, M.; Gašparović, B.; Strmečki, S.; Vojvodić, V.; Tepić, N. Copper complexing ligands and organic matter characteriza-tion in the northern Adriatic Sea. Estuar. Coast. Shelf Sci. 2009, 85, 299–306. [Google Scholar] [CrossRef]
  98. Strmečki, S.A.; Plavšić, M.; Steigenberger, S.; Passow, U. Characterization of phytoplankton exudates and carbohydrates in relation to their complexation of copper, cadmium and iron. Mar. Ecol. Prog. Ser. 2010, 408, 33–46. [Google Scholar] [CrossRef] [Green Version]
  99. Gikas, P. Single and combined effects of nickel (Ni(II)) and cobalt (Co(II)) ions on activated sludge and on other aerobic micro-organisms: A review. J. Hazard. Mater. 2008, 159, 187–203. [Google Scholar] [CrossRef]
  100. Bown, J.; Boye, M.; Nelson, D.M. New insights on the role of organic speciation in the biogeochemical cycle of dissolved cobalt in the southeastern Atlantic and the Southern Ocean. Biogeosciences 2012, 9, 2719–2736. [Google Scholar] [CrossRef] [Green Version]
  101. Bačinić, A.; Tumir, L.M.; Mlakar, M. Electrochemical characterization of Cobalt(II)-Complexes involved in marine biogeochemical processes. I. Co(II)-4-nitrocatechol and Co(II)-Humate. Electrochim. Acta 2020, 337, 135797. [Google Scholar] [CrossRef]
  102. Fuks, D.; Ivančić, I.; Najdek, M.; Lučić, D.; Njire, J.; Godrijan, J.; Marić, D.; Šilović, T.; Paliaga, P.; Blažina, M.; et al. Changes in the planktonic community structure related to trophic conditions: The case study of the northern Adriatic Sea. J. Mar. Syst. 2012, 96–97, 95–102. [Google Scholar] [CrossRef] [Green Version]
  103. Nimmo, M.; van den Berg, C.M.G.; Brown, J. The chemical speciation of dissolved nickel, copper, vanadium and iron in Liv-erpool Bay, Irish Sea. Estuar. Coast. Shelf Sci. 1989, 29, 57–74. [Google Scholar] [CrossRef]
  104. de Carvalho, L.M.; Hollister, A.P.; Trindade, C.; Gledhill, M.; Koschinsky, A. Distribution and size fractionation of nickel and cobalt species along the Amazon estuary and mixing plume. Mar. Chem. 2021, 236, 104019. [Google Scholar] [CrossRef]
  105. Rees, T.A.V.; Bekheet, I.A. The role of nickel in urea assimilation by algae. Planta 1982, 156, 385–387. [Google Scholar] [CrossRef] [PubMed]
  106. Price, N.M.; Morel, F.M.M. Colimitation of phytoplankton growth by nickel and nitrogen. Limnol. Oceanogr. 1991, 36, 1071–1077. [Google Scholar] [CrossRef]
  107. Allen, A.E.; Dupont, C.L.; Oborník, M.; Horák, A.; Nunes-Nesi, A.; McCrow, J.P.; Zheng, H.; Johnson, D.A.; Hu, H.; Fernie, A.R.; et al. Evolution and metabolic significance of the urea cycle in photosynthetic diatoms. Nature 2011, 473, 203–207. [Google Scholar] [CrossRef] [PubMed]
Figure 1. Sampling sites in the northern Adriatic, stations 108 (44°45′24″ N, 12°45′0″ E) and 107 (45°2′52″ N, 13°19′0″ E). Map made by using QGIS (QGIS 2021, Open Source Geospatial Foundation Project. http://qgis.org, accessed on 10 February 2020).
Water 14 00349 g001
Figure 2. Physico-chemical parameters during the studied period: (a,b) seawater temperature, (c,d) salinity, (e,f) Chl a, (g,h) dissolved O2 concentration, (i,j) pH, at 0 (red line), 5 (blue line) and 10 m (black line) depths, at the northern Adriatic west station 108 (a,c,e,g,i) and east station 107 (b,d,f,h,j). (k) The daily averages data of the Po River discharge (Q).
Water 14 00349 g002
Figure 3. Nutrient distribution during the studied period. (a,b) Nitrates, (c,d) nitrites, (e,f) ammonia, (g,h) orthosilicates, (i,j) orthophosphates, and (k,l) organic phosphorus at depths: 0 m (squares), 5 m (circles) and 10 m (triangles) at the northern Adriatic western station 108, (a,c,e,g,i,k) and eastern station 107 (b,d,f,h,j,l).
Water 14 00349 g003
Figure 4. Concentration distribution of dissolved Zn, Cu, Cd, Pb, Ni and Co at station 108 and 107 throughout the sampling period at 0, 5 and 10 m depths.
Water 14 00349 g004
Figure 5. Distribution of surface-active organic substances (SAS) and dissolved organic carbon (DOC) concentrations at stations 108 and 107 throughout the sampling period at 0, 5 and 10 m depths.
Water 14 00349 g005
Figure 6. (a) Bi-linear relationships between Zn and Cd. Zn/Cd < 343 (open symbols) and Cd > 343 (full symbols) for station 108 (squares) and station 107 (triangles), and (b) data for the depths down to 50 m from GEOTRACES campaigns (Atlantic, Pacific, Southern Ocean and Mediterranean cruises GA02, GA03, GA04, GIPY02, GIPY06, GP02, GP13, GP16, GPpr02),) [83,84,85,86,87], Zn/Cd < 343 (open circles), Zn/Cd > 343 (full circles).
Water 14 00349 g006
Table 1. Spearman’s rank correlation coefficients (confidence interval 95%) for dissolved trace metal and environmental parameters of the western station 108 and eastern station 107. Abbreviations are explained in the Method section. Significant positive values are bolded, and significant negative values bolded and italicized.
108CdPbCuNiCoTSpHO2PO43−NO3NO2NH4+SiO44−Chl aDOCPOCSAS
Zn0.1820.4330.408−0.3110.2180.632−0.5890.147−0.2410.331−0.611−0.6900.205−0.556−0.4880.7340.2040.189
Cd 0.3910.5930.5810.4540.037−0.5170.3840.2040.4400.2070.0140.082−0.2790.1880.3950.5200.228
Pb 0.5040.2100.2810.200−0.3600.4020.1860.765−0.174−0.260−0.012−0.389−0.2700.4450.2320.363
Cu 0.4300.7320.208−0.6620.4330.2500.338−0.156−0.2630.376−0.5820.1460.6600.7310.531
Ni 0.519−0.535−0.2590.5780.6960.3980.6470.5260.3300.0290.6260.0780.6730.375
Co 0.119−0.6470.4500.3610.392−0.163−0.2870.503−0.6630.1950.6400.7560.546
T −0.471−0.330−0.7370.125−0.687−0.813−0.101−0.308−0.4670.615−0.0460.238
S −0.564−0.068−0.4440.2810.443−0.4570.591−0.011−0.900−0.694−0.503
pH 0.7460.6340.1670.1770.360−0.3670.2630.4080.6910.324
O2 0.4050.4200.4900.459−0.1070.482−0.0630.4870.116
PO43− 0.102−0.174−0.209−0.3050.2860.3980.5380.582
NO3 0.848−0.1210.5510.782−0.5170.1170.091
NO2 −0.1440.6340.649−0.6770.039−0.149
NH4+ −0.3650.1500.3970.4220.036
SiO44− 0.314−0.668−0.416−0.197
Chl a −0.2190.4370.343
DOC 0.6090.550
POC 0.660
107CdPbCuNiCoTSpHO2PO43−NO3NO2NH4+SiO44−Chl aDOCPOCSAS
Zn0.4710.4430.103−0.031−0.0490.009−0.141−0.1710.059−0.025−0.157−0.0910.434−0.150−0.3670.4650.2140.401
Cd 0.6290.5580.5070.423−0.063−0.3320.1170.1610.241−0.2280.0330.0970.101−0.2030.3490.1880.534
Pb 0.3640.170−0.0770.187−0.199−0.2790.024−0.018−0.524−0.2980.321−0.376−0.4640.4440.1650.437
Cu 0.5910.353−0.127−0.0250.1630.0670.2740.1100.119−0.1610.1380.0410.0970.0540.161
Ni 0.644−0.6180.2210.6420.6100.3900.3640.513−0.5560.3380.528−0.2540.1650.046
Co −0.277−0.1980.3590.2960.4090.0880.260−0.1710.2740.2170.0410.1900.367
T −0.679−0.863−0.937−0.066−0.572−0.7270.645−0.460−0.7190.685−0.0190.338
S 0.6360.548−0.5870.4480.536−0.5560.1530.551−0.791−0.306−0.626
pH 0.7770.1030.6340.777−0.7040.5170.833−0.7180.038−0.365
O2 0.1560.4240.675−0.5760.4260.607−0.5620.111−0.220
PO43− 0.2530.090−0.2300.1450.5050.4070.4000.291
NO3 0.688−0.5550.5740.791−0.5610.045−0.385
NO2 −0.6740.7750.680−0.708−0.297−0.320
NH4+ −0.550−0.7410.7330.1960.605
SiO44− 0.432−0.464−0.336−0.221
Chl a −0.6770.194−0.428
DOC 0.4010.635
POC 0.259
Table 2. Historical changes in relative frequency (%) of phosphorus (P), nitrogen (N) and silicon (Si) limitations in the northern Adriatic surface waters.
Frequency of Nutrient Limitation (%)
2008–2010
n = 51
2016–2017
n = 24
2016–2017
n = 27
Western NA
(101)
Eastern NA
(107)
Western NA
(108)
Eastern NA
(107)
[28]; 0–10 m DepthThis Study
P limitation
PO43− < 0.1 µmol L−1
881008885
N limitation TIN
(NO3 + NO2 + NH4+) < 1 µmol L−1
24334667
Si limitation 1
SiO44− < 2 µmol L−1
2714915052
1 Djakovac personal data.
Table 3. Dissolved trace metal (TM) concentrations from this study compared to other studies in the Mediterranean coastal areas.
SiteDissolved TM Concentrations (nM)Reference
ZnCdPbCuNiCo
N Adriatic/Station 1085–1160.04–0.180.05–0.633–174–110.19–1.22This study
N Adriatic/Station 1076–2240.03–0.160.05–1.253–174–190.14–0.66This study
N Adriatic/Po River101 ± 1380.98 ± 1.071.3 ± 132 ± 835 ± 190.7 ± 0.4[55]
N Adriatic/Po plume 0.12 ± 0.040.34 ± 0.25 ± 2 [26]
N Adriatic40.08 79 [56]
Mid Adriatic/Šibenik Bay7–1010.05–0.210.05–1.116–695–110.26–0.51[37]
Mid Adriatic/Zlarin40.070.05370.36[37]
S Adriatic5–100.06–0.070.05–0.142–35–90.22–0.65[57]
S Adriatic1–30.06–0.070.10–0.143–4 [36]
S Adriatic30.08 35 [56]
N Mediterranean/S France14–310.05–0.080.14–0.382–46–100.22–0.99[58]
W Mediterranean30.080.1423 [59]
Sicilian Strait160.060.1423 [59]
S Mediterranean/Sfax
(Tunisia)
190–6900.14–2.210.53–2.609–2114–10290.88–4.75[60]
Publisher’s Note: MDPI stays neutral with regard to jurisdictional claims in published maps and institutional affiliations.

