Article

Linking Stoichiometric Organic Carbon–Nitrogen Relationships to planktonic Cyanobacteria and Subsurface Methane Maximum in Deep Freshwater Lakes

1
Integrated Graduate School of Medicine, Engineering, and Agricultural Sciences, University of Yamanashi, 4-4-37 Takeda, Kofu 400-8510, Japan
2
Faculty of Life and Environmental Sciences, University of Yamanashi, 4-4-37 Takeda, Kofu 400-8510, Japan
3
Institute of Low Temperature Science, Hokkaido University, Kita-19, Nishi-8, Kita-ku, Sapporo 060-0819, Japan
4
Sugadaira Research Station, Mountain Science Center, University of Tsukuba, 1278-294 Sugadaira-kogen, Ueda 386-2204, Japan
5
National Institute for Environmental Studies, 16-2 Onogawa, Tsukuba 305-8506, Japan
6
Department of Marine Biology and Sciences, Tokai University, 1-1 1-Chome 5-Jo Minami-sawa, Minami-ku, Sapporo 005-8601, Japan
*
Authors to whom correspondence should be addressed.
Water 2020, 12(2), 402; https://doi.org/10.3390/w12020402
Submission received: 29 November 2019 / Revised: 28 January 2020 / Accepted: 31 January 2020 / Published: 2 February 2020
(This article belongs to the Special Issue Advancing Knowledge on Cyanobacterial Blooms in Freshwaters)

Abstract

:
Our understanding of the source of methane (CH4) in freshwater ecosystems is being revised because CH4 production in oxic water columns, a hitherto inconceivable process of methanogenesis, has been discovered for lake ecosystems. The present study surveyed nine Japanese deep freshwater lakes to show the pattern and mechanisms of such aerobic CH4 production and subsurface methane maximum (SMM) formation. The field survey observed the development of SMM around the metalimnion in all the study lakes. Generalized linear model (GLM) analyses showed a strong negative nonlinear relationship between dissolved organic carbon (DOC) and dissolved inorganic nitrogen (DIN), as well as a similar curvilinear relationship between DIN and dissolved CH4, suggesting that the availability of organic carbon controls N accumulation in lake waters thereby influences the CH4 production process. The microbial community analyses revealed that the distribution of picocyanobacteria (i.e., Synechococcus), which produce CH4 in oxic conditions, was closely related to the vertical distribution of dissolved CH4 and SMM formation. Moreover, a cross-lake comparison showed that lakes with a more abundant Synechococcus population exhibited a greater development of the SMM, suggesting that these microorganisms are the most likely cause of methane production. Thus, we conclude that the stoichiometric balance between DOC and DIN might cause the cascading responses of biogeochemical processes, from N depletion to picocyanobacterial domination, and subsequently influence SMM formation in lake ecosystems.

Graphical Abstract

1. Introduction

In recent decades, considerable efforts have been made to elucidate the source of methane (CH4) emissions, because the atmospheric concentration of this greenhouse gas has been increasing [1,2,3]. Among the natural sources of CH4 emissions, freshwater lakes have recently been recognized as an important contributor, accounting for 6–16% of total natural CH4 emissions [4,5]. Traditionally, CH4 production in lakes was believed to occur via anaerobic methanogenesis in oxygen-depleted environments [6,7]. However, recent studies have identified the occurrence of the subsurface methane maximum (SMM) in the oxygenated water columns of many deep freshwater lakes [8,9,10,11,12,13,14,15], as well as in marine ecosystems (known as the methane paradox) [16,17,18]. As subsurface CH4 in upper water column layers is closer to the atmosphere than sedimentary CH4, the formation of the SMM may have a significant impact on CH4 emissions from freshwater lakes [19].
It has been proposed that SMM might develop as a result of the tributary inflow, and the transport and diffusion of CH4 from hypolimnetic and littoral sediments [4,9,20,21,22]. Moreover, anaerobic methanogenesis by archaea present in anoxic microenvironments within algal cell aggregates, zooplankton guts or other particles was also proposed as a possible solution of the methane paradox [10,23]. However, recent studies have added empirical evidence that SMM formation is likely via phosphonate metabolism by planktonic bacteria that carry C-P lyase genes [12,13,15,16,24,25] or via unknown photosynthesis-related processes [26]. For example, planktonic autotrophic and heterotrophic bacteria (e.g., Trichodesmium, Pseudomonas, SAR11, Synechococcus) can utilize phosphonate compounds when they are P-starved and produce CH4 aerobically as a byproduct of phosphonate decomposition. Other methylated compounds, such as dimethylsulfoniopropionate (DMSP), trimethylamine (TMA), and methionine (Met), can also serve as a possible precursor of aerobic CH4 production by planktonic bacteria and microalgae [17,19,27]. However, most of these studies focused only on specific microbes linked with CH4 production in oxic water columns. Moreover, few studies have clarified the relationship among biogeochemical processes, microbial communities, and aerobic CH4 production in lakes.
Our previous studies have shown that SMM starts to develop in early summer in association with the development of stratification, and that it peaks in midsummer around the metalimnion in a deep oligotrophic lake [15]. Then, the SMM disappears in the winter season. It is hypothesized that the seasonal predominance of cyanobacterial populations, such as Synechococcus, during the thermal stratification period may be responsible for the development of SMM through organophosphonate metabolism [15]. However, the hypothesis has never been tested in other lake ecosystems. Although a few studies have examined the role of the microbial community in lake SMM formation [12,13,14,15], knowledge of the relationship between the vertical profile of dissolved CH4 concentrations and microbial communities is also lacking. If planktonic cyanobacteria are responsible for SMM formation, then biogeochemical processes other than CH4 production in metalimnetic waters may also be affected through their metabolic activities, such as primary productivity, nutrient uptake, and the extracellular release of DOC [28,29]. Furthermore, the biogeochemical processes that control SMM development have remained unidentified, even though the degree of the SMM development varies greatly among lakes [15].
The objective of the present study was to clarify the pattern and mechanisms of SMM formation in the aerobic environments of lake ecosystems. We surveyed nine deep freshwater lakes in Japan to determine the pattern of CH4 supersaturation in the metalimnion and to identify the environmental variables that affect such SMM formation. Moreover, we performed microbial community analyses of bacterioplankton and algae to identify the microbes responsible for aerobic CH4 production across the lakes. Finally, we analyzed lake physicochemical environments linked with both the microbial community and SMM formation to expand our knowledge of aerobic CH4 production and emission from oxic layers in deep freshwater lakes.

2. Materials and Methods

2.1. Study Area and Field Survey

The field survey was conducted in nine freshwater lakes of Japan (Figure S1, Tables S1 and S2) during the summer stratification period (from July to September) in 2016–2017. The study lakes are located in temperate and cool-temperate regions (35°11’ N–42°36’ N latitudes) and are mainly classified as caldera lakes, dammed lakes, or tectonic lakes (Table S1). The study lakes are deep stratified lakes, with maximum depths (31–363 m) deeper than the depth of 1% of the irradiance at the surface (i.e., a surrogate for the compensation depth) during the study period. The lake trophy was classified as mesotrophic, oligotrophic, or ultraoligotrophic conditions according to chlorophyll a and TP concentrations (Table S2, [30]). Most of the lakes are monomictic or dimictic and rarely freeze over; except Lake Hibara, where the surface water generally freezes during the December–March period. The watersheds of the study lakes are mostly covered with deciduous and coniferous forests (range = 67–99%). Agricultural lands such as rice paddies and farmlands occupy 20% and 11% of the watershed areas of Lake Toya and Lake Nojiri, respectively. Grassland vegetation accounts for 11% of the watershed area of Lake Hibara, while in Lake Ashinoko, residential areas (9%) contribute to the land cover to some extent.
At the deepest point of each study lake, we established a sampling site and measured the vertical profiles of environmental variables such as water temperature (°C), dissolved oxygen (DO) concentration (DO, mgO2/L) and saturation (%), pH, and photosynthetically active radiation (PAR, µmol m−2 s−1) by using a multi-parameter sonde (YSI ProDSS, YSI-Nanotech, Tokyo, Japan), a DO meter (HQ40d, Hach, Loveland, CO, USA), a pH meter (Orion3-Star, Thermo Scientific, Chelmsford, MA, USA), and a submersible spherical quantum sensor (LI-193, LI-COR, Inc., Lincoln, NE, USA), respectively. For each sampling site, lake water samples were collected at 10 depths, from the surface to hypolimnetic waters, by using a 6 L Van Dorn sampler. For determination of the dissolved CH4 concentration, the collected lake water was siphoned into two 30 mL glass vials and sealed with a butyl rubber stopper and an aluminum crimp. Then, 0.2 mL of saturated HgCl2 was added to each vial as a preservative and stored in a dark place at room temperature until analysis. For water quality analyses, the collected lake water was filtered with a 100 μm nylon mesh to remove large particles (e.g., zooplankton), and the filtrates were stored in polypropylene bottles for total nitrogen (TN) and total phosphorus (TP) analyses. The remaining filtrate water was further filtered through pre-combusted GF/F glass fiber filters (Whatman plc., Maidstone, Kent, UK) for dissolved nutrient (i.e., SRP, NH4, NO2, and NO3) and dissolved organic carbon (DOC) analyses; the former samples were stored in polypropylene bottles, while the latter samples were preserved in pre-combusted amber glass bottles. All of the water samples for nutrient and DOC analyses were kept at −20 °C until analyzed. For analyzing dissolved manganese (Mn) concentrations, the 100 μm mesh-filtered lake waters were further filtered with cellulose acetate disposable filters (pore size 0.45 µm), and nitric acid (final concentration = 0.1 M HNO3) was added to prevent the precipitation and adsorption of metals. Then, the acidified water samples were stored in a refrigerator.
For determination of the vertical profile of phytoplankton biomass and planktonic microbe density, we also collected lake waters from the 10 sampling depths and performed chlorophyll a (Chl a) measurements and CARD-FISH (catalyzed reporter deposition fluorescence in situ hybridization) analyses. We collected phytoplankton pigment samples by filtering 50−500 mL of lake water with GF/F glass fiber filters, and then stored the samples at −20 °C until analysis. For the CARD-FISH analyses, an aliquot of lake water samples was fixed in a 0.2 µm-filtered paraformaldehyde solution (final concentration = 1%, v/v) and stored at 4 °C for <24 h. To analyze the community structure of planktonic eukaryotic algae and prokaryotic bacteria, we collected additional lake water samples from each epilimnion (0 m depth), metalimnion (7−15 m depth), and hypolimnion (26−60 m depth). The samples for the enumeration of eukaryotic algae were fixed with a Lugol solution (final concentrations, 0.2%−0.4%) and stored in the dark at room temperature, while the samples for bacterial community structure were collected on 0.22 µm filters (Sterivex filter cartridges, Millipore, Billerica, MA, USA) and stored at −20 °C until analysis.
To identify the presence of phosphonic compounds in microbial cells, a two-dimensional NMR (1H–31P heteronuclear multiple bond correlation, 1H–31P HMBC) analysis was performed for the suspended particles in lake water samples according to the previous study [31]. A large amount of lake water (68−201 L) was collected from the metalimnion of each lake with the Van Dorn sampler and filtered with a 100 μm nylon mesh to remove large particles. Then, the suspended particulate matter was collected onboard by filtering the collected lake water through a 2 μm cartridge filter (MCP-HX-C10S, Advantec, Inc., Tokyo, Japan) by using a peristaltic pump (Masterflex, L/S VFP002, Cole-Parmer, Vernon Hills, IL, USA). The filter samples were stored at −20 °C until analysis.
We also surveyed all of the major tributary streams identifiable on topographical maps for each study lake (Table S3), except for two inaccessible tributaries (Yanagisawa Stream of Lake Chuzenji and Okotanpe Stream of Lake Shikotsu). Near the downstream end of each tributary inflow, we collected river water samples to analyze the same environmental variables (water temperature, DO, pH, dissolved CH4, nutrients, DOC, and Mn) as those in the lake survey. In addition, the discharge (m3/s) of tributary streams was measured by the midsection method using a portable current meter (CR-7WP; Cosumo Riken, Inc., Kashiwara, Japan).

2.2. Chemical Analyses

Dissolved CH4 concentrations of the collected lake waters were quantified by the headspace equilibration method using a gas chromatograph with an FID detector (GC-FID, GC-8A, Shimadzu Corp., Kyoto, Japan). The headspace phase created by 3 mL of high-purity He gas (>99.9999%) in the vial was equilibrated with the aqueous phase. The pCH4 in the equilibrated headspace was then analyzed by GC-FID. The dissolved CH4 concentration (nmol/L) in the water samples were determined from the amounts of gasses in both the equilibrated headspace and the aqueous phase; the latter was calculated by using pCH4 in the headspace and Henry’s law constant.
The DOC concentration of lake water samples was measured using a total organic carbon analyzer (TOC-L CPN, Shimadzu Corp., Kyoto, Japan). The ammonium concentration (NH4, µM) was quantified spectrophotometrically using the indophenol method [32]. Nitrate (NO3) and nitrite (NO2) concentrations were determined through the second-derivative UV spectrophotometric method [33] and Bendschneider and Robinson’s method [34], respectively. Dissolved inorganic nitrogen (DIN) concentrations were determined as the sum of NH4, NO2, and NO3. The total nitrogen (TN) concentration of the lake water samples was determined by the alkaline persulfate digestion method, followed by the absorbance measurement (at 220 nm) for the resultant nitrate by UV spectrophotometry. Soluble reactive phosphorus (SRP) concentrations were measured spectrophotometrically using the molybdenum blue method. Likewise, the dissolved total phosphorus (DTP) and total phosphorus (TP) concentrations were quantified using the molybdenum blue method after persulfate digestion for the GF/F-filtered lake waters and unfiltered lake waters, respectively. For the phosphomolybdic acid measurements for SRP, DTP, and TP analyses, we increased the sulfuric acid concentration by a factor of two to minimize the effect of silicate interference [35]. The dissolved organic phosphorus (DOP) concentration was determined as the difference between DTP and SRP concentrations. Dissolved Mn concentrations were analyzed using inductively coupled plasma optical emission spectroscopy (SPS 3520 UV-DD, Hitachi High-Tech Science Corp., Tokyo, Japan).

2.3. Analyses for Phytoplankton Biomass and Community Structure

The Chl a sample pigments collected on GF/F glass fiber filters were extracted with N, N-dimethylformamide (6-mL) in the dark for 24 h. The Chl a content in lake water (µg-chl a/L) was then measured by the Welschmeyer method using a fluorometer (Trilogy, Turner Designs, San Jose, CA, USA). To identify the community structure of eukaryotic algae, we identified phytoplankton species to the lowest taxonomic level and enumerated the cell numbers of each algal species for the epilimnion, metalimnion and hypolimnion of each study lake by microscopic enumeration. We also enumerated red autofluorescent algal cells on the CARD-FISH filter (see below) under blue excitation (470 nm, Filter 09, Carl Zeiss Microscopy GmbH, Jena, Germany) to estimate algal cell density (cells/mL).

2.4. Analyses for Planktonic Bacterial Density and Community Structure

To analyze the distribution of specific microbes related to SMM formation, the CARD-FISH analysis was performed for the water samples collected from each sampling depth. The aliquot of lake water samples fixed with paraformaldehyde solution was filtered through a white polycarbonate membrane filter (type GTTP, pore size 0.2 μm, Millipore, Billerica, MA, USA) and a brown polycarbonate membrane filter (type GTBP, pore size 0.2 μm, Millipore, Billerica, MA, USA) for the enumeration of CARD-FISH- and DAPI-stained bacterial cells, respectively. We applied the oligonucleotide probes (labeled with horseradish peroxidese) specific for eubacteria (EUB338), type I MOB (Mg84 + Mg705), Synechococcus (405_Syn) and archaea (ARCH915) for the filters at 46 °C for > 8h for hybridization (Table S4) because these microbial groups have been reported to influence the dissolved methane profile in lakes [15,36,37,38]. FITC-labeled tyramide solution and DAPI solution were then applied to the filter sections for the enumeration of cells on a fluorescence microscope (Zeiss Axio Lab.A1, Carl Zeiss Microscopy GmbH, Jena, Germany) under blue excitation (470 nm, Filter 10) and UV excitation (365 nm, Filter 01), respectively. We also enumerated the autofluorescent cyanobacterial cells under green excitation (545 nm, Filter 43) to estimate the density of cyanobacteria. At least 1000 cells were counted to estimate the cell density of the target bacteria (cells/mL).
To analyze the community structure of planktonic bacteria, 16S rRNA gene amplicon sequencing was performed for the filter samples collected at the epilimnion, metalimnion and hypolimnion of each lake. From the Sterivex filter samples, DNA was extracted using the PowerWater Sterivex DNA Isolation Kit (Qiagen, Hilden, Germany). From the DNA samples, sequencing libraries were prepared according to the Illumina 16S Metagenomic Sequencing Library Preparation protocol and then subjected to Illumina MiSeq sequencing. The resulting reads were processed with QIIME, an open-source bioinformatics platform for microbial community analysis [39], as follows. Quality-filtered sequences were clustered using the UCLUST algorithm with an identity threshold of 97%, to generate operational taxonomic units (OTUs). The representative sequences of the OTUs were subjected to chimera-checking to eliminate chimeric OTUs. The representatives were then used for taxonomic assignment of the OTUs via the Greengenes database, version 13_8. Greengenes annonation includes eukaryotic organelles (i.e., chloroplasts and mitochondria) as a taxonomic group in bacterial phyla. As we focused on bacterioplankton communities in the 16S rRNA gene analyses, we removed the chloroplast and mitochondria reads from the amplicon library for data analyses. The nucleotide sequences of the 16S rRNA gene obtained in the present study are available in the NCBI/SRA with the accession number of PRJNA599317.

2.5. 1H–31P NMR Analyses for Suspended Particles

For NMR analysis, we extracted the organic phosphorus fraction from the suspended particles collected on the 2 μm cartridge filter [31]. We separated the pleated filter paper from the polypropylene filter cartridge by using a cutter and tweezers. The separated filter papers were then placed into a Teflon vial with 50 mL Milli-Q water, and the vials were subsequently immersed for approximately 1 h in a water bath set at 60 °C for the extraction [40]. The extracts were then filtered through a GF/F glass fiber filter followed by membrane filter filtration (PVDF: nominal pore size 0.45 μm, Millex, Millipore, Billerica, MA, USA). The filtrates were frozen (−20 °C) and lyophilized to concentrate the extracts for NMR analysis. Just before the NMR analyses, the lyophilized extracts were re-dissolved in 0.9 mL of EDTA solution (20 mmol L−1) with D2O (0.1 mL, Fujifilm Wako Pure Chemical Corp., Osaka, Japan) and shaken at room temperature for 10 minutes. The solution was then filtered through a membrane filter (nominal pore size: 0.45 μm, Millex, Millipore, Billerica, MA, USA) and transferred into a 5 mm NMR tube. The 1H31P NMR spectrum of the extracts was recorded at 500.2MHz (for 1H) and 202.5 MHz (for 31P) via a JNM-ECA 500 spectrometer (JEOL Ltd., Tokyo, Japan), equipped with a 5 mm auto-tune probe. These spectra were externally referenced to 4,4-dimethyl-4-silapentane-1-sulfonic acid (DSS) and D3PO4 (δ = 0 ppm), respectively. The datasets of 1H–31P HMBC spectra were acquired with 2048 and 256 data points and sweep widths of 9384 and 20,259 Hz for the x and y dimensions, respectively. The obtained spectra were processed with a 2 Hz line broadening using Delta, version 5.

2.6. Data Analyses

A generalized linear model (GLM) was developed to identify environmental variables that affect the dissolved CH4 concentrations in the study lakes. We included physical (depth, water temperature, and percentage of surface irradiance), chemical (DIN, SRP, DOC, DOP, and TN/TP), and biological (Chl a) variables as the explanatory variables. Two variables (i.e., SRP and Chl a) were transformed as log10 (x + 1) because the data were not normally distributed by visual examination. A GLM analysis with a gamma error distribution and an inverse link function was used to analyze the factors that influenced the response variable (dissolved CH4). We built candidate models containing all possible combinations of the nine explanatory variables (29 − 1 = 511 models) and selected the best model based on the AIC value. The relative importance of an explanatory variable was evaluated by the sum of Akaike weights (w) over all models, including that variable [41]. To identify the indirect causal relationships of the environmental variables with SMM formation, we also constructed GLMs for the environmental variables that most strongly affected the dissolved CH4 concentrations. When we constructed the GLM for DOP values, we transformed the response variable as DOP + 1 because the gamma regression analysis did not allow for the inclusion of variables with negative or zero values. The GLM analyses and model-selection procedures were performed using the MuMIn package, version 1.40.0 [42] and the MASS package, version 7.3-48 [43] of the statistical R software 3.3.3 (R Development Core Team 2017).
For the community analyses of planktonic bacteria, 16S rRNA gene sequence read counts were used to calculate the relative abundance of each OTU for eplimnetic, metalimnetic, and hypolimnetic bacterial communities, by assuming that the amplicon reads could be used as a surrogate for the abundance of each bacterial population (total number of amplicon reads = 8848–29,331 reads per sample). In this calculation, we removed the taxonomically unassigned OTUs from the analyses, as the percentage of their amplicon reads accounted only for <1.6% of the total reads. We also confirmed a significant positive correlation between the total number of bacterial read counts per unit of lake volume and the cell density of eubacteria obtained from the CARD-FISH analyses (EUB338, r = 0.50, p = 0.015). Finally, the taxonomic composition data were combined into the phylum level for the analyses. Non-metric multidimensional scaling (NMDS) analysis was performed to identify the relationships between bacterioplankton community composition and the environmental variables of the epilimnion, metalimnion, and hypolimnion of each study lake. To obtain an NMDS ordination with a low stress value at <0.2 (an indication of well-represented data by a two-dimensional representation [44]), the phyla with a relative abundance of <0.4% of the total read counts when all of the samples were combined were grouped into a category as “Others”. For the environmental variables, the average values of 10 variables (i.e., depth, temperature, percentage of surface irradiance, CH4, Chl a, DIN, SRP, DOC, DOP, TN/TP) were determined for each of epilimnion, metalimnion and hypolimnion, and were then incorporated in the analyses. The NMDS analysis (based on the Bray–Curtis dissimilarity) was performed by using the vegan 2.4-5 package [45] of the R software 3.3.3.
Finally, we examined the relationship between the degree of SMM development and lake environmental variables to identify the factors controlling the oxic CH4 peak. According to our previous study [15], the SMM is herein defined as the layer of the local CH4 maximum that forms below the surface water. The degree of SMM development for each study lake was quantified by peak SMM, namely the maximum CH4 concentration in the SMM minus the atmospheric equilibrium CH4 concentration at that depth. The peak SMM for the study lakes was regressed against the environmental variables responsible for SMM formation.

3. Results

3.1. SMM Formation in Lakes

The vertical profiles of dissolved CH4 concentrations revealed that the SMM developed in aerobic layers in all of the nine study lakes (Figure 1). Further, peak SMM concentrations (range = 62.5–592.6 nM) showed the highest values in the vertical CH4 profiles for all of the study lakes. The SMM peak tended to occur within the metalimnion, or in depths adjacent to the metalimnion where DO saturation levels were high (range = 85–131%). In addition, the peak depth and vertical profile of dissolved CH4 (i.e., subsurface peak of CH4) were similar to those of DO saturation, except in Lake Nojiri.
Regarding the other environmental variables, water temperature and percentage of surface irradiance were highest at the lake surface and decreased with depth; this pattern did not correspond with the vertical profile of the dissolved CH4 concentration for any of the study lakes (Figures S2 and S3). Although the overall pattern of Chl a and DOP profiles did not match the CH4 profile, their peaks were located at depths similar to the CH4 peaks (Figures S4 and S5). In most of the study lakes, DIN concentrations tended to be higher in the hypolimniion and lower in both the epilimnion and metalimnion, the latter of which exhibited high CH4 concentrations (Figure S6). Although SRP did not show a clear overall trend, the peak depth and vertical profile of SRP were similar to those of CH4 in Lake Motosu, Lake Saiko, Lake Toya and Lake Shikotsu (Figure S7). Similarly, the vertical patterns of DOC were variable, but its concentrations tended to be higher in the metalimnion or nearby layers (except in Lake Nojiri), as observed in the CH4 profile (Figure S8). The observed values of lake TN/TP ratio (median = 151, range = 32–875) were high relative to the Redfield ratio (N:P = 16:1) for all of the study lakes (Figure S9). The vertical TN/TP profile tended to show a pattern opposite to that of the CH4 profile—except in Lake Shikotsu, where a close association was observed for both variables.
The cross-lake comparison showed that the development of SMM varied among the study lakes (Figure 1). The highest value of peak SMM was observed in Lake Saiko (an oligotrophic lake), while small CH4 peaks were observed in three ultraoligotrophic lakes (Lake Motosu, Lake Toya, and Lake Shikotsu).

3.2. Relationships between Dissolved CH4 and Physicochemical Variables

GLM analyses were performed to identify the physicochemical variables affecting the water-column CH4 concentrations in lakes. In the analyses, six environmental variables (i.e., depth, water temperature, percent of surface irradiance, DIN, DOP, and TN/TP ratio) were retained in the best model selected by AIC (Figure 2). The sum of Akaike weights (w) further identified that depth, DIN, DOP, and TN/TP ratio, were the most important variables explaining the variability of dissolved CH4 concentrations in the lakes (Table S5).
We observed a strong negative nonlinear relationship between DIN and dissolved CH4 concentrations when we combined the data from all nine study lakes (Figure 2 and Table S6). The CH4 concentration increased rapidly with a decrease in the DIN concentration. Similar curvilinear patterns were observed for depth and the TN/TP ratio; the lake waters with shallower depths and a lower TN/TP ratio increased the water-column CH4 concentrations. On the other hand, a positive effect of DOP on dissolved CH4 concentrations was observed for the study lakes.
To explore the potential factors controlling the chemical variables that strongly affect dissolved CH4, we further constructed GLMs for DIN, DOP, and TN/TP (Table S5). The results showed that DOC concentration was the best explanatory variable for all three influential variables (Figure 3 and Table S6). DOC exhibited negative nonlinear relationships with both DIN and the TN/TP ratio. In contrast, DOC showed a positive relationship with DOP concentrations.

3.3. Community Analyses of Planktonic Algae and Bacteria

Microscopic enumeration for eukaryotic algae identified six phytoplankton classes present in the study lakes (Table S7). Among these phytoplanktonic algal groups, Chlorophyceae or Bacillariophyceae predominated in the epilimnion of most of the study lakes except for Lake Toya, where Dinophyceae (53.6%) was the dominant group. Similarly, Chlorophyceae and/or Bacillariophyceae tended to predominate in the algal communities in the metalimnion, although Cryptophyceae and Dinophyceae were relatively abundant in the metalimnion of Lake Ashinoko. In the hypolimnion, Bacillariophyceae accounted for 54–97% of the relative abundance of algal communities, although Chlorophyceae was relatively abundant in the hypolimnion community of Lake Chuzenji (45.8%). There was no phytoplanktonic algal group that consistently exhibited a metalimnetic peak in terms of relative abundance for any of the study lakes.
The 16S rRNA gene amplicon sequencing analyses detected 6510 OTUs of bacteria (except unassigned OTUs), including 47 phyla, from the epilimnetic, metalimnetic, and hypolimnetic layers of all the study lakes. Actinobacteria, Verrucomicrobia, Proteobacteria, Cyanobacteria, Bacteroidetes and Armatimonadetes accounted for, respectively, 1.8–47.2%, 2.7–45.0%, 10.4–41.1%, 0.02–29.1%, 5.7–26.1%, and 0.1–5.8% of the total bacterial community in the epilimnion, metalimnion, and hypolimnion (Figure 4).
The NMDS analyses showed that the community composition of epilimnetic and metalimnetic microbes differed from that of the hypolimnetic community (Figure 4). The results revealed that the relative abundance of Proteobacteria, Verrucomicrobia, Actinobacteria, Bacteroidetes, and Cyanobacteria tended to be high in the epilimnion and metalimnion, whereas Planctomycetes, Acidobacteria, Chloroflexi, and Chlorobi were relatively abundant in the hypolimnion. We further observed the association of community structure and environmental variables. In epilimnetic and metalimnetic layers with high CH4 and DOP concentrations, Cyanobacteria, and Verrucomicrobia tended to be relatively abundant.
The results of epifluorescent microscopic analyses (CARD-FISH, DAPI, and autofluorescent enumeration) showed that both Cyanobacteria and Synechococcus cell density showed significant positive relationships with water-column dissolved CH4 concentrations (Figure 5). Synechococcus accounted for 21–96%, 64–96%, and 22–75% of the total cyanobacterial density in the epilimnion, metalimnion, and hypolimnion of the study lakes, respectively. In contrast to the patterns of Cyanobacteria and Synechococcus, phytoplankton biomass (Chl a), as well as the cell density of eubacteria (EUB338), type I MOB (Mg84 + Mg705), archaea (ARCH915), and algae, showed no significant relationships with dissolved CH4 concentrations.
We then analyzed the vertical profile of Synechococcus density in relation to the CH4 profiles, which showed that both profiles were closely associated with each other (Figure 6). In addition, a negative curvilinear pattern was found for the relationship of Synechococcus cell density with both depth and DIN concentration, as was observed in the patterns of dissolved CH4 concentrations (Figure S10). In contrast, a positive nonlinear relationship between Synechococcus cell density and DOP concentrations was found.

3.4. Relationship between Peak SMM and Environmental Variables

A correlation analysis between the peak SMM and environmental variables revealed that the peak SMM was positively and linearly correlated with lake DOC, DOP, and Synechococcus cell density observed at the same depth (Figure 7 and Table S6). Lakes with higher concentrations of both DOC and DOP and higher Synechococcus cell density tended to develop a larger SMM peak. Moreover, a negative nonlinear relationship of peak SMM was observed for both DIN concentration and the TN/TP ratio, implying that lakes with lower DIN and TN/TP values experienced a rapid increase in peak SMM.

3.5. Identification of Phosphonates in Suspended Particles

Particulate suspended matter collected from the metalimnion was characterized by a two-dimensional 1H31P NMR analysis. The spectral region of 20–31 ppm in 31P NMR analysis is known to represent the chemical shifts of phosphonate compounds [25,46]. Our mass spectra at 1.2 ppm (1H) and 25 ppm (31P) revealed the presence of phosphonate in the suspended particles of the metalimnion in Lake Toya (Figure 8).

4. Discussion

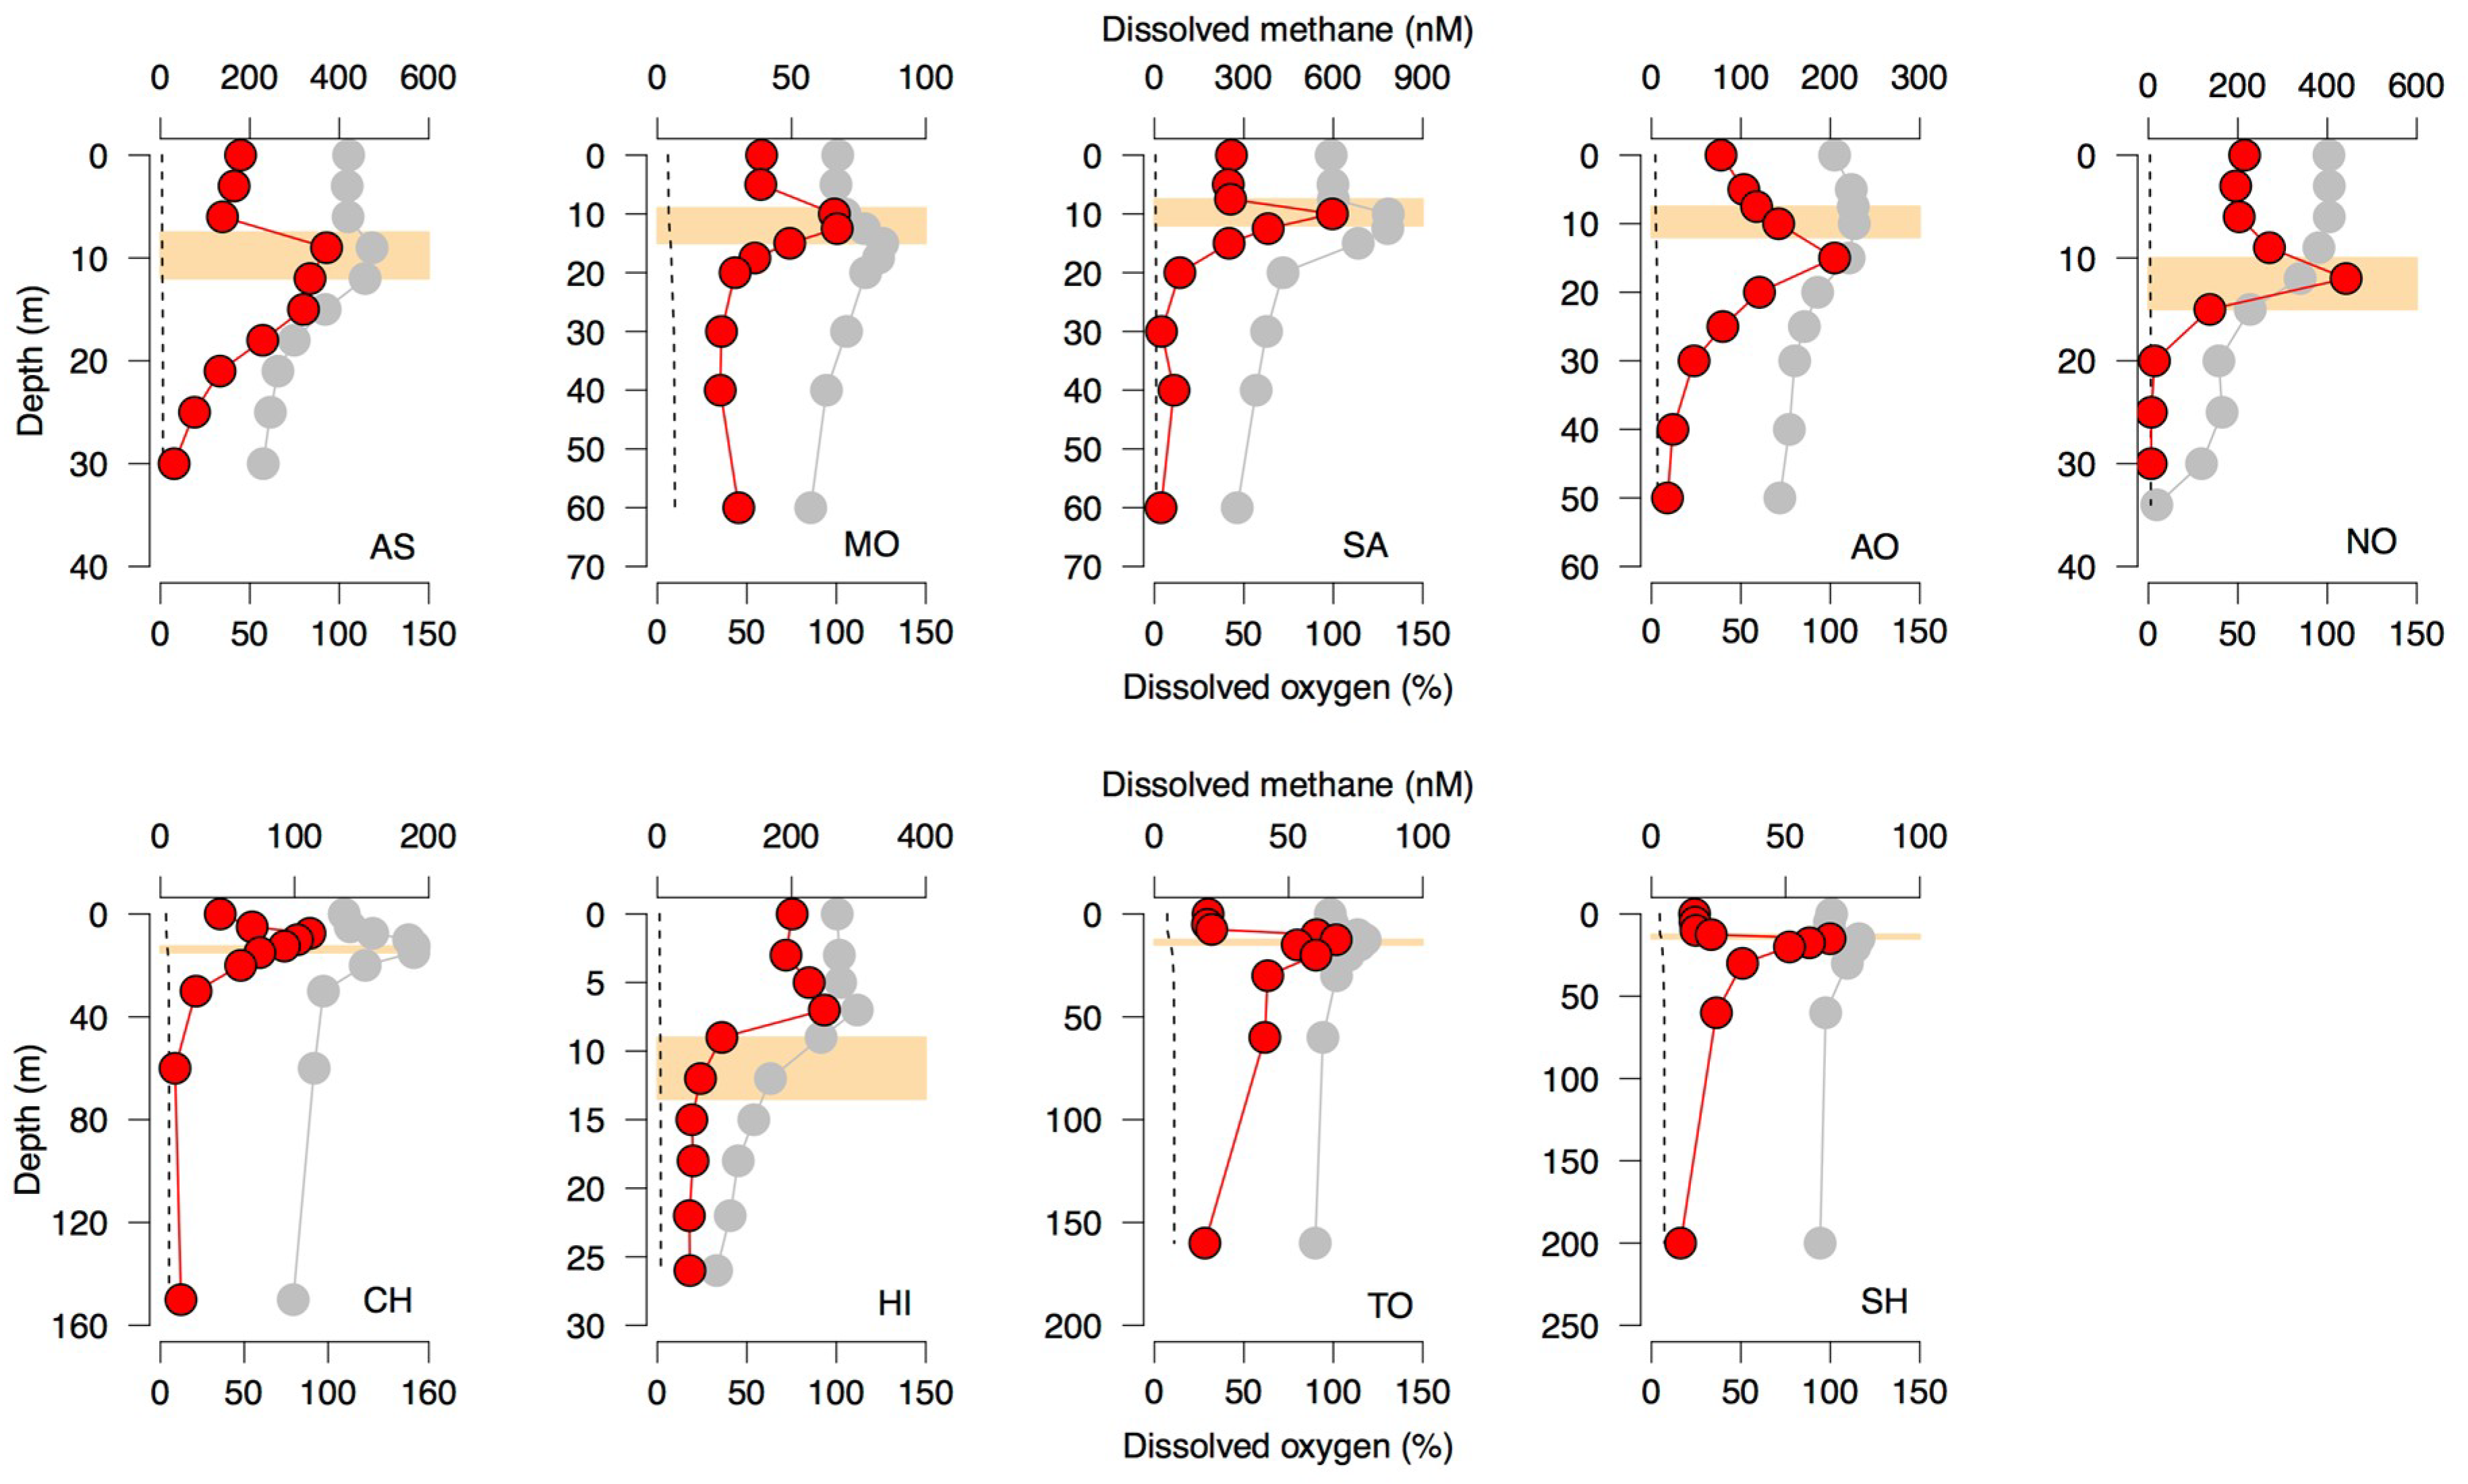
In the present study, we observed the formation of the CH4 maximum in oxic subsurface layers (i.e., SMM) within or near the metalimnion in all of the study lakes (Figure 1). The seasonal development of metalimnetic CH4 peaks during the stratification period was also reported by previous studies in deep freshwater lakes [8,9,10,15] as well as in pelagic marine ecosystems [16,17]. These results suggest that the development of the CH4 peak in aerobic subsurface waters may be a common phenomenon in aquatic ecosystems.
SMM formation was unlikely to couple with the dissolution of atmospheric CH4 because the observed CH4 peak concentrations (67–597 nM, Figure 1) were one or two orders of magnitude higher than the dissolved CH4 equilibrated with the atmosphere (range = 3.4–7.4 nM). Tributary inflow is known to contribute to SMM development in lakes [9]. However, we observed apparent SMM development even in lakes with no tributary streams (i.e., Lake Motosu and Lake Aoki). For the other lakes, moreover, the discharge-weighted average of the dissolved CH4 concentrations of tributary streams (range = 8.8–88 nM) was generally lower than the peak CH4 concentrations—except in Lake Ashinoko, where there is a small tributary (discharge < 0.02 m3/s) with a high CH4 concentration (Table S3). Another potential source of SMM formation might be the transportation of CH4 from anoxic littoral and profundal sediments [20,21]. However, the vertical profile of dissolved Mn concentrations, a tracer of water mass transported from anoxic environments [9,15], showed a pattern unrelated to the CH4 profiles (Figure S11). Moreover, the vertical gradient of CH4 profiles suggests no substantial contribution of hypolimnetic CH4 to the SMM of any of the study lakes (Figure 1). Therefore, we argue that the diffusion of anoxic CH4 from anoxic littoral and profundal sediments was also unlikely to be the source of the CH4 supersaturation observed in our study.
Recent studies have suggested that the microbial degradation of phosphonates (such as MPn and 2-AEP) can explain aerobic methane production in oligotrophic waters [12,13,15,16,24,25]. The marine and freshwater microbial community (e.g., Trichodesmium, Pseudomonas, Synechococcus, SAR11) can express the C-P lyase operon (phn genes) to utilize phosphonic compounds under phosphate-starved conditions [15,16,24,25]. As a result of the cleavage of C-P bonds of phosphonates, these microbes can produce CH4. In fact, the batch-culture experiments of lake water amended with MPn confirmed in situ aerobic CH4 production by planktonic bacteria in one of the study lakes (Lake Saiko) [15]. Considering such circumstantial evidences, as well as the fact that the DO saturation profile resembled the dissolved CH4 pattern (Figure 1), we argue that photosynthesis-related biogeochemical processes mediated by planktonic microbes may be relevant to the development of SMM.
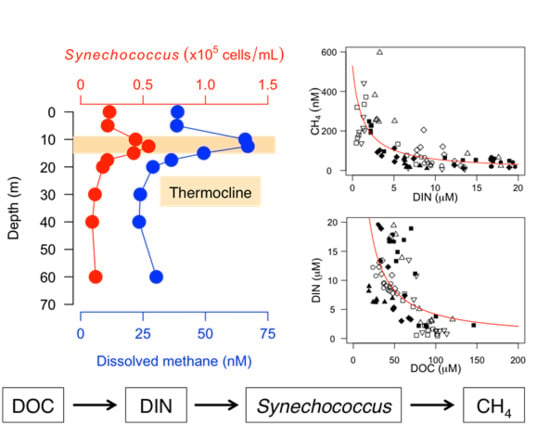
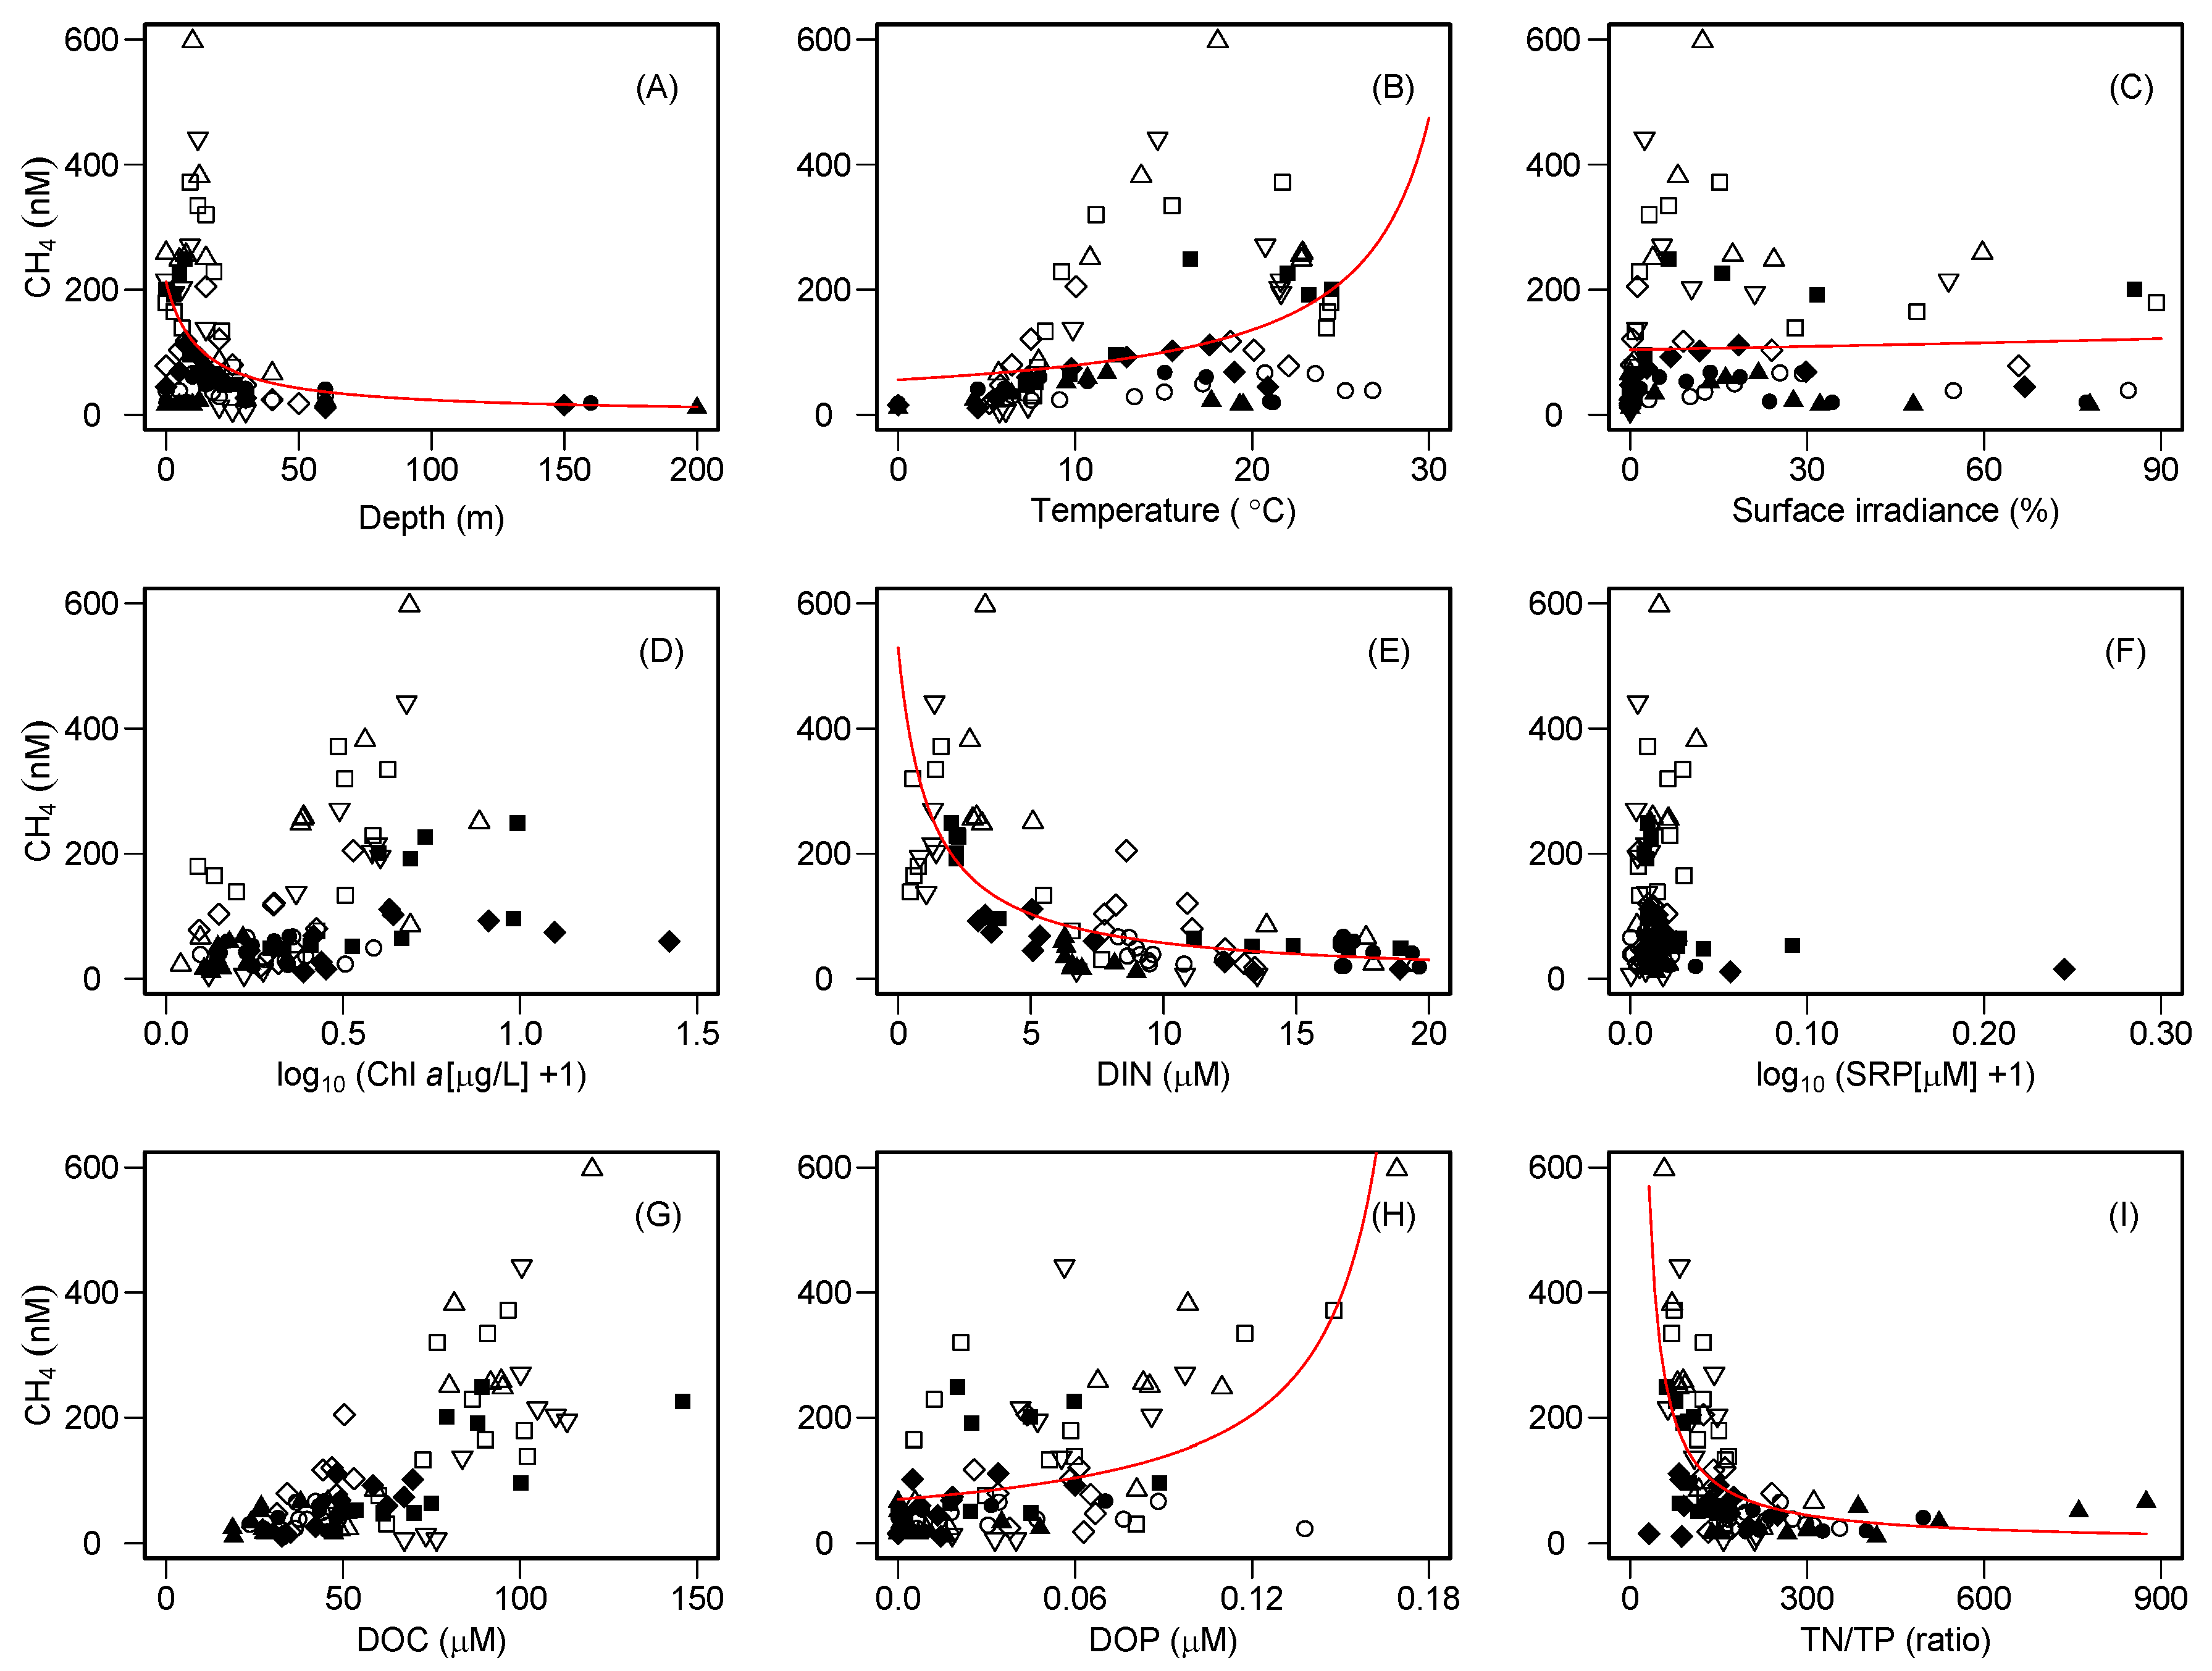
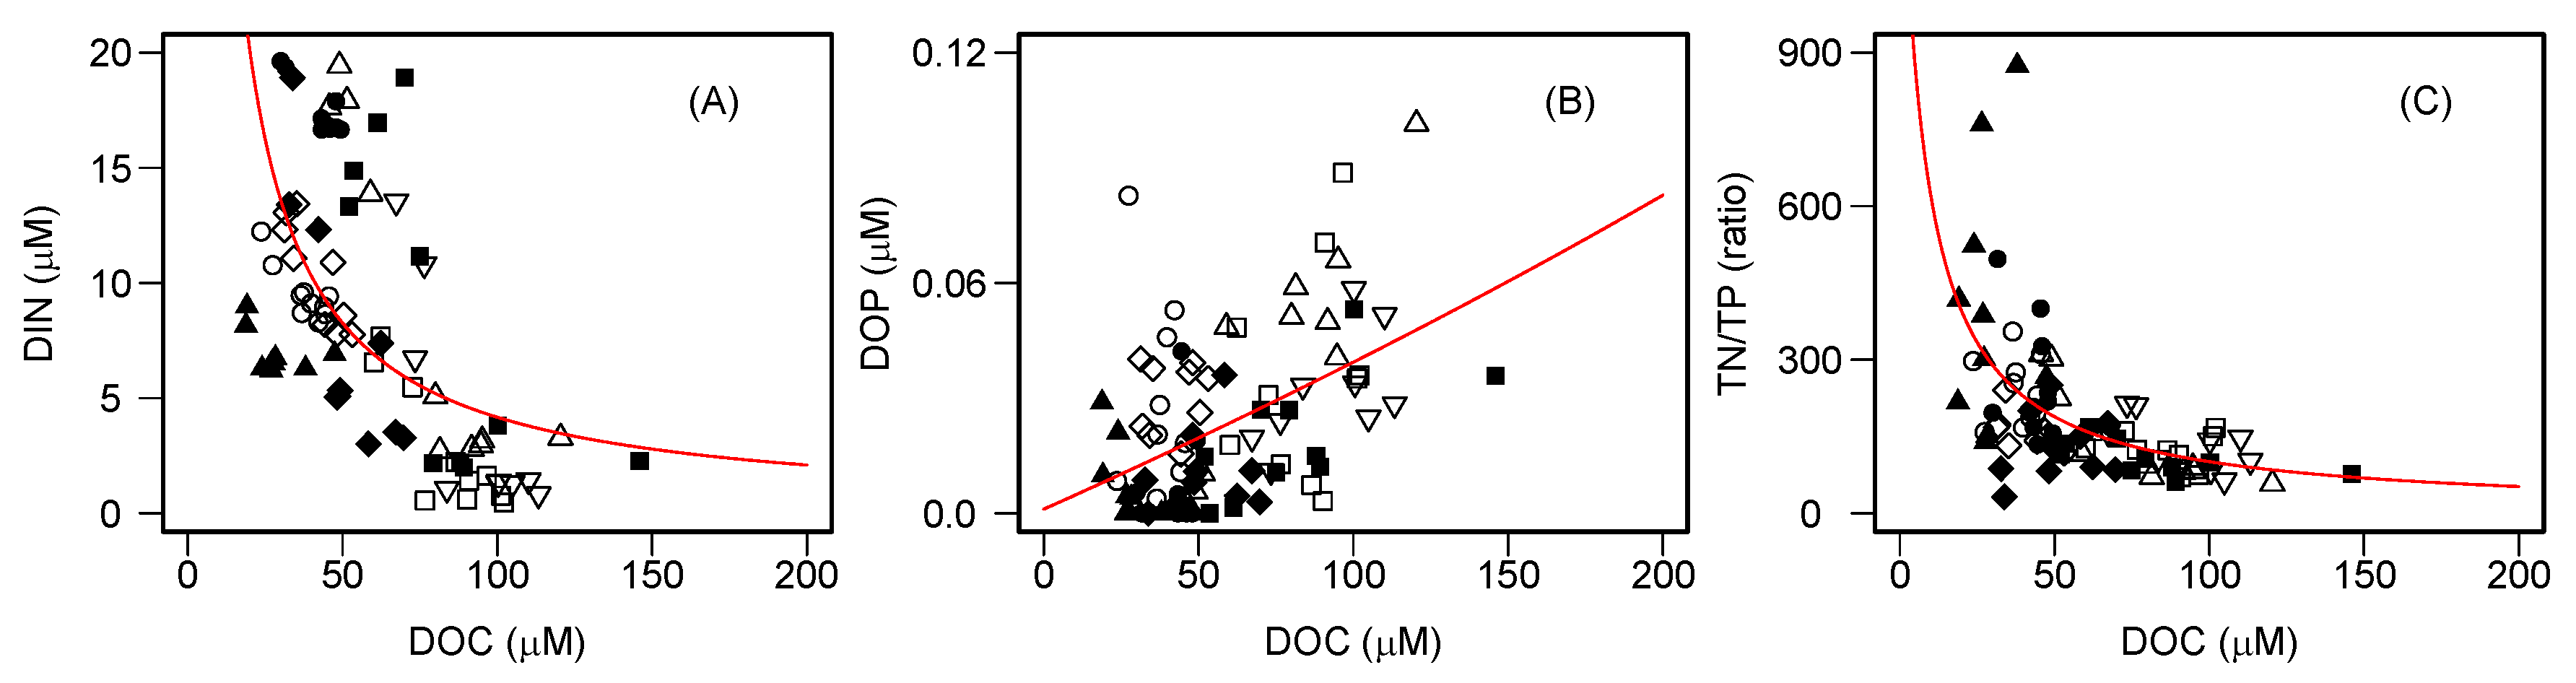
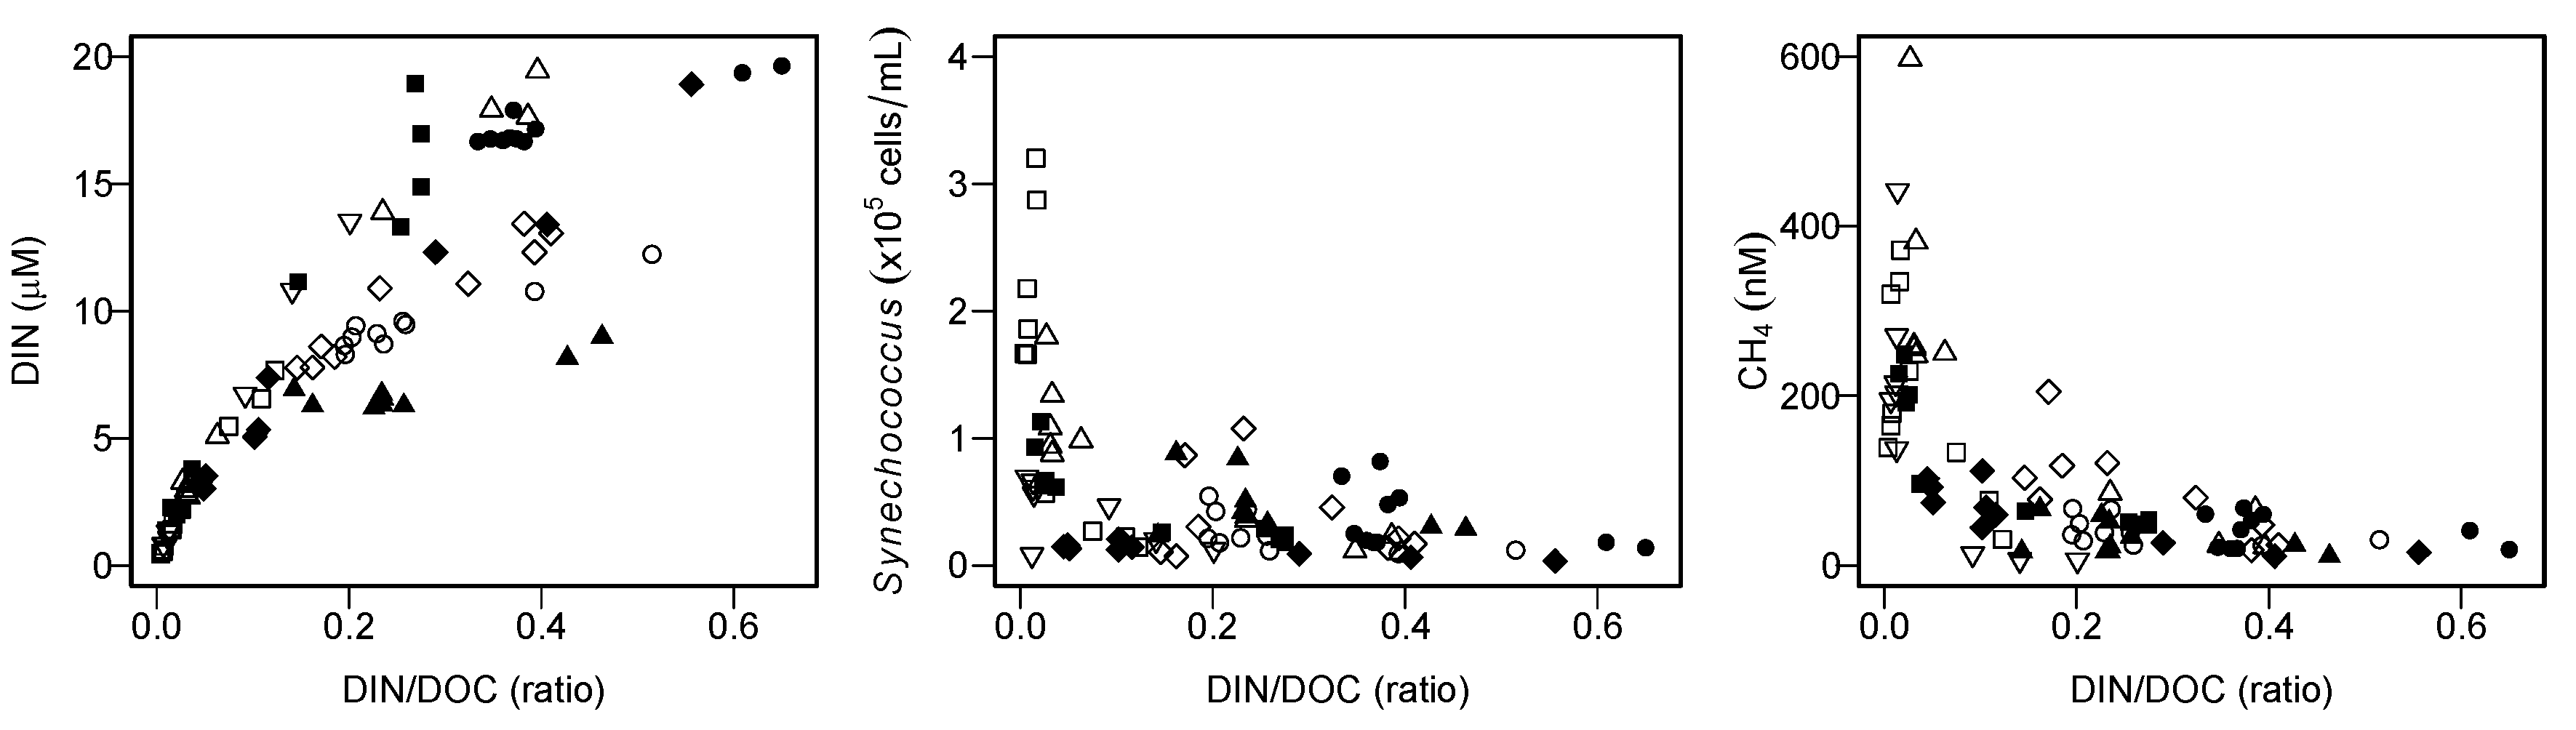
The relationships between dissolved CH4 and limnological variables suggest that DOC controls the availability of DIN, DOP, and the TN/TP ratio, thereby influencing the water-column CH4 concentration in the study lakes (Figure 2 and Figure 3). In particular, the remarkable negative nonlinear relationships of DOC with DIN and the subsequent nonlinear effects of DIN on dissolved CH4 concentrations were found. The nonlinear relationship between DOC and nitrate (NO3) has recently been reported from a wide variety of aquatic environments along a hydrologic continuum from soils to streams and lakes to coastal and pelagic ocean ecosystems [47,48,49,50]. It has been hypothesized that NO3 accumulation may occur in aquatic environments with low DOC concentrations due to an organic C limitation for assimilation and/or denitrification by heterotrophic microbes [50]. In contrast, NO3 depletion may occur in aquatic environments with high DOC concentrations due to the sufficient supply of organic C for heterotrophs. These patterns imply that stoichiometric controls of DOC–NO3 relationships over microbial activity may regulate the fate of N in aquatic ecosystems. In fact, NO3 is the dominant species of DIN in the study lakes (median = 85%, range = 0–98%). Moreover, even when we separately analyzed individual lakes, a significant negative correlation of DOC and DIN was found for each of them (r = −0.69–−0.90, p < 0.05), except Lake Shikotsu (r = −0.44, p > 0.05). Furthermore, a strong nonlinear effect of DOC on the TN/TP ratio was also evident (Figure 2), suggesting that the availability of organic carbon controls N accumulation in the water column, thereby influencing the elemental stoichiometric balance of nitrogen and phosphorus in lakes.
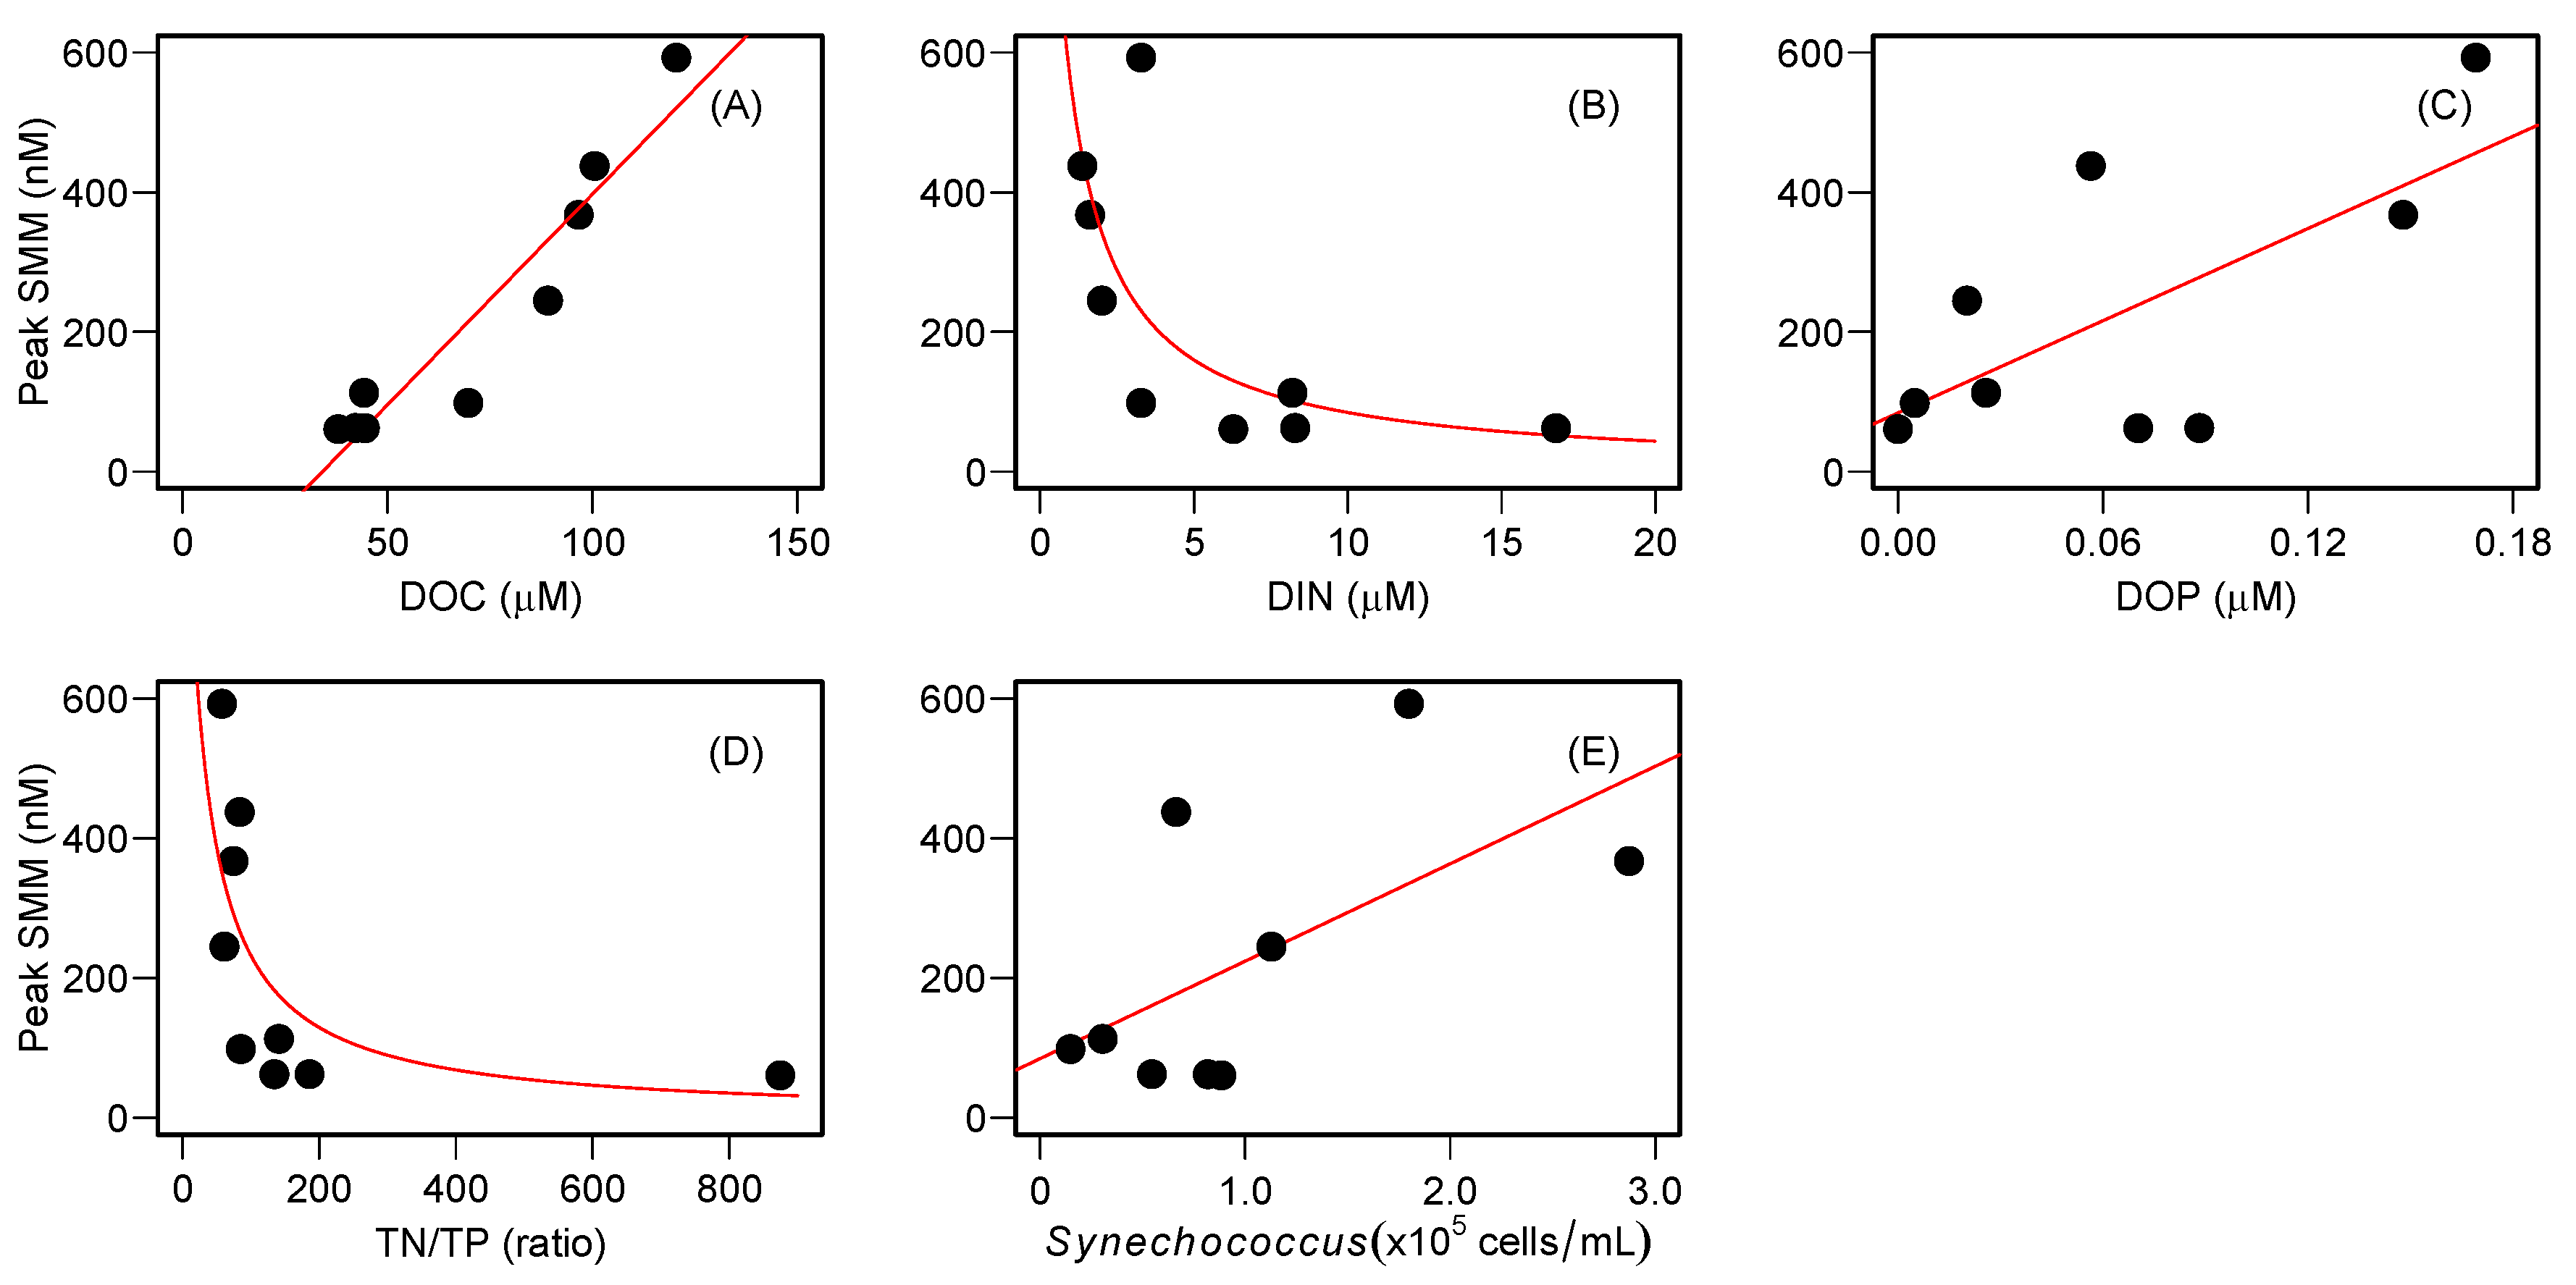
Previous studies explained that aerobic CH4 production from phosphonate decomposition by planktonic microbes occurs under P-starved environments because the organisms utilize phosphonates as an alternative P source [12,13,15,16,24]. However, the present study showed that higher CH4 concentrations tended to occur in lower DIN concentrations; no clear pattern was found for the relationship between SRP and CH4 (Figure 2). These patterns seemed to be intuitively paradoxical, as a lower N availability was likely to stimulate aerobic CH4 production. However, the observed TN/TP ratio in the study lakes (median = 151, range = 32–875, 
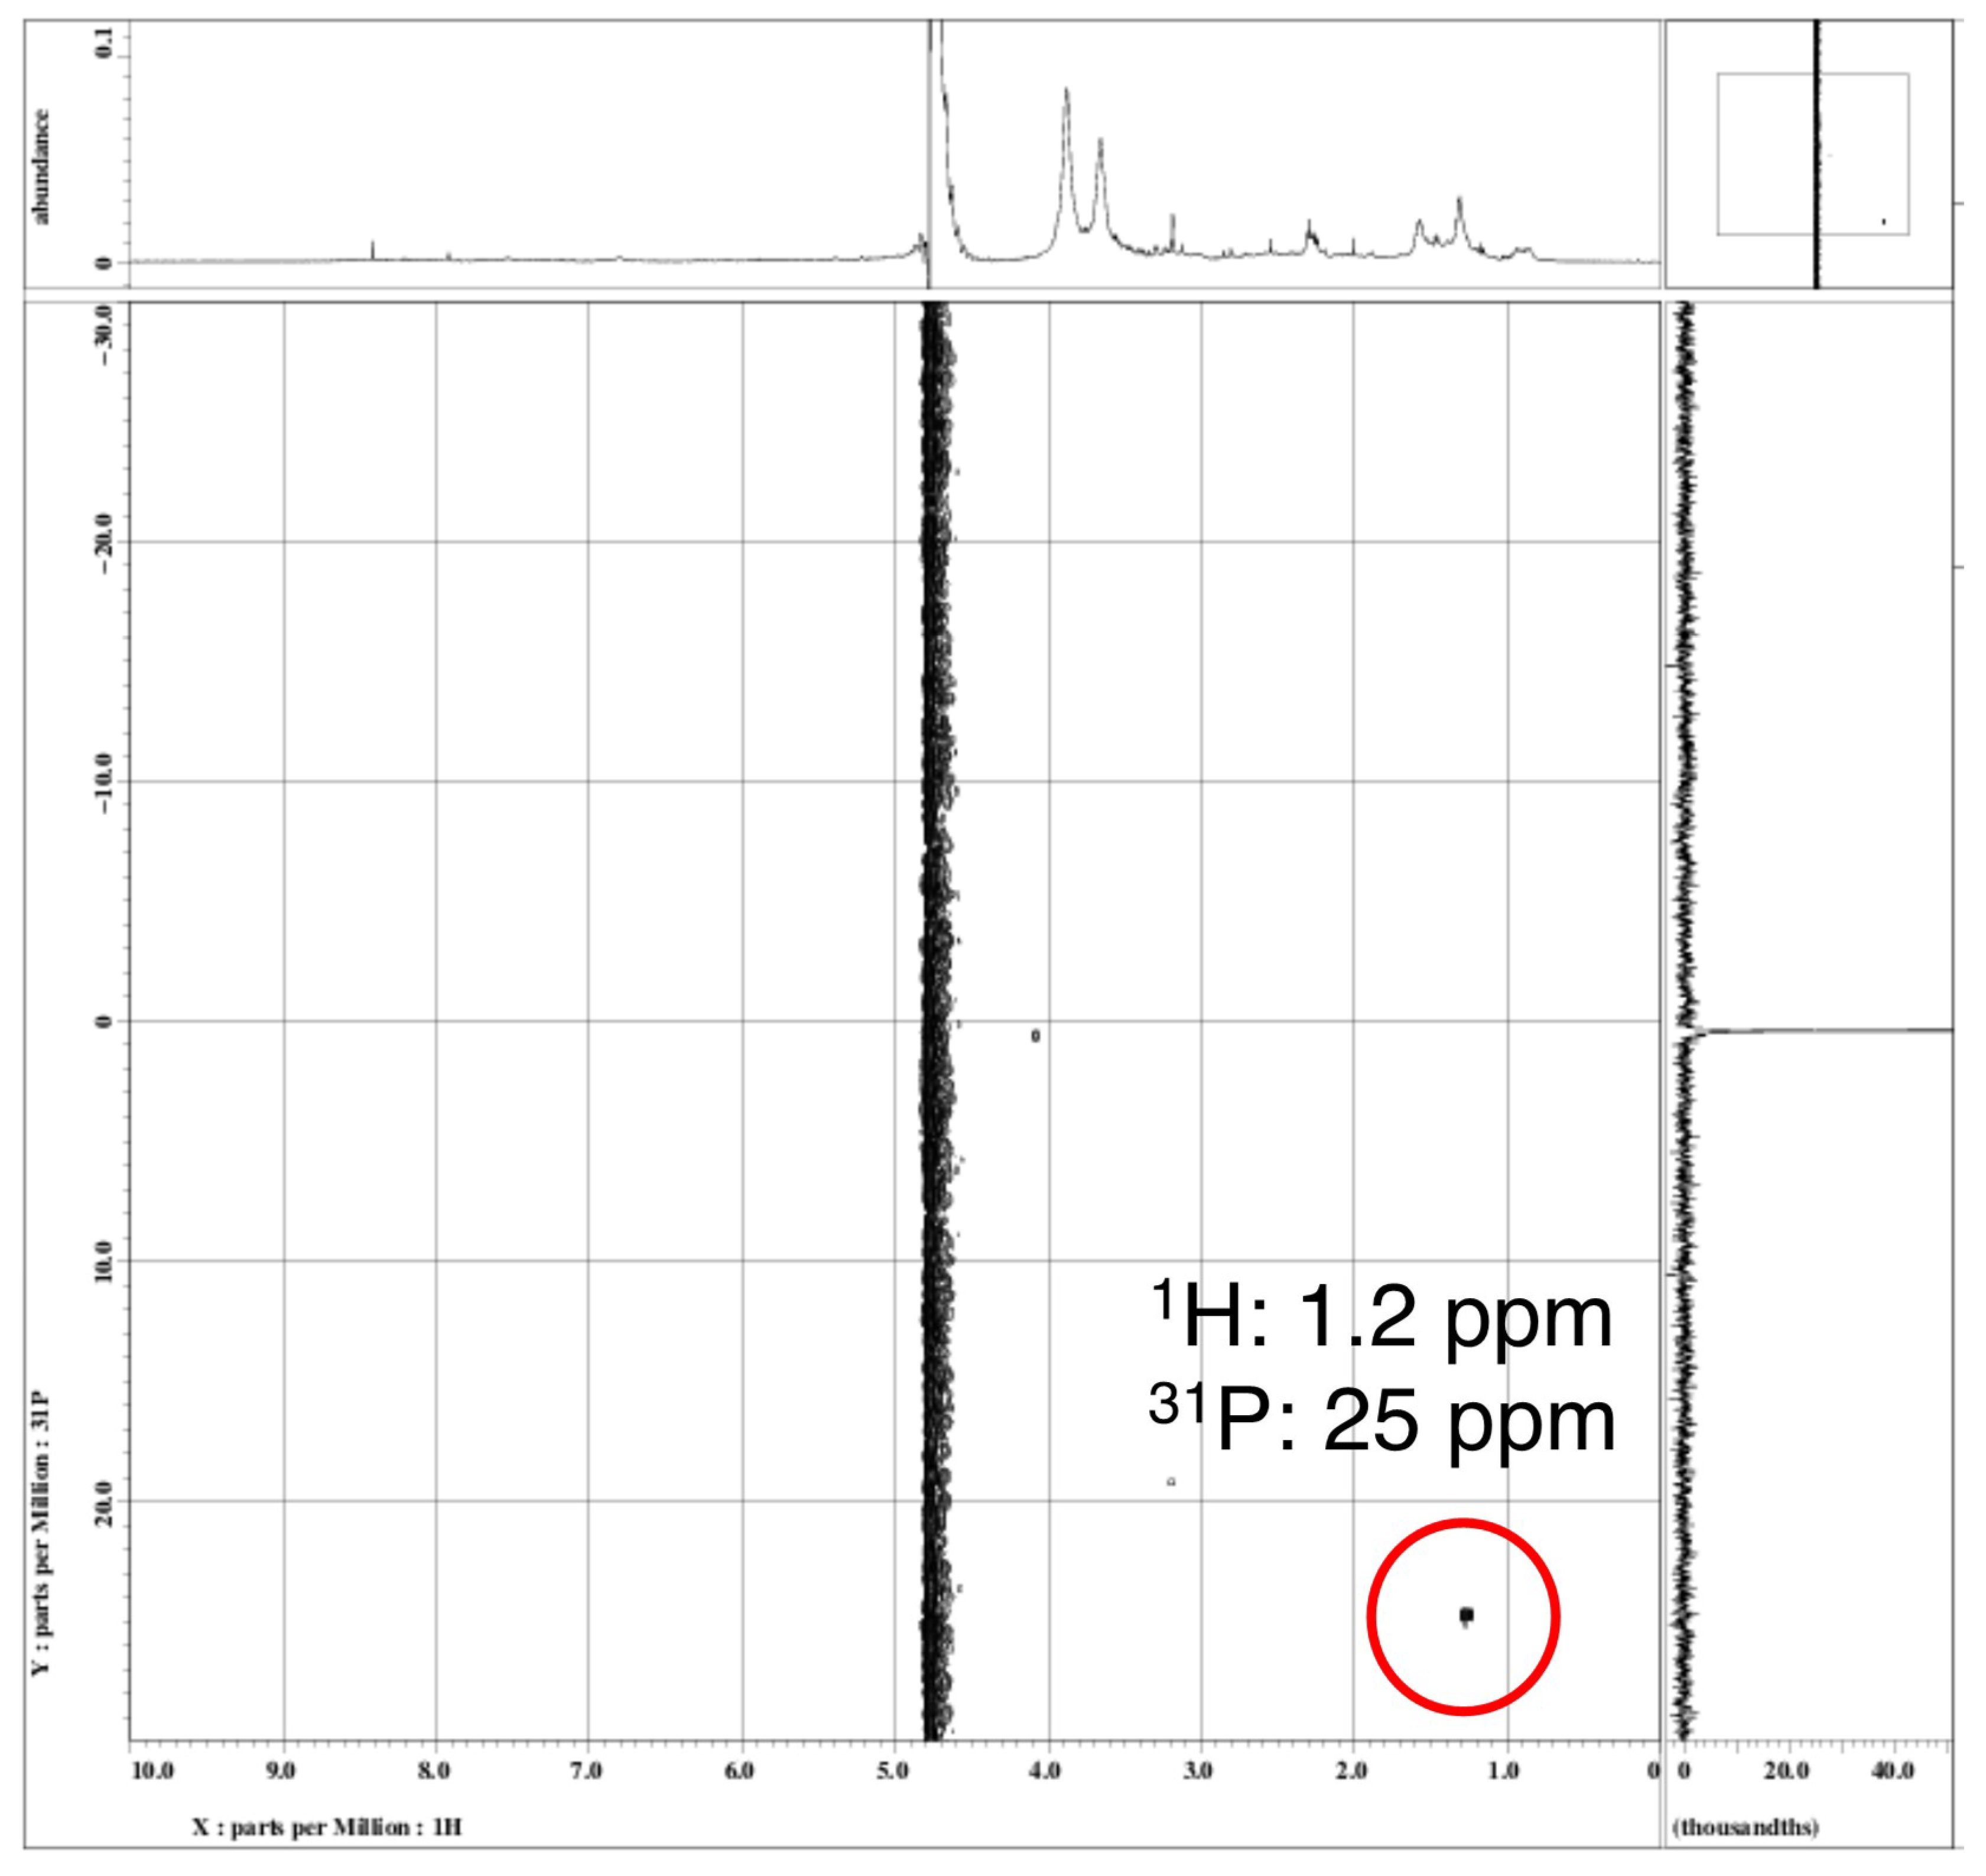
Table S2) was much higher than the Redfield ratio (N/P = 16), suggesting that lake productivity may be more P-limited than N-limited in these lakes. Therefore, we predict that P-starved planktonic microbes utilize phosphonate compounds to form SMM in the oxic waters of the study lakes. The positive relationship between DOP, which may contain dissolved organic phosphonate compounds, and CH4 concentrations, also supports this argument (Figure 2). Moreover, the NMR analysis revealed the presence of particulate phosphonates in the metalimnion of Lake Toya, where SMM formation was observed (Figure 8). A previous study also detected 2-aminoethylphosphonate (2-AEP), a possible precursor of aerobic methane production [51], from the suspended particles in the epilimnion of Lake Saiko [31]. Therefore, we hypothesized that planktonic bacteria in deep unproductive lakes may store P as phosphonate molecules and utilize such intracellular P compounds via the enzymatic liberation of C-P bonds under P-limited environments [15]. Although we were unable to detect phosphonates in the suspended fractions from the other study lakes, this is probably due to the insensitivity of NMR; prolonged data acquisition and/or a larger volume of lake water filtration may be necessary to obtain the spectra. In addition, further development of quantitative analyses for the dissolved species of phosphonate compounds [52] is necessary to understand the phosphonate and CH4 dynamics in lakes.
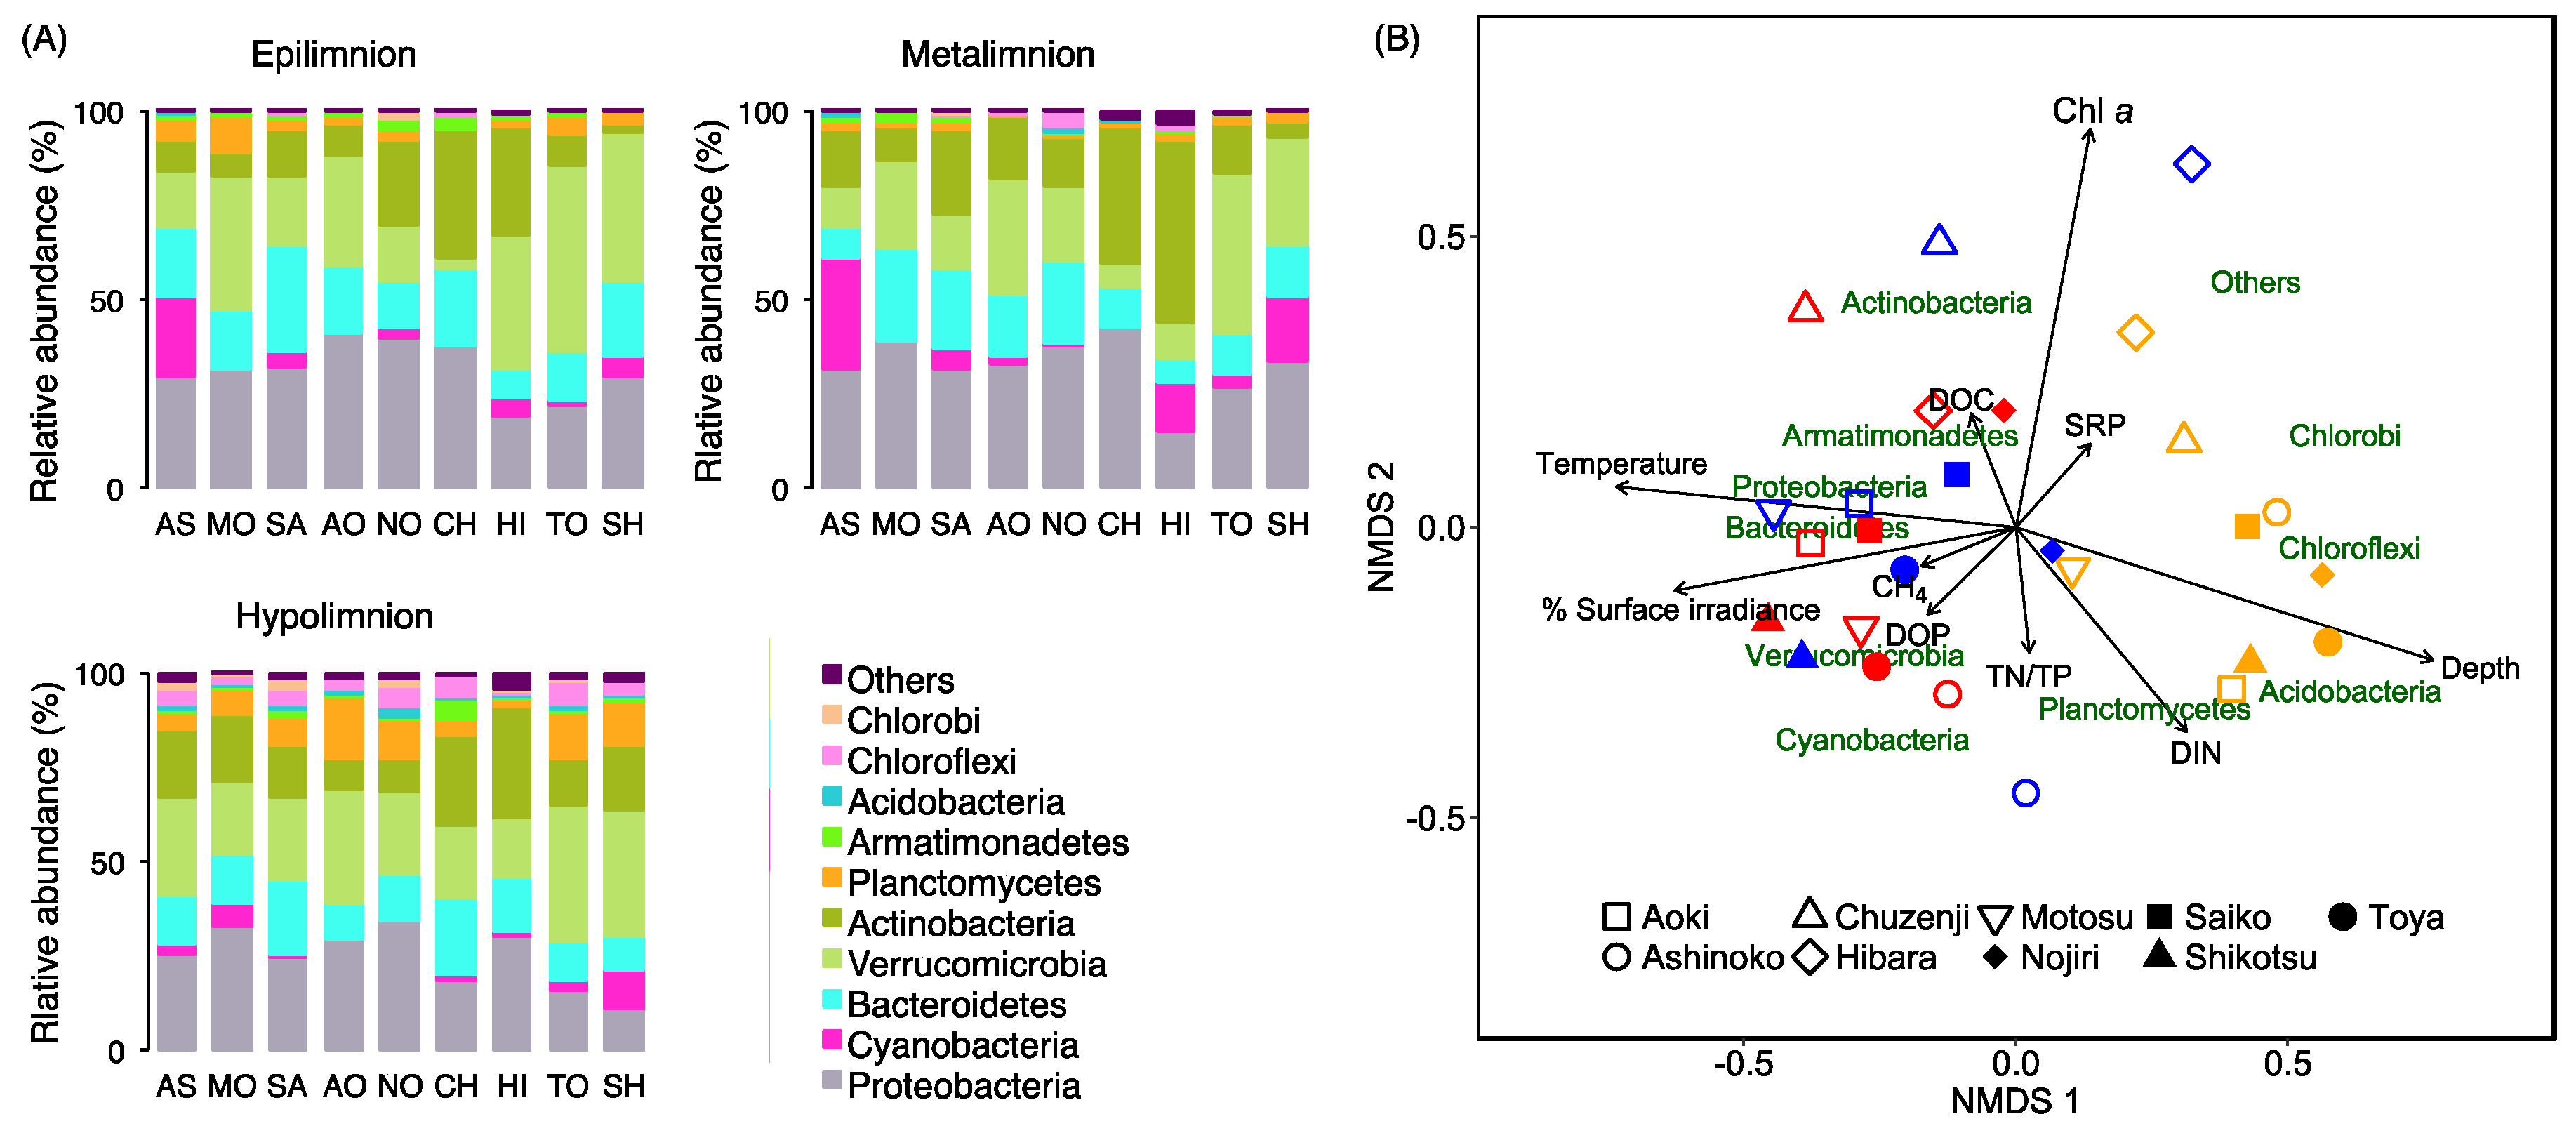
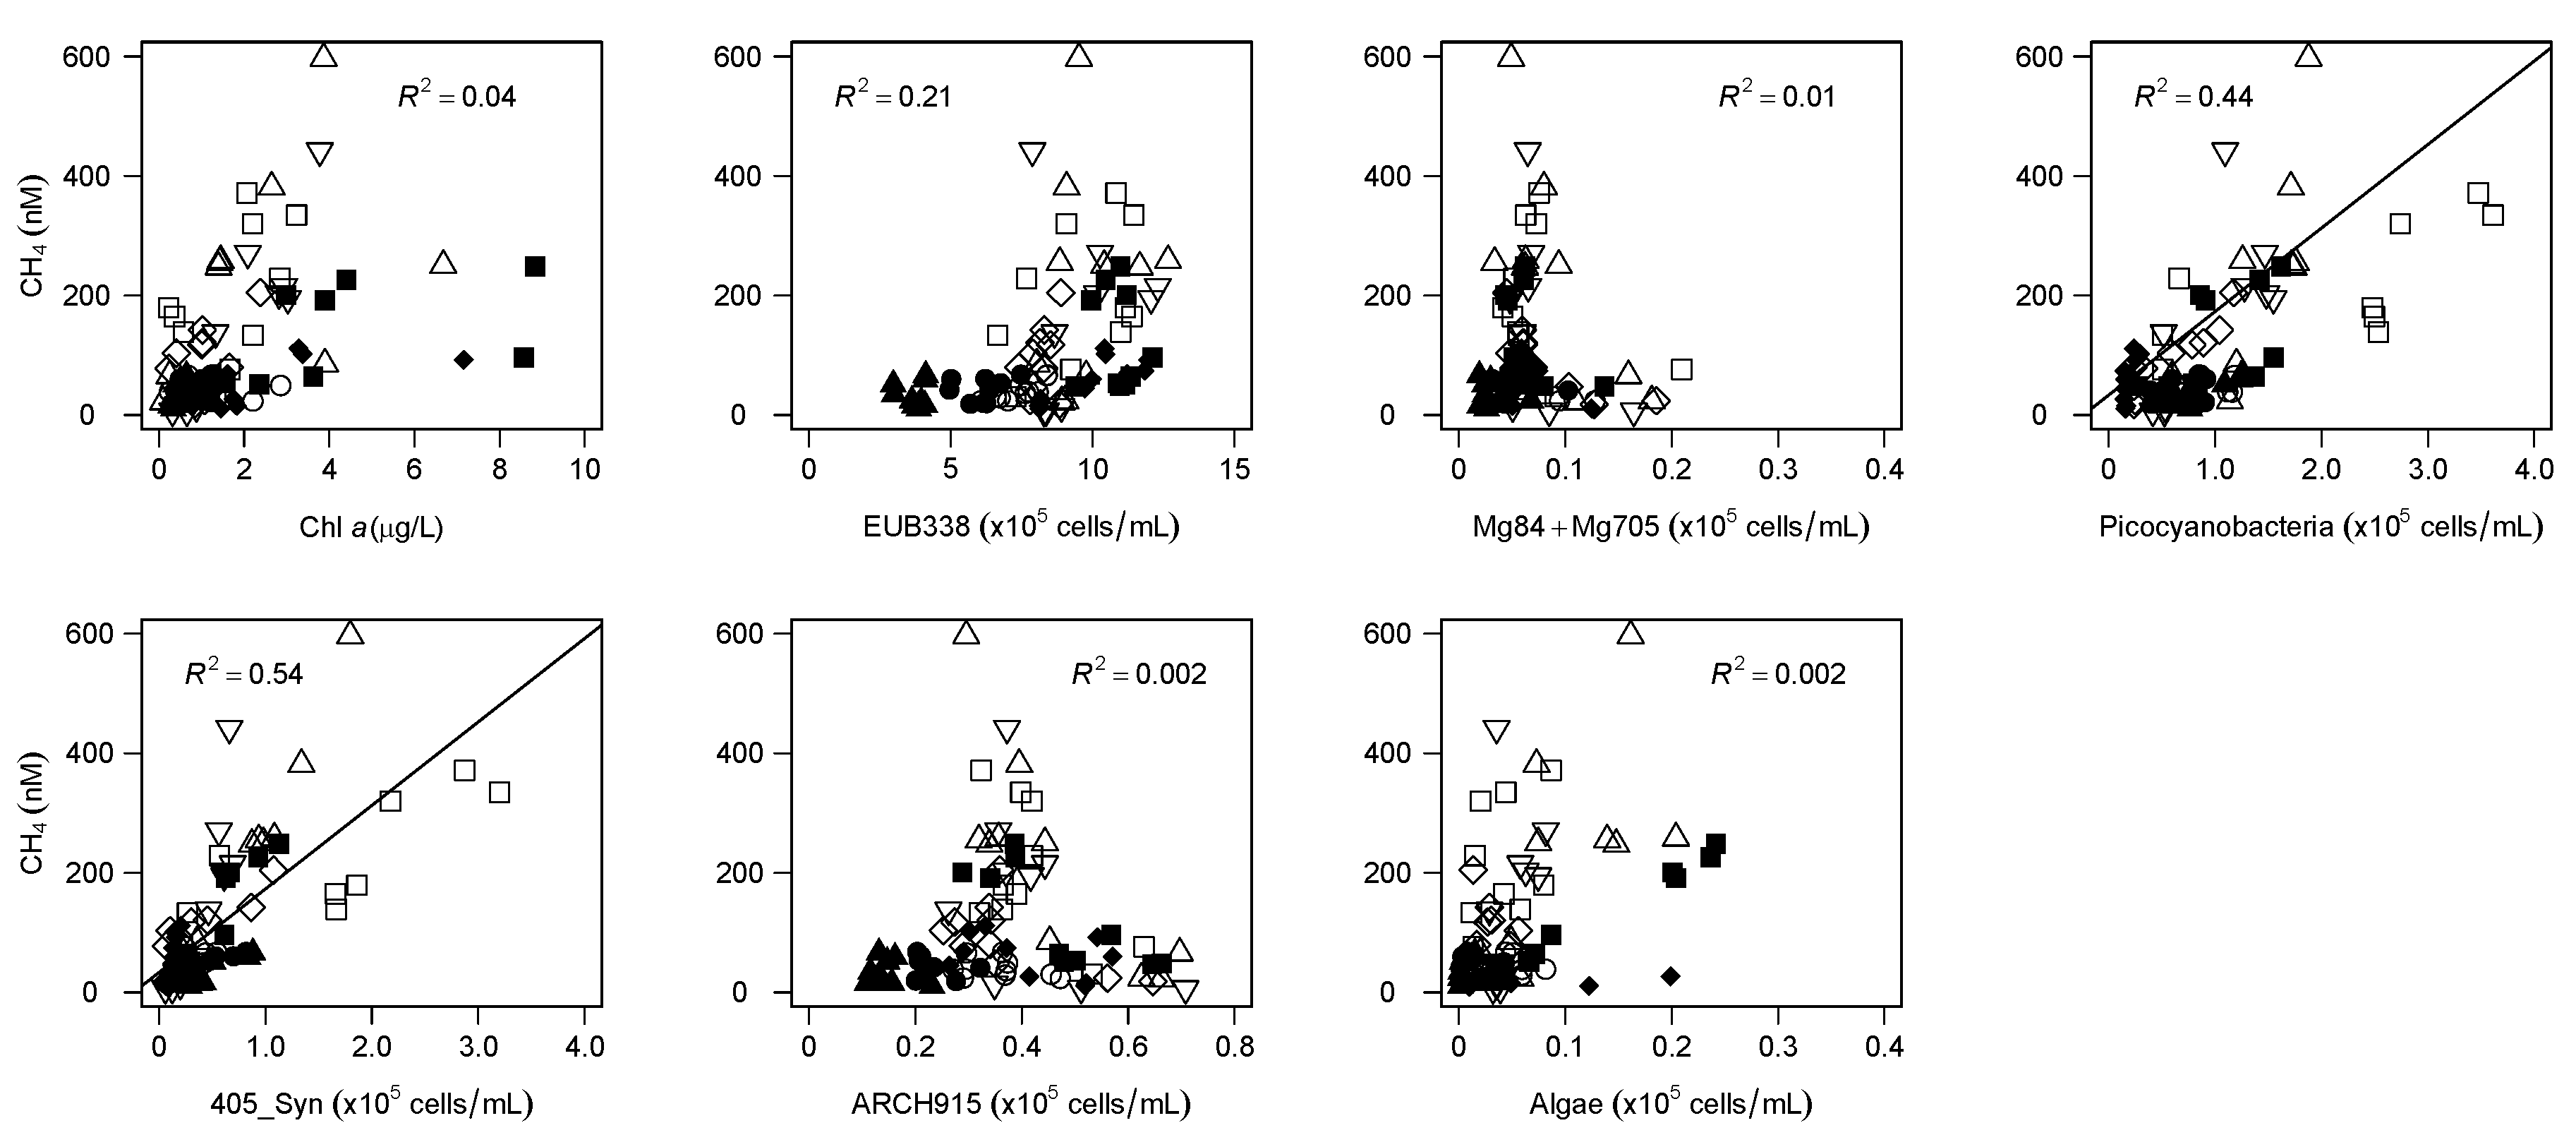
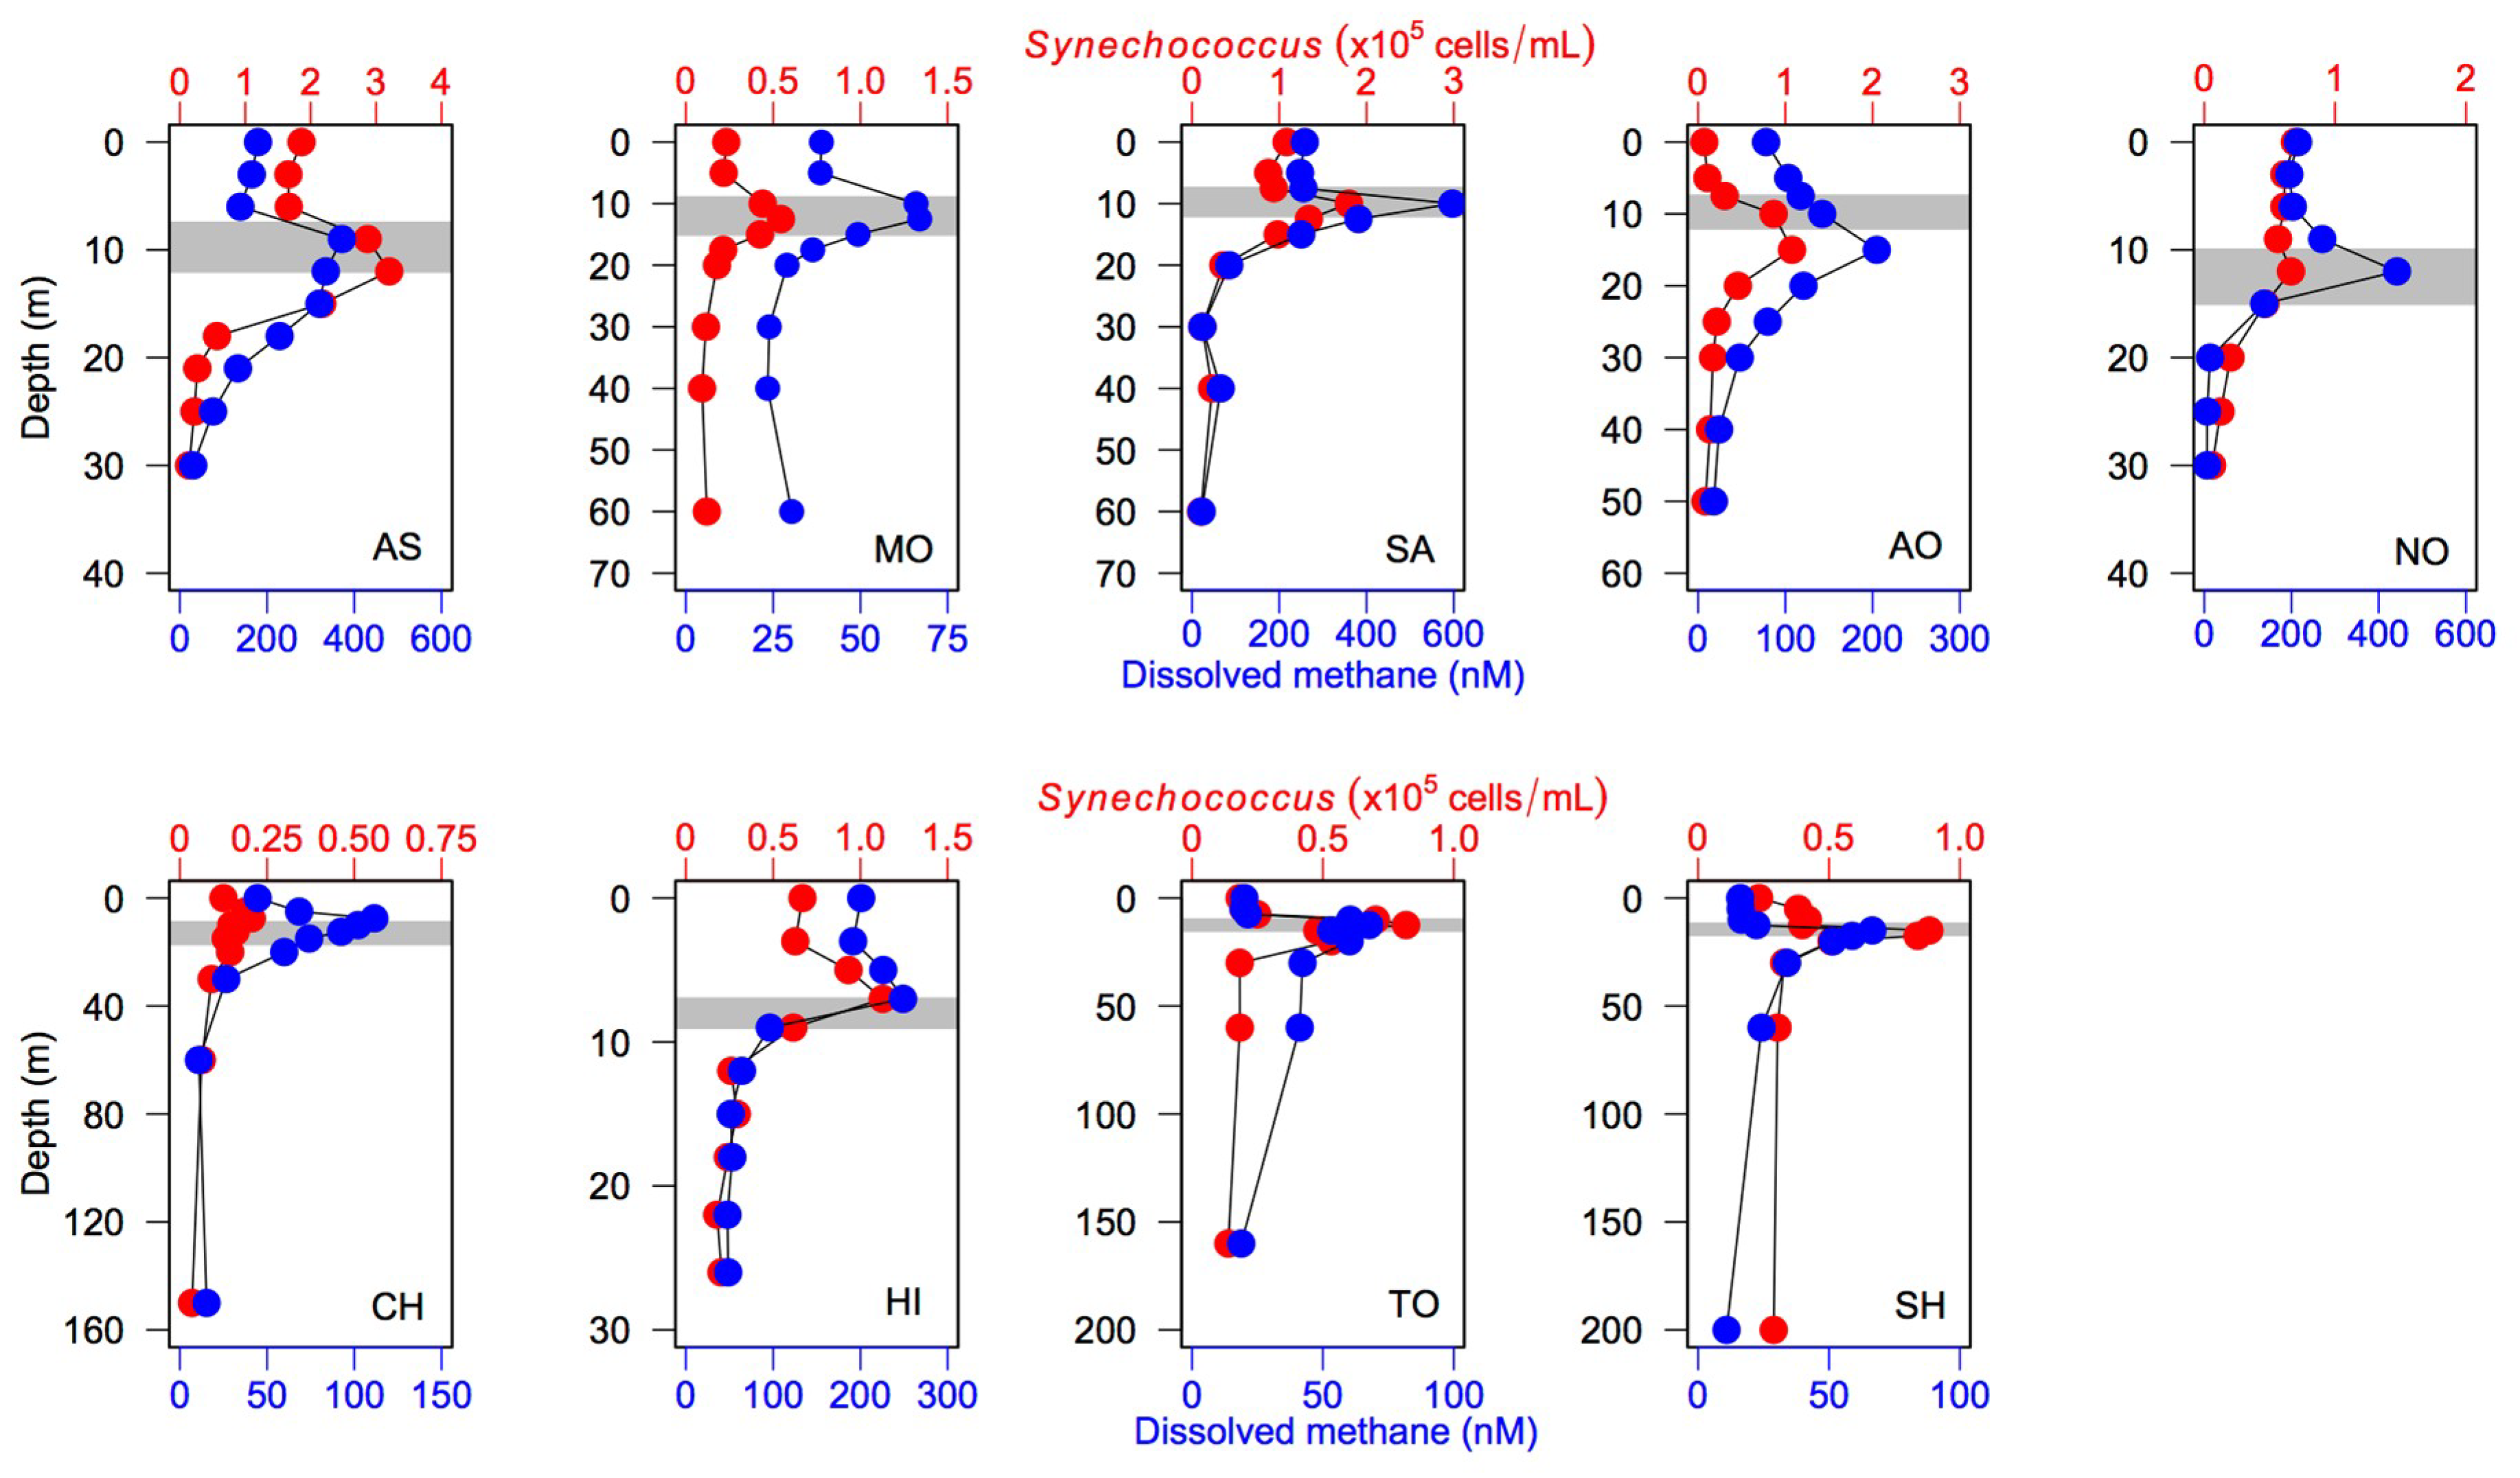
The 16S rRNA gene amplicon sequencing analyses and the CARD-FISH analyses revealed that cyanobacteria, especially Synechococcus, were related to dissolved CH4 concentrations and SMM formation. The composition of cyanobacteria estimated from amplicon reads was associated with the gradient of the CH4 concentration (Figure 4). Moreover, a close association of the vertical CH4 profile with Synechococcus distribution was observed across the lakes (Figure 6), as found in a previous study [15]. The batch-culture experiments conducted in previous studies also showed that Synechococcus strains have the ability to produce CH4 in oxic conditions as a result of phosphonate (such as MPn and 2-AEP) utilization [15,51] or unknown photosynthesis-related processes [26]. Although other heterotrophic bacteria, such as Limnohabotans and Pseudomonas, are also known to carry the C-P lyase (phnJ) gene [13,15], the strong correlation between the CH4 concentration and Synechococcus cell density (Figure 5), as well as the association of the DO saturation profile with the CH4 peak (Figure 1), suggested that Synechococcus (photosynthetic cyanobacteria) may be one of the potential drivers of SMM formation in deep freshwater lakes.
Synechococcus, a group of ubiquitous freshwater picocyanobacteria, often predominate in the planktonic communities in the epilimnion and metalimnion of unproductive lakes during the summer stratification period, where nutrient depletion occurs due to the prevention of vertical water mixing and nutrient exhaustion by competitors, such as eukaryotic algae [53,54,55]. Our previous studies also indicated that the development of nutrient-depleted environments by stratification during midsummer (i.e., low N and P conditions) may favor the growth of Synechococcus because their small cell size is advantageous for nutrient uptake under oligotrophic conditions due to efficient nutrient diffusion per unit of cell volume [15,55]. The present results add a further potential scenario for picocyanobacterial dominance in the metalimnion; that is, the reduced nutrient availability associated with the increase in DOC loading in lakes may promote the population growth of Synechococcus. This may be the reason for the cascading negative responses of biogeochemical elements from DOC to DIN, and from DIN to both Synechococcus and CH4, that were observed in our study. In fact, a cross-lake comparison revealed that lakes with relatively high DOC and low DIN concentrations enhanced the degree of SMM development (Figure 7). Likewise, lakes with more abundant Synechococcus populations and a higher DOP pool promoted the development of SMM (Figure 7). Therefore, we conclude that the stoichiometric balance between DOC and DIN in the water column may regulate nutrient availability for bacterioplankton communities (e.g., Synechococcus) and may subsequently control CH4 production and SMM formation in deep freshwater lakes (Figure 9). Although the variability of DOC and DIN concentrations could also be explained by the extracellular release of DOC and DIN uptake by phytoplankters [28,29], the relationship between phytoplankton biomass (Chl a) and DOC concentration, as well as that between Chl a and DIN, was unclear (Figure S12). Moreover, the vertical profiles of DOC and Synechococcus density were not closely associated with each other for the study lakes (Figure S13), except Lake Saiko and Lake Hibara. Therefore, we argue that phytoplankton (including Synechococcus) per se may not be a major factor controlling the DOC and DIN variability, even though further studies are necessary to clarify the causal relationships between microbial activities and lake biogeochemical conditions.
Although the present studies are conducted in monomictic or dimictic lakes where stratification occurs seasonally, enhanced SMM development might be predicted in meromictic lakes. This is because the lack of vertical mixing in such permanently stratified lakes may reduce the up-welling supply of nutrients from hypolimnion [56], which might result in a low DIN/DOC ratio in shallow water, as observed in the present study (Figure 9). If this is the case, the projected alteration in the lake mixing regime from dimictic to monomictic, or monomictic to meromictic, under climate change might increase the aerobic CH4 production and emission from the nutrient-depleted oxic lake waters. Further studies are required to precisely predict the effect of lake-mixing regime on SMM formation.

5. Conclusions

The formation of SMM might have a significant impact on methane emissions from deep freshwater lakes because methanotrophs generally consume the majority of CH4 and prevent fugitive methane emissions from deep profundal sediments or hypolimnetic zones in lakes [36,37]. In contrast, CH4, produced by aerobic methanogenesis within the SMM of the metalimnetic layer, might easily leak into the atmosphere because of the proximity of CH4 production sites to the lake surface. Therefore, the present study predicted that DOC loading triggers the cascading responses of biogeochemical processes, from N depletion to picocyanobacterial domination, which may promote CH4 production and emission to the atmosphere from the SMM layer. Although previous studies also reported that DOC might influence the CH4 emissions of freshwater ecosystems [57,58], these studies considered DOC as a direct substrate for anaerobic methanogenesis in sediments. In contrast, our study suggested that organic C exerts stoichiometric control over CH4 production in the oxic layer of lakes. DOC concentrations are now expected to increase due to ongoing climate change, which may result in significant changes to the structure and functioning of lake ecosystems [48]. For example, increasing concentrations of DOC often change the light and thermal environments in water columns, thereby affecting the primary and secondary productivity of lake food webs, as well as the thermal stratification regime in lakes. An increased DOC supply can also provide energy subsidies to heterotrophic consumers and consequently influence the metabolic balance of lake ecosystems. Moreover, DOC can change the chemical environments of lake ecosystems, such as their pH and dissolved iron concentrations. We argue that, in addition to these phenomena, increased organic carbon loading under changing environments may promote aerobic CH4 production and emission from the oxic layer of deep freshwater lakes.

Supplementary Materials

The following are available online at https://www.mdpi.com/2073-4441/12/2/402/s1, supplementary data accompany this paper with Figure S1: Geographic location of nine study lakes in Japan, Figure S2: Vertical profiles of dissolved CH4 concentration (nM, red circles) and water temperature (°C, gray circles) in nine study lakes during the period from July to September in 2016–2017. AS: Lake Ashinoko, MO: Lake Motosu, SA: Lake Saiko, AO: Lake Aoki, NO: Lake Nojiri, CH: Lake Chuzenji, HI: Lake Hibara, TO: Lake Toya, SH: Lake Shikotsu. Shaded areas denote the range of the thermocline, Figure S3: Vertical profiles of dissolved CH4 concentration (nM, red circles) and the percentage of surface irradiance (%, gray circles) in nine study lakes during the period from July to September in 2016–2017. See legend of Figure S2 for the abbreviation of lake names and the descriptions of shaded areas, Figure S4: Vertical profiles of dissolved CH4 (nM, red circles) and chlorophyll a (μg/L, gray circles) concentrations in nine study lakes during the period from July to September in 2016–2017. See legend of Figure S2 for the abbreviation of lake names and the descriptions of shaded areas, Figure S5: Vertical profiles of dissolved CH4 (nM, red circles) and DOP (μM, gray circles) concentrations in nine study lakes during the period from July to September in 2016–2017. See legend of Figure S2 for the abbreviation of lake names and the descriptions of shaded areas, Figure S6: Vertical profiles of dissolved CH4 (nM, red circles) and DIN (μM, gray circles) concentrations in nine study lakes during the period from July to September in 2016–2017. See legend of Figure S2 for the abbreviation of lake names and the descriptions of shaded areas, Figure S7: Vertical profiles of dissolved CH4 (nM, red circles) and SRP (μM, gray circles) concentrations in nine study lakes during the period from July to September in 2016–2017. See legend of Figure S2 for the abbreviation of lake names and the descriptions of shaded areas, Figure S8: Vertical profiles of dissolved CH4 (nM, red circles) and DOC (μM, gray circles) concentrations in nine study lakes during the period from July to September in 2016–2017. See legend of Figure S2 for the abbreviation of lake names and the descriptions of shaded areas, Figure S9: Vertical profiles of dissolved CH4 concentration (nM, red circles) and TN/TP (ratio, gray circles) concentrations in nine study lakes during the period from July to September in 2016–2017. See legend of Figure S2 for the abbreviation of lake names and the descriptions of shaded areas, Figure S10: Relationships between Synechococcus cell density (cells/mL) and lake physicochemical variables in study lakes. Univariate regression lines were shown for the explanatory variables that were retained in the best model of GLMs with gamma distribution of response variable. See the legend of Figure S10 for symbol description, Figure S11: Vertical profiles of dissolved CH4 concentration (nM, red circles) and Mn (μM, gray circles) concentrations in nine study lakes during the period from July to September in 2016–2017. See legend of Figure S2 for the abbreviation of lake names and the descriptions of shaded areas, Figure S12: Relationships between phytoplankton biomass (log10 (Chl a), μg/L) and two variables (DIN and DOC, μM) in study lakes, Figure S13: Vertical distribution of Synechococcus density (red circles) in relation to the DOC profile (gray circles) in the study lakes. Shaded areas denote the range of the thermocline. See legend of Figure S2 for the abbreviation of lake names, Table S1: Watershed and lake morphological variables of the nine study lakes in Japan, Table S2: Water quality variables of the nine study lakes in Japan, Table S3: Water quality variables of tributary streams for study lakes, Table S4: The CARD-FISH probes used in the study, Table S5: Relative importance for limnological explanatory variables used in the generalized linear models (GLMs) with a gamma error distribution and an inverse link function for each response variable. Relative importance was evaluated by the sum of Akaike weights (w) for each model (CH4, DIN, DOP and TN/TP), Table S6: Results of the generalized linear models (GLM) assessing the univariate relationship between environmental variables and dissolved CH4 concentrations (as shown in Figure 2), the univariate relationship between DOC and chemical variables (Figure 3), and the univariate relationship between lake environmental variables and the peak subsurface maximum (SMM) in nine study lakes (Figure 7). GLMs were constructed with a gamma error distribution and an inverse link function for each variable (1/y = ax + b), except for the variables with an asterisk whose relationships were estimated with GLMs with a Gaussian error and an identity link function (y = ax + b), Table S7: Relative abundance (%) of phytoplanktonic algae in the epilimnion, metalimnion and hypolimnion of Table S6. Relative abundance (%) of phytoplanktonic algae in the epilimnion, metalimnion and hypolimnion of study lakes.

Author Contributions

T.I., Y.I., K.Y., D.I., T.K. and H.S. performed the field survey and laboratory analyses. S.K., T.I., Y.I. and K.Y. performed the CARD-FISH analyses. H.K. and T.K. performed the genome analyses and database research with S.K. and T.I. R.S. performed the 1H–31P NMR analyses. S.K., Y.I., K.Y., and T.I. performed the data analyses and presentation. S.K. and T.I. wrote the manuscript with the assistance of the other co-authors. All authors have read and agreed to the published version of the manuscript.

Funding

This research was funded by Grants-in-Aid (B) (16H02935) and by the Grant-in-Aid for Young Scientists (A) (23681003) from the Japan Society for the Promotion of Science, the Grant for Joint Research Program of the Institute of Low Temperature Science, Hokkaido University in 2016, and the Grant from the Nippon Life Insurance Foundation in 2015.

Acknowledgments

We thank the laboratory members for their support of our study. We also thank Denboh and the staff of Lake Toya Field Station at Hokkaido University and the staff of Shikotsuko Fishermen’s Cooperative for their support during our field survey.

Conflicts of Interest

The authors declare no competing financial interests.

References

  1. Kirschke, S.; Bousquet, P.; Ciais, P.; Saunois, M.; Canadell, J.G.; Dlugokencky, E.J.; Bergamaschi, P.; Bergmann, D.; Blake, D.R.; Bruhwiler, L.; et al. Three decades of global methane sources and sinks. Nat. Geosci. 2013, 6, 813–823. [Google Scholar] [CrossRef]
  2. Ciais, P.; Sabine, C.; Bala, G.; Bopp, L.; Brovkin, V.; Canadell, J.; Chhabra, A.; DeFries, R.; Galloway, J.; Heimann, M.; et al. Carbon and other biogeochemical cycles. In Climate Change 2013: The Physical Science Basis, Contribution of Working Group I to the Fifth Assessment Report of the Intergovernmental Panel on Climate Change; Stocker, T.F., Qin, D., et al., Eds.; Cambridge University Press: Cambridge, UK, 2013; pp. 465–570. [Google Scholar]
  3. Saunois, M.; Bousquet, P.; Poulter, B.; Peregon, A.; Ciais, P.; Canadell, J.G.; Dlugokencky, E.J.; Etiope, G.; Bastviken, D.; Houweling, S.; et al. The global methane budget 2000–2012. Earth Syst. Sci. Data 2016, 8, 697–751. [Google Scholar] [CrossRef] [Green Version]
  4. Bastviken, D.; Cole, J.; Pace, M.; Tranvik, L. Methane emissions from lakes: Dependence of lake characteristics, two regional assessments, and a global estimate. Glob. Biogeochem. Cycles 2004, 18, 1–12. [Google Scholar] [CrossRef]
  5. Bastviken, D.; Tranvik, L.J.; Downing, J.A.; Crill, P.M.; Enrich-Prast, A. Freshwater methane emissions offset the continental carbon sink. Science 2011, 331, 50. [Google Scholar] [CrossRef] [PubMed] [Green Version]
  6. Thauer, R.K.; Kaster, A.K.; Seedorf, H.; Buckel, W.; Hedderich, R. Methanogenic archaea: Ecologically relevant differences in energy conservation. Nat. Rev. Microbiol. 2008, 6, 579–591. [Google Scholar] [CrossRef]
  7. Conrad, R. The global methane cycle: Recent advances in understanding the microbial processes involved. Environ. Microbiol. Rep. 2009, 1, 285–292. [Google Scholar] [CrossRef]
  8. Utsumi, M.; Nojiri, Y.; Nakamura, T.; Nozawa, T.; Otsuki, A.; Takamura, N.; Watanabe, M.; Seki, H. Dynamics of dissolved methane and methane oxidation in dimictic Lake Nojiri during winter. Limnol. Oceanogr. 1998, 43, 10–17. [Google Scholar] [CrossRef]
  9. Murase, J.; Sakai, Y.; Sugimoto, A.; Okubo, K.; Sakamoto, M. Sources of dissolved methane in Lake Biwa. Limnology 2003, 4, 91–99. [Google Scholar] [CrossRef]
  10. Grossart, H.P.; Frindte, K.; Dziallas, C.; Eckert, W.; Tang, K.W. Microbial methane production in oxygenated water column of an oligotrophic lake. Proc. Natl. Acad. Sci. USA 2011, 108, 19657–19661. [Google Scholar] [CrossRef] [Green Version]
  11. Tang, K.W.; McGinnis, D.F.; Frindte, K.; Brüchert, V.; Grossart, H.P. Paradox reconsidered: Methane oversaturation in well-oxygenated lake waters. Limnol. Oceanogr. 2014, 59, 275–284. [Google Scholar] [CrossRef] [Green Version]
  12. Yao, M.; Henny, C.; Maresca, J.A. Freshwater bacteria release methane as a by-product of phosphorus acquisition. Appl. Environ. Microbiol. 2016, 82, 6994–7003. [Google Scholar] [CrossRef] [PubMed] [Green Version]
  13. Wang, Q.; Dore, J.E.; McDermott, T.R. Methylphosphonate metabolism by Pseudomonas sp. populations contributes to the methane oversaturation paradox in an oxic freshwater lake. Environ. Microbiol. 2017, 19, 2366–2378. [Google Scholar] [CrossRef] [PubMed]
  14. Bižić-Ionescu, M.; Ionescu, D.; Günthel, M.; Tang, K.W.; Grossart, H.P. Oxic methane cycling: New evidence for methane formation in oxic lake water. In Biogenesis of hydrocarbons: Handbook of Hydrocarbon and Lipid Microbiology; Stams, A.J.M., Sousa, D.Z., Eds.; Springer International Publishing: Cham, Switzerland, 2018; pp. 379–400. [Google Scholar]
  15. Khatun, S.; Iwata, T.; Kojima, H.; Fukui, M.; Aoki, T.; Mochizuki, S.; Naito, A.; Kobayashi, A.; Uzawa, R. Aerobic methane production by planktonic microbes in lakes. Sci. Total Environ. 2019, 696, 133916. [Google Scholar] [CrossRef]
  16. Karl, D.M.; Beversdorf, L.; Björkman, K.M.; Church, M.J.; Martinez, A.; Delong, E.F. Aerobic production of methane in the sea. Nat. Geosci. 2008, 1, 473–478. [Google Scholar] [CrossRef]
  17. Damm, E.; Helmke, E.; Thoms, S.; Schauer, U.; Nöthig, E.; Bakker, K.; Kiene, R.P. Methane production in aerobic oligotrophic surface water in the central Arctic Ocean. Biogeosciences 2010, 7, 1099–1108. [Google Scholar] [CrossRef] [Green Version]
  18. Bogard, M.J.; Del Giorgio, P.A.; Boutet, L.; Chaves, M.C.G.; Prairie, Y.T.; Merante, A.; Derry, A.M. Oxic water column methanogenesis as a major component of aquatic CH4 fluxes. Nat. Commun. 2014, 5, 5350. [Google Scholar] [CrossRef]
  19. Tang, K.W.; McGinnis, D.F.; Ionescu, D.; Grossart, H.P. Methane production in oxic lake waters potentially increases aquatic methane flux to air. Environ. Sci. Technol. Lett. 2016, 3, 227–233. [Google Scholar] [CrossRef] [Green Version]
  20. Encinas Fernández, J.; Peeters, F.; Hofmann, H. On the methane paradox: Transport from shallow water zones rather than in situ methanogenesis is the major source of CH4 in the open surface water of lakes. J. Geophys. Res. Biogeosciences 2016, 121, 2717–2726. [Google Scholar] [CrossRef] [Green Version]
  21. Donis, D.; Flury, S.; Stöckli, A.; Spangenberg, J.E.; Vachon, D.; McGinnis, D.F. Full-scale evaluation of methane production under oxic conditions in a mesotrophic lake. Nat. Commun. 2017, 8, 1661. [Google Scholar] [CrossRef] [Green Version]
  22. DelSontro, T.; del Giorgio, P.A.; Prairie, Y.T. No longer a paradox: The interaction between physical transport and biological processes explains the spatial distribution of surface water methane within and across lakes. Ecosystems 2018, 21, 1073–1087. [Google Scholar] [CrossRef]
  23. Schmale, O.; Wäge, J.; Mohrholz, V.; Wasmund, N.; Gräwe, U.; Rehder, G.; Labrenz, M.; Loick-Wilde, N. The contribution of zooplankton to methane supersaturation in the oxygenated upper waters of the central Baltic Sea. Limnol. Oceanogr. 2018, 63, 412–430. [Google Scholar] [CrossRef]
  24. Carini, P.; White, A.E.; Campbell, E.O.; Giovannoni, S.J. Methane production by phosphate-starved SAR11 chemoheterotrophic marine bacteria. Nat. Commun. 2014, 5, 4346. [Google Scholar] [CrossRef] [PubMed] [Green Version]
  25. Repeta, D.J.; Ferrón, S.; Sosa, O.A.; Johnson, C.G.; Repeta, L.D.; Acker, M.; Delong, E.F.; Karl, D.M. Marine methane paradox explained by bacterial degradation of dissolved organic matter. Nat. Geosci. 2016, 9, 884–887. [Google Scholar] [CrossRef]
  26. Bižić, M.; Klintzsch, T.; Ionescu, D.; Hindiyeh, M.Y.; Günthel, M.; Muro-Pastor, A.M.; Eckert, W.; Urich, T.; Keppler, F.; Grossart, H.-P. Aquatic and terrestrial cyanobacteria produce methane. Sci. Adv. 2020, 6, eaax5343. [Google Scholar] [CrossRef] [PubMed] [Green Version]
  27. Lenhart, K.; Klintzsch, T.; Langer, G.; Nehrke, G.; Bunge, M.; Schnell, S.; Keppler, F. Evidence for methane production by the marine algae Emiliania huxleyi. Biogeosciences 2016, 13, 3163–3174. [Google Scholar] [CrossRef] [Green Version]
  28. Baines, S.B.; Pace, M.L. The production of dissolved organic matter by phytoplankton and its importance to bacteria: Patterns across marine and freshwater systems. Limnol. Oceanogr. 1991, 36, 1078–1090. [Google Scholar] [CrossRef] [Green Version]
  29. Litchman, E.; de Tezanos Pinto, P.; Edwards, K.F.; Klausmeier, C.A.; Kremer, C.T.; Thomas, M.K. Global biogeochemical impacts of phytoplankton: A trait-based perspective. J. Ecol. 2015, 103, 1384–1396. [Google Scholar] [CrossRef] [Green Version]
  30. Wetzel, R.G. The phosphorus cycle. In Limnology lake and river ecosystems, 3rd ed.; Elsevier Academic Press: San Diego, CA, USA, 2001; pp. 239–288. [Google Scholar]
  31. Shinohara, R.; Iwata, T.; Ikarashi, Y.; Sano, T. Detection of 2-aminoethylphosphonic acid in suspended particles in an ultraoligotrophic lake: A two-dimensional nuclear magnetic resonance (2D-NMR) study. Environ. Sci. Pollut. Res. 2018, 25, 30739–30743. [Google Scholar] [CrossRef]
  32. Solórzano, L. Determination of ammonia in natural waters by phenolhypochlorite method. Limnol. Oceanogr. 1969, 14, 799–801. [Google Scholar] [CrossRef]
  33. Crumpton, W.G.; Isenhart, T.M.; Mitchell, P.D. Nitrate and organic N analyses with second-derivative spectroscopy. Limnol. Oceanogr. 1992, 37, 907–913. [Google Scholar] [CrossRef] [Green Version]
  34. Bendschneider, K.; Robinson, R.J. A new spectrophotometric method for the determination of nitrite in sea water. J. Mar. Res. 1952, 11, 87–96. [Google Scholar]
  35. Neal, C.; Neal, M.; Wickham, H. Phosphate measurement in natural waters: Two examples of analytical problems associated with silica interference using phosphomolybdic acid methodologies. Sci. Total Environ. 2000, 251–252, 511–522. [Google Scholar] [CrossRef]
  36. Kojima, H.; Iwata, T.; Fukui, M. DNA-based analysis of planktonic methanotrophs in a stratified lake. Freshw. Biol. 2009, 54, 1501–1509. [Google Scholar] [CrossRef]
  37. Tsutsumi, M.; Iwata, T.; Kojima, H.; Fukui, M. Spatiotemporal variations in an assemblage of closely related planktonic aerobic methanotrophs. Freshw. Biol. 2011, 56, 342–351. [Google Scholar] [CrossRef]
  38. Borrel, G.; Jézéquel, D.; Biderre-Petit, C.; Morel-Desrosiers, N.; Morel, J.P.; Peyret, P.; Fonty, G.; Lehours, A.C. Production and consumption of methane in freshwater lake ecosystems. Res. Microbiol. 2011, 162, 832–847. [Google Scholar] [CrossRef] [PubMed]
  39. Caporaso, J.G.; Kuczynski, J.; Stombaugh, J.; Bittinger, K.; Bushman, F.D.; Costello, E.K.; Fierer, N.; Pẽa, A.G.; Goodrich, J.K.; Gordon, J.I.; et al. QIIME allows analysis of high-throughput community sequencing data. Nat. Methods 2010, 7, 335–336. [Google Scholar] [CrossRef] [Green Version]
  40. Metcalf, W.W.; Griffin, B.M.; Cicchillo, R.M.; Gao, J.; Janga, S.C.; Cooke, H.A.; Circello, B.T.; Evans, B.S.; Martens-Habbena, W.; Stahl, D.A.; et al. Synthesis of methylphosphonic acid by marine microbes: A source for methane in the aerobic ocean. Science 2012, 337, 1104–1107. [Google Scholar] [CrossRef] [Green Version]
  41. Burnham, K.P.; Anderson, D.R. Model Selection and Multi-Model Inference: A Practical Information—Theoretical Approach, 2nd ed.; Springer-Verlag: New York, NY, USA, 2002; pp. 1–488. [Google Scholar]
  42. Bartón, K. MuMIn: Model Selection and Model Averaging Base on Information Criteria. R Package Version 1.40.0. Available online: https://CRAN.R-project.org/package=MuMIn (accessed on 1 October 2017).
  43. Ripley, B.; Venables, B.; Bates, D.; Hornik, K.; Gebhardt, A.; Firth, D. MASS: Support Functions and Datasets for Venables and Ripley’s MASS. R Package Version 7.3-48. Available online: https://CRAN.R-project.org/package=MASS (accessed on 25 December 2017).
  44. Clarke, K.R.; Warwick, R.M. Change in Marine Communities: An Approach to Statistical Analysis and Interpretation, 2nd ed.; PRIMER-E Ltd.: Plymouth, UK, 2001. [Google Scholar]
  45. Oksanen, A.J.; Blanchet, F.G.; Kindt, R.; Legen, P.; Minchin, P.R.; Hara, R.B.O.; Simpson, G.L.; Solymos, P.; Stevens, M.H.H. Vegan: Community Ecology Package. R Package Version 2.4-5. Available online: https://CRAN.R-project.org/package= vegan (accessed on 1 December 2017).
  46. Nanny, M.A.; Minear, R.A. Characterization of soluble unreactive phosphorus using 31P nuclear magnetic resonance spectroscopy. Mar. Geol. 1997, 139, 77–94. [Google Scholar] [CrossRef]
  47. Williams, C.J.; Frost, P.C.; Morales-Williams, A.M.; Larson, J.H.; Richardson, W.B.; Chiandet, A.S.; Xenopoulos, M.A. Human activities cause distinct dissolved organic matter composition across freshwater ecosystems. Glob. Chang. Biol. 2016, 22, 613–626. [Google Scholar] [CrossRef]
  48. Corman, J.R.; Bertolet, B.L.; Casson, N.J.; Sebestyen, S.D.; Kolka, R.K.; Stanley, E.H. Nitrogen and phosphorus loads to temperate seepage lakes associated with allochthonous dissolved organic carbon loads. Geophys. Res. Lett. 2018, 45, 5481–5490. [Google Scholar] [CrossRef]
  49. Maranger, R.; Jones, S.E.; Cotner, J.B. Stoichiometry of carbon, nitrogen, and phosphorus through the freshwater pipe. Limnol. Oceanogr. Lett. 2018, 3, 89–101. [Google Scholar] [CrossRef]
  50. Taylor, P.G.; Townsend, A.R. Stoichiometric control of organic carbon-nitrate relationships from soils to the sea. Nature 2010, 464, 1178–1181. [Google Scholar] [CrossRef] [PubMed]
  51. Gomez-Garcia, M.R.; Davison, M.; Blain-Hartnung, M.; Grossman, A.R.; Bhaya, D. Alternative pathways for phosphonate metabolism in thermophilic cyanobacteria from microbial mats. ISME J. 2011, 5, 141–149. [Google Scholar] [CrossRef] [PubMed]
  52. Tsuji, K.; Maruo, M.; Obata, H. Determination of trace methylphosphonate in natural waters by ion chromatography. Bunseki Kagaku 2019, 68, 275–278. [Google Scholar] [CrossRef]
  53. Tilman, D.; Kiesling, R.; Sterner, R.; Kilham, S.S.; Johnson, F.A. Green, bluegreen and diatom algae: Taxonomic differences in competitive ability for phosphorus, silicon and nitrogen. Arch. für Hydrobiol. 1986, 106, 473–485. [Google Scholar]
  54. Agawin, N.S.R.; Duarte, C.M.; Agustí, S. Nutrient and temperature control of the contribution of picoplankton to phytoplankton biomass and production. Limnol. Oceanogr. 2000, 45, 591–600. [Google Scholar] [CrossRef]
  55. Serizawa, H.; Amemiya, T.; Rossberg, A.G.; Itoh, K. Computer simulations of seasonal outbreak and diurnal vertical migration of cyanobacteria. Limnology 2008, 9, 185–194. [Google Scholar] [CrossRef]
  56. Woolway, R.I.; Merchant, C.J. Worldwide alteration of lake mixing regimes in response to climate change. Nat. Geosci. 2019, 12, 271–276. [Google Scholar] [CrossRef]
  57. Tranvik, L.J.; Downing, J.A.; Cotner, J.B.; Loiselle, S.A.; Striegl, R.G.; Ballatore, T.J.; Dillon, P.; Finlay, K.; Fortino, K.; Knoll, L.B.; et al. Lakes and reservoirs as regulators of carbon cycling and climate. Limnol. Oceanogr. 2009, 54, 2298–2314. [Google Scholar] [CrossRef] [Green Version]
  58. Stanley, E.H.; Casson, N.J.; Christel, S.T.; Crawford, J.T.; Loken, L.C.; Oliver, S.K. The ecology of methane in streams and rivers: Patterns, controls, and global significance. Ecol. Monogr. 2016, 86, 146–171. [Google Scholar] [CrossRef]
Figure 1. Vertical profiles of dissolved CH4 concentrations in the nine study lakes of Japan during the July to September in 2016–2017 period. AS: Lake Ashinoko, MO: Lake Motosu, SA: Lake Saiko, AO: Lake Aoki, NO: Lake Nojiri, CH: Lake Chuzenji, HI: Lake Hibara, TO: Lake Toya, SH: Lake Shikotsu. Red and gray circles refer to the dissolved methane (nM) and oxygen (%) concentrations, respectively. Dotted lines denote the atmospheric equilibrium concentration of dissolved CH4 in lake water (3.7–7.2 nM). Shaded areas denote the range of the thermocline.
Water 12 00402 g001
Figure 2. Relationships between environmental variables and dissolved CH4 concentrations in the study lakes. Univariate regression lines are shown for the explanatory variables that were retained in the best generalized linear models (GLMs) with a gamma distribution of the response variable. □: Lake Ashinoko, ○: Lake Motosu, △: Lake Saiko, ◇: Lake Aoki, ▽: Lake Nojiri, ◆: Lake Chuzenji, ■: Lake Hibara, ●: Lake Toya, ▲: Lake Shikotsu.
Water 12 00402 g002
Figure 3. Relationships between dissolved organic carbon (DOC) and chemical variables in the study lakes. Univariate regression lines estimated by the best GLMs with a gamma distribution of the response variable (y) are shown. See the legend for Figure 2 for a description of the symbols.
Water 12 00402 g003
Figure 4. Taxonomic composition of bacterioplankton in the study lakes revealed by 16S rRNA amplicon sequencing analyses (A) and the result of non-metric multidimensional scaling (NMDS_ analysis for the relationship between lake physicochemical variables and the community composition of planktonic bacteria (B). See the legend for Figure 2 for the abbreviations of lake names appearing in panel (A). Red, blue and orange symbols refer to the bacterioplankton samples obtained from the epilinmion, metalimnion, and hypolinmion, respectively.
Water 12 00402 g004
Figure 5. Relationships between the dissolved CH4 concentration and the cell density of microbial communities in study lakes. EUB338, bacteria; Mg84 + Mg705, type-I methane-oxidizing bacteria; 405_Syn, Synechococcus; ARCH915, Archaea (see Table S4). GLM with a Gaussian error distribution and an identity link function was used for the variables, while regression lines shown when significant (p < 0.05). See the legend for Figure 2 for a description of the symbols.
Water 12 00402 g005
Figure 6. Vertical distribution of Synechococcus density (red circles) in relation to the dissolved CH4 profile (blue circles) in the study lakes. Shaded areas denote the range of the thermocline.
Water 12 00402 g006
Figure 7. Relationships between lake environmental variables and the peak subsurface methane maximum (SMM) for the study lakes. For the relationships of both dissolved inorganic nitrogen (DIN) and TN/TP, the regression lines were estimated using generalized linear models (GLMs) with a gamma error distribution and an inverse link function for each variable, while the GLM with a Gaussian error distribution and an identity link function was used for the other variables. For explanatory variables, the values at the peak SMM depths were used for the analyses.
Water 12 00402 g007
Figure 8. Two-dimensional (1H-31P) NMR microscopy for suspended particles collected from the metalimnion showed the presence of phosphonate compounds (black spot inside the red circles) in the metalimnion of Lake Toya.
Water 12 00402 g008
Figure 9. Effects of the stoichiometric balance between DIN and DOC on nitrogen availability, Synechococcus density and dissolved CH4 concentration in the study lakes. See the legend for Figure 2 for a description of the symbols.
Water 12 00402 g009

