Climatic Trends of West Virginia: A Representative Appalachian Microcosm


1
Institute of Water Security and Science, West Virginia University, Agricultural Sciences Building, Morgantown, WV 26506, USA
2
Davis College, Schools of Agriculture and Food, and Natural Resources, West Virginia University, 3109 Agricultural Sciences Building, Morgantown, WV 26506, USA
*
Authors to whom correspondence should be addressed.
Water 2019, 11(6), 1117; https://doi.org/10.3390/w11061117
Submission received: 18 March 2019
/
Revised: 22 May 2019
/
Accepted: 24 May 2019
/
Published: 28 May 2019
(This article belongs to the Special Issue Integrated Water Resources Research: Advancements in Understanding to Improve Future Sustainability)
Abstract
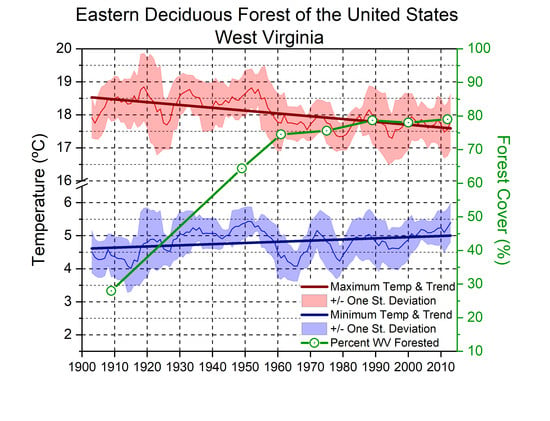
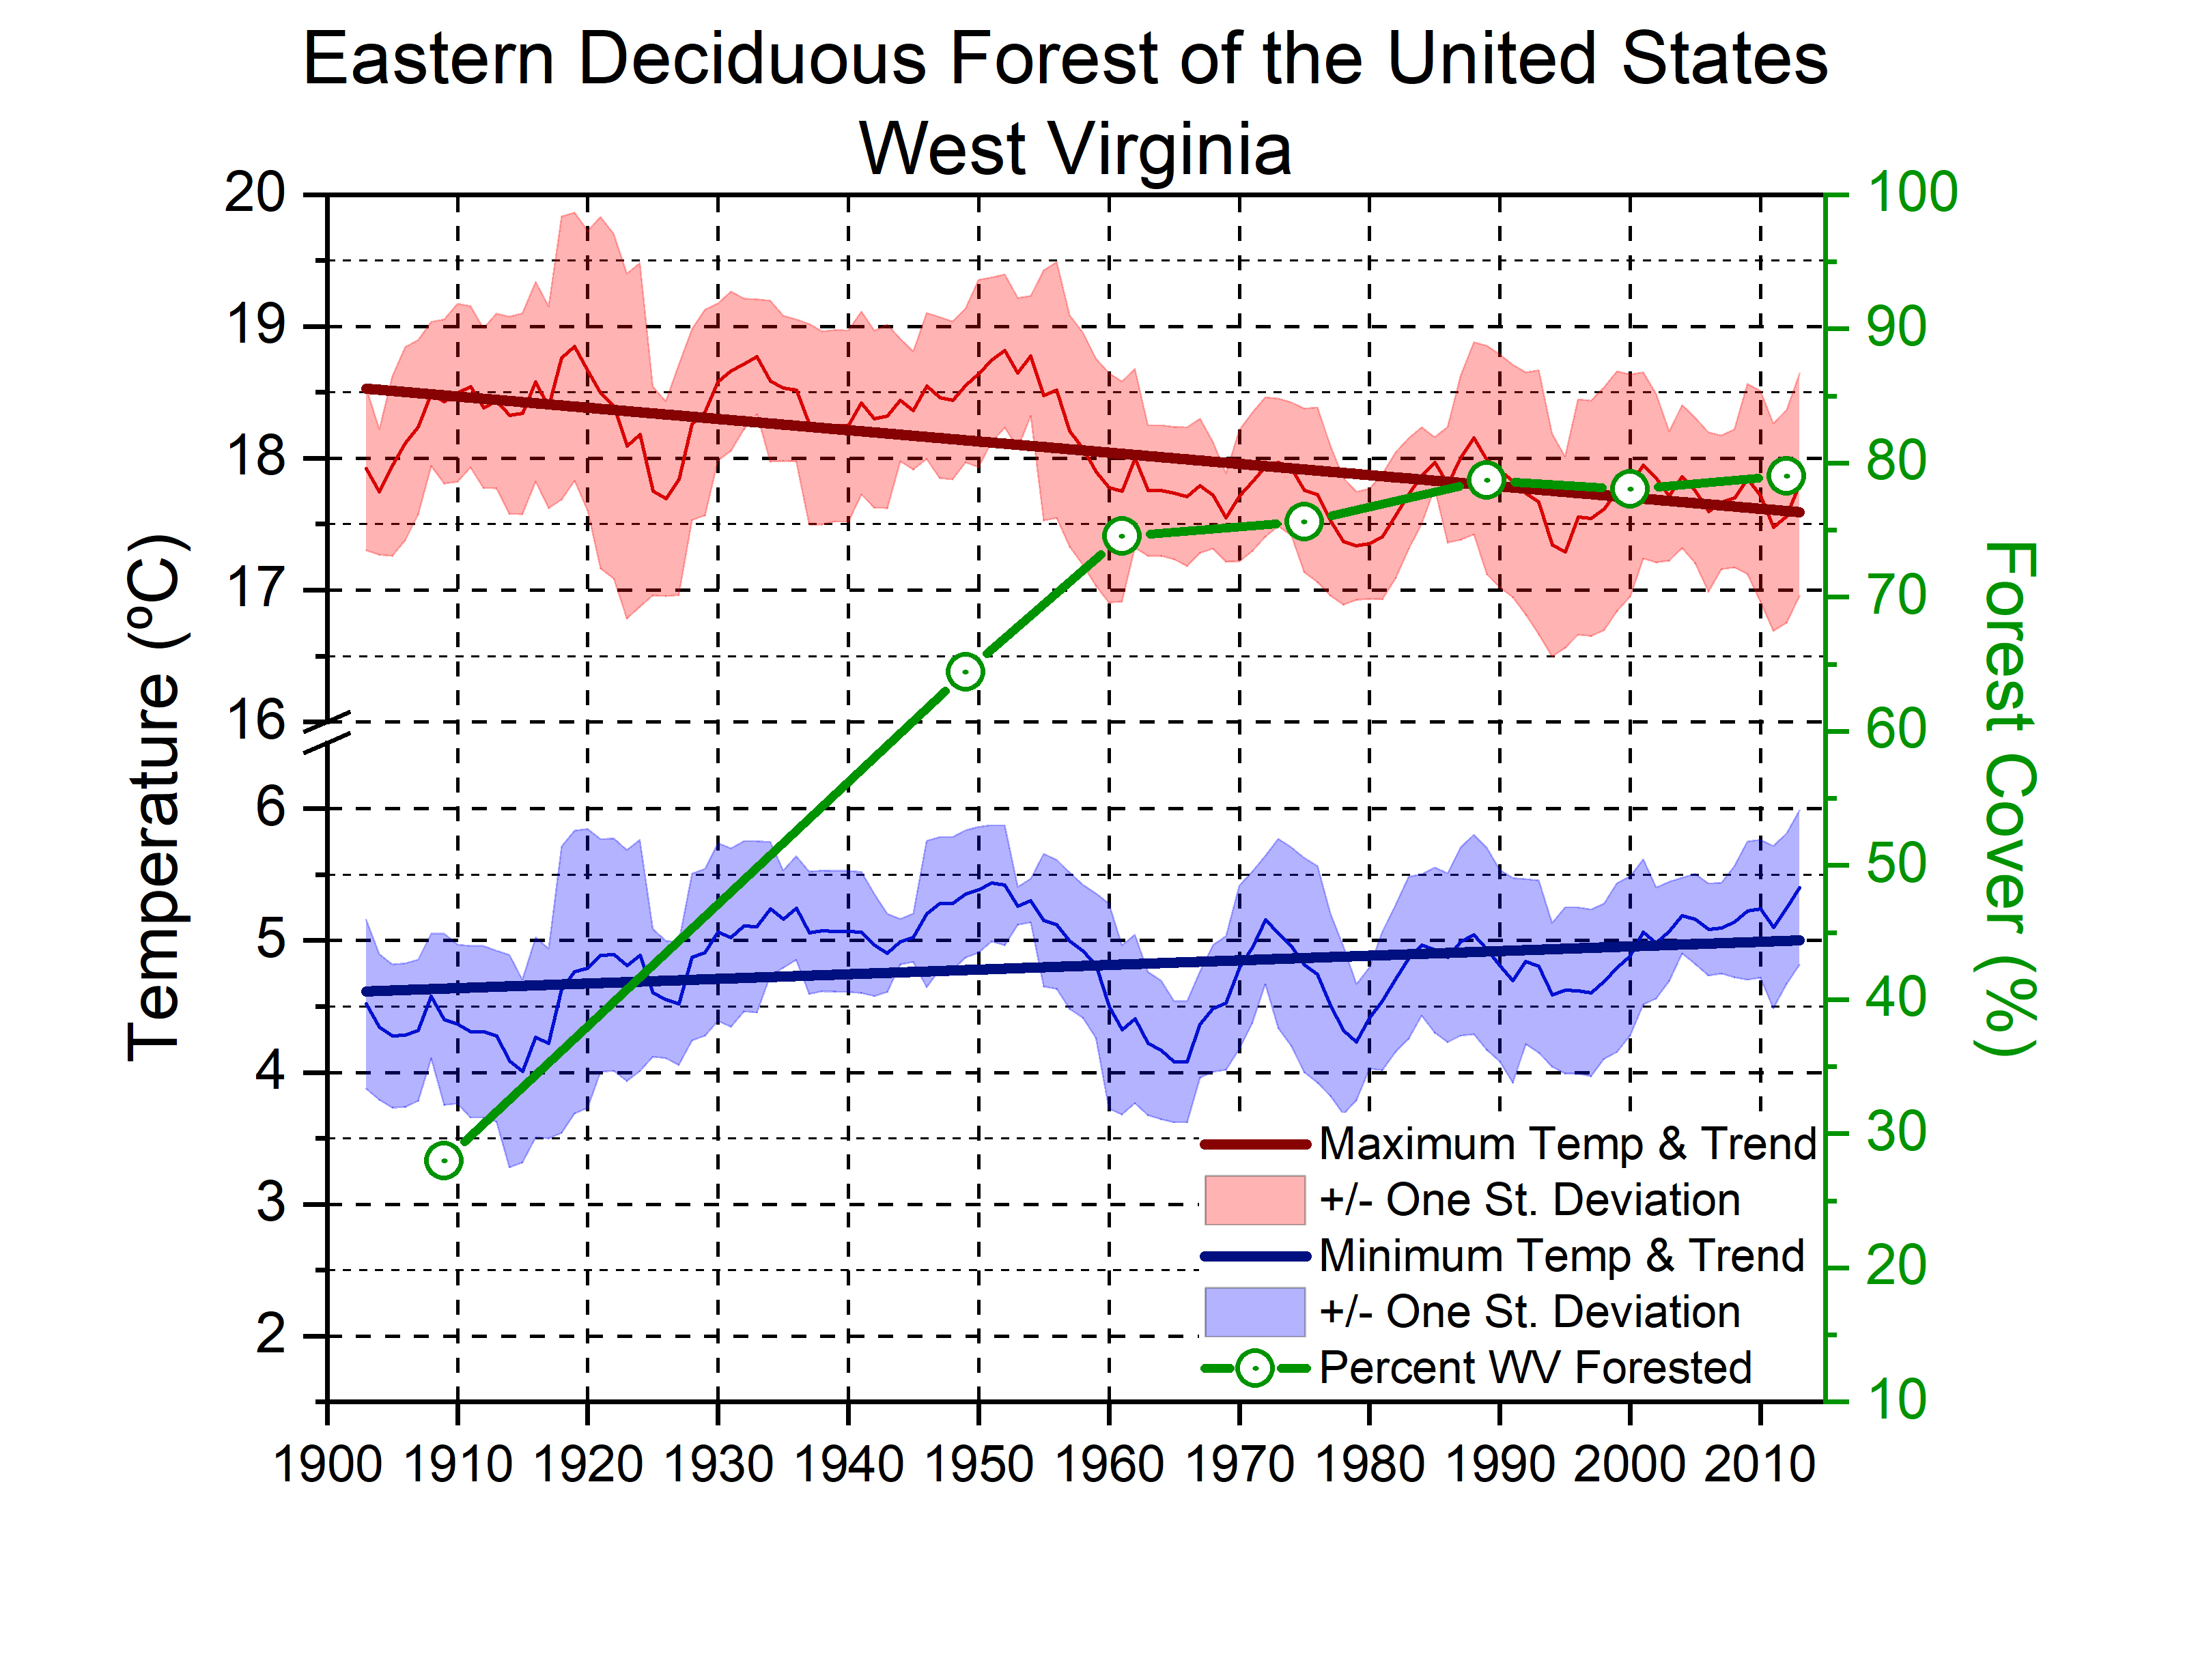
:During the late 19th and very early 20th centuries widespread deforestation occurred across the Appalachian region, USA. However, since the early 20th century, land cover rapidly changed from predominantly agricultural land use (72%; 1909) to forest. West Virginia (WV) is now the USA’s third most forested state by area (79%; 1989–present). It is well understood that land cover alterations feedback on climate with important implications for ecology, water resources, and watershed management. However, the spatiotemporal distribution of climatic changes during reforestation in WV remains unclear. To fill this knowledge gap, daily maximum temperature, minimum temperature, and precipitation data were acquired for eighteen observation sites with long periods of record (POR; ≥77 years). Results indicate an increasingly wet and temperate WV climate characterized by warming summertime minimum temperatures, cooling maximum temperatures year-round, and increased annual precipitation that accelerated during the second half (1959–2016) of the POR. Trends are elevation dependent and may be accelerating due to local to regional ecohydrological feedbacks including increasing forest age and density, changing forest species composition, and increasing globally averaged atmospheric moisture. Furthermore, results imply that excessive wetness may become the primary ecosystem stressor associated with climate change in the USA’s rugged and flood prone Appalachian region. The Appalachian region’s physiographic complexity and history of widespread land use changes makes climatic changes particularly dynamic. Therefore, mechanistic understanding of micro- to mesoscale climate changes is imperative to better inform decision makers and ensure preservation of the region’s rich natural resources.
1. Introduction
During the late 19th to early 20th century West Virginia (WV) was the frontier of American industrial capitalism where the rich natural resources of the Mountain State, especially timber and coal, were exploited for the benefit of aggressively populating eastern cities [1,2]. In 1880, it was estimated that two thirds of WV was covered by ancient growth hardwood forest [2], but by 1909 approximately 72% of WV was agriculture or pasture lands [3]. Widespread logging created a landscape characterized by vast acreages of dried slash that were easily ignited by passing locomotives [3] and burned with unusual intensity during dry periods [4]. By the 1920s, most lumbermen abandoned WV for lands further south and west [2] and extensive fire prevention efforts resulted in the redevelopment of vast hardwood forests [4]. When the first United States (US) Forest Service forest survey of WV was completed in 1949 an estimated 64% of WV lands were forested, which increased to 75% by the 1961 forest survey [5] and was relatively steady (75% to 79%) through 2012 [6]. Despite relatively steady areal coverage since the 1961 forest survey, timber volume increased through 2012 consistent with a maturing forest ecosystem [6]. Given the magnitude of reforestation throughout the broader Appalachian region, WV is an ideal location to assess how the regrowth of native forests may have influenced (or been influenced by) local to regional climatic trends.
Changes in land use and land cover (LULC) alters radiative (e.g., absorption and reflection) and non-radiative (e.g., surface roughness and evapotranspiration) climate forcing that influence spatial and temporal patterns of temperature and precipitation [7,8]. Few studies have focused on climatic influence of reforestation in the northeast US and studies utilizing observations are less frequent than modeling efforts [7,9]. Considering results of model and observation based analyses are contradictory [7,9], spatiotemporal analysis of the climatic influence of extensive reforestation over a long period of record (POR) is needed in WV and other similar regions globally. For example, spatiotemporal patterns in minimum temperature, maximum temperature, and precipitation trends are valuable to agricultural interests [10], natural resource managers (i.e., water, land, energy, wildlife; [11,12]), and other public and private stakeholders. More specifically, spatiotemporal climatic analyses are needed to better understand and prepare for terrestrial ecosystem vulnerabilities that may impact habitat suitability, human health, and food security [12]. Impacts to human health and food security are particularly relevant to West Virginia given the broader Appalachian region classification as a food desert (i.e., low income and limited access to fresh produce) by the US Department of Agriculture, Food and Nutrition Services [13]. Quantifying spatiotemporal climatic changes within WV will guide future climatic analyses, inform natural resource management decisions, and help preserve WV’s diverse terrestrial ecosystem.
West Virginia’s climate, water resources, and ecology are intricately linked and all three are influenced by WV’s complex terrain. Elevation gradually increases from the Ohio River (~300 m) on the western border of WV to the ridges of the Allegheny Mountains (>1000 m) in the eastern third of WV. Annual average precipitation is approximately 100 cm across the far western portions of the state (Wheeling, WV; 102.6 cm), gradually increasing to near 150 cm at the highest elevations (Snowshoe Mountain, WV; 152.1 cm), and abruptly decreases to near 90 cm immediately east of the Allegheny Mountains (Franklin, WV; 91.5 cm; [14]). Complex climatic gradients resulting from WV’s rugged terrain make the Monongahela National Forest, located in the Allegheny Mountains, one of the most ecologically diverse forests in the US National Forest System [15]. Stands of red spruce and populations of snowshoe hare, more typical of northern boreal forests, occur at higher elevations in WV. Localized cold air traps (i.e., deep rock crevices, talus slopes, and caves) provide refugium for organisms adapted to survival in cold and dark environments (e.g., bacteria and fungi; [16]). Drier east-facing slopes located east of the Allegheny ridges support prickly pear cactus and rare plant species including the shale barren rock cress [15]. Lowland locations, including mountain valleys, are characterized by stands of mixed hardwoods growing in relatively deep and rich soils more typical of southern Appalachia. Coupling of WV’s climatic gradients, biodiversity, and physiography suggests an opportunity to manage WV’s water resources using an integrated and multidisciplinary approach. However, before management practices can be advanced, investigation of spatiotemporal climatic changes during and after severe and widespread anthropogenic disturbance (e.g., deforestation and reforestation) is needed.
The overarching objective of the current work was to leverage state and federally funded WV climate observation datasets to quantify spatiotemporal characteristics of long-term (≥77 years) minimum temperature, maximum temperature, and daily precipitation trends across West Virginia, USA. Sub objectives included (a) assessing statistically significant (p < 0.05) trends using the Mann–Kendall trend test, (b) performing analyses during the first (1900–1958) and second (1959–2016) half of the time series, and (c) discussing the ecological and topographic dependence of climatic trends across WV.
2. Materials and Methods
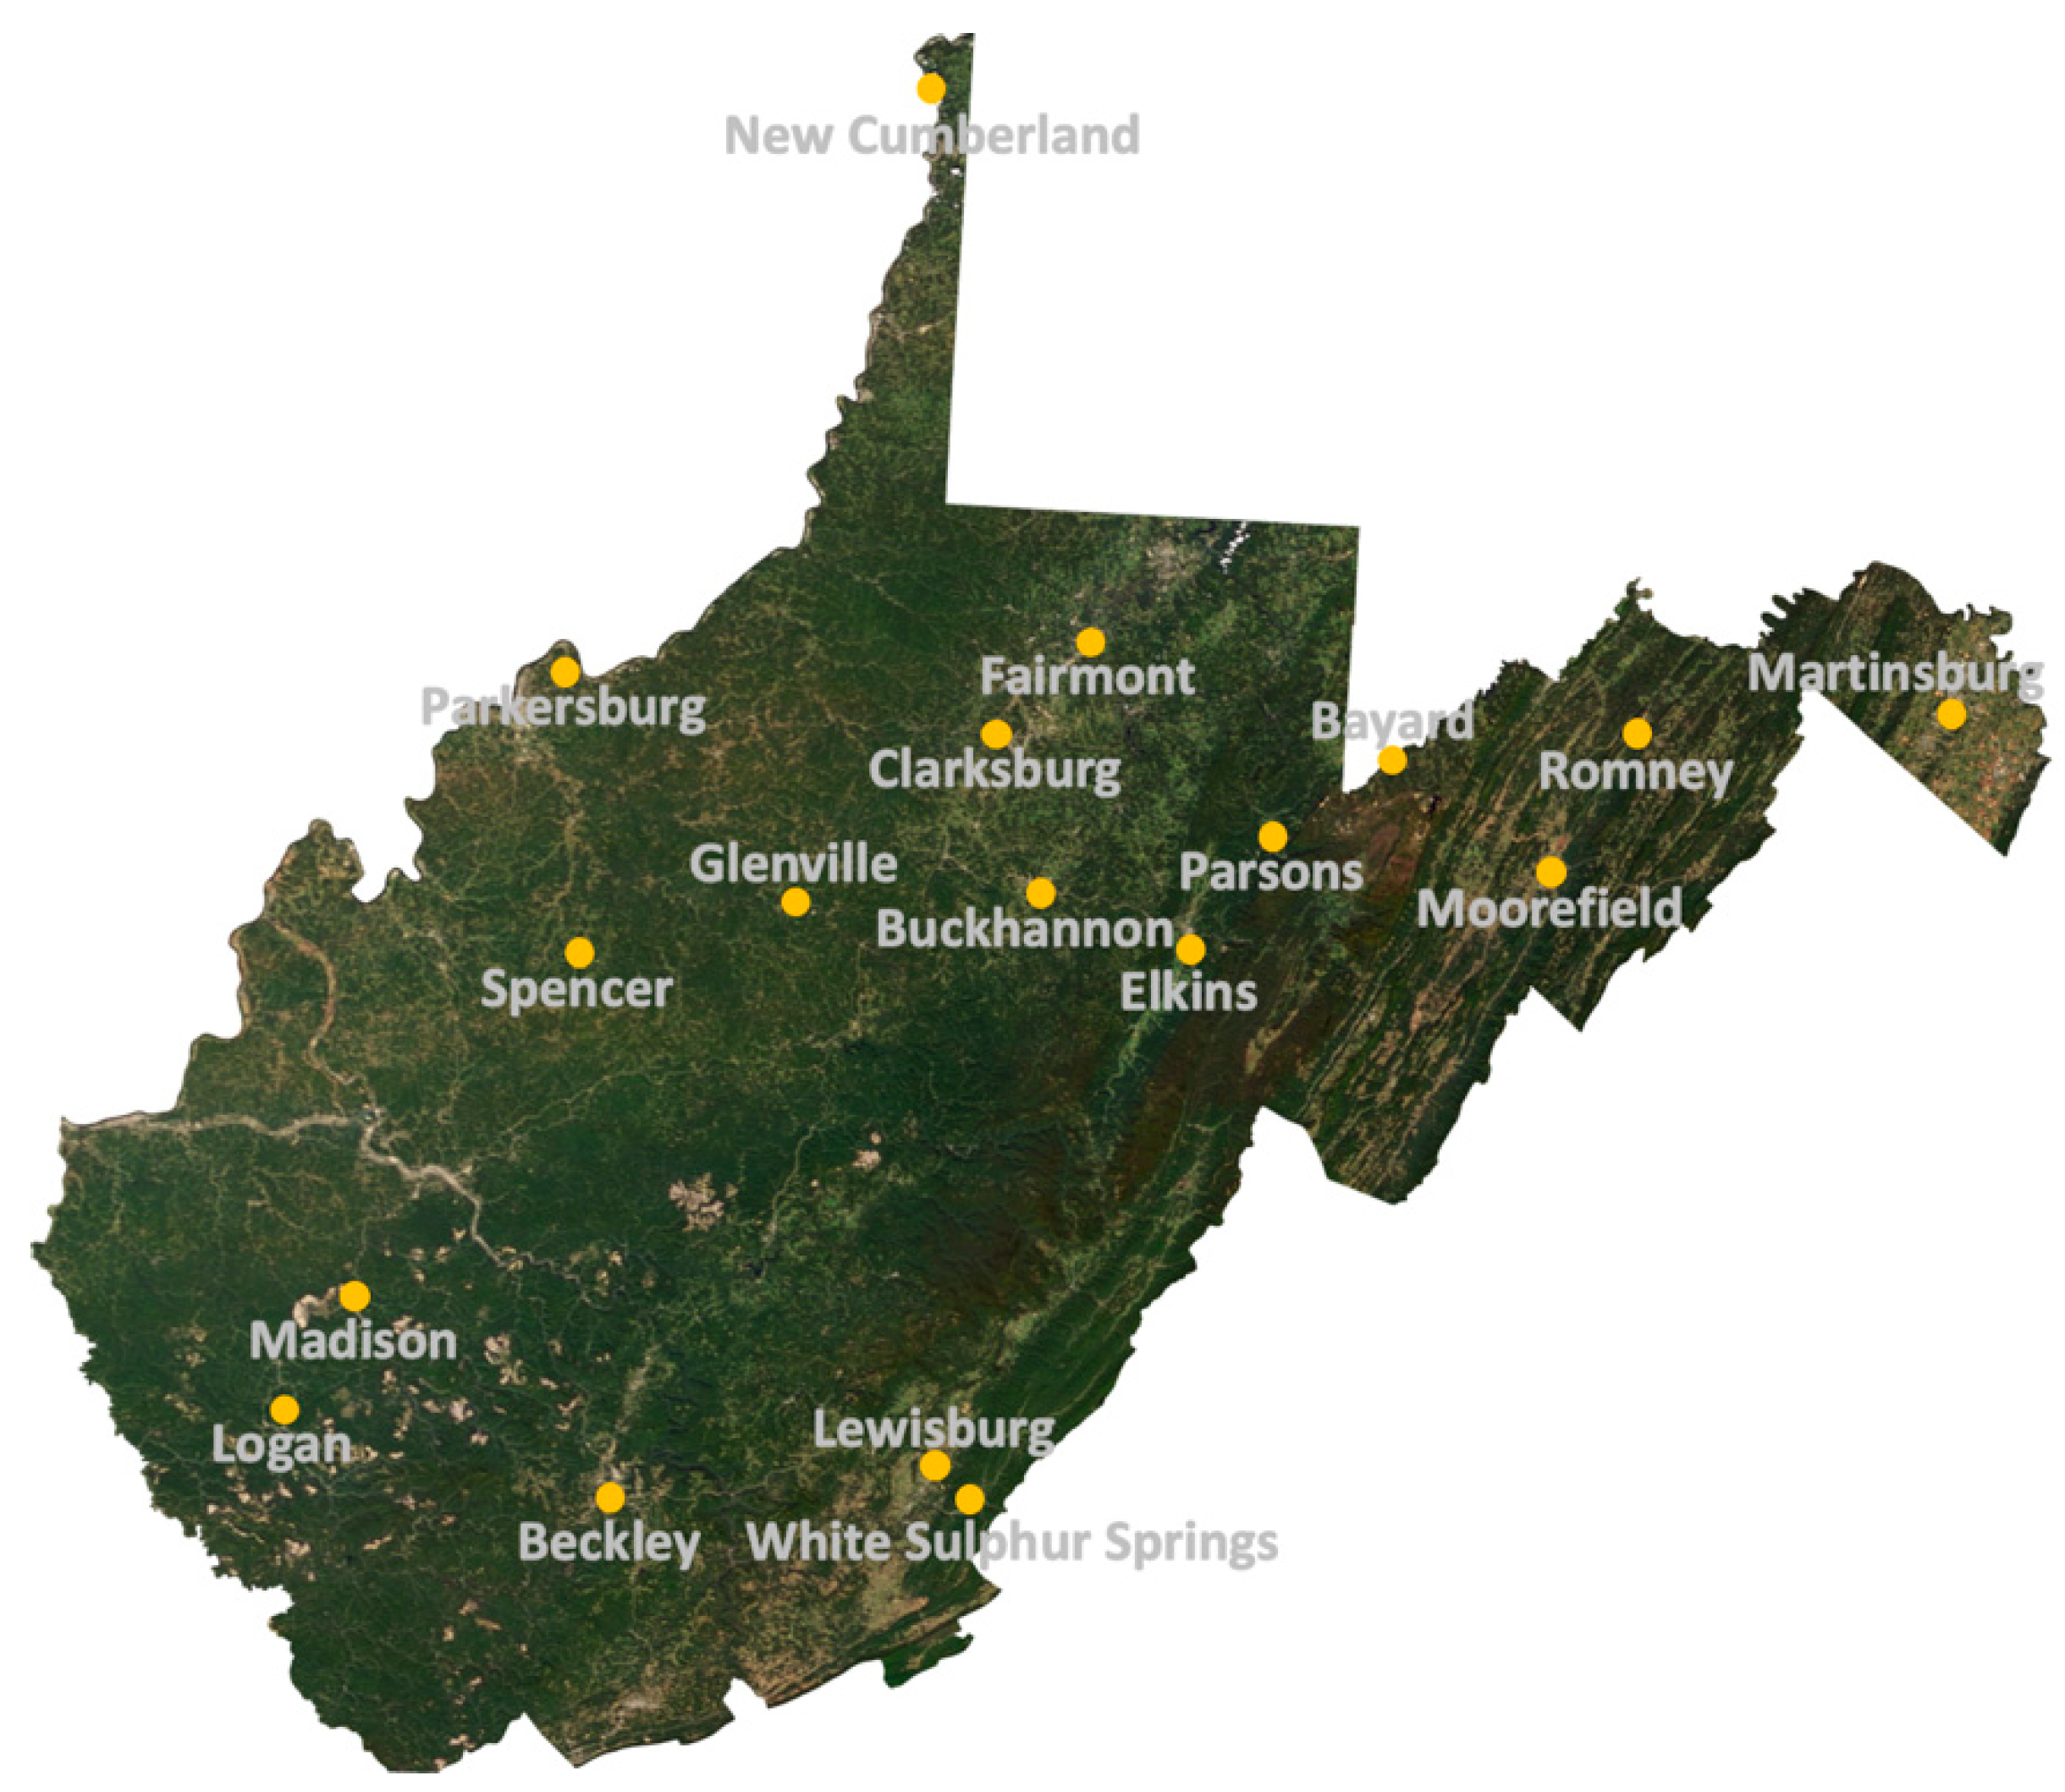
Daily summaries of total precipitation, maximum temperature, and minimum temperature were acquired from the National Center for Environmental Information (NCEI), a branch of the National Oceanic and Atmospheric Administration (NOAA; [17]). Stations were selected with start dates as early as 1900, but no later than 1930, with a nearly continuous time series through the end of 2016. These temporal criteria ensured analyses included the rapid transition from primarily agricultural and pasture lands in the early 20th century to primarily forested land coverage by the middle 20th century and subsequent forest maturation [3,6]. All leap days (i.e., February 29th) were excluded from analyses and daily data were post-processed to ensure all missing dates were included resulting in a continuous time series with 365 days in each year. Annual averages of daily summaries of maximum temperature, minimum temperature, and total precipitation were estimated and counts of missing data points were tabulated annually for each of the 18 selected stations. The spatial distribution of the 18 selected stations is shown in Figure 1 and additional site-specific data are included in Table 2. It was assumed that observers and their equipment followed station siting guidelines established by the United States Weather Bureau in 1890 (Fiebrich 2009). The World Meteorological Organization’s guidelines on missing data in the calculation of climatological normals recommends not calculating monthly averages when five or more daily values are missing [18], which scales to 60 or more daily values for annual averages. For the purposes of this work years with data gaps exceeding 15% of possible daily observations (>54 daily observations) were removed from analyses. Of 117 possible annual averages or totals, each observation location had between 77 and 110 annual averages for maximum and minimum temperature and between 84 and 110 annual precipitation totals.
Investigating temporal trends of the central tendency of a data series is of interest in the context of identifying a changing climate [20,21]. Sen’s slope estimator paired with the Mann–Kendall trend test is a robust, non-parametric method to estimate the linear trend and assess statistical significance [22] and was thus deemed appropriate for this work. Spatial characteristics of temporal trends were estimated and statistical significance (α = 0.05) assessed over the entire time series (1900–2016) and during the first (1900–1958) and second (1959–2016) halves of each time series at each observation location. Analyses for each half of the time series were performed because the data series was sufficiently long and the first half corresponded with reforestation whereas the second half corresponded with forest maturation and globally averaged warming exceeding 0.65 °C [4,5,6,23]. Except for New Cumberland (Table 1, Figure 1), each observation location had a more complete time series of each variable during the second half (93.8%) rather than the first half (71.7%) of the POR suggesting early data gaps (1900–1930) could have influenced results. As a result, the data should not be considered stationary and readers should use caution when extrapolating results into the future. Changes in temporal characteristics (i.e., seasonality) were estimated for all 365 days using a continuous time series of daily data averaged across all eighteen locations for the entire POR and the second half of the POR (1959–2016). Seasonal analyses were not performed for the first half of the POR due to larger and more frequent data gaps. For plotting purposes, centered three-week moving averages of daily Sen’s slope, upper and lower 95% confidence interval values were calculated to smooth day-to-day variability and better show seasonal changes of each variable. Centered moving averages (CMAs) represent a series of arithmetic means throughout a time series that is centered on the middle value (i.e., day 11 of the 21-day average). Three-week CMAs were selected because meteorological and astronomical definitions of seasonality are static in time and space and may be inadequate considering a swiftly changing climate [24]. Ultimately, the methods described in the current work are easily applied and provide valuable information about spatiotemporal changes in climate that are needed for effective decision making.
3. Results
3.1. Climate during Period of Record
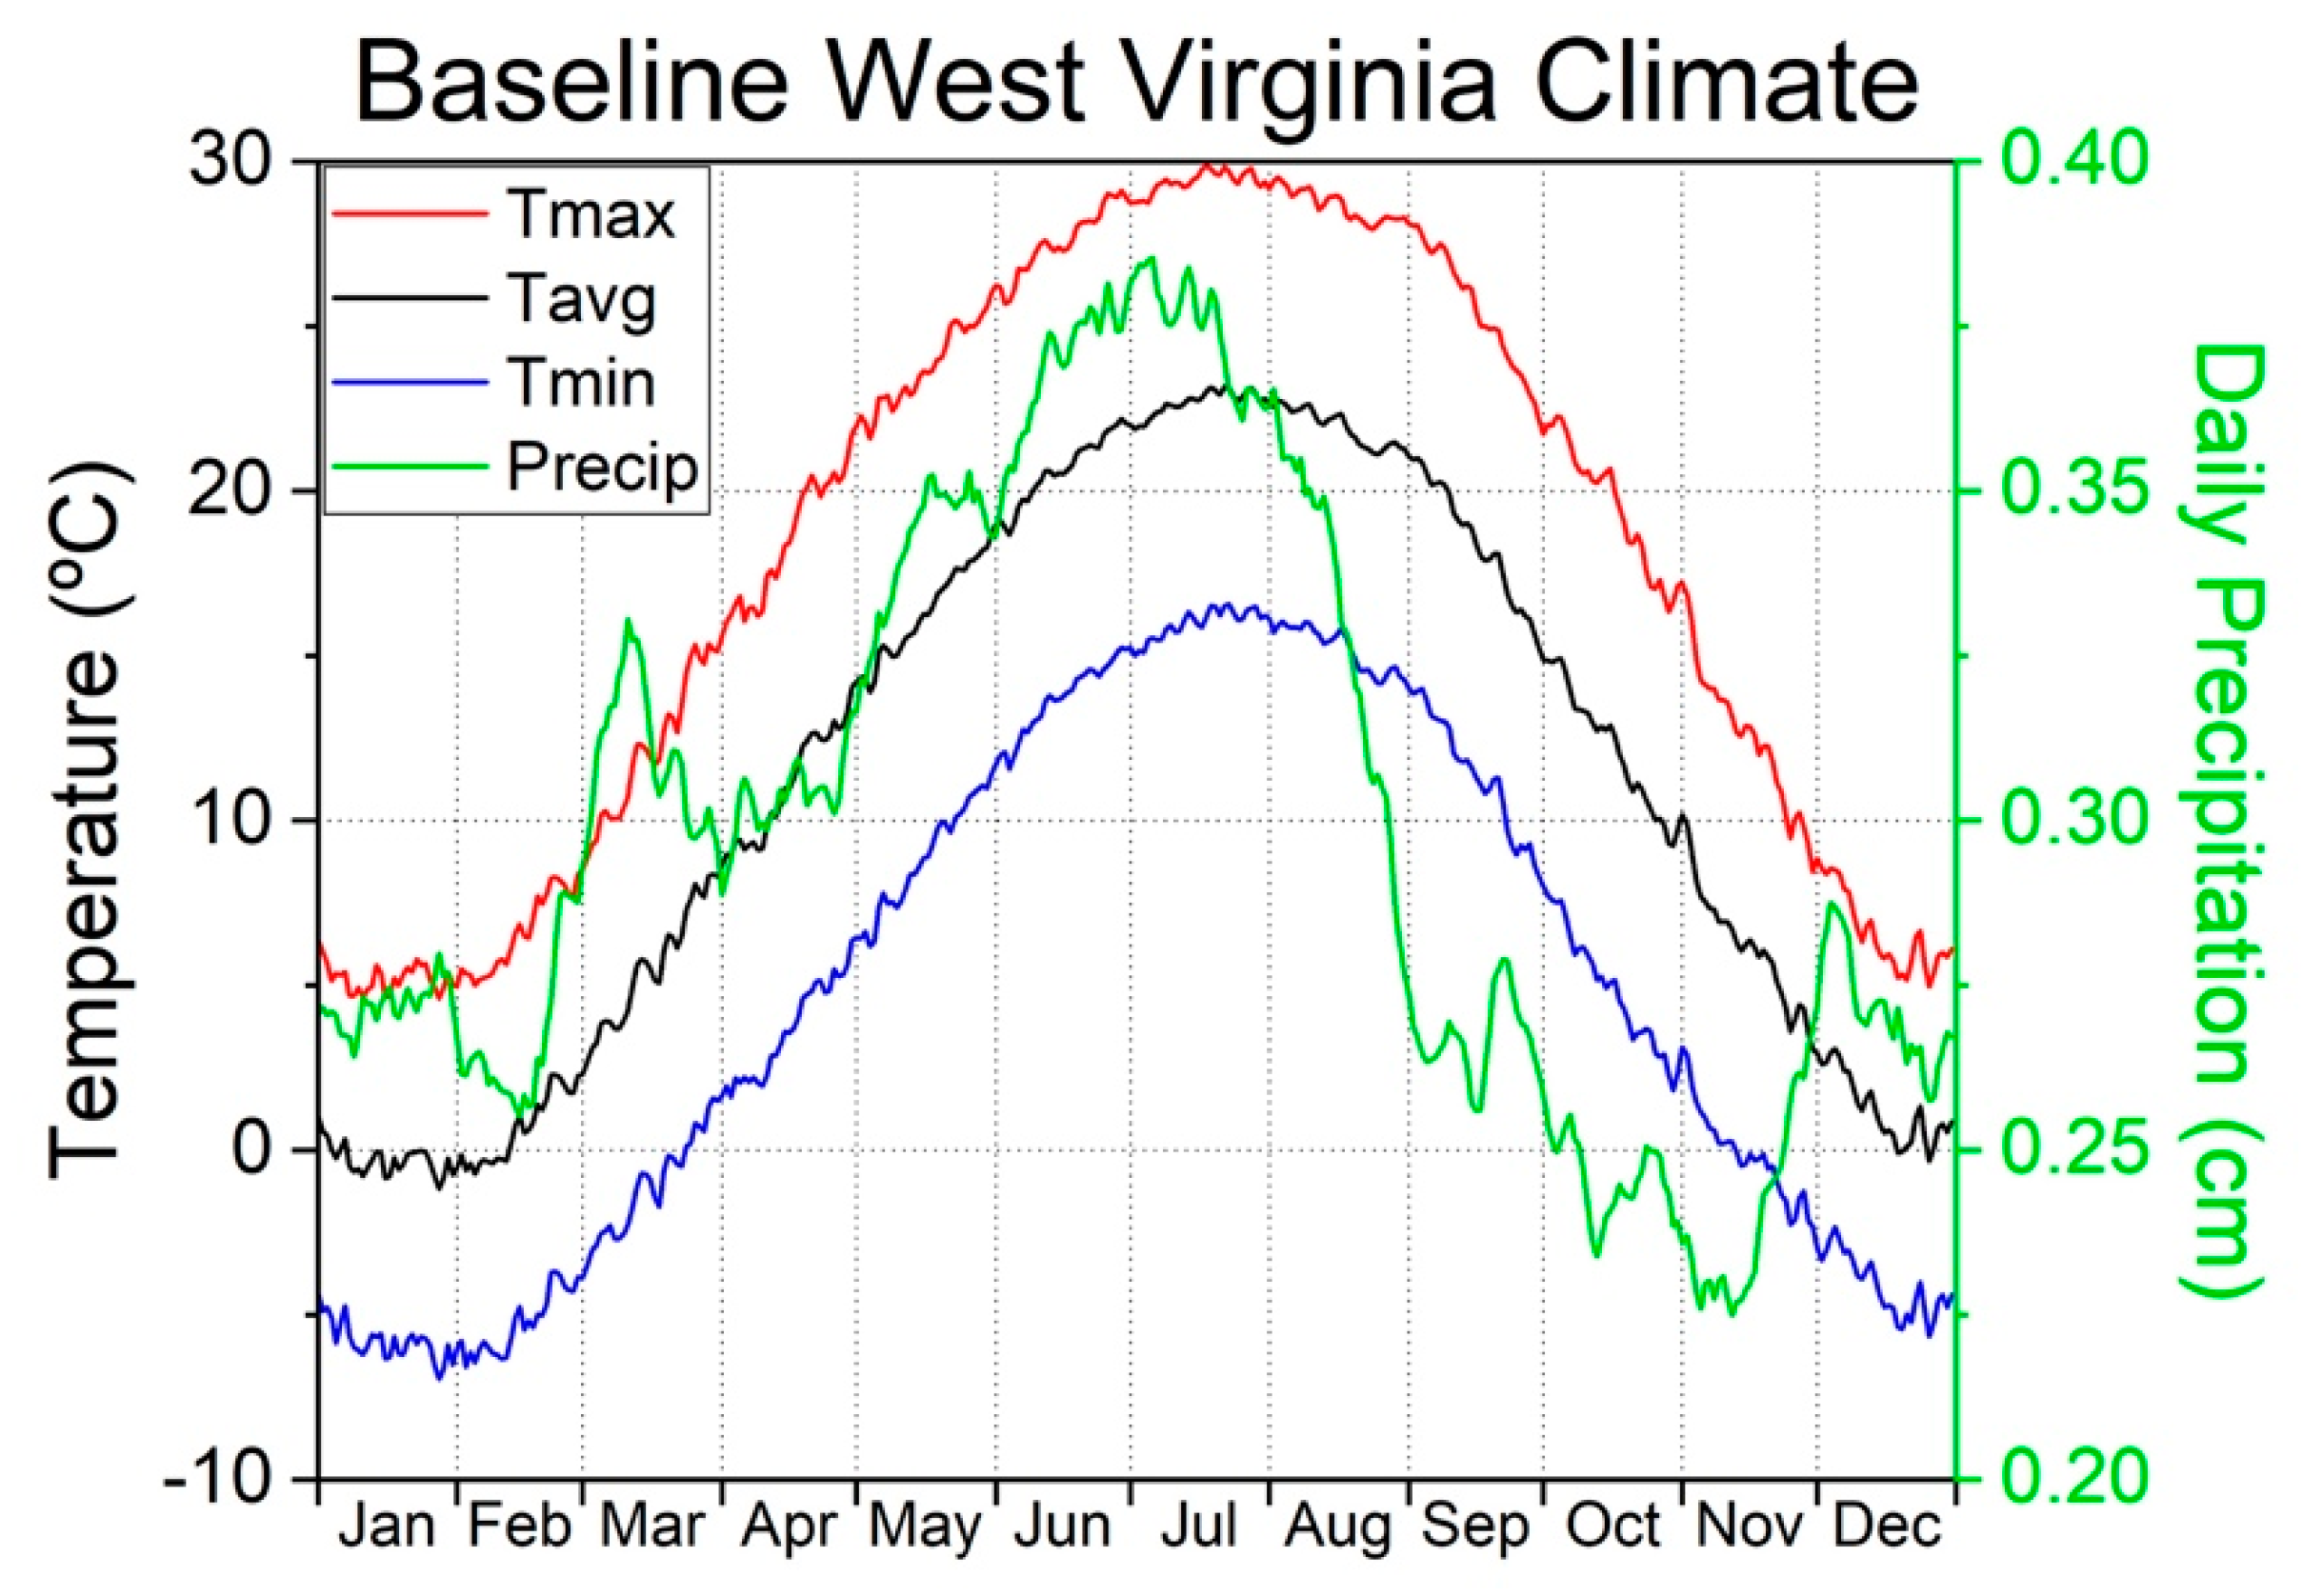
Monthly and daily averages of precipitation and maximum, minimum, and daily average temperatures are included in Table 1 and Figure 2, respectively. West Virginia’s (WV) wettest month of the year was July when an average of 11.7 cm of precipitation was observed during the period of record (Table 1). July was also WV’s warmest month of the year with a daily average temperature of 22.7 °C and average maximum and minimum temperatures of 29.4 °C and 16.0 °C, respectively. Alternatively, January was the coolest month with a daily average temperature of −0.3 °C and daily maximum and minimum temperatures of 5.2 °C and −5.8 °C, respectively. February, October, and November were similarly dry with each month averaging less than 7.5 cm of precipitation. At daily resolution, the warmest average maximum temperature was 29.9 °C on July 18th and the coolest average minimum temperature was −6.9 °C on January 28th (Figure 2). Maximum daily average precipitation occurred on July 10th with 0.49 cm day−1 and minimum daily average precipitation occurred on November 21st with 0.14 cm day−1 (not shown). Between 1900 and 2016, WV’s spatially averaged climate was cold with hot summers and no dry season (i.e., Köppen-Geiger Dfa; [25]).
3.2. Spatial Climatic Changes
The observation location, elevation, and POR for each selected site as well as trends in minimum temperature, maximum temperature, and total annual precipitation are summarized in Table 2 and shown spatially in Figure 3. Unless otherwise stated, estimated trends reported parenthetically represent trends averaged across observation sites with either positive or negative trends.
3.2.1. Entire Time Series (1900–2016)
Half of the eighteen observation sites in WV indicated a decreasing trend in minimum temperature (–0.05 °C/decade), while the other half indicated a greater increasing trend (0.08 °C/decade). Warming minimum temperatures were generally observed across the northern and southwestern portions of WV, but the two lowest elevation observation sites had the largest rate of warming (≥0.12 °C/decade) and trends were statistically significant (p < 0.00). Alternatively, thirteen observations sites spatially and topographically distributed across WV recorded decreasing trends (–0.14 °C/decade) in maximum temperatures. Three of the four largest negative trends (≤–0.20 °C/decade) were observed across north-central WV above the median station elevation (323 m) and all four of the largest negative trends were statistically significant (p < 0.00). Total annual precipitation increased (0.87 cm/decade) at twelve observation sites and decreased (–0.72 cm/decade) at the other six sites. The two sites with the largest increase (>1.5 cm/decade) and decrease (<–1 cm/decade) in annual precipitation were below and above the median elevation, respectively and all four trends were statistically significant (p < 0.03). In synthesis, annually averaged minimum temperatures increased more at lower elevations, maximum temperatures decreased more at higher elevations, and precipitation increased at lower elevations between 1900 and 2016 across WV.
3.2.2. First Half (1900–1958)
Twelve observation sites were characterized by increasing minimum temperatures (0.17 °C/decade) and the remaining six sites had decreasing minimum temperatures (−0.12 °C/decade). Just two sites below the median elevation had decreasing minimum temperatures and the two largest decreases (≤0.14 °C/decade), both statistically significant (p < 0.04), were found at higher elevations (604 and 722 m). Six of the twelve sites with positive minimum temperature trends were statistically significant (p < 0.02) and four of the six sites, including the largest positive trend (0.40 °C/decade), were below the median elevation. Ten of the observation sites indicated warming maximum temperature trends (0.20 °C/decade), the remaining eight sites indicated cooling (−0.15 °C/decade). Half of sites with observed warming and cooling maximum temperatures were above or below the median elevation. Seven observation sites indicated increasing trends in total annual precipitation (1.85 cm/decade) and eleven indicated decreasing trends (−2.70 cm/decade). Three of the eleven sites with decreasing trends were significant (p < 0.03) and all were above the median elevation. In summary, annually averaged minimum temperatures increased particularly at lower elevations, maximum temperatures increased, and precipitation decreased in WV between 1900 and 1958.
3.2.3. Second Half (1959–2016)
Fourteen climate observation sites indicated increasing minimum temperatures (0.22 °C/decade) and the remaining four sites indicated decreasing minimum temperatures (−0.10 °C/decade). Eight observation sites indicated increasing trends in annually averaged maximum temperatures (0.15 °C/decade) and ten observation sites indicated decreasing trends (−0.17 °C/decade). Half of all sites with observed warming or cooling minimum and maximum temperatures were above or below the median elevation, but sites with warming minimum (maximum) temperatures warmed 0.04 °C/decade (0.05 °C/decade) slower at higher elevation stations. Additionally, sites with cooling minimum (maximum) temperatures cooled −0.10 °C/decade (−0.08 °C/decade) faster at lower (higher) elevations. All eighteen observation sites indicated increasing trends (2.50 cm/decade) in total annual precipitation, but lower elevation sites had trends 1.09 cm/decade larger than higher elevation sites. Additionally, statistically significant (p < 0.05) increases in total annual precipitation were confined to observation locations below 400 meters in elevation across the western half of WV. As a result, minimum temperatures increased particularly at lower elevations, maximum temperatures decreased particularly at higher elevations, and precipitation increased state-wide with significant (p < 0.05) increases at lower elevations across western WV between 1959 and 2016.
3.3. Temporal Trends (1900–2016)
3.3.1. Entire Time Series (1900–2016)
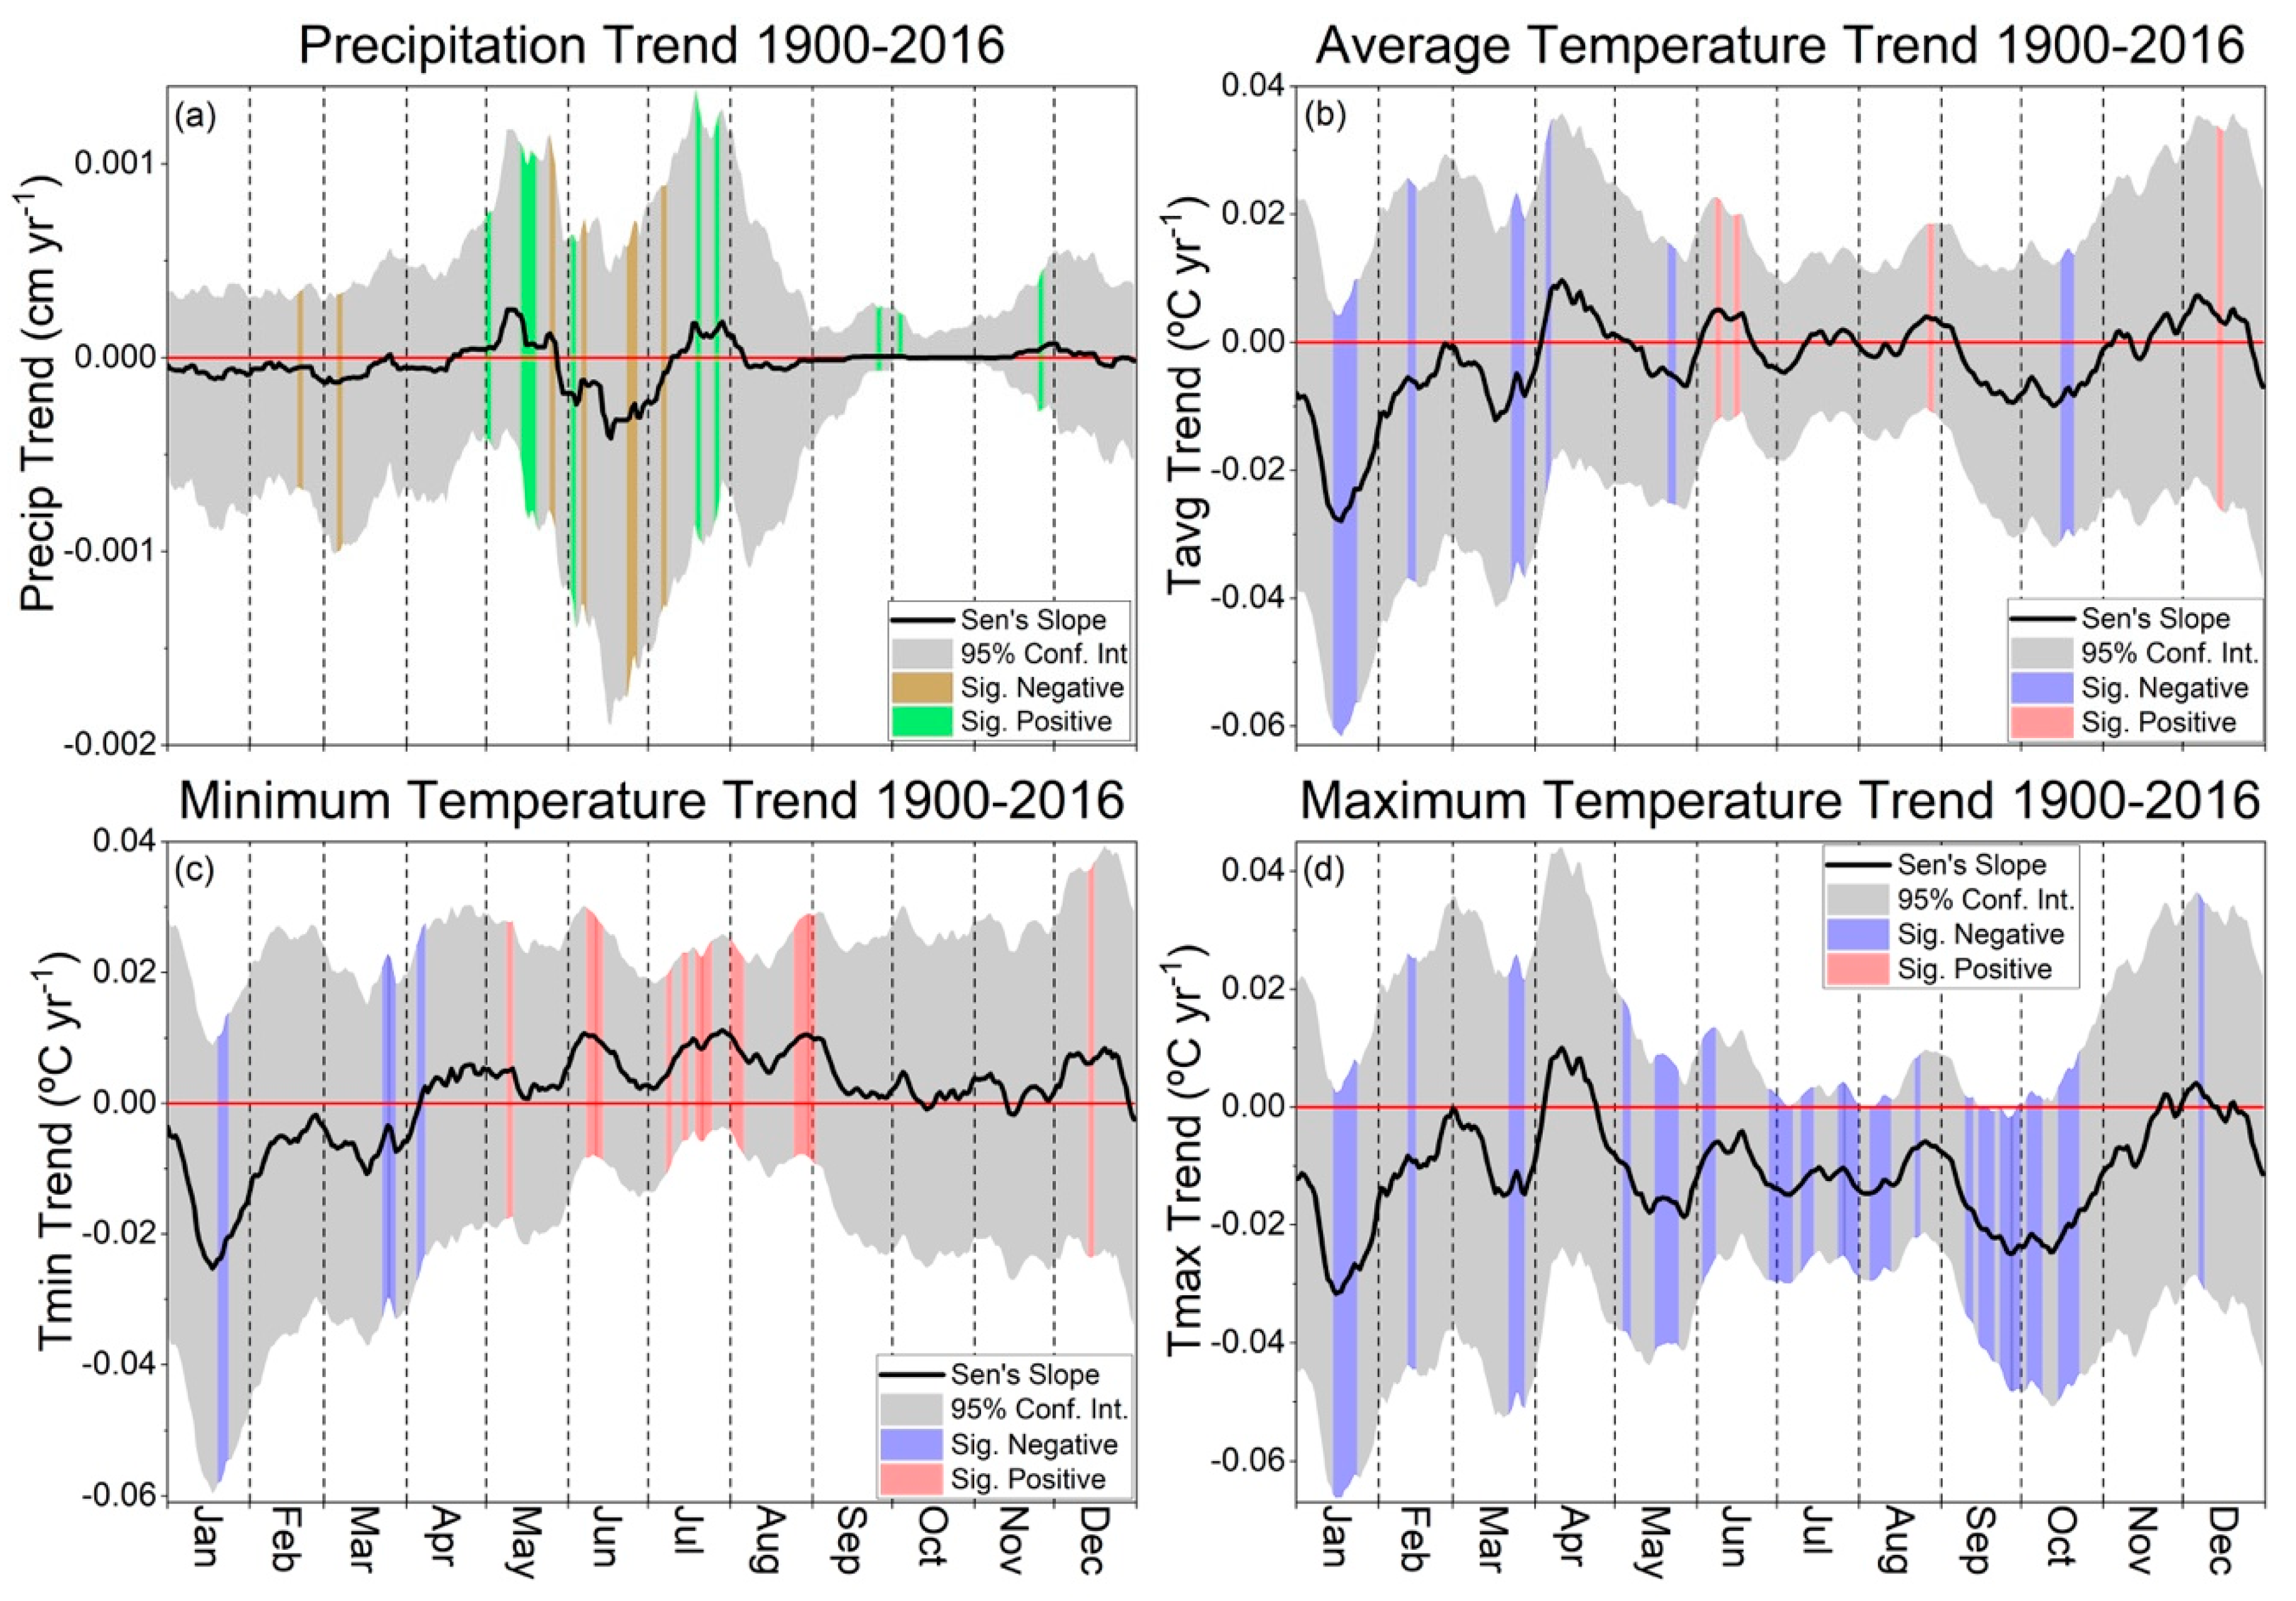
Centered three-week moving averages (CMAs) of state-averaged, daily precipitation and temperature trends are indicative of seasonal trends in WV (Figure 4). Daily precipitation trends were generally small (92% between ±0.0005 cm year−1), except for increases during May, decreases during June, and increases during July when 12 of the 17 significant (p < 0.05) daily trends occurred (Figure 4a). All but four of the 23 significant daily trends (p < 0.05) in average daily temperature were negative and the significant positive trends occurred in June, August, and December (Figure 4b). Daily average temperature trends were most negative during January (−0.021 °C year−1), October (−0.008 °C year−1), and March (−0.008 °C year−1) whereas April (0.006 °C year−1) and December (0.003 °C year−1) were most positive. Nineteen of the 26 significant (p < 0.05) daily minimum temperature trends were positive, especially during June, July, and August when sixteen significantly positive trends occurred (p < 0.05; Figure 4c). All seven significantly decreasing (p < 0.05) daily minimum temperature trends occurred between January 22nd and April 8th. All significant daily maximum temperature trends (n = 73) were negative, but CMAs were briefly positive during April, late November, and early December (Figure 4d). Between May and October, WV’s growing season, 79% of the significant (p < 0.05) negative maximum temperature trends occurred. In summary, daily precipitation trends were largest during May, June, and July; average temperatures decreased most during January; minimum temperatures increased most during June, July, and August; and maximum temperatures decreased year-round between 1900 and 2016.
3.3.2. Second Half (1959–2016)
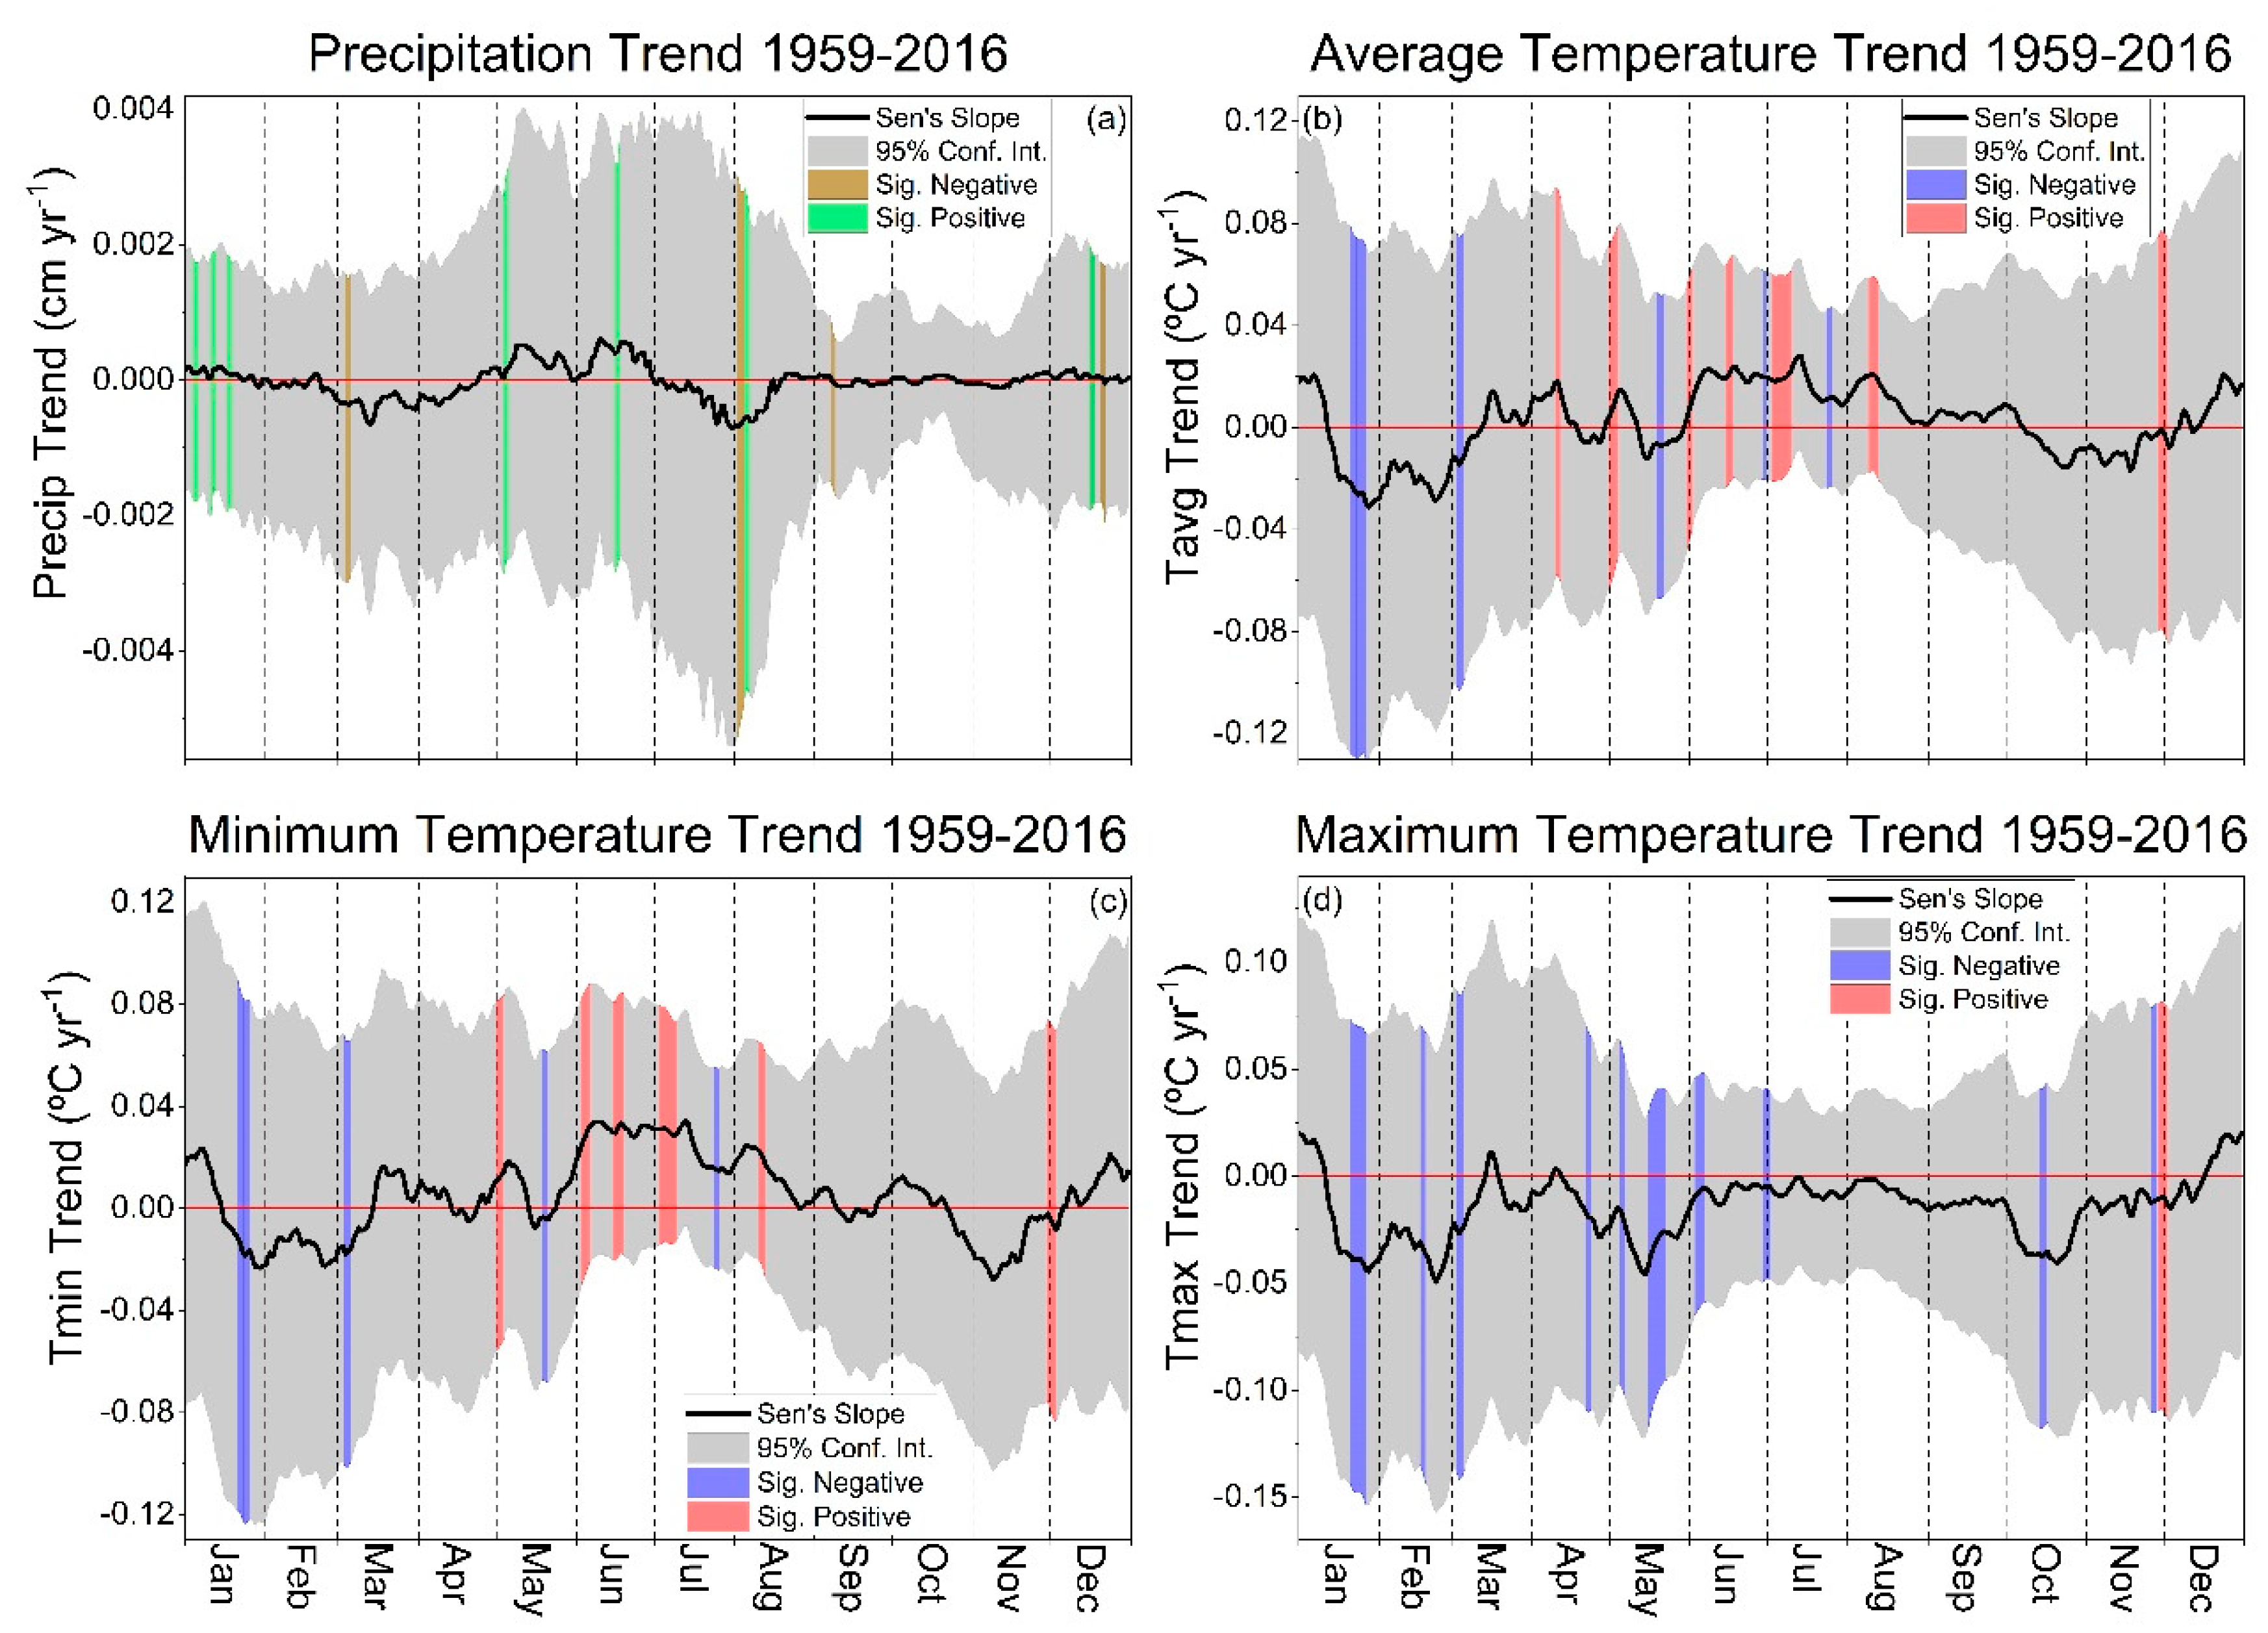
Between 1959 and 2016, 312 of the 365 (85%) daily precipitation trends were between ±0.001 cm year−1 (not shown) and twelve days (four negative; eight positive) were characterized by significant trends (p < 0.05; Figure 5a). Average temperatures cooled between late January and early March when five of the nine (56%) significantly negative (p < 0.05) daily trends occurred (Figure 5b). Average temperatures warmed at an average rate of 0.015 °C year−1 during June, July, and August (JJA) when eleven of the sixteen (69%) significantly positive (p < 0.05) daily trends occurred. Similarly, minimum temperatures warmed an average of 0.022 °C year−1 during JJA when thirteen of the seventeen (76%) significantly positive (p < 0.05) daily trends occurred (Figure 5c). Alternatively, maximum temperatures cooled an average of −0.018 °C year−1 between January 1st and July 1st when twenty of the twenty three (87%) significantly negative trends (p < 0.05) occurred. Between May and October, WV’s growing season, average trends in maximum and minimum temperatures were −0.016 °C year−1 and 0.014 °C year−1 respectively. In summary, daily precipitation trends were largest between March and August; average temperatures increased most during JJA; minimum temperatures increased most during JJA; and maximum temperatures decreased between January 1st and July 1st between 1959 and 2016.
4. Discussion
Extensive LULC changes occurred across West Virginia (WV) and the broader Appalachian region between 1900 and 2016 that greatly contrast global LULC changes [26]. WV’s dominant LULC transitioned from agricultural land (72%) to native forest cover (64%) between 1909 and 1949 [5]. Forest cover continued to increase in areal coverage (79%) and density (i.e., timber volume) through 2012 [6]. LULC changes influence biogeophysical regulation of climate associated with changes in albedo, turbulent fluxes of energy, mass, and momentum at the land–atmosphere interface, and the hydrologic cycle [26,27,28,29]. Simulations of coupled land–atmosphere interactions indicated that temperate forests are characterized by lower albedo and evapotranspiration values relative to irrigated croplands resulting in significantly warmer temperatures [29]. However, near surface eddy-covariance observations were compared between forest cover and an adjacent, non-irrigated grass field in nearby North Carolina, USA [30]. Results of Reference [30] showed the cooling effect of greater bulk aerodynamic conductance in forests was about three times larger than warming attributable to albedo effects. Therefore, the rapid transition from non-irrigated agricultural to forested land uses in WV may have resulted in a net cooling effect.
Net cooling in WV was characterized by decreasing state-average maximum temperatures (−1.0 °C) and increasing minimum temperatures (+0.4 °C) between 1900 and 2016 [9], but spatial and seasonal changes were not addressed. At the regional scale, changes in maximum and minimum temperatures contrasted the reported warming of 0.64 °C and 0.94 °C across the broader Northeast US region that included WV, respectively [31]. However, temperature trends in WV were more consistent with the Southeast US region during the period of study where maximum and minimum temperatures increased 0.16 °C and 0.76 °C, respectively [31]. In WV, minimum temperatures increased more at lower elevation locations (Table 1) where old-growth hardwood forests were harvested, conceivably with relatively less effort than WV’s rugged mountainous terrain [2]. Between 1900 and 2016, increasing daily minimum temperature trends were consistently positive during JJA when 84% of significant (p < 0.05) increasing daily trends occurred. Similarly, 76% of the seventeen significantly positive (p < 0.05) daily average trends between 1959 and 2016 occurred during JJA. Warming summertime minimum temperatures in WV’s humid subtropical climate suggests warmer dew point temperatures that may alter dewfall dynamics [32] and contribute to WV’s increasingly humid climate [9]. Maximum temperatures cooled significantly (p < 0.05) on 72 days between 1900 and 2016 (Figure 4) and annual trends were larger at higher elevations between 1959 and 2016 (Table 2) where forest cover may be less disturbed and more mature [3]. Cooling high-elevation maximum temperatures may be explained by topographically induced circulations focusing afternoon cloud development along high-elevation ridges [33] that could be more frequent in an increasingly humid climate [9]. Further investigation into the mechanism(s) responsible for differential temperature trends at low and high elevation locations is needed, but warmer minimum and cooler maximum temperatures are consistent with attenuation of the diurnal temperature range due to forest cover [34] or cloud cover [35]. In addition to LULC changes in WV, increased forest coverage and maturity, and agricultural intensification (i.e., fertilization and irrigation; [36]) upwind of WV (i.e., Midwestern US) likely contributed to WV’s increasingly humid WV climate [37]. Additional contributing mechanisms include (but are not limited to) increases in globally averaged atmospheric moisture associated with warming air and sea surface temperatures [38] or regional precipitation recycling [39]. Irrespective of the forcing mechanism(s), increased cloud cover aligns with an increasingly wet, temperate, and humid WV climate [35] and suggests regional climate forcing associated with coupled land–atmosphere interactions exceeded radiative forcing in WV (i.e., greenhouse gases; [40]).
Extrapolating annual trends over the entire POR then averaging across all eighteen locations indicated total annual precipitation increased by 3.8%, which is consistent with the national average reported in the Fourth National Climate Assessment [31]. However, precipitation increased at all locations between 1959 and 2016 when linear trends averaged across all sites indicated a 14.2 cm (13.2%) increase in precipitation relative to the epoch average. This precipitation trend was more than triple the rate of increase during the entire POR suggesting precipitation trends may be accelerating as a result of global scale increases in water vapor content [41] and super Clausius–Clapeyron scaling (SCCS) of precipitation extremes [42]. Significant (p < 0.05) increasing precipitation trends between 1959 and 2016 were estimated at lower elevation sites across western WV where forest harvesting, regrowth, and maturation was widespread [2] implying greater feedbacks associated with LULC change. The methods documented in the current work could be used to address the need for data-driven assessments of feedbacks between climate and LULC change in many locations, globally [43]. Understanding of LULC feedbacks on precipitation are particularly important in WV where some of the most extreme rainfall accumulations in the world were observed at time scales less than 6 h [44]. Thus, WV may be particularly vulnerable to changes in the frequency and magnitude (i.e., SCCS) of precipitation extremes and the impact of LULC changes (e.g., reforestation) on precipitation extremes and SCCS should be investigated.
The combination of an increasingly wet and temperate climate should help to secure WV’s water resource quantity, but water quality problems exist in WV including (but not limited to) LULC change [45], acid mine drainage [46], and pathogenic water contamination [47]. Additionally, WV’s increasingly temperate climate combined with decreasing temperature variance [9] may prolong episodes of excessive soil wetness and humid conditions that increases the vulnerability of terrestrial ecosystems to pathogens and fungal-like oomycetes such as Phytophtora and Pythium [48]. Similarly, increasing precipitation variance [9] indicates wet years are becoming more extreme, which may exacerbate vulnerabilities associated with pests and pathogens [49,50,51,52,53]. As a result, further investigation into changing climate variability may help to better explain observed changes in ecosystem biodiversity, carbon dynamics, and hydrology at a range of spatiotemporal scales [54]. However, increasing average precipitation (i.e., freshwater availability) signals potential for increasing agricultural productivity to ameliorate the food desert crisis in WV through conservation practices sponsored by the United States Department of Agriculture’s (USDA) Environmental Quality Incentives Program (EQIP; [55]). In particular EQIP’s High Tunnel System Initiative allows farmers to more efficiently deliver water and nutrients to plants, better protect plants from pests and pathogens, and minimize LULC change by increasing productivity per unit land area. Ultimately, climatic changes in WV may be distinct from the Northeast US climate region and Appalachia’s complex topography may therefore necessitate refined climatic regions based on climate trends observed over a long POR and physiographic properties [56], including (but not limited to) elevation, slope and aspect, historic LULC changes, and forest age and composition.
5. Conclusions
Long term changes in West Virginia’s LULC associated with widespread deforestation in the early 20th century, rapid forest regrowth through the mid-20th century, and subsequent forest maturation resulted in climatic changes distinct from the broader Northeast US climate region. Overall climatic trends averaged across the state suggest an increasingly temperate climate with increasing summertime minimum temperatures, particularly at lower elevations, and decreasing maximum temperatures year-round, particularly at higher elevations. Total annual precipitation is increasing and trends appear to be accelerating, particularly across the lower elevations of western WV where forest regrowth and maturation was particularly widespread. The mechanisms forcing observed changes in WV climate require much more investigation. This article therefore serves as an alert for greatly needed climate investigations in the Appalachian region to provide science-based guidance for future land-use/ land management activities in the region. This is critical since a wetter and more temperate climate may improve some ecosystems services (i.e., water security) while others may become increasingly stressed by increasing vulnerability to invasive pests and pathogens. Additionally, observed climatic changes support increasing agricultural productivity to address the food desert crisis through sustainable agricultural practices that minimize LULC changes (i.e., high tunnel systems). Therefore, climate observations over a long period of record should be used to identify spatiotemporal patterns of dynamic climatic changes at local to regional scales to better understand climatic changes, inform decision makers, and ensure preservation of WV’s rich natural resources.
Author Contributions
Conceptualization, J.H. and E.K.; methodology, E.K. and J.H.; formal analysis, E.K.; investigation, E.K.; data curation, E.K.; writing—original draft preparation, E.K.; writing—review and editing, J.H.; visualization, E.K. and J.H.; supervision, J.H.; project administration, J.H.; funding acquisition, J.H.
Funding
This research was funded by the National Science Foundation, award number OIA-1458952, The United States Department of Agriculture’s National Institute of Food and Agriculture, Hatch project 1011536, and the West Virginia Agricultural and Forestry Experiment Station.
Acknowledgments
Additional thanks are due to feedback from anonymous reviews and administrative support from Laura Tinney and Felix Greiner.
Conflicts of Interest
The authors declare no conflict of interest. The funders had no role in the design of the study; in the collection, analyses, or interpretation of data; in the writing of the manuscript, or in the decision to publish the results.
References
- Lewis, R.L. Appalachian Restructuring in Historical Perspective: Coal, Culture and Social Change in West Virginia. Urban. Stud. 1993, 30, 299–308. [Google Scholar] [CrossRef]
- Lewis, R.L. Transforming the Appalachian Countryside Railroads, Deforestation, and Social Change in West Virginia; The University of North Carolina Press: Chapel Hill, NC, USA, 1998; ISBN 9780807847060. [Google Scholar]
- Brooks, A.B. West Virginia Geological Survey, Vol. 5: Forestry and Wood Industries; Acme Publishing Co.: Morgantown, WV, USA, 1911. [Google Scholar]
- Brose, P.; Schuler, T.; Van Lear, D.; Berst, J. Bringing fire back: The changing regimes of the Appalachian mixed-oak forests. J. For. 2001, 99, 30–35. [Google Scholar] [CrossRef]
- Bones, J.T. The Forest Resources of West Virginia; Resource Bulletin Me-56; U.S. Department of Agriculture, Forest Service, Northeastern Forest Experiment Station: Broomall, PA, USA, 1978. [CrossRef]
- Morin, R.S.; Cook, G.W.; Barnett, C.J.; Butler, B.J.; Crocker, S.J.; Hatfield, M.A.; Kurtz, C.M.; Lister, T.W.; Luppold, W.G.; McWilliams, W.H.; et al. West Virginia Forests 2013; Resource Bulletin NRS-105; U.S. Department of Agriculture, Forest Service, Northeastern Forest Experiment Station: Newtown Square, PA, USA, 2016. [CrossRef]
- Burakowski, E.A.; Ollinger, S.V.; Bonan, G.B.; Wake, C.P.; Dibb, J.E.; Hollinger, D.Y. Evaluating the climate effects of reforestation in new England using a weather research and forecasting (WRF) model multiphysics ensemble. J. Clim. 2016, 29, 5141–5156. [Google Scholar] [CrossRef]
- Campbell, G.; Norman, J. An. Introduction to Environmental Biophysics; Springer Science & Business Media, Inc.: New York, NY, USA, 1998; ISBN 0-387-94937-2. [Google Scholar]
- Kutta, E.; Hubbart, J.A. Changing climatic averages and variance: Implications for mesophication at the eastern edge of North America’s Eastern deciduous forest. Forests 2018, 9. [Google Scholar] [CrossRef]
- Hoffmann, M.P.; Smith, D.L. Feeding Our Great Cities: Climate Change and Opportunities for Agriculture in Eastern Canada and the Northeastern US. Available online: http://www2.ca.uky.edu/Anr/PDF/US-CanadaClimateChangeWhitePaper.pdf (accessed on 14 December 2018).
- Darvill, R.; Lindo, Z. The inclusion of stakeholders and cultural ecosystem services in land management trade-off decisions using an ecosystem services approach. Landsc. Ecol. 2016, 31, 533–545. [Google Scholar] [CrossRef]
- Gómez-Aíza, L.; Martínez-Ballesté, A.; Álvarez-Balderas, L.; Lombardero-Goldaracena, A.; García-Meneses, P.M.; Caso-Chávez, M.; Conde-Álvarez, C. Can wildlife management units reduce land use/land cover change and climate change vulnerability? Conditions to encourage this capacity in Mexican municipalities. Land Use Policy 2017, 64, 317–326. [Google Scholar] [CrossRef]
- United States Department of Agriculture Food and Nutrition Service. Food Desert Locator: Release No. 0191.11. Available online: https://www.usda.gov/media/blog/2011/05/03/interactive-web-tool-maps-food-deserts-provides-key-data (accessed on 15 January 2018).
- Arguez, A.; Durre, I.; Applequist, S.; Squires, M.; Vose, R.; Yin, X. NOAA’s U.S. Climate Normals (1981–2010). Available online: https://www.ncdc.noaa.gov/cdo-web/datatools/normals (accessed on 14 August 2018).
- United States Department of Agriculture Food and Nutrition Service. Monongahela National Forest Land and Resource Management Plan. Available online: https://www.fs.usda.gov/Internet/FSE_DOCUMENTS/stelprdb5330420.pdf (accessed on February 15 2018).
- Edenborn, H.M.; Sams, J.I.; Kite, J.S. Thermal Regime of a Cold Air Trap in Central Pennsylvania, USA: The Trough Creek Ice Mine. Permafr. Periglac. Process. 2012, 23, 187–195. [Google Scholar] [CrossRef]
- NOAAs NCEI Climate Data Online. Available online: https://www.ncdc.noaa.gov/ghcn-daily-description (accessed on October 6 2017).
- The Role of Climatological Normals in a Changing Climate; World Meteorological Organization (WMO): Geneva, Switzerland, 2007.
- Allen, J. NASA Image based on data from the MODIS Rapid Response Team, Goddard Space Flight Center. Available online: https://earthobservatory.nasa.gov/images/8344/mining-permits-across-west-virginia (accessed on 14 March 2018).
- Lanzante, J.R. Resistant, robust and non-parametric techniques for the analysis of climate data: Theory and examples, including applications to historical radiosonde station data. Int. J. Climatol. 1996, 16, 1197–1226. [Google Scholar] [CrossRef]
- Wilks, D.S. Statistical Methods in the Atmospheric Sciences; Academic Press: Cambridge, MA, USA, 2011; ISBN 9780444515544. [Google Scholar]
- Gocic, M.; Trajkovic, S. Analysis of changes in meteorological variables using Mann-Kendall and Sen’s slope estimator statistical tests in Serbia. Glob. Planet. Chang. 2013, 100, 172–182. [Google Scholar] [CrossRef]
- Hayhoe, K.; Wuebbles, D.J.; Easterling, D.R.; Fahey, D.W.; Doherty, S.; Kossin, J.P.; Sweet, W.V.; Vose, R.S.; Wehner, M.F. Chapter 2: Our Changing Climate. In Impacts, Risks, and Adaptation in the United States: The Fourth National Climate Assessment, Volume II. Available online: https://data.globalchange.gov/report/nca4/chapter/our-changing-climate (accessed on 31 December 2018).
- Kutta, E.; Hubbart, J.A. Reconsidering meteorological seasons in a changing climate. Clim. Chang. 2016, 137, 511–524. [Google Scholar] [CrossRef]
- Peel, M.C.; Finlayson, B.L.; McMahon, T.A. Updated world map of the Köppen-Geiger climate classification. Hydrol. Earth Syst. Sci. 2007, 11, 1633–1644. [Google Scholar] [CrossRef]
- Bonan, G.B. Forests and climate change: Forcings, feedbacks, and the climate benefits of forests. Science 2008, 320, 1444–1449. [Google Scholar] [CrossRef]
- Pitman, A.J. Review the Evolution of and Revolution in Land Surface Schemes. Int. J. Climatol. 2003, 510, 479–510. [Google Scholar] [CrossRef]
- Hubbart, J.A.; Link, T.E.; Gravelle, J.A.; Elliot, W.J. Timber harvest impacts on water yield in the continental/maritime hydroclimatic region of the United States. For. Sci. 2007, 53, 169–180. [Google Scholar]
- Pitman, A.J.; Brovkin, V.; van den Hurk, B.J.J.M.; Strengers, B.J.; Ganzeveld, L.; Gayler, V.; Claussen, M.; Müller, C.; Seneviratne, S.I.; Bonan, G.B.; et al. Uncertainties in climate responses to past land cover change: First results from the LUCID intercomparison study. Geophys. Res. Lett. 2009, 36. [Google Scholar] [CrossRef] [Green Version]
- Juang, J.-Y.; Stoy, P.; Novick, K.; Katul, G.; Siqueira, M. Separating the effects of albedo from eco-physiological changes on surface temperature along a successional chronosequence in the southeastern United States. Geophys. Res. Lett. 2007, 34. [Google Scholar] [CrossRef] [Green Version]
- U.S. Global Change Research Program—Executive summary. In Climate Science Special Report: Fourth National Climate Assessment, Volume I. Available online: https://science2017.globalchange.gov/ (accessed on 14 December 2018).
- Richards, K. Urban and rural dewfall, surface moisture, and associated canopy-level air temperature and humidity measurements for Vancouver, Canada. Boundary-Layer Meteorol. 2005, 114, 143–163. [Google Scholar] [CrossRef]
- Jr Houze, R.A. Orographic effects on precipitating clouds. Rev. Geophys. 2012, 50, 1–47. [Google Scholar] [CrossRef]
- Zheng, D.; Chen, J.; Song, B.; Xu, M.; Sneed, P.; Jensen, R. Effects of silvicultural treatments on summer forest microclimate in southeastern Missouri Ozarks. Clim. Res. 2000, 15, 45–59. [Google Scholar] [CrossRef] [Green Version]
- Dai, A.; Trenberth, K.E.; Karl, T.R. Effects of clouds, soil moisture, precipitation, and water vapor on diurnal temperature range. J. Clim. 1999, 12, 2451–2473. [Google Scholar] [CrossRef]
- Mueller, N.D.; Butler, E.E.; Mckinnon, K.A.; Rhines, A.; Tingley, M.; Holbrook, N.M.; Huybers, P. Cooling of US Midwest summer temperature extremes from cropland intensification. Nat. Clim. Chang. 2016, 6, 317–322. [Google Scholar] [CrossRef]
- Kutta, E.; Hubbart, J.A. Observed climatic changes in West Virginia and opportunities for agriculture. Reg. Environ. Chang. 2019. [Google Scholar] [CrossRef]
- Held, I.M.; Soden, B.J. Robust responses of the hydrological cycle to global warming. J. Clim. 2006, 19, 5686–5699. [Google Scholar] [CrossRef]
- Dirmeyer, P.A.; Brubaker, K.L. Characterization of the Global Hydrologic Cycle from a Back-Trajectory Analysis of Atmospheric Water Vapor. J. Hydrometeorol. 2007, 8, 20–37. [Google Scholar] [CrossRef]
- Deser, C.; Phillips, A.S.; Alexander, M.A.; Smoliak, B.V. Projecting North American climate over the next 50 years: Uncertainty due to internal variability. J. Clim. 2014, 27, 2271–2296. [Google Scholar] [CrossRef]
- Kevin, E.T.; Aiguo, D.; Roy, M.R.; David, B.P. The Changing Character of Precipitation. Bull. Am. Meteorol. Soc. 2003, 84, 1205–1218. [Google Scholar] [CrossRef]
- Lenderink, G.; Barbero, R.; Loriaux, J.M.; Fowler, H.J. Super-Clausius-Clapeyron scaling of extreme hourly convective precipitation and its relation to large-scale atmospheric conditions. J. Clim. 2017, 30, 6037–6052. [Google Scholar] [CrossRef]
- Alkama, R.; Cescatti, A. Climate change: Biophysical climate impacts of recent changes in global forest cover. Science 2016, 351, 600–604. [Google Scholar] [CrossRef] [PubMed]
- Villarini, G.; Steiner, M.; Smith, J.A.; Ntelekos, A.A.; Baeck, M.L. Extreme rainfall and flooding from orographic thunderstorms in the central Appalachians. Water Resour. Res. 2011, 47, 1–24. [Google Scholar] [CrossRef]
- Kellner, E.; Hubbart, J.A. Flow class analyses of suspended sediment concentration and particle size in a mixed-land-use watershed. Sci. Total Environ. 2019, 648, 973–983. [Google Scholar] [CrossRef]
- Zipper, C.E.; Barton, C.B.; Davis, V.; Franklin, J.A.; Burger, J.A.; Skousen, J.G.; Angel, P.N. Restoring Forests and Associated Ecosystem Services on Appalachian Coal Surface Mines [electronic resource]. Environ. Manage. 2011, 47, 751–765. [Google Scholar] [CrossRef]
- Petersen, F.; Hubbart, J.A.; Kellner, E.; Kutta, E. Land-use-mediated Escherichia coli concentrations in a contemporary Appalachian watershed. Environ. Earth Sci. 2018, 77. [Google Scholar] [CrossRef]
- Hubbart, J.A.; Guyette, R.; Muzika, R.M. More than Drought: Precipitation Variance, Excessive Wetness, Pathogens and the Future of the Western Edge of the Eastern Deciduous Forest. Sci. Total Environ. 2016, 566, 463–467. [Google Scholar] [CrossRef]
- Anagnostakis, S.L. Chestnut Blight: The Classical Problem of an Introduced Pathogen. Mycologia 1987, 79, 23. [Google Scholar] [CrossRef]
- Cale, J.A.; Teale, S.A.; Johnston, M.T.; Boyer, G.L.; Perri, K.A.; Castello, J.D. New ecological and physiological dimensions of beech bark disease development in aftermath forests. For. Ecol. Manage. 2015, 336, 99–108. [Google Scholar] [CrossRef]
- Kauffman, B.W.; Clatterbuck, W.K.; Liebhold, A.M.; Coyle, D.R. Gypsy Moth in the Southeastern U.S.: Biology, Ecology, and Forest Management Strategies; SREF-FH-008; Southern Regional Extension Forestry: Athens, GA, USA, 2017. [Google Scholar]
- Herms, D.A.; McCullough, D.G. Emerald Ash Borer Invasion of North America: History, Biology, Ecology, Impacts, and Management. Annu. Rev. Entomol. 2014, 59, 13–30. [Google Scholar] [CrossRef] [Green Version]
- Kim, J.; Hwang, T.; Schaaf, C.L.; Orwig, D.A.; Boose, E.; Munger, J.W. Increased water yield due to the hemlock woolly adelgid infestation in New England. Geophys. Res. Lett. 2017, 44, 2327–2335. [Google Scholar] [CrossRef]
- Greenland, D.; Goodin, D.G.; Smith, R.C. Climate Variability and Ecosystem Response at Long-Term Ecological Research Sites; Oxford University Press, Inc.: Oxford, UK, 2003; ISBN 0195150597. [Google Scholar]
- United States Department of Agriculture. High Tunnel System Initiative. Available online: https://www.nrcs.usda.gov/wps/portal/nrcs/detailfull/national/programs/?cid=stelprdb1046250 (accessed on March 14 2018).
- Raitz, K.B.; Ulack, R. Appalachia A regional geography Land, People, and Development; Westview Press, Inc.: Boulder, CO, USA, 1984. [Google Scholar]
Figure 1.
Observed climate record site locations in West Virginia, USA. Satellite image credit: National Aeronautics and Space Administration (NASA; [19]).
Figure 1.
Observed climate record site locations in West Virginia, USA. Satellite image credit: National Aeronautics and Space Administration (NASA; [19]).

Figure 2.
Daily average maximum temperature (Tmax), minimum temperature (Tmin), average temperature (Tavg), and precipitation (Precip) over a long period of record (1900–2016) averaged across eighteen observation locations in West Virginia, USA. Daily average precipitation data were smoothed with a centered three-week moving average for plotting purposes.

Figure 3.
Sen’s slope estimator for minimum temperature (left), maximum temperature (middle), and precipitation (right) across the state of West Virginia, USA between 1900–2016 (top), 1900–1958 (middle), and 1959–2016 (bottom). * Indicates statistically significant trends (p < 0.05).
Figure 3.
Sen’s slope estimator for minimum temperature (left), maximum temperature (middle), and precipitation (right) across the state of West Virginia, USA between 1900–2016 (top), 1900–1958 (middle), and 1959–2016 (bottom). * Indicates statistically significant trends (p < 0.05).

Figure 4.
Centered three-week moving averages of (a) daily precipitation, (b) average temperature, (c) minimum temperature, and (d) maximum temperature trends averaged across all eighteen stations between 1900 and 2016. Grey shading represents the 95% confidence interval. Brown and green (red and blue) shading represents statistically significant (p < 0.05) daily precipitation (temperature) trends.

Figure 5.
Centered three-week moving averages of (a) daily precipitation, (b) average temperature, (c) minimum temperature, and (d) maximum temperature trends averaged across all eighteen stations between 1959 and 2016. Grey shading represents the 95% confidence interval. Brown and green (red and blue) shading represents statistically significant (p < 0.05) daily precipitation (temperature) trends.


Table 1.
Monthly averages of total precipitation (Precip; cm), maximum temperature (Tmax; °C), minimum temperature (Tmin; °C), and average temperature (Tavg; °C) averaged across eighteen observation locations in West Virginia, USA (Table 2) between 1900 and 2016.
Table 1.
Monthly averages of total precipitation (Precip; cm), maximum temperature (Tmax; °C), minimum temperature (Tmin; °C), and average temperature (Tavg; °C) averaged across eighteen observation locations in West Virginia, USA (Table 2) between 1900 and 2016.
| Jan | Feb | Mar | Apr | May | Jun | Jul | Aug | Sep | Oct | Nov | Dec | |
|---|---|---|---|---|---|---|---|---|---|---|---|---|
| Precip | 8.5 | 7.4 | 9.7 | 9.1 | 10.5 | 11.1 | 11.7 | 10.1 | 8.2 | 7.4 | 7.3 | 8.3 |
| Tmax | 5.2 | 6.6 | 12.2 | 18.4 | 23.7 | 27.5 | 29.4 | 28.7 | 25.6 | 19.6 | 12.6 | 6.6 |
| Tavg | −0.3 | 0.7 | 5.5 | 11.0 | 16.3 | 20.6 | 22.7 | 22.0 | 18.5 | 12.3 | 6.2 | 1.3 |
| Tmin | −5.8 | −5.3 | −1.1 | 3.6 | 8.8 | 13.6 | 16.0 | 15.2 | 11.4 | 4.9 | −0.1 | −4.1 |
Table 2.
Eighteen observation stations in West Virginia, USA. Elevation (m), period of record (POR), and estimated linear slope for minimum temperature (°C/decade), maximum temperature (°C/decade), and total annual precipitation (cm/decade). Higher and lower elevation averages refer to above or below the median elevation (323 m), respectively.
| Minimum | Maximum | Precipitation | |||||||||
|---|---|---|---|---|---|---|---|---|---|---|---|
| City | Elev | Period of Record | 1900–2016 | 1900–1958 | 1959–2016 | 1900–2016 | 1900–1958 | 1959–2016 | 1900–2016 | 1900–1958 | 1959–2016 |
| Martinsburg | 165 | 1926–2016 | 0.12 | 0.01 | 0.32 | −0.06 | −0.40 | 0.12 | −0.30 | −5.10 | 1.20 |
| New Cumb. | 205 | 1902–2016 | 0.17 | 0.30 | 0.22 | 0.02 | 0.50 | −0.29 | 0.49 | 1.34 | 3.21 |
| Romney | 206 | 1900–2016 | −0.02 | 0.08 | 0.05 | −0.06 | 0.16 | −0.09 | −0.05 | −0.89 | 1.30 |
| Madison | 208 | 1909–2016 | 0.04 | 0.03 | 0.31 | 0.04 | −0.07 | 0.24 | 3.05 | 3.03 | 4.44 |
| Glenville | 229 | 1900–2016 | −0.02 | 0.15 | 0.42 | −0.21 | 0.00 | 0.15 | −0.54 | 1.44 | 2.83 |
| Moorefield | 254 | 1901–2016 | 0.01 | 0.29 | −0.23 | −0.12 | 0.15 | −0.12 | 0.30 | −1.56 | 1.90 |
| Parkerburg | 254 | 1926–2016 | −0.09 | −0.03 | 0.05 | 0.01 | 0.17 | 0.19 | 1.52 | 3.19 | 3.71 |
| Spencer | 294 | 1906–2016 | −0.07 | 0.40 | −0.07 | −0.10 | −0.01 | −0.13 | 0.36 | −0.77 | 4.48 |
| Clarksburg | 302 | 1923–2016 | 0.11 | −0.05 | 0.30 | −0.10 | −0.04 | −0.03 | 1.42 | −2.20 | 4.30 |
| Fairmont | 345 | 1906–2016 | 0.10 | 0.32 | 0.27 | −0.21 | −0.24 | 0.11 | 0.79 | 0.28 | 2.16 |
| Logan | 367 | 1902–2016 | 0.11 | 0.00 | 0.52 | −0.09 | −0.10 | 0.16 | 0.18 | −3.01 | 3.66 |
| Buckhannon | 433 | 1909–2016 | −0.09 | −0.07 | 0.14 | −0.30 | 0.15 | 0.02 | −1.17 | −1.50 | 0.69 |
| Parsons | 543 | 1900–2016 | 0.06 | 0.39 | 0.07 | −0.15 | 0.23 | −0.05 | 0.94 | 0.86 | 1.23 |
| White SS | 597 | 1921–2016 | −0.01 | 0.17 | −0.04 | −0.16 | 0.29 | −0.40 | 1.15 | 2.84 | 2.14 |
| Elkins | 604 | 1926–2016 | −0.07 | −0.31 | 0.31 | 0.04 | 0.14 | 0.21 | −0.51 | −8.34 | 1.33 |
| Lewisburg | 696 | 1901–2016 | −0.04 | 0.07 | −0.06 | −0.06 | 0.20 | −0.29 | 0.19 | −3.17 | 2.38 |
| Beckley | 711 | 1907–2016 | −0.03 | 0.03 | 0.02 | 0.01 | −0.16 | −0.24 | −1.77 | −1.37 | 1.62 |
| Bayard | 722 | 1903–2016 | 0.02 | −0.14 | 0.06 | −0.20 | −0.17 | −0.07 | 0.06 | −1.84 | 2.33 |
| Lower Elevation Average | 0.03 | 0.13 | 0.15 | −0.06 | 0.05 | 0.00 | 0.69 | −0.17 | 3.04 | ||
| Higher Elevation Average | 0.01 | 0.05 | 0.14 | −0.12 | 0.04 | −0.06 | −0.02 | −1.69 | 1.95 | ||
| Average | 0.02 | 0.09 | 0.15 | −0.09 | 0.04 | −0.03 | 0.34 | −0.93 | 2.50 | ||
White SS = White Sulphur Springs, New Cumb. = New Cumberland, Elev = elevation, blue or brown shading = significant decrease (p < 0.05), red or green shading = significant increase (p < 0.05).
© 2019 by the authors. Licensee MDPI, Basel, Switzerland. This article is an open access article distributed under the terms and conditions of the Creative Commons Attribution (CC BY) license (http://creativecommons.org/licenses/by/4.0/).
Share and Cite
MDPI and ACS Style
Kutta, E.; Hubbart, J. Climatic Trends of West Virginia: A Representative Appalachian Microcosm. Water 2019, 11, 1117. https://doi.org/10.3390/w11061117
AMA Style
Kutta E, Hubbart J. Climatic Trends of West Virginia: A Representative Appalachian Microcosm. Water. 2019; 11(6):1117. https://doi.org/10.3390/w11061117
Chicago/Turabian StyleKutta, Evan, and Jason Hubbart. 2019. "Climatic Trends of West Virginia: A Representative Appalachian Microcosm" Water 11, no. 6: 1117. https://doi.org/10.3390/w11061117
Note that from the first issue of 2016, this journal uses article numbers instead of page numbers. See further details here.