The Optimal Width and Mechanism of Riparian Buffers for Storm Water Nutrient Removal in the Chinese Eutrophic Lake Chaohu Watershed

1
Key Laboratory of Algal Biology, State Key Laboratory of Freshwater Ecology and Biotechnology, Institute of Hydrobiology, Chinese Academy of Sciences, Wuhan 430072, China
2
University of Chinese Academy of Sciences, Beijing 100039, China
*
Author to whom correspondence should be addressed.
†
All authors contributed equally to the paper.
Water 2018, 10(10), 1489; https://doi.org/10.3390/w10101489
Submission received: 28 September 2018
/
Revised: 15 October 2018
/
Accepted: 17 October 2018
/
Published: 22 October 2018
(This article belongs to the Special Issue Lake and River Restoration: Method, Evaluation and Management)
Abstract
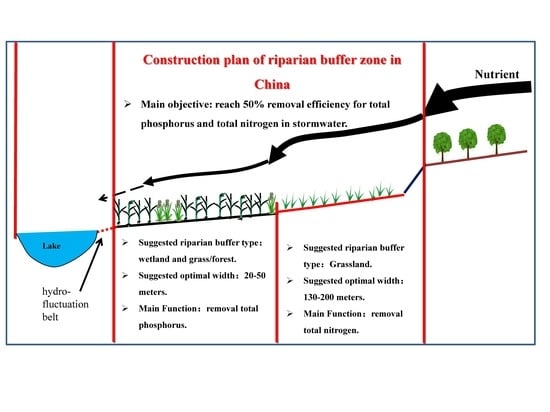
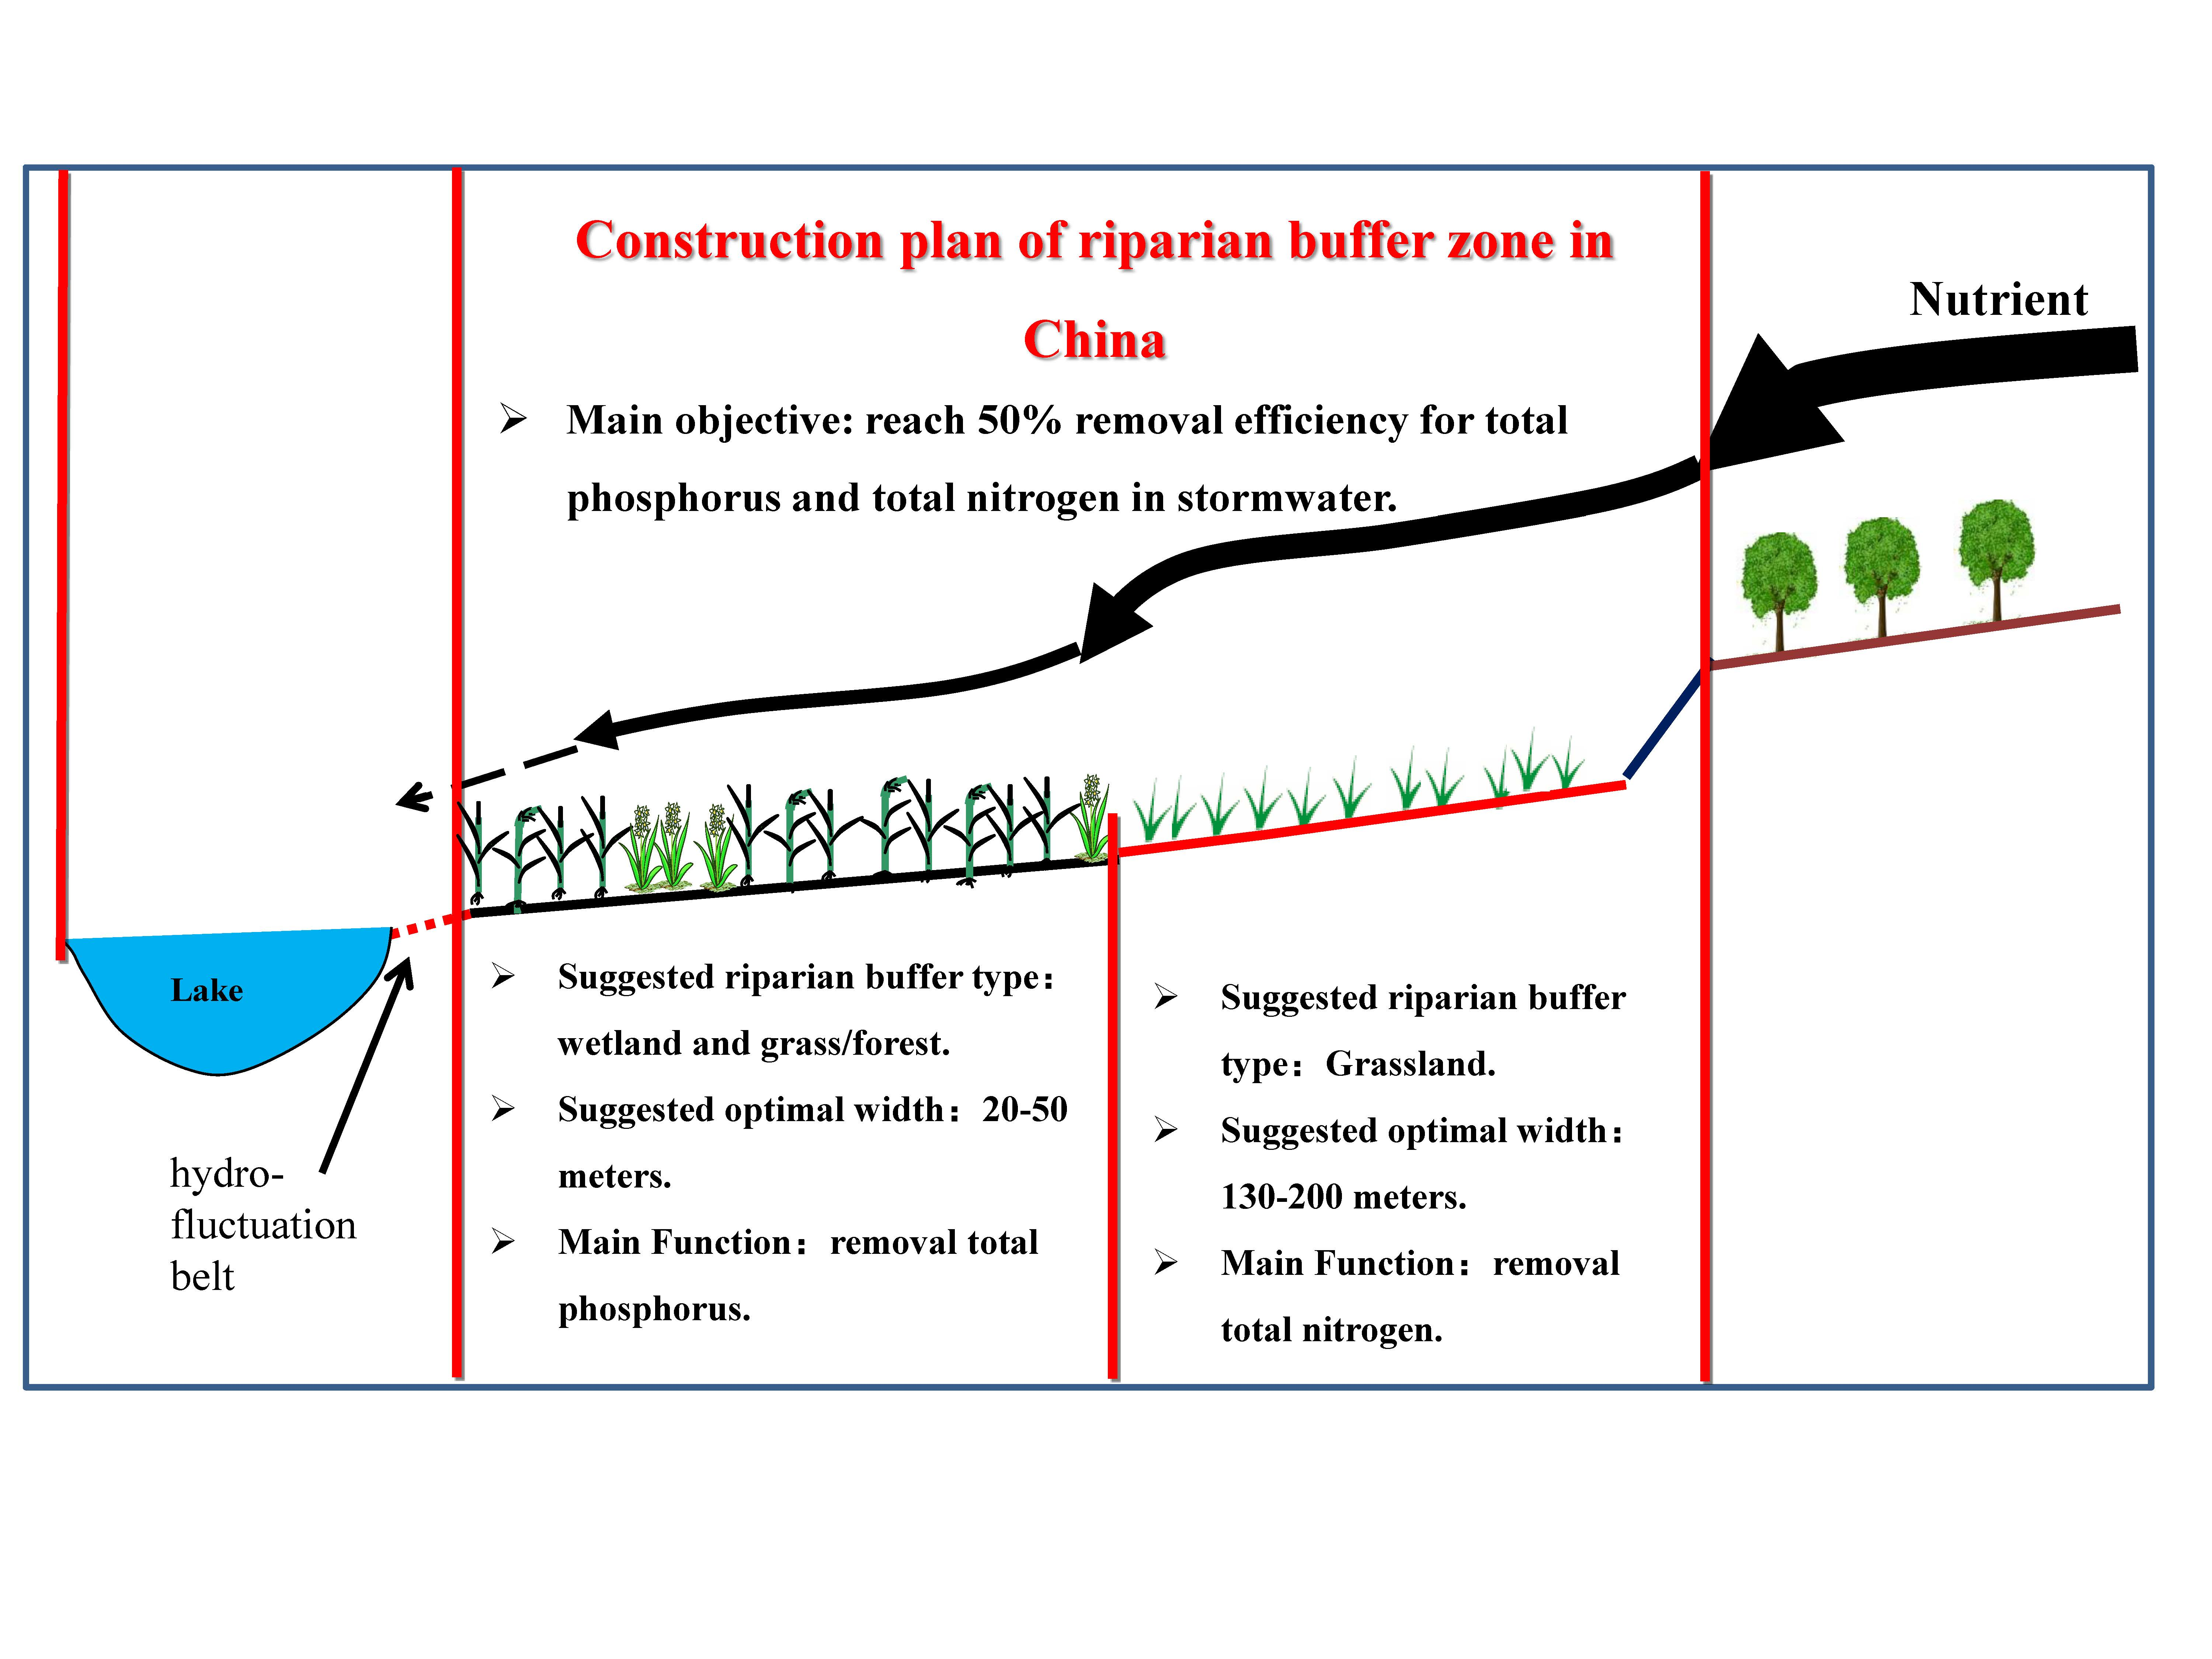
:Riparian buffers play an important role in intercepting nutrients entering lakes from non-point runoffs. In spite of its ecological significance, little is known regarding the underlying mechanisms of riparian buffers or their optimal width. In this study, we examined nutrient removal efficiency, including the quantity of nutrients and water quality, in the littoral zone of different types of riparian buffers in the watershed around eutrophic Lake Chaohu (China), and estimated the optimal width for different types of riparian buffers for effective nutrient removal. In general, a weak phosphorus (P) adsorption ability and nitrification-denitrification potential in soil resulted in a far greater riparian buffer demand than before in Lake Chaohu, which may be attributed to the soil degradation and simplification of cover vegetation. In detail, the width was at least 23 m (grass/forest) and 130 m (grass) for total P (TP) and total nitrogen (TN) to reach 50% removal efficiency, respectively, indicating a significantly greater demand for TN removal than that for TP. Additionally, wetland and grass/forest riparian buffers were more effective for TP removal, which was attributed to a high P sorption maximum (Qmax) and a low equilibrium P concentration (EPC0), respectively. The high potential nitrification rate (PNR) and potential denitrification rate (PDR) were responsible for the more effective TN removal efficiencies in grass riparian buffers. The nutrient removal efficiency of different types of riparian buffers was closely related with nutrient level in adjacent littoral zones around Lake Chaohu.
1. Introduction
Transport of nutrients to lakes and the resulting acceleration of eutrophication is a serious concern around the world. Runoff from land surfaces such as grass, forest, farmland, and wetlands has been found to be an important nutrient source for aquatic ecosystems [1]. Riparian buffers have been considered as an effective and sustainable means of buffering aquatic ecosystems against nutrient stressors, such as N and P from runoff [2], and thus they have been considered as the last line of defense for nutrient removal. Riparian buffers attenuate nutrients through soil adsorption, microbial immobilization, plant uptake, and coupled nitrification-denitrification [3,4,5].
Riparian buffer width is an important reference for managers and planners of watershed in designing the restoration of riparian buffers or protection objectives and scope. The determination of riparian buffer width range depends on the physiochemical and microbial properties of soil, slope, vegetation cover, the form and content of nutrients, and so on [6]. Sandy soil shows higher retention efficiency for P than silty clay [7]. Combinations of the dense, stiff, and native warm-season grass and woody vegetation were proved to significantly improve the removal effectiveness for non-point source pollutants [8]. Buffers composed of trees generally remove more N from runoffs [6], which should be attributed to the strong coupled nitrification-denitrification potential mediated by rhizosphere microorganisms. However, the riparian buffer width demand studied by many researchers indeed varied greatly between 5 m and 300 m [9,10,11,12,13,14,15,16,17], and little research has been focused on the mechanisms and explanations, which has lacked sufficient evidence. In addition, the actual effect of nutrient removal through riparian buffers on adjacent aquatic ecosystems was rarely involved.
In this study, nutrient levels (TN and TP) from storm water runoffs in different types of riparian buffer and surface water in littoral and deep zones of Lake Chaohu were investigated to reveal the nutrient removal efficiency and width demand of riparian buffers and the effects on aquatic ecosystems. The P adsorption ability and nitrification-denitrification potential of soil from riparian buffers were also analyzed to explain the corresponding mechanisms. The following points will be addressed: (1) comparison of riparian buffer width demand for nutrient removal in Chinese eutrophic lake watershed to European and American studies; (2) the optimal riparian buffer types for P and N removal as well as their mechanisms; (3) whether riparian buffers can make a crucial effect on nutrient levels in adjacent aquatic ecosystems, especially in littoral zones.
2. Materials and Methods
2.1. Study Site
Lake Chaohu, one of the five largest freshwater lakes in China, is located in the Yangtze-Huaihe region, central of Anhui Province. Its surface area is about 780 km2, drainage total area is 13,486 km2, and the shoreline length around the whole lake is 184.66 km. The climate of Lake Chaohu belongs to sub-tropical monsoon climates, and the annual average rainfall is 1120 mm [18]. In the last decades, due to the over-development of land, over-fertilization of agriculture, construction of highway around the lake that is too close to the shoreline, large-scale artificial plant restoration, vegetation and microorganism biodiversity as well as the properties of soil in the riparian buffer has noticeably declined, resulting in weaker nutrient removal efficiency and more serious lake eutrophication (see the Supplementary Materials Figures S1 and S2).
Different types of riparian buffer around Lake Chaohu was chosen depending on vegetation cover type, including grass (37 sites), forest (27 sites), wetlands (33 sites), grass/forest (27 sites), S and farmland (20 sites).
2.2. Storm Water Collection and Sampling
The storm water sampler received runoff in riparian buffers of different widths around Lake Chaohu during June to September in 2013 and 2014 through a 50 cm piece of 2 cm diameter PVC pipe placed flush with the surface of the ground on a selected sloping surface of an angle of about 10–30 degrees with the horizon line. Runoff entered the pipe through a slit cut along the entire length of pipe. The pipe was wrapped with a fiberglass screen to prevent insects and large debris from entering. Wooden clothespins with small pieces of nylon rope held the pipes in place. Water from the pipe flowed into a sampler through a notched cap with silicon tubing, which ran from the end of the PVC pipes to the sample bottle. The sampler was a 1 L glass bottle placed in a 10 cm diameter protective PVC sleeve. The original storm water was collected directly from the sky as the initial untreated storm water samples. All the sample bottles were taken back to the laboratory for chemical analysis as soon as possible after runoff had stopped, and the water volume in each bottle and the riparian width from the top to the collection site was recorded [19]. Two samplers for each site were designed and installed in the upper and lower sites of the riparian buffer, respectively, in order to calculate the efficiency of nutrient removal through the specific width.
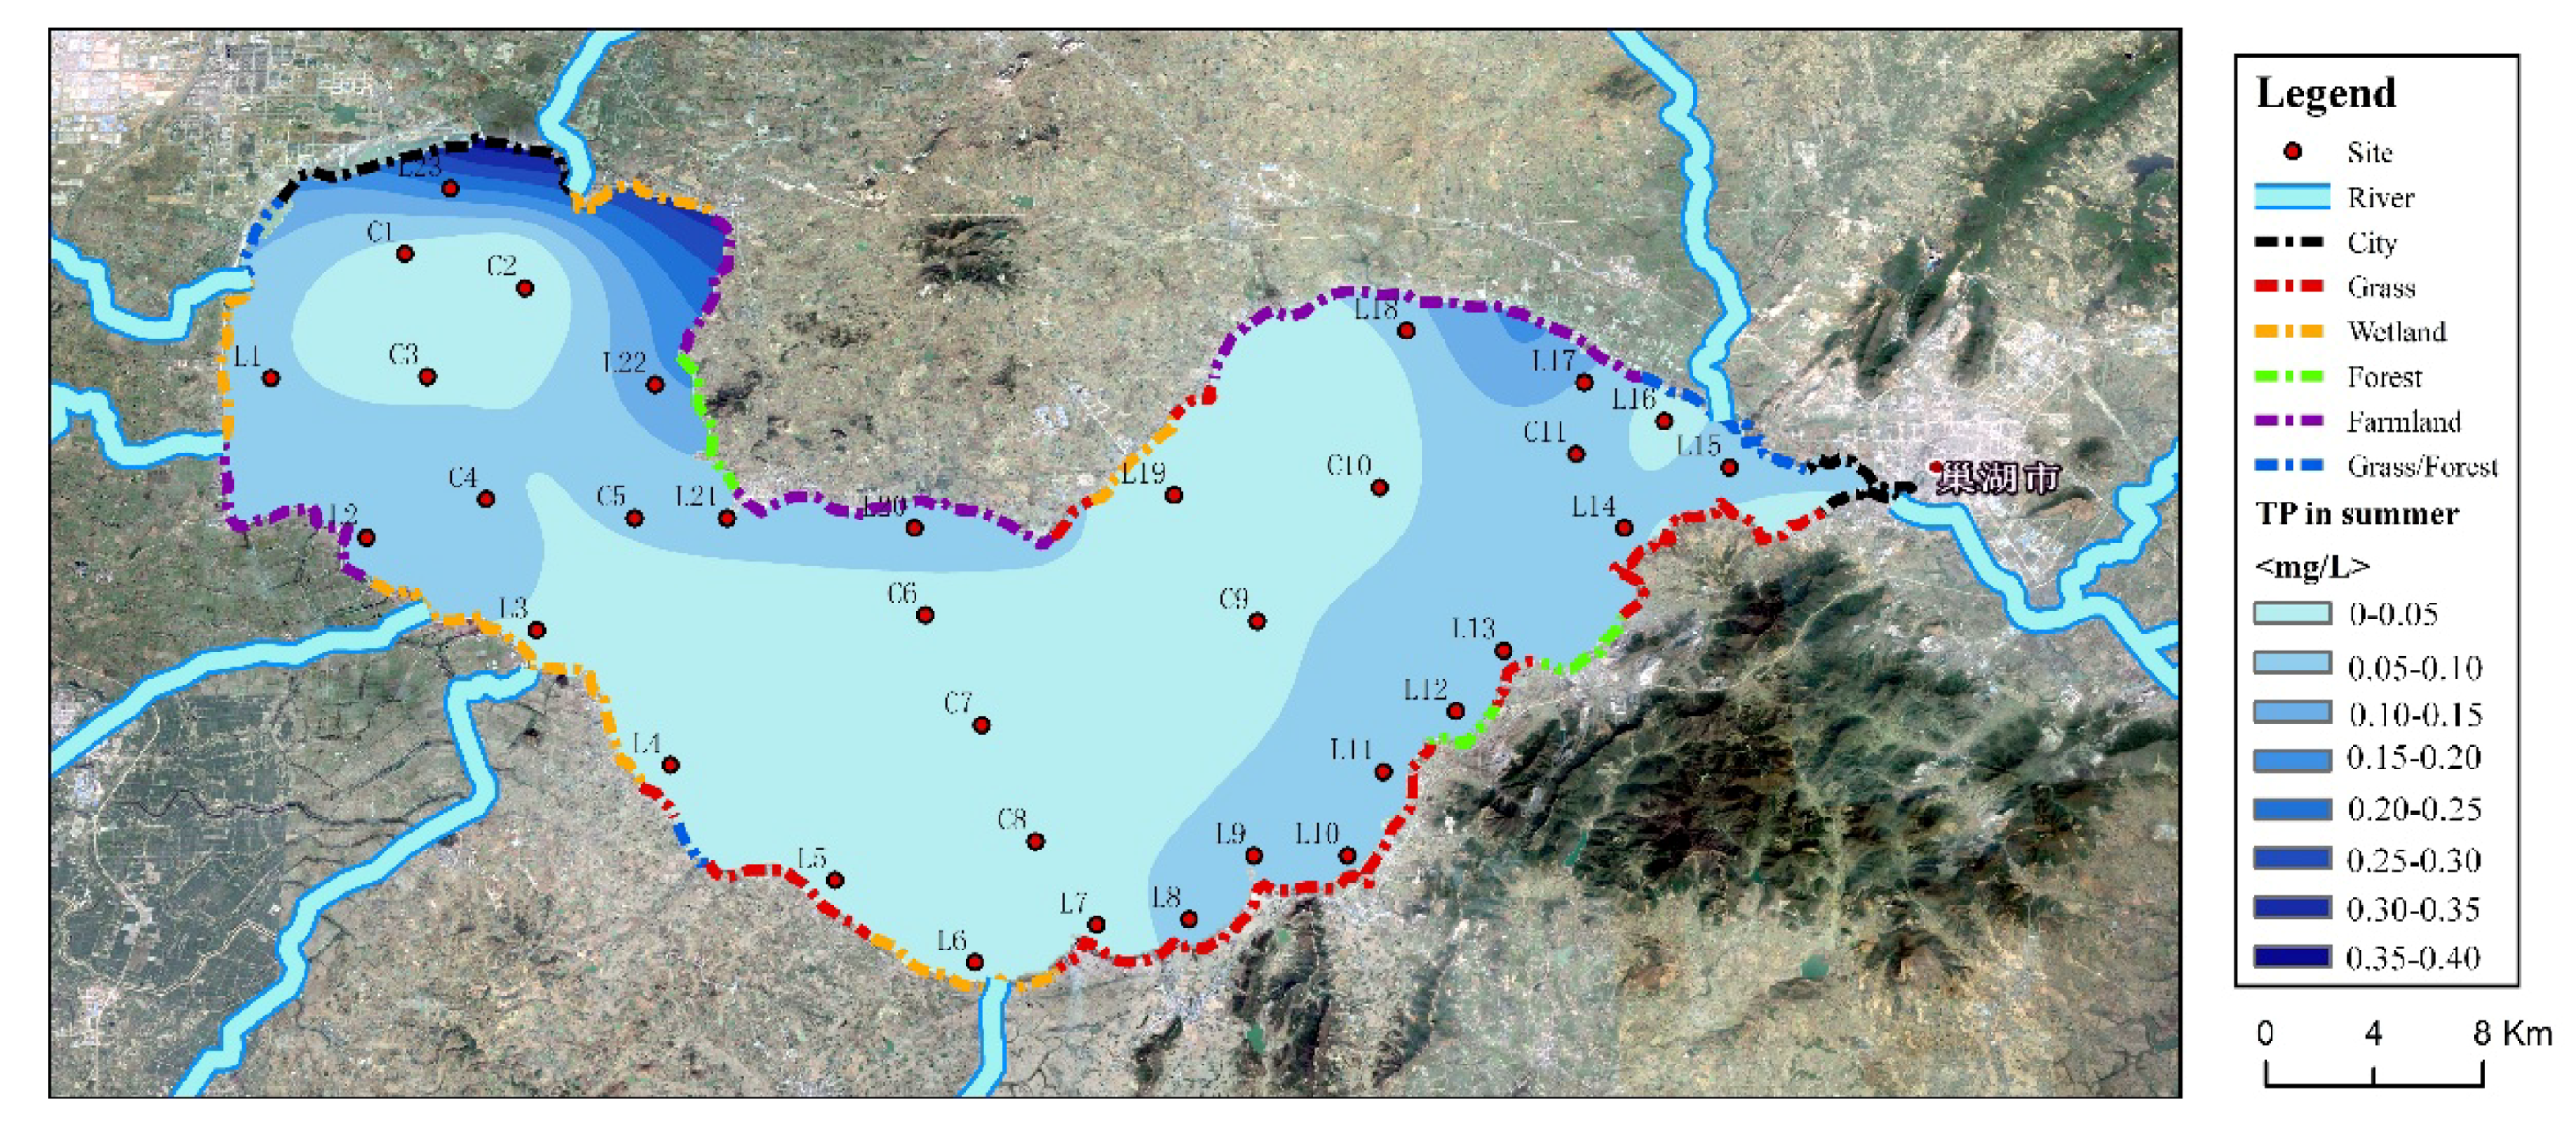
Storm water was collected at each site of different widths for two to three rain events. Soil samples under the surface of the vegetation 10–20 cm at each site were collected for the analysis of P adsorption and potential nitrification-denitrification rate. Surface waters of littoral (22 sites) and deep (11 sites) zones in Lake Chaohu were also obtained with a Friedinger sampler. The positions of the sampling sites in littoral (L) and deep (C) zones as well as the types of riparian buffers are shown in Figure 1 and Figure 2.
2.3. Chemical Analysis
TN and TP from water samples were measured following national standards [20].
Batch P sorption isotherm experiments were conducted in triplicate for soil samples under reducing conditions, using 0.01 mol L−1 KCl solutions containing 0, 0.1, 0.2, 1, 2, 5, 8, 10, 15, 20, 30, 40, 50, and 100 mg P L−1 KH2PO4 as sorption solution matrices [21]. The sealed centrifuge tubes with the mixed solution were shaken on a reciprocal shaker at a speed of 200 cycles min−1 for 24 h at 25 ± 3 °C. The suspension was centrifuged at 3500 rpm for 20 min. The supernatants were filtered through a 0.22 μm mixed cellulose ester membrane and determined for soluble reactive phosphorus. P sorption parameters of soils were simulated by the Langmuir and Freundlich isothermal model, and equilibrium P concentration (EPC0) was determined according to the Freundlich equation. P sorption maximum (Qmax) was determined according to the Langmuir equation [22].
The soil samples were washed by phosphate buffer to extracted biofilm [23] which was used to extract DNA and measure potential PNR and PDR. The PNR was measured according to the shaken-slurry method [24]. Slurry containing 3 g of biofilm pellet, 100 mL of phosphate buffer (1 mM, pH 7.4), and 0.5 mL of (NH4)2SO4 (0.25 M) was incubated on an orbital shaker (180 rpm) at 25 °C for 24 h. Subsamples (5 mL) of the slurry were taken at 1, 4, 10, 16, and 24 h after the start of the incubation. The subsamples were used for the analyses of NO2−-N and NO3−-N. The PNR was calculated as NO2−-N and NO3−-N production per unit time.
Meanwhile, the PDR was measured based on the Denitrifying Enzyme Activity (DEA) Assay [25]. Briefly, 5 g of biofilm pellet was moved to a special tailor-made borosilicate glass media bottle with 20 mL DEA solution (7 mM KNO3, 3 mM glucose and 5 mM chloramphenicol), and oxygen was purged out from each bottle by continuously pumping helium and acetylene which was added to reach a final concentration of 10%. Sample bottles were placed on an orbital shaker and shaken (125 r/min) in dark at 25 °C. Gas samples were taken out at 0, 0.5, 1, 1.5, and 2 h for N2O measurement using gas chromatography. The PDR was calculated as the slope of a curve of best fit in a plot of N2O concentration against time.
2.4. Statistical Analysis
Pearson correlation coefficients and log-normal regression analyses were performed using SigmaPlot 2000 and SPSS 13.0 for Windows. Pearson’s test was performed using the SPSS 18.0 package (SPSS, Chicago, IL, USA), with a selected value of 0.05 for significance.
3. Results
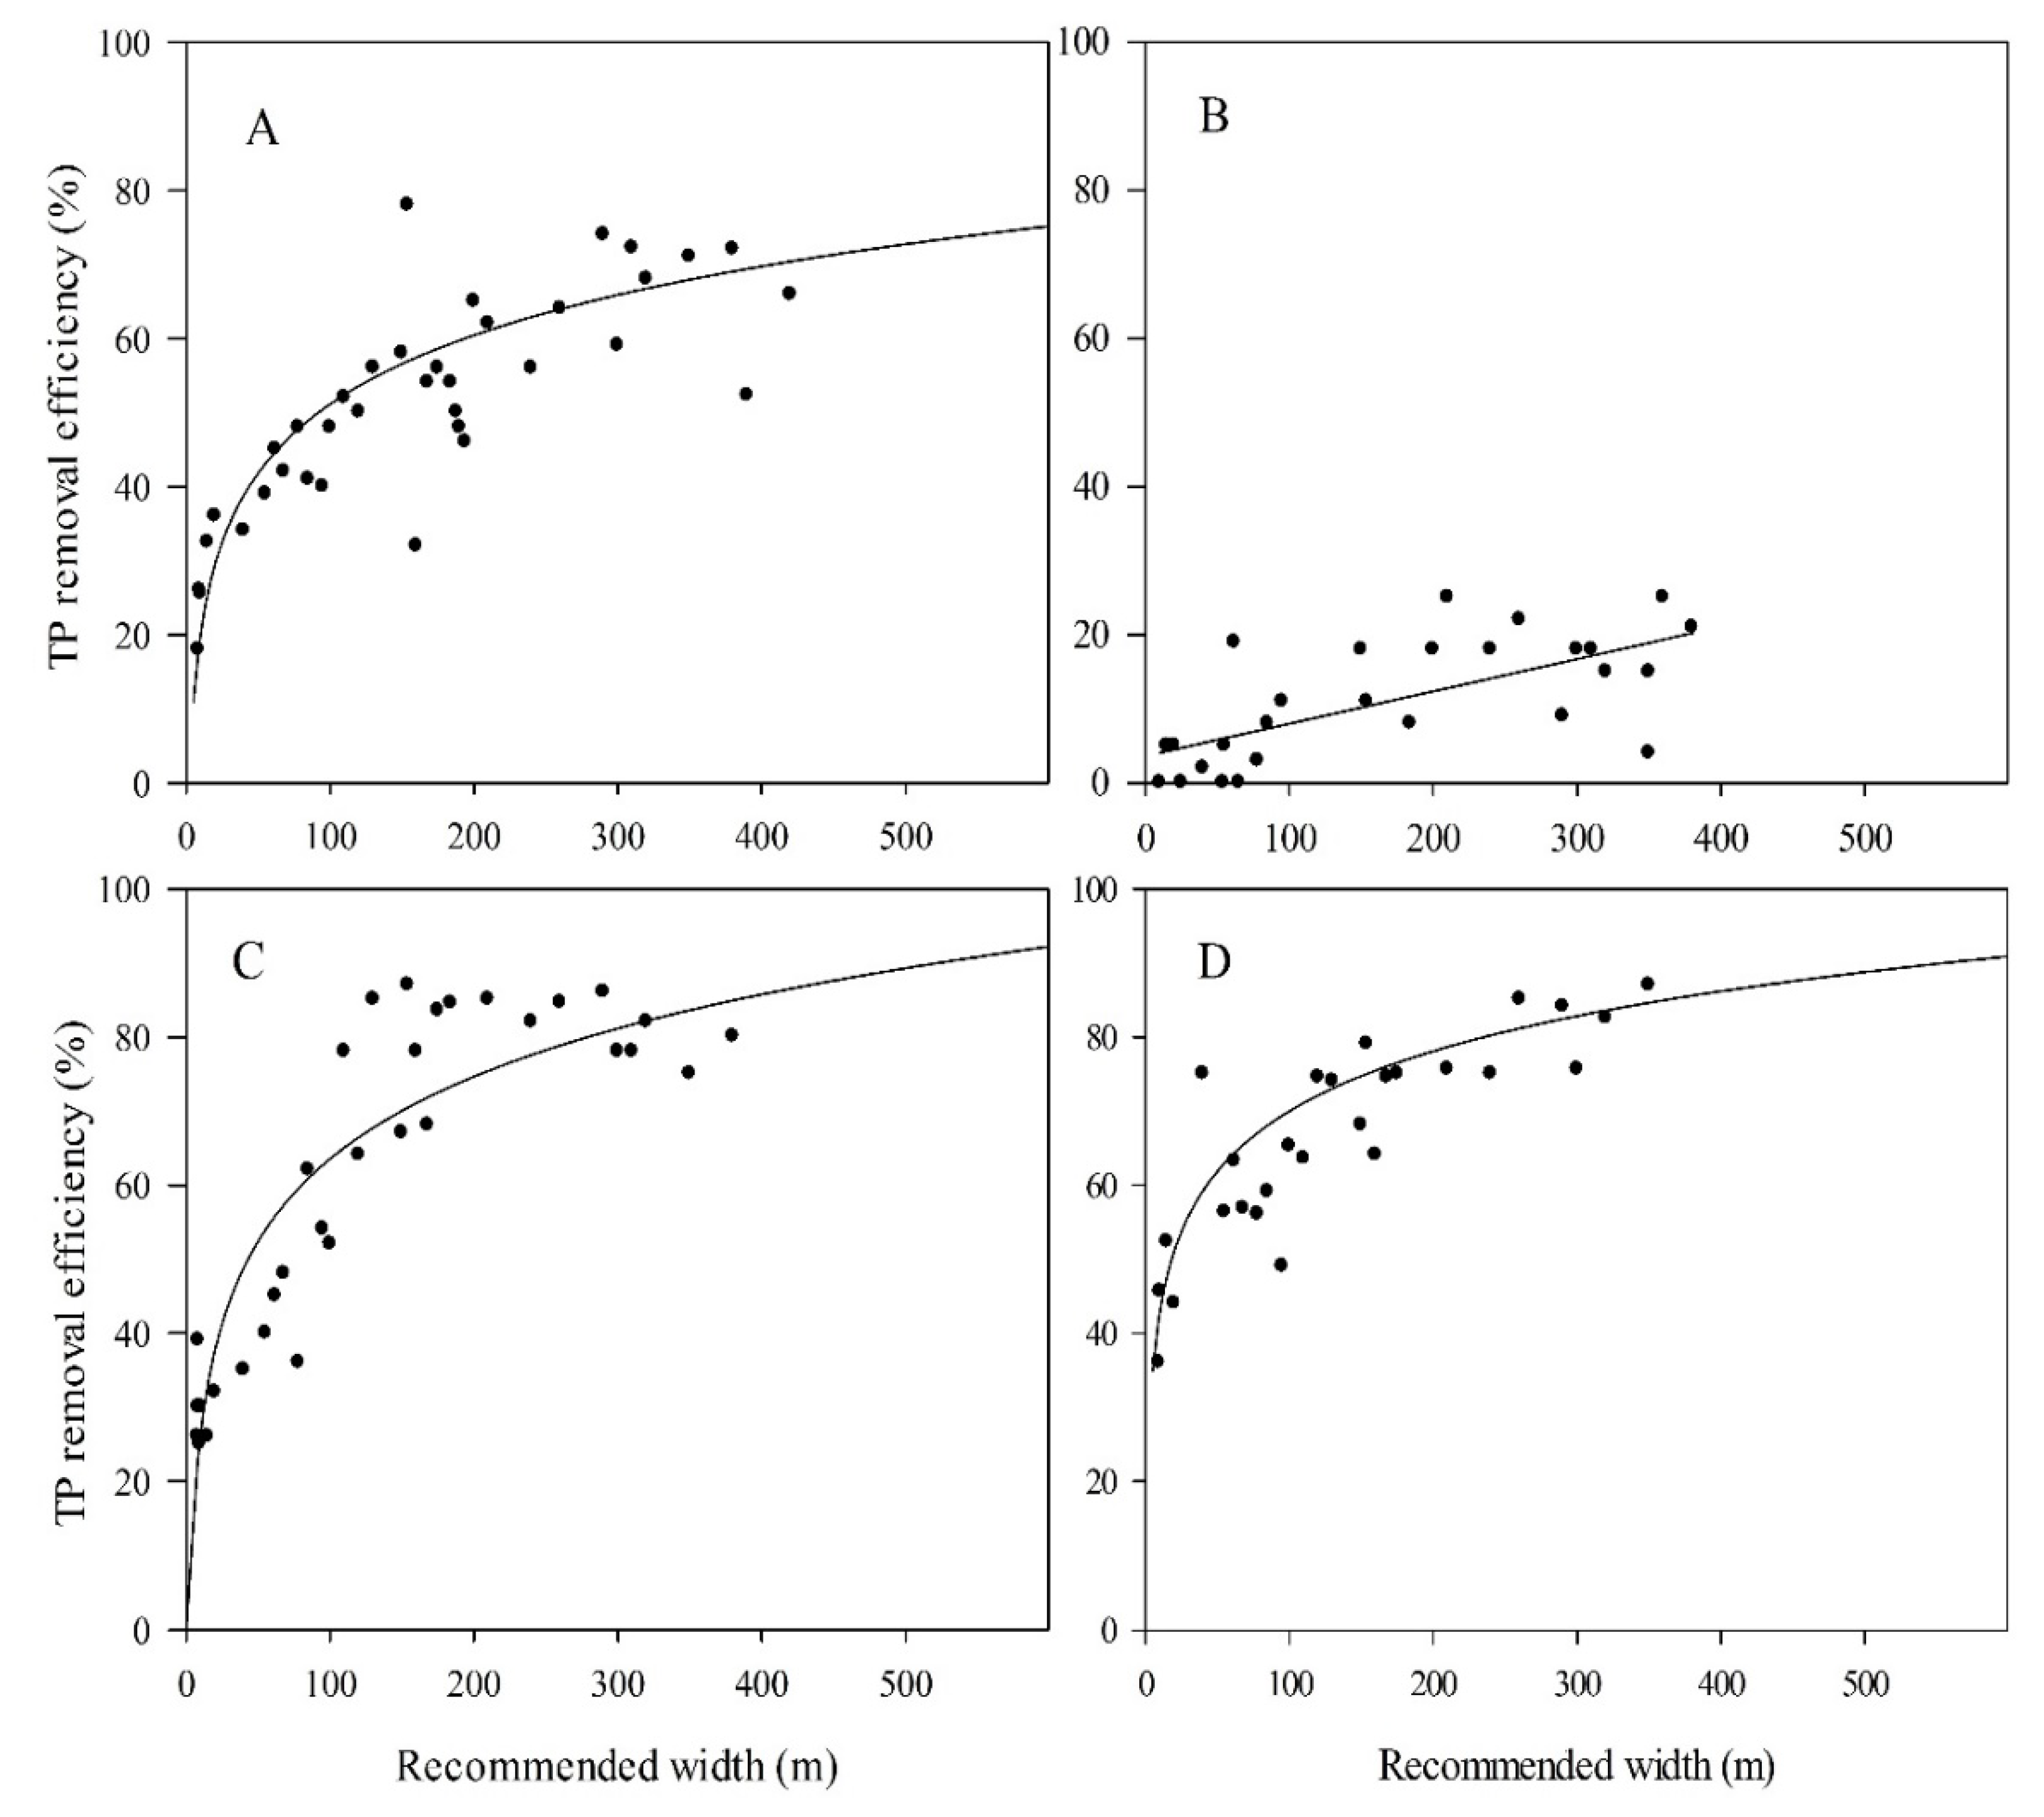
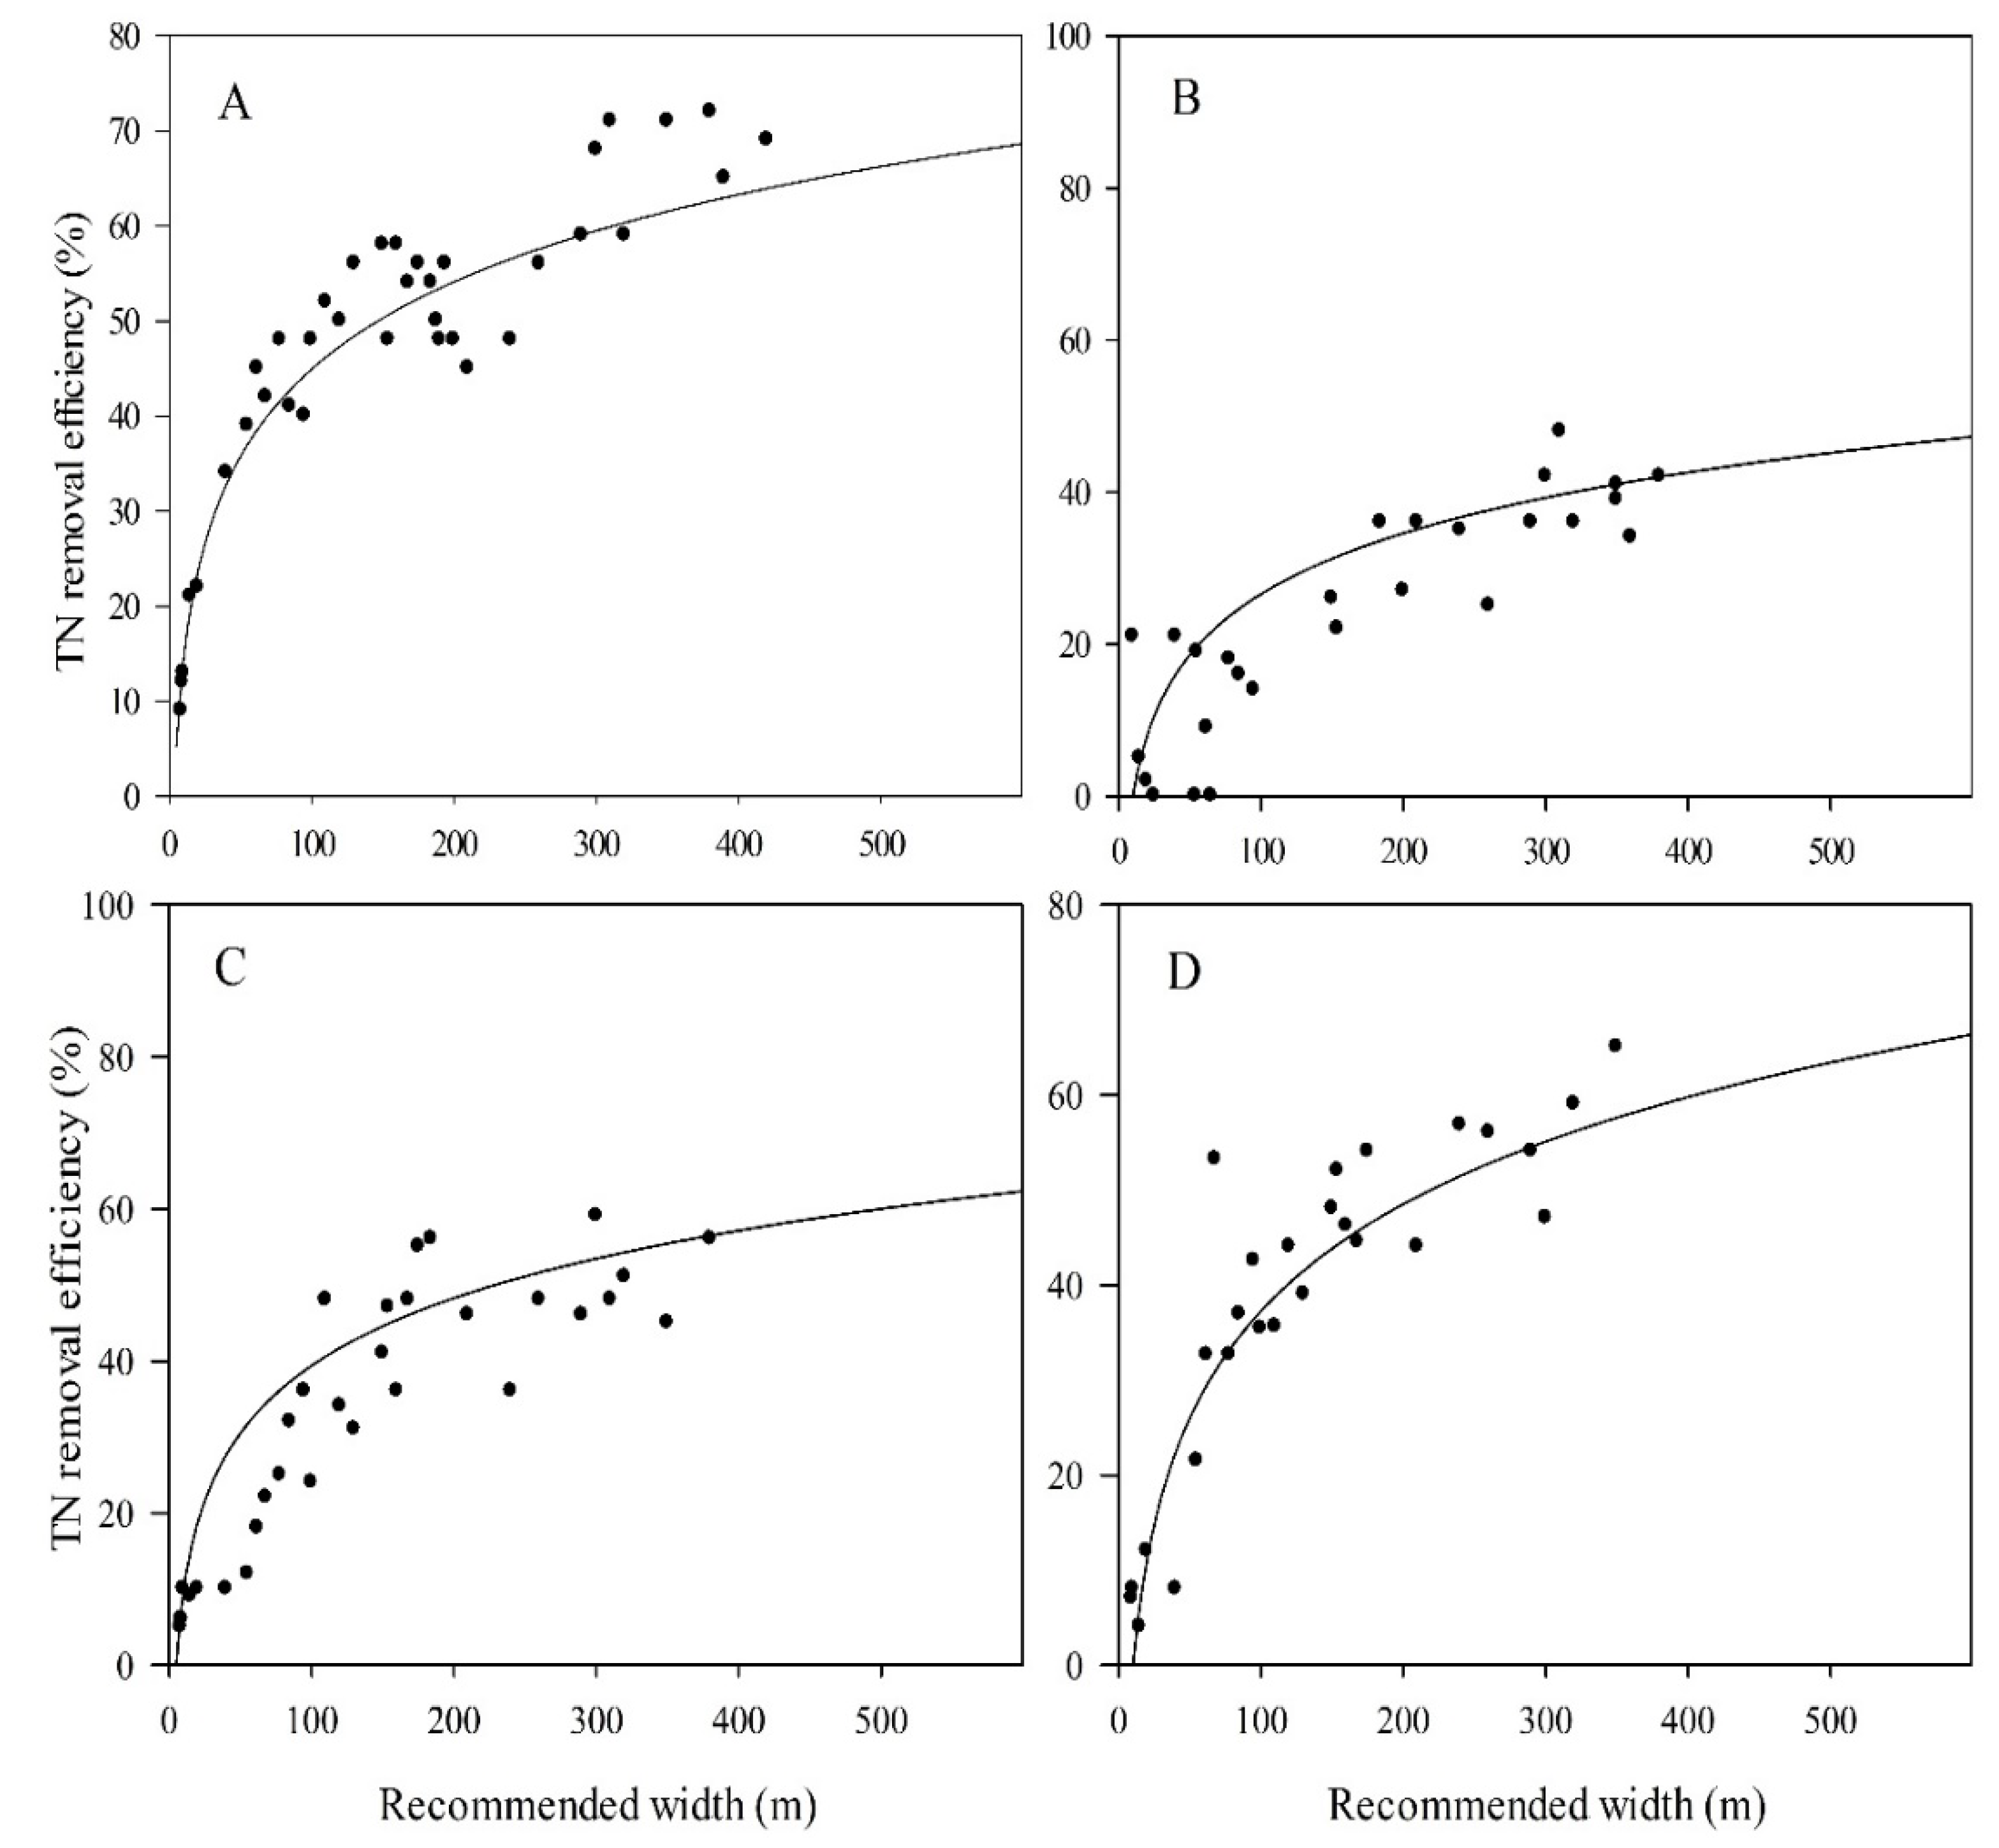
The relationships between riparian buffer width and nutrient removal efficiency are shown in Figure 3 (TP) and Figure 4 (TN), and exhibited log-normal distributions (except the forest type in TP profile). The farmland data are not shown due to heavy nutrient loss (nutrient levels got higher through the riparian buffer). Based on the non-linear regression model, the buffer width was calculated under specific removal efficiencies (50%, 75%, and 90%). On the condition of the same percentage removal efficiency, the needed width for TN removal was longer than for TP (Figure 3 and Figure 4, and Table 1). In detail, the wetland and grass/forest riparian buffers were more effective for TP removal, and their widths were 44 m, 204 m, and 512 m and 23 m, 203 m, and 755 m to achieve a 50%, 75%, and 90% removal efficiency, respectively. The grass riparian buffer was less effective in TP removal, which needed more width to reach removal efficiency. The removal effectiveness of TP in the forest riparian buffer had a weak linear relationship with buffer width, showing a longer width than other riparian buffers (Table 1, Figure 3). The best TN removal efficiency was observed in the grass riparian buffer, which was 130 m, 749 m, and 2143 m in width for 50%, 75%, and 90% removal efficiency, respectively, followed by grass/forest and wetland riparian buffers. The forest riparian buffer could function for TN removal at considerably large widths, which was difficult to construct (Table 1).
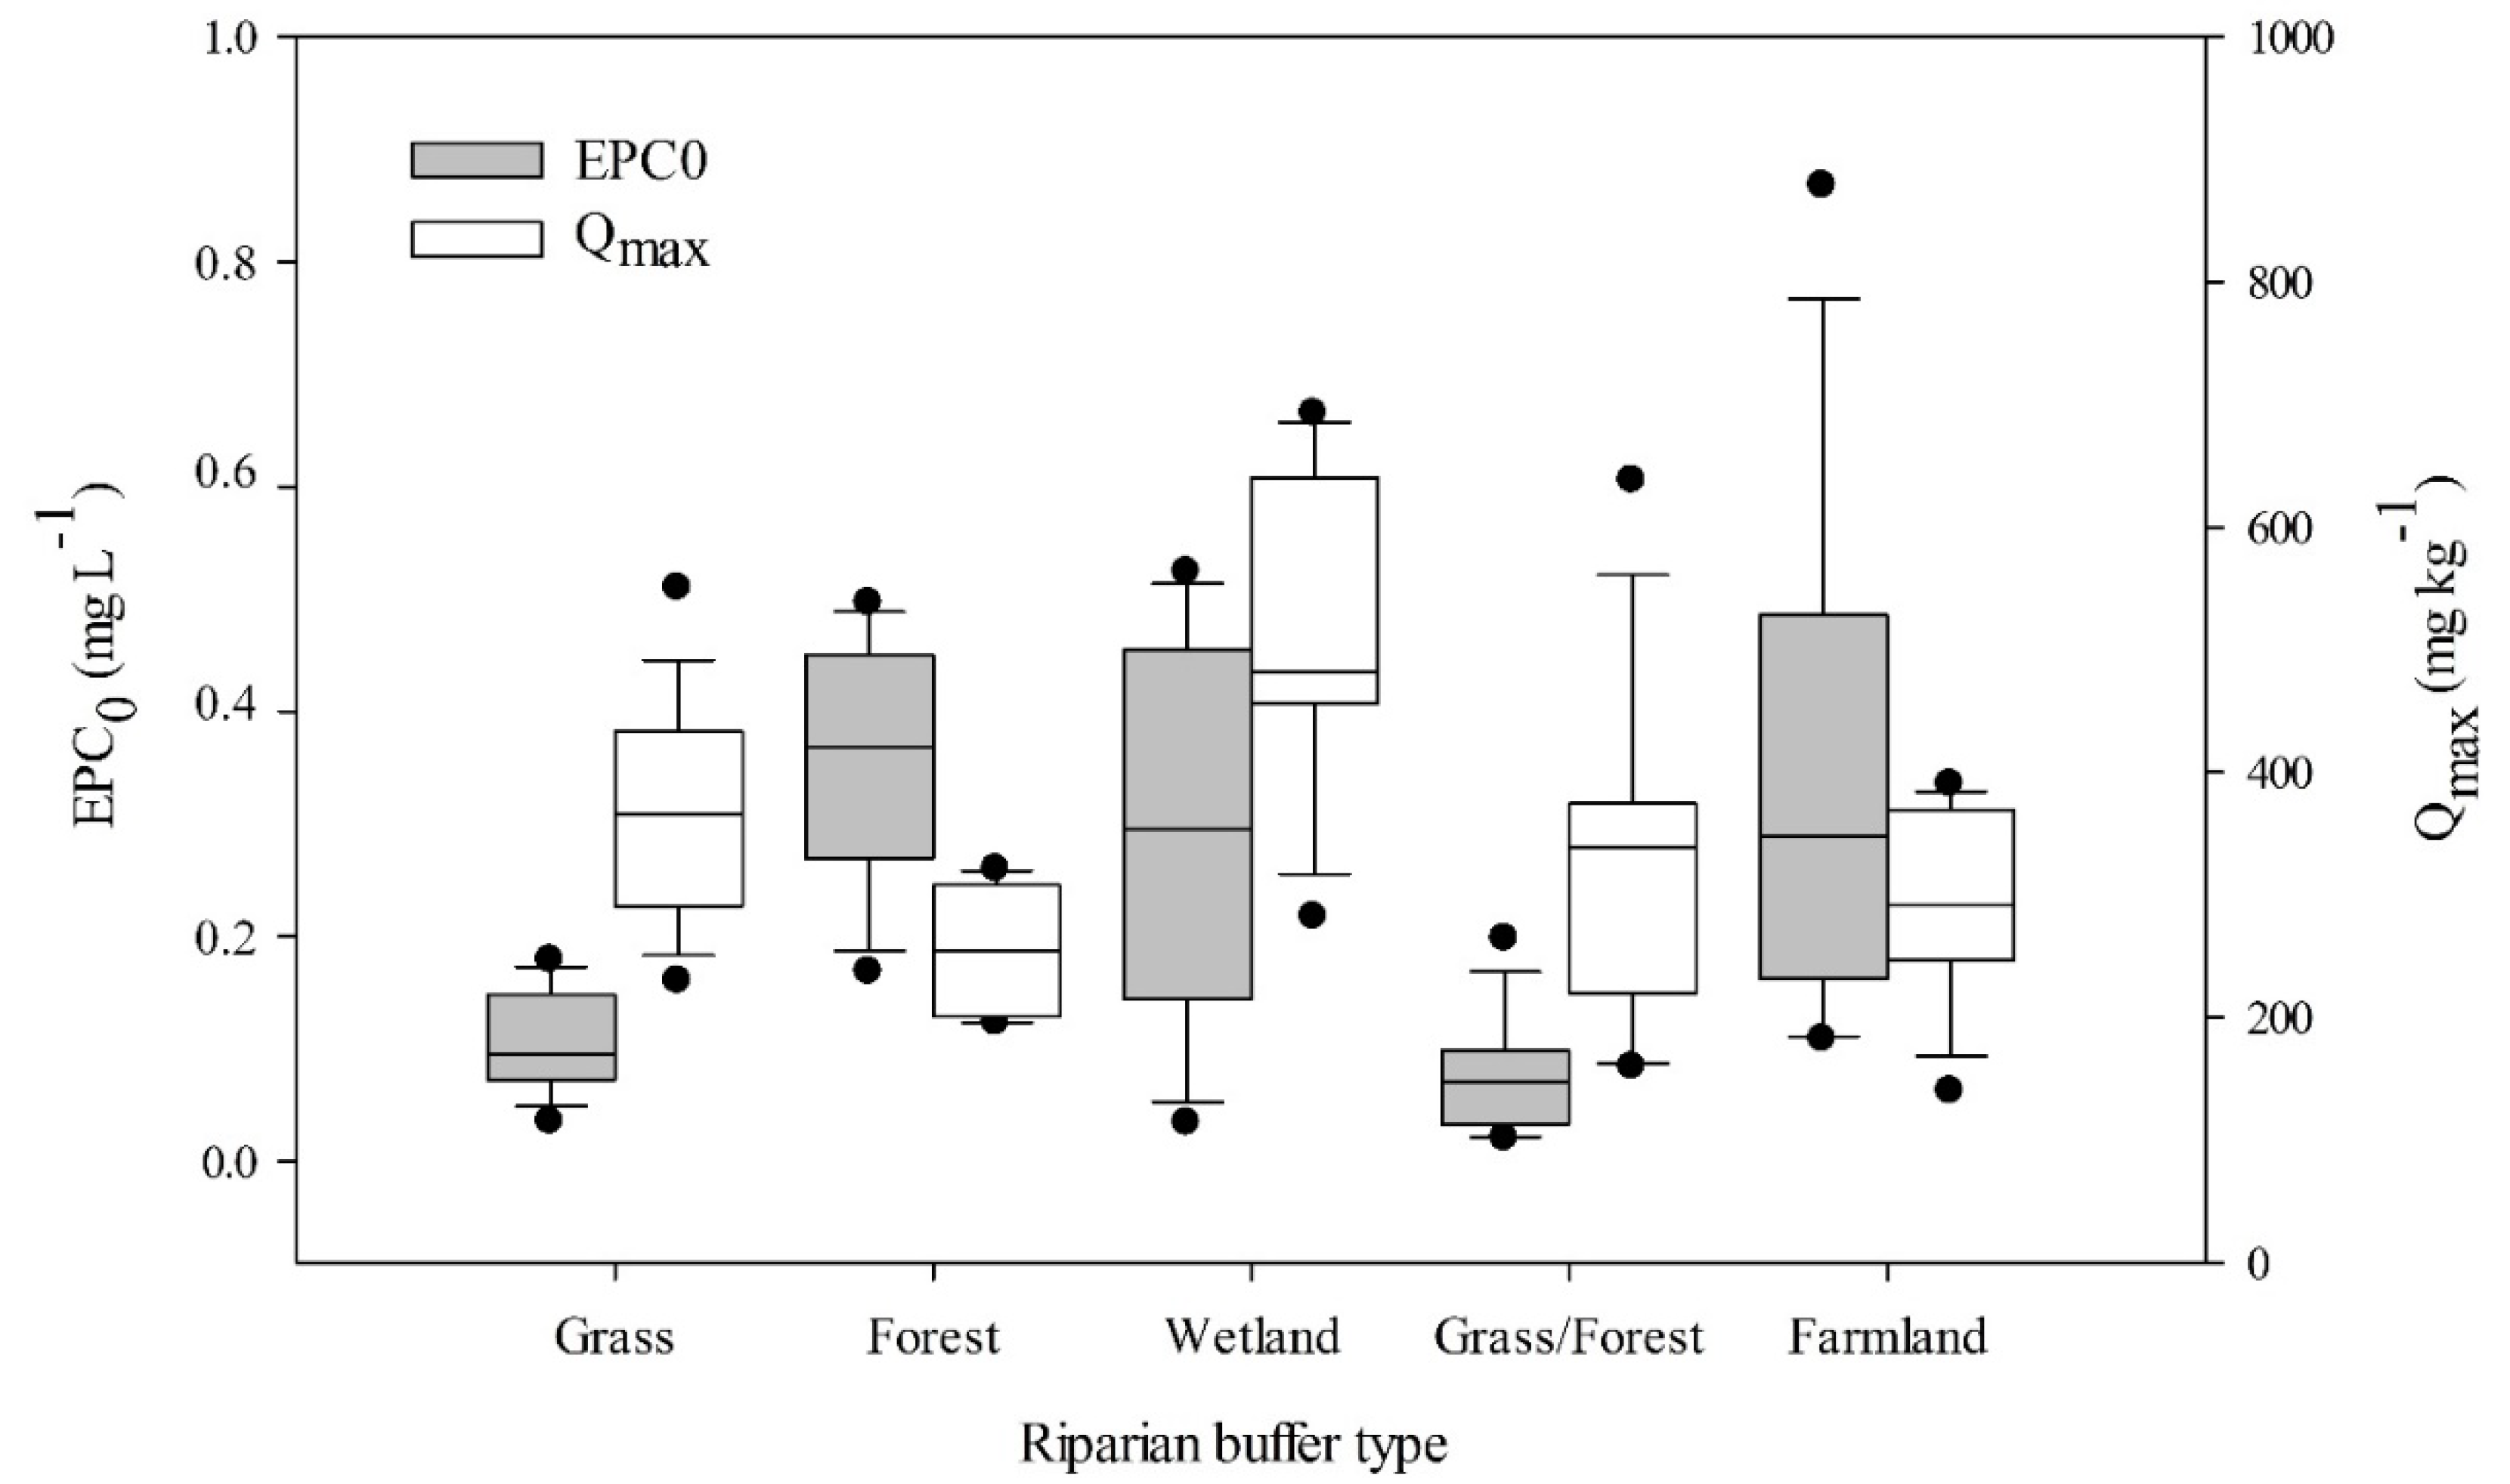
Compared to previous research, significantly higher EPC0 (0.24 mg L−1 on average) and lower Qmax (352.5 mg kg−1 on average) were recorded in the riparian buffers of Lake Chaohu (Figure 5). In horizontal profile, the highest Qmax value in the wetland riparian buffer and the lowest EPC0 value in the grass/forest riparian buffer, as well as the lower Qmax value and the higher EPC0 value in farmland and forest riparian buffers, are shown in Figure 5. Similarly, considerably low PNR and PDR levels were found in this study (Figure 6). In horizontal profile, the higher PNR and PDR were observed in grass and forest riparian buffers and the lowest PNR and PDR were observed in the farmland riparian buffer (Figure 6).
The low TP concentration was distributed in the littoral zone of the southeast area (mainly wetland riparian buffer from Site L2 to L7) and the northeast area (mainly grass/forest riparian buffer from Site L15 to L17), as well as Site L19 in Lake Chaohu. The high TP concentration was distributed in the littoral zone of the north area (mainly farmland riparian buffer in Site L1, L2, L17, L18, L20, L21, and L22) and the southeast area (mainly grass riparian buffer from Site L7 to L15) in Lake Chaohu (Figure 1).
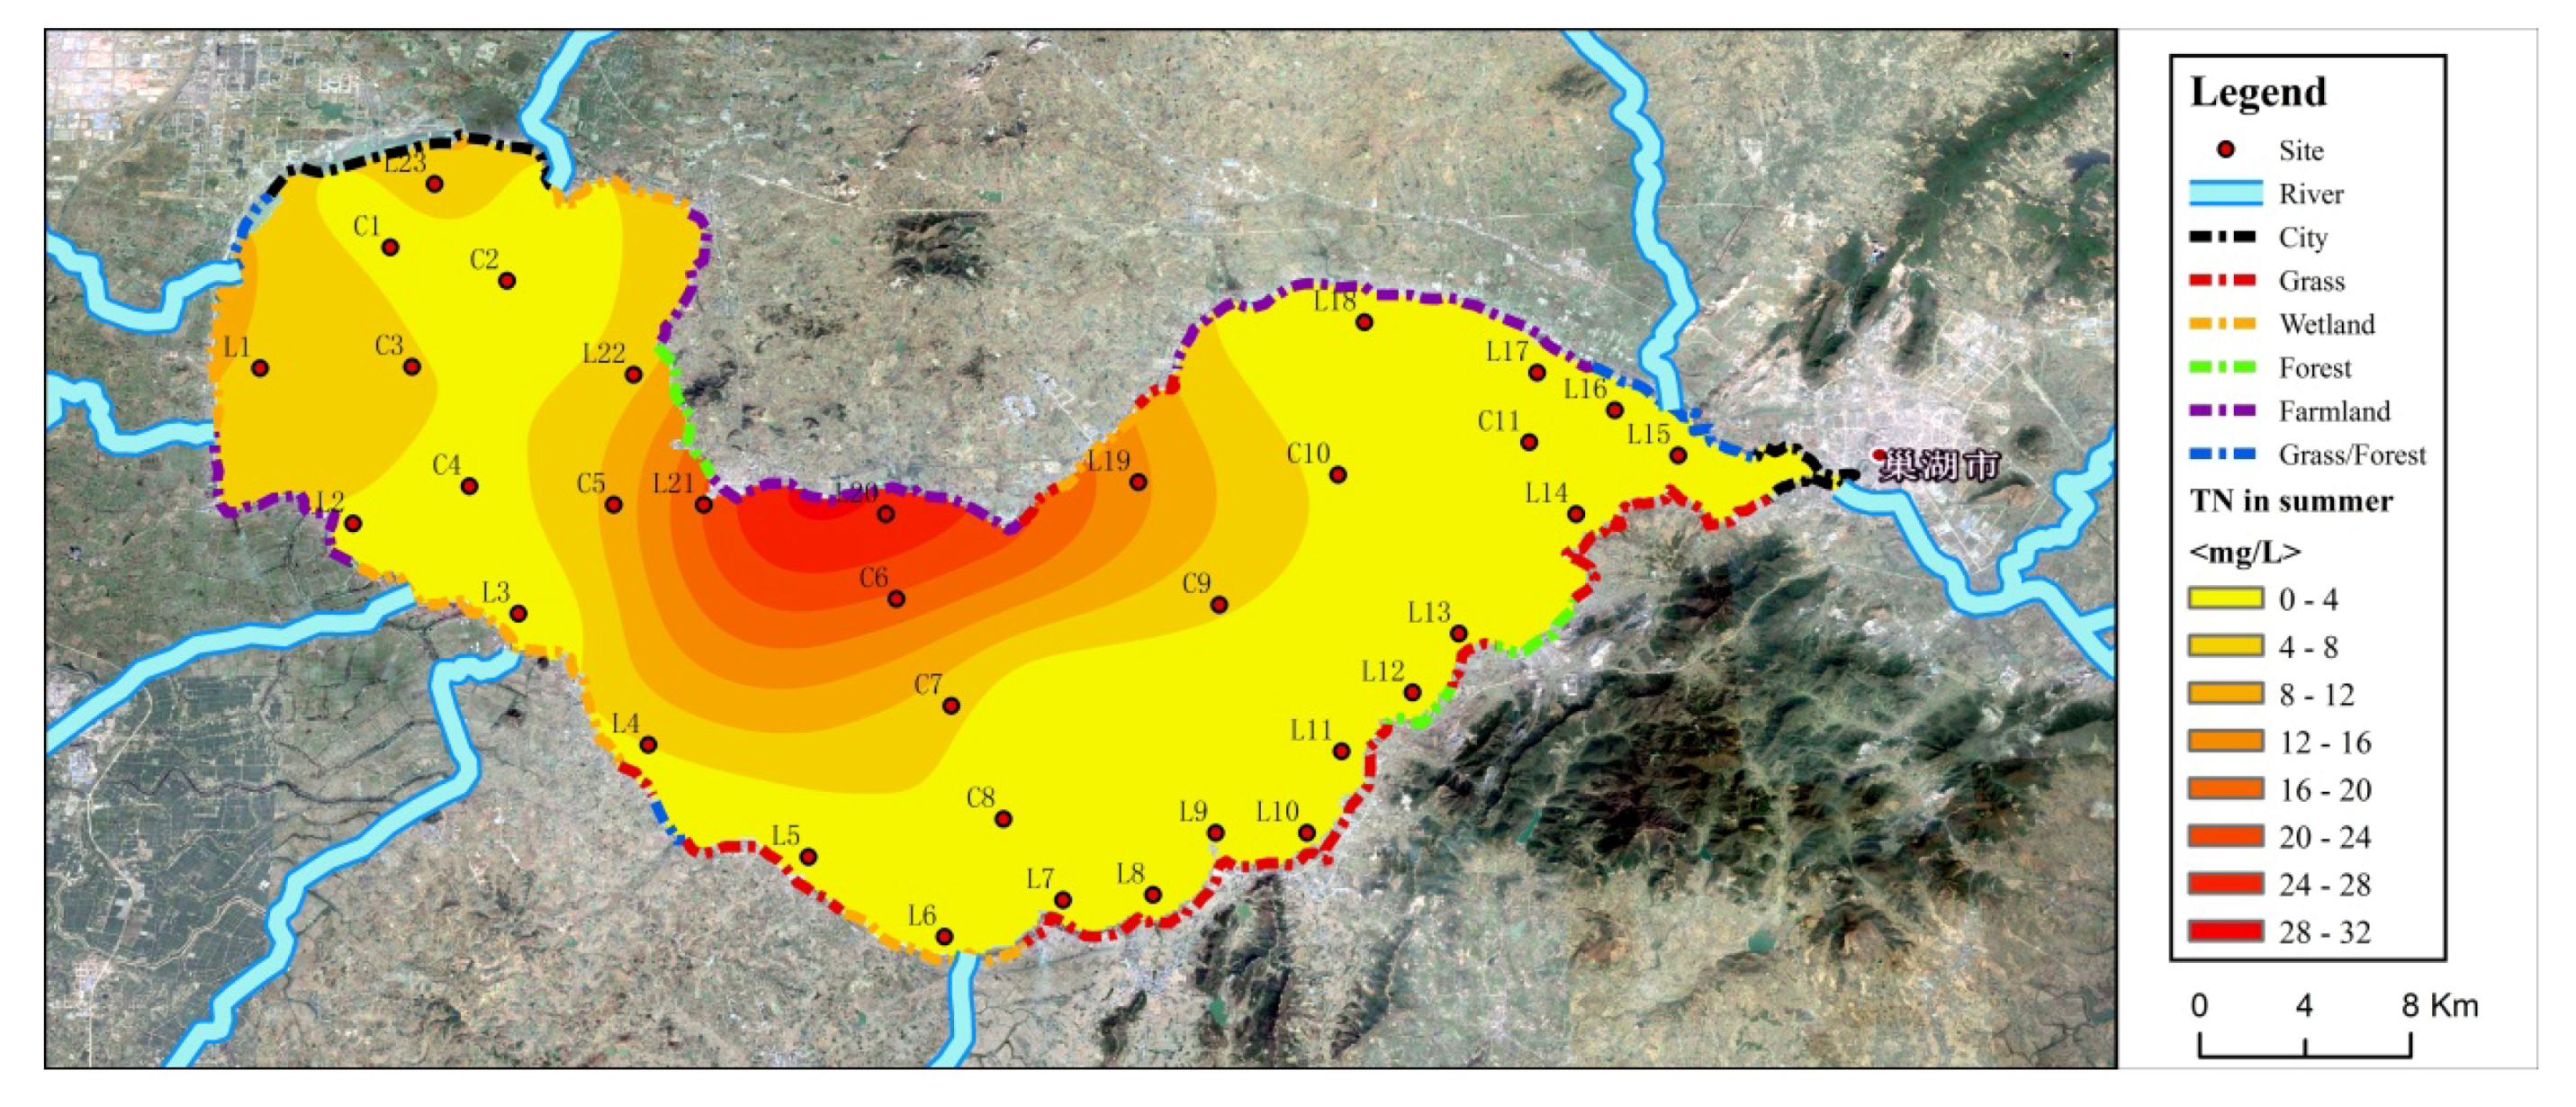
The TN showed similar tendencies to the TP. In the southeast area, the grass riparian buffer contributed mainly to the low TN value in littoral zones, and the farmland riparian buffer, with nutrient leaching, was responsible for the high TN level in the littoral zone of the north area of Lake Chaohu (Figure 2).
4. Discussion
The log-normal relationships between riparian buffer width and nutrient removal efficiency for TP and TN are in agreement with previous reports [6,16]. The longer width demand for TN compared to TP at specific nutrient removal efficiencies can be explained by nutrient retention capabilities. Strong retention of inorganic P and weaker retention of inorganic N by soil indicates greater contribution to the increased export of nitrogen [26]. Through the comparison of riparian buffer width demand between this study and previous research, it is not hard to find that the width demand in this study is greater than that of previous research. In rural temperate watersheds of Brazil, riparian buffer zones with 60 m width and composed of woody soils were more effective in phosphorus (99.9%) and nitrogen (99.9%) removal when compared to shrub (66.4% and 83.9%, respectively) or grass vegetation (52.9% and 61.6%, respectively) areas [27]. In Europe and the United States, riparian width (smaller than 10 m) provided limited protection against nitrate contamination [13,14]. During rainfall simulation, the switch-grass buffer removed 64 and 72% of the incoming TN and TP, respectively. The switch grass-woody buffer removed 80 and 93% of the incoming TN and TP, respectively [8]. A meta-analysis of literature has shown that more than 96% of the buffers studied for N and P removal were less than 20 m wide, and buffers composed of trees had higher N and P removal efficacy than buffers composed of grasses or mixtures of grasses and trees [6]. The huge width demand of riparian buffers in this study should be attributed to the decline of nutrient removal ability due to soil degradation and low vegetation diversity. A close relationship exists between land use, soil properties, and nutrient removal [28]. On the other hand, aggressive non-native plant species have colonized and dominated, the diversity of native plants has declined, and the plant community structure has been simplified [29], leading to less efficiency of riparian buffers as sinks for nutrients. Structurally diverse riparian buffers, i.e., those that contain a mix of trees, shrubs, and grass, are much more effective at capturing a wide range of nutrients than a riparian buffer that is solely of trees or grass [30]. Hence, the over-use and over-fertilization of soil and human intervention on vegetation restoration in riparian buffers around Lake Chaohu watershed has directly resulted in the decline of soil physicochemical characteristics and rhizospheric microbial activities as well as community composition diversity [31,32], eventually accelerating the nutrient leaching of soil and the decline of nutrient removal efficiency. All these factors have jointly caused the enormous demand on riparian buffer width, which facilitated the administrative organization in reserving or restoring more riparian buffers for effective nutrient removal.
EPC0 is the soluble reactive phosphorus (SRP) concentration in equilibrium with soil at which neither net sorption nor desorption occurs. In short, soil with a high EPC0 value will have a greater tendency to desorb (release) SRP. Lower EPCo values would suggest that this particular soil is inclined to adsorb P from runoff [33,34]. Qmax represents the P adsorption capability. In this study, significantly higher EPC0 and lower Qmax indicated weak P adsorption ability in riparian buffers of Lake Chaohu (Figure 3) compared to previous reports that exhibited a lower and higher value by an order of magnitude for EPC0 and for Qmax, respectively [35,36]. In horizontal profile, the higher TP removal efficiency in wetland and forest/grass riparian buffers in this study can be explained by the highest Qmax value in the wetland riparian buffer and the lowest EPC0 value in the grass/forest riparian buffer, indicating high P adsorption capacity in wetland riparian buffers and strong P retention ability in grass/forest riparian buffers. At the same time, the lower Qmax value and the higher EPC0 value in farmland and forest riparian buffers manifested the weak P adsorption ability, which was in parallel, with no relationship between riparian buffer width and TP removal efficiency in the forest riparian buffer and P leaching from the farmland riparian buffer. All these facts indicates the close relationship between riparian buffer width demand for P removal and P adsorption ability.
TN removal efficiency depended on the PNR and PDR. Similarly, compared to previous reports on soil reviewed by Xu et al. [37], considerably low PNR and PDR levels in this study directly caused the decrease of N removal efficiency and the increase of riparian buffer width demand. In horizontal profile, the highest TN removal efficiency in the grass riparian buffer was found to be coupled with the highest PNR and PDR, indicating strong N removal through coupled nitrification-denitrification. Although the higher PNR and PDR were found in the forest riparian buffer, the amount of N leaching from the forest probably exceeded that of the N removal, resulting in low TN removal efficiency. In the wetland riparian buffer, the lower PNR restricted the denitrification process and TN removal efficiency. The difference of PNR and PDR in the different types of riparian buffers should be attributed to the quality and quantity of organic carbon, aerobic and anaerobic conditions, and the activity and community composition of rhizobacteria [38]. Taken together, the demand of riparian buffer width for P and N removal was closely related with P adsorption ability and coupled nitrification-denitrification ability in soil, respectively.
The nutrient removal efficiency of the riparian buffers made a crucial effect on the nutrient level of the water column in the adjacent aquatic ecosystem, especially in littoral zones. In this study, high TP removal efficiency in wetland and grass/forest buffers was responsible for low TP distribution in the littoral zone of the southeast area (mainly wetland riparian buffer) and the northeast area (mainly grass/forest riparian buffer) in Lake Chaohu. Weak TP removal efficiency in the other buffers also correspond to high TP levels in littoral zones of the north area (mainly farmland riparian buffer) and the southeast area (mainly grass riparian buffer) of Lake Chaohu. In the southeast area, the grass buffer with high TN removal efficiency contributed mainly to the low TN value in littoral zones, and the farmland buffer with nutrient leaching was responsible for the high TN level in littoral zones of the north area in Lake Chaohu. All these facts mentioned above validated the prediction that nutrient removal of riparian buffers had an important contribution to lake eutrophication.
5. Conclusions
The vegetation cover type of riparian buffers can determine the physiochemical features of riparian buffer soil, which further influences the storm water nutrient removal efficiency, resulting in the change of nutrient levels in littoral zones of lake. Construction of wetland or grass/forest and grass riparian buffer strips is strongly recommended for effective TP and TN removal, respectively.
Supplementary Materials
The following are available online at https://www.mdpi.com/2073-4441/10/10/1489/s1, Figure S1: the distribution of different land use types in the littoral zone around Lake Chaohu, Figure S2: the distribution of different land use types in the riparian buffer zone with a width of 10 km from the shoreline around Lake Chaohu.
Author Contributions
All authors contributed equally to the paper.
Funding
This research was funded by National Natural Science Foundation of China (41877381; 41573110), the Major Science and Technology Program for Water Pollution Control and Treatment (2017ZX07603), the State Key Laboratory of Freshwater Ecology and Biotechnology (2016FBZ07). The APC was funded by National Natural Science Foundation of China (41573110).
Acknowledgments
We thank Siyang Wang, Zijun Zhou and Yao Zhang for sampling helps.
Conflicts of Interest
The authors declare no conflict of interest. The founding sponsors had no role in the design of the study; in the collection, analyses, or interpretation of data; in the writing of the manuscript, and in the decision to publish the results.
References
- Klapproth, J.C.; Johnson, J.E. Understanding the science behind riparian forest buffers: Effects on water quality. Va. Polytech. Inst. State Univ. Publ. 2009, 22. Available online: https://vtechworks.lib.vt.edu/bitstream/handle/10919/48062/420-151_pdf.pdf?sequence=1&isAllowed=y (accessed on 1 May 2005).
- Phillips, J.D. An evaluation of the factors determining the effectiveness of water quality buffer zones. J. Hydrol. 1989, 107, 133–145. [Google Scholar] [CrossRef]
- Syversen, N. Effect of a cold-climate buffer zone on minimizing diffuse pollution from agriculture. Water Sci. Technol. 2002, 45, 69–76. [Google Scholar] [CrossRef] [PubMed]
- Syversen, N. Effect and design of buffer zones in the Nordic climate: The influence of width, amount of surface runoff, seasonal variation and vegetation type on retention efficiency for nutrient and particle runoff. Ecol. Eng. 2005, 24, 483–490. [Google Scholar] [CrossRef]
- Stutter, M.I.; Langan, S.J.; Lunsdom, D.G. Vegetated buffer strips can lead toincreased release of phosphorus to waters: A biogeochemical assessment of themechanisms. Environ. Sci. Technol. 2009, 43, 1858–1863. [Google Scholar] [CrossRef] [PubMed]
- Zhang, X.; Liu, X.; Zhang, M.; Dahlgren, R.A.; Eitzel, M. Review of vegetated buffers and a meta-analysis of their mitigation efficacy in reducing nonpoint source pollution. J. Environ. Qual. 2010, 39, 76–84. [Google Scholar] [CrossRef] [PubMed]
- Schwer, C.B.; Clausen, J.C. Vegetative filter treatment of dairy milkhouse wastewater. J. Environ. Qual. 1989, 18, 446–451. [Google Scholar] [CrossRef]
- Kyehan, L.; Isenhart, T.M.; Schultz, R.C.; Mickelson, S.K. Multispecies riparian buffers trap sediment and nutrients during rainfall simulations. J. Environ. Qual. 2000, 29, 1200–1205. [Google Scholar]
- Lowrance, R.R.; Todd, R.L.; Asmussen, L.E. Nutrient cycling in an agricultural watershed—I: Phreatic movement. J. Environ. Qual. 1984, 13, 22–27. [Google Scholar] [CrossRef]
- Lee, P.; Smyth, C.; Boutin, S. Quantitative review of riparian buffer width guidelines from Canada and the United States. J. Environ. Manag. 2004, 70, 165–180. [Google Scholar] [CrossRef]
- Spruill, T.B. Effectiveness of riparian buffers in controlling ground-water discharge of nitrate to streams in selected hydrogeological settings of the North Carolina Coastal Plain. Water Sci. Technol. 2004, 49, 63–70. [Google Scholar] [CrossRef] [PubMed]
- Vidon, P.G.F.; Hill, A.R. Landscape controls on nitrate removal in stream riparian zones. Water Resour. Res. 2004, 40, 114–125. [Google Scholar] [CrossRef]
- Borin, M.; Vianello, M.; Zanin, G. Effectiveness of buffer strips in removing pollutants in runoff from a cultivated field in North-East Italy. Agric. Ecosyst. Environ. 2005, 105, 101–114. [Google Scholar] [CrossRef]
- Hefting, M.M.; Clement, J.; Bienkowski, P.; Dowrick, D.; Guenat, C.; Butturini, A.; Topa, S.; Pinay, G.; Verhoeven, J.T.A. The role of vegetation and litter in the nitrogen dynamics of riparian buffer zones in Europe. Ecol. Eng. 2005, 24, 465–482. [Google Scholar] [CrossRef]
- Weissteiner, C.J.; Bouraoui, F.; Aloe, A. Reduction of nitrogen and phosphorus loads to european rivers by riparian buffer zones. Knowl. Manag. Aquat. Ecosyst. 2013, 483, 1–7. [Google Scholar] [CrossRef]
- Sweeney, B.W.; Newbold, J.D. Streamside forest buffer width needed to protect stream water quality, habitat, and organisms: A literature review. J. Am. Water Resour. Assoc. 2014, 50, 560–584. [Google Scholar] [CrossRef]
- Miller, J.J.; Curtis, T.; Chanasyk, D.S.; Reedyk, S. Influence of mowing and narrow grass buffer widths on reductions in se. Can. J. Soil Sci. 2015, 95, 139–151. [Google Scholar] [CrossRef]
- Zheng, L.G.; Liu, G.J.; Kang, Y.; Yang, R.K. Some potential hazardous trace elements contamination and their ecological risk in sediments of western Chaohu Lake, China. Environ. Monit. Assess. 2010, 166, 379–386. [Google Scholar] [CrossRef] [PubMed]
- Ward, J.R.; Harr, C.A. (Eds.) Methods for Collection and Processing of Surface-Water and Bed-Material Samples for Physical and Chemical Analyses; U.S. Geological Survey Open-File Report; U.S. Geological Survey: Reston, VA, USA, 1990; Volume 71, pp. 90–140.
- Rice, E.W.; Baird, R.B.; Eaton, A.D.; Clesceri, L.S. Standard Methods for the Examination of Water and Wastewater, 22nd ed.; American Public Health Association: Washington, DC, USA, 2012. [Google Scholar]
- Istvanovics, V. Fractional composition, adsorption and release of sediment phosphorus in the Kis-Balaton reservoir. Water Res. 1994, 28, 717–726. [Google Scholar] [CrossRef]
- Xiao, W.J.; Song, C.L.; Cao, X.Y.; Zhou, Y.Y. Effects of air-drying on phosphorus sorption in shallow lake sediment, China. Fresenius Environ. Bull. 2012, 21, 672–678. [Google Scholar]
- Huang, X.; Liu, C.X.; Wang, Z.; Gao, C.F.; Zhu, G.F.; Liu, L. The effects of different substrates on ammonium removal in constructed wetlands: A comparison of their physicochemical characteristics and ammonium-oxidizing prokaryotic communities. Clean Soil Air Water 2013, 41, 283–290. [Google Scholar] [CrossRef]
- Fan, F.L.; Zhang, F.S.; Lu, Y.H. Linking plant identity and interspecific competition to soil nitrogen cycling through ammonia oxidizer communities. Soil Biol. Biochem. 2011, 43, 46–54. [Google Scholar] [CrossRef]
- Jha, P.K.; Minagawa, M. Assessment of denitrification process in lower Ishikari River system, Japan. Chemosphere 2013, 93, 1726–1733. [Google Scholar] [CrossRef] [PubMed]
- Harms, T.K.; Ludwig, S.M. Retention and removal of nitrogen and phosphorus in saturated soils of arctic hillslopes. Biogeochemistry 2016, 127, 291–304. [Google Scholar] [CrossRef]
- Aguiar, T.R.; Rasera, K.; Parron, L.M.; Brito, A.G.; Ferreira, M.T. Nutrient removal effectiveness by riparian buffer zones in rural temperate watersheds: The impact of no-till crops practices. Agric. Water Manag. 2015, 149, 74–80. [Google Scholar] [CrossRef]
- Castelle, A.J.; Johnson, A.W.; Conolly, C. Wetland and stream buffer size requirements—A review. J. Environ. Qual. 1994, 23, 878–882. [Google Scholar] [CrossRef]
- Gardner, P.A.; Stevens, R.; Howe, F.P. A Handbook of Riparian Restoration and Revegetation for the Conservation of Land Birds in Utah with Emphasis on Habitat Types in Middle and Lower Elevations; Utah Division of Wildlife Resources: Salt Lake City, UT, USA, 1999; Volume 48, pp. 1–48.
- Jontos, R. Vegetative buffers for water quality protection: An introduction and guidance document. Connecticut Association of Wetland Scientists White Paper on Vegetative Buffers, Draft Version; 2004, Volume 1. Available online: http://www.ctwetlands.org/downloads/Draft%20Buffer%20Paper%20Version%201.0.doc (accessed on 21 October 2018).
- Zhang, C.; Liu, G.; Xue, S.; Wang, G. Changes in rhizospheric microbial community structure and function during the natural recovery of abandoned cropland on the Loess Plateau, China. Ecol. Eng. 2015, 75, 161–171. [Google Scholar] [CrossRef]
- Kuramae, E.E.; Etienne, Y.; Wong, L.C.; Pijl, A.S.; Veen, J.A.; Kowalchuk, G.A. Soil characteristics more strongly influence soil bacterial, communities than land-use type. FEMS Microbiol. Ecol. 2012, 79, 12–24. [Google Scholar] [CrossRef] [PubMed]
- Phillips, I.R. Nitrogen and phosphorus transport in soil using simulated waterlogged conditions. Commun. Soil Sci. Plan. 2001, 32, 821–842. [Google Scholar] [CrossRef]
- Litaor, M.I.; Reichmann, O.; Haim, A.; Auerswald, K.; Shenker, M. Sorption characteristics of phosphorus in peat soils of a semiarid altered wetland. Soil Sci. Soc. Am. J. 2005, 69, 1658–1665. [Google Scholar] [CrossRef]
- Heiberg, L.; Pedersen, T.V.; Jensen, H.S.; Kjaergaard, C.; Hansen, H.C.B. A comparative study of phosphate sorption in lowland soils under oxic and anoxic conditions. J. Environ. Qual. 2010, 39, 734–743. [Google Scholar] [CrossRef] [PubMed]
- Janardhanan, L.; Daroub, S.H. Phosphorus sorption in organic soils in south Florida. Soil Sci. Soc. Am. J. 2010, 74, 1597–1606. [Google Scholar] [CrossRef]
- Xu, Y.; Xu, Z.; Cai, Z.; Reverchon, F. Review of denitrification in tropical and subtropical soils of terrestrial ecosystems. J. Soil. Sediments 2013, 13, 699–710. [Google Scholar] [CrossRef]
- Lowrance, R.; Vellidis, G.; Hubbard, R.K. Denitrification in a restored riparian forest wetland. J. Environ. Qual. 1995, 24, 808–815. [Google Scholar] [CrossRef]
Figure 1.
A map showing TP distribution in the littoral and deep zones of Lake Chaohu, including the distribution of riparian buffer type.
Figure 1.
A map showing TP distribution in the littoral and deep zones of Lake Chaohu, including the distribution of riparian buffer type.

Figure 2.
A map showing TN distribution in the littoral and deep zones of Lake Chaohu, including the distribution of riparian buffer types.
Figure 2.
A map showing TN distribution in the littoral and deep zones of Lake Chaohu, including the distribution of riparian buffer types.

Figure 3.
Relationships between TP removal efficiency for storm water and the width of different types of riparian buffer in the Lake Chaohu watershed. (A) Grass; (B) Forest; (C) Wetland; (D) Grass/Forest.
Figure 3.
Relationships between TP removal efficiency for storm water and the width of different types of riparian buffer in the Lake Chaohu watershed. (A) Grass; (B) Forest; (C) Wetland; (D) Grass/Forest.

Figure 4.
Relationships between TN removal efficiency for storm water and the width of different types of riparian buffer in the Lake Chaohu watershed. (A) Grass; (B) Forest; (C) Wetland; (D) Grass/Forest.
Figure 4.
Relationships between TN removal efficiency for storm water and the width of different types of riparian buffer in the Lake Chaohu watershed. (A) Grass; (B) Forest; (C) Wetland; (D) Grass/Forest.

Figure 5.
Comparison of phosphorus adsorption ability (Qmax and EPC0) in different types of riparian buffer soil.
Figure 5.
Comparison of phosphorus adsorption ability (Qmax and EPC0) in different types of riparian buffer soil.

Figure 6.
Comparison of PNR and PDR in different types of riparian buffer soil.


Table 1.
The relationship between TN and TP removal efficiency and riparian buffer width. Based on a given percent effectiveness (50%, 75%, and 90%), buffer widths are approximate values predicted by the non-linear model, y = a × ln(x) + b.
Table 1.
The relationship between TN and TP removal efficiency and riparian buffer width. Based on a given percent effectiveness (50%, 75%, and 90%), buffer widths are approximate values predicted by the non-linear model, y = a × ln(x) + b.
| Riparian Buffer Type | N | Relationship between TP Removal Efficiency and Buffer Width | Approximate Buffer Width (m) by Predicted TP Effectiveness | Relationship between TN Removal Efficiency and Buffer Width | Approximate Buffer Width (m) by Predicted TN Effectiveness | ||||||
|---|---|---|---|---|---|---|---|---|---|---|---|
| Model | R2 | 50% | 75% | 90% | Model | R2 | 50% | 75% | 90% | ||
| Grass | 37 | y = 0.1155ln(x) − 0.0367 | 0.7124 | 104 | 908 | 3325 | y = 0.1426ln(x) − 0.1938 | 0.9043 | 130 | 749 | 2143 |
| Forest | 27 | y = 3.6864 + 0.0436x | 0.4493 | 1062 | 1636 | 1980 | y = 0.1108ln(x) − 0.2841 | 0.6577 | 1184 | 11305 | 43775 |
| Wetland | 33 | y = 0.1628ln(x) − 0.1157 | 0.8073 | 44 | 204 | 512 | y = 0.1327ln(x) − 0.2678 | 0.8336 | 325 | 2142 | 6636 |
| Grass/Forest | 27 | y = 0.1142ln(x) + 0.1432 | 0.7411 | 23 | 203 | 755 | y = 0.1586ln(x) − 0.3401 | 0.8513 | 200 | 966 | 2488 |
© 2018 by the authors. Licensee MDPI, Basel, Switzerland. This article is an open access article distributed under the terms and conditions of the Creative Commons Attribution (CC BY) license (http://creativecommons.org/licenses/by/4.0/).
Share and Cite
MDPI and ACS Style
Cao, X.; Song, C.; Xiao, J.; Zhou, Y. The Optimal Width and Mechanism of Riparian Buffers for Storm Water Nutrient Removal in the Chinese Eutrophic Lake Chaohu Watershed. Water 2018, 10, 1489. https://doi.org/10.3390/w10101489
AMA Style
Cao X, Song C, Xiao J, Zhou Y. The Optimal Width and Mechanism of Riparian Buffers for Storm Water Nutrient Removal in the Chinese Eutrophic Lake Chaohu Watershed. Water. 2018; 10(10):1489. https://doi.org/10.3390/w10101489
Chicago/Turabian StyleCao, Xiuyun, Chunlei Song, Jian Xiao, and Yiyong Zhou. 2018. "The Optimal Width and Mechanism of Riparian Buffers for Storm Water Nutrient Removal in the Chinese Eutrophic Lake Chaohu Watershed" Water 10, no. 10: 1489. https://doi.org/10.3390/w10101489
Note that from the first issue of 2016, this journal uses article numbers instead of page numbers. See further details here.