Gut Microbiota and Their Derived Metabolites, a Search for Potential Targets to Limit Accumulation of Protein-Bound Uremic Toxins in Chronic Kidney Disease

 ,
,  , and
, and 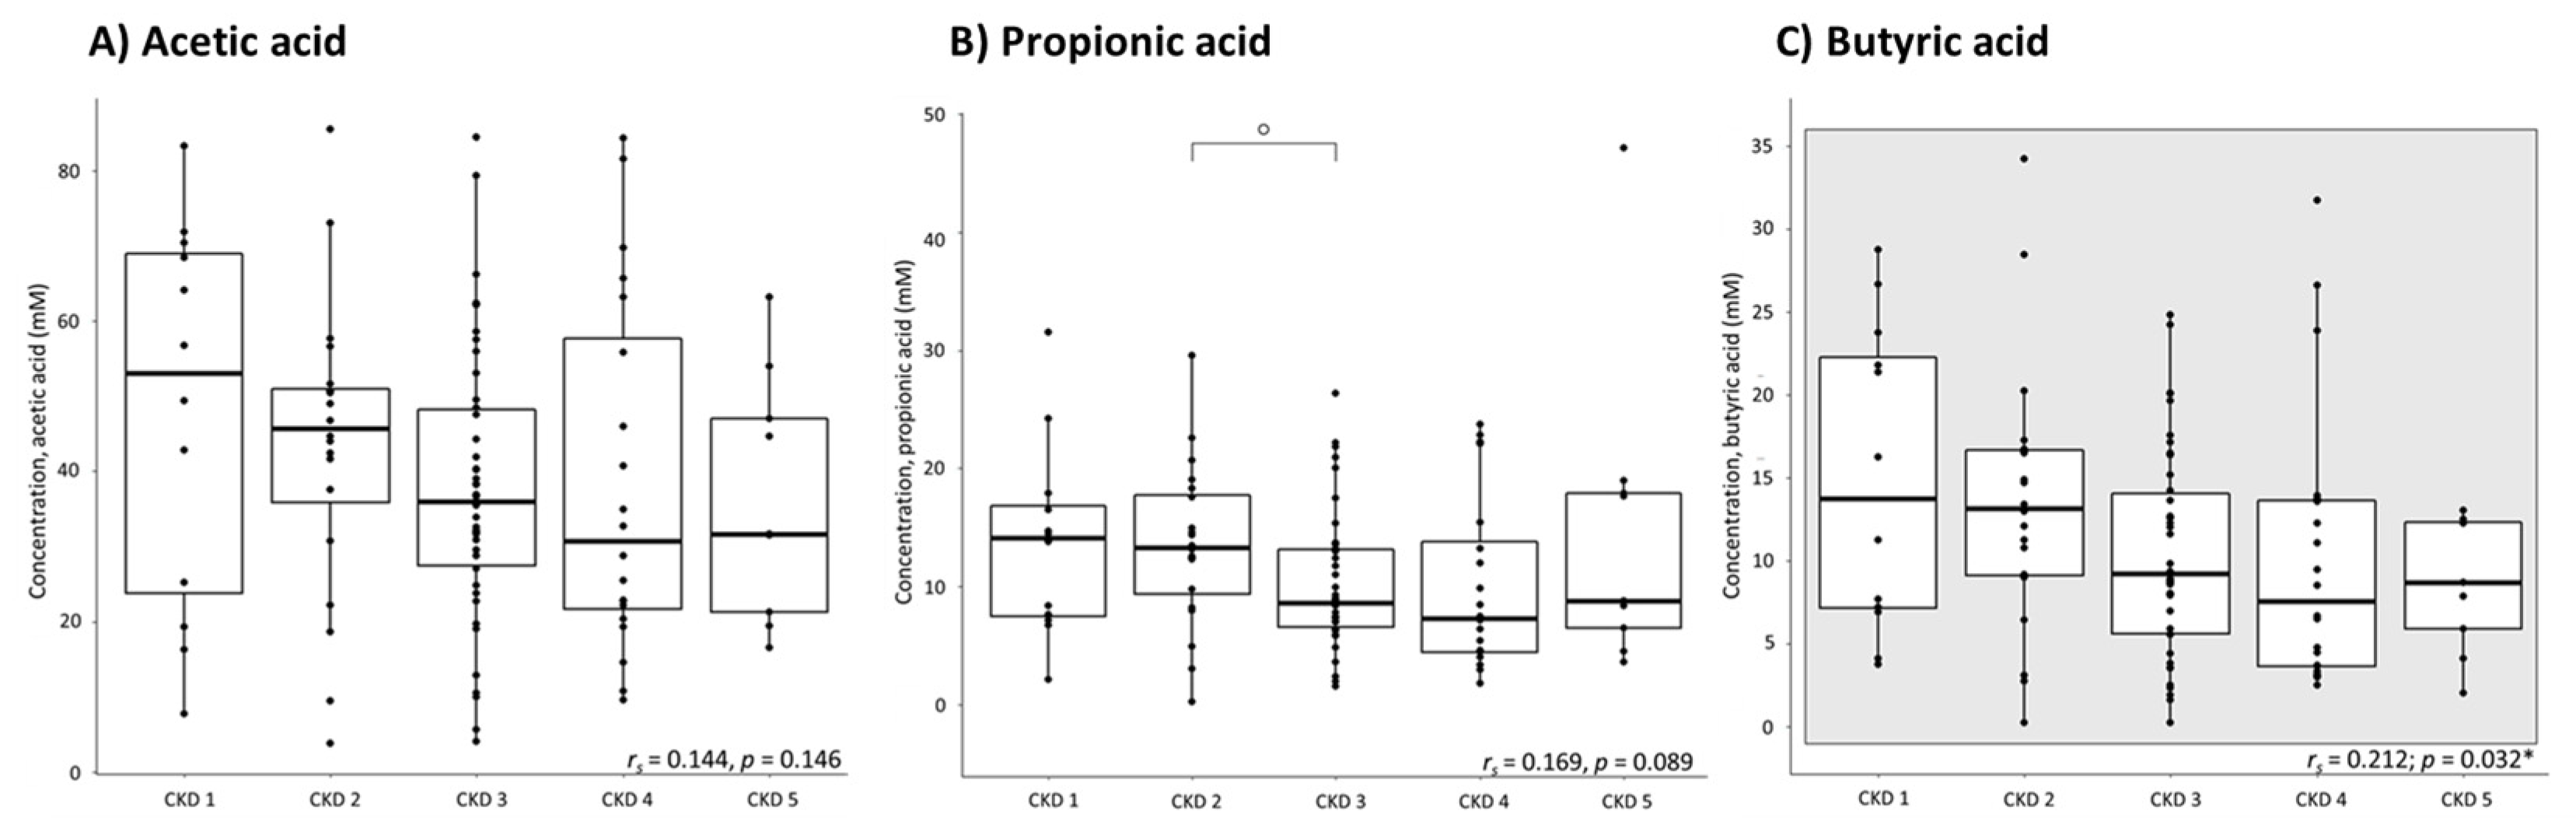
Abstract
:1. Introduction
2. Results
2.1. Fecal Levels of Short-Chain Fatty Acids over the Different Stages of CKD
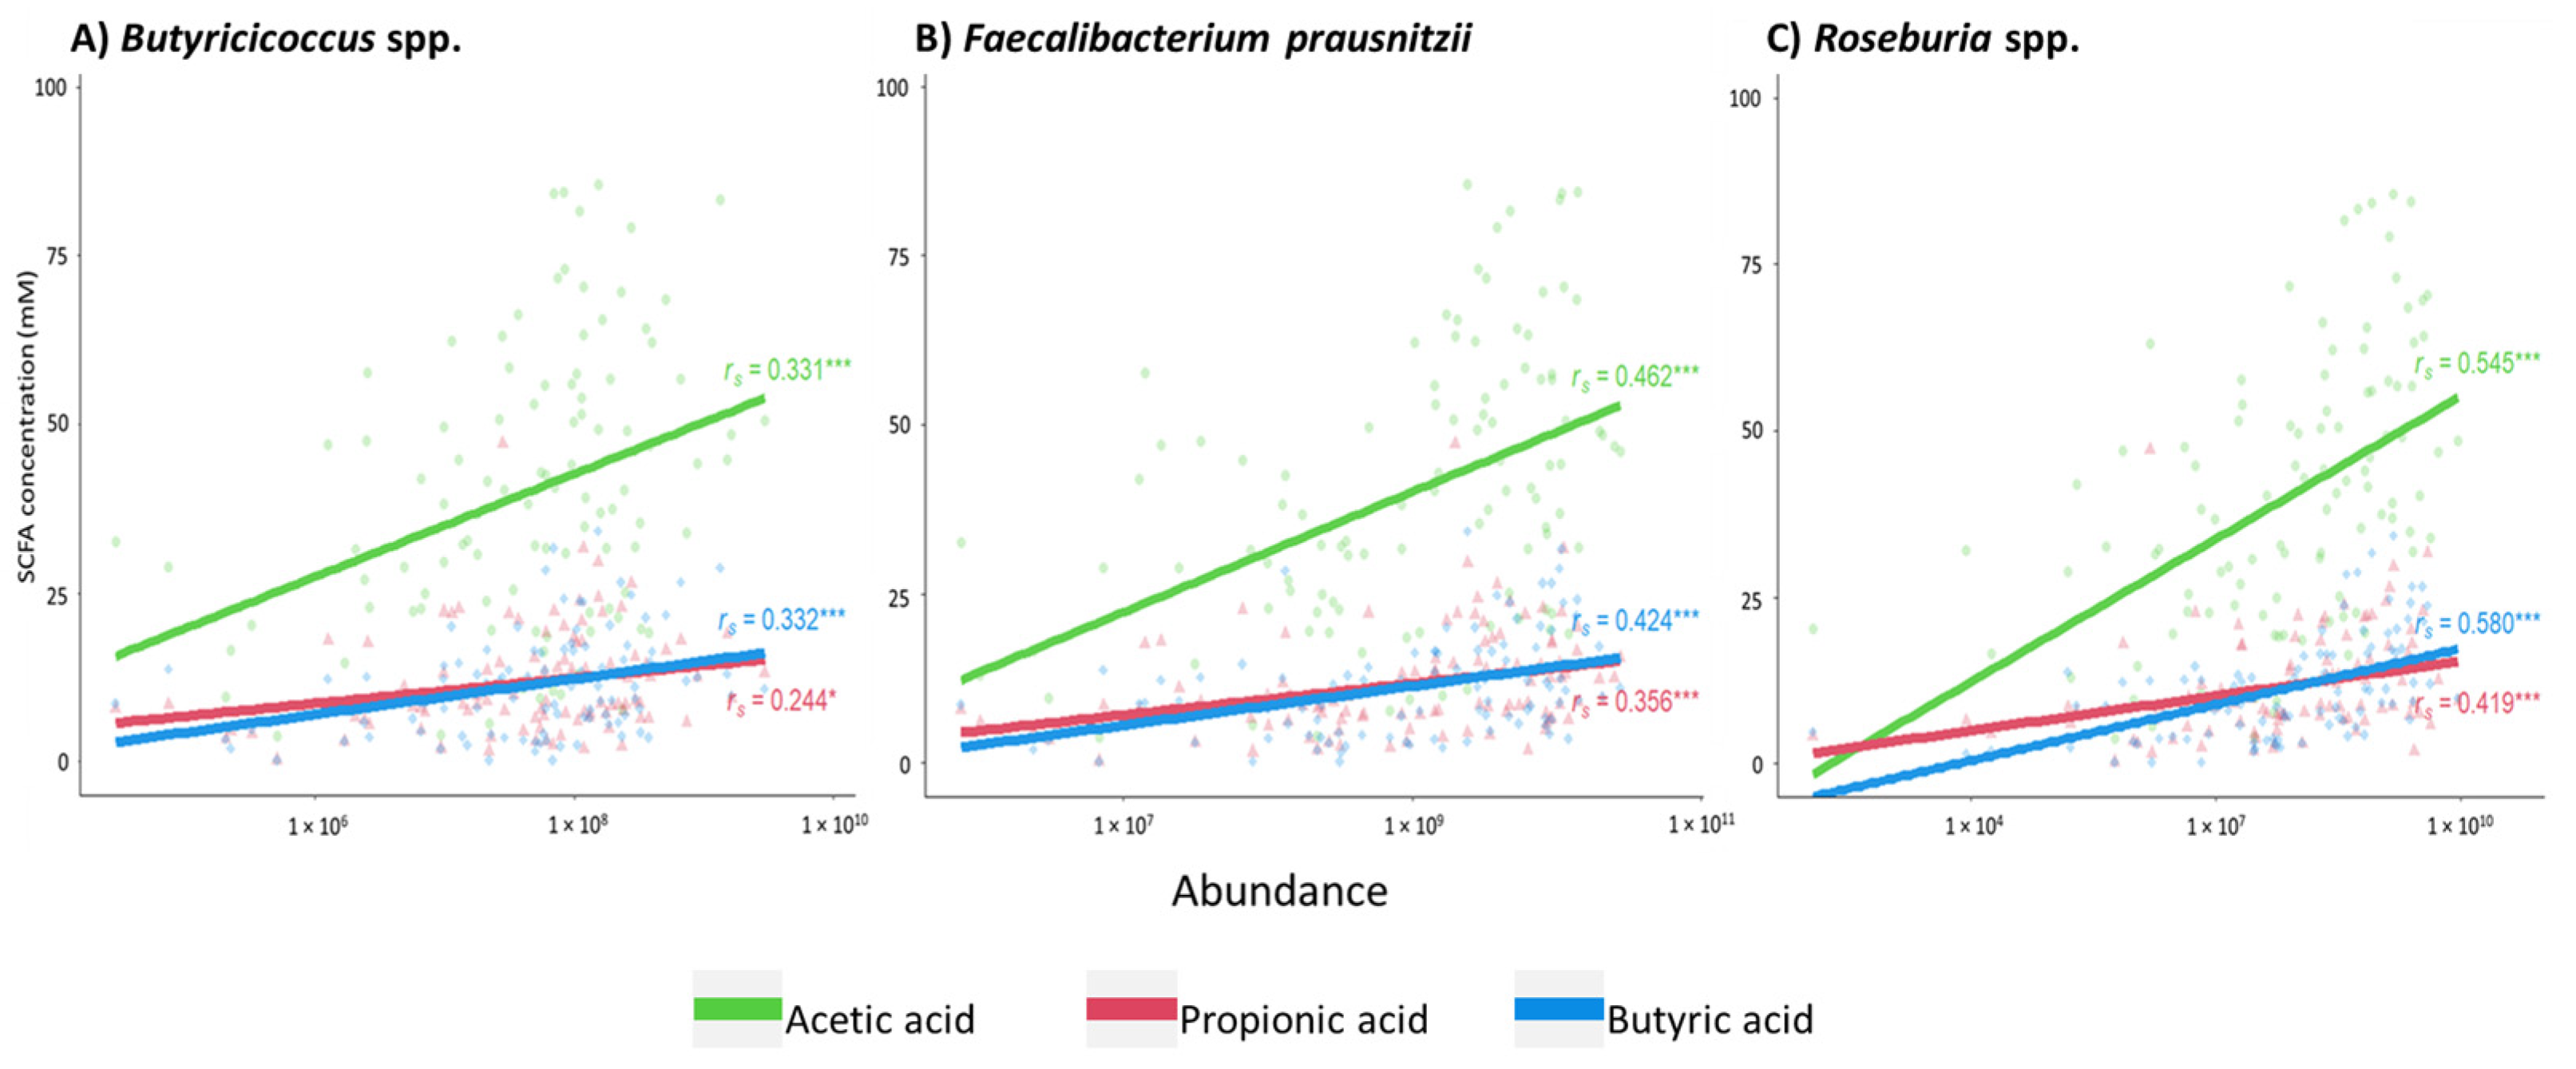
2.2. Association between the Presence of Short-Chain Fatty Acid-Producing Bacterial Species and Fecal Levels of Short-Chain Fatty Acids in CKD
2.3. Correlation between Fecal Levels of Short-Chain Fatty Acids and Metabolites of the Amino Acid Metabolism
2.4. Relationship between the Uremic Toxin Precursors in Feces and Their Corresponding Toxins in Plasma
2.5. Fecal Levels of Short-Chain Fatty Acids Are Associated with Plasma Levels of p-Cresol-Derived Uremic Toxins, p-Cresyl Sulfate and p-Cresyl Glucuronide
2.6. Albumin Modifications in CKD
2.7. Plasma Levels of and Protein-Bound Uremic Toxins and Percentage of Protein Binding Are Associated with the Albumin Symmetry Factor
3. Discussion
4. Materials and Methods
4.1. Cohort
4.2. Quantification of Bacterial Species in Fecal Samples
4.3. Preparation of the Fecal Suspension
4.4. Quantification of Uremic Toxins Precursors in the Fecal Suspension and Plasma of CKD Patients
4.5. Quantification of Short-Chain Fatty Acids in the Fecal Suspension of CKD Patients
4.6. Quantification of the Albumin Symmetry Factor
4.7. Other Parameters
4.8. Statistical Analysis
Supplementary Materials
Author Contributions
Funding
Institutional Review Board Statement
Informed Consent Statement
Data Availability Statement
Acknowledgments
Conflicts of Interest
References
- Duranton, F.; Cohen, G.; De Smet, R.; Rodriguez, M.; Jankowski, J.; Vanholder, R.; Argiles, A. Normal and pathologic concentrations of uremic toxins. J. Am. Soc. Nephrol. 2012, 23, 1258–1270. [Google Scholar] [CrossRef] [Green Version]
- Vanholder, R.; Pletinck, A.; Schepers, E.; Glorieux, G. Biochemical and Clinical Impact of Organic Uremic Retention Solutes: A Comprehensive Update. Toxins 2018, 10, 33. [Google Scholar] [CrossRef] [PubMed] [Green Version]
- Hobby, G.P.; Karaduta, O.; Dusio, G.F.; Singh, M.; Zybailov, B.L.; Arthur, J.M. Chronic kidney disease and the gut microbiome. Am. J. Physiol. Renal Physiol. 2019, 316, F1211–F1217. [Google Scholar] [CrossRef]
- Nallu, A.; Sharma, S.; Ramezani, A.; Muralidharan, J.; Raj, D. Gut microbiome in chronic kidney disease: Challenges and opportunities. Transl. Res. 2017, 179, 24–37. [Google Scholar] [CrossRef] [PubMed] [Green Version]
- Mair, R.D.; Sirich, T.L.; Plummer, N.S.; Meyer, T.W. Characteristics of Colon-Derived Uremic Solutes. Clin. J. Am. Soc. Nephrol. 2018, 13, 1398–1404. [Google Scholar] [CrossRef] [Green Version]
- Gryp, T.; De Paepe, K.; Vanholder, R.; Kerckhof, F.M.; Van Biesen, W.; Van de Wiele, T.; Verbeke, F.; Speeckaert, M.; Joossens, M.; Couttenye, M.M.; et al. Gut microbiota generation of protein-bound uremic toxins and related metabolites is not altered at different stages of chronic kidney disease. Kidney Int. 2020, 97, 1230–1242. [Google Scholar] [CrossRef] [Green Version]
- Meijers, B.; Farré, R.; Dejongh, S.; Vicario, M.; Evenepoel, P. Intestinal Barrier Function in Chronic Kidney Disease. Toxins 2018, 10, 298. [Google Scholar] [CrossRef] [Green Version]
- Ramakrishna, B.S.; Gee, D.; Weiss, A.; Pannallc, P.; Roberts-Thomson, I.C.; Roediger, W.E. Estimation of phenolic conjugation by colonic mucosa. J. Clin. Pathol. 1989, 42, 620–623. [Google Scholar] [CrossRef] [PubMed]
- Schepers, E.; Glorieux, G.; Vanholder, R. The gut: The forgotten organ in uremia? Blood Purif. 2010, 29, 130–136. [Google Scholar] [CrossRef]
- Gryp, T.; Vanholder, R.; Vaneechoutte, M.; Glorieux, G. p-Cresyl Sulfate. Toxins 2017, 9, 52. [Google Scholar] [CrossRef] [Green Version]
- Gryp, T.; Huys, G.R.B.; Joossens, M.; Van Biesen, W.; Glorieux, G.; Vaneechoutte, M. Isolation and Quantification of Uremic Toxin Precursor-Generating Gut Bacteria in Chronic Kidney Disease Patients. Int. J. Mol. Sci. 2020, 21, 1986. [Google Scholar] [CrossRef] [Green Version]
- Al Khodor, S.; Shatat, I.F. Gut microbiome and kidney disease: A bidirectional relationship. Pediatric Nephrol. 2017, 32, 921–931. [Google Scholar] [CrossRef] [PubMed] [Green Version]
- Wong, J.; Piceno, Y.M.; DeSantis, T.Z.; Pahl, M.; Andersen, G.L.; Vaziri, N.D. Expansion of urease- and uricase-containing, indole- and p-cresol-forming and contraction of short-chain fatty acid-producing intestinal microbiota in ESRD. Am. J. Nephrol. 2014, 39, 230–237. [Google Scholar] [CrossRef] [PubMed] [Green Version]
- Pascale, A.; Marchesi, N.; Marelli, C.; Coppola, A.; Luzi, L.; Govoni, S.; Giustina, A.; Gazzaruso, C. Microbiota and metabolic diseases. Endocrine 2018, 61, 357–371. [Google Scholar] [CrossRef] [PubMed]
- Eeckhaut, V.; Van Immerseel, F.; Teirlynck, E.; Pasmans, F.; Fievez, V.; Snauwaert, C.; Haesebrouck, F.; Ducatelle, F.; Louis, P.; Vandamme, P.; et al. Butyricicoccus pullicaecorum gen. nov., sp. nov., an anaerobic, butyrate-producing bacterium isolated from the caecal content of a broiler chicken. Int. J. Syst. Evol. Microbiol. 2008, 58 Pt 12, 2799–2802. [Google Scholar] [CrossRef]
- Zhou, L.; Zhang, M.; Wang, Y.; Dorfman, R.G.; Liu, H.; Yu, T.; Chen, X.; Tang, D.; Xu, L.; Yin, Y.; et al. Faecalibacterium prausnitzii Produces Butyrate to Maintain Th17/Treg Balance and to Ameliorate Colorectal Colitis by Inhibiting Histone Deacetylase 1. Inflamm. Bowel Dis. 2018, 24, 1926–1940. [Google Scholar] [CrossRef] [Green Version]
- Duncan, S.; Hold, G.; Barcenilla, A.; Stewart, C.; Flint, H. Roseburia intestinalis sp. nov., a novel saccharolytic, butyrate-producing bacterium from human faeces. Int. J. Syst. Evol. 2002, 52, 1615–1620. [Google Scholar] [CrossRef] [Green Version]
- Liu, P.; Wang, Y.; Yang, G.; Zhang, Q.; Meng, L.; Xin, Y.; Jiang, X. The role of short-chain fatty acids in intestinal barrier function, inflammation, oxidative stress, and colonic carcinogenesis. Pharmacol. Res. 2021, 165, 105420. [Google Scholar] [CrossRef]
- den Besten, G.; van Eunen, K.; Groen, A.K.; Venema, K.; Reijngoud, D.J.; Bakker, B.M. The role of short-chain fatty acids in the interplay between diet, gut microbiota, and host energy metabolism. J. Lipid Res. 2013, 54, 2325–2340. [Google Scholar] [CrossRef] [Green Version]
- Tan, J.; McKenzie, C.; Potamitis, M.; Thorburn, A.N.; Mackay, C.R.; Macia, L. The role of short-chain fatty acids in health and disease. Adv. Immunol. 2014, 121, 91–119. [Google Scholar] [CrossRef]
- He, F.; Wu, C.; Li, P.; Li, N.; Zhang, D.; Zhu, Q.; Ren, W.; Peng, Y. Functions and Signaling Pathways of Amino Acids in Intestinal Inflammation. BioMed Res. Int. 2018, 2018, 9171905. [Google Scholar] [CrossRef] [PubMed]
- Gonzalez, A.; Krieg, R.; Massey, H.D.; Carl, D.; Ghosh, S.; Gehr, T.W.B.; Ghosh, S.S. Sodium butyrate ameliorates insulin resistance and renal failure in CKD rats by modulating intestinal permeability and mucin expression. Nephrol. Dial. Transplant. 2019, 34, 783–794. [Google Scholar] [CrossRef] [PubMed]
- Van Biesen, W.; Van Craenenbroeck, A.; Abramowicz, D.; Holvoet, E.; Veys, N.; Glorieux, G.; Couttenye, M.M.; Eloot, S. Health utility but not uremic toxins are associated with one year mortality in HD patients. Nephrol. Dial. Transplant. 2020, 35 (Suppl. S3), 192. [Google Scholar] [CrossRef]
- Magnani, S.; Atti, M. Uremic Toxins and Blood Purification: A Review of Current Evidence and Future Perspectives. Toxins 2021, 13, 246. [Google Scholar] [CrossRef]
- Vanholder, R.; Annemans, L.; Brown, E.; Gansevoort, R.; Gout-Zwart, J.J.; Lameire, N.; Morton, R.L.; Oberbauer, R.; Postma, M.J.; Tonelli, M.; et al. Reducing the costs of chronic kidney disease while delivering quality health care: A call to action. Nat. Rev. Nephrol. 2017, 13, 393–409. [Google Scholar] [CrossRef]
- Jadoon, A.; Mathew, A.V.; Byun, J.; Gadegbeku, C.A.; Gipson, D.S.; Afshinnia, F.; Pennathur, S. Gut Microbial Product Predicts Cardiovascular Risk in Chronic Kidney Disease Patients. Am. J. Nephrol. 2018, 48, 269–277. [Google Scholar] [CrossRef]
- Wang, S.; Lv, D.; Jiang, S.; Jiang, J.; Liang, M.; Hou, F.; Chen, Y. Quantitative reduction in short-chain fatty acids, especially butyrate, contributes to the progression of chronic kidney disease. Clin. Sci. 2019, 133, 1857–1870. [Google Scholar] [CrossRef]
- Andriamihaja, M.; Lan, A.; Beaumont, M.; Audebert, M.; Wong, X.; Yamada, K.; Yin, Y.; Tomé, D.; Carrasco-Pozo, C.; Gotteland, M.; et al. The deleterious metabolic and genotoxic effects of the bacterial metabolite p-cresol on colonic epithelial cells. Free Radic. Biol. Med. 2015, 85, 219–227. [Google Scholar] [CrossRef]
- Shimada, Y.; Kinoshita, M.; Harada, K.; Mizutani, M.; Masahata, K.; Kayama, H.; Takeda, K. Commensal bacteria-dependent indole production enhances epithelial barrier function in the colon. PLoS ONE 2013, 8, e80604. [Google Scholar] [CrossRef] [Green Version]
- Ramezani, A.; Raj, D.S. The gut microbiome, kidney disease, and targeted interventions. J. Am. Soc. Nephrol. 2014, 25, 657–670. [Google Scholar] [CrossRef] [Green Version]
- Macfarlane, G.T.; Macfarlane, S. Bacteria, colonic fermentation, and gastrointestinal health. J. AOAC Int. 2012, 95, 50–60. [Google Scholar] [CrossRef] [PubMed]
- Evenepoel, P.; Meijers, B.K.; Bammens, B.R.; Verbeke, K. Uremic toxins originating from colonic microbial metabolism. Kidney Int. 2009, 76, S12–S19. [Google Scholar] [CrossRef] [PubMed] [Green Version]
- Byrne, C.S.; Chambers, E.S.; Morrison, D.J.; Frost, G. The role of short chain fatty acids in appetite regulation and energy homeostasis. Int. J. Obes. 2015, 39, 1331–1338. [Google Scholar] [CrossRef] [Green Version]
- Adak, A.; Khan, M.R. An insight into gut microbiota and its functionalities. Cell. Mol. Life Sci. 2019, 76, 473–493. [Google Scholar] [CrossRef]
- Jiang, S.; Xie, S.; Lv, D.; Zhang, Y.; Deng, J.; Zeng, L.; Chen, Y. A reduction in the butyrate producing species Roseburia spp. and Faecalibacterium prausnitzii is associated with chronic kidney disease progression. Antonie Van Leeuwenhoek 2016, 109, 1389–1396. [Google Scholar] [CrossRef] [PubMed]
- Wang, X.; Yang, S.; Li, S.; Zhao, L.; Hao, Y.; Qin, J.; Zhang, L.; Zhang, C.; Bian, W.; Zuo, L.; et al. Aberrant gut microbiota alters host metabolome and impacts renal failure in humans and rodents. Gut 2020, 69, 2131. [Google Scholar] [CrossRef]
- Ohara, T.; Mori, T. Antiproliferative Effects of Short-chain Fatty Acids on Human Colorectal Cancer Cells via Gene Expression Inhibition. Anticancer Res. 2019, 39, 4659–4666. [Google Scholar] [CrossRef] [Green Version]
- Gonçalves, P.; Araújo, J.R.; Di Santo, J.P. A Cross-Talk Between Microbiota-Derived Short-Chain Fatty Acids and the Host Mucosal Immune System Regulates Intestinal Homeostasis and Inflammatory Bowel Disease. Inflamm. Bowel Dis. 2018, 24, 558–572. [Google Scholar] [CrossRef] [Green Version]
- Khan, M.T.; Duncan, S.H.; Stams, A.J.; van Dijl, J.M.; Flint, H.J.; Harmsen, H.J. The gut anaerobe Faecalibacterium prausnitzii uses an extracellular electron shuttle to grow at oxic-anoxic interphases. ISME J. 2012, 6, 1578–1585. [Google Scholar] [CrossRef]
- Duncan, S.H.; Barcenilla, A.; Stewart, C.S.; Pryde, S.E.; Flint, H.J. Acetate utilization and butyryl coenzyme A (CoA):acetate-CoA transferase in butyrate-producing bacteria from the human large intestine. Appl. Environ. Microbiol. 2002, 68, 5186–5190. [Google Scholar] [CrossRef] [Green Version]
- Rios-Covian, D.; Gueimonde, M.; Duncan, S.H.; Flint, H.J.; de los Reyes-Gavilan, C.G. Enhanced butyrate formation by cross-feeding between Faecalibacterium prausnitzii and Bifidobacterium adolescentis. FEMS Microbiol. Lett. 2015, 362, fnv176. [Google Scholar] [CrossRef] [PubMed] [Green Version]
- Bansal, T.; Alaniz, R.C.; Wood, T.K.; Jayaraman, A. The bacterial signal indole increases epithelial-cell tight-junction resistance and attenuates indicators of inflammation. Proc. Natl. Acad. Sci. USA 2010, 107, 228–233. [Google Scholar] [CrossRef] [PubMed] [Green Version]
- Pluznick, J.L. Gut microbiota in renal physiology: Focus on short-chain fatty acids and their receptors. Kidney Int. 2016, 90, 1191–1198. [Google Scholar] [CrossRef] [PubMed] [Green Version]
- Gajjala, P.R.; Fliser, D.; Speer, T.; Jankowski, V.; Jankowski, J. Emerging role of post-translational modifications in chronic kidney disease and cardiovascular disease. Nephrol. Dial. Transplant. 2015, 30, 1814–1824. [Google Scholar] [CrossRef] [Green Version]
- Kalim, S.; Karumanchi, S.A.; Tadhani, R.I.; Berg, A.H. Protein carbamylation in kidney disease: Pathogenesis and clinical implications. Am. J. Kidney Dis. 2014, 64, 793–803. [Google Scholar] [CrossRef] [PubMed] [Green Version]
- Long, J.; Vela Parada, X.; Kalim, S. Protein Carbamylation in Chronic Kidney Disease and Dialysis. Adv. Clin. Chem. 2018, 87, 37–67. [Google Scholar] [CrossRef] [PubMed]
- Vaziri, N.D.; Wong, J.; Pahl, M.; Piceno, Y.M.; Yuan, J.; DeSantis, T.Z.; Ni, Z.; Nguyen, T.; Andersen, G.L. Chronic kidney disease alters intestinal microbial flora. Kidney Int. 2013, 83, 308–315. [Google Scholar] [CrossRef] [Green Version]
- El Amouri, A.; Snauwaert, E.; Foulon, A.; Vande Moortel, C.; Van Dyck, M.; Van Hoeck, K.; Godefroid, N.; Glorieux, G.; Van Biesen, W.; Vande Walle, J.; et al. Dietary Fibre Intake Is Associated with Serum Levels of Uraemic Toxins in Children with Chronic Kidney Disease. Toxins 2021, 13, 225. [Google Scholar] [CrossRef]
- Delanghe, S.; Moerman, A.; Pletinck, A.; Schepers, E.; Glorieux, G.; Van Biesen, W.; Delanghe, J.R.; Speeckaert, M.M. Quantification of carbamylated albumin in serum based on capillary electrophoresis. Electrophoresis 2017, 38, 2135–2140. [Google Scholar] [CrossRef]
- Levey, A.S.; Stevens, L.A.; Schmid, C.H.; Zhang, Y.L.; Castro, A.F.; Feldman, H.I.; Kusek, J.W.; Eggers, P.; Van Lente, F.; Greene, T.; et al. A new equation to estimate glomerular filtration rate. Ann. Intern. Med. 2009, 150, 604–612. [Google Scholar] [CrossRef]


Publisher’s Note: MDPI stays neutral with regard to jurisdictional claims in published maps and institutional affiliations. |
© 2021 by the authors. Licensee MDPI, Basel, Switzerland. This article is an open access article distributed under the terms and conditions of the Creative Commons Attribution (CC BY) license (https://creativecommons.org/licenses/by/4.0/).
Share and Cite
Steenbeke, M.; Valkenburg, S.; Gryp, T.; Van Biesen, W.; Delanghe, J.R.; Speeckaert, M.M.; Glorieux, G. Gut Microbiota and Their Derived Metabolites, a Search for Potential Targets to Limit Accumulation of Protein-Bound Uremic Toxins in Chronic Kidney Disease. Toxins 2021, 13, 809. https://doi.org/10.3390/toxins13110809
Steenbeke M, Valkenburg S, Gryp T, Van Biesen W, Delanghe JR, Speeckaert MM, Glorieux G. Gut Microbiota and Their Derived Metabolites, a Search for Potential Targets to Limit Accumulation of Protein-Bound Uremic Toxins in Chronic Kidney Disease. Toxins. 2021; 13(11):809. https://doi.org/10.3390/toxins13110809
Chicago/Turabian StyleSteenbeke, Mieke, Sophie Valkenburg, Tessa Gryp, Wim Van Biesen, Joris R. Delanghe, Marijn M. Speeckaert, and Griet Glorieux. 2021. "Gut Microbiota and Their Derived Metabolites, a Search for Potential Targets to Limit Accumulation of Protein-Bound Uremic Toxins in Chronic Kidney Disease" Toxins 13, no. 11: 809. https://doi.org/10.3390/toxins13110809