1. Introduction
Amounts of municipal solid waste (MSW), and its composition, have been changing due to the changes in consumption behaviors of people along with the rapid advances of technology. According to a study conducted to determine the per capita annual municipal waste production of 32 European countries for 2001 and 2010 by the European Environment Agency in 2013, the per capita municipal waste production was found to be higher in 21 countries in 2010, while it was found to be lower in 11 countries. While a rise was recorded in waste amounts of 26 countries between 2001 and 2008, there was a fall in six countries [
1]. A gradual increase in the amount of solid waste leads to various problems in transportation, storage, and disposal of this waste and makes efficient solid waste management complicated. MSW has great economic potential [
2] and the efficiency of waste management systems affects the potential economic value of MSW [
3,
4]
Amounts and characteristics of MSW differ not only from country to country, but also from region to region and neighborhood to neighborhood even within the same city. These differences depend on socio-economic structure, income level, consumption, and usage habits of people [
5,
6]. An efficient system for MSW management requires a good knowledge of the characterization of solid wastes to be disposed. Physical features of solid wastes are significant parameters for the selection and functioning of collection and transportation equipment, energy transformation, studies related to recoverable matter, as well as selection and design of proper disposal methods [
7]. Some problems can be encountered during management of solid wastes since they have a heterogeneous structure. For this reason, physical features of solid wastes, such as moisture content (MC), calorific value (heating) (HHV), and composition, should be well known for their management through suitable methods. The moisture content of solid wastes differs between 15% and 40%. The average MC, while having a very wide range due to regional characteristics and socio-economic structure, is reported as 20% [
8]. However, MC may reach up to 60%–70% from time to time depending, especially, on solid waste composition and climate conditions, according to the literature [
9]. Calorific value is highly related to MC and it is also a significant parameter which is a determinant in the design of procedures, such as combustion, commonly used for the recovery of solid wastes. Waste composition defines all parameters that are effective in decision-making processes about solid waste management. Composition and the amount of solid wastes differ by the place of formation, season, lifestyles of people, social parameters, economic structure, nutritional habits, and some regulations related to waste and the recoverability of waste.
In the related literature, studies on characterization of waste are common [
10,
11,
12,
13,
14,
15]. Additionally, there are also studies frequently conducted towards the economic utilization of wastes and income from wastes [
16,
17,
18]. In a related study, Yay [
19] analyzed the management of solid wastes in the province of Sakarya. To this end, a ton of solid waste samples were collected during one year and suitable waste management suggestions were made [
19]. In another study conducted with the purpose of characterization, solid wastes formed in four different seasons in a one-year period from three different socio-economic groups of Lahore city were used and the differences in solid waste composition were found based on income level and socio-economic conditions [
20]. Banar and Ozkan [
5] characterized solid wastes in the province of Eskişehir based on different income groups. In their study, they divided the province into low, middle, and high income groups and determined the proportions of solid waste components based on these income levels. Gómez et al. [
21] determined the seasonal changes in the characteristics of solid wastes. They investigated the city in three different socio-economic categories in their characterization study. In another characterization study, research was conducted based, again, on three different income levels (low, middle, high) and suggestions were made regarding waste management [
22].
This study aims to determine the differences in substances within solid waste mass by income levels and seasonal conditions following the analysis conducted on the characterization of solid wastes formed within the borders of the Kartal district. In order to provide support to waste characterization, moisture content and calorific value analyses were also conducted and various suggestions were brought towards waste management in line with the obtained findings. In this paper, the first section explains the theoretical framework of the study, conducts a literature review and analyzes previously published studies. The second section defines the methods used, while the last section presents the findings and results that were obtained.
2. Materials and Methods
The research area, the Kartal district, is located on the southwest of the Kocaeli peninsula, which is located on the east coast of the province of Istanbul (
Figure 1). In this district, there are 20 neighborhoods, 231 avenues, and 2236 streets with 38.54 km
2 of area and a total population of 450,498 [
23]. The Kartal area, chosen due to its high population density and varying socio-economic structures, will provide a good example for investigating the effects of different income levels on solid waste characterization. Additionally, considering the amounts of waste produced, the study area appears as a suitable area for solid waste characterization.
Solid waste produced in the study area is collected from neighborhoods and streets on a daily basis. The solid waste collected by hydraulic compression trucks are transferred to a solid waste interchange station and then, finally, to the permanent storage area. Solid waste is collected in the containers located in the streets and avenues in a mixed form. There are also some implementations towards collecting packaging products separately. Collection vehicles collect packaging waste from residences and businesses once a week, and from industrial facilities between one and three times a week based on the production of waste. Weekly collection amounts may be reduced or increased by consulting the officials of the business producing the waste. The collection operation is done six days a week, and two workers are situated in each collection vehicle. While locations where waste production is low (residences) are given garbage bags, small enterprises are given internal area boxes and businesses where waste production is higher are given containers of approximately 1 m3 of volume. Collection was achieved in the Kartal district in 2015 using a total of 172 recycling containers. Packaging wastes collected as a mixture in the Kartal district are brought to separation facilities. Then these packaging wastes are separated into five basic groups as paper, glass, metal, plastic, and composites. Separation in the facilities is done manually. The packaging wastes separated into groups are stored in the storage area as bundles after being pressed by a compression machine, and sent to the factories of the firms that sell them as raw materials for their recycling.
2.1. MSW Characterization
The study on the characterization of MSW was conducted four times in the winter and summer periods with the purpose of evaluating all seasonal conditions. Studies were conducted twice in January for the winter period and in July and August in the summer period. The ASTM D5231 (Standard Test Method for Determination of the Composition of Unprocessed Municipal Solid Waste) method developed by the American Society for Testing and Materials (ASTM) was used for determining waste characterization [
24]. During the study, MSWs collected from different locations of the city (low, medium, and high income levels, and downtown) were used for the characterization of solid wastes. For the presentation of different socio-cultural sections of the city, MSWs were collected from different neighborhoods: Hurriyet Neighborhood (W1) for the presentation of the low-income level; Petrol-Is Neighborhood (W2) for the presentation of the medium-income level; Orhantepe Neighborhood (W3) for the presentation of the high-income level; and Soganlık Yeni Neighborhood (W4) for the presentation of downtown (
Figure 1). Income level was explained in the literature as the following: Extended families that have low-incomes, low socio-economic statuses, and single flat homes were classified as the low-income level. Civil servants who have a higher socio-economic status reside in the regions called the middle-income level. Business-people who have the highest socio-economic statuses and income levels reside in the regions that were classified as the high-income level [
5]. Information stored in the database of Kartal Municipality was used for determining these regions based on different income levels. For a better representation of waste types formed during the week and at the weekend, suitable days were selected for the characterization during the collection process of wastes. The waste collected on Monday was chosen to represent the waste produced over the weekend, while the waste collected on Tuesday was chosen to represent the waste produced during the week. Compression trucks were not used during collection. Box trucks were used. In the case of using compression trucks, moisture content decreased due to water being released during compression, and separation of package waste becomes difficult due to breaking and disintegration. Each vehicle coming from the regions unloaded the waste as separate stacks. A high-density polyethylene (HDPE) cover was laid on the area where the characterization was made. From the stacks to be sampled, the waste products were filled on a topless and bottomless mold with the dimensions 1 m × 1 m × 0.5 m randomly, and 1 m
3 representative samples were achieved this way. The sample mold prepared for sampling 1 m
3 representative samples from different regions was filled two times randomly. Therefore, a total of eight different samples of 1 m
3 of volume were obtained for each income level, representing the weekend and the week days. The same processes were applied for the summer period, and separation and weighing operations were conducted on a total of sixteen 1 m
3 samples. Empty weights of the molds were measured and recorded before the weighing processes. During the separation process, closed bags were opened and the waste in these bags were put in suitable containers. The weighing process was achieved using an electronic scale by filling each separated component into an empty container, and the obtained values were recorded. Municipal solid waste components (MSWC) were grouped in accordance with the ASTM D5231 standard. Accordingly, MSW was separated into 17 main components, weighed during the waste sorting process for the matter group analysis (
Table 1), and the weight percentage of each matter group in a waste group was found.
2.2. Calorific Value and Moisture Content Analysis
Any standard measurement of calorific (heating) value using laboratory apparatus, such as a bomb calorimeter at constant volume, returns the gross heating value (higher heating value on a dry basis, HHV) [
25]. For calorific value analyses, approximately 5 kg waste samples were randomly selected from the characterized wastes. The HHV analyses were conducted according to the ISO 1928 method [
26] with a LECO AC500 bomb calorimeter (Saint Joseph, MI, USA).
The MC of solid wastes was determined in homogenized samples in accordance with the TS10459 standard [
27]. Representative samples, each of which weighed 5 kg, were taken in certain amounts in porcelain cups and dried in an oven at 105 °C for 24 h. Dried samples were kept in a desiccator to be brought down to room temperature. Samples were weighed again and MC was calculated using Equation (1) [
28,
29]:
where
w: initial weight of sample, (kg)
d: weight after being dried under 105 °C, (kg)
M: moisture content.
3. Results
To conduct the solid waste characterization, MSW amounts in the given region should also be evaluated. In this scope, the monthly change of MSW amounts in the research area within the last two years is presented in
Figure 2. The MSW amount in the region in 2015 was calculated as 166,531 tons, while this figure was found as 162,476 tons in 2014. No significant differences were found in solid amounts within the last two years. Monthly differences in waste were analyzed and minor increases were found in the summer period. Considering the population records in 2014 and the most recent data, daily waste amount in the research area was calculated as 0.98 kg per person.
For the characterization study, the research field was divided into four different regions according to income levels and socio-economic structure in order to represent the winter period. Two different characterization studies were conducted in January in different times. In this period, 1056 kg of solid waste samples were collected and used in the characterization. Waste amounts in neighborhoods selected in the regions where characterized solid wastes were collected (
Table 2) were taken into consideration for the calculation of MSWC rates. These rates are presented in
Table 3. In parallel with the winter period, results of the characterization studies conducted in different times in the summer period are presented in
Table 4. A total of 884 kg of MSW samples were collected from the zones hosting different income levels during the characterization study in the summer period and used in the MSWC analyses.
According to
Table 3 and
Table 4, the most significant difference in MSWC means between the summer and winter periods can be seen in kitchen waste. The mean proportion of kitchen wastes in the summer period was 53.74% while this rose up to 61.64% in the winter period. The reason for this change is assumed to be related to evaporation of water within solid waste due to high temperatures during summer months and higher fruit consumption in these months. The mean annual value of the proportion of kitchen waste was calculated as 57.69%. In the MSWC analysis conducted in summer and winter periods, another significant difference was observed in park and garden wastes. This waste component’s proportion was found to be 4.60% in summer and 1.25% in winter. It is thought that grass wastes produced at the end of intense mowing activities during summer months lead the rate of park and garden wastes during the summer period to rise. One of the significant differences between the winter and summer periods is the glass component. The rate of glass in waste mass was 4.60% in the winter period, while this reached up to 7.67%. It is assumed that this increase results from consumption habits changing due to the hot weather during summer months.
Considering the change in MSWC values by income level, the organic waste component in the region with low-income level was found higher in comparison to other regions. The highest organic waste amount was found in the W1 region (the lowest income level) in the winter period with 65.41%. The lowest rate was found in the W3 region (the highest income level) with 46.98%. Considering the differences in organic waste by income level and seasonal conditions, further changes related to income level were found in the winter period in comparison to the summer period. Another MSW component which differentiated based on income level was paper. In the characterization study of the winter period, paper components found in the region with the high income level (W3) were approximately two-fold compared to the one with the low income level (W1). It was found that the rate of the paper component in waste composition increases in parallel to income level, while the highest rate was found in the W3 region, at 7.41%.
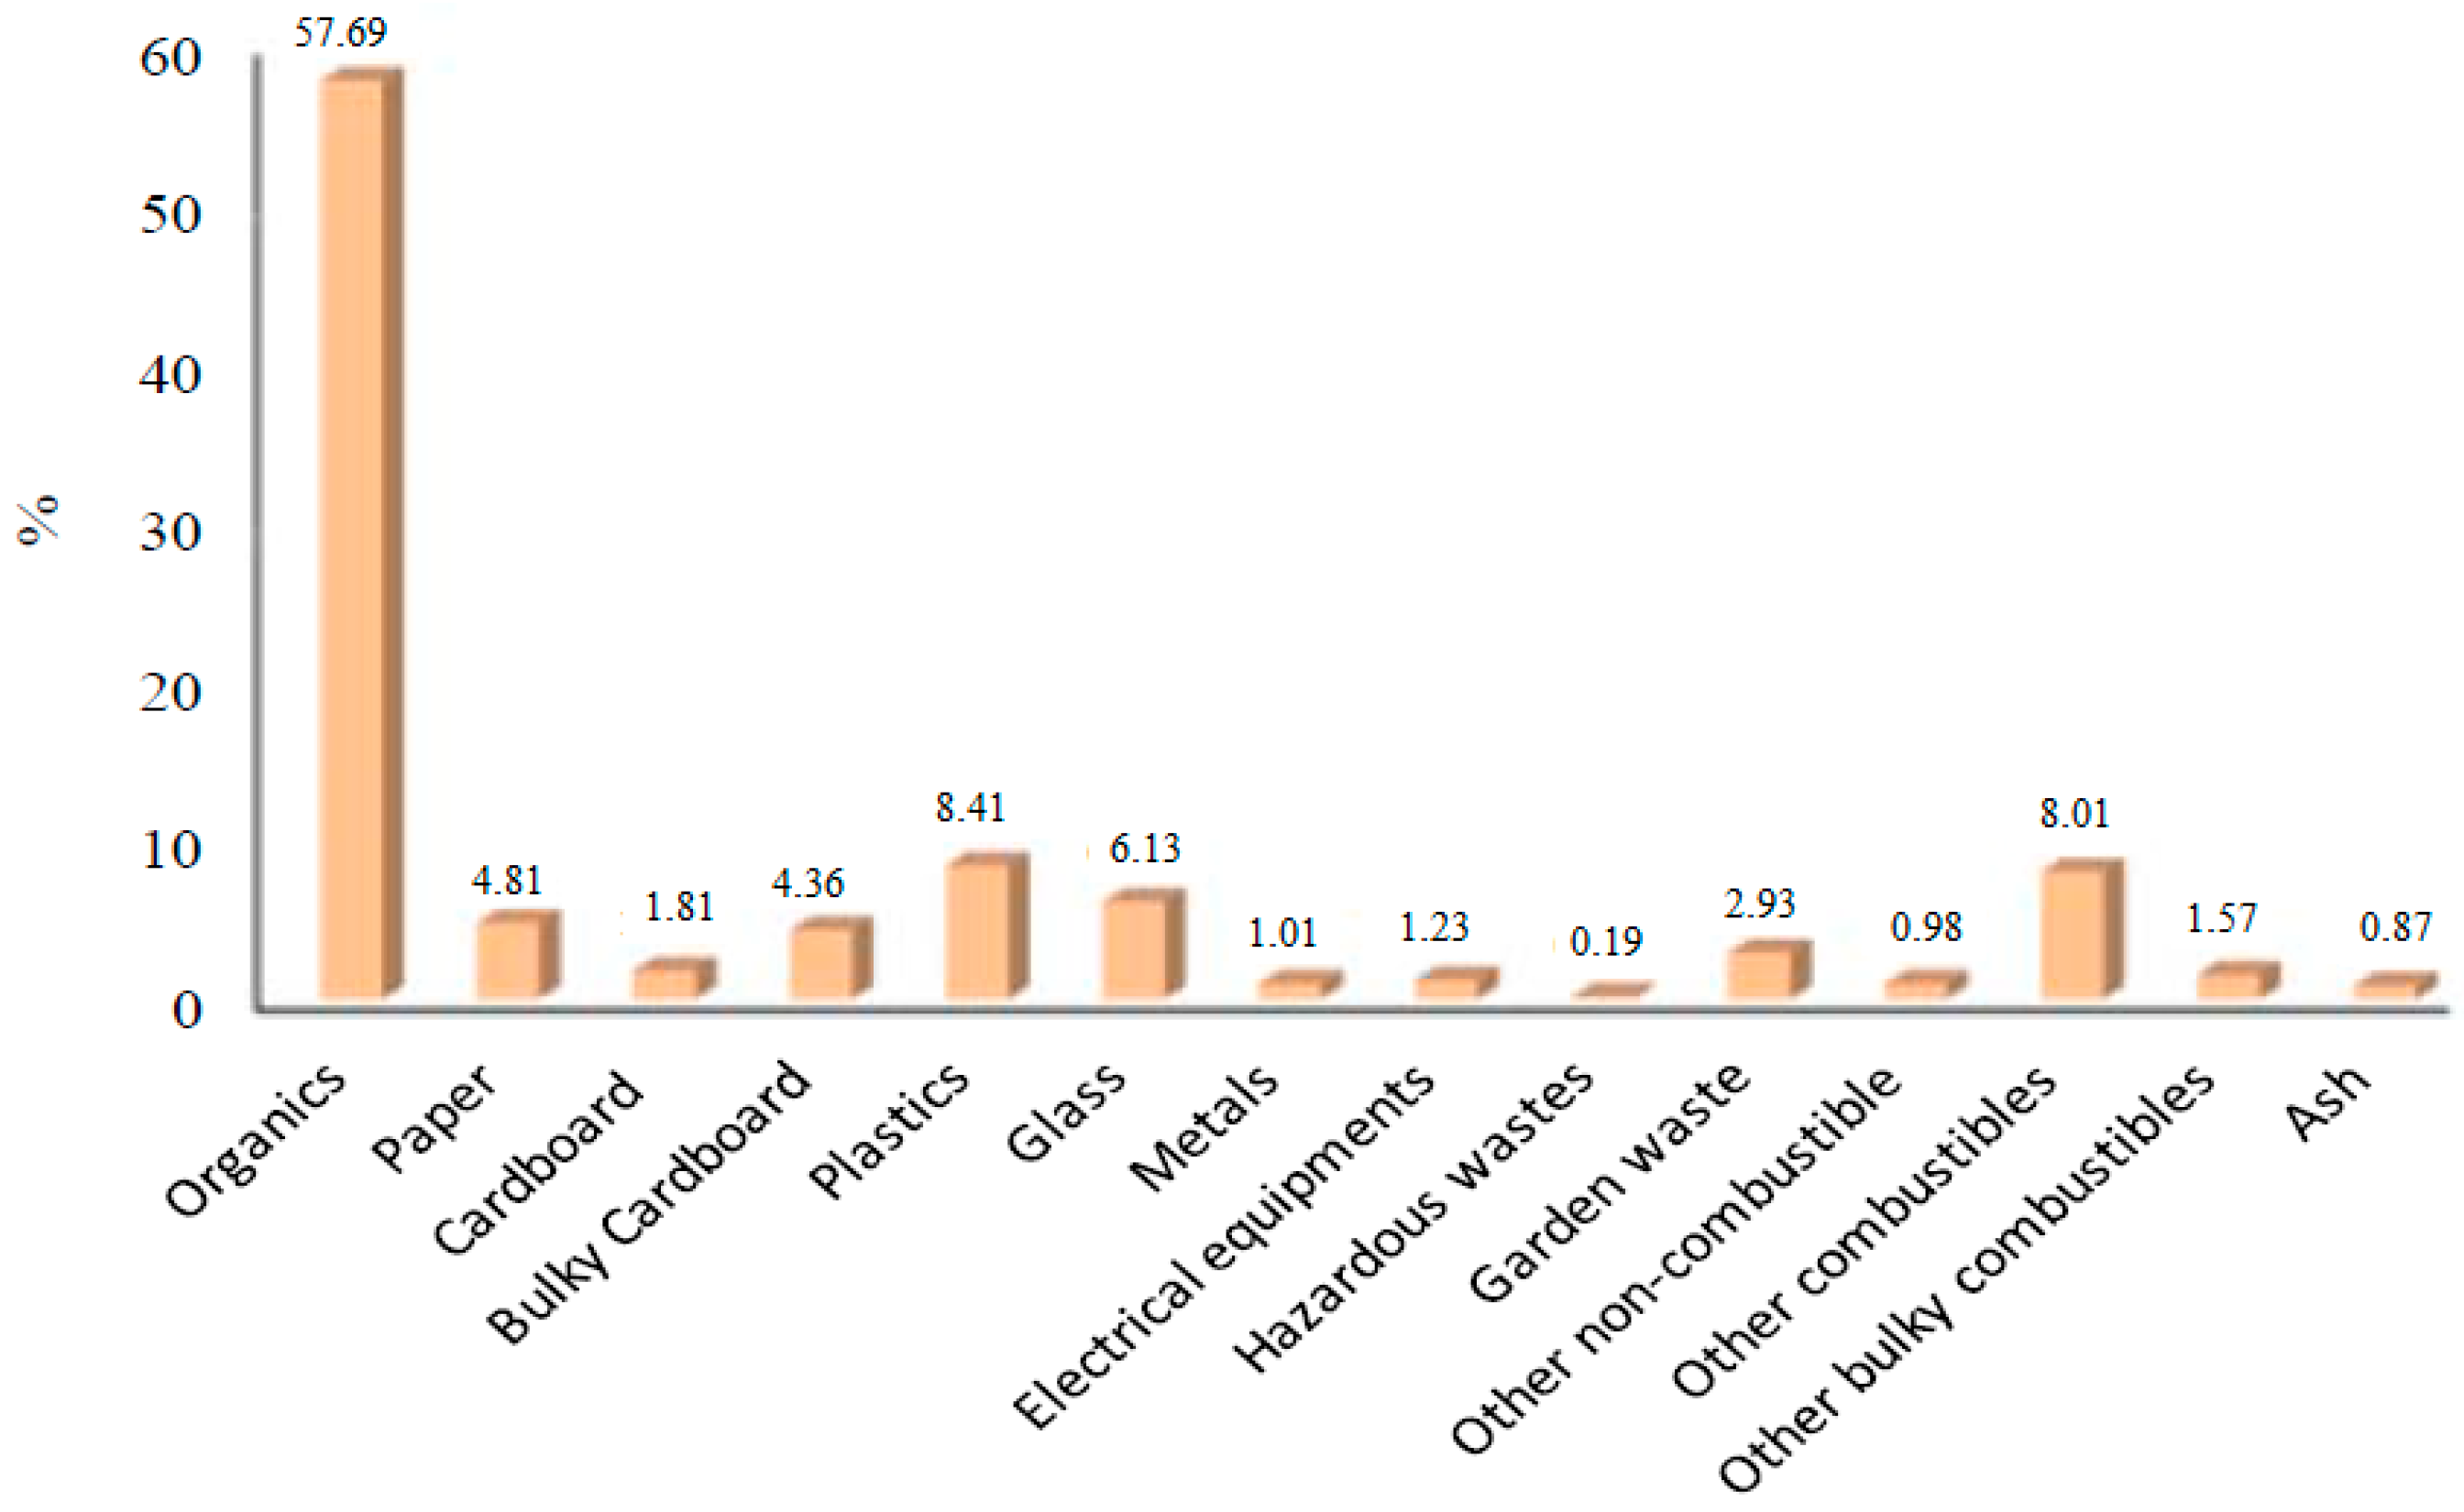
A general evaluation on the MSWC results (obtained in the summer and winter periods) is presented in
Figure 3. Accordingly, matters named as other burnable wastes had the highest rate in solid wastes (fabric, diaper, shoes, slippers, pillow, carpet, rugs, bags) following kitchen wastes and package wastes and their rate in waste mass was found to be 8.01% (
Figure 3).
The ash component was found to constitute a proportion of 1.73% in the winter period, while no ash was found in the solid waste composition in the summer period. The mean value of the rate of the ash component in the winter and summer periods was calculated as 0.87% (
Figure 3). Out of solid waste samples collected from four different regions having different income levels, the ash component was found only in the W1 region, which has the lowest income level. This is because of the fact that the W1 region mostly hosts shanty settlements and heating stoves are used in this region. Considering the rates of recyclable components in solid waste mass, the rate of package wastes in total solid waste was found to be 24.31% in the winter period and 28.75% in the summer period. The mean value of the rate of package wastes was found to be 26.53% (
Table 5). Paper/carton, plastic, glass, and metals had the highest percentages among recyclable wastes, respectively.
In the literature, results obtained from solid waste characterization in Istanbul and Turkey were reported, respectively, as 54.09% and 34% for organic wastes. The results of the present study (57.69% organic waste component) are very similar to the results related to Istanbul, yet well above the mean value for Turkey. Comparing the rates of recyclable wastes within MSWC for Istanbul and Turkey, it may be seen that the percentage of 26.53% obtained in the present study is lower than the mean value for Istanbul (34.27%) and close to the mean value for Turkey (25%) [
28,
30].
Pursuant to the sorting process during characterization studies, representative samples were taken for both the winter and summer periods and MC values were determined. Results of these analyses are presented in
Table 6. As expected, MC rates of solid waste samples were found higher on weekdays and at the weekend in the winter period as compared to the summer period. Solid waste MC was measured as 78% in the winter period and 64.3% in the summer period. The mean waste MC of the Kartal district in summer and winter periods was measured as 71.1%.
Considering the differences of solid waste MC based on income level, it may be seen that solid waste MC falls as the income level increases. In this study, the highest MC was found in the weekend samples in winter in the W1 region. MC proportions of downtown (W4) were generally similar to the values of the medium-income level (W2).
Higher heating values (HHV) of MSWs were measured in summer and winter periods two times with the purpose of determining the calorific values of solid waste samples. HHV values of the samples were found as 1557 kcal·kg−1 in the winter period and 3480 kcal·kg−1 in the summer period. Considering that there is no large difference between waste characterization activities conducted in summer and winter, it is assumed that the most important component having an impact on calorific value is the moisture content. The mean value of HHV measured in the summer and winter periods was calculated as 2518.5 kcal·kg−1.
4. Discussion and Conclusions
This study aims to determine the differences in components in the solid waste composition in a region based on income levels and seasonal conditions. The obtained results are presented as follows:
In the findings obtained from the solid waste characterization analysis, the following rates of different types of waste were found: organic waste: 57.69%; package waste: 26.53%; other burnable wastes (fabric, diaper, shoes, slippers, pillow, carpet, rug, bag): 8.01%; park and garden waste: 2.93%; electrical and electronic equipment waste: 1.23%; and hazardous waste: 0.19%. Considering the differences in waste components based on income level, it was found that organic waste rates and income level were inversely proportional. The highest organic waste rate was found in the region having the lowest income level (W1). The recyclable MSW rate was calculated as 26.53% (
Table 5). Comparing the rate of package wastes to the mean value of the rates for Istanbul (34.27%), it was found that there was a difference of 8%. Accordingly, management activities towards package wastes in the Kartal district are more positive and effective than activities conducted in Istanbul in general. The package waste rate of the Kartal district was found to be much close to the value of 25%, which is representative of Turkey. It was found that 166,531 tons of solid waste was produced in 2015 and 26.53% of this waste was package waste. Considering this information, it can be concluded that approximately 44,000 tons of package waste was thrown away along with other solid wastes. It is believed that this is a very high rate and more attention should be paid to increasing recycling activities. Additionally, 28.97% of MSWC composition consisted of combustible waste components. This rate is very high and it is believed that the waste in this region can be used as refuse-derived fuel (RDF).
Considering the MC analyses, the mean value of the winter and summer periods was calculated as 71.17%. High organic matter content in solid waste composition may be a significant factor which increases MC. Although this value seems high in comparison to the theoretical MC value of MSW, it is in parallel with previous studies in the literature [
9,
28]. Moisture content and calorific value have a vital role to determine the method to be preferred for the management and disposal of MSW. The mean value of HHV in winter and summer periods, 2581.5 kcal·kg
−1, is above 2000–2500 kcal·kg
−1, which is required for disposal of solid wastes with a burning process. However, it was also found that HHV decreased with MC during winter months and this value was found around 1557 kcal·kg
−1. Considering the HHVs in winter and summer periods, it was concluded that the HHV of waste in certain periods cannot be sufficient for suitable combustion activity without any need for extra fuel due to seasonal conditions. Additionally, the increase in recovery and recycling activities will lead to a decline in the rate of combustible components, such as package wastes, within waste composition and, thus, HHV will fall as well.
In light of the results obtained in this study it was shown that solid waste, and especially the packaging waste in the composition of solid waste, may be reclaimed for the economy by efficient and effective waste management planning. Considering the methods implemented in the region chosen as the study area, increasing separate collection activities in the region will not only increase the amount of the collected package waste and the profit margins of licensed firms, but also decrease the total amount of waste sent for disposal. Therefore, while providing better opportunities to utilize waste as a secondary raw material, total waste disposal costs will decrease. Determining the characterization of waste is the most important part of integrated waste management. This type of study should be conducted more frequently to observe the improvement of MSW management systems and minimize the total amount of MSW.


