Article

Human Health Risks and Interference of Urban Landscape and Meteorological Parameters in the Distribution of Pollutant: A Case Study of Nakhon Si Thammarat Province, Thailand

by
Rungruang Janta
1,2,
Jenjira Kaewrat
1,2,*,
Wittaya Tala
3,4,*,
Surasak Sichum
2,
Chuthamat Rattikansukha
1,2 and
K. H. Sameera M. Dharmadasa
5
1
School of Languages and General Education, Walailak University, Nakhon Si Thammarat 80160, Thailand
2
Center of Excellence in Sustainable Disaster Management, Walailak University, Nakhon Si Thammarat 80160, Thailand
3
Environmental Science Research Center (ESRC), Faculty of Science, Chiang Mai University, Chiang Mai 50200, Thailand
4
Environmental Chemistry Research Laboratory (ECRL), Department of Chemistry, Faculty of Science, Chiang Mai University, Chiang Mai 50200, Thailand
5
Central Environmental Authority, Battaramulla 10120, Sri Lanka
*
Authors to whom correspondence should be addressed.
Sustainability 2023, 15(20), 14672; https://doi.org/10.3390/su152014672
Submission received: 25 August 2023 / Revised: 29 September 2023 / Accepted: 5 October 2023 / Published: 10 October 2023

Abstract

:
Recently, the air quality in urban areas has declined because of increasing traffic emissions. This paper aimed to determine the toxicity from exposure to pollutants among three sensitive groups of residents in urban areas. Moreover, this study also estimated the impacts of landscape and meteorological conditions on the accumulation of air pollutants in these areas. The results showed that the annual average concentration in the town exceeded the WHO air quality guidelines. Other areas that had a high traffic density also presented unacceptable levels according to the hazard quotient (HQ value ≥ 1). It was found that the air quality in the town had declined. This study also found that people living in a tropical monsoon climate should avoid exposure to air pollution in both the summer and rainy seasons; even though the pollutant concentration is lower in the rainy season, the longer exposure time causes unacceptable health risks. Humidity showed a strong impact on gas pollutant reduction (rs = −0.943). The pollutants tended to increase in areas with a high density of main roads. Additionally, building density affected the accumulation of pollutants in near-source areas and blocked pollutants in receptor areas. Therefore, this study suggests that local authorities should provide vegetation infrastructure for a sustainable air quality improvement in urban areas.

1. Introduction

In general, air pollution in urban areas is increasing because of anthropogenic activities. According to the World Health Organization (WHO), over 80% of people living in urban areas around the world are exposed to air pollution levels higher than the acceptable level set out in the WHO’s guidelines. Therefore, respiratory diseases and chronic obstructive pulmonary disease (COPD) are commonly found in urban areas [1,2,3]. Air pollutants emitted from traffic are major contributors to poor air quality in urban areas [4]. Nitrogen dioxide (NO2) shows a relationship with traffic exposure, as well as with many other traffic-related pollutants [5,6]. Inhalation of air with high concentrations of NO2 is associated with deleterious health effects such as airway inflammation, pulmonary heart disease, and impairments in lung function [7]. Also, Grazuleviciene et al. [8] found a relationship between long-term exposure to NO2 and myocardial infarction incidence. In Iran, every 10 µg/m3 increase in the NO2 concentration in the ambient atmosphere led to an increase of 0.2–0.4% in the relative risks of myocardial infarction, cardiovascular diseases, and obstructive pulmonary disease [9]. Additionally, the reaction of NO2 and other atmospheric substances such as volatile organic compounds (VOCs) with vapor forms secondary pollutants such as tropospheric ozone (O3) and particulate matter (PM) [10]. A study by He et al. [11] indicated that the O3 concentration is sensitive to reductions in NO2 in the megacities of China. Moreover, NO2 can be a cause of acid rain, which causes ecosystem degradation [12,13]. The global annual average NO2 concentration in 2019 decreased by 13% from that in 2000. However, the concentration in urban areas was still greater than that outlined in the WHO guidelines [14].
Many parameters influence the accumulation of NO2 in urban areas, including emission sources, meteorological factors, and building density. The number of vehicles is a direct factor as an emission source affecting near-road NO2 concentrations in urban areas, which are significantly related to traffic density [1,15]. Previously, meteorological factors including temperature, humidity, wind speed, and rainfall were reported to be related to the concentration of NO2 in the studied areas [16,17]. Some factors, such as temperature and humidity, present both positive and negative effects on NO2 concentrations in different areas because the anthropogenic landscape and microclimate changes have a significant impact on NO2 concentrations in urban areas [17]. A high density of buildings has a significant effect on urban air quality in terms of blocking pollutant dispersion when pollutants accumulate in an area, resulting in poor air quality. Su et al. [18] found that pollutant concentrations in economically developed areas were greater than those in rural areas. Moreover, these concentrations were associated with the densities of main roads and buildings. Many researchers have studied the influence of parameters including sources, meteorological factors, and land properties on pollutant accumulation. Those studies separately studied either meteorological factors or land properties. The combined study of both parameters is still limited. Moreover, air quality monitoring was studied in many parts of Thailand that have a tropical savanna climate (three seasons a year). Only a few studies have been conducted in the southern part of Thailand, which has a tropical monsoon climate that has only summer and rainy seasons throughout the year, even though many provinces in this area have urbanized because of the growth of tourism.
This study aimed to measure NO2 concentrations in urban areas in the southern part of Thailand, which is influenced by a tropical monsoon climate. The non-cancer health risks of residents from exposure to air pollutants were also estimated. This study also explored the seasonal variation in human health risks in a tropical monsoon climate zone. Moreover, this study estimated the influence of meteorological factors and the landscape on nitrogen dioxide concentrations in urban areas. The results from this study should provide useful information for residents and help the relevant local agencies consider appropriate measures to reduce human health effects by controlling exposure to air pollutants. Additionally, it is suggested that landscape improvement could provide a sustainable air quality improvement in urban areas.

2. Materials and Methods
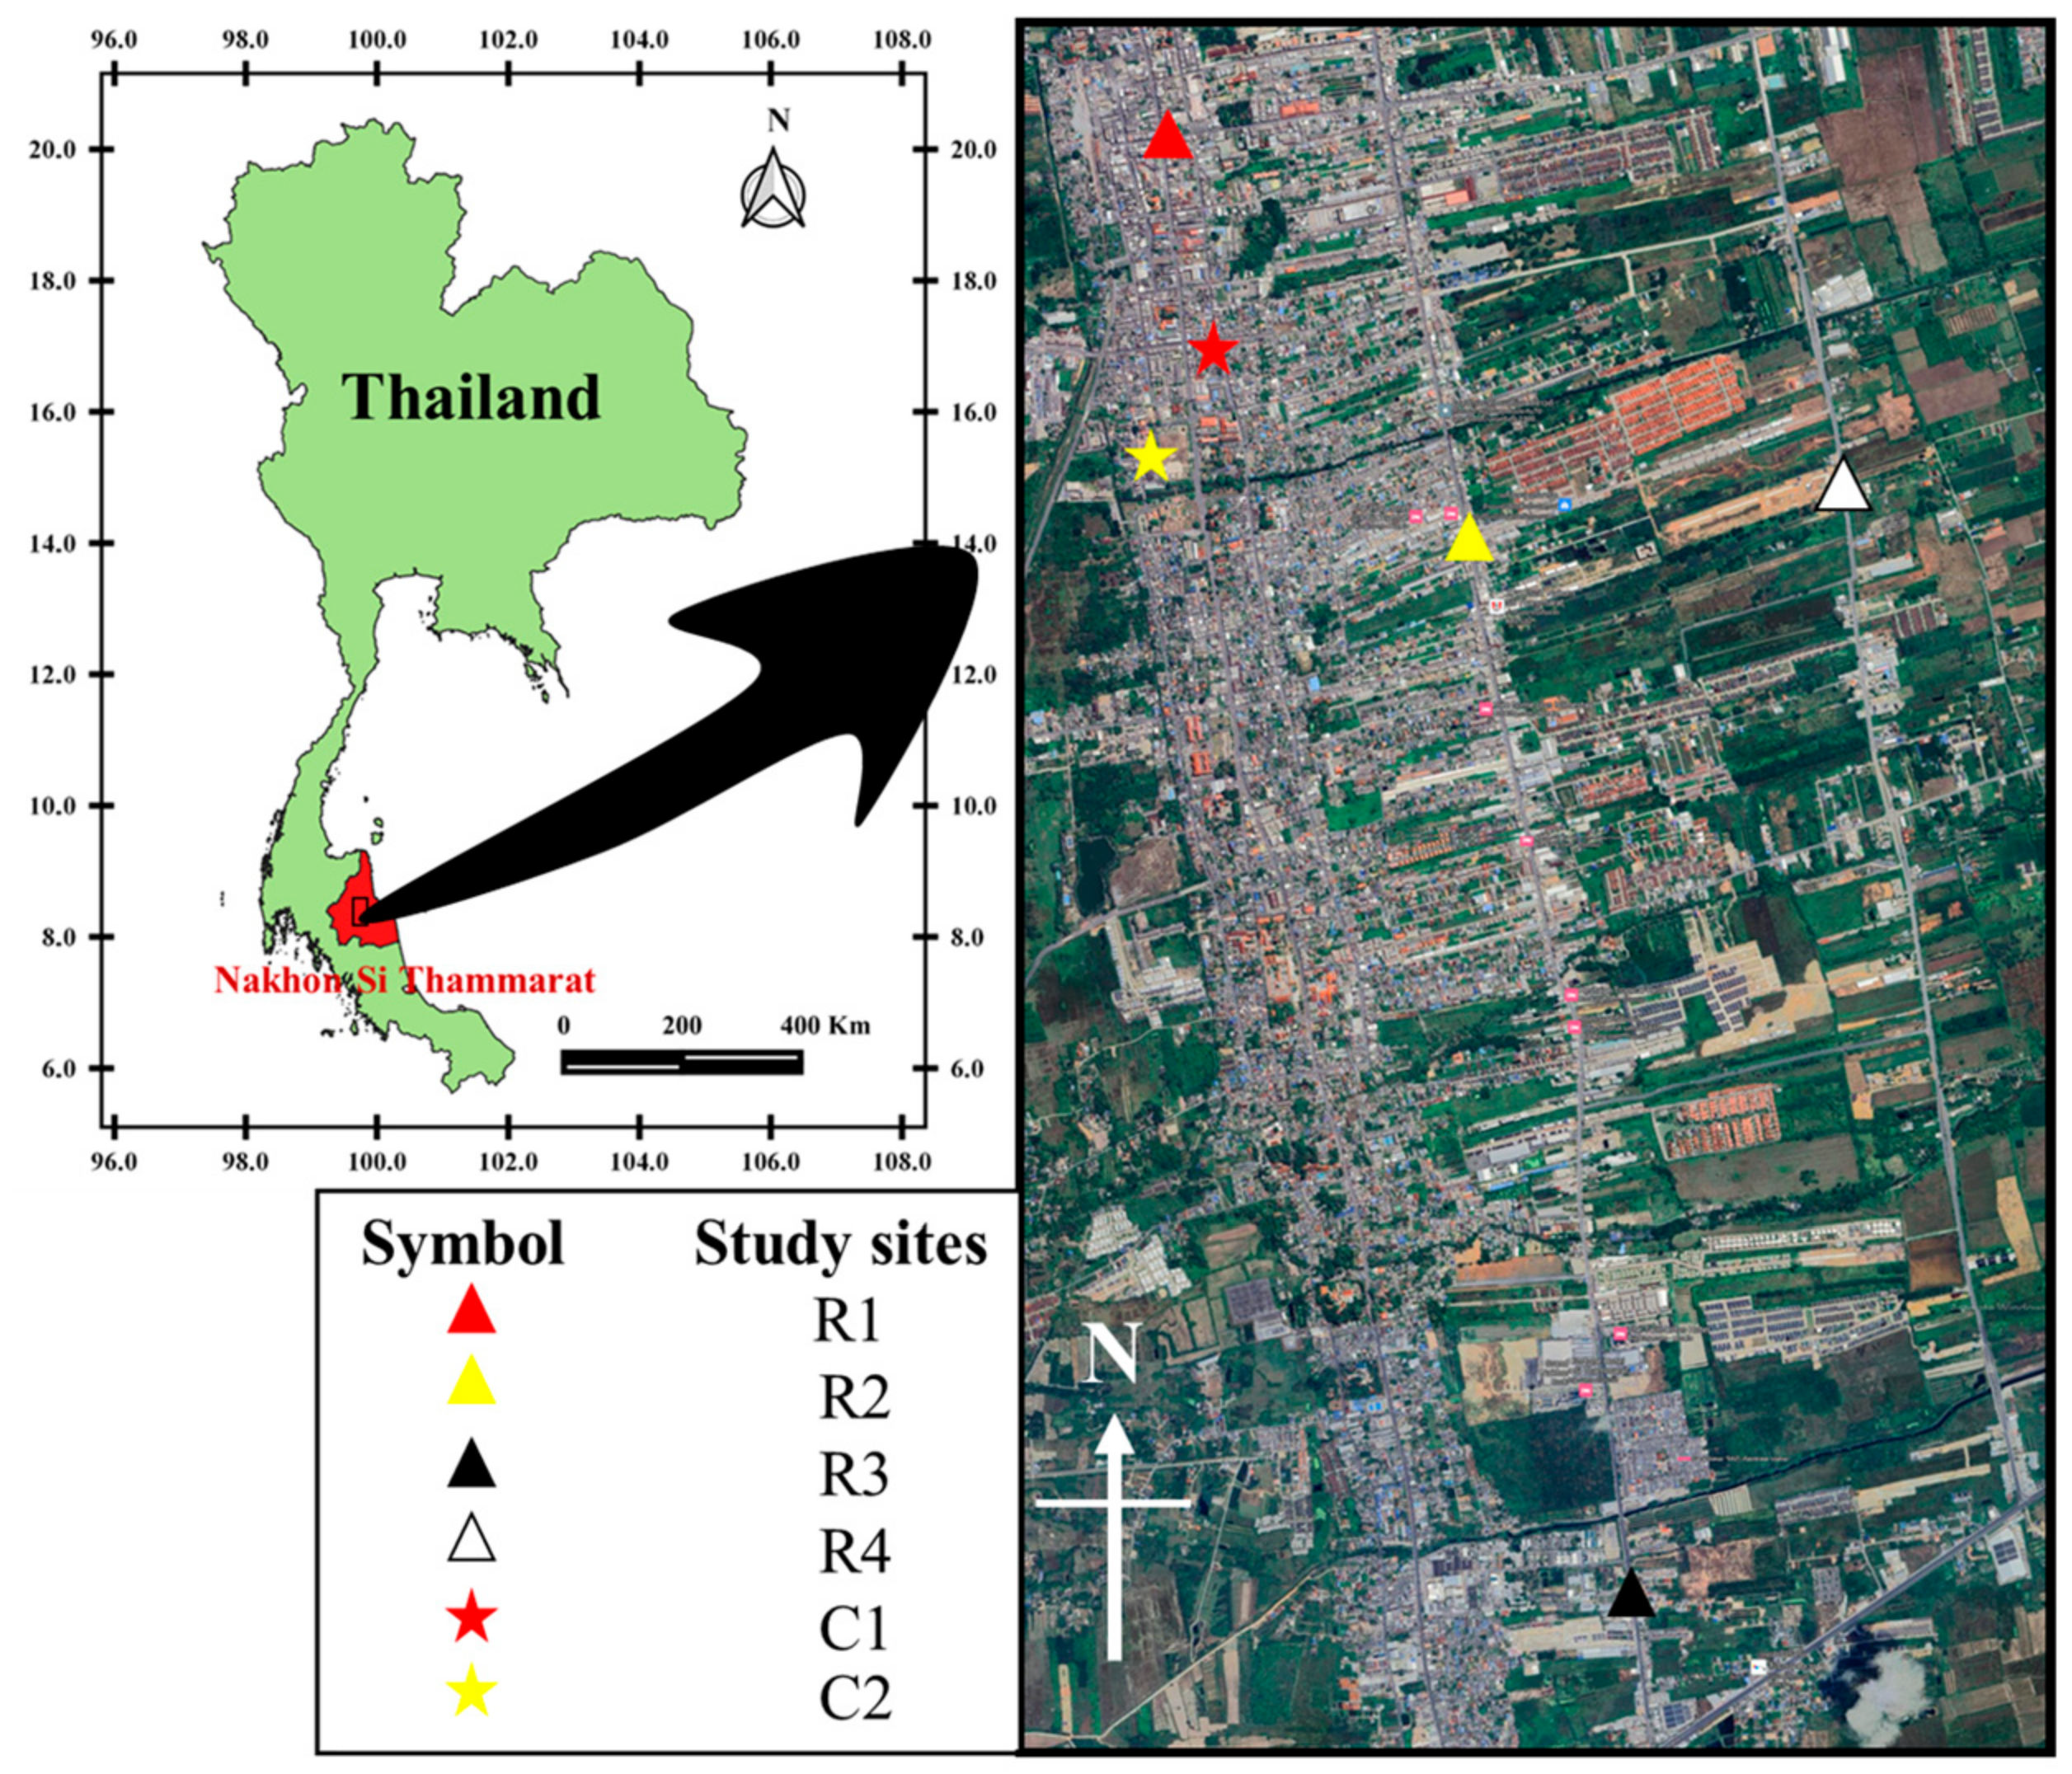
2.1. Study Area

The study area is located in Nakhon Si Thammarat Province, Thailand (8°26′10.2″ N, 99°57′46.4″ E). This province is the second largest in the southern part of Thailand. It is located on the eastern coast of the Malay Peninsula. The weather in this province is influenced by both the southwest and northeast monsoons (a tropical monsoon climate zone). There are only 2 seasons in this area, which are the summer (February–May) and rainy (June–January) seasons, with total annual rainfall of 590 mm and 2100 mm for the summer and rainy seasons, respectively. The annual temperature is around 27 °C, with 2500 mm of rainfall. According to the Tourism Authority of Thailand (TAT), this province has had the fastest growth in tourism since 2018. The economy of this area has grown rapidly compared to the development of the infrastructure, which has narrow roads, a high building density, and traffic flows. Therefore, traffic congestion and air quality are deteriorating in this province, particularly in urban areas.
Nitrogen concentrations were collected from six of the urban areas of Nakhon Si Thammarat (Figure 1). The study areas varied in terms of building density, traffic volume, and traffic flow, as well as roadside and community areas. The details of the study sites are presented below (Table 1).

2.2. Nitrogen Dioxide Collection

Air sampling was conducted once a month during both the dry season (February–April 2018) and the rainy season (June–December 2018). Nitrogen dioxide was collected using a passive sampler developed by the Environmental Chemistry Research Laboratory (ECRL), Chiang Mai University, Thailand. In passive sampling, the air diffuses into the passive tube, then the ambient NO2 is absorbed with a chemical coating on the absorbent placed at the bottom of the tube. The details of the air sampler preparation are provided by Bootdee et al. [19]. In brief, a set of passive samplers was used, consisting of 8 diffusion tubes, of which 5 were sample tubes and 3 were blank tubes. Each diffusion tube contained filter paper coated with triethanolamine (TEA) for NO2 collection. All diffusion tubes were closed with a cover before use. For the NO2 sampling, the cover of the sample tubes was removed, and the tubes were placed in a shelter together with the blank tubes to avoid the impact of meteorological effects. The shelter was hung at 1.5–2 m above ground level for 7 days. Then, the tubes were covered and sealed for further analysis in the laboratory. A total of 400 samples were collected in this study, comprising 8 samples from each of the 5 study sites collected every month over a period of 10 months.

2.3. Meteorological Data

The meteorological data, including humidity, temperature, and pressure, were monitored manually using an Outdoor Temperature and Humidity Sensor (MISOL model STAWH11501) on the day of the NO2 sampling.

2.4. Road and Building Densities

The road and building densities were calculated for all study sites. The GIS database of the main road network and buildings in the town of Nakhon Si Thammarat was created by digitizing road lines and building shapes from a web mapping service on Google.com. Grid cells of 200 m × 200 m, 500 m × 500 m, and 1000 m × 1000 m, which covered the main road network and the buildings, were drawn over the study sites. The features of the main roads and building areas contained in each grid were calculated for the road density and building density, respectively. The road density was calculated from the ratio of a summation of the length of the road in a grid cell (Ln,i) to the area of the grid cell (Ai m2) (Figure 2A). The building density was calculated from the ratio of a summation of the building area (Bn,i) to the grid cell area (Figure 2B).

2.5. Health Risk Assessment

The hazard quotient (HQ) was introduced by the United States Environmental Protection Agency (EPA)’s National-Scale Air Toxics Assessment (NATA) for air toxics risk assessment. This method is used to assess the potential for non-cancer effects in humans. The chronic non-cancer effects from exposure to air pollution include respiratory irritation, emphysema, mutagenicity, developmental toxicity, neurotoxicity, and reproductive toxicity [20]. Many studies have applied HQ values to indicate the non-cancer risk from exposure to air pollutants [21,22,23] because this method is a simple method using the ratio of exposure to effects to express the hazards or relative safety of exposure to pollutants.
The non-cancer risk from inhalation of ambient nitrogen dioxide was applied to assess the human health risk from exposure to NO2. This study focused on the residents who have a high risk of health effects from ambient air pollutants or who always stay in their houses in the town of Nakhon Si Thammarat. The selected residents were classified into 3 groups of residents, namely infants (0–1 years), children (1–5 years), and older people (>60 years), as these groups usually stay in the area for 24 h. The buildings in the town are mainly of the open-air type (natural ventilation). Various studies indicated that indoor NO2 concentration in open-air buildings is influenced by ambient NO2, and the peak indoor concentration can reach the same levels as the outdoor concentration [22,24,25]. Therefore, this study used the worst-case condition for the assessment, that the concentration of indoor air was similar to outdoor concentration. Thus, the exposure time to NO2 was 24 h per day.
The HQ was applied to assess the health risk from exposure to ambient NO2. The HQ value is the ratio of the potential of daily exposure to a pollutant (NO2) through inhalation to its intake level without adverse health effects (non-cancer effects). Lina et al. [26], referring to Limy [27], classified the hazard level according to the HQ value as follows: no hazard exists (HQ < 0.1); low hazard risk (HQ: 0.1–1.0); moderate hazard risk (HQ: 1.1–10); and high hazard risk (HQ > 10). The HQ value was calculated using Equations (1) and (2) [28,29,30]:
H Q = A D D R f D
A D D = C i × I R × E T × E F × E D B W × A T
where ADD (average daily dose) is the exposure to pollutants via inhalation (mg/kg.day); RfD (reference dose) refers to the pollutant level of human daily intake without adverse health effects during a lifetime (mg/kg.day), where the RfD of NO2 is 1.1 × 10⁻² mg/kg.day [30]; Ci is the NO2 concentration (mg/m3) at study site i, where the concentrations used for calculation in each study site were CR1 0.047 mg/m3, CR2 0.025 mg/m3, CR3 0.17 mg/m3, CR4 0.15 mg/m3, CC1 0.014 mg/m3, and CC2 0.010 mg/m3; IR is the inhalation rate (m3/day); BW is the body weight (kg) of each resident group; ET is the exposure time (h/day); EF is the exposure frequency (days/year); ED is the exposure duration (years); and AT is the average time (days). The details of each parameter are presented in Table 2.
This study applied the Monte Carlo Simulation (MCS) method for sensitivity analysis of non-carcinogenic risk assessment. The probability distribution of uncertainty/variability on the estimation was performed by the MSC method. A total of 10,000 repetitions [31] of the inhalation rate, body weight, and concentrations were independently performed by the MSC method in an Excel sheet with normal distribution and a confidence level of 95%. Then, each repetition was calculated for the HQ value.
Table 2. Exposure factors of the residents in Nahon Si Thammarat Province.
Exposed ParametersSymbolUnitInfant
(0–1 Year)
Child
(1–5 Years)
Adult
(>60 Years)
Probability
Distribution
References
Inhalation rateIRm3/h0.17 ± 0.04 *0.31 ± 0.06 *0.48 ± 0.16 *normal[32]
Body weightBWkg10.6 ± 1.7 *14.3 ± 2.5 *61.0 ± 14.9 *normal[33,34]
The exposure durationEDyear1530
The exposure timeETh/day242424
The exposure frequencyEFday/year365365365
The average timeATdayED × 365 (day/year) [35]
Note: * the average of the value of man and woman.

3. Results and Discussion

3.1. Nitrogen Dioxide Concentration

Figure 3A presents the annual average NO2 concentration in the studied urban areas of Nakhon Si Thammarat. The overall annual concentration of NO2 ranged between 9.5 and 47.1 µg/m3. The lowest concentration was found at the C2 site (9.5 ± 5.0 µg/m3), while the highest concentration was found at the R1 site (47.1 ± 20.1 µg/m3). The concentration at the R1 site was higher than the WHO guidelines’ annual standard for NO2 concentrations (40 µg/m3). Therefore, the level of NO2 at the R1 site was greater than the safe level, which may cause acute effects in humans due to exposure.
The roads in the urban areas of Nakhon Si Thammarat are connected to the city center (T1), where there is a high level of human activity related to the train station, the market, and the department stores. Traffic emissions were high in this area, so the pollutant levels were also at their highest. Table 3 shows the correlation coefficient between the study sites. The coefficients of all the traffic sites showed a moderate to strong relationship, with rs values ranging between 0.573 and 0.888. This indicates that the sources of NO2 were similar. The behavior of vehicle flows shows that vehicles can move from the city center to the main connecting road (T2 then T3) and then to the suburban area, or that vehicles can move to the bypass road (T4) and then to the suburban area. The traffic volume in the city center was divided between two roads. Traffic congestion is usually found in small areas in the city center. As such, lower NO2 concentrations were found in study sites T2–T4 compared to the T1 study site. Many studies indicated a form of urban spatial structure that had a high impact on pollutant accumulation in the studied areas [36,37,38]. It is recommended that the government improve the spatial structure of highly contiguous built-up areas by increasing vegetation planting and improving traffic flow through measures such as one-way driving and no parking at the side of roads in order to reduce traffic congestion.
The average NO2 concentration in the summer season was slightly greater than that in the rainy season in the community and low-traffic-density areas (Figure 3B). At the community sites, the concentration in the summer and rainy seasons ranged between 2.5 and 16.5 µg/m3 for C1, and 5.1 and 27.2 µg/m3 for C2. There was also no significant difference between seasons at the low-traffic site (R4), with concentrations ranging between 3.9 and 26.6 µg/m3. In the case of the high-traffic-density areas, the concentration of NO2 in the rainy season was 15.0 ± 5.4 µg/m3 for R3, 21.7 ± 6.4 µg/m3 for R2, and 38.2 ± 13.4 µg/m3 for R1. Meanwhile, the concentrations in the summer season were 22.9 ± 2.2 µg/m3, 33.4 ± 5.9 µg/m3, and 73.6 ± 6.0 µg/m3 for R3, R2, and R1, respectively. A significant difference between the seasons (p < 0.05) was observed for all sites. The seasons seem to have a greater effect on NO2 levels in areas with a high traffic density than in areas with a low traffic density.

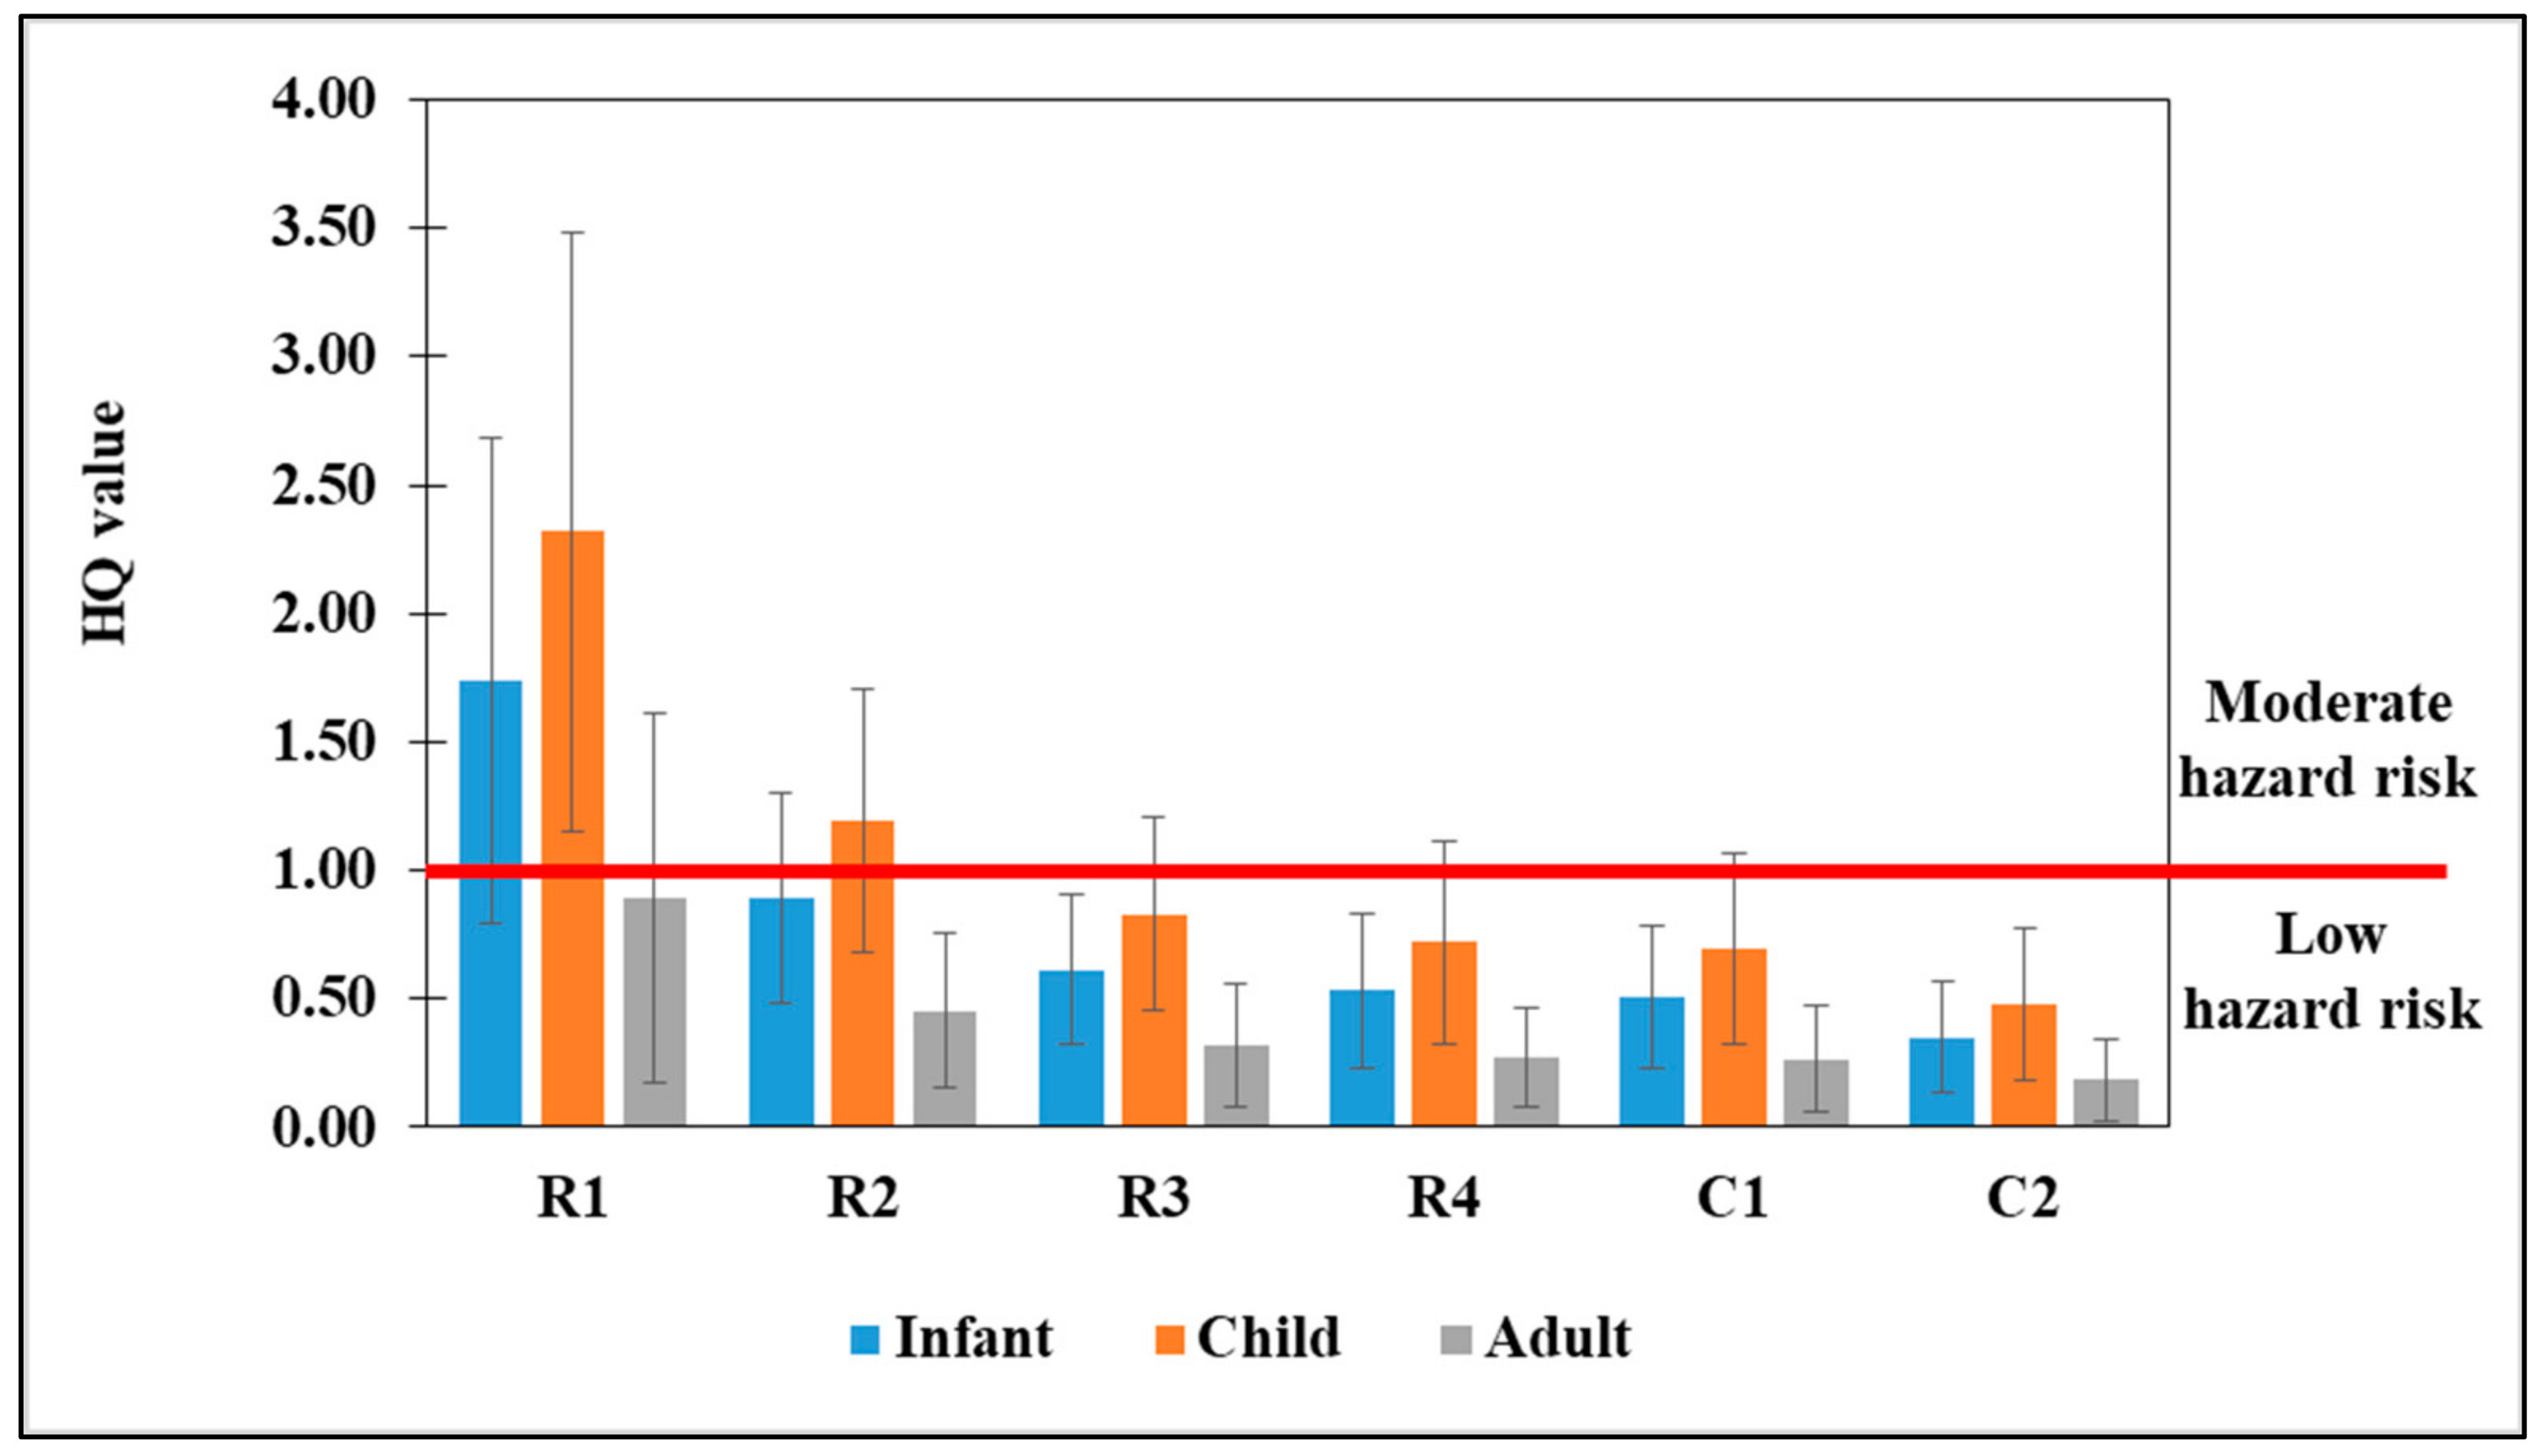
3.2. Human Health Risk Assessment

The hazard quotient (HQ) value was used to estimate the non-carcinogenic risks from exposure to NO2 at each study site for the three sensitive groups of residents, namely infants, children, and older people. Figure 4 presents the HQ values in the studied urban areas of Nakhon Si Thammarat, ranging between 0.03 (low hazard) and 2.68 (moderate hazard). The HQ value at the R1 site showed a moderate hazard risk to all resident groups, which was related to the concentrations being greater than the standard annual WHO guidelines. In the case of the R2 site, the concentration was acceptable in terms of the standard, but the HQ values for infants and children presented unacceptable exposure conditions with non-cancer risks for human health. These results indicated that these groups were safe from acute effects but at risk of long-term health effects from exposure to NO2. Additionally, the HQ value of the children group was the highest among the resident groups, ranging between 0.19 and 3.48 because of the high ratio of the inhalation rate to body weight. Therefore, children aged 1–5 years were at the greatest risk of exposure to NO2. This result agrees with that from the study of Kaewrat and Janta [39], which also indicated that the highest HQ value was found among children compared to other age groups in a tourist destination area of Nakhon Si Thammarat. Moreover, a lower-body-weight group was also found to have a higher risk of non-carcinogenic effects from exposure to air pollutants [35].
The HQ values at the high-traffic-density sites (R1, R2, and R3), where the NO2 concentration in the summer was significantly greater than that in the rainy season, were equivalent between the summer and rainy seasons (Table 4), whereas the HQ values at the R4, C1, and C2 sites in the rainy season were about 1.5 times those in the summer season, even though there were no significant difference in NO2 concentrations between the seasons. Even though the concentration in the rainy season was lower than that in the summer season, the exposure time in the rainy season (8 months) was twice the exposure time in the summer season (4 months), resulting in the high HQ value in the rainy season. This usually occurs in a tropical monsoon climate, particularly in the southern part of Thailand. However, other parts of Thailand have three seasons (summer, rainy, and winter seasons), where the duration of each season is similar, approximately 4 months; in these parts of Thailand, lower HQ values are observed in the rainy season [40]. Therefore, residents should reduce the time spent on outdoor activities and stay in enclosed spaces for longer periods. Moreover, vegetation should be planted in both traffic areas and indoors in order to reduce the concentrations of air pollutants because the leaves of plants can absorb NO2 through their stomata [41]. Moreover, outdoor vegetation can increase the deposition rates of pollutants because deposition rates on vegetation are greater than those on hard, built surfaces [42]. Additionally, the installation of air pollutant monitoring stations and reconsideration of the control levels of air pollutants are recommended actions to the relevant authorities.

3.3. Correlation Analysis of Pollutant Distribution

Landscapes, meteorological conditions, and pollution emission sources influence the level of pollutants in urban areas [37,43]. Meteorological factors include temperature, pressure, and humidity, and landscape factors include road density and building density. Table 5 presents the correlation between NO2 and landscape and meteorological conditions. The meteorological conditions collected over the NO2 sampling period were as follows: temperature ranging between 30.88 and 31.77, air pressure ranging between 1007.91 and 1008.31 hPa, and humidity ranging between 62.58 and 65.17%. The nitrogen concentration had a strong negative correlation (rs = −0.943) with humidity. The results of this study agree with those of the studies of Cros et al. [44] and Janta et al. [45], which also found a negative relation between NO2 and ambient humidity. High vapor levels in the atmosphere under high solar radiation are related to the formation of hydroxyl radicals (·OH). These radicals usually react with NO2 to form HNO3, resulting in a reduction in NO2 [46]. With regard to air pressure and temperature, we found a weak relationship with NO2 concentrations in the area because there was little variation between the study sites. However, the correlations of other meteorological parameters such as wind speed and rainfall were not analyzed in this study because of the lack of equipment for onsite measurement. Therefore, low-cost sensors for the measurements of wind speed and rainfall should be employed in further studies.
With respect to the landscape factors, this study evaluated the degree of interference caused by the road and building densities (200 × 200 m2, 500 × 500 m2, and 1000 × 1000 m2) in the concentrations of NO2. The road density of each site ranged from 0.010 to 0.021 for the 200 × 200 m2 area, from 0.006 to 0.018 for the 500 × 500 m2 area, and from 0.003 to 0.016 for the 1000 × 1000 m2 area. The road density presented strong and very strong correlations for the 500 × 500 m2 (rs = 0.543) and 200 × 200 m2 (rs = 0.841) areas, respectively, while a moderate correlation was observed for the 1000 × 1000 m2 (rs = 0.429) area. The result indicated that a high road density related to the pollutant concentration in each area. Moreover, the influence of the 200 × 200 m2 area on the concentration was greater than that of the 500 × 500 m2 and 1000 × 1000 m2 areas. This indicated that the density of traffic emissions greatly affected pollutant concentrations in each area. The building density of each site ranged from 0.013 to 0.761 for the 200 × 200 m2 area, from 0.004 to 0.586 for the 500 × 500 m2 area, and from 0.027 to 0.421 for the 1000 × 1000 m2 area. The building density showed a weak relationship with the pollutant level for all areas. However, when evaluating only the traffic sites (T1–T4), the coefficients of the building densities ranged from 0.890 to 0.985, showing a very strong correlation. This means that building density is strongly related to pollutant accumulation where there are heavy dense emissions because of the poor air ventilation in high-building-density areas. Additionally, Lau [47] suggested that high-density, high-rise built forms had a critical impact on the poor air quality and lack of air ventilation in urban areas and residential units or apartments. In the residential area (receptor area), the C1 site was located close to the T1 site and had the highest building density at 200 × 200 m2 (0.761), but it showed a low NO2 concentration compared to the traffic sites. These results illustrate that the pollutants might be blocked by the buildings or construction work in the area. Therefore, the development of green infrastructure or the planting of trees with a reasonable width-to-height ratio or a high aspect ratio (>65) in the streets is recommended in order to improve the air quality in urban areas [48].
The result of this study is a preliminary presentation of the impact of landscapes and meteorological conditions in a town in a tropical monsoon climate zone using the Spearman correlation. Only a relationship between both parameters and air pollutant accumulation was presented. The most influential parameter could not be indicated in this study because the number of cases (study sites) was fewer than the minimum number of case requirements for multiple regression analysis. Increasing of number of study sites and equipment for onsite measurement should be considered for future studies.

4. Conclusions

This study used passive air samplers to measure the concentrations of NO2 in urban areas in Nakhon Si Thammarat Province, Thailand. This study measured NO2 pollution and estimated the health risks from exposure to pollutants for three sensitive groups of residents in the town. Moreover, the influence of landscape and meteorological conditions on NO2 accumulation in small cities in a tropical monsoon climate zone was also estimated. The annual concentration of NO2 at the city center site (47.1 ± 20.1 µg/m3), which had high traffic and building density, exceeded the WHO guidelines for NO2 concentrations, indicating poor air quality that can negatively affect human health and the environment. In the high-traffic-density areas, the concentration in the summer season was significantly greater than that in the rainy season. The toxicity assessment in the high-traffic-density areas (HQ ≥ 1) indicated unacceptable exposure conditions with non-cancer risks for the sensitive groups of residents, particularly children aged 1–5 years. There was no significant difference between the seasons in those areas because of the longer exposure time in the rainy season compared to the summer season. Therefore, villagers living in the town should avoid outdoor activities throughout the year. With regard to the impact of landscape factors, road and building densities both showed a positive correlation with NO2 accumulation, as high building densities caused poor air ventilation in traffic areas, and the buildings blocked the pollutants in residential areas. Additionally, the meteorological conditions, particularly humidity, strongly impacted the reduction of NO2. The planting of vegetation in the streets is recommended in order to absorb NO2 and block air pollutants in urban areas. However, this study was a primary estimate of the relationship between air quality and landscape and meteorological conditions in the town of Nakhon Si Thammarat Province (a tropical monsoon climate zone). Air quality prediction will be investigated in further studies using a prediction model or a multiple regression model.

Author Contributions

Conceptualization, J.K., W.T. and R.J.; methodology, R.J. and S.S.; validation, R.J., S.S. and W.T.; formal analysis, R.J.; investigation, C.R.; resources, J.K.; data curation, R.J. and J.K.; writing—original draft preparation, R.J. and S.S.; writing—review and editing, K.H.S.M.D.; visualization, R.J.; supervision, R.J. and C.R. All authors have read and agreed to the published version of the manuscript.

Funding

This research received no external funding.

Institutional Review Board Statement

Not applicable.

Informed Consent Statement

Not applicable.

Data Availability Statement

Data sharing is not applicable to this article.

Acknowledgments

The authors would like to thank the Center for Scientific and Technological Equipment, Walailak University for support during sample preparation and analysis. We are also grateful to Sudarat Sangkron and Wimolsiri Pattanawichian for their support during sample collection.

Conflicts of Interest

The authors declare no conflict of interest.

References

  1. Wang, L.; Chen, R.; Sun, W.; Yang, X.; Li, X. Impact of High-Density Urban Built Environment on Chronic Obstructive Pulmonary Disease: A Case Study of Jing’an District, Shanghai. Int. J. Environ. Res. Public Health 2019, 17, 252. [Google Scholar] [CrossRef]
  2. Apichainan, N.; Norkaew, S.; Taneepanichskul, N. Residential environment in relation to self-report of respiratory and asthma symptoms among primary school children in a high-polluted urban area. Sci. Rep. 2022, 12, 2946. [Google Scholar] [CrossRef]
  3. Sharif, H.; Jan, S.S.; Sharif, S.; Seemi, T.; Naeem, H.; Rehman, J. Respiratory Diseases’ Burden in children and adolescents of marginalized population: A retrospective study in slum area of Karachi, Pakistan. Front. Epidemiol. 2023, 2, 1031666. [Google Scholar] [CrossRef]
  4. Wang, B.; Wang, B.; Lv, B.; Wang, R. Impact of Motor Vehicle Exhaust on the Air Quality of an Urban City. Aerosol Air Qual. Res. 2022, 22, 220213. [Google Scholar] [CrossRef]
  5. Beckerman, B.; Jerrett, M.; Brook, J.R.; Verma, K.D.; Arain, M.A.; Finkelstein, M.M. Correlation of nitrogen dioxide with other traffic pollutants near a major expressway. Atmos. Environ. 2008, 42, 275–290. [Google Scholar] [CrossRef]
  6. Smith, L.; Mukerjee, S.; Kovalcik, K.; Sams, E.; Stallings, C.; Hudgens, E.; Scott, J.; Krantz, T.; Neas, L. Near-road measurements for nitrogen dioxide and its association with traffic exposure zones. Atmos. Pollut. Res. 2015, 6, 1082–1086. [Google Scholar] [CrossRef]
  7. Jarvis, D.J.; Adamkiewicz, G.; Heroux, M.E.; Rapp, R.; Kelly, F.J. Nitrogen dioxide. In WHO Guidelines for Indoor Air Quality: Selected Pollutants; World Health Organization: Geneva, Switzerland, 2010; Available online: https://www.ncbi.nlm.nih.gov/books/NBK138707 (accessed on 1 August 2023).
  8. Grazuleviciene, R.; Maroziene, L.; Dulskiene, V.; Malinauskiene, V.; Azaraviciene, A.; Laurinaviciene, D.; Jankauskiene, K. Exposure to urban nitrogen dioxide pollution and the risk of myocardial infarction. Scand. J. Work Environ. Health 2004, 30, 293–298. [Google Scholar] [CrossRef]
  9. Zallaghi, E.; Goudarzi, G.; Haddad, M.N.; Moosavian, S.M.; Mohammadi, M.J. Assessing the Effects of Nitrogen Dioxide in Urban Air on Health of West and Southwest Cities of Iran. Health Sci. 2014, 6, e23469. [Google Scholar] [CrossRef]
  10. Buteau, S.; Hatzopoulou, M.; Crouse, L.D.; Smargiassi, A.; Burnett, R.T.; Logan, T.; Cavellin, L.D.; Goldberg, M.S. Comparison of spatiotemporal prediction models of daily exposure of individuals to ambient nitrogen dioxide and ozone in Montreal, Canada. Environ. Res. 2017, 156, 201–230. [Google Scholar] [CrossRef] [PubMed]
  11. He, Z.; He, Y.; Fan, G.; Li, Z.; Liang, Z.; Fang, H.; Zeng, Z.-C. Ozone Pollution and Its Response to Nitrogen Dioxide Change from a Dense Ground-Based Network in the Yangtze River Delta: Implications for Ozone Abatement in Urban Agglomeration. Atmosphere 2022, 13, 1450. [Google Scholar] [CrossRef]
  12. Breeze, P. Combustion Plant Emissions: Sulfur Dioxide, Nitrogen Oxides, and Acid Rain. In Electricity Generation and the Environment; Elsevier: Amsterdam, The Netherlands, 2017; pp. 33–47. [Google Scholar]
  13. Du, E.; Dong, D.; Zeng, X.; Sun, Z.; Jiang, X.; Vries, W. Direct effect of acid rain on leaf chlorophyll content of terrestrial plants in China. Sci. Total Environ. 2017, 605, 764–769. [Google Scholar] [CrossRef]
  14. Anenberg, S.C.; Mohegh, A.; Goldberg, D.L.; Kerr, G.H.; Brauer, M.; Burkart, K.; Hystad, P.; Larkin, A.; Wozniak, S.; Lamsal, L. Long-term trends in urban NO2 concentrations and associated paediatric asthma incidence: Estimates from global datasets. Lancet Planet Health 2022, 6, e49–e58. [Google Scholar] [CrossRef]
  15. Carslaw, D.C.; Farren, N.J.; Vaughan, A.R.; Drysdale, W.S.; Young, S.; Lee, J.D. The diminishing importance of nitrogen dioxide emissions from road vehicle exhaust. Atmos. Environ. X 2019, 1, 100002. [Google Scholar]
  16. Eheu-weil, I.T.; Azuma, K.I.; Ogunmuyiwa, F.B.B. Passive Sampling of Ambient Nitrogen Dioxide at Toll Plazas in Malaysia. Open J. Air Pollut. 2018, 7, 14–33. [Google Scholar]
  17. Voiculescu, M.; Constantin, D.E.; Condurache-Bota, S.; Călmuc, V.; Roșu, A.; Dragomir Bălănică, C.M. Role of Meteorological Parameters in the Diurnal and Seasonal Variation of NO2 in a Romanian Urban Environment. Int. J. Environ. Res. Public Health 2020, 17, 6228. [Google Scholar] [CrossRef] [PubMed]
  18. Su, Y.; Wu, X.; Zhao, Q.; Zhou, D.; Meng, X. Interference of Urban Morphological Parameters in the Spatiotemporal Distribution of PM10 and NO2, Taking Dalian as an Example. Atmosphere 2022, 13, 907. [Google Scholar] [CrossRef]
  19. Bootdee, S.; Chalemrom, P.; Chantara, S. Validation and field application of tailor-made nitrogen dioxide passive samplers. Int. J. Environ. Sci. Technol. 2012, 9, 515–526. [Google Scholar] [CrossRef]
  20. US EPA. An Overview of Methods for EPA’s National-Scale Air Toxics Assessment. 2011. Available online: https://www.epa.gov/sites/production/files/2015-10/documents/2005-nata-tmd.pdf (accessed on 13 September 2023).
  21. Yunesian, M.; Rostami, R.; Zarei, A.; Fazlzadeh, M.; Janjani, H. Exposure to high levels of PM2.5 and PM10 in the metropolis of Tehran and the associated health risks during 2016–2017. Microchem. J. 2019, 150, 104174. [Google Scholar] [CrossRef]
  22. Kaewrat, J.; Janta, R.; Sichum, S.; Kanabkaew, T. Indoor Air Quality, and Human Health Risk Assessment in the Open-Air Classroom. Sustainability 2021, 13, 8302. [Google Scholar] [CrossRef]
  23. Riveron, T.P.; Wilde, M.J.; Ibrahim, W.; Carr, L.; Monks, P.S.; Greening, N.J.; Gaillard, E.A.; Brighting, C.E.; Siddiqui, S.; Hansell, A.L.; et al. Characterisation of volatile organic compounds in hospital indoor air and exposure health risk determination. Build. Environ. 2023, 242, 110513. [Google Scholar]
  24. Leung, Y.C. Outdoor-indoor air pollution in urban environment: Challenges and opportunity. Front. Environ. Sci. 2015, 2, 46. [Google Scholar] [CrossRef]
  25. Hu, Y.; Zhao, B. Relationship between indoor and outdoor NO2: A review. Build. Environ. 2020, 180, 106909. [Google Scholar] [CrossRef]
  26. Lina, N.D.; Engelbrecht, J.C.; Wright, C.Y.; Osthuizen, M.A. Human health risks posed by exposure to PM10 for four life stages in a low socio-economic community in South Africa. Pan Afr. Med. J. 2014, 18, 206. [Google Scholar] [CrossRef] [PubMed]
  27. Lemly, A.D. Evaluation of the Hazard Quotient Method for Risk Assessment of Selenium. Ecotoxicol. Environ. Saf. 1996, 35, 156–162. [Google Scholar] [CrossRef] [PubMed]
  28. US EPA. Concepts Methods and Data Sources for Cumulative Health Risk Assessment of Multiple Chemicals, Exposures and Effects: A Resource Document, EPA/600/R-06/013F; National Center for Environmental Assessment, Office of Research and Development: Cincinnati, OH, USA, 2007; Available online: https://cfpub.epa.gov/ncea/risk/recordisplay.cfm?deid=190187 (accessed on 1 June 2023).
  29. US EPA. The Risk Assessment Guidance for Superfund (RAGS) Part A. Office of Emergency and Remedial Response, U.S.A. 2010. Available online: https://www.epa.gov/risk/risk-assessment-guidance-superfund-rags-part (accessed on 1 June 2023).
  30. Garbero, V.; Montaldo, A.; Lazovic, N.; Salizzoni, P.; Berrone, S.; Soulhac, L. The Impact of the Urban Air Pollution on the Human Health: A Case-Study in Turin. Air Pollut. Model. Its Appl. 2011, 11, 729–732. [Google Scholar]
  31. Abbasnia, A.; Ghoochani, M.; Yousefi, N.; Nazmara, S.; Radfard, M.; Soleimani, H.; Youdefi, M.; Barmar, S.; Alimohammadi, M. Prediction of human exposure and health risk assessment to trihalomethanes in indoor swimming pools and risk reduction strategy. Hum. Ecol. Risk Assess. Int. J. 2018, 25, 2098–2115. [Google Scholar] [CrossRef]
  32. US EPA. Exposure Factors Handbook Chapter 6, 2011. Available online: https://www.epa.gov/expobox/exposure-factors-handbook-chapter-6 (accessed on 23 September 2023).
  33. Chan, J.; Lu, Y.C.; Yao, M.M.-S.; Kosik, R.O. Correlation between hand grip strength and regional muscle mass in older Asian adults: An observational study. BMC Geriatr. 2022, 22, 206. [Google Scholar] [CrossRef]
  34. Sandjaja, S.; Poh, B.K.; Rojroongwasinkul, N.; Le Nguyen Bao, K.; Soekatri, M.; Wong, J.E.; Boonpraderm, A.; Huu, C.N.; Deurenberg, P.; Manios, Y. Body weight and BMI percentiles for children in the South-East Asian Nutrition Surveys (SEANUTS). Public Health Nutr. 2018, 21, 2972–2981. [Google Scholar] [CrossRef]
  35. Gruszecka-Kosowska, A. Assessment of the Krako’w inhabitants’ health risk caused by the exposure to inhalation of outdoor air contaminants. Stoch. Environ. Res. Risk Assess. 2016, 32, 485–499. [Google Scholar] [CrossRef]
  36. Bereitschaft, B.; Debbage, K. Urban Form, Air Pollution, and CO2 emissions in Large U.S. Metropolitan Areas. Prof. Geogr. 2013, 65, 612–635. [Google Scholar] [CrossRef]
  37. McCarty, J.; Kaza, N. Urban form and air quality in the United States. Landsc. Urban Plan. 2015, 139, 168–179. [Google Scholar] [CrossRef]
  38. Wang, F.; Dong, M.; Ren, J.; Luo, S.; Zhao, H.; Liu, J. The impact of urban spatial structure on air pollution: Empirical evidence from China. Environ. Dev. Sustain. 2022, 24, 5531–5550. [Google Scholar] [CrossRef]
  39. Kaewrat, J.; Janta, R. Health Risk Assessment of Residents in a Tourist City: A Case Study of Nakhon Si Thammarat Province. Walailak J. Sci. Techol. 2021, 18, 11510. [Google Scholar] [CrossRef]
  40. Sillapapiromsuk, S.; Koontoop, G.; Bootdee, S. Health Risk Assessment of Ambient Nitrogen Dioxide Concentrations in Urban and Industrial Area in Rayong Province, Thailand. Trends Sci. 2022, 19, 4476. [Google Scholar] [CrossRef]
  41. Gubb, C.; Blanusa, T.; Griffiths, A.; Pfrang, C. Potted plants can remove the pollutant nitrogen dioxide indoors. Air Qual. Atmos. Health 2022, 15, 479–490. [Google Scholar] [CrossRef]
  42. Hewitt, C.N.; Ashworth, K.; MacKenzie, A.R. Using green infrastructure to improve urban air quality (GI4AQ). Ambio 2020, 49, 62–73. [Google Scholar] [CrossRef] [PubMed]
  43. Han, L.; Zhou, W.; Li, W.; Meshesha, D.T.; Li, L.; Zheng, M. Meteorological and urban landscape factors on severe air pollution in Beijing. Air Waste Manag. Assoc. 2015, 65, 782–787. [Google Scholar] [CrossRef] [PubMed]
  44. Cros, C.J.; Terpeluk, A.L.; Crain, N.E.; Juenger, M.C.; Corsi, R.L. Influence of environmental factors on the removal of oxides of nitrogen by a photocatalytic coating”. Air Waste Manag. Assoc. 2015, 65, 937–947. [Google Scholar] [CrossRef]
  45. Janta, R.; Kaewrat, J.; Rattikansukha, C.; Sichum, S. Measurement of Nitrogen Dioxide Concentration in Traffic Areas of Nakhon Si Thammarat Province and Heath Risk Assessment. Tech. Educ. J. KMUTNB 2020, 30, 481–494. (In Thai) [Google Scholar]
  46. Wang, G.; Jia, S.; Li, R.; Ma, S.; Chen, X.; Wu, Z.; Shi, G.; Niu, X. Seasonal variation characteristics of hydroxyl radical pollution and its potential formation mechanism during the daytime in Lanzhou. J. Environ. Sci. 2020, 95, 58–64. [Google Scholar] [CrossRef]
  47. Lau, S.S.Y. Physical Environment of Tall Residential Buildings: The Case of Hong Kong. High-Rise Living Asian Cities 2010, 12, 25–47. [Google Scholar]
  48. Voordeckers, D.; Meysman, F.J.R.; Billen, P.; Tytgat, P.; Van, A. The impact of street canyon morphology and traffic volume on NO2 values in the street canyons of Antwerp. Build. Environ. 2021, 187, 107825. [Google Scholar] [CrossRef]
Figure 1. Study sites in urban areas of Nakhon Si Thammarat Province, Thailand.
Sustainability 15 14672 g001
Figure 2. Parameters for calculation of land properties: (A) road density; (B) building density.
Sustainability 15 14672 g002
Figure 3. Nitrogen dioxide concentrations at each study site: (A) annual concentrations; (B) concentrations in the summer and rainy seasons.
Sustainability 15 14672 g003
Figure 4. HQ values of the residents in the town of Nakhon Si Thammarat. Note: The red line refers to an acceptable limit of non-carcinogenic health risk.
Sustainability 15 14672 g004
Table 1. Details of study sites in Nakhon Si Thammarat Province.
Study SitesSymbolsDetails of Study Sites
1R1Roadside in the city center with high traffic density, high building density, and low traffic flow
2R2Roadside of the main connecting road from the city center with high traffic density, high building density, and good traffic flow
3R3Roadside of the main connecting road from the city center with high traffic density, low building density, and good traffic flow
4R4Roadside of the bypass road with low traffic density, low building density, and good traffic flow
5C1Residential area with high building density (residential area)
6C2Residential area with low building density (residential area)
Table 3. The correlation coefficient of nitrogen dioxide concentration between the study sites.
Study SitesT1T2T3T4C1
T20.860 **
T30.748 **0.888 **
T40.748 **0.657 *0.573
C10.636 *0.657 *0.643 *0.280
C20.3780.5240.601 *0.2660.322
Note: * and ** refer to a significant correlation at the 0.05 and 0.01 levels (2-tailed), respectively.
Table 4. A comparison of the HQ values between the seasons.
Study Sites HQ Value
Infant (0–1 Year)Child (1–5 Years)Adult (>60 Years)
SummerRainy S.SummerRainy S.SummerRainy S.
R10.87 ± 0.270.88 ± 0.451.18 ± 0.331.19 ± 0.570.45 ± 0.260.46 ± 0.36
R20.39 ± 0.140.52 ± 0.220.52 ± 0.170.7 ± 0.280.20 ± 0.130.26 ± 0.16
R30.27 ± 0.090.35 ± 0.160.37 ± 0.100.47 ± 0.200.14 ± 0.080.18 ± 0.13
R40.24 ± 0.100.30 ± 0.190.32 ± 0.130.40 ± 0.240.12 ± 0.080.15 ± 0.13
C10.19 ± 0.070.34 ± 0.210.26 ± 0.080.45 ± 0.260.10 ± 0.060.17 ± 0.15
C20.14 ± 0.060.22 ± 0.140.19 ± 0.070.3 ± 0.180.07 ± 0.050.11 ± 0.09
Table 5. Correlations between nitrogen dioxide concentrations, land properties, and meteorological conditions.
ParametersSpearman Correlation Coefficient
Meteorological conditionsHumidity−0.943 **
Pressure0.257
Temperature−0.371
Land propertiesRoad density (1000 × 1000 m2)0.429
Road density (500 × 500 m2)0.543
Road density (200 × 200 m2)0.841 *
Building density (1000 × 1000 m2)−0.082
Building density (500 × 500 m2)0.371
Building density (200 × 200 m2)0.314
* and ** refer to a significant correlation at the 0.05 and 0.01 levels (2-tailed), respectively.
Disclaimer/Publisher’s Note: The statements, opinions and data contained in all publications are solely those of the individual author(s) and contributor(s) and not of MDPI and/or the editor(s). MDPI and/or the editor(s) disclaim responsibility for any injury to people or property resulting from any ideas, methods, instructions or products referred to in the content.

