Article

The Misalignment of the FT50 with the Achievement of the UN’s SDGs: A Call for Responsible Research Assessment by Business Schools

by
Kathleen Rodenburg
1,*,
Michael Rowan
1,
Andrew Nixon
1 and
Julia Christensen Hughes
1,2
1
Gordon S. Lang School of Business and Economics, University of Guelph, Guelph, ON N1G 2W1, Canada
2
Yorkville University, Toronto, ON L4K 4N1, Canada
*
Author to whom correspondence should be addressed.
Sustainability 2022, 14(15), 9598; https://doi.org/10.3390/su14159598
Submission received: 30 June 2022 / Revised: 27 July 2022 / Accepted: 27 July 2022 / Published: 4 August 2022
(This article belongs to the Section Sustainable Management)

Abstract

:
Publication in the list of 50 journals endorsed by the Financial Times (i.e., the FT50) has become ‘institutionalized’ as a primary measure of research quality and prestige by business schools and faculty. This study investigated the extent to which this closed publication system is (mis)aligned with societal imperatives, in particular the United Nation’s 17 Sustainable Development Goals (SDGs). Research methods included both inductive and deductive analysis. Undergraduate and graduate student research assistants, enrolled in business-related programs, read all 4522 articles published by FT50 journals in 2019 and assessed their relevance to explicit and implicit concepts in the SDG framework. Additionally, potential biases that might stifle research innovation in support of the SDGs were explored. Findings included that 90% of articles were found to have no ‘explicit’ relationship to the SDGs, while only 17% were interpreted as having an implicit relationship. SDG-related articles were disproportionately from one journal-the Journal of Business Ethics (48.1%). There was also an over-representation of observed white male primary authors, who used North American (NA) data sets from NA institutions. A logistic regression model determined that the predicted probability of an SDG-related article increased with observed female primary authors, who used non-NA data sets and institutions. The next steps include comparing this methodological approach with machine learning techniques to find a more efficient and robust method for analyzing an article’s SDG content. Business Schools with sustainability as a core value are encouraged to move beyond FT50 publications for assessing research quality, including for tenure and promotion purposes, and place more focus on assessing research relevance and impact.

1. Introduction

Business school rankings have come under increased scrutiny over the past several years, for their enormous power to influence brand, enrolments, institutional priorities, and resources, and for the questionable metrics on which they are based [1]. Rankings provide a ‘perceived’ credible way to externally validate and benchmark universities nationally and internationally and assist potential students, faculty members, funding agencies and philanthropists when deciding which university best fits their interests [1]. During the World Economic Forum (WEF) in Davos [2] deans of business schools and industry executives identified by Corporate Knights as sustainability champions noted that although published rankings can positively influence student recruitment and resources, they can also cause unintended consequences. Specifically, “…perverse effects on faculty and decanal priorities have been identified, including incenting behaviors that are at odds with the achievement of the United Nations Sustainable Development Goals (SDGs) [1,3] and the 2030 agenda [4] (p. 1).” This in part may be due to a general lack of awareness of the methodological limitations of such rankings, including criteria and focus. Special Issues purport to rank ‘the best business schools in the world’, even though the answer to the question, ‘best at what?’ may not be well understood. In general, business school rankings use data from a combination of internal and external sources, including research output measured through citation indexing databases or bibliometrics; publicly available data on institutional demographics, student administration, and finances; and self-reported data from employers, students, faculty, and alumni. The chosen indicators, algorithms and methodologies vary among rankings with many reflecting the subjective value judgments and priorities of the promoter of the evaluation [5].
We suggest that the insidious influence rankings have had on the perceptions and priorities of the broader academic and practitioner business communities has yet to be fully realized; in particular, the impact arising from ‘unconditionally’ accepting unqualified metrics as evidence of academic quality. For example, measures used by ranking bodies of a school’s research output have influenced government assessment of (research) excellence at the institution, funding organizations’ decisions to invest in research, and partnerships with external stakeholders [6]. Recognizing the powerful influence that these metrics have on these additional stakeholders, many ‘play the game’, aligning their priorities accordingly [7].
To raise awareness of the issue, this study focused on the Financial Times MBA ranking methodology and specifically the 10% weighting assigned to the number of publications by an institution’s faculty in the Financial Times’ approved list of 50 journals, commonly referred to as the FT50. Over time, regardless of whether a school participates in the ranking or not, this quantifiable metric has been reified by many business schools and faculty alike as the definition of excellence in faculty research.
While only approximately 315 accredited business schools with MBA programs (i.e., Global MBA, Executive MBA, and online MBA) participated in the 2022 Financial Times ranking, publication in the FT50 list has become ‘institutionalized’ by a much larger number and is used for a variety of purposes, including when hiring faculty and for promotion and tenure (P&T) decisions [8,9]. As such, research published in other journals or disseminated in other ways can be devalued, regardless of quality and potential for impact [9]. Reportedly, promotions have been denied, faculty have been put on probation or given teaching only contracts for failure to publish in the FT50 [9]. Of further concern is the influence of this practice on stakeholders beyond the institution, including society in general, as this metric has little to do with assessing research. Instead, it merely succeeds in categorizing academics into those who have been successful in publishing in a small list of journals judged to be of value by elite schools, and those who have not [10]. In this way, we suggest the uncritical institutionalization of the FT50 may be stifling research innovation, providing a disincentive to align research priorities with evolving societal imperatives, such as embracing corporate social responsibility and sustainability, or inter-disciplinary approaches for resolving ‘wicked-world’ problems identified within the SDGs. Other criticisms of the FT50 have suggested the potential existence of systemic biases within the journals themselves, such as privileging topics and organizations of interest to those in developed nations with strong economies, papers written in English, by male authors, with a large percentage of citations coming from the same journal [11,12,13,14].
The present study had three primary objectives. First, to determine the incidence of found relationships between the 2019 FT50 journal articles (4522 in total) and the topics and concepts discussed within the SDG framework. The results of this investigation provide evidence of the extent to which publications within the FT50 may be (mis)aligned with societal imperatives, particularly the SDGs. This work builds on previous research that has similarly investigated to what extent articles in the FT50 are aligned with the SDGs, in both content and process.
Second, this study provides a methodological contribution to the literature, exploring the contributions of human judgement. Past studies have employed both machine learning (ML) and bibliometric techniques to identify aligned articles [15] with the SDGs, with varying results. For the most part, they have noted a glaring gap in SDG-related topics and themes found within FT50 journals [16]. However, no algorithm has yet been identified or sanctioned as a best practice for completing this task. This study conducted a similar analysis to the ones previously mentioned uniquely using qualitative methods to account for the acknowledged weaknesses of ML and bibliometric techniques [17]. A research team consisting of trained undergraduate and graduate business students read 4522 articles published by FT50 journals in 2019 to determine found relationships with topics from the SDG’s 2030 agenda using prescribed interpretative frameworks [18]. These frameworks were created by the research team using inductive reasoning to isolate key themes found within the SDGs blueprint [19]. Next, students were required to apply deductive reasoning to form a conclusion using these frameworks to determine whether the general meaning of the text within each article could be interpreted as SDG-related. Both the frameworks and the SDG identification process followed the general principles of hermeneutic phenomenology described by Van Manen [19]. Bergh et al. [20], applying their typology would classify this as an incremental methodological contribution, given its potential to matter to a large group of scholars and that only minor adjustments to practice would occur in the future due to cost and time required to execute this qualitative approach. We believe the combination and comparison of this approach with other methods using the same data set in future studies will result in a major contribution to the literature, providing a more robust treatment of a highly controversial research topic; a topic where robust evidence could have significant financial, institutional and faculty legitimacy implications.
Finally, key biases peculiar to the FT50 that may stifle research innovation in support of the SDGs were explored. Our findings suggest that this closed publication system has created “echo-chambers insulated from rebuttal” [21] and that selectivity, confirmation, and anchoring biases have unduly and counterproductively influenced the research agenda within the business school community. These influences include country of origin for the data source, whether the study was qualitative or otherwise, author diversity by institutional affiliation, visual assessment of gender and Black, Indigenous, and People of Colour (BIPOC), status of first author (applying the assumption that authors listed first on an article were either the principal and primary investigator for the study or had contributed at least equally to others, thereby having significant influence), and length of time from submission to publication. To determine the influence these factors had on the likelihood of an article’s relatedness to the SDGs, quantitative methods were employed. Specifically, Ordinary Least Squares (OLS) and Logistic regressions were performed with SDG-related articles as the dependent variable and the above listed factors served as possible explanations for SDG-related outcomes. A statistically significant finding for any of the predicted influencers (biases) provides evidence that change is needed and a more accurate understanding of what precisely needs to be changed.
Overall, 90% (4070) of the articles that were reviewed were identified as having no explicit relationship, where ‘explicit’ indicated a found direct relationship to the concepts, targets and goals expressed in the SDG framework. In contrast, just 17% (769) were found to have an implicit relationship, where ‘implicit’ required human interpretative skills to make a connection. This means that fully 73% (3301 articles) were identified as having no alignment (neither explicit nor implicit). Further, close to half (586 articles, 48.1%) of the 1221 articles identified as related (explicit or implicit) were from just one journal-the Journal of Business Ethics (JBE). Additionally, observed female and BIPOC primary authors were found to be underrepresented relative to the number of female and BIPOC tenure-track faculty identified at AACSB [22,23] schools. The predicted probability of an article being related to the SDGs was found to be statistically significantly greater when an article involved qualitative methods, used non-NA data, was not affiliated with a NA institution, had an observed female primary author, had a time to publication between 12–18 months or was published within JBE.
Results from the study directionally align with results from other studies. For example, Rodenburg, De Silva and Christensen Hughes, using ML techniques on the same 2019 FT50 articles, found 89% of articles to have no explicit relationship with the SDG framework (75.6% of those identified as having an explicit relationship were from JBE), while 25% were found to have an implicit one (18.1% of these were from JBE) [16]. Although there is no way to determine whether the identified SDG-related articles had an impact on moving the 2030 agenda forward, these results are concerning given that business schools/academia have been identified as key contributors necessary to their achievement [24]. Business Schools are part of a much larger ecosystem. Despite the rising inclusion of the SDGs, Corporate Social Responsibility (CSR) and Environmental Social Governance (ESG) topics in business school course curricula, the focus of the majority of faculty research away from these topics provides a powerful signal to students that these topics are less important than traditional business models that support shareholder primacy. Consequently, the knowledge and values of business school graduates future business leaders may be at odds with the increasing call for businesses to contribute significantly and swiftly toward solving the world’s most pressing challenges.
This paper is divided as follows: In Section 1, given the widespread acceptance of FT50 journal publications as indicators of ‘quality’ research within the business school landscape, the results of an investigative study of the evolution of the list of journals that comprise the FT50 List is shared. Understanding the criteria used to inform the ranking over time, and the identity of the individuals and institutions who provided input into their development, helps to challenge the legitimacy of this metric as an overall measure of research quality. This section also presents a review of literature that has found embedded biases in academic publishing, which potentially inhibit SDG-related research. The section concludes with the hypotheses that guided this study. Section 2 describes the methodology for both the qualitative and quantitative research conducted. Summary statistics and detailed statistical inference results are presented in Section 3. In Section 4 the implications of the findings and limitations are discussed, recommendations are made to better align future research toward positive societal impact, and a conclusion is provided.

2. Literature

2.1. The Financial Times MBA Ranking

The Financial Times MBA Business School Ranking is arguably largely a ranking that assesses the potential benefit for students with the financial means to attend one of the Western world’s so called ‘elite’ programs, with 57% of the criteria focused on self-reported post-graduation salary and career progress. This metric includes: weighted salaries (20%), salary increase (20%), value for money (3%), employed after 3 months (2%), career progress (3%), aims achieved (3%) and international mobility (6%). This emphasis on salary and career progression are important as it allows potential candidates to determine their rate of return from their educational investment. Elite MBA programs in turn want to be ranked highly to continue to justify the high cost of attendance. For example, tuition plus living expenses to complete a two-year MBA program at Harvard is estimated to cost USD 221,480, which includes USD 146,880 in tuition and USD 74,600 in estimated living expenses [25]. Students attending such programs can additionally expect to build a professional network of others from similarly privileged backgrounds.
A second, much smaller dimension measures the diversity of faculty, students, and board members (Female, 5% and BIPOC, 10%). Little weight (7%) is assigned to the curriculum (3% ESG content, 3% International course experience, 1% extra language needed to graduate), signaling that what students can expect to learn is one of the least important areas of consideration.
With respect to research, it may be surprising given its larger influence, that only 10% of the Financial Times ranking pertains to the publication record of faculty members in select academic journals (see Appendix A, Table A1). As previously suggested, regardless of a business school’s participation in the Financial Times ranking, publishing in the FT50 has become broadly institutionalized, making publication in these journals a necessity for many academics hoping to secure and advance in a business school tenure-track position [8].
Both North American and European business school faculty have reported explicit expectations by the administration to publish in the FT50 to gain tenure and promotion [26]. For example, at the University of Denver’s Daniels College of Business, faculty are rewarded bonus points (Premier Plus) for publication in the FT50 [27]. Connelly and Gallagher noted that faculty at some schools receive merit pay or additional research funds for each publication on the list [26]. The Department of Management at Baylor University’s Hankamer School of Business and the College of Business and Economics at the University of Hawaii at Hilo explicitly include the FT50 in their tenure and promotion documents [28,29]. Furthermore, while Baylor participated in the FT rankings, Hilo, an AACSB-accredited school, did not. The Foster School of Business at the University of Washington advertised their FT50 publications on a “Focus on Research” webpage [30] and used these publications as evidence of achievement toward the standards set out by AACSB (2020 Guiding Principles and Standards for Business Education for Quality and Impact). The University of Alberta’s School of Business included the FT50 List as the gold standard publishing target for their management scholars [31]. Other business schools have used the FT50 List as a filter for entry-level positions, stating that prospective candidates will have demonstrated evidence of outstanding research and scholarship by having “publications or late-round revisions in relevant top-tier journals, and preferably those journals in the Financial Times 50 group” [32,33].
In summary, the Financial Times’ measure of research productivity based on publication in a specified journal list, has accumulated value and influence far beyond its use in determining 10 percent of the score in the ranking of an exceptionally small percentage of the world’s MBA programs. Publication in the FT50 list serves as an internal assessment tool for many business schools as a proxy for quality research.
Next, we provide an overview of the philosophy and values that guided the formation of the Financial Times MBA ranking and in particular, the evolution of the coveted list of journals that has held such sway over faculty research priorities.

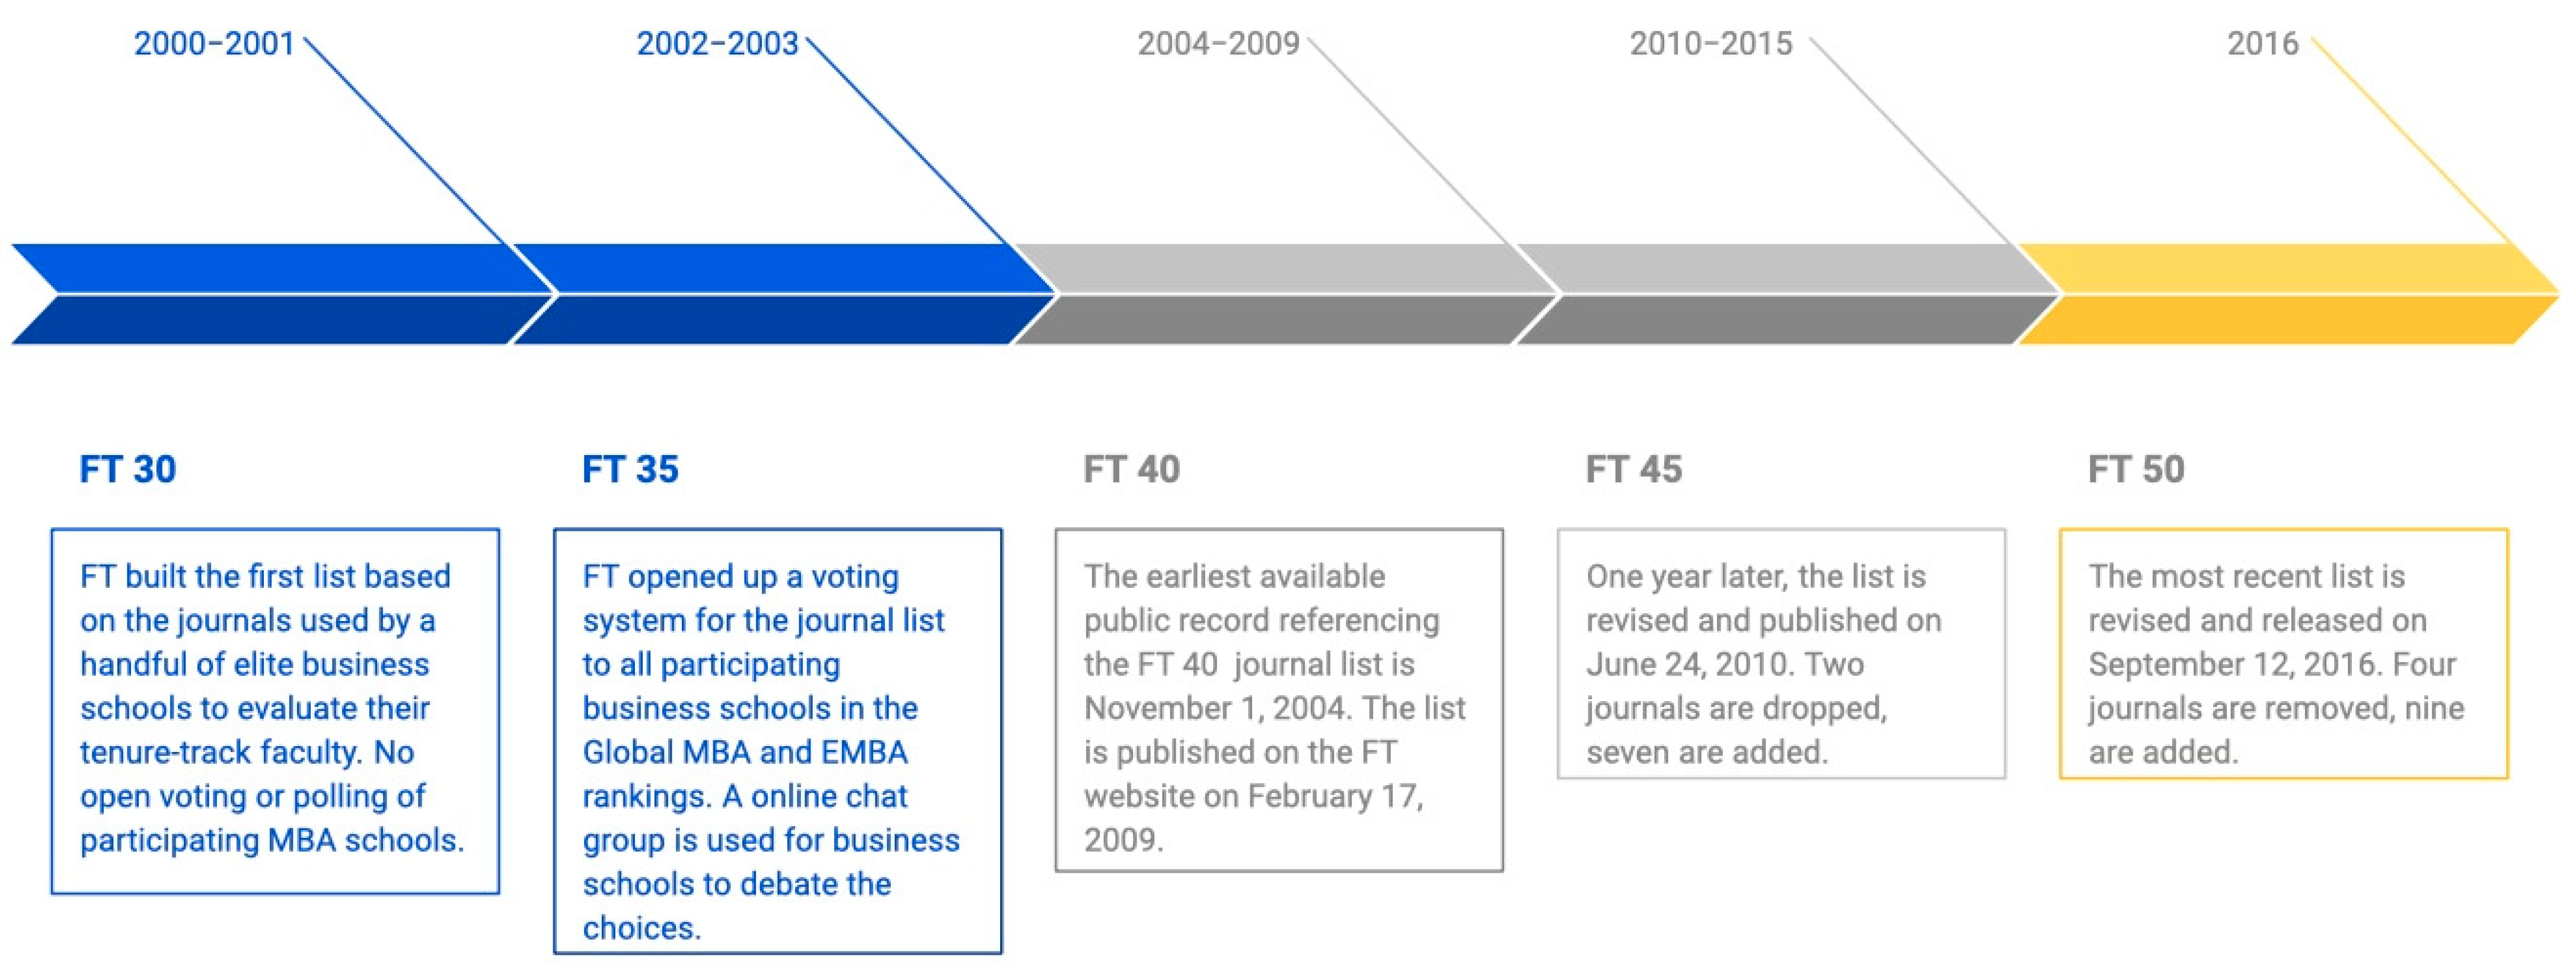
2.2. Evolution of the FT50 List

The first Financial Times business school ranking was introduced over twenty years ago, in 1999, with an exclusive focus on MBA programs. The initial journal list used to benchmark research productivity was believed to be launched in 2000 or 2001 and consisted of 30 journals. Efforts to uncover the first FT list, the justification for their inclusion, and the methods used for its growth to 35 journals, were complicated by a lack of available records. According to the Financial Times archives, however, in 2002 a voting system open to participating business schools in the MBA and EMBA rankings expanded the list from 35 to 40 journals (see Figure 1). In 2004, an article referenced the FT40 list as measuring scholarship published by faculty members in “40 international academic and practitioner journals chosen by the business schools” [34]. Public records in 2009 reported on the further expansion of the list to 45 journals (see Appendix A, Table A1). The explanation of how the current FT50 list was compiled was published in 2016 [35].
Andrew Jack, Global Education Editor of the Financial Times, shared that the first list of journals used in calculating the Research Rank was published in the “second or third year” of the MBA rankings [36]. When asked how the original list was created, he provided the following, “The list was originally developed in consultation with academics at the leading global business schools that participate in the Financial Times’ rankings and has been updated and expanded several times over the past two decades” [37]. Notably, the revisions made over time have been primarily additive. For example, the FT 45 and FT 50 lists removed six journals while adding 16 over a 7-year period (see Appendix A, Table A1)). In this manner, the list arguably enshrined the perspective of the largely elite Western schools the Financial Times already recognized as ‘globally leading’, essentially reinforcing the status quo [38]. Figure 1 illustrates the evolution from 2000 to 2016 of the lists of journals used in the Financial Times’ research metric.
Table 1 shows the geographic country of origin for the participating business schools with MBA programs in the Financial Times ranking for each year the FT journal lists were updated. The table also reflects the upper limit of the number of schools that had influence over the collection of journals used to assess the quality of faculty research output. In 1999 and 2001, the majority of schools participating were US based at 62% and 52% respectively. By 2004 (It is unclear as to whether the 40 journals were static until the 2010 revision that gave us the FT 45 list (two journals were added and two deleted in 2006 according to Connelly and Gallagher [26]), the concentration of U.S. schools had increased despite the entry of schools from Asia and South America. Increased Asian business school participation in 2016 showed encouraging progress, however, Western majority representation has persisted.
It is important to note that schools participating in the Financial Times ranking represent only a small percentage of accredited business schools (by AACSB, EFMD or EAMBA). For example, in 1999 approximately 9% and 13% of accredited MBA programs in the US and Europe, respectively, were ranked by the Financial Times. In 2017 participating schools represented less than 18% (216) of the estimated 1200+ accredited schools. Furthermore, AACSB estimated that there are 16,000+ business schools operating around the world [35]. In 2016, of the 216 participating schools, only 140 voted on the FT50 publication list, suggesting that the journals listed are influenced by the views of representatives from less than 1% of the business school global universe [39].
In a positive move, in recent times, the Financial Times has surveyed a wider set of stakeholders including non-participating business schools, organizations and other individuals interested in revising the FT journal list. Although this marks an improvement in the selection process, there remains an overall lack of opportunity for broad-based stakeholder input from those who are not invested in maintaining the status quo [40]. Having institutionalized this list, business schools should be reminded that the Financial Times is a profit-seeking media organization, that benefits financially from the ability to compare standings from one year to the next, necessitating little movement in assessment criteria. Deans and faculty would be well advised to consider academically endorsed journal lists such as the Academic Journal Guide produced by the UK’s Chartered Association of Business Schools [41] and the Australia Business Deans Council Journal Quality List [42].

2.3. Embedded Biases Creating “Echo Chambers” Impervious to Research Innovation

The composition of the FT50 journal list is arguably inextricable from the biases and preferences of those associated with its founding and maintenance, including those who have joined over time. All researchers are potentially subject to cognitive biases (errors in thinking) that reinforce existing beliefs and discount or ignore information that does not align. Unerman noted that these biases are amplified by academic communities that use “self-referral” peer review processes [21]. In these environments ‘echo chambers’ are created where “…beliefs are amplified or reinforced by repetitive communications inside a closed system that is insulated from rebuttal” [43].

2.3.1. Selectivity, Confirmation and Anchoring Biases

Formal and informal peer review processes housed within the FT50 journals are subject to both conscious selectivity, unconscious confirmation, and anchoring biases. Selectivity bias is a cognitive bias whereby researchers only pay attention to select the information that affirms assumptions, findings or understanding from their prior beliefs [21]. Selectivity bias in research has been confirmed in several studies within the business discipline, in particular accounting and finance [44,45,46,47]. Although conscious selection bias behaviour is problematic, the unconscious behaviour of rating research as higher quality when it reconfirms one’s prior beliefs, known as confirmation bias, is of greater concern. Many studies have found instances of confirmation bias where researchers unconsciously rate studies consistent with their prior belief as higher than studies that refute prior findings [48,49,50,51,52,53]. Other studies have found that confirmation biases stifle innovation in research [54,55]. Anchoring biases often accompany confirmation biases. This bias occurs given that our first understandings pertaining to a topic are more easily confirmed and most difficult to readjust [56].
The evidence suggests that FT50 journal research trajectories inform the research agenda for the business school academic community. If most of the research published by these journals is not aligned with advancing the UN’s SDG agenda, then it is doubtful that much progress would be made on sustainability agendas through business school research.
Based on the above-identified biases, we anticipated that the journal articles we reviewed would be less likely to have an explicit connection to the SDGs, and those that did, would be more likely to reflect elements connected with certain SDGs, reflective of more traditional business school concerns, such as economic growth (SDG 8), industry (SDG 9) and production and consumption (SDG 12). We also anticipated that some journals would be more naturally aligned with the SDGs than others (such as the JBE versus Finance). This informed the first four alternative hypotheses of this study:
Hypothesis 1 (H1).
There are a greater number of articles with no SDG relationships than articles with SDG relationships.
Hypothesis 2 (H2).
There are a greater number of implicit relationships with the SDGs than explicit references to the goals as SDGs have not been a traditional business topic of study.
Hypothesis 3 (H3).
There are more explicit and implicit references to SDG 8—Decent work and economic growth, SDG 9—Industry, innovation and infrastructure, SDG 12—Responsible consumption and production as these align with traditional business topics. Subsequently, there will be less references to SDG 1—No poverty, SDG 2—Zero hunger, SDG 13—Climate action, SDG 14—Life below water, SDG 15—Life on land, SDG 17—Partnerships for the goals.
Hypothesis 4 (H4).
There is more SDG relevance for Business Ethics, Management, Human Resources, and Organizational behaviour than the disciplines of Economics, Finance and Accounting.
Next, we investigated key factors peculiar to the FT 50 journal list that amplify these biases (selectivity, confirmation, and anchoring) further contributing to the ‘echo chamber’.

2.3.2. Focus on Western-Centric Studies

Most studies obtain their data from Western economies. Yang, Wang and Su [11], in their review of 1296 articles published in six leading international business journals from 1992 to 2003, found that 60.9% of studies used a one-country sample, with 88.9% of these from Western countries. Further, Boyacigiller and Adler [57] noted that the relevance of business models and theories developed in Western contexts are assumed to fit all contexts with location differences mostly being ignored when applying results. Similarly, Dheer [58] highlighted that most research on entrepreneurship focused on developed nations and ignored market conditions faced by developing nations, where entrepreneurship endeavours may be particularly beneficial. Herdin, Faust, and Chen [59] noted that the dominance of Eurocentrism has been responsible for thwarting non-European research approaches. This informed the next two alternative hypotheses.
Hypothesis 5a (H5a).
The FT50 journal articles are mainly focused on NA data.
Hypothesis 5b (H5b).
The FT50 journal articles mainly focused on NA data are less likely to focus on the SDGs than data used from other countries.

2.3.3. Author, Institutional, and Country Concentrations

Desai and Kumar [12] in their paper reviewed 6403 FT50 articles from the finance discipline over a 20-year period (1999–2018) to determine who was the most influential author, institution, and country. The journals included the Journal of Finance, Journal of Finance and Qualitative Analysis, Journal of Financial Economics, Review of Finance and Review of Financial Studies. There was a total of 14,998 authors, with 5620 being identified as unique. US authors contributed 71% of the total papers (4591 articles), with UK and Canada contributing 323 and 257 articles, respectively. They also noted that the US had the most single-country publications (where the authors were all from the US), indicating little collaboration with authors from other countries whereas, the UK, Canada and China had more multi-country authored papers. The US publications had the most citations (379,315) followed by Canada, the UK and then China. The top 3 most prolific authors contributed 130 papers combined, all three were male, two of the three were from US Universities (Ohio State, Columbus, UCLA, Los Angeles, CA, USA) and one was from France (Insead, Fontainebleau, France). One of the three was visually identified as BIPOC. On an institutional basis, most FT publications came from US-based universities (see Table 2) [12]. Harvard contributed the greatest number (300), followed by the University of Chicago (287) and the University of Pennsylvania (282). It is noteworthy that there was no institution on this list from Southern, Eastern or the Middle East countries. The University of Chicago and University of Pennsylvania were the top contributors over a 30-year period.Brooks, Fenton, Schopohl and Walker also found that leading finance research is concentrated in elite US institutions and had a disproportionately strong citation-based impact [60].
Table 2 reports that 95% of the top 20 schools in FT50 Financial journals from 1999 to 2018 were US based and represented +56% of all publications. Another paper using ML assessed the publication trends across business disciplines from 1990 to 2020; 64,000(+) articles were published in 24 top journals found in the University of Texas at Dallas’ list of 24 business journals (UTD24) [13]. The UTD24 list has 23 of its journals in common with the FT50 (see Appendix A, Table A1 astricts) spanning seven (7) disciplines (Accounting, Finance, Information Systems, Marketing Management, Operations Management and Organizational studies). They found that while the concentration of publications for the top US business schools declined from 1990 to 2020 it was at a slower pace than what occurred globally. Additionally, they found that 45% of the institutions from 6 out of the 7 disciplines had consistently been top contributors for the entire time frame studied.
These studies informed the following alternative hypotheses:
Hypothesis 6a (H6a).
FT50 Journal articles are mainly affiliated with NA institutions.
Hypothesis 6b (H6b).
FT50 Journal articles affiliated with NA institutions are less likely to focus on SDG topics than articles affiliated with non-NA institutions.

2.3.4. Primary Female Author Underrepresentation

In a survey conducted in 2020, women made up 37.9 percent of tenure-track faculty members at AACSB-member schools [22]. Shang et al. found in their research that women were more likely to engage in sustainability research [61]. Specifically, they analyzed 26,976 articles from 2011 to 2017 and found that male researchers more often valued and engaged in research aimed at scientific progress whereas female researchers more often valued and engaged in research aimed at contributing to societal progress. They also found while the former resulted in higher citations, the latter research articles had higher usage (e.g., downloads and views).
This same study found that females were more concerned with SDG-related studies in general and concentrated more on SDG 5—gender equality related research. Specifically, female first authors dominated studies associated with SDG 5. However, compared to male first authors, SDG 5 related publications by females had relatively lower citation impact but slightly higher views. Although SDG 5—gender equality is a standalone goal, its accomplishment is necessary to advance the remaining 16 goals. Gender inequalities “exists across education, employment opportunities, healthcare facilities, life expectancy, family life, and political participation, thereby holding back the capacity of half of the world’s population to contribute to solutions to the global challenges” [61] (p. 1).
The seventh set of alternative hypotheses were predicated on the assumption that authors listed first on an article were either the principal and primary investigator for the study or had contributed at least equally to others listed (having significant influence).
Hypothesis 7a (H7a).
Female first authorship will be under-represented within the FT50 2019 articles.
Hypothesis 7b (H7b).
Female first authorship will be more likely to publish articles with topics related to the SDGs than their male counterparts.

2.3.5. Primary BIPOC First Author Underrepresentation

BIPOC make up 41.5 percent of tenure-track faculty members at US AACSB-member schools [23]. Several researchers have identified racial bias through the peer- review publication process [62,63,64,65]. Avery et al. [63] notes research topics and research samples typically published in management journals have the tendency to be “predominantly White and Northern American researchers” (p. 3). This has become a “descriptive norm of research” within these journals, where studies using samples of “the most influential demographic groups” have become the standard (p. 3). Studies have also found that bias is more strongly associated with race and diversity as a research topic than with the racial background of the authors [65]. However, racial and diversity topics are more investigated by BIPOC authors. Notably, past studies have found that White North Americans are over-represented in senior positions within the publication process—as editor and editorial board representatives in top tier journals [66].
The eighth set of alternative hypotheses were predicated on the assumption that authors listed first on an article were either the principal and primary investigator for the study or had contributed at least equally to others listed (having significant influence).
Hypothesis 8a (H8a).
BIPOC first authorship will be under-represented within the FT50 2019 articles.
Hypothesis 8b (H8b).
BIPOC first authorship will be more likely to publish articles with topics related to the SDGs than those who are not.

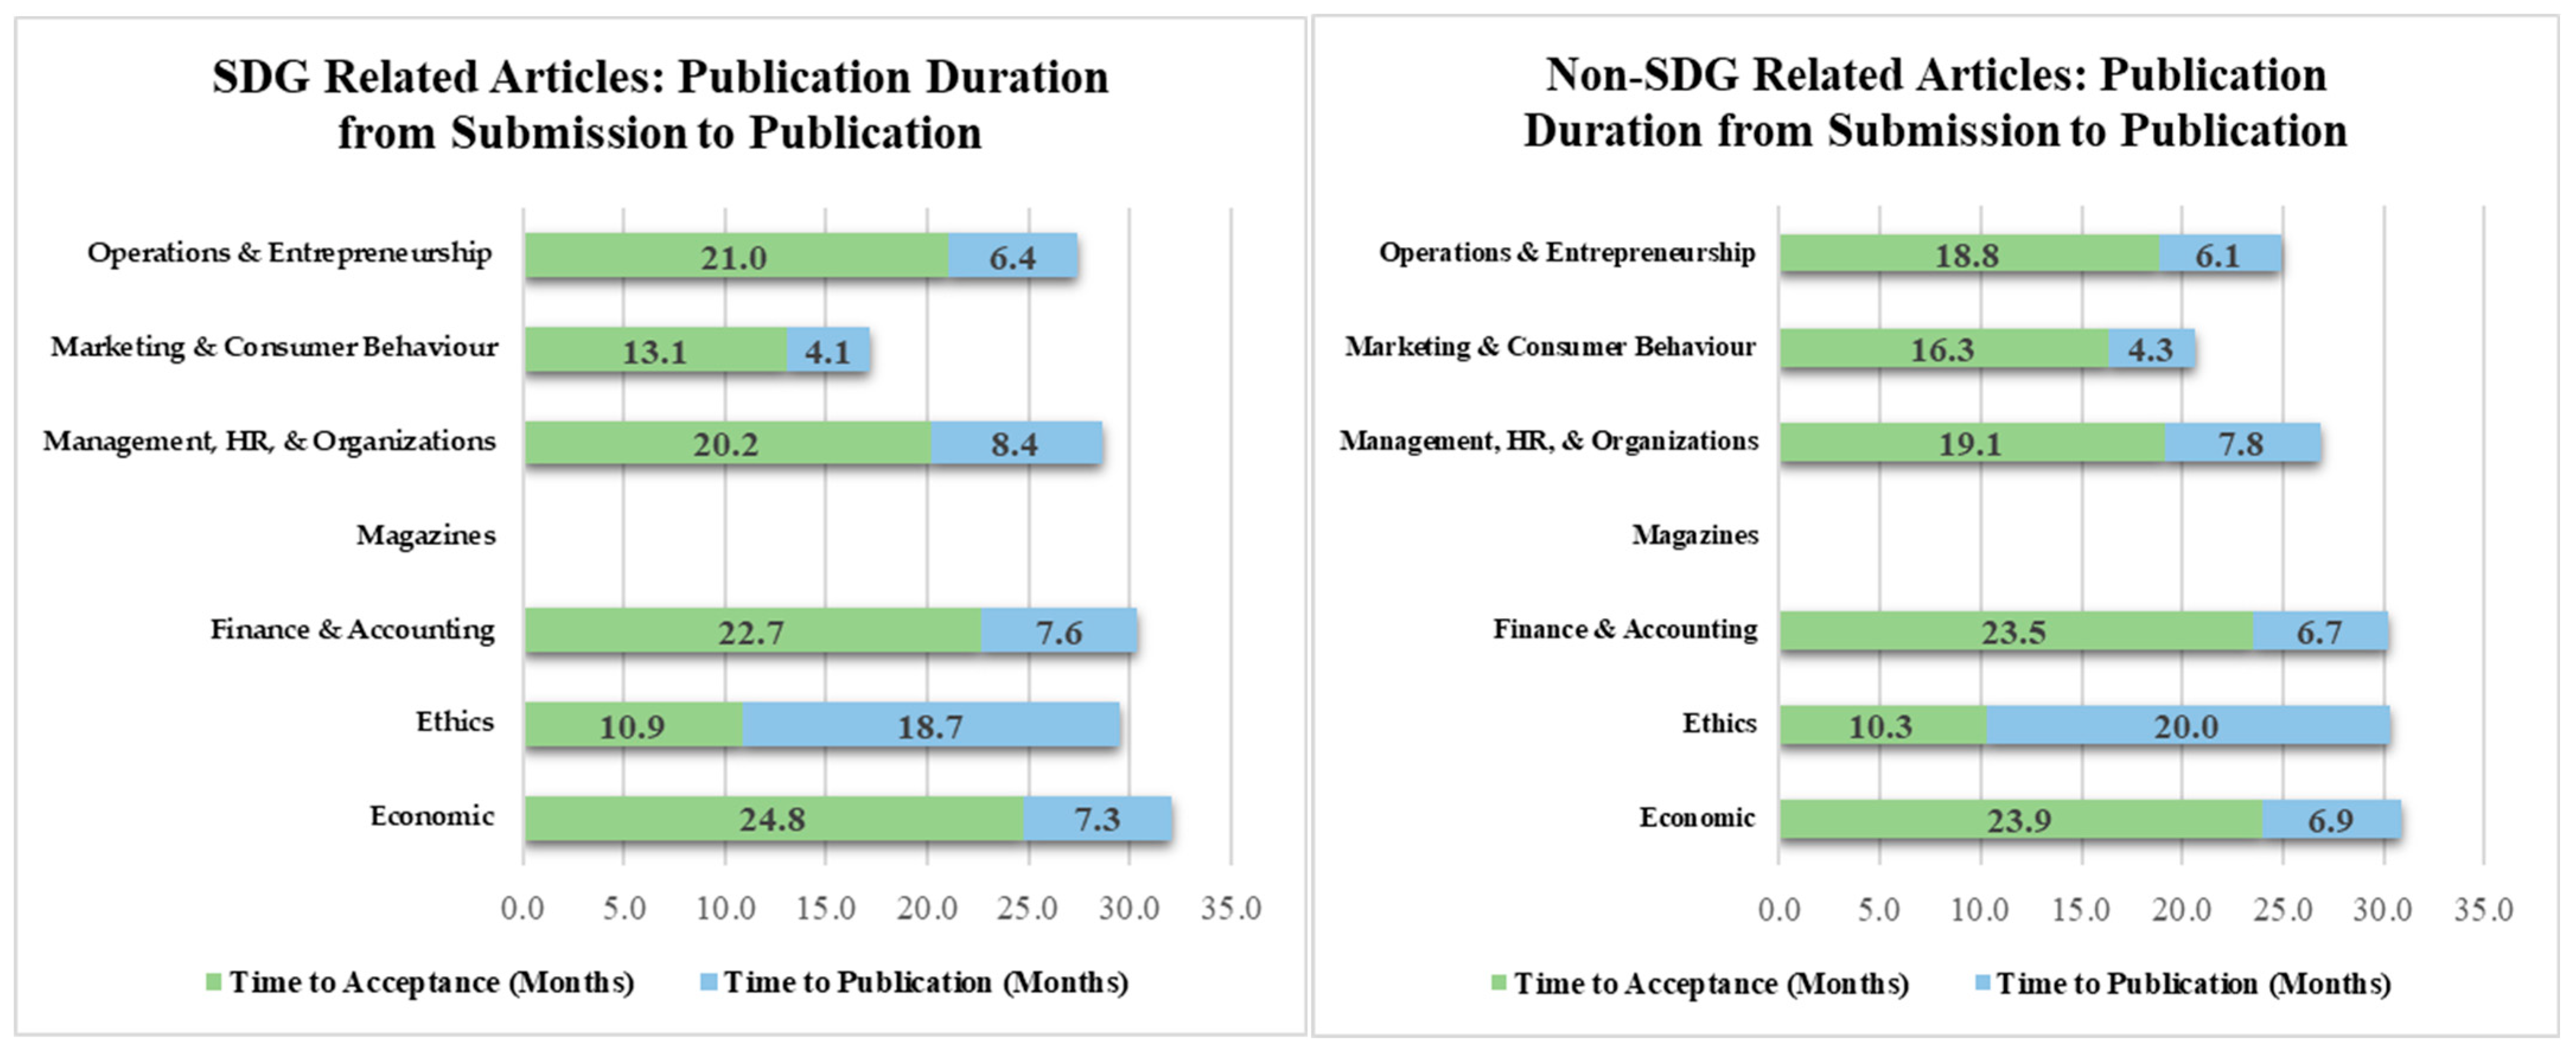
2.3.6. Time to Publication Reducing Relevancy of Research Topics Explored

The Harvard Business Review (HBR) noted two main problems that contribute to the irrelevance of academic research for business practitioners [67]. First, the exclusion of insights from research in practitioner-oriented journals and the lack of awareness of the “research-supported management insights reported in academic journals” [67]. Secondly, researchers in many cases do not consult the business stakeholders that they study. However, even if successfully addressed, a third issue impedes the relevance of academic research and its application for practitioners andthat is the length of time from submission to publication. Studies found that the median acceptance times of the top business journals range anywhere from 9.9 months to 19.8 months [68]. Factoring the research process leading up to the submission date, published topics may experience a 2 to 5 year or longer lag time [68]. This lag time may arguably be one explanation for the dearth of SDG-related publications in FT50 journals in 2019 as the 2030 agenda was adopted in September 2015, just four years prior to our study. To the extent that FT50 journals can speed up time to publication, their relevance to the SDGs will likely be strengthened.
Hypothesis 9 (H9).
FT50 journals with shorter publication timelines will have more articles relating to SDG topics.

2.3.7. Limitations to the SDG Framework as a Responsible Research Assessment Tool
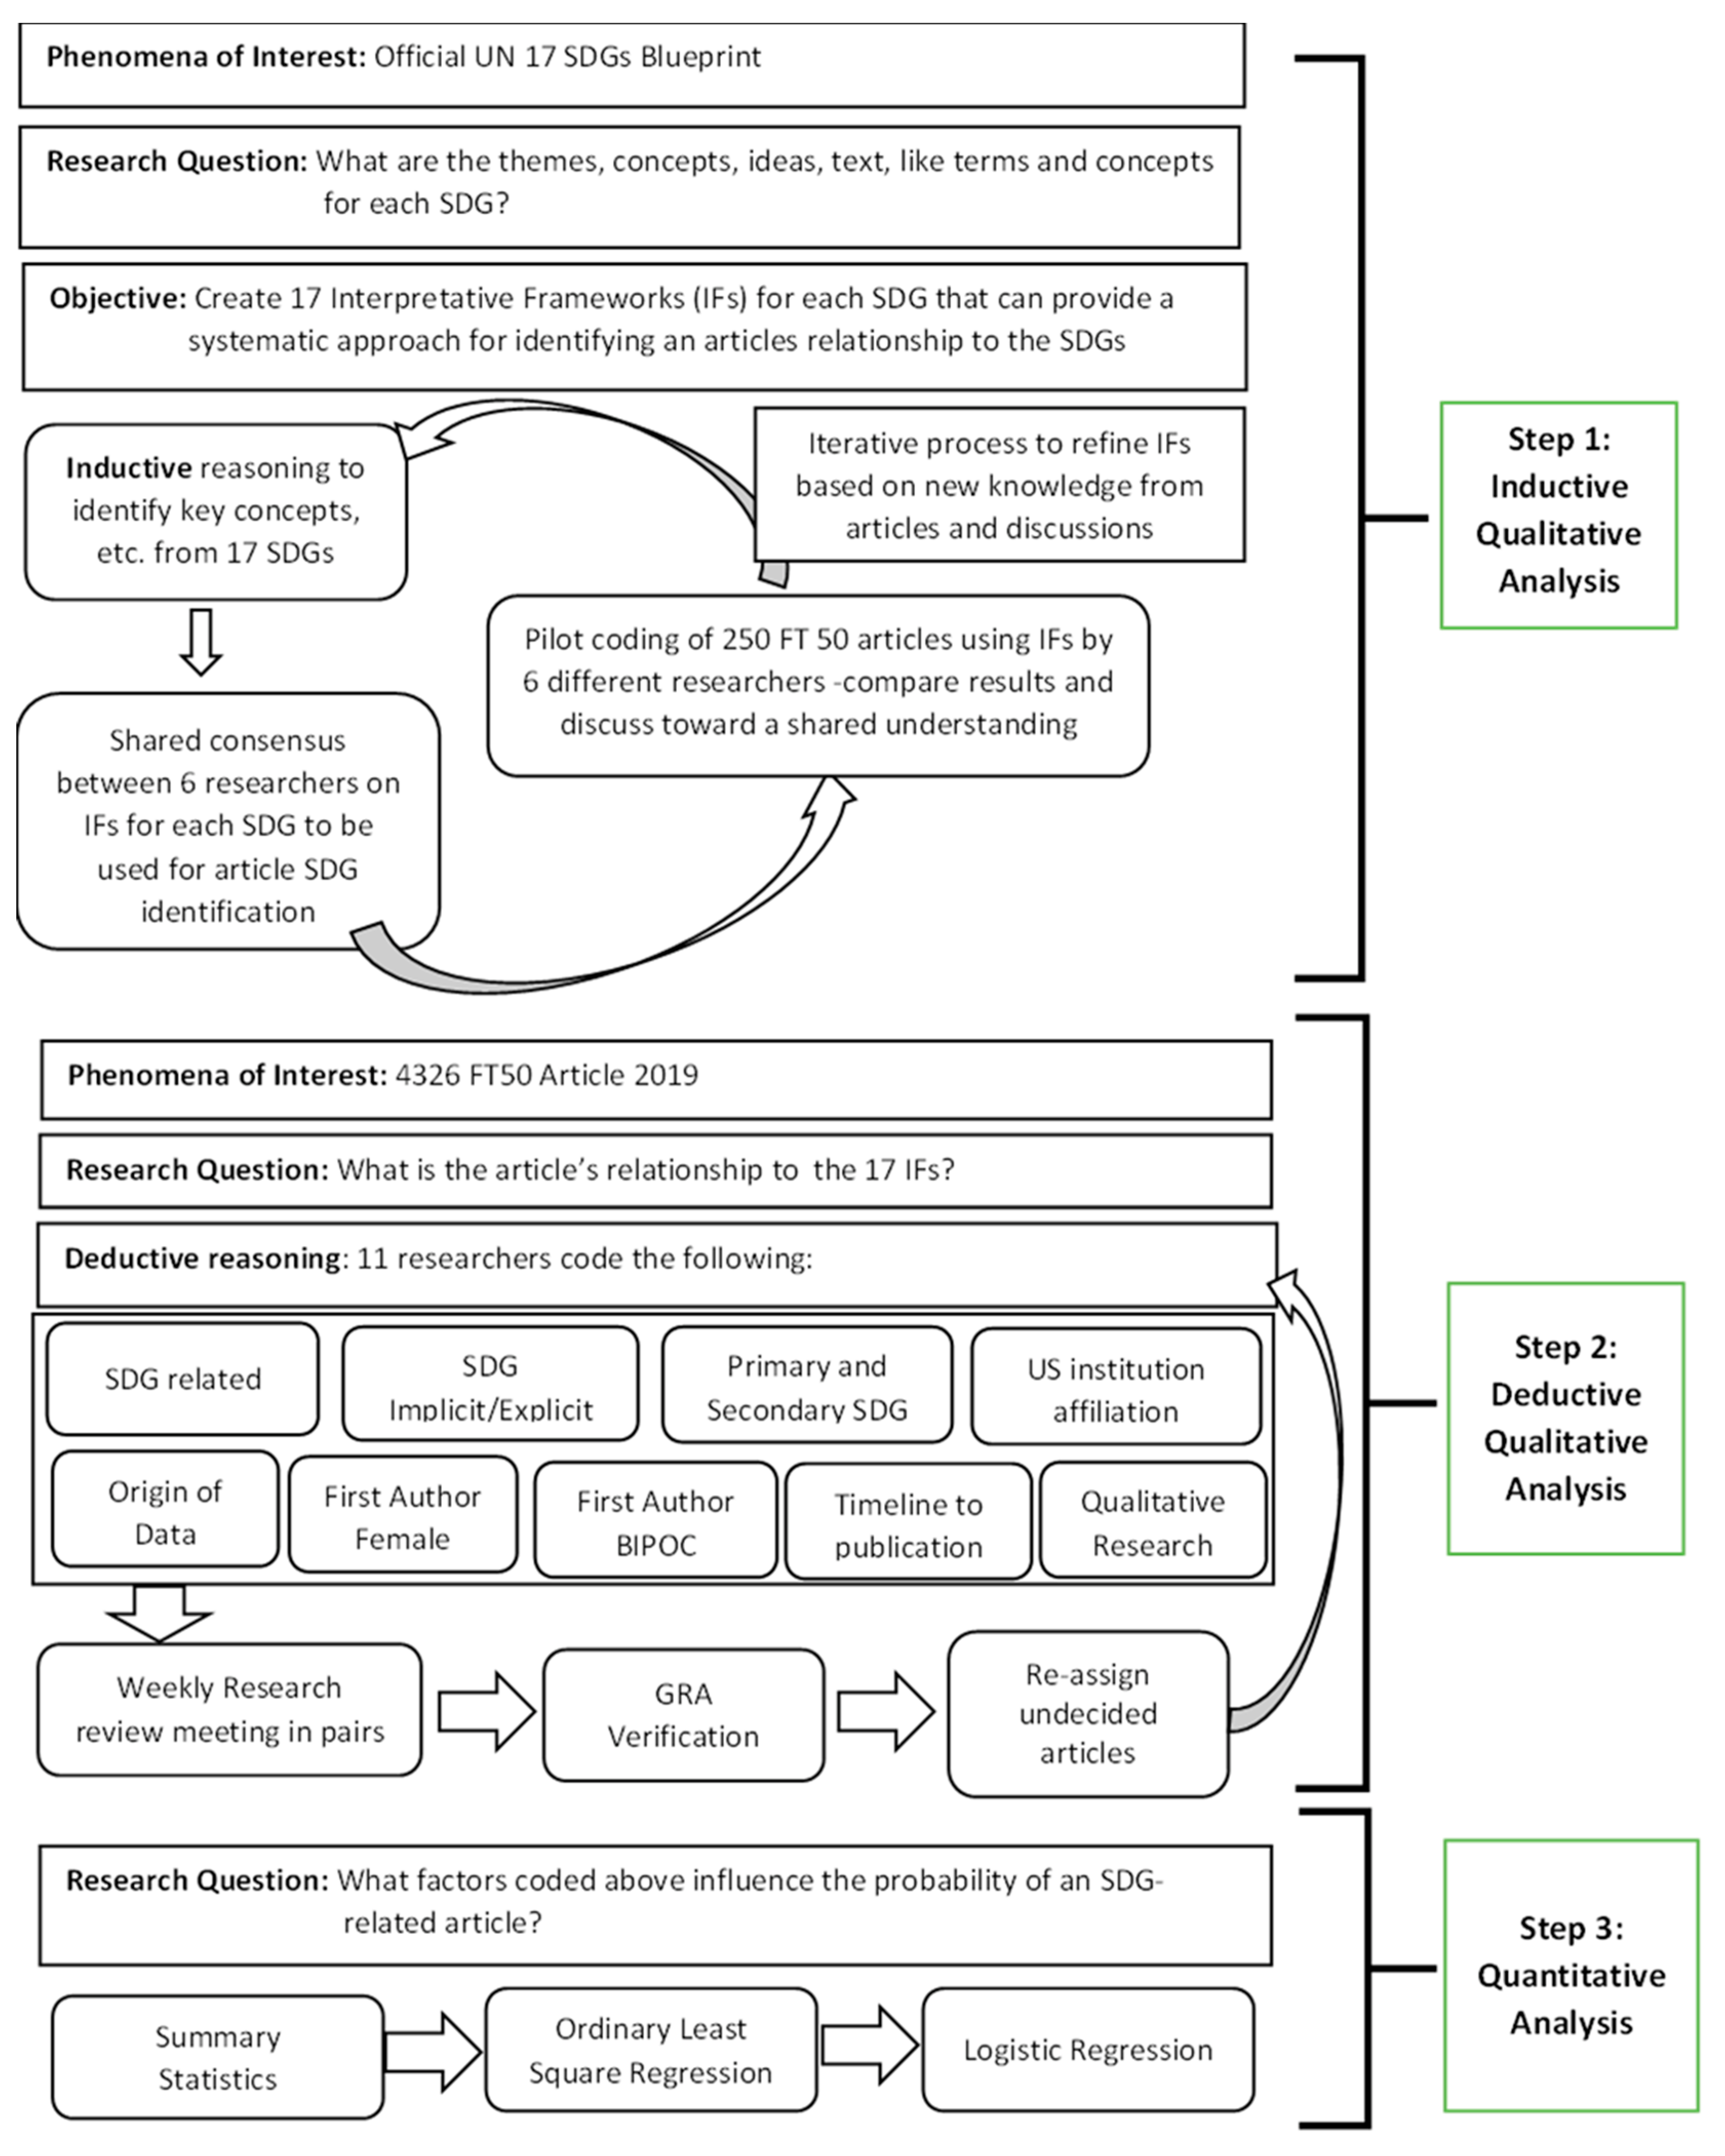
There are several overlapping themes and concepts across all 17 goals. Rodenburg et al., assessed the SDG framework as a responsible research assessment tool (RRA), and suggested a way to utilize this framework in a more holistic manner to capture tacit associations with the SDGs [16]. Using ML techniques, top themes that emerged across all 17 goals were identified and then used to match against that top theme that emerged from the FT50 2019 publications. This led to our final alternative hypothesis.
Hypothesis 10 (H10).
There is consensus by the researchers on whether an article has an SDG focus or not, but disagreement on the specific SDG number given that the SDG framework has several overlapping concepts between each designated SDG [16].

3. Methodologies

This study used a mixed methods research approach that included qualitative analyses as well as quantitative inference techniques. Figure A1, found in the Appendix A,provides a detailed figure that illustrates both the steps and research design for this study.
Steps 1 and 2, used qualitative methods, following the principles of hermeneutic phenomenology described by Van Manen [19]. Unlike ML and bibliometric techniques, the researcher in this case was the instrument for the data collection. The choice of ML and bibliometric techniques while appropriate, given the magnitude of text contained within the journal set and the limitations of human memory, was not the best method for establishing meaning from the text. A hermeneutic perspective was required, where the text needed to be viewed as an interpretation that could never be definitively judged as true or false. Furthermore, unlike ML, humans without prior knowledge of the topic were more capable of using their intelligence to assess new topics. ML, on the other hand, would require updating and retraining when faced with new topics with changed schematics. The choice of methods matched our estimation of the research problem. Specifically, the identification of SDG relationships within an article would necessitate a rigorous approach, extensive time, and the ability for conclusions to change and evolve continuously as new knowledge was obtained through shared conversations and as more data was collected [18]. In our study, the phenomena investigated were the 4522 FT50 2019 published journal articles where, the principal research question to be answered was ‘what is each articles relationship to the concepts, topics and ideas found within the SDG framework [69]?’ To answer this question, an interpretive paradigm was applied “where the central goal was to seek to interpret” each article by searching “for meaning, beliefs, and values, and through looking for wholes and relationships with other wholes” [70] (p. 49).
Specifically, in step 1, using an inductive qualitative analysis approach, the 17 SDG interpretative frameworks were created to establish a systematic approach across researchers for interpreting an article’s relationship to the SDGs. In step 2, using the interpretative frameworks and deductive qualitative analysis techniques all 2019 FT50 journal articles were read by the research team to identify explicit and implicit relationships to the SDGs. Additionally, researchers were asked to record (1) whether the study was empirical, qualitative, or otherwise, (2) the country of origin of the data source, (3) author diversity by institutional affiliation, (4) visual assessment of first authors’ gender and BIPOC status, and (5) length of time from submission to acceptance and from acceptance to publication. In step 3, quantitative methods were used to analyze the qualitative data gathered to determine what key variables described above improved the likelihood of an article’s relatedness to SDG topics.

3.1. Step 1: Creating the Interpretive Frameworks for SDG Identifcation

The interpretive frameworks (IFs) for SDG identification within the article data set were optimized by four undergraduate students who took part in an independent study for credit designed to teach qualitative research methods. The independent study was facilitated by one Graduate Research Assistant (GRA) and two faculty members (PIs). Each student was first tasked, employing an inductive qualitative approach, with creating a one-page detailed summary of the themes, concepts and key words that emerged and best described each of the 17 SDGs using detailed information including the goal, its targets and indicators found on the official UNSDG website [69]. The students completed sixteen IFs in total (4 per student) with the GRA finishing the 17th SDG IF. These IFs informed the decision criteria for determining whether a journal article contained a key concept or idea that related either explicitly (i.e., there was a very clear relationship between the SDG without ambiguity or vagueness) or implicitly (i.e., there was an understood relationship, but it was not described clearly and required interpretation to make the SDG connection).
Next, the team of four students in addition to the GRA and one PI tested the reliability and validity of the established IFs. Each researcher was given the same 25 FT50 2019 published articles to read and identify whether the article contributed to the advancement of or was related to any one or more of the SDGs using the 17 IF summaries. During this process, the team was additionally tasked with adding keywords, concepts and similar terms found within the journal articles that may have been missed during the initial IF summarization stage. For example, the term BIPOC did not exist anywhere within the official SDG framework but was added to the SDG 5 IF during the analysis. As such, the SDG IFs were augmented through each subsequent reading and SDG identification assignment to cast a wider net when conducting the following week’s analysis. After reading each of the 25 articles, each researcher independently completed an excel spreadsheet where they were asked to identify whether the article was SDG-related or not, and if yes, which SDG the article best aligned with. Researchers coded the most applicable SDG as ‘primary’ and if a second SDG was relevant, it would be coded as ‘secondary’. Furthermore, they were required to indicate whether they found the article’s SDG relationship to be explicit or implicit. Once the spreadsheet was completed each researcher sent their results to the GRA who summarized the findings of all 6 researchers (4 undergraduate students, the PI and GRA) for the 25 same articles. The summarized results were anonymous, with only the researcher knowing which responses were theirs.
Subsequently, the team met to discuss discrepancies that included disagreements on whether there was an SDG connection, the SDG number assigned, or its explicit or implicit relationship. Researchers were given an opportunity to explain their point of view (POV) and change their POV based on others’ explanations in an attempt to corroborate/legitimize alternative explanations toward a consensual research community validation of the 17SDG IFs. The students were provided with readings to help emphasize the importance of independent and collaborative thought based on self-interpreted evidence when conducting research [71]. Additionally, both the PI and GRA kept their comments to the end after listening to the various points of view to avoid undue influence on the team given their positions of power [72]. For most articles, there was a consensus after the discussion. However, there were articles where there was no consensus reached between the students, the GRA and the PIs, highlighting the biases that can exist when using human interpretative skills, as well as the overlapping nature of some of the SDGs. These undecided articles were identified and set aside for future analysis and decision or were indicated as undecided within the data set. The process of reading the same 25 articles, recording findings independently and then discussing results continued for 10 weeks. As the weeks progressed, the number of articles where there were discrepancies between researchers diminished. For example, in Week 1, 46% of the articles had discrepancies whereas in week 10 there were only 28% with discrepancies. At the end of the semester-long independent study, 250 of the 4576 (5.4%) FT50 articles had been qualitatively analyzed 6 times each by 6 different researchers (1500 article reads in total) to determine their SDG-relatedness. Over the course of the 10-week cycle, the 17 IF summarized word documents had been augmented iteratively to improve the robustness of the IFs as a research assessment tool for the remaining 4326 FT50 articles.

3.2. Step 2: Qualitatively Analyzing the Remaining 4326 FT50 Articles

In step 2, to complete the hypotheses tests for 1–10, a research team consisting of 11 students was employed to conduct the remaining analysis. The number of hours worked per week ranged from 10–35 depending on the researcher’s contract. An anonymous Qualtrics survey was conducted to determine the demographics, expertise, and socio-political leanings of the research team to identify potential biases that may exist within this study. The research team performing the analyses consisted of nine upper-year undergraduate business school students guided by one master’s student and one PhD candidate. The team represented four different fields within business (Marketing, Economics and Finance, Real Estate and Housing, and Leadership and Organizational Management). One-third of the team identified as BIPOC and over 60% of the team were female. Questions from a PEW survey were included to measure the individual researcher’s and the total team’s political leanings based on responses to a set of 8 questions. From the responses given, 82% percent indicated liberal leaning and 18% percent were conservative-leaning. On average the team leaned left. Research has shown that liberal leaning governments have a greater penchant for social welfare and environmental issues [73].
This new set of researchers was first individually required to review the 17 SDG IF summary documents previously created and were informed that in the following week there would be a test and that success on this test would require a complete understanding of all 17 IFs. The test consisted of 20 questions, each containing a paragraph taken from the previously 250 assessed articles, where the assigned SDG was unanimous among the previous set of researchers. New research team members were asked to identify if the paragraph indicated SDG-related content or not, and if so, what SDG number they would assign. They were allowed to refer to the 17 IF summary sheets in making their judgements. After the test was completed, an open discussion commenced to provide clarity and ensure that researchers fully understood the content and their role and responsibility for the assignment. Each week, pairs of researchers were given the same set of FT50 articles to analyze. The number of articles given was dependent on the researcher’s contracted weekly hours. The partner reading the same articles was unknown, so pairs could not collaborate on analysis during the review period. Each week, the paired partner changed. Each researcher was tasked independently with reading the assigned set of articles and required to record their answers on an excel spreadsheet to the following questions:
  • Is this SDG-related research (Yes/No)?
  • If yes, is the relationship explicit or implicit?
  • If yes, what is the primary and (if applicable) the secondary SDG number that it relates to?
  • Is the article affiliated with a US institution (Y/N)?
  • Is this Qualitative research (Y/N)?
  • What is the origin (region) of the Data used in the study? (i.e., NA, Europe, etc.)
Once completed, the researcher sent the completed spreadsheet to the two GRAs facilitating the research process in advance of a weekly mandatory zoom meeting. During the zoom meeting, the researchers were put into pairs in breakout rooms with one other researcher who conducted the same analysis on the same set of articles. During this breakout meeting, teams were required to review their responses, compare results, and discuss differences. Throughout the meeting, the GRAs circulated between the break-out rooms to answer questions or provide clarity. Teams worked toward a common understanding through discussion between pairs and the GRAs. At the end of the meeting, each team of two would return to the main room to share their results with the GRAs and identify articles where they had difficulty determining their designation for any of the above 5 questions or where they could not reach a consensus. If no consensus was reached, articles were re-assigned to a new pair in the following week. This process continued until all articles had been analyzed at least twice by two different researchers with more challenging articles receiving additional attention. Researchers who committed to more hours per week in tandem with the GRAs recorded the following information for each article:
  • Was the first author female as ‘observed’ from photo (Y/N)?
  • Was the first author BIPOC as ‘observed’ from photo (Y/N)?
  • What was the timeline of paper submission- from submission to publication?

3.3. Step 3: Statistical Analysis of the Qualitative Data

Summary statistics, ordinary least squares (OLS) and Logistic regressions were used to determine the statistical significance of the key variables studied and to determine what influence they had on the probability of an article’s alignment to the SDGs. In addition to summary statistics and inference statistics by individual journals, journals were further categorized by discipline (see Supplementary Material, Table S2) to test for differences between disciplines. The dependent variable for the OLS was continuous across all n = 4522 articles of study and represented the percentage of articles identified as aligned explicitly and implicitly with the SDGs. Key variables identified from this study were explored to determine their influence on an article’s likelihood of SDG alignment to determine their reliability as predictors of the outcome variable. To verify OLS results and further understand the causes of the observed SDG aligned articles, a Logistic regression (fixed effects) was run with SDG alignment as the dependant variable to determine the odds ratio (Odds Ratio = (Proportion of success: positive dependent variable (1)/Proportion of failures: nonpositive dependent variable (0))), log odds (The logarithm of the odds ratio), and the marginal effects (Change in the probability of observing the dependent variable, if the independent variable changes by one unit) of the explanatory variables on these three outcomes. The dependent variable in this case was a dichotomous outcome variable, where 1 represented an article being aligned with the SDGs and 0 represented an article that is not aligned with the SDGs. For both the OLS and Logit regression there were 2 types of explanatory variables used to explain the data: independent dichotomous variables and independent categorical variables. The independent dichotomous variables consisted of: Implicit SDG Alignment, Qualitative Content, Institution Affiliation, Female Primary Authorship, and BIPOC Primary Authorship. The independent categorical variables consisted of: Time to Publication, Journal Discipline, and Data Origin.

4. Results

4.1. Summary Statistics

In total, 4522 FT50 articles from 2019 were qualitatively analyzed by a team of human researchers to first determine each article’s relatedness to the SDGs and second, identify key factors found in previous research that could contribute to biases in these specified publications. Table S1, found in the Supplementary Material reports the summary statistics for each of the FT50 journals including: 1. the number of articles analyzed, 2. the total percent of articles that were SDG aligned, further broken down by the percent of these which were implicitly versus explicitly aligned, 3. the percentage of articles that used data from outside of North America, 4. the percentage of articles which used qualitative research methods 5. the percentage of articles with a non-US institutional affiliation 6. the percentage of articles that had primary female and BIPOC authors as observed from a photo and 7. the average time in months from submission to acceptance and from acceptance to publication.
Table 3 reports the results of the pairwise t-tests required to test H2–H4 and Hypotheses a. for 5 and 6.
Overall, 27% (10% explicit and 17% implicit) of all FT50 2019 articles analyzed were identified as related to the SDGs. The null hypothesis for H1 was rejected, there were a greater number of articles with no SDG-relationships than articles with SDG-relationships. Of the total articles reviewed, approximately 37% used data from outside of North America, 33% used qualitative methodologies, 31% were affiliated with an academic institution outside of North America, 28% and 35% were visually identified from a photo as having a female and BIPOC first author, respectively. The average number of months from submission of an article to its acceptance was 20 and from submission to publication was 27 (2+ years). A pairwise T-test (see Table 3) that compared implicit and explicit SDG-related articles rejected the null hypothesis for H2 (p = 0.0082). There were a greater number of implicit relationships to the SDGs (62.9%) than explicit (37.1%). Table 4 and Figure 2 report the primary and secondary SDG goal associated with each identified SDG-related article as a percentage of the total articles identified (n = 1219).
SDG 8, 9 and 12 were identified as the primary or secondary SDG for 41.3% of the SDG-related articles (mean score of 26.7%, 8.3% and 6.3%, respectively). Whereas SDG 1, 2, 13, 14, 15 and 17 were identified as the primary or secondary for 9.5% of the SDG-related articles (mean score 0.9%, 1.0%, 3.4%, 0.1% and 4% respectively). Pairwise T-tests (see Table 3) rejected the null for hypothesis 3 (p = 0.000). There were more explicit and implicit references to SDG 8—Decent work and economic growth, SDG 9—Industry, innovation and infrastructure, SDG 12—Responsible consumption and production. Additionally, there were less references to SDG 1—No poverty, SDG 2—Zero hunger, SDG 13—Climate action, SDG 14—Life below water, SDG 15—Life on land, SDG 17—Partnerships for the goals. However, SDG 16—Peace, justice and strong institutions and SDG 3—Good health and well-being were more prominent than expected with a mean score of 15.4% and 12.2%, respectively. Table S2, found in the Supplementary Material, reports the summary statistics for the 4522 articles categorized by seven (7) business-related discipline to observe differences between disciplines. Figure 3 illustrates the percentage of total explicit and implicit related SDG articles by journal discipline.
A pairwise T-test (see Table 3) rejected the null hypothesis for H4 (p = 0.0689). Almost half (48.1%) of articles from the Ethics discipline and 33.1% from Management, Human Resources, and Organizations were identified as related to the SDGs. Finance and Accounting had 15.4%, and Marketing and Consumer behaviour had 16.5% of their articles identified as being aligned. Business ethics had the most ‘explicit’ relationships (42.6%). Notably, the Economics discipline was higher than expected at 26.1%. Several economic concepts (i.e., pollution abatement, consumer and societal wellbeing, social welfare and distribution of income) were interpreted by the team were as having an implicit relationship to the SDGs (e.g., 72% of all Economics journal articles identified as aligned with the SDGs were found to have an implicit relationship). Operations and Entrepreneurship had 22.3% of their articles identified as related, however like Economics, the majority (65.7%) required interpretation of concepts by the research team to make the connection.
Pair-wise t-tests rejected the null hypothesis for 5a (p = 7.692 × 10⁻⁵) and 6a (p = 1.397 × 10⁻⁸). Fewer journal articles used non-NA data (36.5%) or were affiliated with non-NA institutions (31%) than those who used NA data and were affiliated with NA institutions. The null hypotheses for 7a and 8a were rejected. Female or BIPOC primary authors were underrepresented (28.2% and 34.7%, respectively) relative to the number of tenured faculty from these two groups within the business discipline according to AACSB (37.9% and 41.5%, respectively).

4.2. Inference Statistics

To test Hypotheses 5b, 6b, 7b, 8b and 9, an OLS regression was conducted to determine the statistical significance of key factors that may impact the probability of an article being SDG-related. A subsequent logistic regression was conducted to determine the best fit model given the data and to verify the results from the OLS regression.
The dependent variable for the OLS was continuous and represented the percentage of articles identified explicitly and implicitly as SDG-related (SDG-related = 0.2696). The dependent variable for the Logistic regression was a dichotomous outcome variable, where 1 represented an article being related with the SDGs and 0 represented an article that was not related. Both regressions explored explanatory variables peculiar to the FT50 set of articles from 2019 that could be predictors of an article’s relationship to the SDGs. There was a set of independent dichotomous explanatory variables that included: 1. Implicit SDG Alignment (0 no, 1 yes), Qualitative Content (0 no, 1 yes), Empirical Content (0 no, 1 yes), NA institution affiliation (0 no, 1 yes), Female Primary Authorship (0 no, 1 yes), and BIPOC Primary Authorship (0 no, 1 yes) and a set of categorical explanatory variables that included: Time to Publication, Journal Discipline, and Data Origin. Both regressions dropped two categorical explanatory variables, Ethics Discipline and Data Origin: Global/Other, due to multicollinearity. Therefore, the regressions’ results measured the disciplines relative to Ethics, and data origin relative to Global/other.
The results of the OLS showed an overall significant effect of all independent variables, F (18, 4500) = 19.29, R2 = 0.0679, and p < 2.2 × 10⁻¹⁶ and Akaike information criterion (AIC) score of 5186.8 (see Table 5). Although a low R2 value can signal a poorly fitting model it may also indicate noisy, high-variability data that still has a significant trend. To further verify model fit the spread between the multiple and adjusted R -squared value and the residuals were observed. Table 5 showed a minimal spread between the multiple and adjusted R-squared value indicating that the model did not overfit the data. Table 6 verified the model fit with minuscule residual values centered just below median 0.
To further verify the causes of the observed SDG aligned articles, a logistic regression (fixed effects) was run with SDG alignment as the dependent variable to determine the odds ratio (Odds Ratio = (Proportion of success: positive dependent variable (1)/Proportion of failures: nonpositive dependent variable (0))), log odds (The logarithm of the odds ratio), and the marginal effects (Change in the probability of observing the dependent variable, if the independent variable changes by one unit) of the independent variables on these three outcomes. The results of the logistic regression (Table 7) outlined an overall significant effect of all the independent variables, McFadden Pseudo R2 = 0.061, and p = 0. Specifically, 6.1% of the variance was explained by the model. Table 8 reported notable deviance residuals obtained from the logistic regression. The deviance residual values are relatively centered around median 0, indicating that the logistic model was a good fit for the data. The intercept (β = −0.2573, S.E. = 0.2123, p = 0.2255) in Table 9 was not significant, yet indicated that the probability that an article would be SDG-related was 43.6% if all explanatory variables were coded as zero ( e β   1 + e β ) . This provided evidence that the explanatory variables had an impact on the probability of an article’s relatedness to the SDGs. Next, a p-value for the pseudo R2 from the Chi-squared distribution of 0 was derived, indicating statistical significance at the 0.1% level. The Logit’s results supported the findings from the OLS model.
Finally, the lower AIC score for the Logit model of 4985.8 (see Table 7) smaller than the AIC score of 5186.81 for the OLS model indicated that the logistic model was a stronger fit for the data. As such, in this section we report in Table 9 the results from the Logit regression (see Supplementary Material Table S3 for OLS table).
Logistic model output determined that articles: 1. using qualitative research content (β = 0.2064, S.E. = 0.0789, p = 0.0089), 2. containing female primary authorship (β = 0.3623, S.E. = 0.0764, p = 2.09 × 10⁻⁶), and 3. time to publication: 13–18 months (β = 0.2627, S.E. = 0.1589, p = 0.0984) are significant and positive at the 1%, 0.1%, and 10% levels, respectively. Additionally, results displayed that articles: 4. containing authors affiliated with North American institutions (β = −0.1557, S.E. = 0.0807, p = 0.0537), 5. falling within the Economic (β = −0.7197, S.E. = 0.1837, p = 8.90 × 10⁻⁵), Finance and Accounting (β = −1.3733, S.E. = 0.1878, p = 2.60 × 10⁻¹³), Professional Magazine (β = −1.6759, S.E. = 0.2803, p = 2.25 × 10⁻⁹), Management, Human Resources, and Organizations (β = −0.5857, S.E. = 0.1497, p = 9.12 × 10⁻⁵), Marketing and Consumer Behaviour (β = −1.4524, S.E. = 0.1957, p = 1.16 × 10⁻¹³), and Operations and Entrepreneurship (β = −0.9637 S.E. = 0.1716, p = 1.94 × 10⁻⁸) journal disciplines, and 6. using North American data sets (β = −0.2036, S.E. = 0.1027, p = 0.0474), were significant and negative at the 5.5%, 0.1%, 0.1%, 0.1%, 0.1%, 0.1%, 0.1%, and 5% levels, respectively.
Figure 4 shows the summary statistics comparing each significant explanatory variable percentage of articles identified that were SDG-related versus non-related.
The null hypotheses for 5b, 6b and 7b were rejected. Studies with data origin outside NA, that were affiliated with a non-NA institution or had female primary authorship had a greater number of SDG-related topics. For BIPOC primary authorship (H8b), the null hypothesis could not be rejected (β = 0.0324, S.E. = 0.0779, p = 0.416). There was no significant difference between SDG and non-SDG-related topics when there was a primary BIPOC author. The null hypothesis for 9 could not be rejected. There was no major difference between submission to acceptance and acceptance to publication time between SDG and non-SDG-related articles. However, the logistic regression did identify that an SDG-related article would more likely experience a wait time of 13–18 months from submission to publication, statistically significant at the 10% level. Figure 5 plots the average time duration for an article in each respective discipline (excluding magazines as data was unavailable) from submission to acceptance compared to acceptance to publication.
Articles within the Marketing and Consumer Behaviour discipline had a significantly shorter path from submission to publication compared to the other disciplines. Each of the disciplines, excluding Ethics, had a greater time duration from submission to acceptance than acceptance to publication. Interestingly, the Ethics discipline (made up of articles from JBE only) observed a shorter wait time to acceptance with a much longer wait time to publication (suggesting a backlog of accepted articles and consequently, that more journals of this theme may be warranted).
Finally, there was qualitative support for hypothesis 9. There was consensus by the researchers on whether an article had an SDG focus or not, but disagreement on the specific SDG number. While in the final iteration of the research project, 80% agreed that an article was SDG-related, 33% of these had a different SDG identified as primary. Several researchers have noted the interconnectivity of ideas and concepts contained within the SDG framework [16]. This finding further supported the ML findings that the SDG framework has several overlapping concepts between each designated SDG.

5. Discussion

Business schools have been identified as important contributors for the achievement of the UN’s 17 SDGs and 2030 agenda. Fortunately, there are compelling reasons for business schools to engage (beyond it being the ‘right and moral’ thing to do): 1. research funding sources (government, private industry, foundations, professional organizations) increasingly require an estimation of positive impact and effects from research output on society [1,3] within the application process and, 2. business school and program accreditation bodies (AACSB, EFMD, MMBA, CEEMAN) increasingly require evidence of commitments to sustainability, ethics, and responsible leadership within the curriculum and research agendas (see, for example, PRME’s Blueprint for SDG Integration into Curriculum, Research and Partnerships [74]). Although many business schools have made strides by including in their mission statements strategic goals associated with developing graduates who will become leaders with the skills and values aligned with the creation of a sustainable future, evidence of a major transformation or impact from these efforts has been lacking.
Although business schools have tremendous power to influence society (through the knowledge transferred and actions taken by their graduates) they are also motivated to build reputations based on prestige, in order to attract top students and maximize enrollments to improve their financial position. Given that prospective students and faculty turn to published business school rankings when deciding where to apply, it should not be surprising that business schools, “appear to be greatly influenced by business school rankings” [3] (p. 23), aligning their priorities and actions to gain top ranks for this purpose [3]. Unfortunately, the “metrics of business school rankings seem to be misaligned with the needs of society, including the development of ‘a sustainable, inclusive 21st century economy’” [3] (p. 23). “[R]anking systems (with notable exceptions–such as Corporate Knights and the PIR) have had perverse (unintended) consequences on the focus of faculty research, curricular and pedagogical innovation, and the student experience (particularly for undergraduate students)” [2] (p. 1).
Despite mounting criticism such as this regarding published rankings, business school—and other university rankings—continue to garner public interest. It is important to note that media agencies have a self-interest in promoting their own rankings, given the financial gains earned from sales of special rankings editions. Business school rankings, i.e., Financial Times, Times Higher Ed (THE), QS World University (QS) and U.S News have had a major influence over the business school selection process, particularly for graduate programs. “Research has shown that improvements in the ranking of a business school leads to a surge in the number of applicants in the coming years [5] and that these rankings are more influential than other types of media in helping potential MBA applicants determine their preferred school” [75].
Of special concern to this study was the criterion created by the Financial Times for its ranking of MBA programs, in particular, publication in FT50 journals. We have argued that this metric, despite being worth only 10% of the score, has become institutionalized as a general measure of quality, and used as evidence of research productivity for hiring and promotion and tenure (P&T) [8,9] decisions. Arguably, the composition of the FT50 journal list is inextricable from the biases and preferences of those involved in its creation, as well as each of the associated journal’s editors. Our results suggest that the accumulated value of this proxy measure for quality may have unintentionally blocked progress toward achieving the SDGs.
Overall, 90% (4070) of the 2019 FT50 articles were identified as having no explicit relationship and 73% (3301 articles) were identified as having neither an explicit nor implicit relationship with the SDGs by the process employed by the research team. Notably, but not surprisingly, most of the SDG-related articles were found in just one journal. The Journal of Business Ethics was found to have 586 SDG-related articles–fully 48% of the articles identified as being SDG-related. This was followed by journals within the Management, Human Resources, and Organizations discipline, with a combined total of 403 articles. These results negate the potential argument that FT50 journals had yet to publish SDG-related work as it was still a novel concept. Clearly, where these topics were perceived as relevant, work was being published. The JBE was also the only journal where the time from acceptance to publication was three times longer than the time from submission to acceptance, indicating that faculty may be far more interested in publishing on SDG-related topics than current FT50 journals allow.
Across all journals, there were more explicit and implicit references to SDG 8—Decent work and economic growth, SDG 9—Industry, innovation and infrastructure, SDG 12—Responsible consumption and production. Arguably these aligned most closely with traditional business topics. There were fewer references to SDG 1—No poverty, SDG 2—Zero hunger, SDG 13—Climate action, SDG 14—Life below water, SDG 15—Life on land, SDG 17—Partnerships for the goals. In a previous study, Rodenburg et. al, also noted that there was no direct reference to the SDGs or the 2030 agenda in any of the FT50 2019 published articles.
Several studies have mapped academic projects and publications related to the SDGs. Varied and diverse results have pointed to an overall underrepresentation of research and projects at the business program level targeted at advancing or related to the SDGs. See for example, Bergen University [15], Elsevier [76], Aurora Network [77], SIRIS Academic [78], Rotterdam School of Management AI Dashboard (RSM Emasmus University) [79], Rodenburg, De Silva and Christensen Hughes [16] and Cabell’s and SDG Dashboard (SJU) [80,81,82,83]. Specifically, the SDG Impact Intensity™ journal rating system created by Cabell’s in conjunction with St. Joseph’s University’s Haub School of Business [82] provided compelling evidence of this underrepresentation when comparing the FT50 journal set with 50 creditable journals from Cabell’s Journalytics database focused on sustainability, ethics, public policy, and environmental management (n = 100). Only two FT50 journals made the top 50 list (JBE and Journal of Human Relations), while the remaining 48 fell within the bottom 50. Only four of the top 10 biggest academic publishers appeared within the top 26 [82]. Simon Linacre, formally from Cabell’s noted “while government, funders and society have started to embrace the SDGs, this has yet to filter through to what has been published in journals traditionally regarded as high impact [83].”
Results from this study also showed an over-representation of published articles that had an observed white male as the primary author, used NA data sets and were from NA-based institutions. This is concerning given the positive statistically significant OLS and Logistic regressions results that indicated that the probability of an SDG-related article increased with an observed female primary author or was from a non-NA institution or used non-NA data sets. The length of time from submission to publication (2+ years) was also concerning as the relevance of the published work may have diminished over time. Studies employing qualitative research methods were also more likely to be SDG-related.
Other Studies [11,12,13,84,85,86], have found similar results, showing that FT50 journals were regionally focused and restricted to developed nations with strong economies, were overrepresented by select few institutions, were English language only, had male-dominated first authors and editorial boards, and had a large percentage of citations coming from the same academic journals (self-referencing) [14,87].
Research has also argued that publication concentration by a few elite schools prioritized ideologies that stifled diverse and innovative thinking [84,85]. Research agendas that prioritize publication in a narrow list of academic journals disincentivizes scholars from undertaking practitioner-focused research which limits management faculty from engaging with real-world, high-impact topics [24]. Tourish noted that overemphasis on publishing in so called ‘top-tier journals’ has led some management scholars to suggest that there is a “strong fetish of theorizing for its own sake” [88] (p. 99).
The perverse effects of business schools and their faculty chasing FT50 publications are far reaching, impacting not only institutional and faculty priorities, but students as future business leaders and consequently the ability of businesses to also contribute toward the advancement of the 2030 agenda. Arguably, institutional priorities focused on accumulating FT50 publications either for ranking purposes or as a proxy measure of research quality incent current and potential faculty to publish in FT50 journals by tying the metric to job security and career advancement [67,87]. Under pressure to publish in these outlets, faculty align their research with what may be an outdated sense of quality and relevance. Research is aligned with the ideologies and preferences of editorial boards and reviewers, emphasizing findings from previously published works from these same journals [24,26,86]. If most of the research published by these journals is not aligned with advancing the UN SDG agenda, then it is doubtful that business schools will have much to contribute, regardless of the passage of time.
Research is clear that topics geared toward the SDGs will be treated much more favourably outside of the FT50 ecosystem. Fully legitimized by other rankings as quality work (i.e., Corporate Knights’ research ranking criteria [89], Cabell’s and SJU’s Impact Intensity™ journal rating system [83]), these lists do not yet carry the same prestige as the FT50. The ongoing, institutionalized pursuit of FT50 publications not only stifles research innovation but runs counter to the values and strategic priorities of many business schools that have incorporated ideas for curricular and extra-curricular activities that contribute to advancing the SDGs [90]. Ojeda Suárez et al. [91] in their systematic review, found many studies that pointed toward the need for the SDGs to be included simultaneously, in teaching, research and service activities. “Schools send strong signals to students about what is and what is not important to them as graduates in the business world from the minute they first interact with the school” [92] (p. 87). Hence, research output that is contrary to the learning objectives, would signal to students that these were less important than other traditional business school learning outcomes.
Knowledge transferred and future business leaders developed by business schools have the power to accelerate the business community’s ability and willingness to move forward the UN’s 2030 agenda. However, while business organizations have acknowledged their role and have made strides in contributing to the goals, progress here has also been slow. Despite increased consumer demand for ethical and sustainable products and services and investor willingness to invest in ‘greener’ more sustainable business models, many business leaders continue to get caught ‘green washing’ in order to be perceived as addressing societal demand while at the same time maintaining shareholder returns above all other interests. The water industry provided excellent examples (see “bottled water is more safe and good for the planet” [93], and Anderson’s article “Nestle water ads misleading: Canada green groups” [94]). In defense of these actions, businesses have claimed an overall lack of information on how to integrate the SDGs into their planning. Price Waterhouse Coopers (PWCs)’ “SDG Challenge Report”, stated that “while there is a general acknowledgment of the importance of the goals, there is still not enough understanding of what concrete action should be or is taking place” [95]. Academic researchers have also shown that ‘how’ businesses can contribute to the SDGs is unclear [96] and have noted that much more research is needed to help businesses navigate their role in achieving these goals [97]. The number of consultants on standby to assist companies to navigate environmental impacts, sustainability and equity, diversity and inclusion workplace challenges would suggest that this rationale may be over simplified [98]. Nevertheless, in addition to the lack of research in the area, as previously noted see [92] it is questionable whether academic research focused at advancing the 2030 agenda would be used by business practitioners.
On a positive note, research supports sustainable business models as a necessary practice, particularly during tough economic times [99]. Green investments are shown to be a permanent and major trend according to ESG investing numbers [100]. The Business Round Table, a nonprofit lobbyist association with 181 members who are chief executive officers of major United States companies, recently updated its principles of corporate governance statement (August 2019) committing to move their companies away from “shareholder primacy” to include a “Commitment to All Stakeholders’ -customers, employees, suppliers, and communities” [101]. However, members of the academic community warn that the lack of “company specific, stakeholder-inclusive ‘Statement of Purpose’ signed by every member of each individual company’s board” would negate any progress towards these corporate governance aims (see ‘An Open Letter to The Business RoundTable 181′ [102]).
Businesses have tremendous financial resources to solve the issues more so than any other entity and have many unique capabilities that can contribute toward achieving the goals. These include “financing-specific expertise and knowledge, management and enforcement capabilities and a higher willingness to take risk” [95,103]. For example, in 2022, Apple, Microsoft, Tesla, Alphabet and Amazon had market capitalizations over a trillion dollars each [104], rivalling Canada’s total Gross Domestic Product (GDP) of 1.7 trillion [105]. Apple’s most recent earnings surpassed $30 billion for the quarter putting it on track for over $100 billion in profits annually [106]. If Apple was a country, this would place it in 58th position, ahead of 136 other countries’ GDPs [105].
Sadly, under the current research reward system business schools and faculty fail to see that they are part of a much larger ecosystem. Management and economic scholars who clamour to publish in the FT50, feed “a marketing tool that improves business school rankings” [9] and boosts institutional and faculty research prestige but does not in a deliberate way contribute to output desperately needed to solve real-world problems, including developing leaders for a sustainable future, and helping businesses to adopt and engage in sustainable practices.

5.1. Limitations

There are several limitations to this study. First, the use of human researchers versus machine learning algorithms to read entire articles twice or more and to find explicit and implicit relationships to the SDGs for 4522 articles was both costly and time-consuming. Furthermore, unlike ML, the interpretation of implicit concepts varied from person to person given that individual learning processes also vary [17]. Furthermore, the researchers were undergraduate students from the same business school with various disciplinary backgrounds, suggesting that they may have shared some biases, while also bringing unique perspectives to the task. A shared understanding of key concepts, themes and words was established to minimize the variance. However, since we are unable to view the inner thinking of each researcher, a verification of the results to improve the robustness of findings and to find a faster and less expensive methodology would be beneficial. To this end, a subsequent study is currently underway that will compare the results of this study with three different ML algorithms (Leximancer™ [16], RSM AI Dashboard [79], SDG Impact Intensity™ [83]) using the same data set see working paper [107] in effort to create a responsible research assessment tool for universal acceptance and application.
Second, we acknowledge the limitations and sensitivities associated with female and BIPOC identification determined by observing a photo. Additionally, we recognize the limitations of focusing only on first authors, as first authorship does not necessarily equate with primary or principal authorship, and that other methods for assigning author order on an article are possible. Through our approach, the contributions of other female and BIPOC authors would have been understated. Access to survey data used by journals to collect information on self-declared author diversity and contributions made would be a more accurate and appropriate measure for future research.
Third, we recognize that based on time from inception to publication of research (2–5 years) that SDG topics would just be emerging in 2019, given that the SDGs were launched in 2015. However, as previously argued, as the JBE and some other journals published considerable SDG content during the same period, the lack of representation arguably had much more to do with focus than time. That said, Corporate Knights, conducting similar work reviewed titles and abstracts of 16,497 papers published in 2021 by faculty from 149 schools and found just 27.7% of papers to be SDG-related [108]. This suggests little progress had been made in the SDG space by the business academic research community in general. To confirm the result an agreed and consistent methodology is needed to assess subsequent years of the FT50. This will help determine the extent to which time to publication influenced the outcome of this study.
Finally, it is duly noted that the concerns highlighted with focusing on FT50 publications can be applicable to other so called ‘elite’ publication outlets. For example, the UTA24 publication list is a subset of the FT50 and does not include the JBE, making it even more problematic. On the other hand, organizations such as RePEC (Research Papers in Economics) are working hard to provide a decentralized database of articles for faster and broader reach for research dissemination within the academic community [109]. Additionally, Cabell’s and SJU’s SDG Impact Intensity™ journal rating system, using transparent methodologies for identifying SDG relevance, has identified a more comprehensive list, including open access journals such as Sustainability [83].

5.2. Call to Action

Most business academics can likely agree on the answer to the following question: ‘what has motivated business school scholars to regard the FT50 list as the ‘holy grail’ of research excellence?’ Publications here garner both prestige and respect from the academic community, contribute favourably to rankings that accrue major benefits to a school and provide evidence of ‘apparent’ excellence in research for P and T purposes. Disconcertingly, however, given these incentives, is that most would be incapable of answering the following two questions; ‘who decided which journals to include on the list? and, ‘what are the biases held within each of the sanctioned journals, that may be restricting SDG aligned research?’ Arguably, the composition of the FT50 journal list is inextricable from the self-interest of the dominant US-based schools that participated in its founding, and who have benefited from being highly ranked ever since.
Although business school vision and mission statements may indicate an interest in the SDGs, the extent to which the FT50 has been institutionalized, suggests more concern for reputation than positive social impact. Our study found that not only are many voices and perspectives being excluded from FT50 publications, but when those voices are heard, they are more likely to be focused on the SDGs.
The result has been a focus on research topics that favour the status quo and is in contradiction with the prevailing values and goals of sustainable development. The chosen list and the faculty from elite Western schools whose articles are published set the research agenda for the academic community. Whether created by the Financial Times, their voting members, or the widespread acceptance of publications in the FT50 list by the academic community as proof of relevant and valid research, it is clearly more than time that the systemic bias that is prevalent in our so called ‘elite’ journals be acknowledged. Recognizing the shortcomings of current systems and understanding the barriers that block business schools’ ability to accomplish specified sustainability goals is only the beginning. Several stakeholders have a role to play.
First, continued advocacy and urgent focus by the GRLI, PRME and HESI communities toward creating a more robust research assessment tool for measuring research with impact-- using the SDG framework is needed. This will require recognition that a ‘robust’ or ‘strong’ tool may be less defined than a citation metric given the nature of the SDG framework.
Second, we recommend that business school leaders explicitly communicate what matters through mission and purpose statements. It is also recommended that teaching, research, and service goals be aligned toward providing leaders and knowledge for a sustainable future. School policies need to be implemented that motivate faculty research toward the SDGs by recognizing this work as important. This would involve compensating, funding, or promoting faculty accordingly. This will require the recognition of publications beyond the FT50, as evidence of research excellence from P and T documents while including better methods for assessing quality and measuring research impact. It also recommended that schools carefully choose rankings that align with their mission and vision.
Academic researchers must come to the table too. Businesses have many resources and opportunities for helping achieve the SDGs. Research is needed to better understand how SDGs could be incorporated into corporate strategies to improve business community contributions. These findings also need to be showcased in more accessible outlets to encourage business practitioner application. Furthermore, research that investigates the embedded biases contained within published rankings is essential to further curtail unintentional consequences.
Academic publishers, editors and reviewers also play a key role. Julia Christensen Hughes presented a “top 10 list” at the UN Publishers Compact [110], of simple steps that would help. Suggestions include encouraging publishers to explicitly state their commitment to the SDGs, to host SDG-relevant Special Issues, and to ensure reviewers ask authors to make the alignment of SDG concepts explicit (in the body of the work and keywords).
Results from this study indicate that gender equity initiatives that promote female primary authorship and data from outside North America would result in a greater likelihood of research aligned with the SDGs. Additionally, a faster turnaround time from submission to publication is essential given the limited time remaining and the necessity for relevant timely research. New peer review approaches that help speed time to acceptance and publication are clearly needed, as are more journals with a focus on ethics or other associated management concepts.
Published ranking bodies also have a critical role to play. Despite their many flaws, stakeholders continue to turn to rankings as a lazy proxy for quality. Fortunately, long-established rankings have acknowledged the need to change and are adopting new approaches, including launching special sustainability issues. Of note, Duncan Ross from Times Higher Education (THE) and member of the main HESI group, and the Rankings, Ratings and Accreditation sub-committee, has made a commitment to improving the transparency of the methodologies used to rank universities’ progress toward the SDGs [111]. Andrew Jack, editor and journalist for the Financial Times, participated in both WEF Davos events, 2019 and 2020 [2,112] and has acknowledged in his recent article, “the growing demand for societal impact of teaching, research, and operations necessitates fresh approaches to our analysis of business school rankings” [113]. Inclusion of criteria that measure business discipline contribution to research that matters could have a significant influence on research agendas. The SDG framework as an assessment tool, although not perfect, is a good place to start. Careful consideration should be made to use criteria that better balance teaching, research, and service initiatives in these areas. The inclusion of more journals used to benchmark an institution’s success in publications that have a sustainability, ethics, governance, or social responsibility focus is also necessary (see Cabell’s and SJU’s Impact Intensity™ journal ranking system [83]).
Business schools are part of a much larger ecosystem, and meaningful change will only occur when all stakeholders understand the tremendous influence that their actions have on the broader business community and society. Business schools have the potential to contribute significantly to solving the world’s most pressing challenges both as a developer of future leaders and through the research conducted by their faculty and students. We need metrics, lists, definitions, and incentives that are well-aligned with these aims.

5.3. Conclusions

The present study had three primary objectives. First, to determine the incidence of found relationships between the 2019 FT50 journal articles (4522 in total) and the topics and concepts discussed within the SDG framework. The results of this investigation are supported by prior research and provide additional evidence that suggests the ‘institutionalized’ FT50 Research Framework reified by academics to equate to research excellence is misaligned with the achievement of the UN’s SDGs. Secondly, we provided an incremental methodological contribution to the literature for combination and comparison with ML and bibliometric methods toward the identification and development of a responsible research assessment tool that aligns priorities of academic research with the institution, accreditation bodies and society. Finally, we found key biases peculiar to the FT50 that may have stifled research innovation in support of the SDGs. There was an over-representation of observed white male primary authors and NA data sets from NA institutions. A logistic regression determined that the predicted probability of an SDG-related article increased with an observed female primary author, non-NA data sets and institutions. We suggest that this closed publication system has created “echo-chambers insulated from rebuttal” [17] and that selectivity, confirmation, and anchoring biases have unduly and counterproductively influenced the research agenda within the business school community.

Supplementary Materials

The following supporting information can be downloaded at: https://www.mdpi.com/article/10.3390/su14159598/s1, Table S1: Summary statistics highlighting the percent of 2019 published articles by journal that aligned with the descriptions of the dependent (SDG Alignment) and independent variables used in the OLS and Logit regressions; Table S2: Summary statistics highlighting the percent of 2019 published articles by journal discipline that aligned with the descriptions of the dependent (SDG Alignment) and independent variables used in the OLS and Logit regressions; Table S3: Table of Results from the Ordinary Least Squares (OLS) regression model.

Author Contributions

Conceptualization, J.C.H.; methodology, J.C.H. and K.R.; software, K.R. and M.R.; validation, K.R., J.C.H. and A.N.; formal analysis, K.R., M.R., and A.N.; investigation, K.R., and A.N.; data curation, M.R.; writing—original draft preparation, K.R., A.N., M.R., J.C.H.; writing—review and editing, K.R. and J.C.H.; visualization, M.R.; supervision, A.N. and K.R.; project administration, K.R.; funding acquisition, J.C.H. All authors have read and agreed to the published version of the manuscript.

Funding

This research received no external funding.

Institutional Review Board Statement

Not applicable.

Informed Consent Statement

Not applicable.

Data Availability Statement

Acknowledgments

We would like to acknowledge the undergraduate research team (12 students) that was hired to collect the data for this study and a former graduate research assistant, Taimoor Rizwan, for his valuable insights.

Conflicts of Interest

One of the authors, Julia Christensen Hughes, is a former dean, who prioritized becoming “ranked” as part of her efforts to build the global brand of her business school. Following an analysis of various rankings, she identified Corporate Knights Better MBA ranking, as the one most aligned with the aspirations of her school to “develop leaders for a sustainable world”. She also contributed to the development of the Positive Impact Rating and currently serves as member on its board. At the invitation of Corporate Knights and the United Nations (UN) Global Compact and Principles for Responsible Management Education (PRME) initiative, Julia also facilitated several “Deans Dialogue” events at Davos during the World Economic Forum on business school rankings. More recently, she has engaged with the UN’s Higher Education Sustainability Initiative (HESI), through which she has continued to advocate for change in traditional rankings. While she provided input to the design of the current survey and its implementation, as well as discussions on the analysis of the results, to guard against any potential bias, she had no direct contact with the data or student participants.

Appendix A

Table A1. Evolution of the FT List of Selected Journals from FT40 to FT45 to FT50.
FT40 (2004–2009)FT45 (2010–2015)FT50 (2016–PRESENT)
1Academy of Management Journal
(Academy of Management, Ada, Ohio)
Academy of Management JournalAcademy of Management Journal *
2Academy of Management Perspectives (AMP)Academy of Management PerspectivesAcademy of Management Review *
3Academy of Management Review (Academy of Management)Academy of Management ReviewAccounting, Organizations and Society
4Accounting Review (American Accounting Association)Accounting, Organisations and Society
(Elsevier)
Administrative Science Quarterly *
5Accounting, Organisations and Society (Elsevier)Accounting Review (American Accounting Association)American Economic Review
6Administrative Science Quarterly (Cornell University)Administrative Science Quarterly (Cornell University)Contemporary Accounting Research
7American Economic Review (American Economic Association, Nashville)American Economic Review (American Economic Association, Nashville)Econometrica
8California Management Review
(UC Berkeley)
California Management Review (UC Berkely)Entrepreneurship Theory and Practice
9Econometrica (Econometric Society, University of Chicago)Contemporary Accounting Research (Wiley)Harvard Business Review
10Entrepreneurship Theory and Practice (Baylor University, Waco, Texas)Econometrica (Econometric Society, University of Chicago)Human Relations
11Harvard Business Review
(Harvard Business School Publishing)
Entrepreneurship Theory and Practice
(Baylor University, Waco, Texas)
Human Resource Management
12Human Resource Management
(John Wiley and Sons)
Harvard Business Review
(Harvard Business School Publishing)
Information Systems Research *
13Information Systems Research (Informs)Human Resource Management (John Wiley and Sons)Journal of Accounting and Economics *
14International Journal of Human Resource management (Routledge)Information Systems Research (Informs)Journal of Accounting Research *
15Journal of Accounting and Economics
(Elsevier)
Journal of Accounting and Economics
(Elsevier)
Journal of Applied Psychology
16Journal of Accounting Research (University of Chicago)Journal of Accounting Research (University of Chicago)Journal of Business Ethics
17Journal of Applied Psychology (American Psychological Association)Journal of Applied Psychology (American Psychological Association)Journal of Business Venturing
18Journal of Business Ethics
(Kluwer Academic)
Journal of Business Ethics
(Kluwer Academic)
Journal of Consumer Psychology
19Journal of Business Venturing (Elsevier)Journal of Business Venturing (Elsevier)Journal of Consumer Research *
20Journal of Consumer Research
(University of Chicago)
Journal of Consumer Psychology (Elsevier)Journal of Finance *
21Journal of Finance (Blackwell)Journal of Consumer Research (University of Chicago)Journal of Financial and Quantitative Analysis
22Journal of Financial and Quantitative
Analysis - NEW
Journal of Finance (Blackwell)Journal of Financial Economics *
23Journal of Financial Economics (Elsevier)Journal of Financial and Quantitative
Analysis
Journal of International Business Studies*
24Journal of International Business Studies (Academy of International Business)Journal of Financial Economics (Elsevier)Journal of Management
25Journal of Marketing (American Marketing Association)Journal of International Business Studies (Academy of International Business)Journal of Management Information Systems
26Journal of Marketing Research (American Marketing Association)Journal of Management Studies (Wiley)Journal of Management Studies
27Journal of Operations Management (Elsevier)Journal of Marketing
(American Marketing Association)
Journal of Marketing *
28Journal of Political Economy (University of Chicago) Journal of Marketing Research (American Marketing Association)Journal of Marketing Research *
29Journal of the American Statistical Association (American Statistical Association)Journal of Operations Management
(Elsevier)
Journal of Operations Management *
30Management International Review (Gabler)Journal of Political Economy
(University of Chicago)
Journal of Political Economy
31Management Science (Informs)Journal of the American Statistical Association (American Statistical Association)Journal of the Academy of Marketing Science
32Marketing Science (Informs)Management Science (Informs)Management Science *
33MIS Quarterly (Management Information Systems Research Centre,
University of Minnesota)
Marketing Science (Informs)Manufacturing and Service Operations Management *
34Operations Research (Informs)MIS Quarterly (Management Information Systems Research Centre,
Unviersity of Minnesota)
Marketing Science *
35Organization Science (Informs)Operations Research (Informs)MIS Quarterly *
36Organizational Behaviour and Human Decision Processes (Academic Press) Organization Science (Informs)Operations Research *
37Rand Journal of Economics
(The Rand Corporation)
Organization Studies (SAGE)Organization Science *
38Review of Financial Studies
(Oxford University Press)
Organizational Behaviour and Human Decision Processes (Academic Press)Organization Studies
39Sloan Management Review (MIT)Production and Operations Management (POMS)Organizational Behavior and Human Decision Processes
40Strategic Management Journal
(John Wiley and Sons)
Quarterly Journal of Economics (MIT)Production and Operations Management *
41 Rand Journal of Economics
(The Rand Corporation)
Quarterly Journal of Economics
42 Review of Accounting Studies (Springer)Research Policy
43 Review of Financial Studies
(Oxford University Press)
Review of Accounting Studies
44 Sloan Management Review (MIT)Review of Economic Studies
45 Strategic Management Journal
(John Wiley and Sons)
Review of Finance
46 Review of Financial Studies *
47 Sloan Management Review
48 Strategic Entrepreneurship Journal
49 Strategic Management Journal *
50 The Accounting Review *
Note: Journals in bold were added from the previous edition. Journals in red were dropped in the subsequent edition. Journals with * are also included on the UTD24 list.
Figure A1. Research Design and Methodology: Mixed Methods [19].
Sustainability 14 09598 g0a1

References

  1. Badat, S. Global rankings of universities: A perverse and present burden. In Global Inequalities and Higher Education: Whose Interests Are We Serving; Entwistle, N., King, R., Eds.; Palgrave Macmillian: London, UK, 2010; pp. 117–141. [Google Scholar]
  2. Dialogue at Davos: On Business School Rankings (23 January 2019) at the Invitation of Corporate Knights and Principles for Responsible Management Education. Available online: https://grli.org/wp-content/uploads/2019/02/Davos-Dialogue-11-Feb-2019-FINAL.pdf (accessed on 28 April 2021).
  3. Pitt-Watson, D.; Quigley, E. Business School Rankings for the 21st Century. UN Principles for Responsible Management Education (PRME). January 2019. Available online: https://gmac.gcs-web.com/static-files/70eb162a-685b-4a83-81ae-748543aa3ad5 (accessed on 30 March 2021).
  4. Rodenburg, K.; Rizwan, T.; Liu, R.; Christensen Hughes, J. Enhancing the Positive Impact Rating: A New Business School Rating in Support of a Sustainable Future. Sustainability 2021, 13, 6519. [Google Scholar] [CrossRef]
  5. Peters, K. Business school rankings: Content and context. J. Manag. Dev. 2007, 26, 49–53. [Google Scholar] [CrossRef]
  6. Discussion Paper on Mission-Oriented Research. Available online: https://www.globalresearchcouncil.org/fileadmin//documents/Library/Discussion_Paper_Mission_Oriented_Research_for_the_2019_2020_RM.pdf (accessed on 16 August 2021).
  7. Acker, S.; Webber, M. Discipline and Publish: The Tenure Review Process in Ontario Universities. In Assembling and Governing the Higher Education Institution; Palgrave Macmillan: London, UK, 2016; pp. 233–255. [Google Scholar]
  8. Mu, F.; Hatch, J. Becoming a Teacher Scholar: The Perils and Promise of Meeting the Promotion and Tenure Requirements in a Business School. J. Manag. Educ. 2021, 45, 293–318. [Google Scholar] [CrossRef]
  9. Mingers, J.; Willmott, H. Tailorizing business school research: On the ‘one best way’ performative effects of journal ranking lists. Hum. Relat. 2013, 66, 1051–1073. [Google Scholar] [CrossRef]
  10. Adler, N.; Harzing, A.-W. When Knowledge Wins: Transcending the Sense and Nonsense of Academic Rankings. Acad. Manag. Learn. Educ. 2009, 8, 72–95. [Google Scholar] [CrossRef] [Green Version]
  11. Yang, Z.; Wang, X.; Su, C. A review of research methodologies in international business. Int. Bus. Rev. 2006, 15, 601–617. [Google Scholar] [CrossRef]
  12. Desai, A.; Anil Kumar, H. Trends in finance research: Analyzing publication data of leading financial journals. J. Bus. Financ. 2021, 26, 126–144. [Google Scholar] [CrossRef]
  13. Dong, H.; Guo, X.; Miller, S.; Yang, T. Publication Concentration Trends of Top Business Journals, 1990–2020. Soc. Sci. Res. Netw. 2021. [Google Scholar] [CrossRef]
  14. Humphrey, C.; Kiseleva, O.; Schleicher, T. A time-series analysis of the scale of coercive journal self-citation and its effect on impact factors and journal rankings. Eur. Account. Rev. 2019, 28, 335–369. [Google Scholar] [CrossRef] [Green Version]
  15. Armitage, C.S.; Lorenz, M.; Mikki, S. Mapping scholarly publications related to the Sustainable Development Goals: Do independent bibliometric approaches get the same results? Quant. Sci. Stud. 2020, 1, 1092–1108. [Google Scholar] [CrossRef]
  16. Rodenburg, K.; De Silva, V.; Christensen Hughes, J. SDGs: A Responsible Research Assessment Tool toward Impactful Business Research. Sustainability 2021, 13, 14019. [Google Scholar] [CrossRef]
  17. Human Learning and Machine Learning—How They Differ? Available online: https://www.datasciencecentral.com/human-learning-and-machine-learning-how-they-differ/#:~:text=Human%20learning%20process%20varies%20from%20person%20to%20person.&text=Humans%20acquire%20knowledge%20through%20experience,being%20used%20to%20define%20intelligence (accessed on 1 March 2022).
  18. Creswell, J.W.; Poth, C.N. Qualitative Inquiry and Research Design: Choosing among Five Approaches; Sage Publications: Thousand Oaks, CA, USA, 2016. [Google Scholar]
  19. Van Manen, M. Phenomenology of Practice: Meaning Given Methods in Phenomenological Research and Writing; Left Coast Press: Walnut Creek, CA, USA, 2014. [Google Scholar]
  20. Bergh, D.D.; Boyd, B.K.; Byron, K.; Gove, S.; Ketchen, D.J. What Constitutes a Methodological Contribution? J. Manag. 2022, 48, 01492063221088235. [Google Scholar] [CrossRef]
  21. Unerman, J. Risks from self-referential peer review echo chambers developing in research fields: 2018 Keynote Address presented at The British Accounting Review 50th Anniversary Celebrations, British Accounting and Finance Association Annual Conference, London. Br. Account. Rev. 2020, 52, 100910. [Google Scholar] [CrossRef]
  22. Elevating the Equity Curve. Available online: https://www.aacsb.edu/insights/articles/2021/03/elevating-the-equity-curve#:~:text=For%20instance%2C%20women%20make%20up,from%2026.6%20percent%20in%202016 (accessed on 2 May 2022).
  23. Myths of the Diversity Dilemma. Available online: https://www.aacsb.edu/insights/articles/2021/06/myths-of-the-diversity-dilemma (accessed on 18 April 2022).
  24. Chowdhury, G.; Koya, K. Information practices for sustainability: Role of Schools in achieving the UN sustainable development goals (SDGs). J. Assoc. Inf. Sci. Technol. 2017, 68, 2128–2138. [Google Scholar] [CrossRef]
  25. What Is the True Cost of a Harvard MBA? Available online: https://www.nitrocollege.com/blog/true-cost-of-a-harvard-mba#:~:text=What%20is%20the%20cost%20of,rises%20to%20%24110%2C740%20per%20year (accessed on 1 June 2022).
  26. Connelly, C.E.; Gallagher, D.G. Making “The List”: Business School Rankings and the commodification of business research. J. Curric. Theor. 2010, 26, 86–99. [Google Scholar]
  27. University of Denver—Target Journal List: Academic Units AY2018-19. Available online: https://portfolio.du.edu/downloadChildItem/212820 (accessed on 18 March 2022).
  28. Baylor University: Standards for Faculty Appointment, Tenure and Promotion Decisions, and Annual Performance Review. Available online: https://www.baylor.edu/provost/doc.php/374899.pdf (accessed on 29 November 2021).
  29. University of Hawaii at Hilo: Guidelines for Candidates for Reappointment, Tenure, Promotion and Post-Tenure Qualification. Available online: http://business.uhh.hawaii.edu/senate/tenure-promotion-guidelines.php (accessed on 7 May 2022).
  30. University of Washington: Focus on Research. Available online: https://foster.uw.edu/faculty-research/academic-departments/finance-and-business-economics/research/ (accessed on 18 December 2021).
  31. University of Alberta: Top Management Journals. Available online: https://www.ualberta.ca/business/research/publications/top-management-journals.html (accessed on 17 April 2022).
  32. York University: Academic Hiring—Position Listings. Available online: http://webapps.yorku.ca/academichiringviewer/viewposition.jsp?positionnumber=1784 (accessed on 23 March 2022).
  33. Montpellier Business School: Assistant Professor of Marketing. Available online: https://extranet.montpellier-bs.com/MBSCandidature/JobDetail.aspx?id=8a16828e7c7738e4017c82f2f20132b4 (accessed on 20 February 2022).
  34. Most Successful So Far. Available online: https://www.ft.com/content/29766980-28f0-11d9-836c-00000e2511c8 (accessed on 12 February 2022).
  35. 50 Journals Used in FT Research Rank. Available online: https://www.ft.com/content/3405a512-5cbb-11e1-8f1f-00144feabdc0 (accessed on 13 December 2021).
  36. Andrew, J.; (Financial Times, London, UK). Personal communication, 2021.
  37. Hacking a Top Journals List: A Collective Approach to Developing Metrics? Available online: https://scholarlykitchen.sspnet.org/2021/08/31/hacking-a-top-journals-list-a-collective-approach-to-developing-metrics/ (accessed on 16 March 2022).
  38. (BPRW) Malcolm Gladwell Podcast “Revisionist History” Focuses on HBCU Dillard Univ.; Exposes Hypocrisy of Well-Known Annual College Ranking System. Available online: https://www.blackprwire.com/press-releases/bprw-malcolm-gladwell-podcast-revisionist-history-focuses-on-hbcu-dillard-univ-exposes-hypocrisy-of-well-known-annual-college-ranking-system (accessed on 5 December 2021).
  39. Are Business Schools Fit for the Future? Available online: https://charteredabs.org/business-schools-fit-future/ (accessed on 17 February 2022).
  40. FT Global MBA Ranking 2022. Available online: https://www.ft.com/mba-method (accessed on 26 April 2022).
  41. The Purpose of the Academic Journal Guide. Available online: https://charteredabs.org/academic-journal-guide-2021/ (accessed on 27 January 2022).
  42. ABDC Journal Quality List. Available online: https://abdc.edu.au/research/abdc-journal-quality-list/ (accessed on 28 March 2022).
  43. Oxford Learner’s Definition—Echo Chamber. Available online: https://www.oxfordlearnersdictionaries.com/us/definition/english/echo-chamber (accessed on 9 November 2021).
  44. Cooper, D.J.; Wayne, M. Case Study Research in Accounting. Account. Horiz. 2008, 22, 159–178. [Google Scholar] [CrossRef]
  45. Forsythe, R.; Nelson, F.; Neumann, G.R.; Wright, J. Anatomy of an Experimental Political Stock Market. Am. Econ. Rev. 1992, 82, 1142–1161. [Google Scholar]
  46. Hirshleifer, D. Investor Psychology and Asset Pricing. J. Financ. 2002, 56, 1533–1597. [Google Scholar] [CrossRef] [Green Version]
  47. Hirshleifer, D.; Seongyeon Lim, S.; Hong Teoh, S. Driven to Distraction: Extraneous Events and Underreaction to Earnings News. J. Financ. 2009, 64, 2289–2325. [Google Scholar] [CrossRef] [Green Version]
  48. Epstein, W.M. Confirmational response bias and the quality of the editorial processes among American social work journals. Res. Soc. Work Pract. 2004, 14, 450–458. [Google Scholar] [CrossRef]
  49. Goodstein, L.D.; Brazis, K.L. Psychology of scientist: XXX. Credibility of psychologists: An empirical study. Psychol. Rep. 1970, 27, 835–838. [Google Scholar] [CrossRef]
  50. Greenwald, A.G.; Pratkanis, A.R.; Leippe, M.R.; Baumgardner, M.H. Under what conditions does theory obstruct research progress? Psychol. Rev. 1986, 93, 216–229. [Google Scholar] [CrossRef] [PubMed]
  51. Koehler, J.J. The influence of prior beliefs on scientific judgments of evidence quality. Organ. Behav. Hum. Decis. Processes 1993, 56, 28–55. [Google Scholar] [CrossRef] [Green Version]
  52. Mahoney, M.J. Publication prejudices: An experimental study of confirmatory bias in the peer review system. Cogn. Ther. Res. 1977, 1, 161–175. [Google Scholar] [CrossRef]
  53. Hergovich, A.; Schott, R.; Burger, C. Biased Evaluation of Abstracts Depending on Topic and Conclusion: Further Evidence of a Confirmation Bias within Scientific Psychology. Curr. Psychol. 2010, 29, 188–209. [Google Scholar] [CrossRef]
  54. Armstrong, J.S. Publication of research on controversial topics: The early acceptance procedure. Int. J. Forecast. 1996, 12, 299–302. [Google Scholar] [CrossRef] [Green Version]
  55. Horrobin, D.F. The philosophical basis of peer review and the suppression of innovation. J. Am. Med. Assoc. 1990, 263, 1438–1441. [Google Scholar] [CrossRef]
  56. Why We Tend to Rely Heavily upon the First Piece of Information We Receive. Available online: https://thedecisionlab.com/biases/anchoring-bias (accessed on 16 November 2021).
  57. Boyacigiller, N.A.; Adler, N.J. The Parochial Dinosaur: Organizational Science in a Global Context. Acad. Manag. Rev. 1991, 16, 262–290. [Google Scholar] [CrossRef]
  58. Dheer, R.J.S. Entrepreneurship by immigrants: A review of existing literature and directions for future research. Int. Entrep. Manag. J. 2018, 14, 555–614. [Google Scholar] [CrossRef]
  59. Herdin, T.; Faust, M.; Chen, G. On the Need for de-Westernization of Visual Communication and Culture in the Global South. In De-Westernizing Visual Communication and Cultures; Nomos Verlagsgesellschaft: Baden-Baden, Germany, 2020. [Google Scholar]
  60. Brooks, C.; Fenton, E.; Schopohl, L.; Walker, J. Why does research in finance have so little impact? Crit. Perspect. Account. 2019, 58, 24–52. [Google Scholar] [CrossRef] [Green Version]
  61. Shang, Y.; Silversten, G.; Cao, Z.; Zhang, L. Gender differences in research focused on the Sustainable Development Goal of Gender Equality. SocArXiv 2021. [Google Scholar] [CrossRef]
  62. Cox, C. Anything less is not feminism: Racial difference and the W.M.W.M. Law Crit. 1990, 1, 237–248. [Google Scholar] [CrossRef]
  63. King, E.B.; Avery, D.R.; Hebl, M.R.; Cortina, J.M. Systematic Subjectivity: How Subtle Biases Infect the Scholarship Review Process. J. Manag. 2017, 44, 843–853. [Google Scholar] [CrossRef] [Green Version]
  64. Nkomo, S.M. The Emperor Has No Clothes: Rewriting “Race in Organizations”. Acad. Manag. Rev. 1992, 17, 487–513. [Google Scholar]
  65. Avery, D.R.; Dumas, T.L.; George, E.; Joshi, A.; Loyd, D.L.; van Knippenberg, D.; Wang, M.; Xu, H. Racial Biases in the Publication Process: Exploring Expressions and Solutions. J. Manag. 2021, 48, 7–16. [Google Scholar] [CrossRef]
  66. Harzing, A.-W.; Metz, I. Explaining geographic diversity of editorial boards: The role of conference participation and English-language skills. Eur. J. Int. Manag. 2012, 6, 697–715. [Google Scholar] [CrossRef] [Green Version]
  67. It’s Time to Make Business School Research More Relevant. Available online: https://hbr.org/2018/07/its-time-to-make-business-school-research-more-relevant (accessed on 20 January 2022).
  68. Holden, C.W. Do acceptance and publication times differ across finance journals? Rev. Corp. Financ. Stud. 2017, 6, 102–126. [Google Scholar] [CrossRef]
  69. The 17 Goals. Available online: https://sdgs.un.org/goals (accessed on 21 November 2021).
  70. Higgs, J. Charting standpoints in qualitative research. In Critical Moments in Qualitative Research; Byrne-Armstrong, H., Higgs, J., Horsfall, D., Eds.; Butterworth-Heinemann: Oxford, UK, 2001; pp. 44–67. [Google Scholar]
  71. Thomas, D.R. A General Inductive Approach for Qualitative Data Analysis. Am. J. Eval. 2003, 27, 1–11. [Google Scholar]
  72. UW Research Glossary—Undue Influence. Available online: https://www.washington.edu/research/glossary/undue-influence/#:~:text=Undue%20influence%20refers%20to%20the,they%20participate%20in%20the%20research (accessed on 24 January 2022).
  73. Two-Thirds of Americans Think Government Should Do More on Climate. Available online: https://www.pewresearch.org/science/2020/06/23/two-thirds-of-americans-think-government-should-do-more-on-climate/ (accessed on 6 March 2022).
  74. Blueprint for SDG Integration into Curriculum, Research, and Partnerships. Available online: https://www.academia.edu/43370734/BLUEPRINT_FOR_SDG_INTEGRATION_INTO_CURRICULUM_RESEARCH_AND_PARTNERSHIPS (accessed on 31 July 2021).
  75. Tyson, G.; Greif, G. A Look Behind the Numbers. In Selections; Graduate Management Admission Council: Reston, VA, USA, 2001; Volume 1, pp. 8–15. [Google Scholar]
  76. Jayabalasingham, B.; Boverhof, R.; Agnew, K.; Klein, L. Identifying research supporting the United Nations Sustainable Development Goals; Elsevier Doc: Amsterdam, The Netherlands, 2019; Volume 1. [Google Scholar] [CrossRef]
  77. Aurora Universities Network. Available online: https://aurora-network.global/ (accessed on 14 October 2021).
  78. SIRIS Academic. Available online: https://sirisacademic.com/ (accessed on 6 September 2021).
  79. Rotterdam School of Management Erasmus University. Available online: https://www.rsm.nl/ (accessed on 30 September 2021).
  80. SDG Dashboard, St. Joseph’s University. Available online: https://sdgdashboard.sju.edu/?page_id=22 (accessed on 19 September 2021).
  81. Steingard, D.; Linacre, S. Transforming academic journal assessment from “quality” to “impact”: A case study of the SDG Impact Intensity academic journal rating artificial intelligence system. In Responsible Management Education and the Digital Transformation Challenge; Hauser, C., Amann, W., Eds.; Palgrave Macmillan: New York, NY, USA, 2022. [Google Scholar]
  82. Steingard, D.; Balduccini, M.; Sinha, A. Applying for AI for social good: Aligning academic journal ratings with the United Nations Sustainable Development Goals (SDGs). AI Soc. 2022. [Google Scholar] [CrossRef]
  83. Cabell’s Launches New SDG Impact Intensity Journal Rating System in Partnership with Saint Joseph’s University Haul School of Business. Available online: https://blog.cabells.com/2021/03/17/cabells-launches-new-sdg-impact-intensity-journal-rating-system-in-partnership-with-saint-josephs-universitys-haub-school-of-business/ (accessed on 15 December 2021).
  84. Hodgson, G.M.; Rothman, H. The Editors and Authors of Economics Journals: A Case of Institutional Oligopoly? Econ. J. 2001, 109, 165–186. [Google Scholar] [CrossRef] [Green Version]
  85. Larivière, V.; Haustein, S.; Mongeon, P. The Oligopoly of Academic Publishers in the Digital Era. PLoS ONE 2015, 10, e0127502. [Google Scholar] [CrossRef] [PubMed]
  86. Publication, Power, and Patronage: On Inequality and Academic Publishing. Available online: http://piperlab.mcgill.ca/pdfs/Wellmon_Piper_Academic_Inequality_CI_2017.pdf (accessed on 5 January 2022).
  87. Miranda, R.; Garcia-Carpintero, E. Overcitation and overrepresentation of review papers in the most cited papers. J. Informetr. 2018, 12, 1015–1030. [Google Scholar] [CrossRef]
  88. Tourish, D. The Triumph of Nonsense in Management Studies. Acad. Manag. Learn. Educ. 2020, 19, 99–109. [Google Scholar] [CrossRef]
  89. Corporate Knights—The 2021 Better World MBA Methodology. Available online: https://www.corporateknights.com/wp-content/uploads/2021/06/2021-Better-World-MBA-Methodology.pdf (accessed on 15 June 2022).
  90. García-Feijoo, M.; Eizaguirre, A.; Rica-Aspiunza, A. Systematic Review of Sustainable-Development-Goal Deployment in Business Schools. Sustainability 2020, 12, 440. [Google Scholar] [CrossRef] [Green Version]
  91. Ojeda Suárez, R.; Agüero Contreras, F.C. Globalización, Agenda 2030 e imperativo de la educación superior: Reflexiones. Conrado 2019, 15, 125–134. [Google Scholar]
  92. Weybrecht, G. From challenge to opportunity–Management education’s crucial role in sustainability and the Sustainable Development Goals—An overview and framework. Int. J. Manag. Educ. 2017, 15, 84–92. [Google Scholar] [CrossRef]
  93. Selling Bottled Water That’s Better for the Planet. Available online: https://www.nytimes.com/2016/05/01/business/selling-bottled-water-thats-better-for-the-planet.html (accessed on 12 December 2021).
  94. Nestle Water Ads Misleading: Canada Green Groups. Available online: https://www.reuters.com/article/us-water-protest-idUSTRE4B06UJ20081201 (accessed on 16 December 2021).
  95. PwC’s SDG Challenge 2019. Available online: https://www.pwc.com/gx/en/services/sustainability/sustainable-development-goals/sdg-challenge-2019.html (accessed on 21 September 2021).
  96. Spangenberg, J. Hot Air or Comprehensive Progress? A Critical Assessment of the SDGs. Sustain. Dev. 2017, 25, 311–321. [Google Scholar] [CrossRef]
  97. Nagle, T.; Doyle, C.; Sammon, D. A Case History of Practitioner Design Science Research. OSF Preprints 2020. [Google Scholar] [CrossRef]
  98. Environmental Consulting in Canada—Market Size 2005–2027. Available online: https://www.ibisworld.com/canada/market-size/environmental-consulting/#:~:text=past%205%20years%3F-,The%20market%20size%20of%20the%20Environmental%20Consulting%20industry%20in%20Canada,average%20between%202017%20and%202022 (accessed on 15 January 2022).
  99. Lu, J.; Rodenburg, K.; Foti, L.; Pegoraro, A. Are firms with better sustainability performance more resilient during crises? Business Strategy and the Environment. CNBC News, 11 April 2022. [Google Scholar]
  100. The Numbers Suggest the Green Investing ‘Mega Trend’ Is Here to Stay. Available online: https://www.cnbc.com/2020/02/14/esg-investing-numbers-suggest-green-investing-mega-trend-is-here.html (accessed on 22 February 2022).
  101. Business Roundtable Redefines the Purpose of a Corporation to Promote ‘An Economy That Serves All Americans’. Available online: https://www.businessroundtable.org/business-roundtable-redefines-the-purpose-of-a-corporation-to-promote-an-economy-that-serves-all-americans#:~:text=We%20believe%20the%20free%2Dmarket,providing%20essential%20goods%20and%20services (accessed on 22 February 2022).
  102. An Open Letter to The Business Roundtable 181. 2020. Available online: https://www.forbes.com/sites/bobeccles/2020/08/19/an-open-letter-to-the-business-roundtable-181/?sh=534610184001 (accessed on 17 July 2022).
  103. Schönherr, N.; Findler, F.; Martinuzzi, A. Exploring the interface of CSR and the Sustainable Development Goals. Transnatl. Corp. 2017, 24, 33–47. [Google Scholar] [CrossRef] [Green Version]
  104. Google Finance. Available online: https://www.google.com/finance/ (accessed on 7 February 2022).
  105. Real GDP Growth—Annual Percent Change. Available online: https://www.imf.org/external/datamapper/NGDP_RPCH@WEO/OEMDC/ADVEC/WEOWORLD (accessed on 2 May 2022).
  106. Apple News and Results—Investor Updates—FY 22 Second Quarter Results. Available online: https://investor.apple.com/investor-relations/default.aspx (accessed on 30 April 2022).
  107. Rodenburg, K.; Steingard, D.; Mijnhardt, W.; Christensen Hughes, J. Methodology comparison of the SDG research assessment tools. Work in progress.
  108. Torrie, R.D.; (Research Director, Corporate Knights, Toronto, ON, Canada). Personal communication, 2022.
  109. Research Papers in Economics. Available online: https://ideas.repec.org/ (accessed on 18 July 2022).
  110. HESI Webinar: SDG Publishers Compact: Aligning Scholarly Activity with the Sustainable Development Goals. Available online: https://www.iau-hesd.net/events/5309-hesi-webinar-sdg-publishers-compact-aligning-scholarly-activity-sustainable-development (accessed on 15 November 2021).
  111. Introducing Our New Impact Rankings Advisory Board. Available online: https://www.timeshighereducation.com/world-university-rankings/introducing-our-new-impact-rankings-advisory-board (accessed on 4 December 2021).
  112. The Future of Business School Rankings and Ratings, Davos. 2020. Available online: https:/issuu.com/oikosworld/docs/davosrecapreport2020 (accessed on 12 August 2021).
  113. Andrew, J. Business School Rankings: The Financial Times’ Experience and Evolutions. Bus. Soc. 2022, 61, 795–800. [Google Scholar]
Figure 1. Evolution of the list of journals used in the FT Research Metric.
Sustainability 14 09598 g001
Figure 2. FT50 2019 SDG Related Articles by Designated SDG.
Sustainability 14 09598 g002
Figure 3. Implicit and explicit SDG-related articles by discipline.
Sustainability 14 09598 g003
Figure 4. FT50 2019 articles comparing key summary statistics of SDG-related versus non-SDG-related articles.
Sustainability 14 09598 g004
Figure 5. Publication Time Duration from Submission to Publication comparison SDG versus non-SDG-related articles.
Sustainability 14 09598 g005
Table 1. Historical number of participating schools in the Financial Times Rankings by geographic region for the years that the FT Journal List was updated.
1999 (50)2001 (151)2004 (175)2010 (200)2016 (216)
MBA50 (100%)101 (67%)100 (57%)100 (50%)101 (47%)
EMBA050 (33%)75 (43%)100 (50%)100 (46%)
On-line MBA000015 (7%)
U.S.A.31 (62%)78 (52%)99 (57%)105 (53%)94 (44%)
Canada3 (6%)12 (8%)14 (8%)12 (6%)9 (4%)
Europe16 (32%)49 (32%)48 (27%)57 (29%)73 (34%)
Asia04 (3%)5 (3%)13 (7%)26 (12%)
Middle East0001 (<1%)2 (<1%)
Africa0001 (<1%)2 (<1%)
South America01 (<1%)3 (2%)4 (2%)4 (2%)
Table 2. Universities ranked by number of papers published in FT50 Finance Journals.
RankAffiliationsPapersPercentage (%)
1Harvard University3004.69%
2University of Chicago2874.48%
3University of Pennsylvania2824.40%
4Stern School of Business2273.55%
5National Bureau of Economic Research2153.36%
6Duke University1852.89%
7University of Michigan1722.67%
8London Business School1702.66%
9University of California Los Angeles1702.66%
10Ohio State University1692.64%
11Columbia University1642.56%
12University of North Carolina1612.51%
13Stanford University1602.50%
14Cornell University1582.47%
15Northwestern University1422.22%
16University of California Berkley1422.22%
17University of Illinois1402.19%
18University of Maryland1312.05%
19Boston College1302.03%
20Indiana University1282.00%
Table 3. Paired T-Tests to test H1b, H2, H3, H4a, H5a.
p-Value Hypothesis Interpretation
Explicitly SDG Related Articles (H2)0.0082***Explicitly SDG-related articles are significantly different (statistically underrepresented) at the 1% level as compared to Implicitly SDG-related articles
Articles Relating to SDG 1, 2, 13–15, and 17 (H3)0.000****Number of articles relating to SDG 1, 2, 13–15, and 17 are significantly less than articles relating to SDG 8, 9, and 12
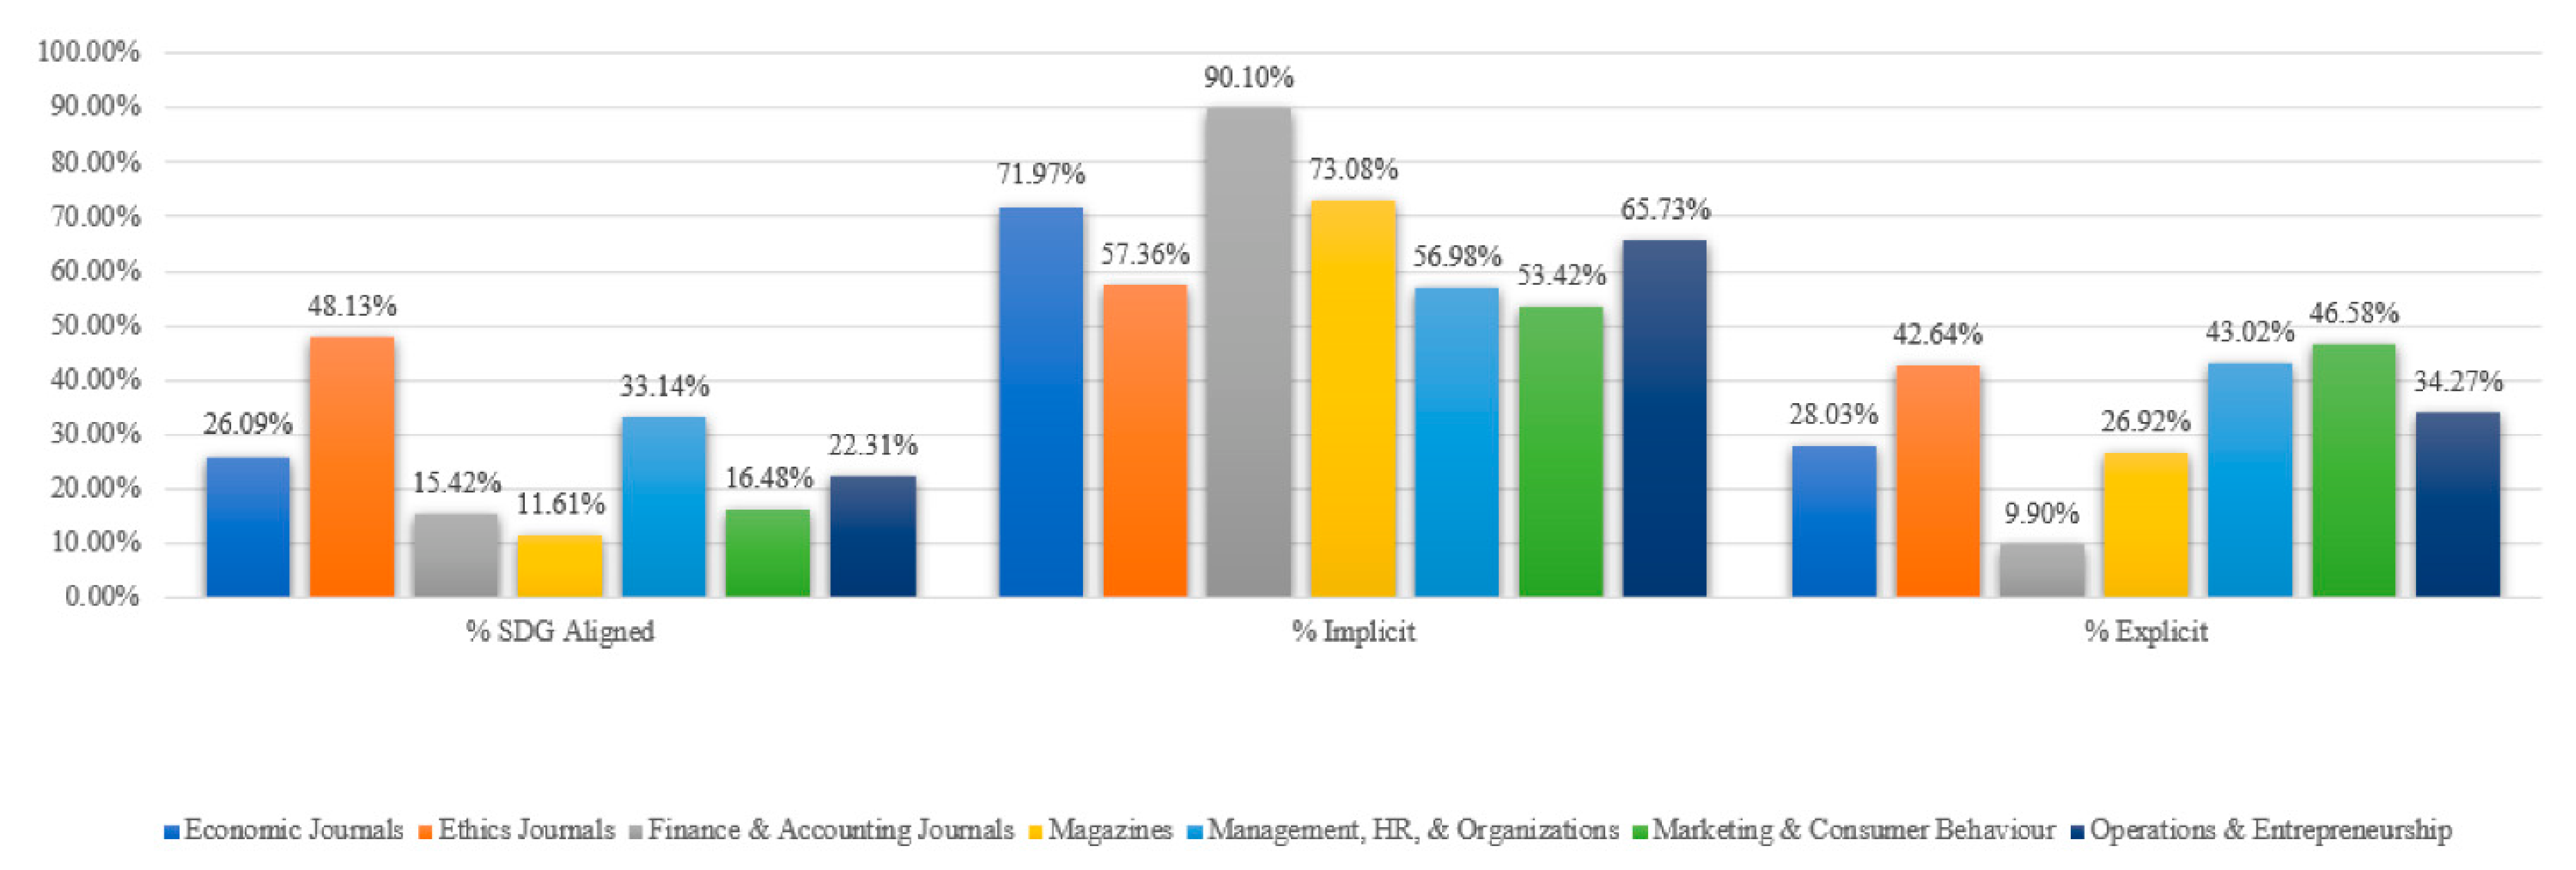
Articles Relating to the Economics, Finance and Accounting Journal Disciplines (H4)0.0689*SDG identified Articles relating to the Economics, Finance and Accounting journal disciplines are significantly different (statistically underrepresented) at the 7% level compared to number of SDG articles identified in Business Ethics, Management, Human Resources, and Organizations journal disciplines
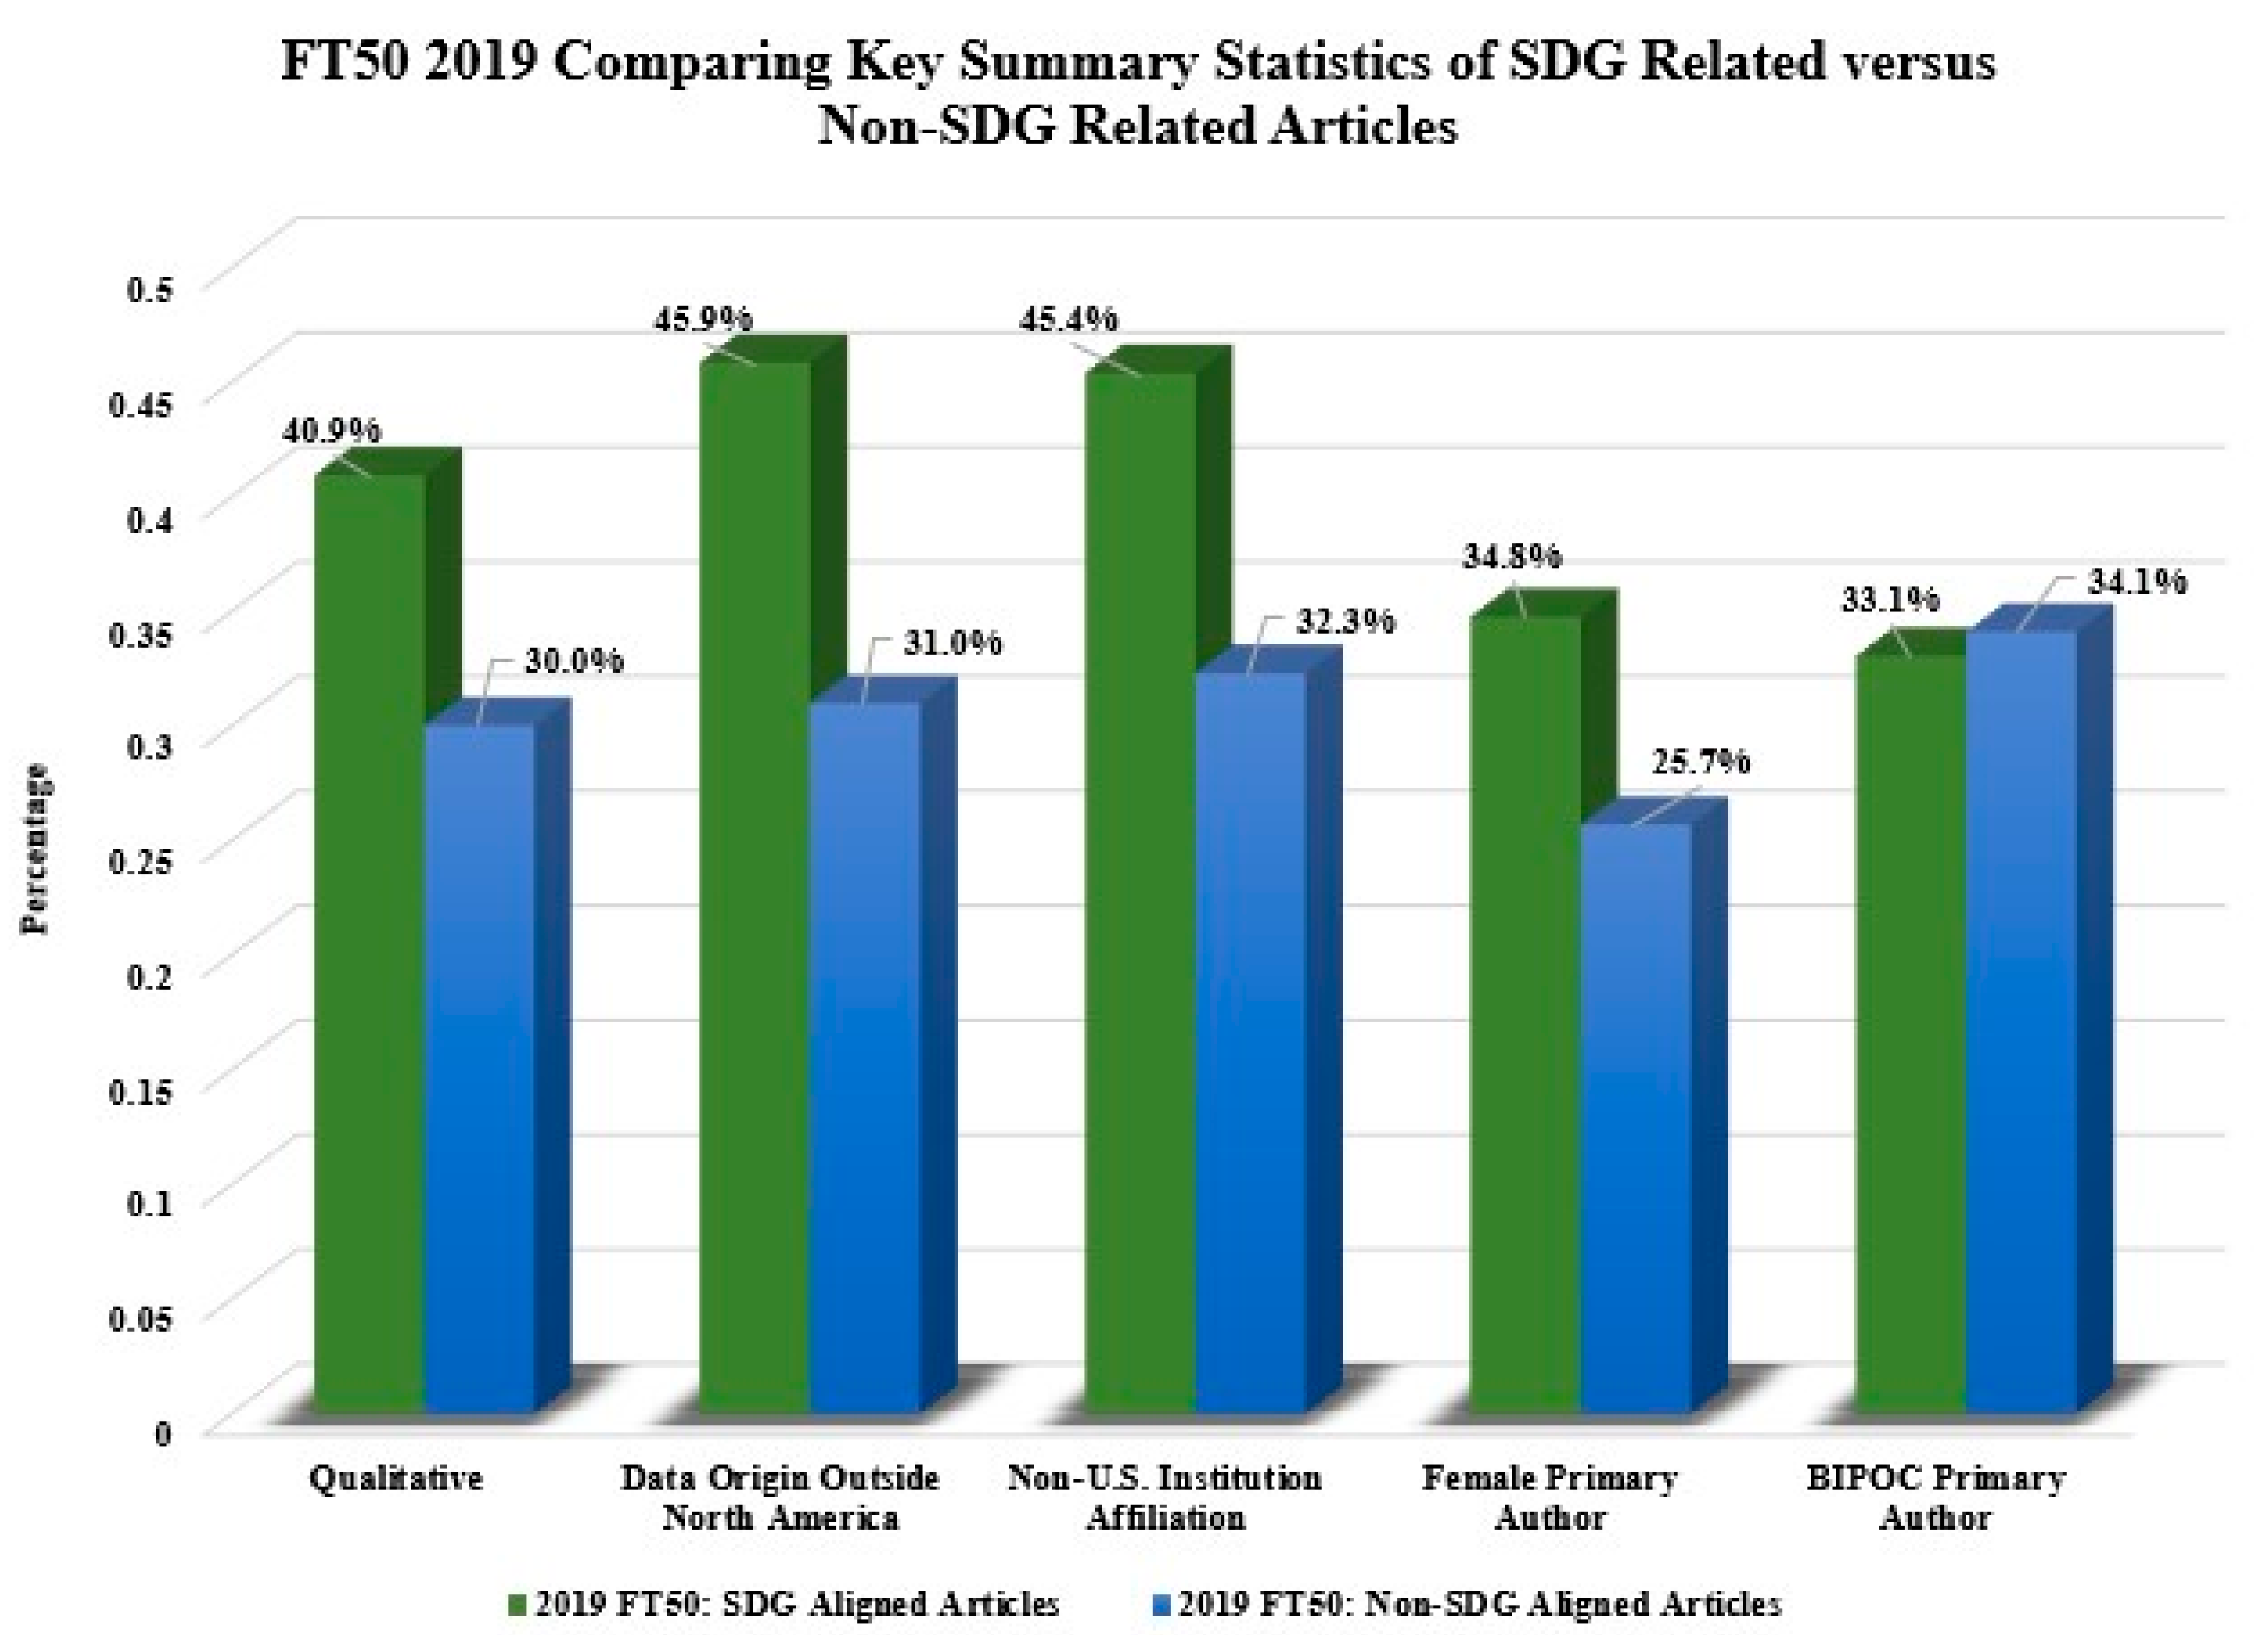
Data Origin: Outside North America (H5a)7.692 × 10⁻⁵****Articles with Data Origin: Outside North America are significantly different (statistically underrepresented) at the 0.1% level when compared to articles with Data Origin: North America
Non-U.S. Institution Affiliation (H6a)1.397 × 10⁻⁸****Articles with Non-U.S. Institution Affiliation are significantly different (statistically underrepresented) at the 0.1% level when compared to articles with U.S. Institution Affiliation
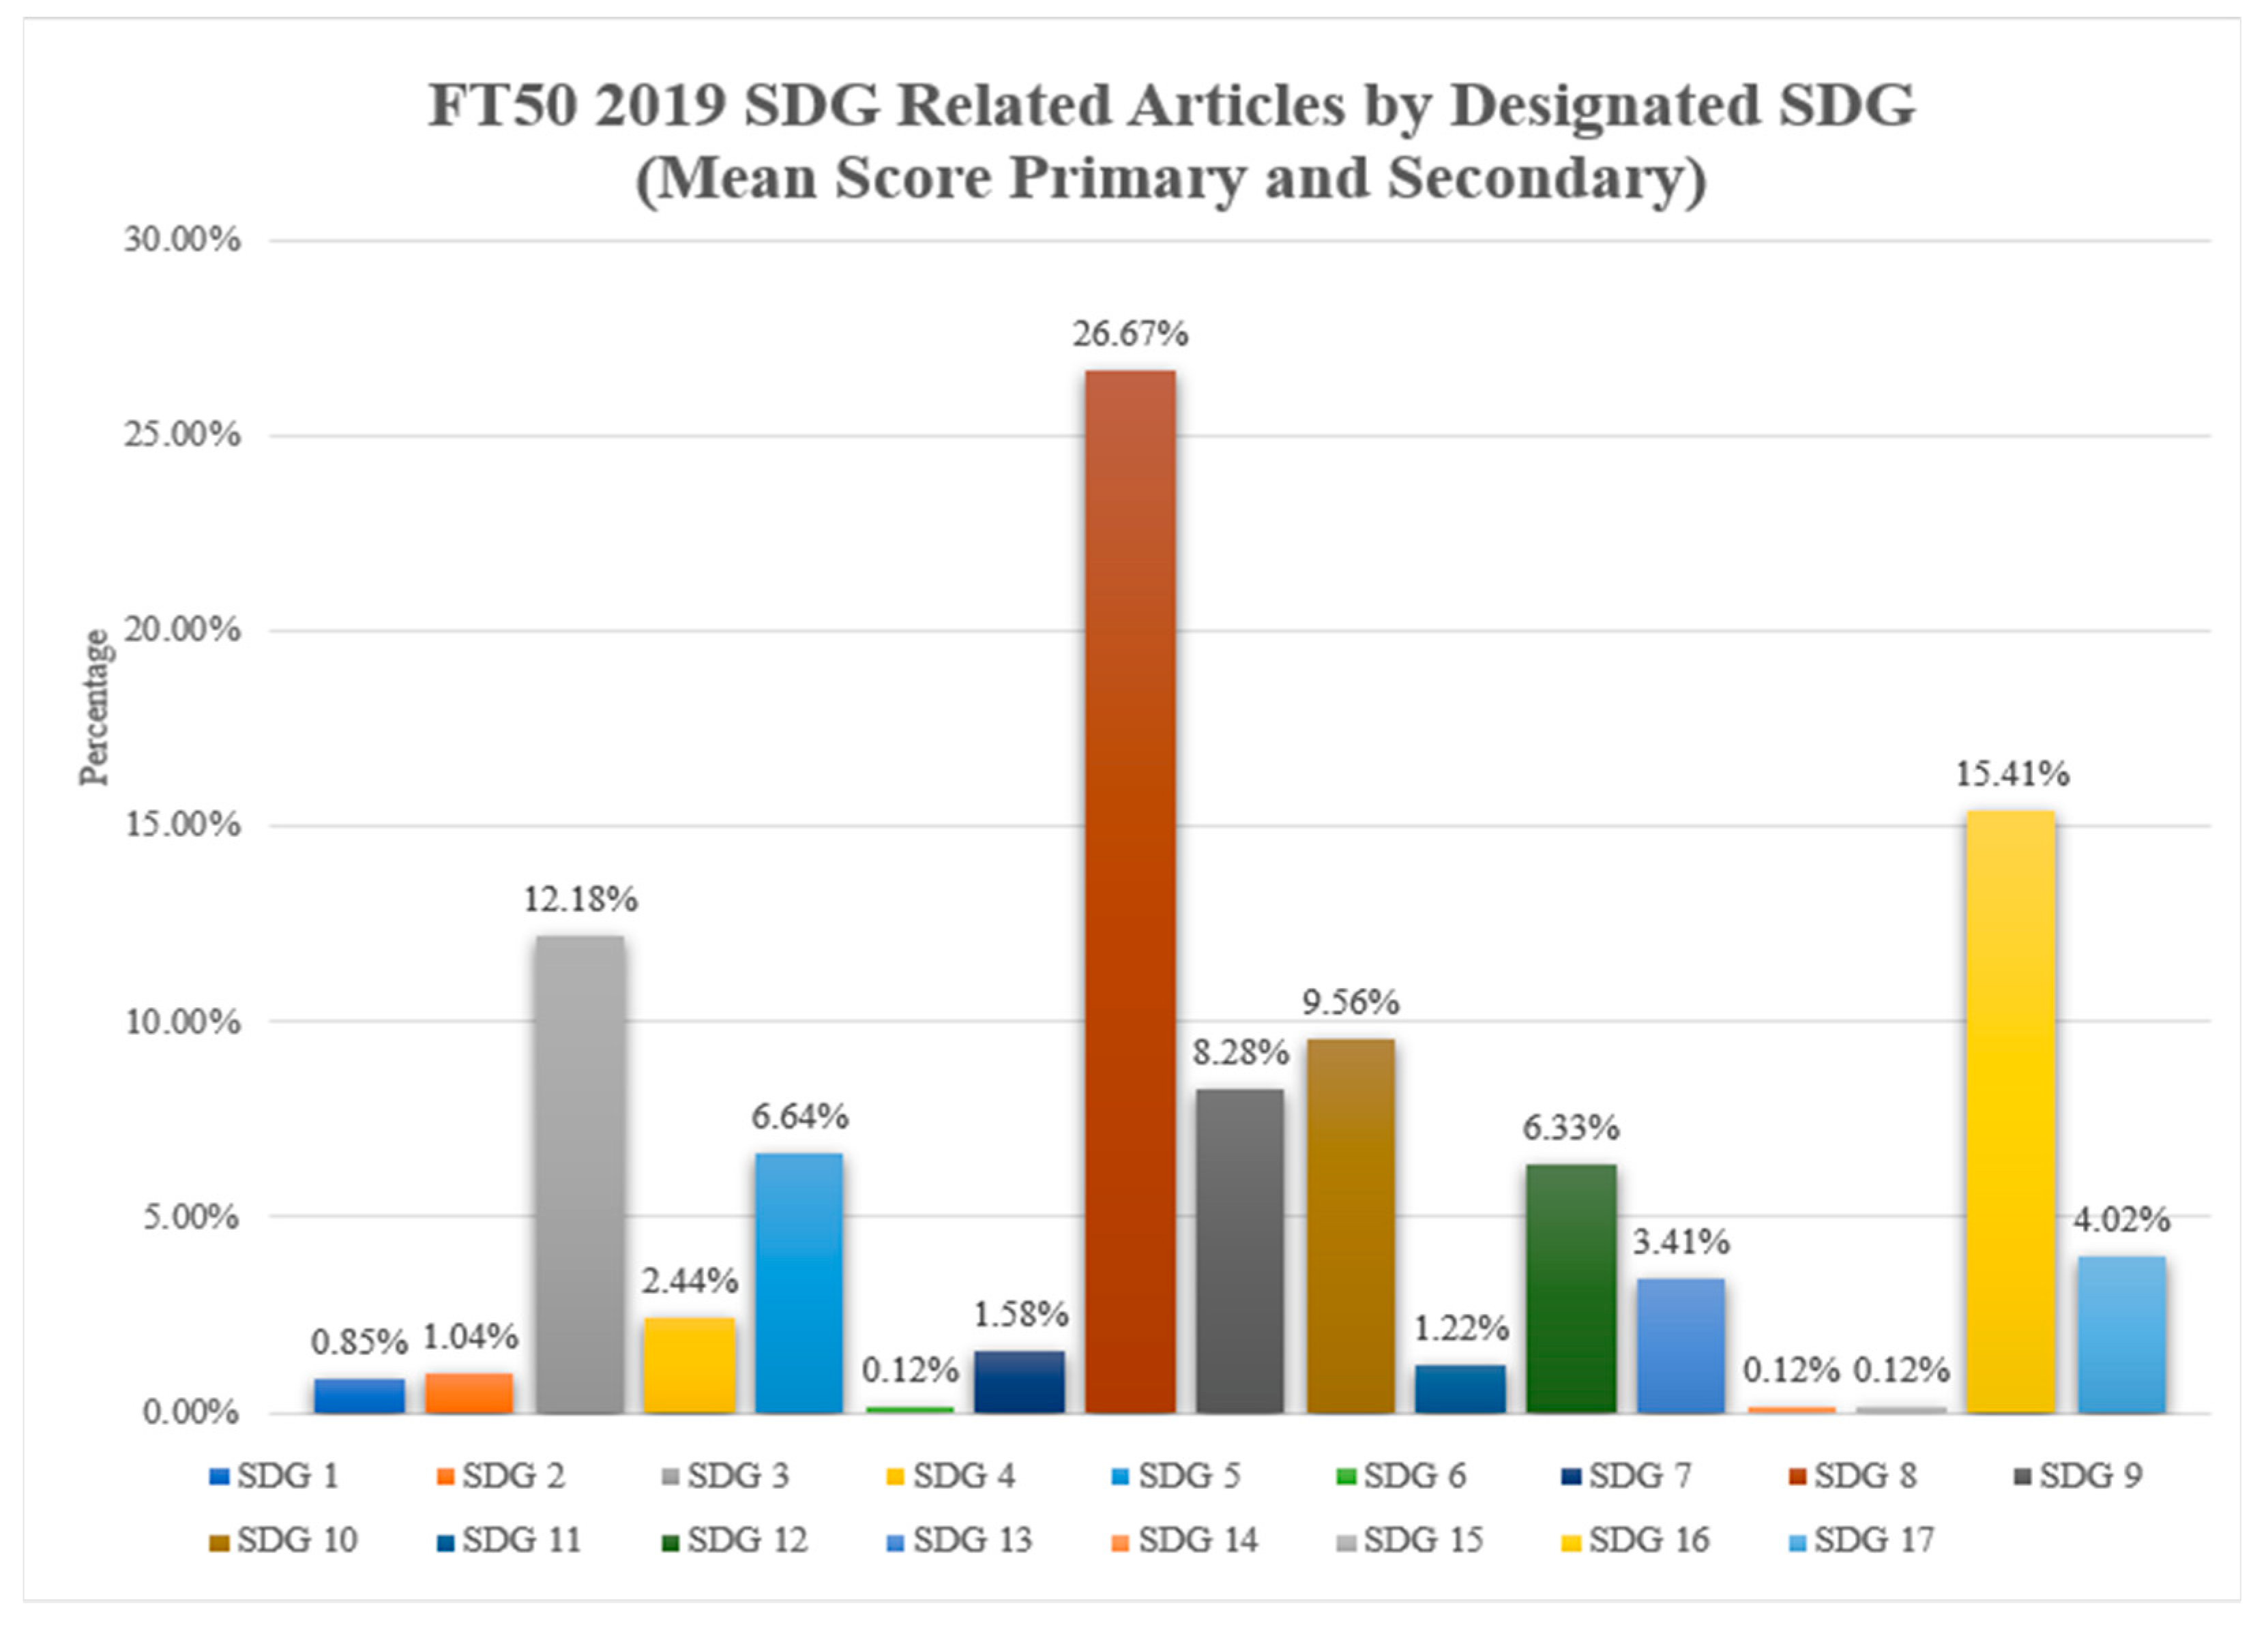
Note: ****, ***,* represent 0.1%, 1%, and 10% level of significance respectively.
Table 4. Article Relatedness by SDG (% of n = 1219).
SDGIdentified as PrimaryIdentified as SecondaryMean Score
SDG 10.7%1.4%0.9%
SDG 21.2%0.5%1.0%
SDG 313.0%9.7%12.2%
SDG 42.3%2.8%2.4%
SDG 57.5%4.0%6.6%
SDG 60.1%0.2%0.1%
SDG 71.4%2.1%1.6%
SDG 828.0%22.9%26.7%
SDG 99.0%6.1%8.3%
SDG 109.4%9.9%9.6%
SDG 111.1%1.7%1.2%
SDG 126.2%6.6%6.3%
SDG 133.1%4.3%3.4%
SDG 140.0%0.5%0.1%
SDG 150.1%0.2%0.1%
SDG 1613.6%20.6%15.4%
SDG 173.2%6.4%4.0%
Table 5. OLS Model R-Squared.
Statistic ValueDegrees of Freedom
Residual Standard Error0.4285on 4500 degrees of freedom
Multiple R20.0716
Adjusted R20.0679
F-Statistic19.29on 18 and 4500 degrees of freedom
p-Value<2.2 × 10⁻¹⁶
AIC5186.81
Table 6. OLS Model Residuals.
Residual Value
Minimum−0.6374
1st Quartile−0.2773
Median−0.1833
3rd Quartile0.4838
Maximum0.9326
Table 7. Logistic Model R-Squared.
Statistic ValueDegrees of Freedom
Null Deviance5269.2on 4518 degrees of freedom
Residual Deviance4947.8on 4500 degrees of freedom
Pseudo R20.06101
p-Value0
AIC4985.8
Table 8. Logistic Model Deviance Residuals.
Deviance Residual Value
Minimum−1.4704
1st Quartile−0.7976
Median−0.6340
3rd Quartile1.1384
Maximum2.1857
Table 9. Logistic Model Coefficients.
Explanatory VariableCoefficient Estimate (β)Standard Error (S.E.)Z-ValueMarginal Effectp-Value (p)Significance
Intercept−0.2572650.212276−1.212N/A0.22554
Qualitative Content0.2063600.0788602.6170.040.00888***
Primary Authorship
 Female0.3623260.0763674.7450.072.09 × 10−6****
 BIPOC0.0324220.0779380.4160.010.67742
U.S. Institution Affiliation−0.1556790.080690−1.929−0.030.05369*
Time to Publication
 0–6 Months0.0455250.1244640.3660.010.71454
 7–12 Months0.1181980.1349620.8760.020.38115
 13–18 Months0.2626780.1589271.6530.050.09837*
 19–24 Months0.0062540.1943490.0320.000.97433
 25+ Months−0.1598050.333286−0.479−0.030.63160
Journal Disciplines
 Economic−0.7197370.183659−3.919−0.128.90 × 10−5****
 Finance and Accounting−1.3732890.187774−7.314−0.202.60 × 10−13****
 Magazine−1.6759160.280316−5.979−0.212.25 × 10−9****
 Management, Human Resources, and Organizations−0.5856680.149672−3.913−0.109.12 × 10−5****
 Marketing and Consumer Behaviour−1.4524030.195707−7.421−0.201.16****
 Operations and Entrepreneurship−0.9637210.171553−5.618−0.151.94 × 10−8****
Data Origin
 North America−0.2035990.102693−1.983−0.040.04741**
 Europe0.0925610.1276480.7250.020.46837
 Asia/Oceania0.0302130.1475630.2050.010.83777
Note: ****, ***, **, * represent 0.1%, 1%, 5%, and 10% level of significance respectively.
Publisher’s Note: MDPI stays neutral with regard to jurisdictional claims in published maps and institutional affiliations.

