
Biodiversity Conservation of National Parks and Nature-Protected Areas in West Africa: The Case of Kainji National Park, Nigeria


1
College of Landscape Architecture, Nanjing Forestry University, Nanjing 210037, China
2
NFU Academy of Chinese Ecological Progress and Forestry Development Studies, Nanjing 210037, China
*
Author to whom correspondence should be addressed.
Sustainability 2022, 14(12), 7322; https://doi.org/10.3390/su14127322
Submission received: 15 May 2022
/
Revised: 2 June 2022
/
Accepted: 6 June 2022
/
Published: 15 June 2022
(This article belongs to the Special Issue GIAHS and Community-Based Conservation in National Parks)
Abstract
:Due to rising global warming and climate change, biodiversity protection has become a critical ecological concern. Rich biodiversity zones are under threat and are deteriorating, necessitating national, regional, and provincial efforts to safeguard these natural areas. The effective conservation of national parks and nature-protected areas help to improve biodiversity conservation, forest, and urban air quality. The continuous encroachment and abuse of these protected areas have degraded the ecosystem over time. While exploring the geophysical ecology and biodiversity conservation of these areas in West Africa, Kainji National Park was selected for this study because of its notable location, naturalness, rich habitat diversity, topographic uniqueness, and landmass. The conservation of national parks and nature-protected areas is a cornerstone of biodiversity conservation globally. This study is aimed at the target United Nations’ Sustainable Development Goal 13, 2030—Climate Action targeted at taking urgent action towards combating climate change and its impacts. The study captures both flora and fauna that are dominant in the study area. The 15 identified tree species were selected from over 30 species with 563,500,000 (an average of 3,700,000 in each sample frame) trees for every tree species/type with a total of 63% tree green canopy cover. The study areas divided into three zones were randomly sampled within a stratum of 25 × 25 km frames divided into 150 sample frames for proper analyses using the i-Tree Eco v6.0.25. It is a United States Department of Agriculture (USDA) Forest Service peer-reviewed application (software) designed which includes tools for urban and rural forestry study and benefits evaluations. The following microclimatic data were captured and analyzed photosynthetically active radiation, rain/precipitation, temperature, transpiration, evaporation, water intercepted by trees, runoff avoided by trees, potential evaporation by trees, and isoprene and monoterpene by trees. This study also further discusses the tree benefits of a green, low carbon, and sustainable environment within the context of biodiversity conservation, considering carbon storage, carbon sequestration, hydrology effects, pollution removal, oxygen production, and volatile organic compounds (VOCs). There is a quick need for remotely-sensed information about the national parks, protected areas and nature reserves at regular intervals, and government policies must be strict against illegal poaching, logging activities, and other hazardous human impacts.
1. Introduction
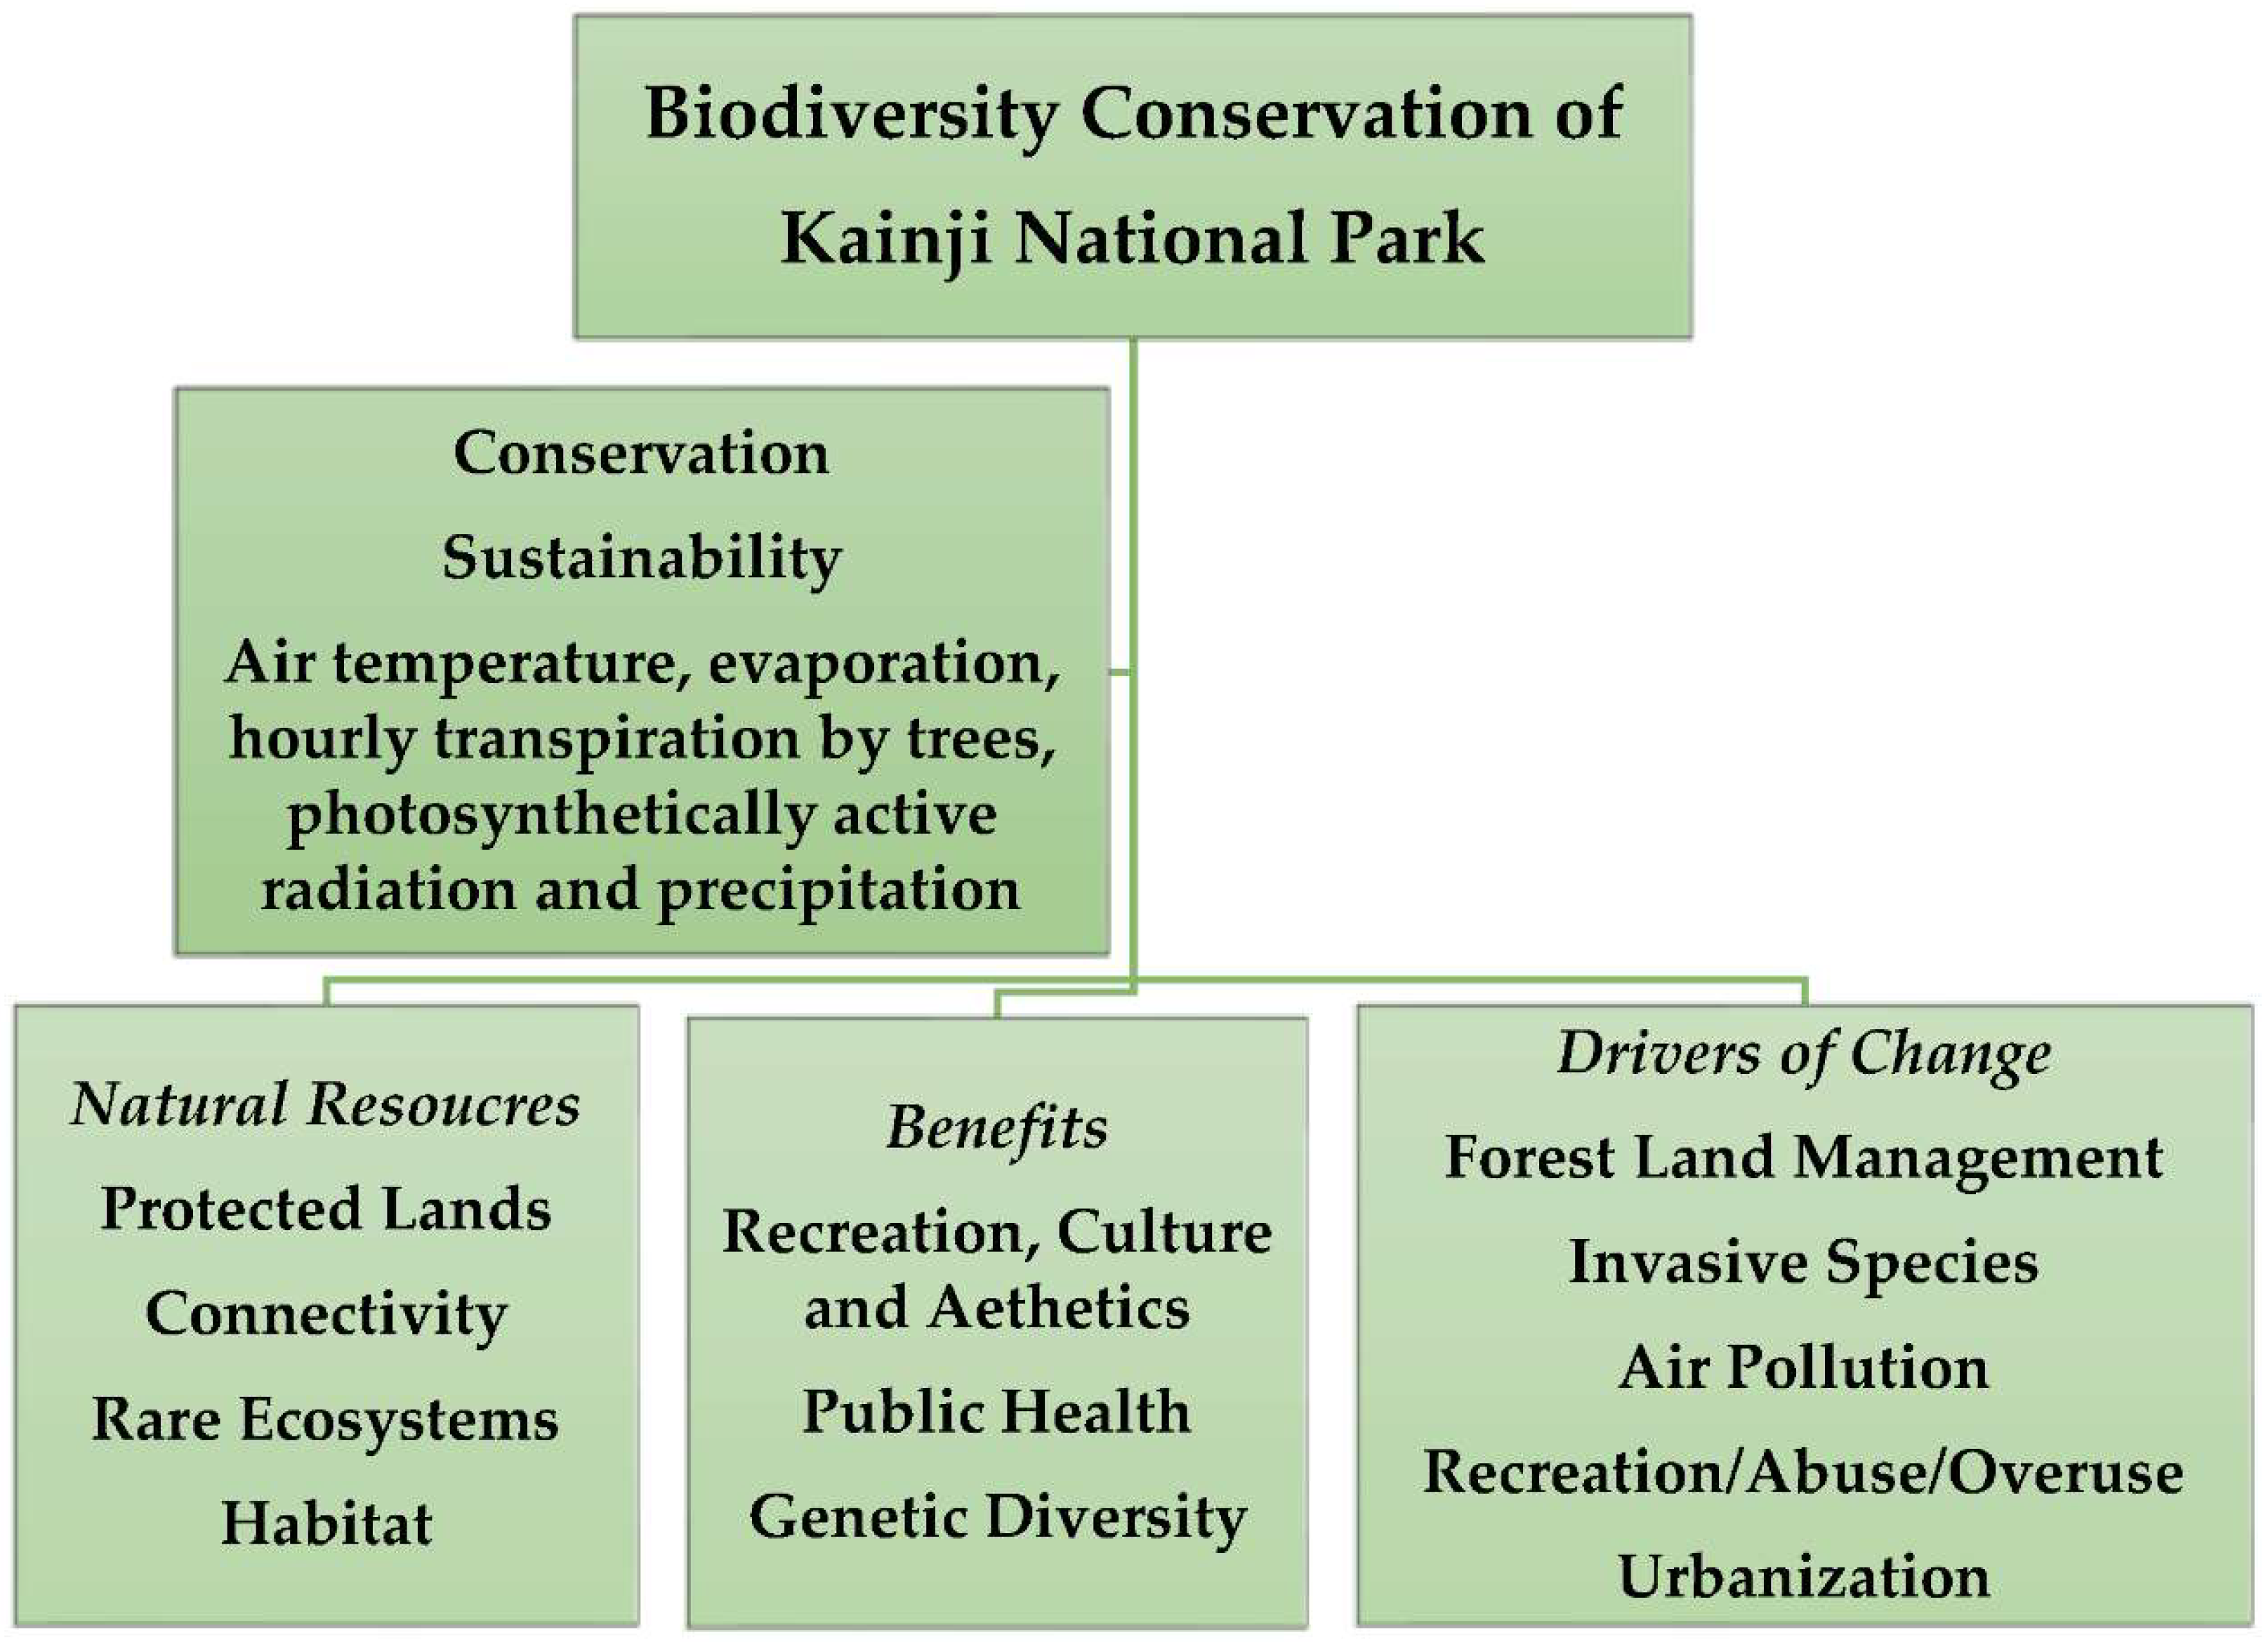
Biological richness is considered “the variability among living species from all sources, including terrestrial, marine, and other aquatic habitats, as well as the ecological complexes of which they are a part” [1]. The convention’s main goals are to conserve biodiversity, ensure the long-term viability of biodiversity components, and ensure equality in the allocation of genetic natural resources. Natural resources, public benefits, and environmental drivers of change are three components of biodiversity protection, as defined by the United States Environmental Protection Agency [2], and depicted in Figure 1. In this context, as part of its policy, the Federal Ministry of Environment is taking a huge step toward accomplishing wildlife protection in Nigeria’s national parks and protected regions, which is in line with the United Nations’ Sustainable Development Goals 2030.
Most nature reserves are places set aside and managed for wildlife and natural resource conservation [1,3]. They are diversely rich in flora and fauna in great numbers, and they all assist the ecology in some way [3]. Each West African country’s government has institutions responsible for monitoring, patrolling, and controlling illegal poaching operations in these protected areas, as well as enforcing applicable international treaties and conventions to which all West African nations are signatories. Protecting life support systems such as watersheds and water catchment regions is one of the advantages of protected areas and national parks.
Due to the obvious significant potential for research development, most research institutions in agriculture, health, and bioorganic technology are located near or in some of these locations. The link between national security and national parks (protected areas) is one of the governments’ concerns [4]. National parks and protected regions are vital to every country’s national security [5]. Unfortunately, the majority of state-owned forest reserves have now become hotbeds of criminal activity [6].
As a result, the formation of these national parks would offer the much-needed apparatus to fend off criminal elements in the country’s present struggle against the terrorist insurgency, bandit armies who most times hide in these reserved forests, and other organized crime, such as poaching, cattle rustling, and illegal logging, amongst others.
With the existing approach to natural resource management by the federal government, most states and municipal governments have outgrown the magnitude of strain on natural resources. Extension services on forestry and biodiversity-related issues have been ineffective in most Sub-Saharan African nations, particularly Nigeria (West Africa sub-region), leaving natural resource governance and biodiversity conservation in shambles, with a high deterioration of its infrastructure without any ecological benefit.
2. Literature Review: Biodiversity, Protected Areas, and National Parks
According to Conservation International [1], the value of biodiversity in Sub-Saharan Africa (SSA) is well understood. The West African forest environment is also home to two of Africa’s great apes, including a tiny population of western lowland gorillas near the Nigeria–Cameroon border, and remnant dispersed groups of endangered western chimpanzees [1]. A population of about 7500 African elephants lives in West African countries, yet many of them live in northern savanna environments outside of forest ecosystems [7]. The Upper Guinean forest ecosystem in West Africa, on the other hand, is one of the world’s most critically fragmented ecosystems in Africa [8].
The International Union for Conservation of Nature (IUCN) classified the Kainji National Park as a National Park in the second category II [9,10,11]. In terms of size and the primary goal of safeguarding functioning ecosystems, the National Park is comparable to a wilderness region. National parks, on the other hand, are more tolerant of human visitation and the infrastructure that supports it. National parks are administered in such a way that they may help local economies by fostering educational and recreational tourism on a scale that does not jeopardize conservation efforts [2,12,13]. Significant sections of a national park may be used for recreational or non-recreational purposes, but they should nevertheless operate as a shield for the protection of the protected area’s native (indigenous) species and communities so that they can thrive in the long run. In a system devised by the organization, IUCN protected area management categories are used to classify national parks and nature-protected areas [14]. The Aichi Targets, “Living in Harmony with Nature”, and the UN Decade of Biodiversity’s Strategic Plan for Biodiversity 2011–2020 were examined in this study.
Biological variety, according to Ortiz, and Newbold et al. [15,16], underlies the functioning of ecosystems and the provision of ecosystem services critical to human well-being. It ensures food security, human health, and access to clean air and water; it supports local livelihoods and economic growth, and it is critical to achieving the goals. It is also a big part of a lot of people’s belief systems, worldviews, and identities. Biodiversity, despite its critical value, continues to be lost. In 2010, the Parties to the Convention on Biological Diversity approved the Strategic Plan for Biodiversity 2011–2020 in Nagoya, Japan, to encourage broad-based action in support of biodiversity by all governments and stakeholders during the following decade [17,18,19]. The United Nations General Assembly also named 2011–2020 as the United Nations Decade on Biodiversity, recognizing the urgent need for action. The Biodiversity Strategic Plan 2011–2020 is a ten-year framework for action by all governments and partners to conserve biodiversity and maximize its benefits to people [20,21,22,23]. However, the proposed frameworks were not actualized due to political, religious, traditional, and economic reasons peculiar to some developing countries in Africa and around the world, hence the need for a prompt review.
The Study Area: Kainji National Park, Nigeria (West Africa)
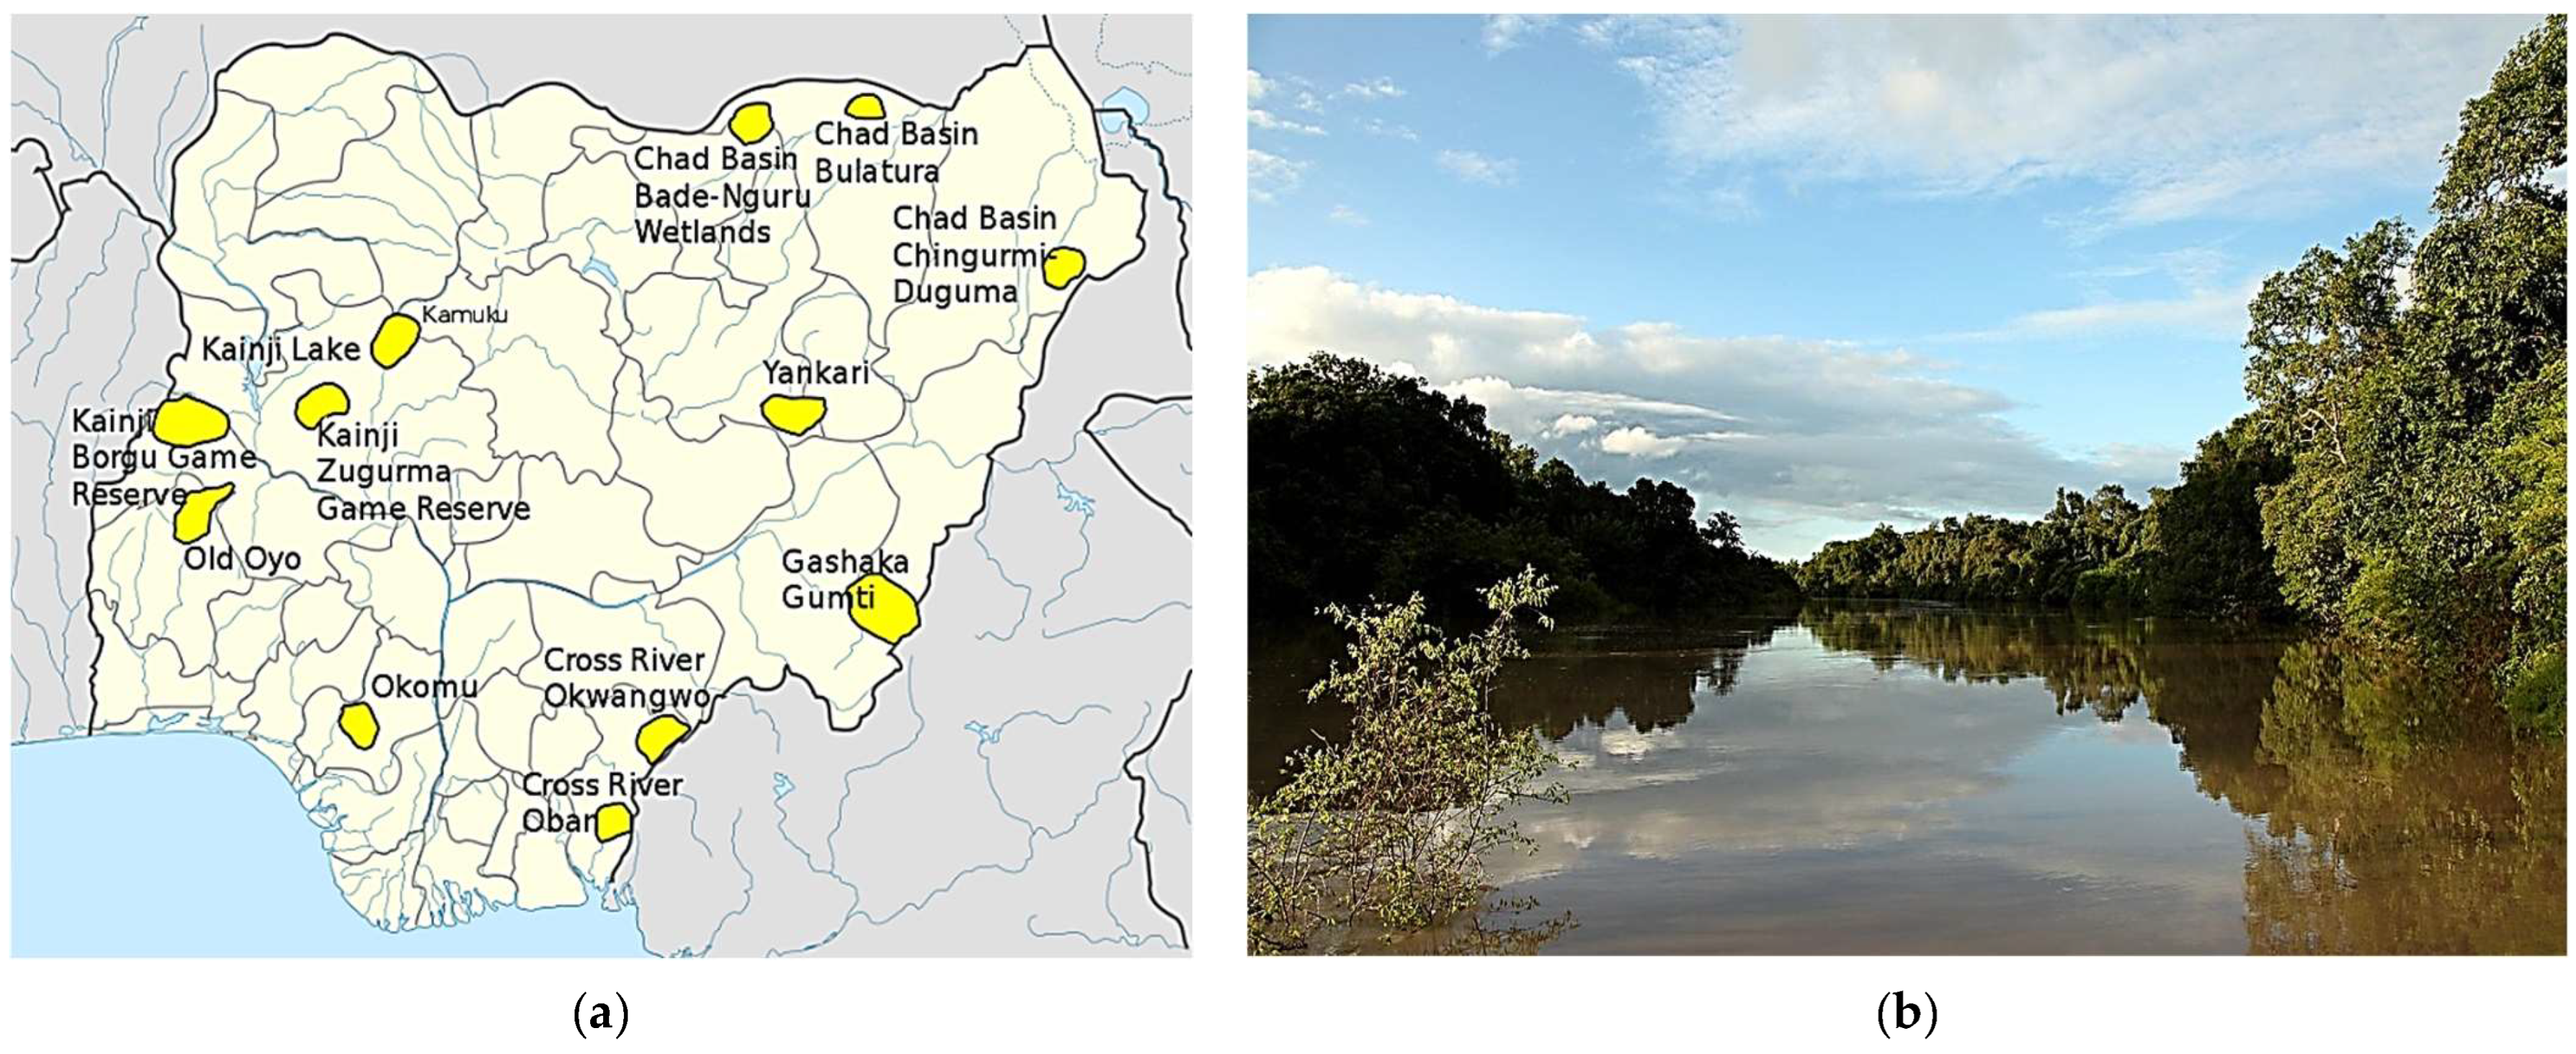
Geographically located in both Kwara and Niger States (Provinces) of Nigeria, the Kainji National Park was given recognition in 1978, covering a land area of 5341 km2 [21,22]. There are 18 national parks and nature-protected areas in Nigeria, the first eight are already recognized, while the remaining ten are yet to be given national recognition. It is divided into three distinct zones/sectors: the Kainji Lake Area, the Borgu Game Reserve in the western area of the lake, and the Zugurma Game Reserve close to the South East of the lake. The Nigerian government, through an agency known as the Federal National Park Service (FNPS) and a second agency known as the Nigeria National Park Service (NNPS), manage and fund the park, while preserving, enhancing, protecting, and managing vegetation and wild animals in the national parks, since the Federal Government gave it special recognition in 2005. It was then considered a Lion Conservation Unit [21,22,23]. There are laws and policies already in place that have been enforced, and actions were taken against poaching and unscrupulous human activities, which can be pursued under national reserves and parks law [24]. In line with the microclimatic location of the study site, the area is mostly savanna forest, which is comprised mainly of the Borgu Game Reserve, which has a land area of 3929 km2; the smallest amongst the game reserves is the Zugurma Game Reserve, with a size of 1370 km2. A 136 km long lake separating the two main parts of the park is the Kainji Lake (see Figure 2b), connecting the two reserves with a rich green corridor, accessible with locally made canoes and boats. The geographical location of this nature-protected area is not yet attractive to the general public for tourism, due to its poor location and security challenges. The tourism sector under the Nigerian Tourism Development Corporation in this park is very limited because the location is just evolving into an urban settlement, mostly residential buildings.
The dominant fauna is comprised of over 70 mammal species, over 400 species of birds, and 40 species of reptiles and amphibians that have been recorded in the park. These include the following wildlife: elephant, African manatee, antelope, hippopotamus, African wild dog, honey badger, Senegal bushbaby, monkey, and African clawless otter. There are lots of reptiles, such as the Nile crocodile, West African slender-snouted crocodile, turtle species, Nile monitor, Savanna monitor, lizards, snakes, baboons, suikers, hyenas, and roan antelopes. Numerous species of amphibians (15 amphibian species) were spotted, as well as fish (90 species). The reptiles, amphibians, and fish are commonly spotted in the Lake Kainji zone. Assessing the form, function, and value of an urban forest may help guide management decisions that benefit human health and the environment.
3. Methods: The Study Area Protocol
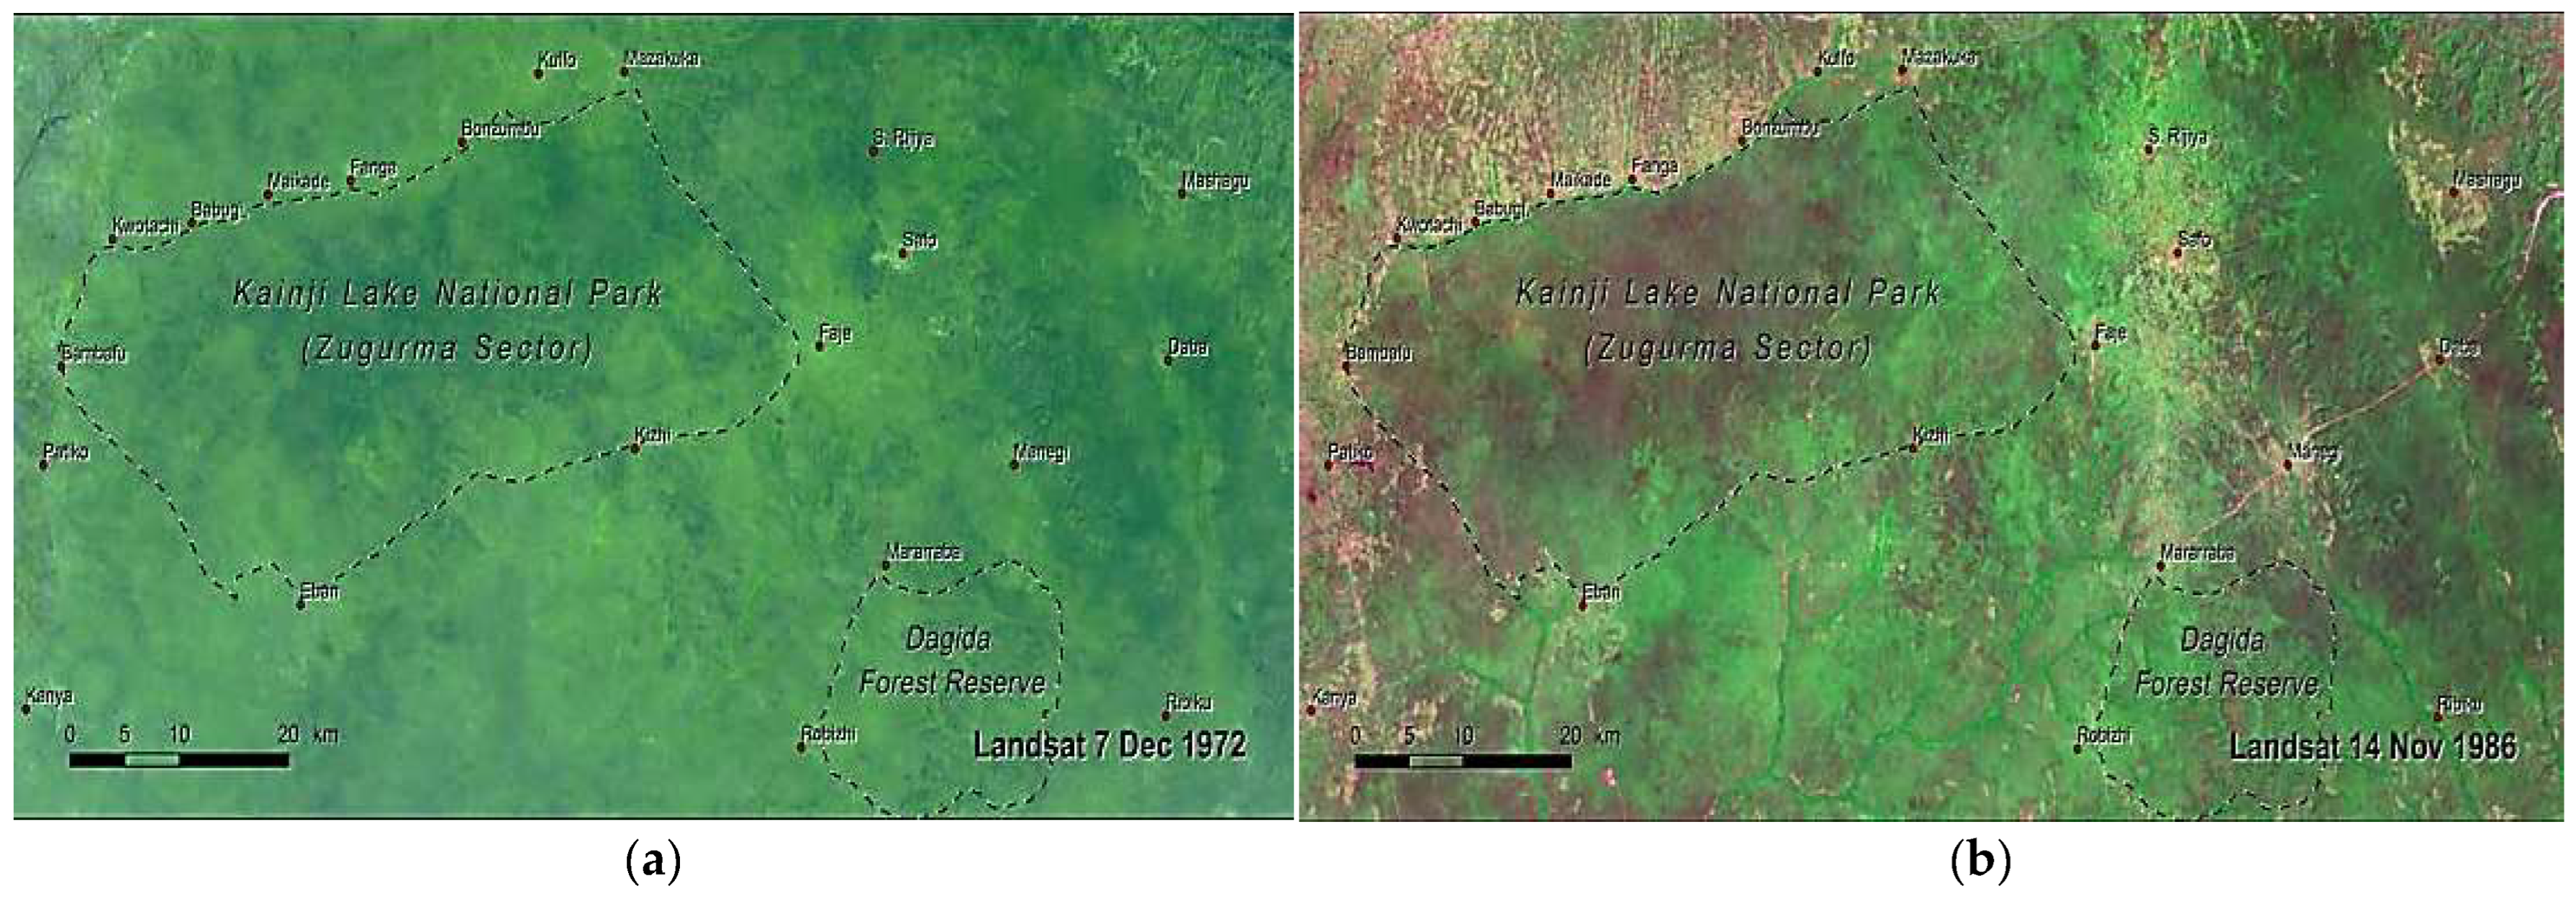
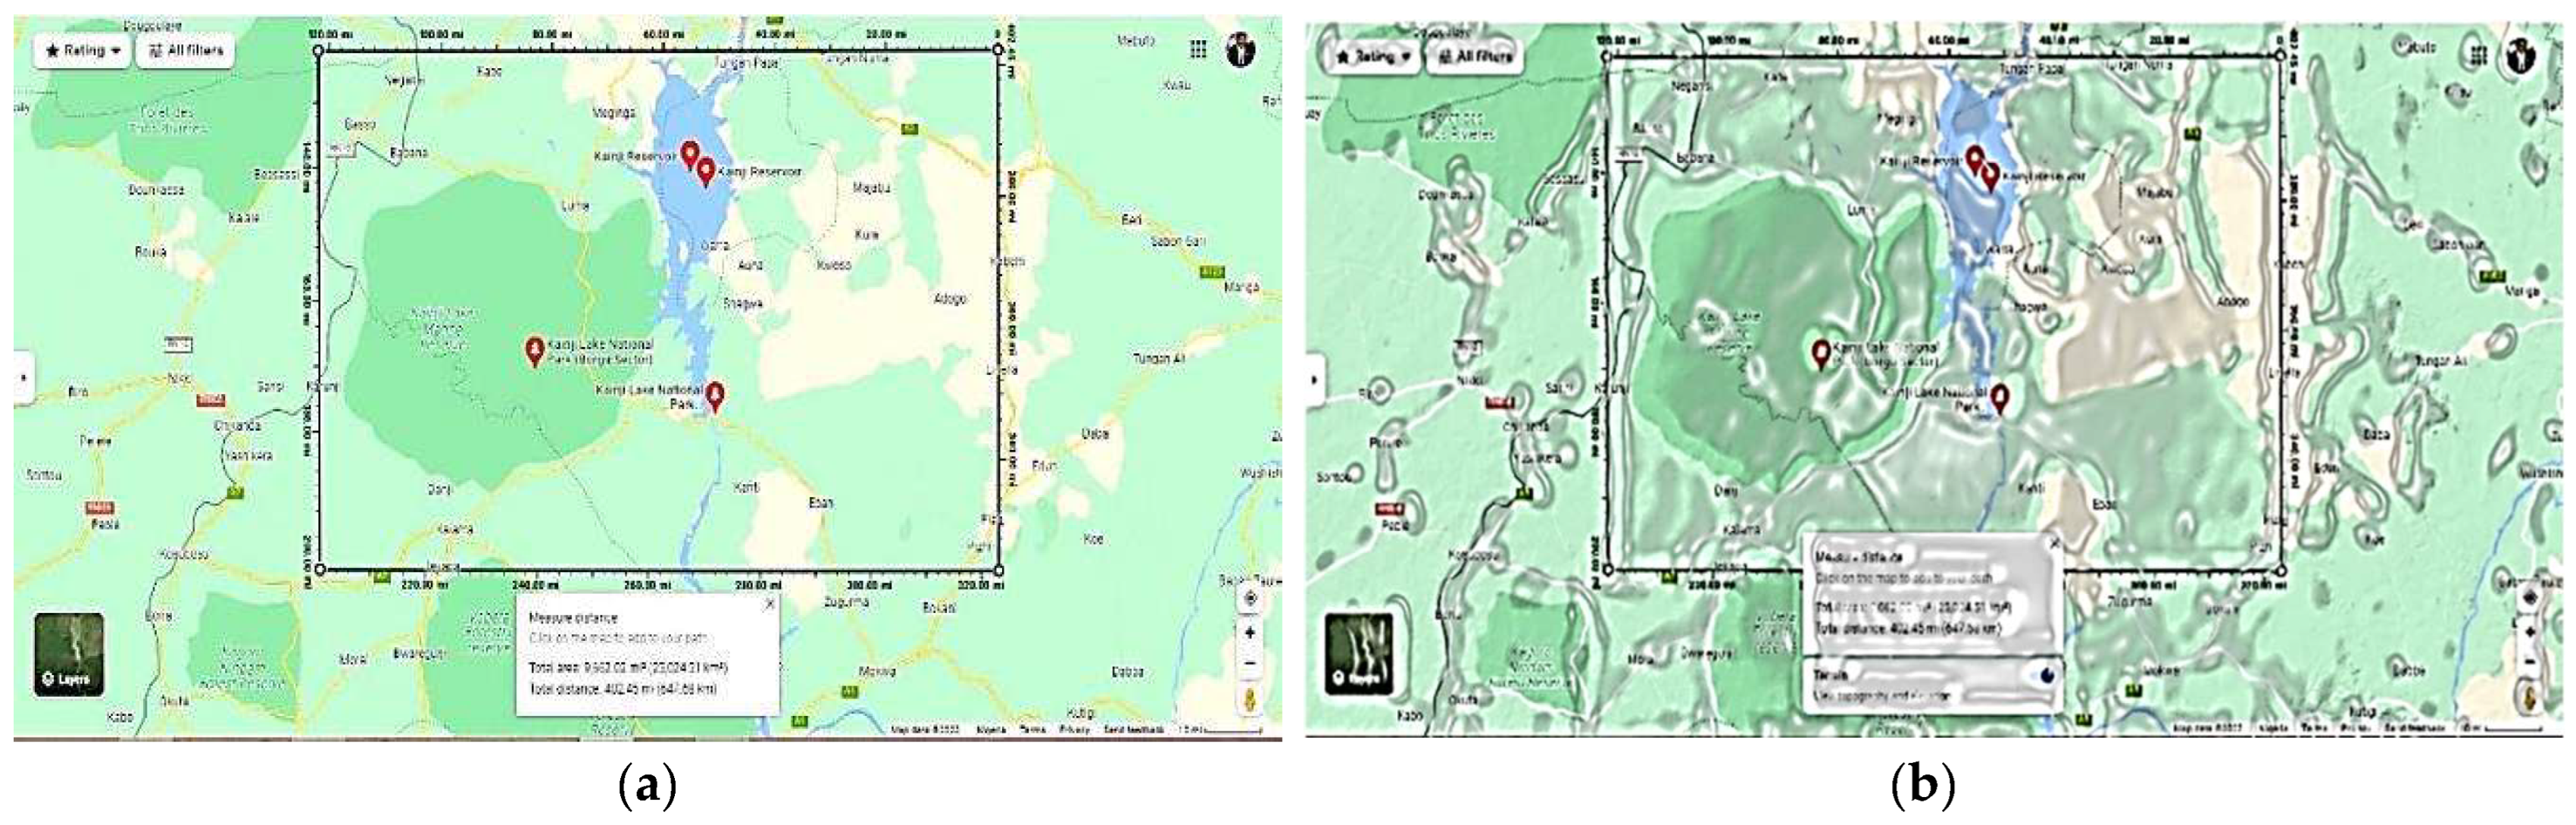
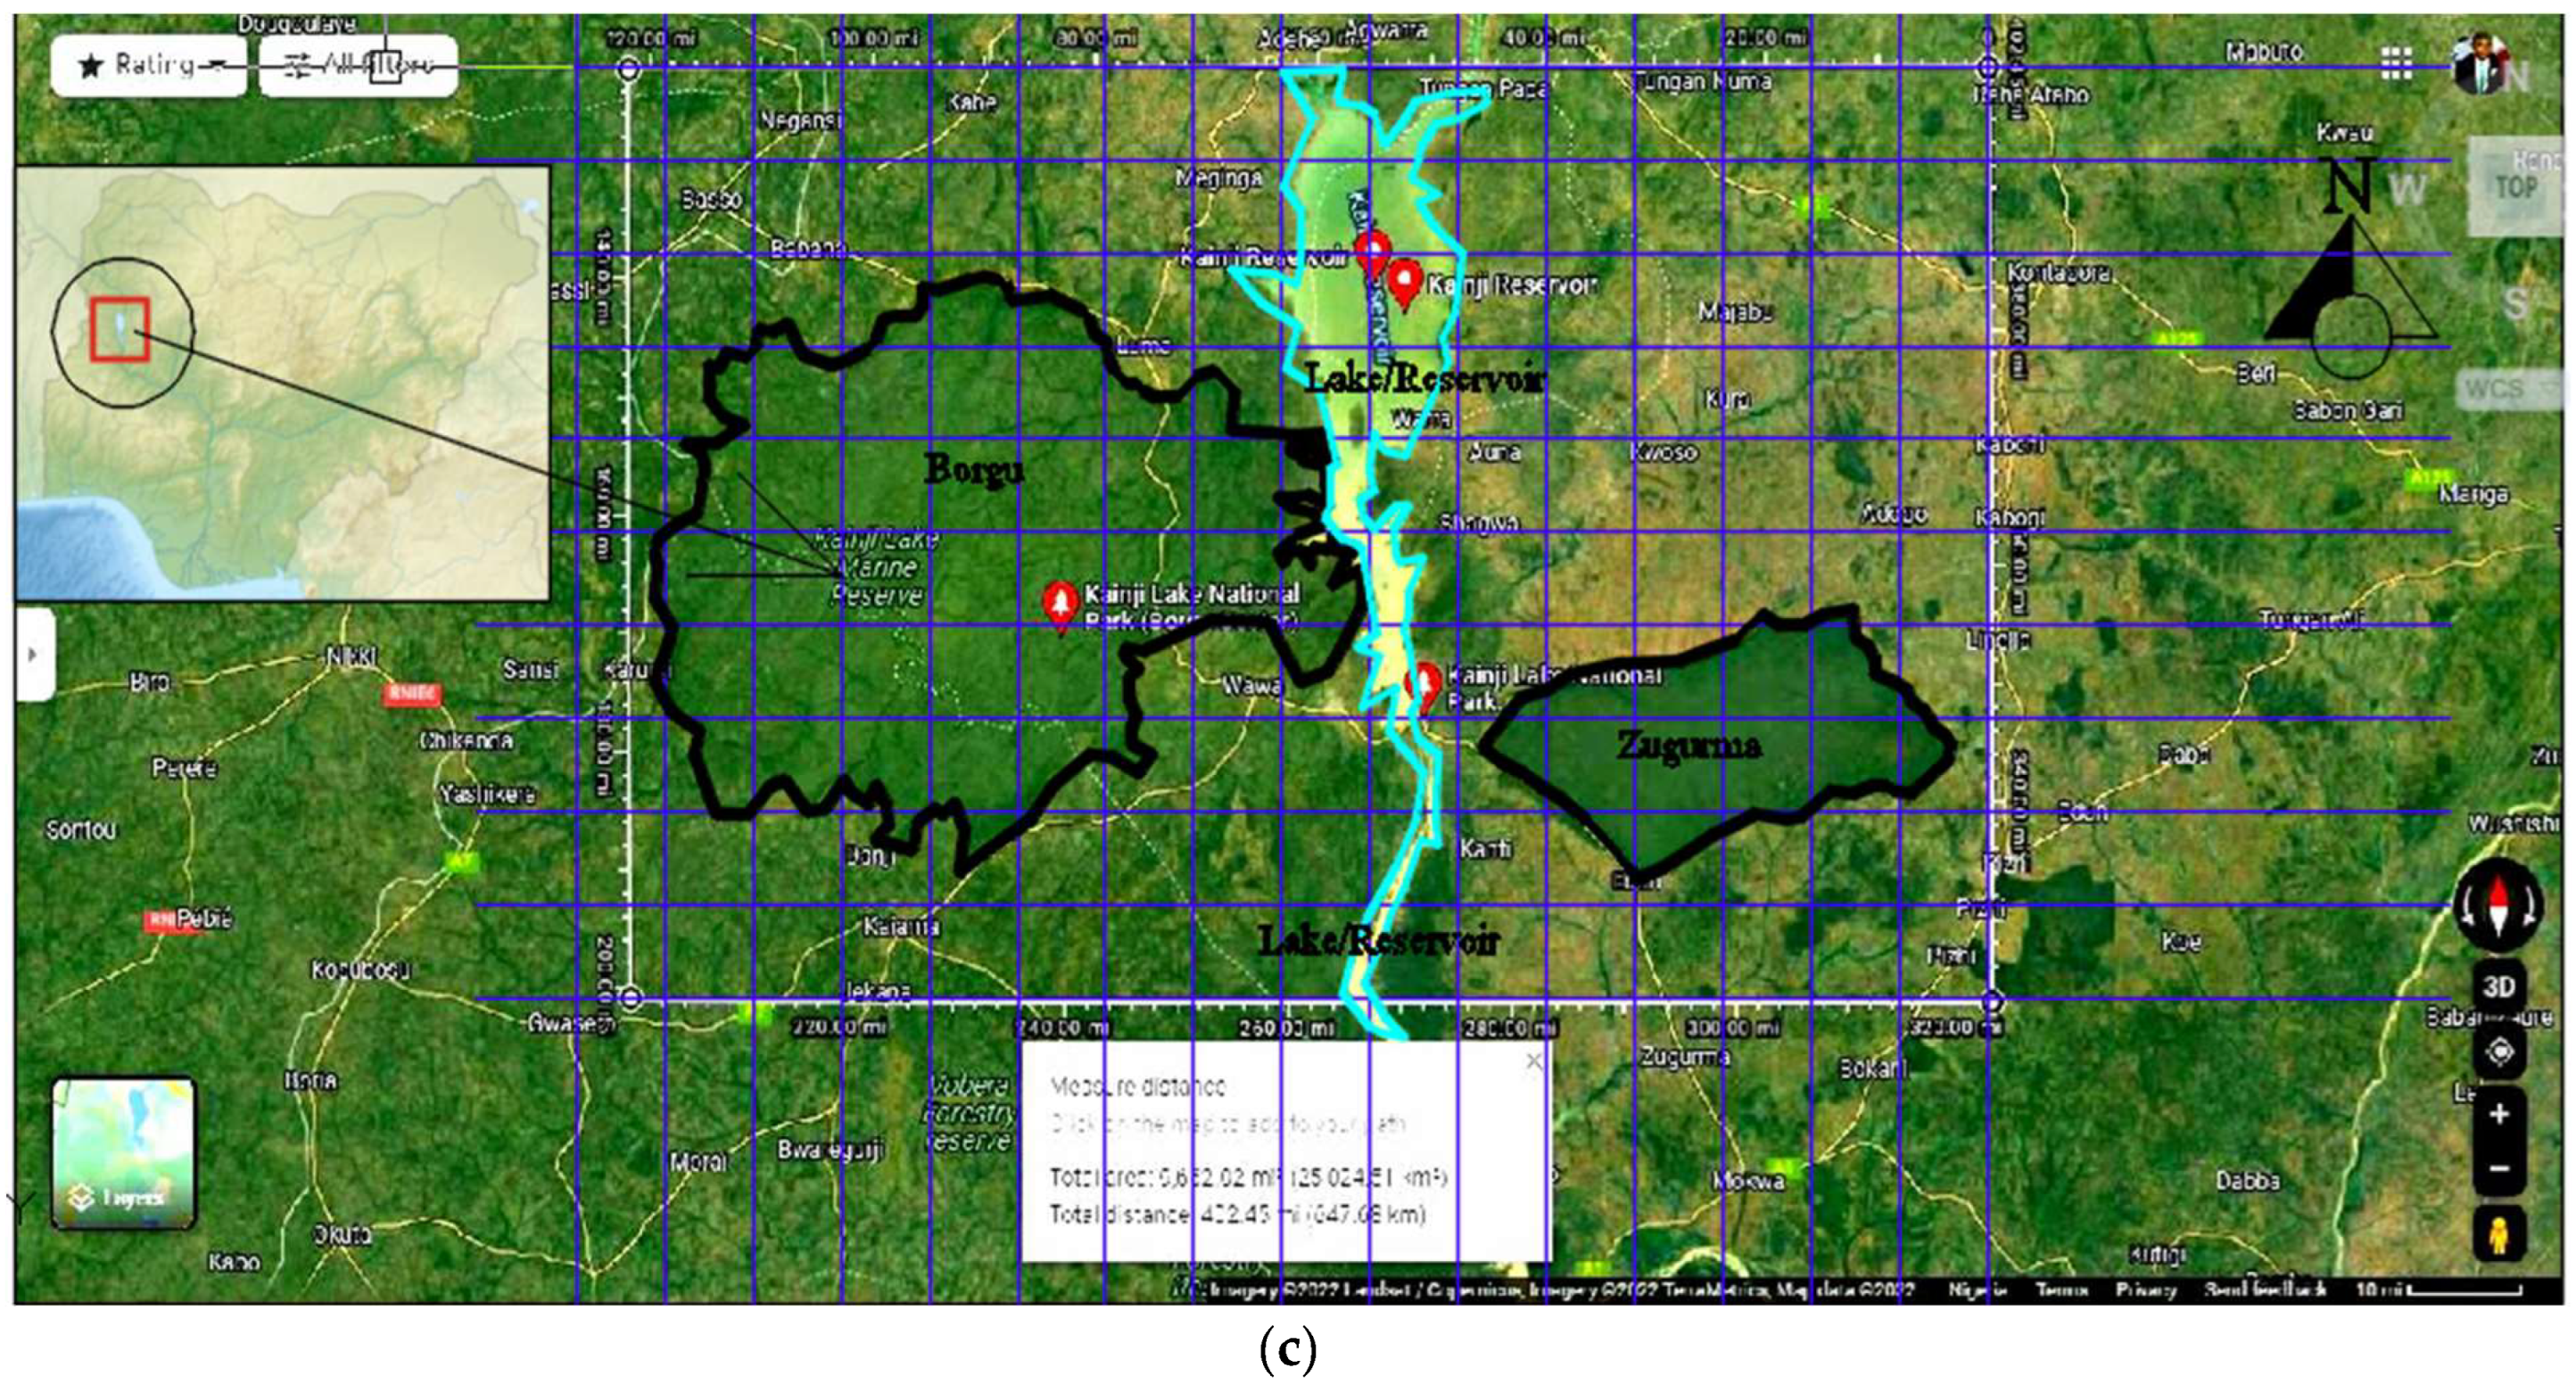
The remotely sensed imageries were used for assessment of the perpetual landuse changes that occurred in the past five decades The Landsat imageries obtained from 1972, 1986, 2015, and 2022 show the dramatic transformation in the area surrounding this protected area. The three geographical zones are Borgu zone, Zugurma zone, and Kainji Lake/Reservoir zone. The study area covers a total length distance of 196.75 km (122.26 mi), a total breadth distance of 118.57 km (73.67 mi), and a total area of 25,024.51 km2 (9662.02 mi2). The three zones are found in the following geographical coordinates: Borgu—10°02′15.7″ N 4°02′24.0″ E, Zugurma—9°51′40.3″ N 4°55′23.6″ E, and the third and final zone, Kainji Lake/Reservoir—10°20′15.9″ N 4°34′57.0″ E.
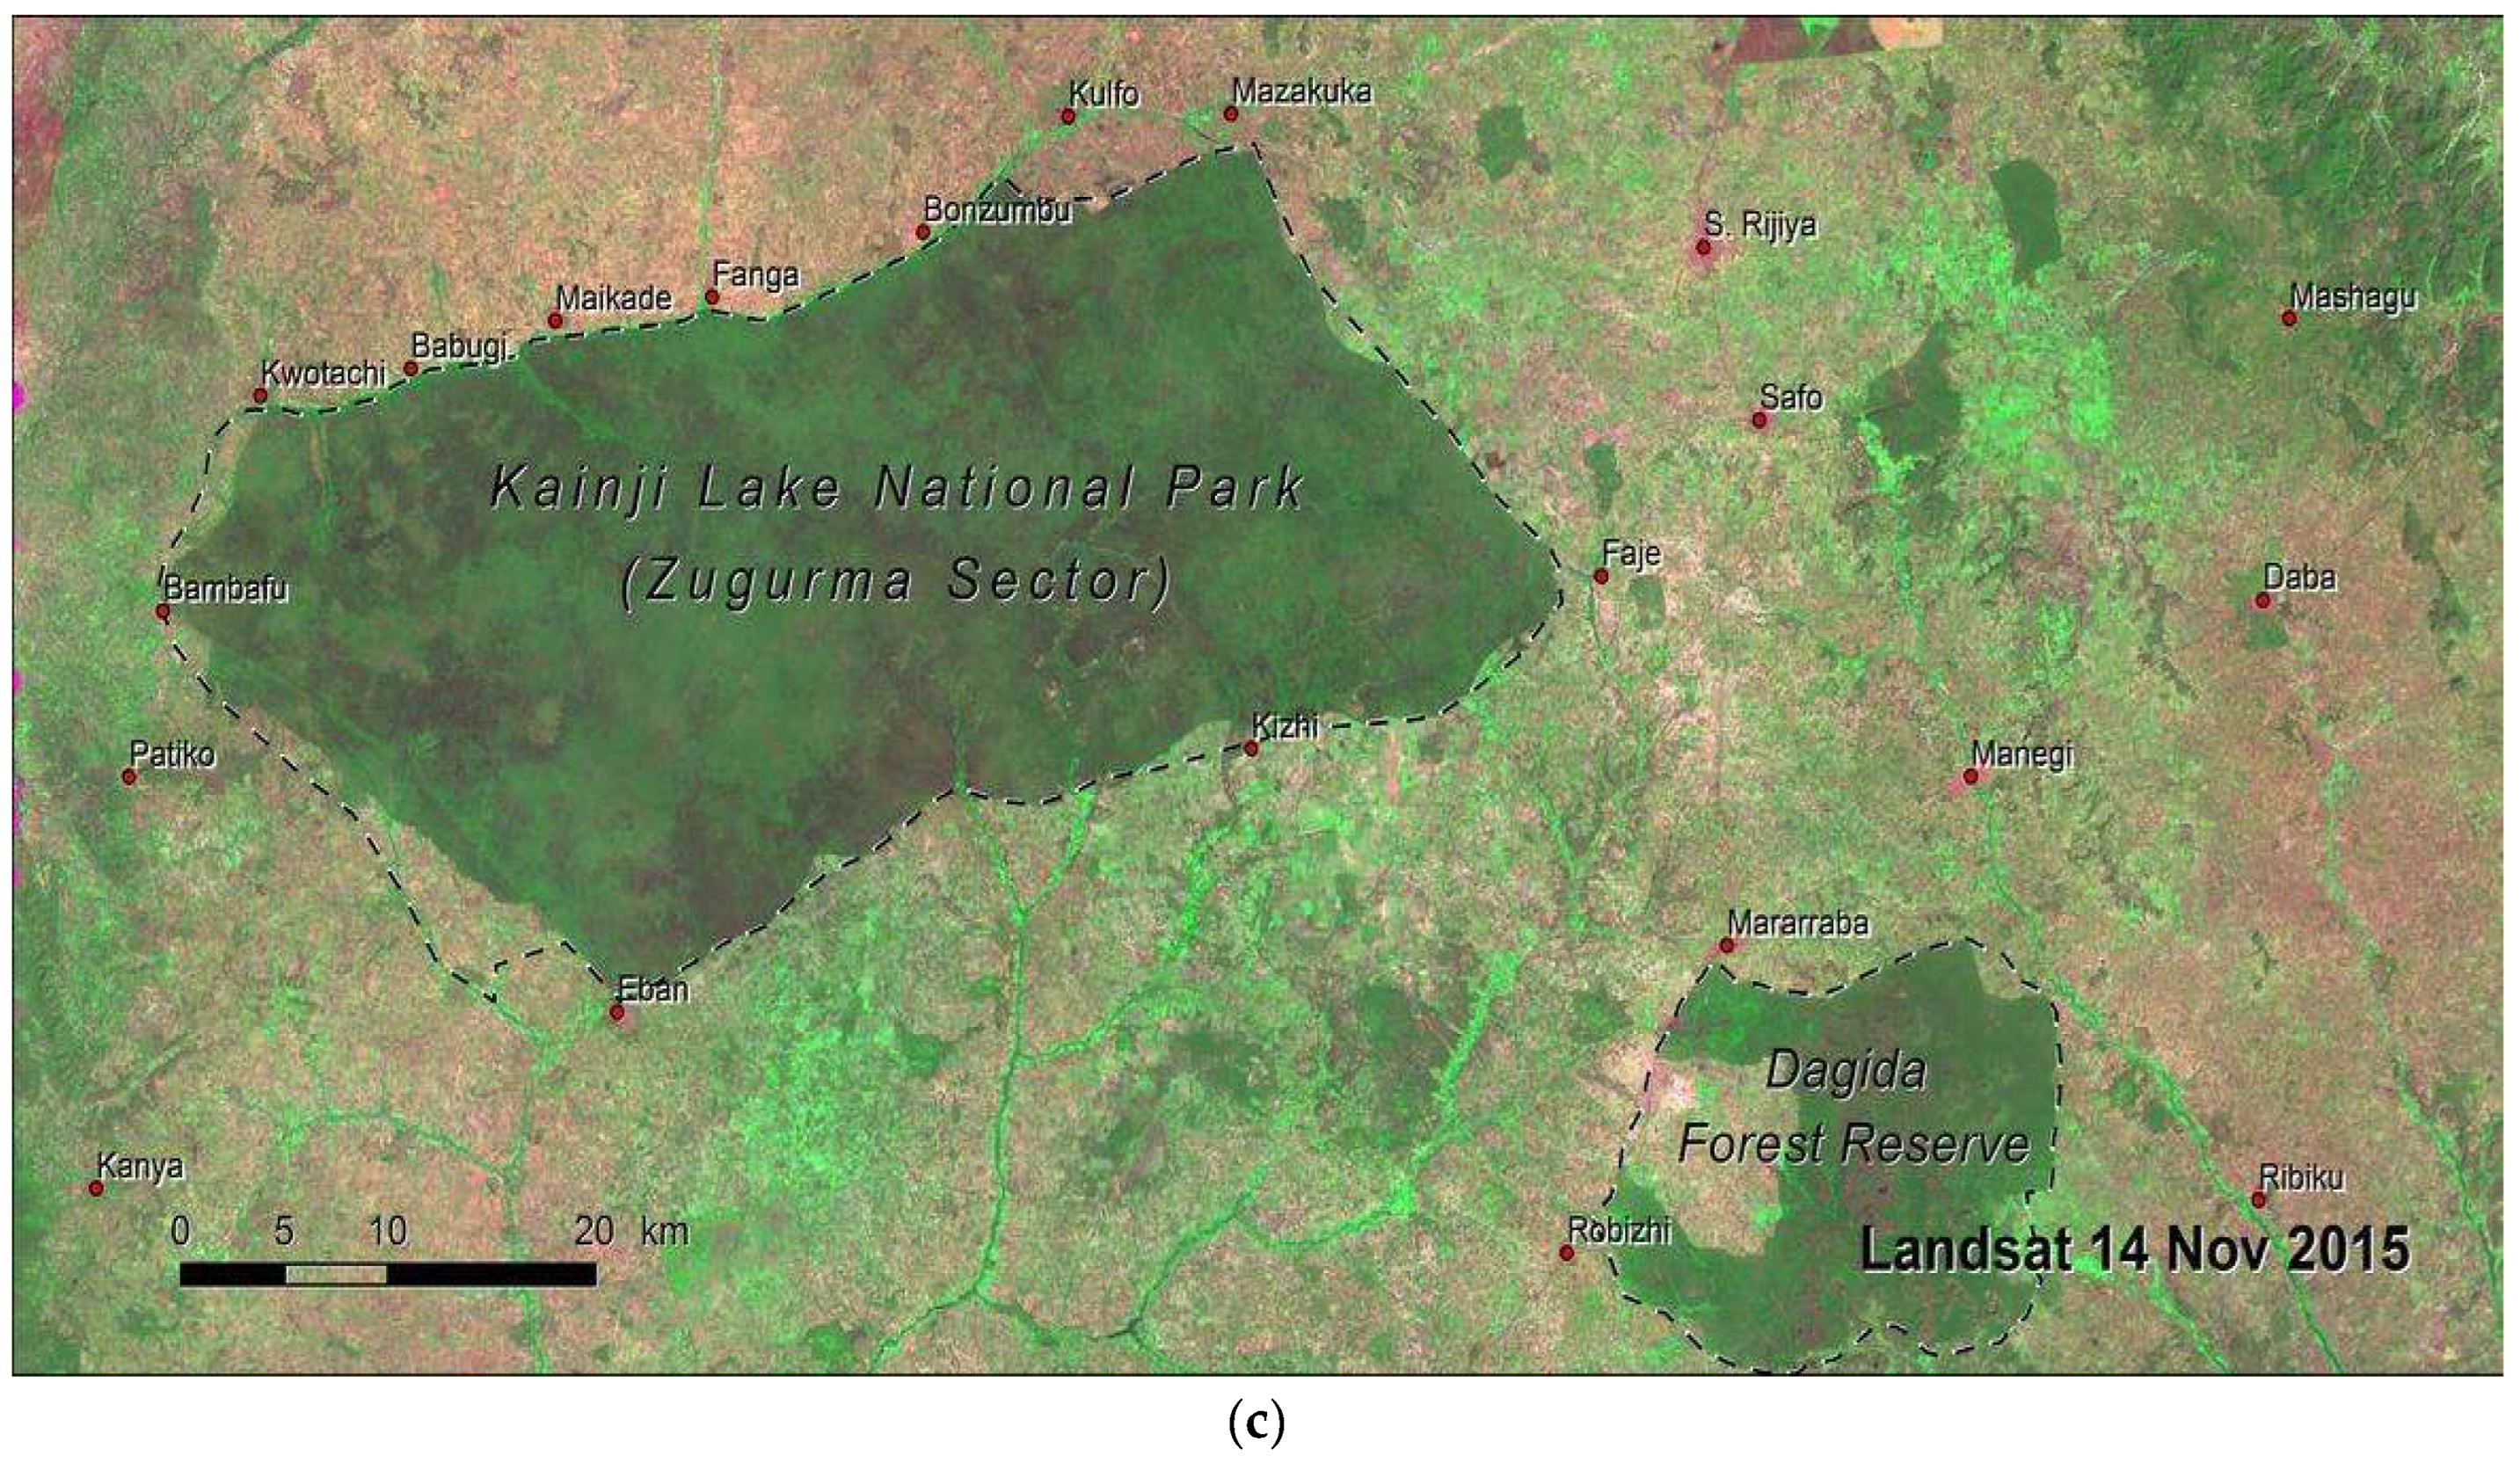
The transformation witnessed by the study area in the past five decades is enormous. The green area is gradually shifting from the wooded savanna into farmland and into the brown patches, which are the present human settlements (see Figure 3a–c). This study presents novel results and analyses connecting the tree species and their microclimatic effects, considering: the photosynthetically active radiation, rain/precipitation, temperature, transpiration, evaporation, water intercepted by trees, runoff avoided by trees, potential evaporation by trees, and isoprene and monoterpene by trees, which revolves around the relationship between the flora (tree species) and fauna of the study site, and the predominant biodiversity and land use. The rapid expansion of agriculture in this formerly semi-natural area can be understood in the context of changing land use, continuous agricultural purposes and forestry trades, which has grown the Nigerian economy through the increase in food production, wood, and non-wood forest products.
Data Collection
A random sampling strategy, consisting of random sample frames stratified stratum and all these strati, are situated in a common ecoregion. These ecological areas have similar biophysical and environmental situations. This helps to ascertain the framework for effective research, inventory, and management of natural resources, capturing both flora and fauna (biota analysis) that are dominant in the study area.
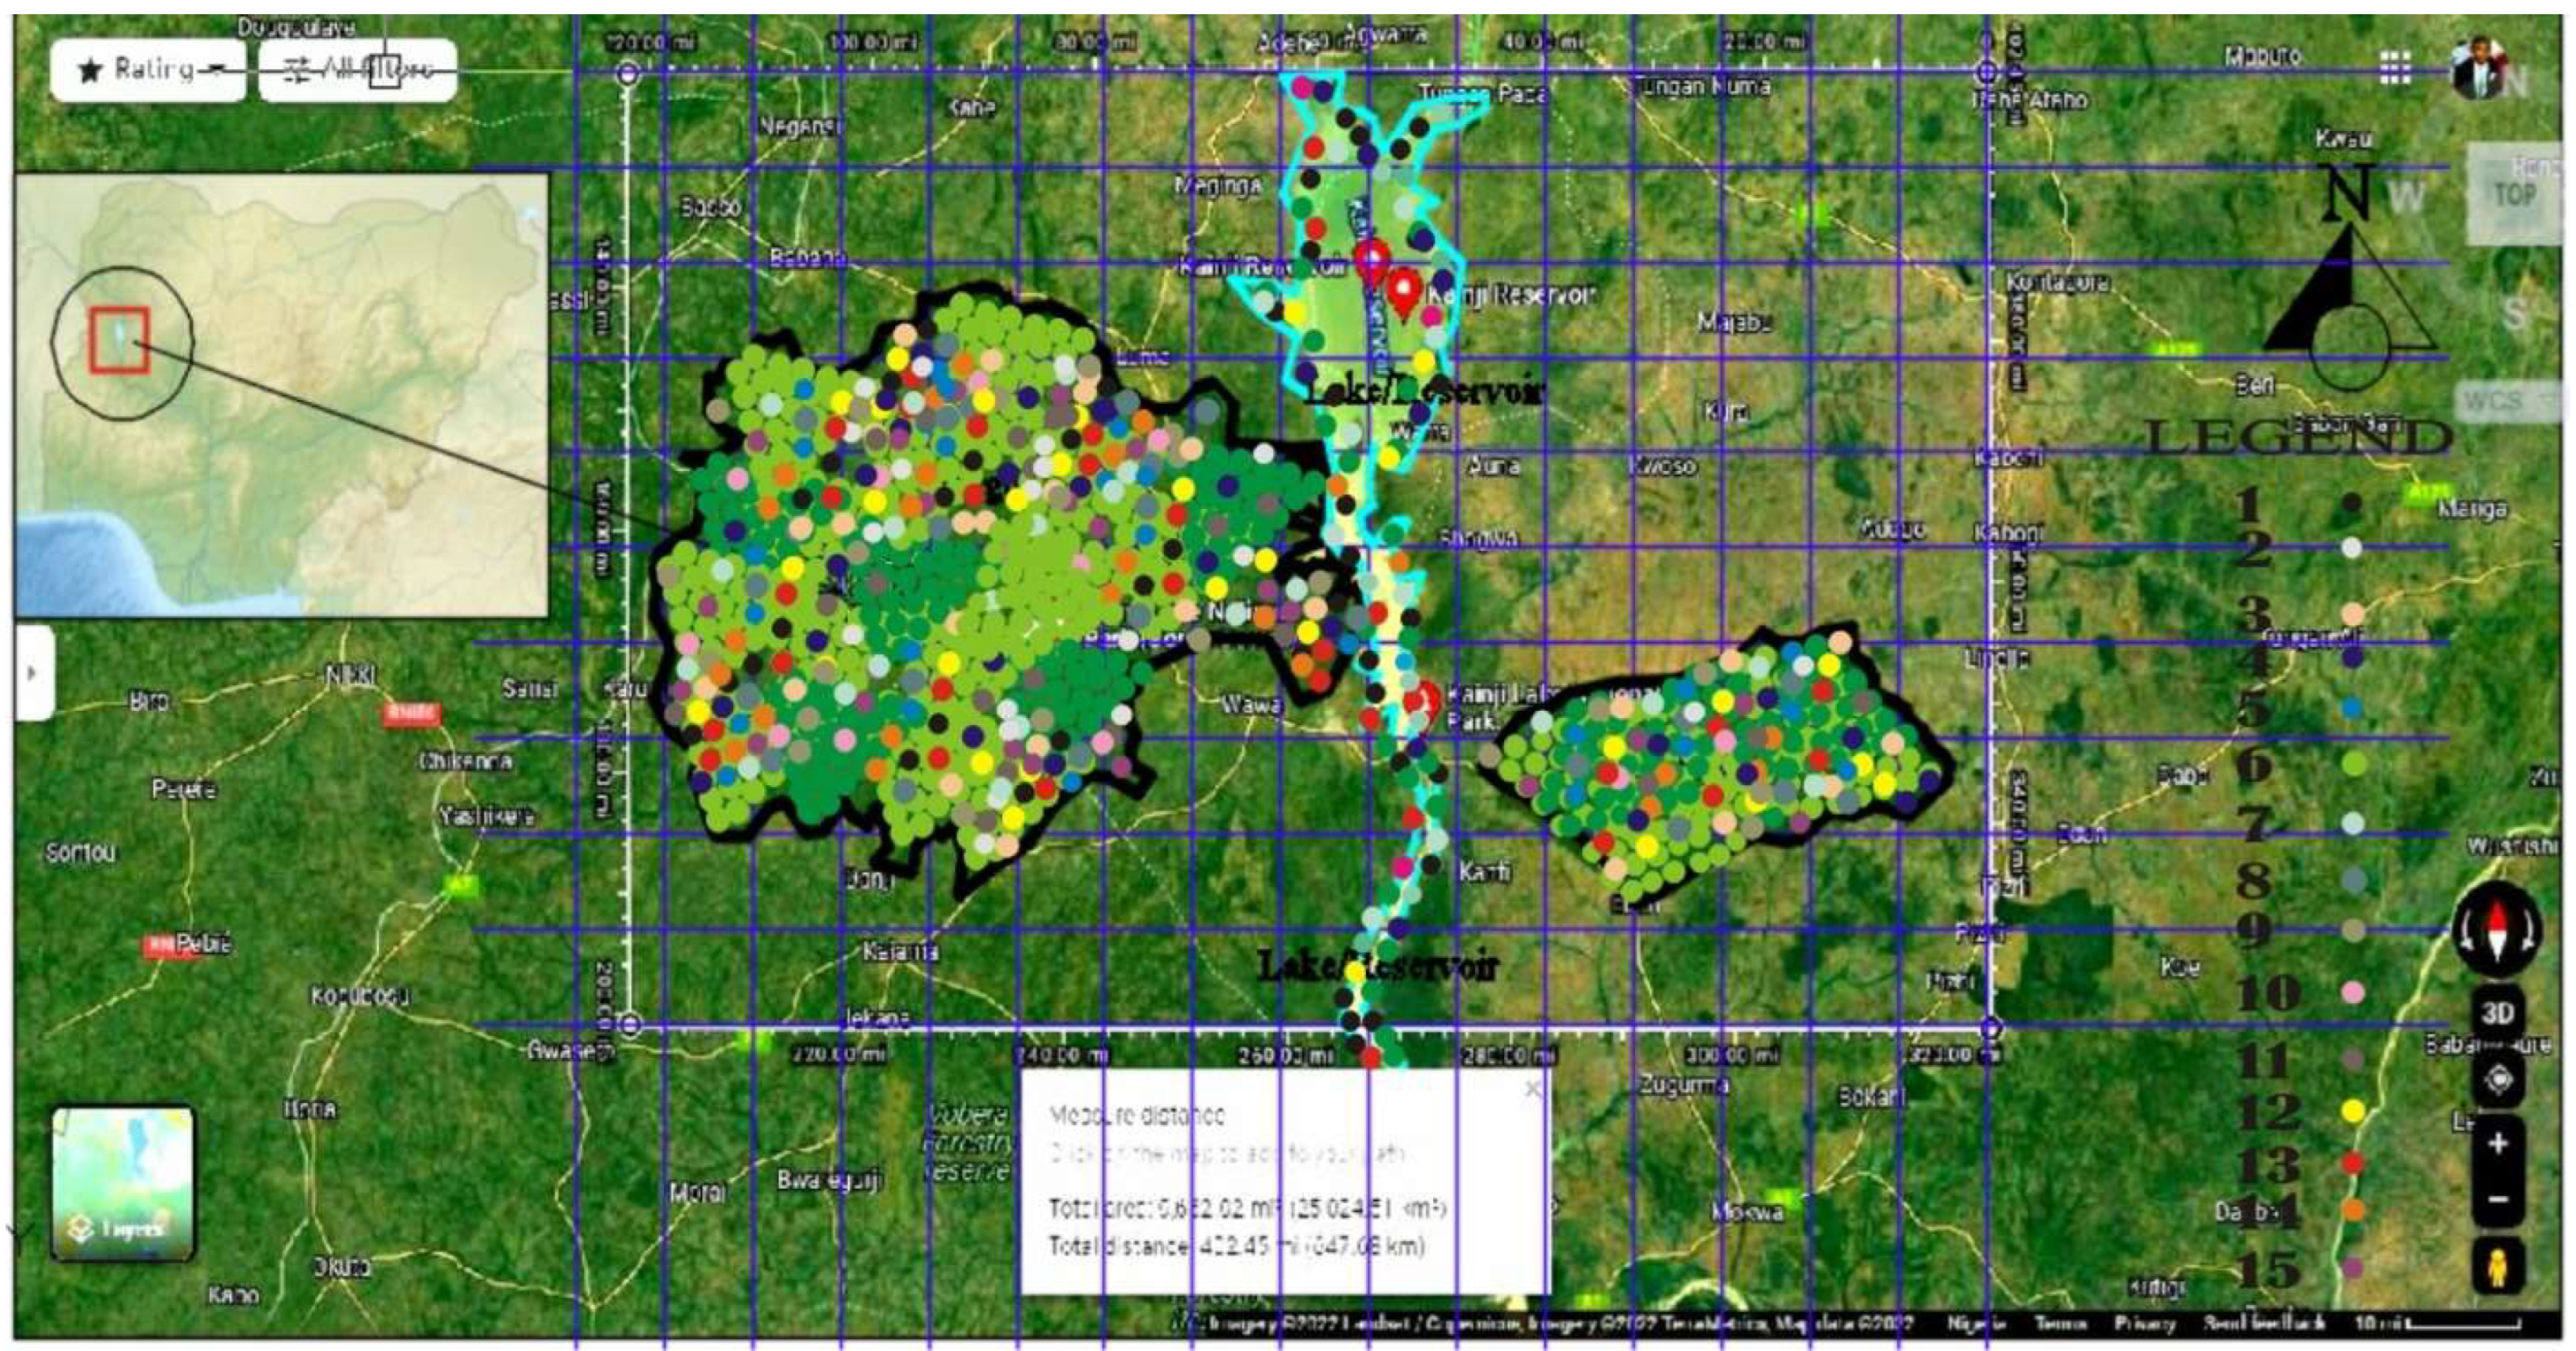
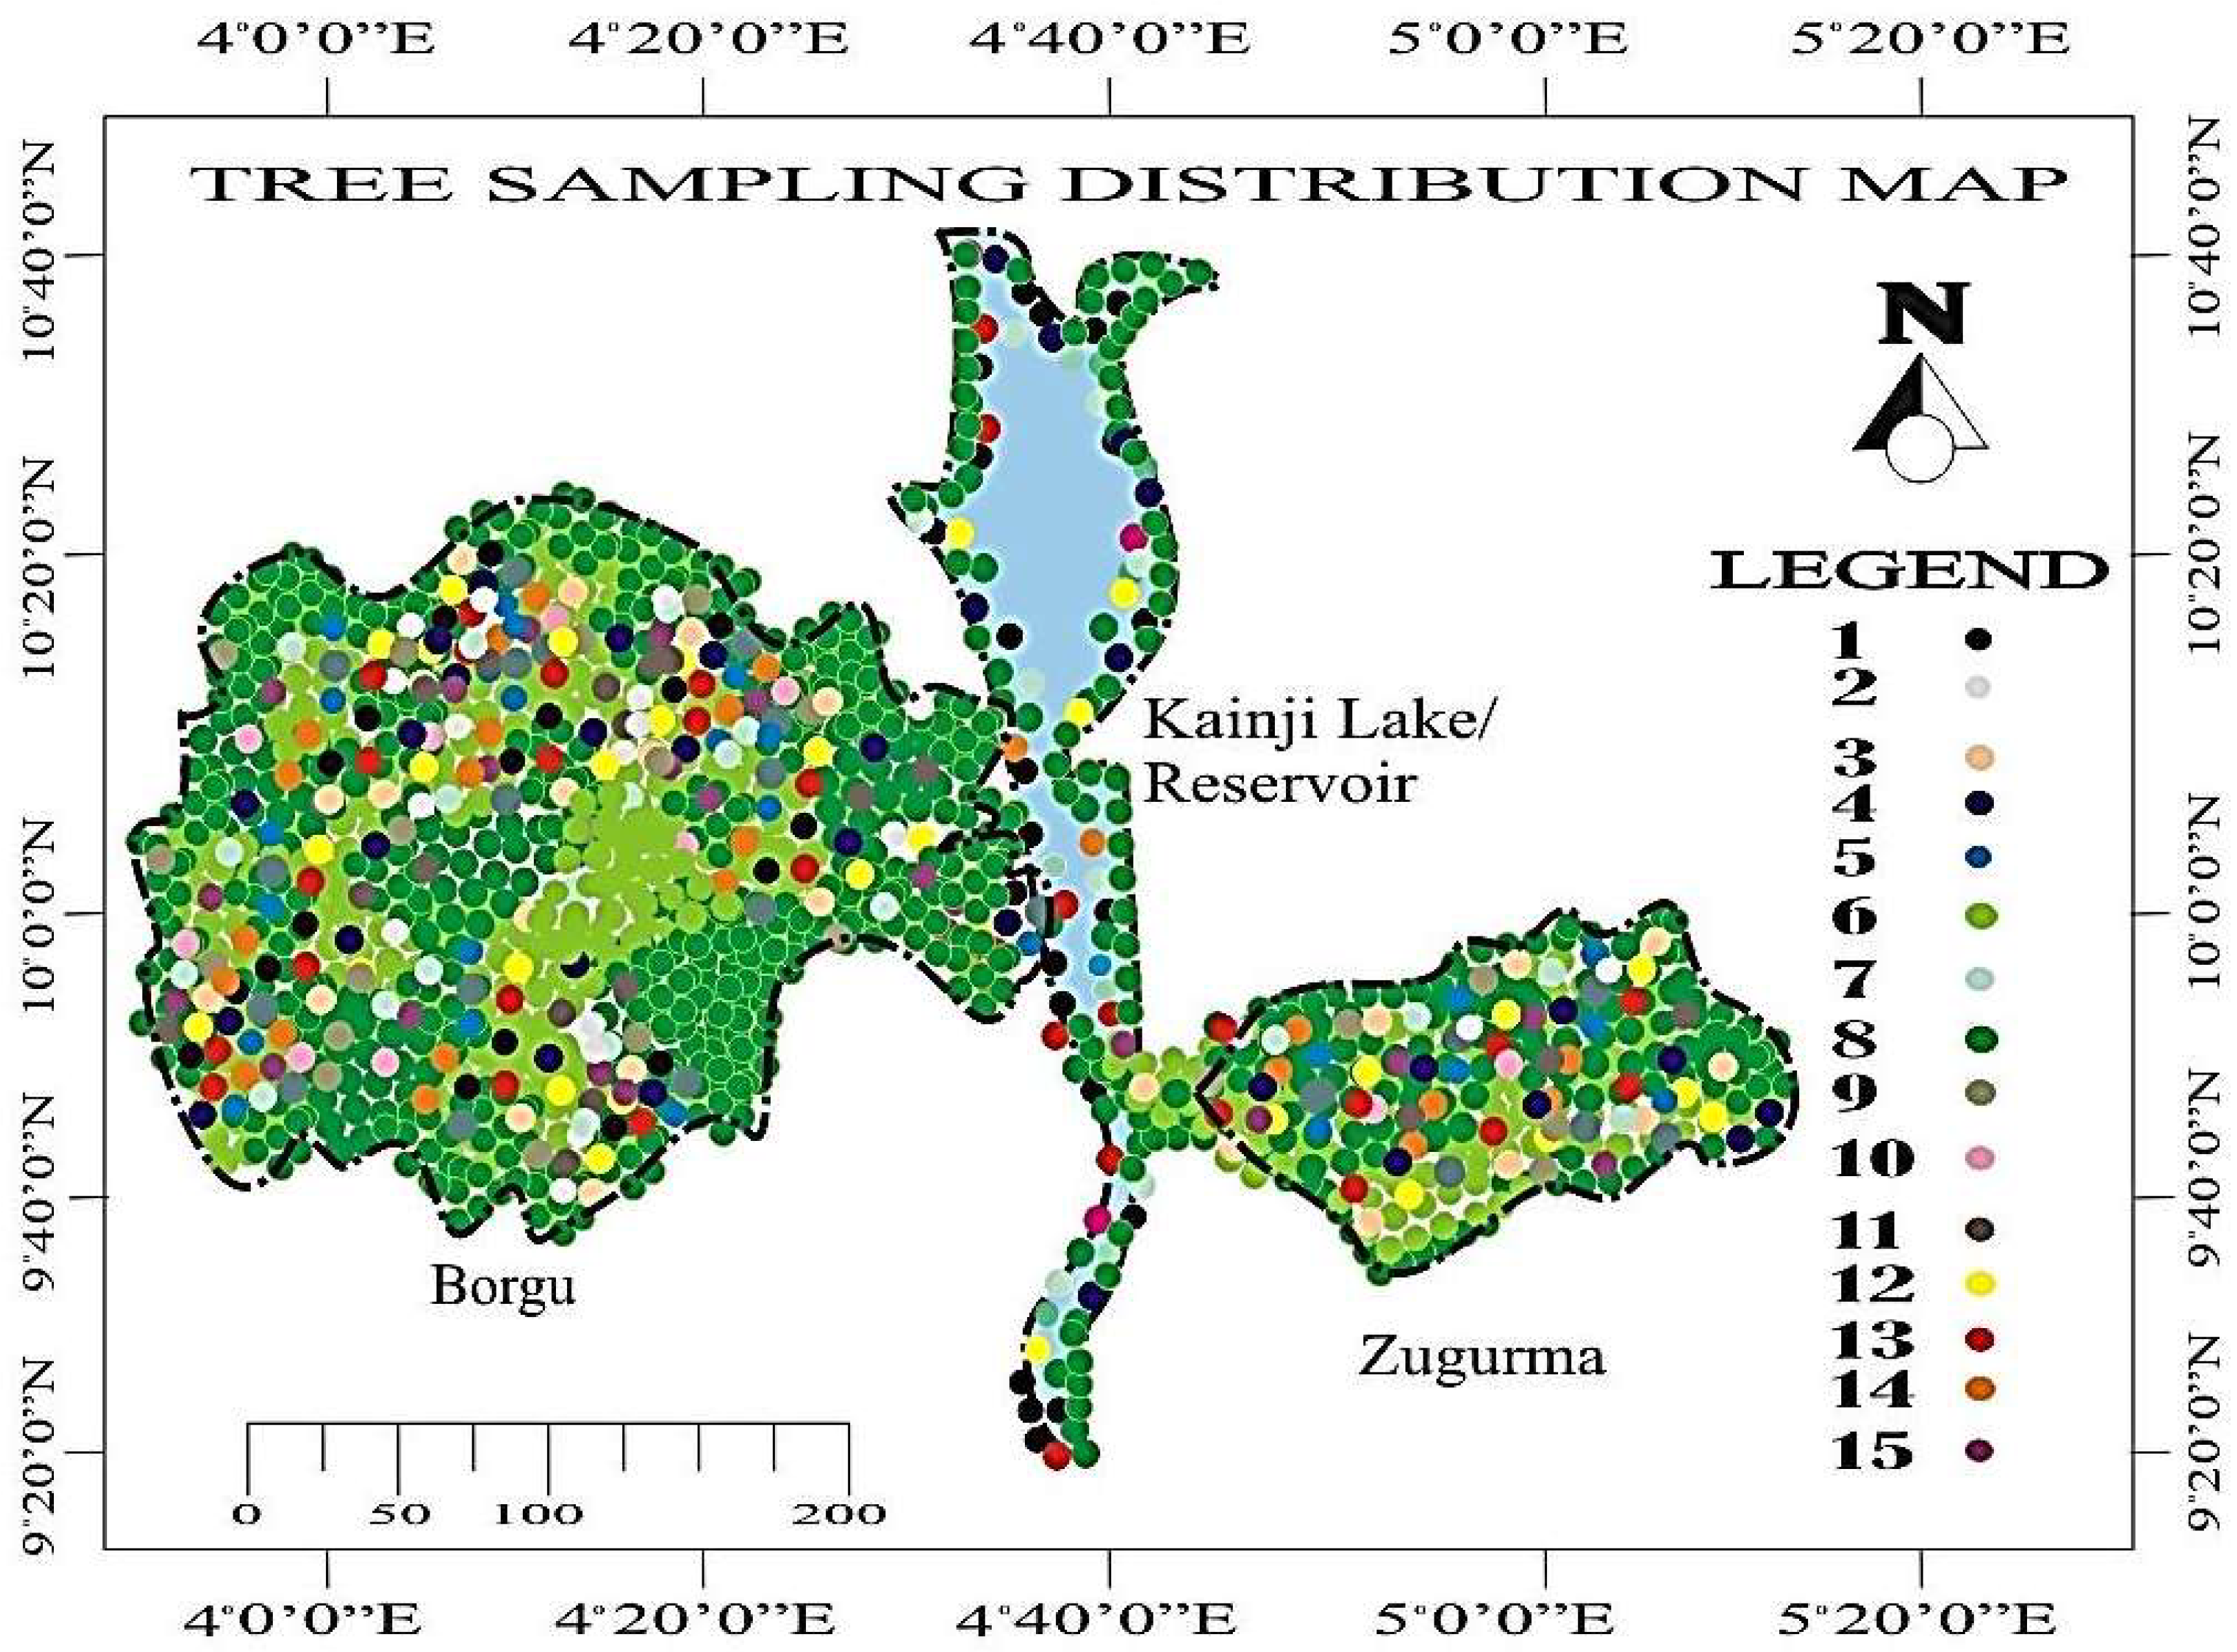
The 15 identified tree species with 563,500,000 (an average of 3,700,000 in each sample frame) trees per tree species/type with a total of 63% tree cover were randomly sampled within a stratum of 25 × 25 km frames divided into 150 sample frames for proper analyses. There are over 30 species, but this study only selected 15 to avoid it being too cumbersome for analysis and assessment. The report in this study was captured from January to November of the year 2018 using the i-Tree Eco v6.0.25 model, a software that estimates ecosystem services and structural aspects of the urban or rural forest using tree measurements and other data. It is a versatile software application that quantifies forest structure, environmental effects, and community value, using data collected in the field from single trees, complete inventories, or randomly located plots throughout a study area, as well as local hourly air pollution and meteorological data. The available data on air temperature, evaporation, hourly transpiration by trees, photosynthetically active radiation, and precipitation runoff avoided by trees were also considered. The study also captured the potential evapotranspiration by trees, isoprene by trees, and monoterpene by trees. The most recent data for the selected area is 2018 (still relevant, as not much has changed in the study area between 2018 and now), and the most recent years of 2019, 2021 and 2022 are not yet available at the time of this study. The study area (approximately 12 km2 (45% of the total)) is a subset of the captured area, showing that the area that was fully forested many years ago has lost greenery in at least five decades (Figure 4 and Figure 5). However, the ecoregion is similar and the indigenous trees were deforested due to the host community’s encroachment and unguided development. These trees are categorised into 15 types (1–15 for proper identifications—see Table 1 for the Tree IDs and Species Name).
The dominant flora in the savanna woodland of the Borgu sector is dominated by the following indigenous trees: Burkea africana, Terminalia avicennioides, Detarium microcarpum, Isoberlinia tomentosa, Diospyros mespiliformis, Polysphaeria orbuscula, Terminalia macroptera, Isoberlinia doka, Afzelia africana, Daniella oliveri, Pterocarpus erinaceus, Parkia clappertoniana, Vitellaria paradoxa, Detarium microcarpum, Uapaca togoensis. All these indigenous trees belong to the following species of trees: Abies, Abelia, Dovyalis abyssinica, Abarema, Abies balsamea, Acacia adunca, Lagarostrobos franklinii, Adenostoma, Adenaria floribunda, Salix fragilis, Hakea francisiana, Acacia argyrophylla, Adenaria floribunda, Carya x schneckii, and Adenostoma fasciculatum, as used in the i-Tree Eco v6.0.25.
Figure 3a–c above elucidated the conditions of the study area, with the detailed maps of the Zugurma zone showing the deforestation between 1972 to 1986 is less than 30%, as fewer visible development patches could be seen. However, from the year 1986 to 1996, and into 2015, the dramatic change has gone up to 60%, and the immediate surrounds of the zone are the worst affected, dominated by subsistence farm settlement, as more encroachment patches could be seen as well. Climate change impact has hence affected the microclimatic situation of Kainji National Park, and the trees and wildlife have degenerated far below 80%. If landscape regeneration and restoration are not deployed, as well as a sustainable strategy against the continuous loss of biota (flora and fauna), the entire value of the primary ecosystem services will fall way below 100%, as the intense development has risen to its prime, due to many aforementioned anthropogenic activities. The socio-economic situation, livelihood, environment, and well-being of the people (host community) will deteriorate to zero in the near future if nothing changes regarding the placement, implementation, and full enforcement of strategic biodiversity conservation measures.
The colour codes used (see maps legend) do not necessarily represent the morphological forms and nature of behavioural patterns of the tree species but are used for annotation and prompt identification within the context of this study (Figure 6). There are so many recognised national parks and forest reserves in the northern part of Nigeria that have also suffered a similar fate but are not discussed in this study, such as the Dagida Forest Reserve, which is about 100 km away from the Zugurma zone of the Kainji National Park. It is isolated and has the same tree species, as well as similar human and bioclimatic conditions and environmental factors to those in the Zugurma and Borgu zones.
4. Results
In the year 2018, a study of the vegetation structure, function, and value of Kainji National Park and the protected forest was carried out. The i-Tree Eco model created by the US Forest Service’s Northern Research Station was used to evaluate data through multiple frames of one plot, placed throughout the research region with the assistance of the nearest weather station. The Zugurma zone is the most affected of all the three zones by the impact of humans, due to excessive agricultural practice and exploration, and has suffered deforestation and degradation that is visible in the Landsat Imageries below, dating back to 1972–2015 and later to the year (2018) that this study captured from which future projections and evaluation of the study area were made.
The following tables report the individual-level results for the composition and structure of trees in the study area, according to the weather station close to the location (see Table 1 and Table 2 for the weather station data). The existing flora and fauna were identified, and the i-Tree Eco v6.0.25 was used for onward analysis, using the parameters identified in the study of crown health dieback and other conditions below.
Table 1 presents a summary of the data collected in the field, as well as additional estimated tree characteristics for each of the trees sampled. This table includes Plot and Tree ID, Species Name, DBH, Height, Street Tree Status, and estimations for Canopy Cover, Tree Condition, Leaf Area, Leaf Biomass, Leaf Area Index—calculated by dividing Leaf Area by Tree Canopy—and Basal Area. The following are the tree condition ratings used in this study:
- Crown Health (dieback): Excellent = 0% dieback, Good = 1–10% dieback, Fair = 10–25% dieback, Poor = 25–50% dieback, Critical = 50–75% dieback, Dying = 75–99% dieback, Dead = 100% dieback.
- Crown Health (condition): Excellent = 100% condition, Good = 90–99% condition, Fair = 75–90% condition, Poor = 50–75% condition, Critical = 25–50% condition, Dying = 1–25% condition, Dead = 0% condition.
Table 2 provides an overview of the field data, as well as additional estimated tree characteristics, for each of the trees sampled. The following attributes are estimated in this table: Tree Count, Canopy Cover, Leaf Area, Leaf Biomass, and Basal Area.
The ecosystem service and values were captured and summarized in Table 3. It was revealed that land degradation, abuse, and misuse in the national park are both a part and consequence of environmental changes leading to the enormous loss of valuable biodiversity and land resources. The following findings were reported from the study metadata and reported using the i-Tree Eco v6.0.23 from January to December 2018 under the following characteristics: photosynthetically active radiation, rain/precipitation, temperature, transpiration, evaporation, water intercepted by trees, runoff avoided by trees, potential evaporation by trees, and isoprene and monoterpene by trees (see Supplementary Materials).
Tree Characteristics of Kainji National Park
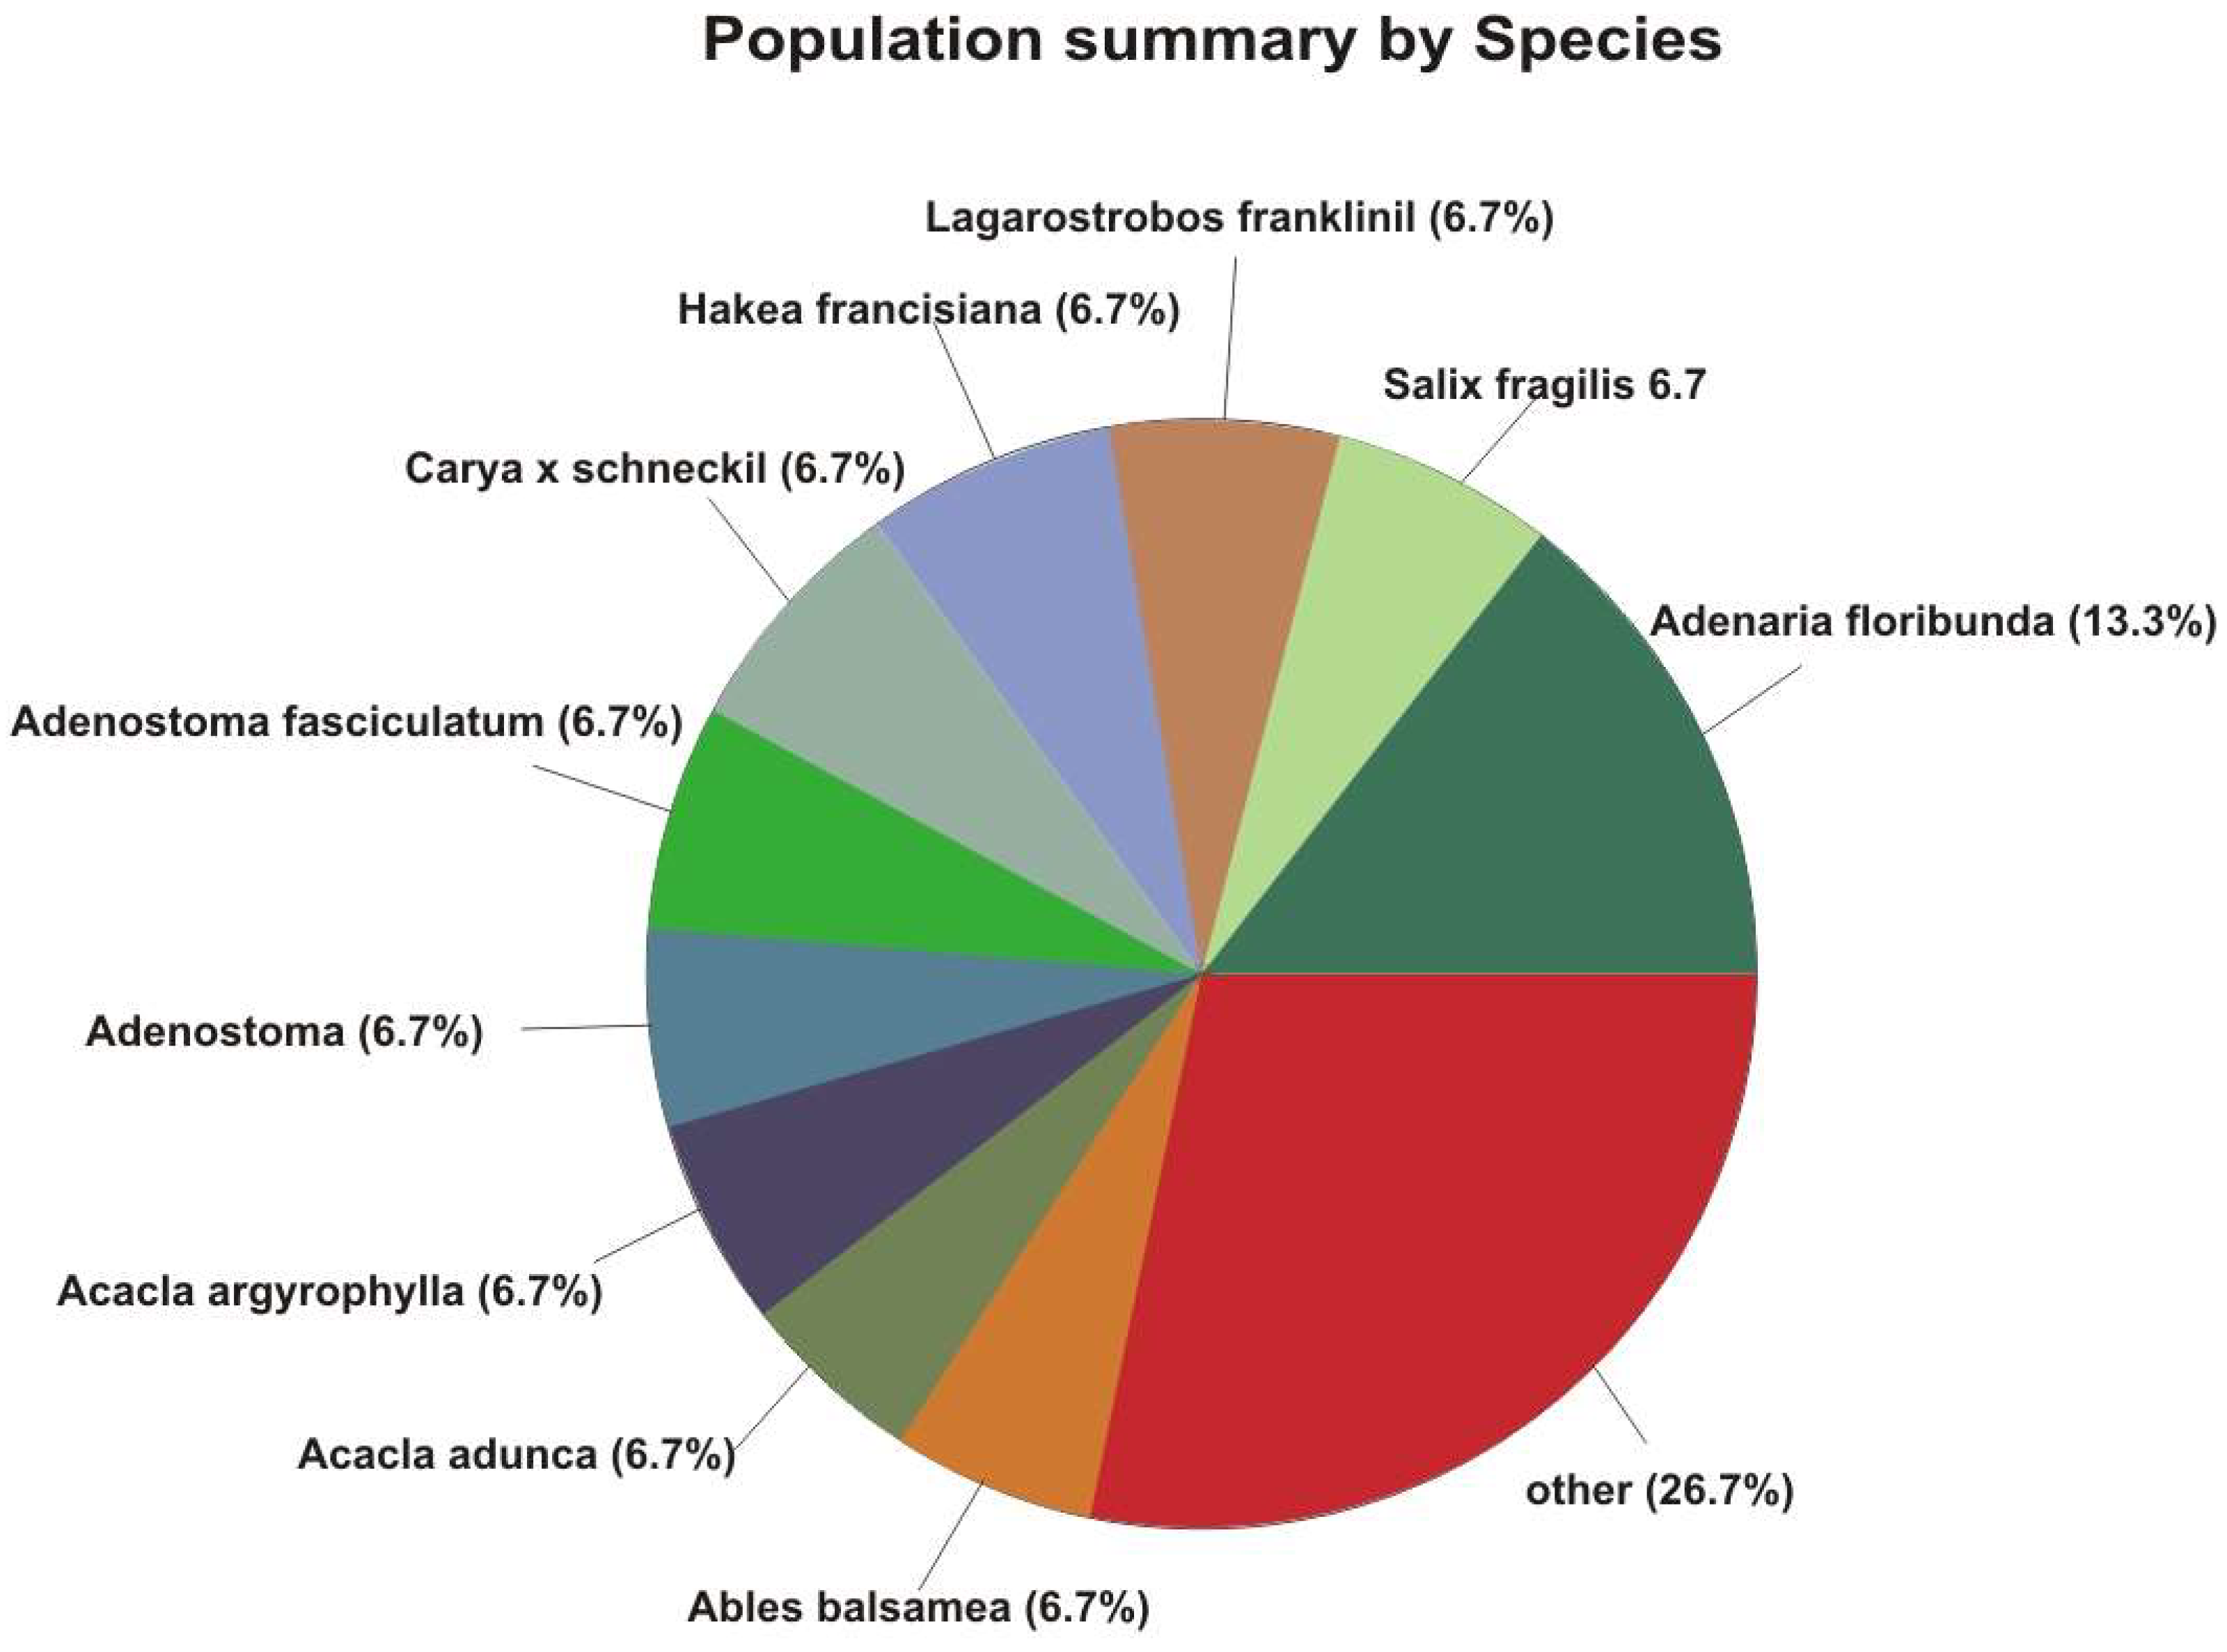
The protected area of Kainji Park has an estimated 563,500,000 trees, with a tree cover of 63.0%. The three most common species are Adenaria floribunda (13%), Crack willow (6.7%), and Huon pine (6.7%). The overall tree density is 150 trees/acre. The protected forests are composed of a mix of native, foreign, and exotic tree species.
As a result, Table 4 revealed that the tree diversification in the protected forests is generally greater than in adjacent native environments and local villages around the study area. Increased tree diversity can reduce the overall damage or devastation caused by a species-specific insect or disease, but it can also put native plants in danger if any of the introduced species are invasive and replace native species. About 20% of the tree species are indigenous to Africa, Asia and North America. While South America has 13.3%, Oceania has the highest at 26.7%. However, 20% of the entire tree species does not have any known origin at the time of data collection for this study( also see Figure 7 below).
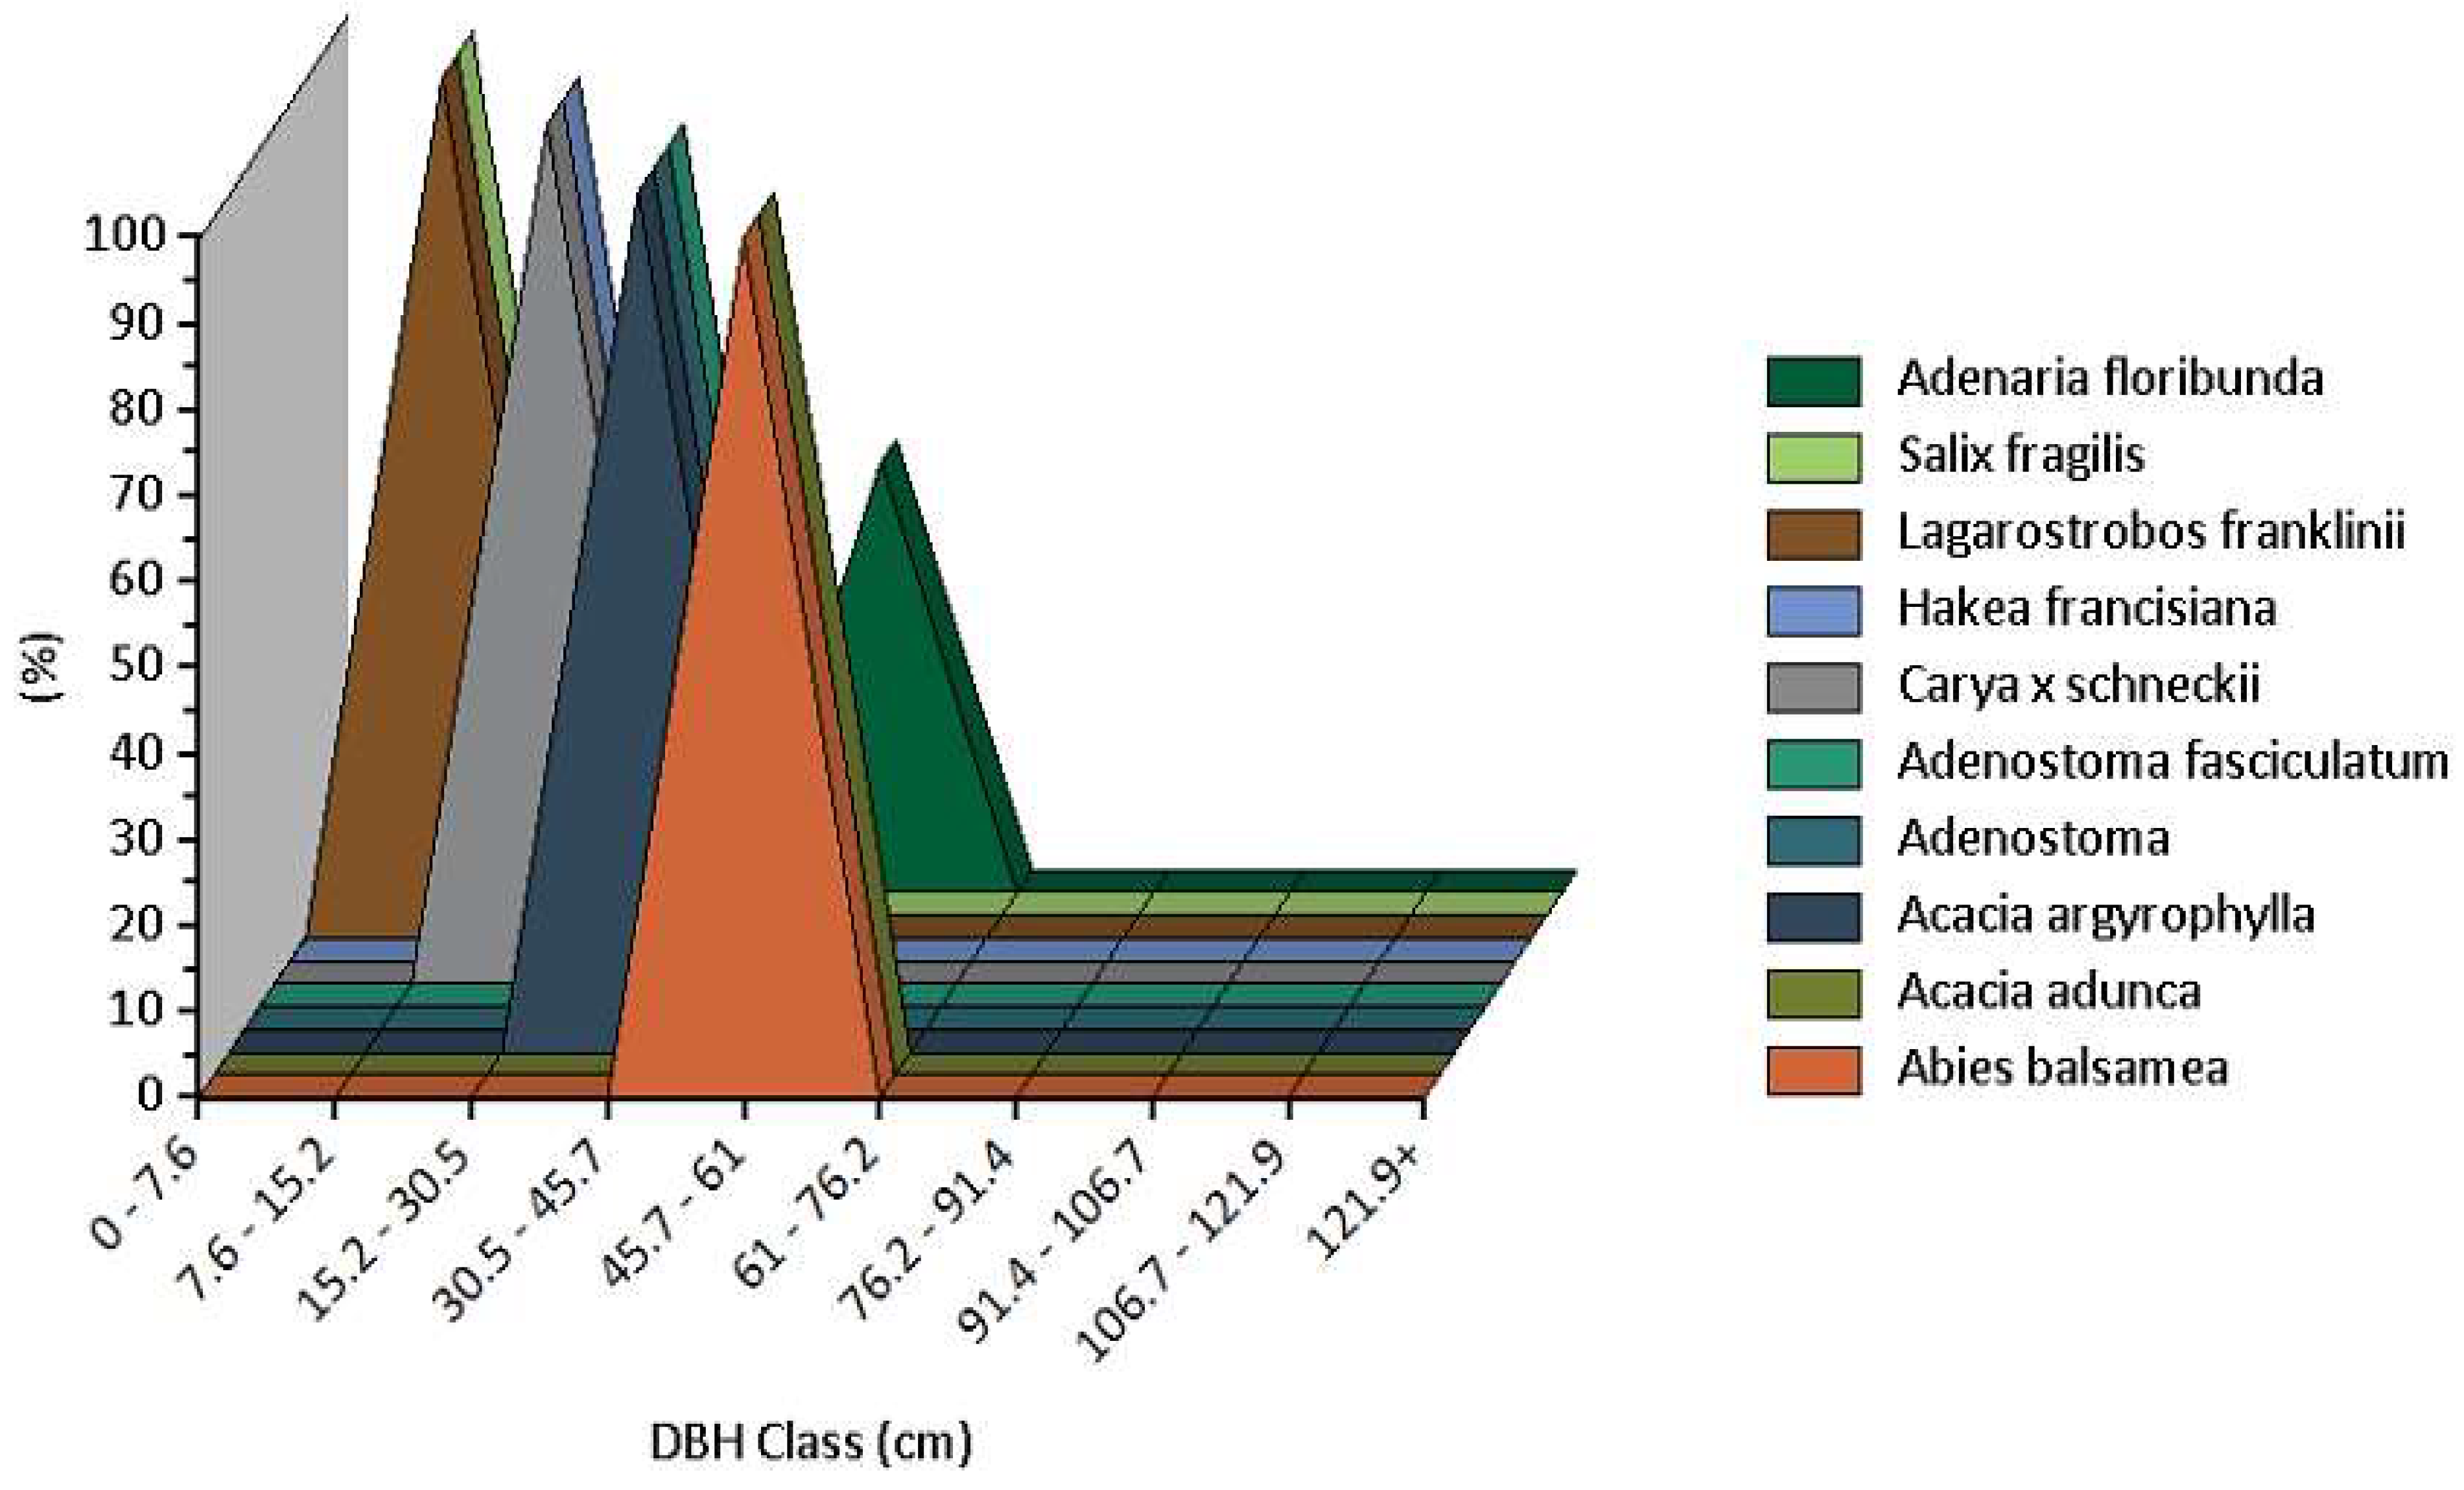
Only around 7% of the trees are native to Africa, while the majority of the trees originate from Oceania (27% of the trees), where they are categorised as indigenous trees. The vitality, ability to adapt, reproductive capacity, and overall absence of natural adversaries are all characteristics of invasive plant species. They can use these characteristics to eliminate native trees, posing a hazard to the ecological regions. The most effective course of action in this troubled situation in Kainji National Park is eradicating them by killing all the invasive species. However, increasing data suggest that removing invasive species from fragile ecosystems is not only effective but also crucial for restoring endangered habitats and species. Figure 8 (Table 1) shows the estimates of the proportion of each species of tree identified in each Diameter at Breast Height (DBH) size class in the study. The proportion of the tree species population by DBH class for each of the ten-fifteen most frequent tree species in the research region is presented in the chart (Figure 8).
The analysis provides total estimates and percentage contributions of the number of trees for each species in the study area. This report displays results in pie charts and table formats below (Table 5 and Figure 9 below).
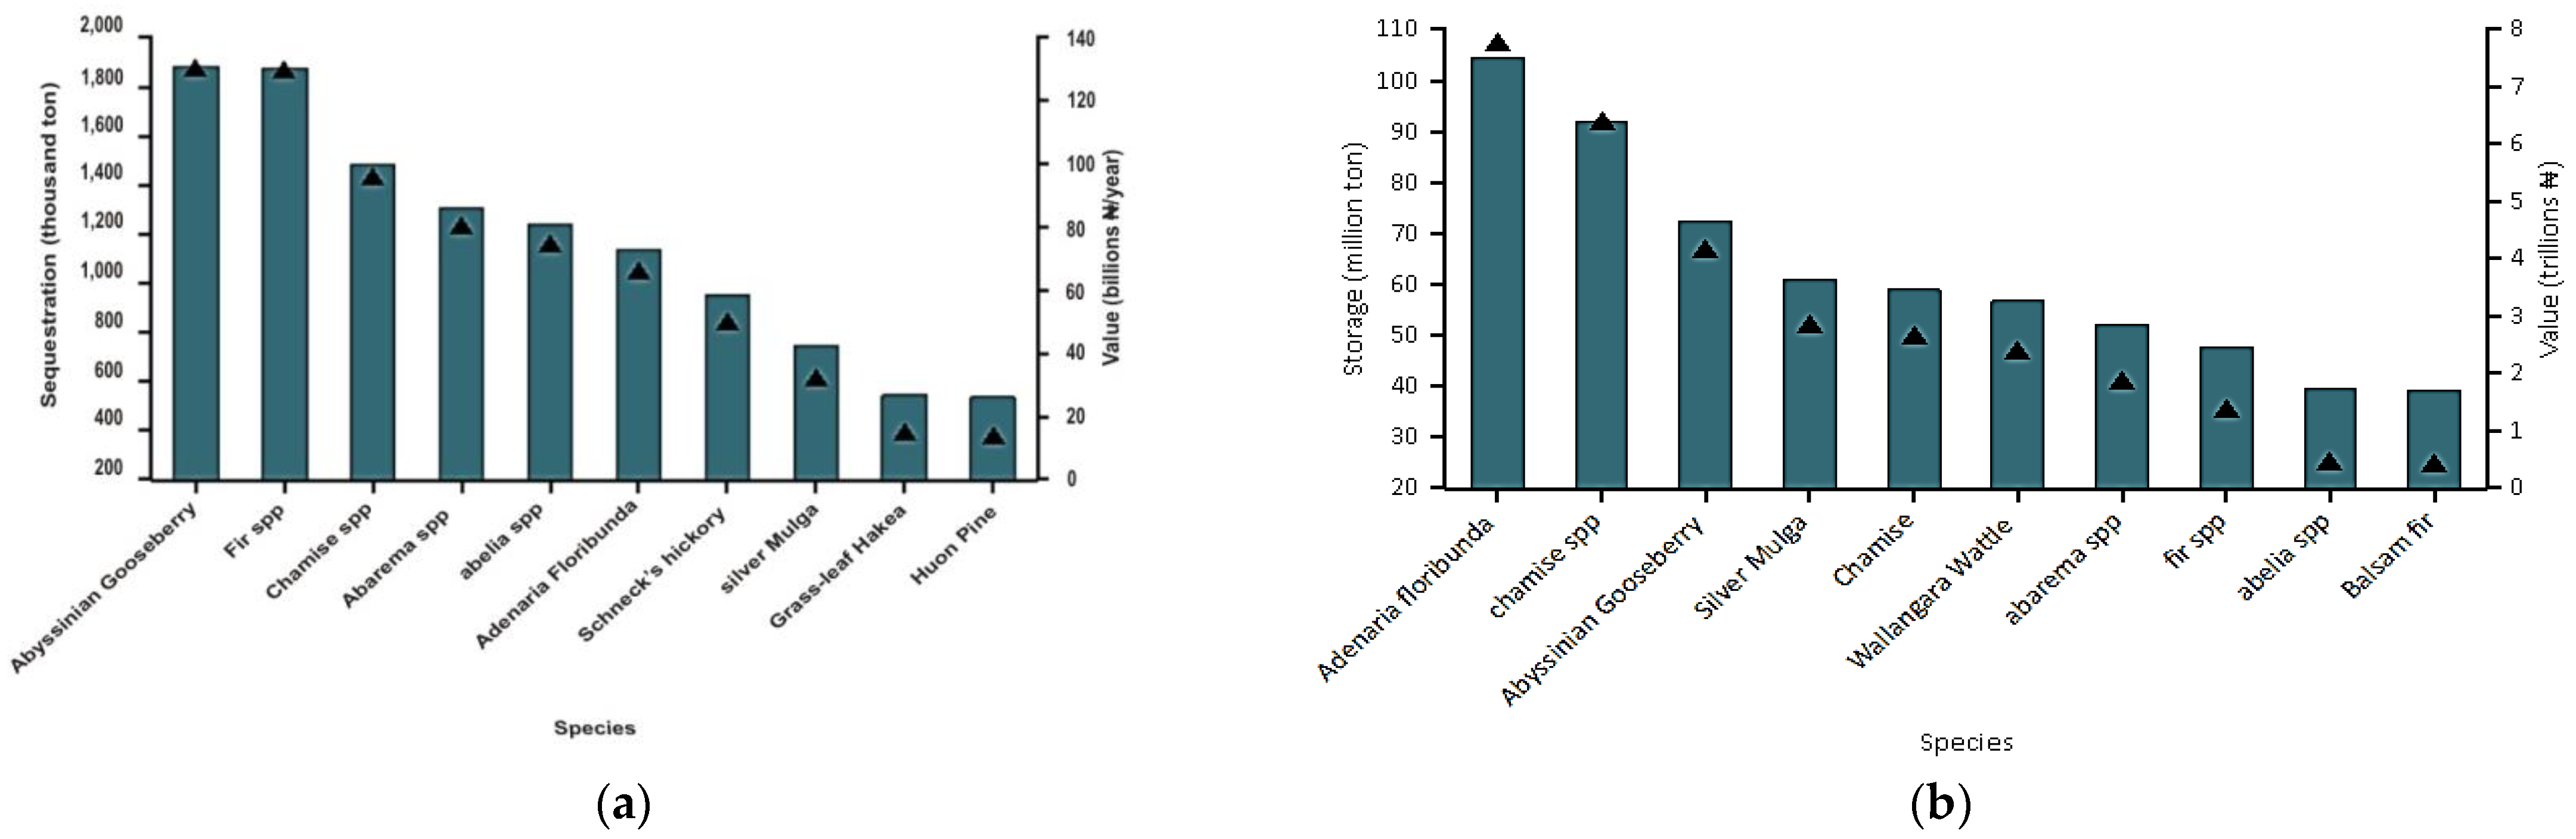
This study reveals that the tree characteristics of the urban forest and biodiversity conservation of Kainji Park have an estimated 563,500,000 trees with a tree cover of 63.0%. The three most common species are Adenaria floribunda (13.3%), Crack willow (6.7%), and Huon Pine (6.7%). The data analysed for the evaluation of the urban forest cover leaf area and importance values shows that several plant advantages are proportional to the plant’s robust leaf pore volume. Trees cover about 63% of the Kainji National Park protected area and provide 39.14 thousand sqm of leaf area. the most dominant species in terms of leaf area are Abyssinian Gooseberry, fir spp., and abelia spp. Importance values (IV) are calculated as the sum of percentage population and percentage leaf area. High importance values do not mean that these trees should necessarily be encouraged in the future; rather these species currently dominate the Kainji National Park forest structure.
5. Discussion
5.1. Trees’ Benefits for Biodiversity Conservation
This section further discusses the tree benefits of green, low carbon, and sustainable environment within the context of biodiversity conservation considering; Carbon Storage, Carbon Sequestration, Hydrology Effects, Pollution Removal, Oxygen production, and Volatile Organic Compounds (VOCs). The models for achieving these themes vary from zone to zone across the entire Kainji Park but it is not peculiar to the study area only as trees all over the world have similar characteristics and growth patterns. In line with the target of United Nations Sustainable Development Goal 13, 2030—Climate Action, the microclimatic data captured were analysed. However, the pollution removal data were not available at the time of this study. The charts (Figure 11, Figure 12, Figure 13, Figure 14 and Figure 15 in Section 5.1.1, Section 5.1.2, Section 5.1.3, Section 5.1.4 and Section 5.1.5) as captured within the January and November of the study year indicate blue colour density and variations which identify the volume (quantity) and emissions of the selected tree species dense blue areas indicate more volume while light-blue (blue-grey) areas indicating less-dense and limited volume generated.
5.1.1. Photosynthetically Active Radiation and Precipitation
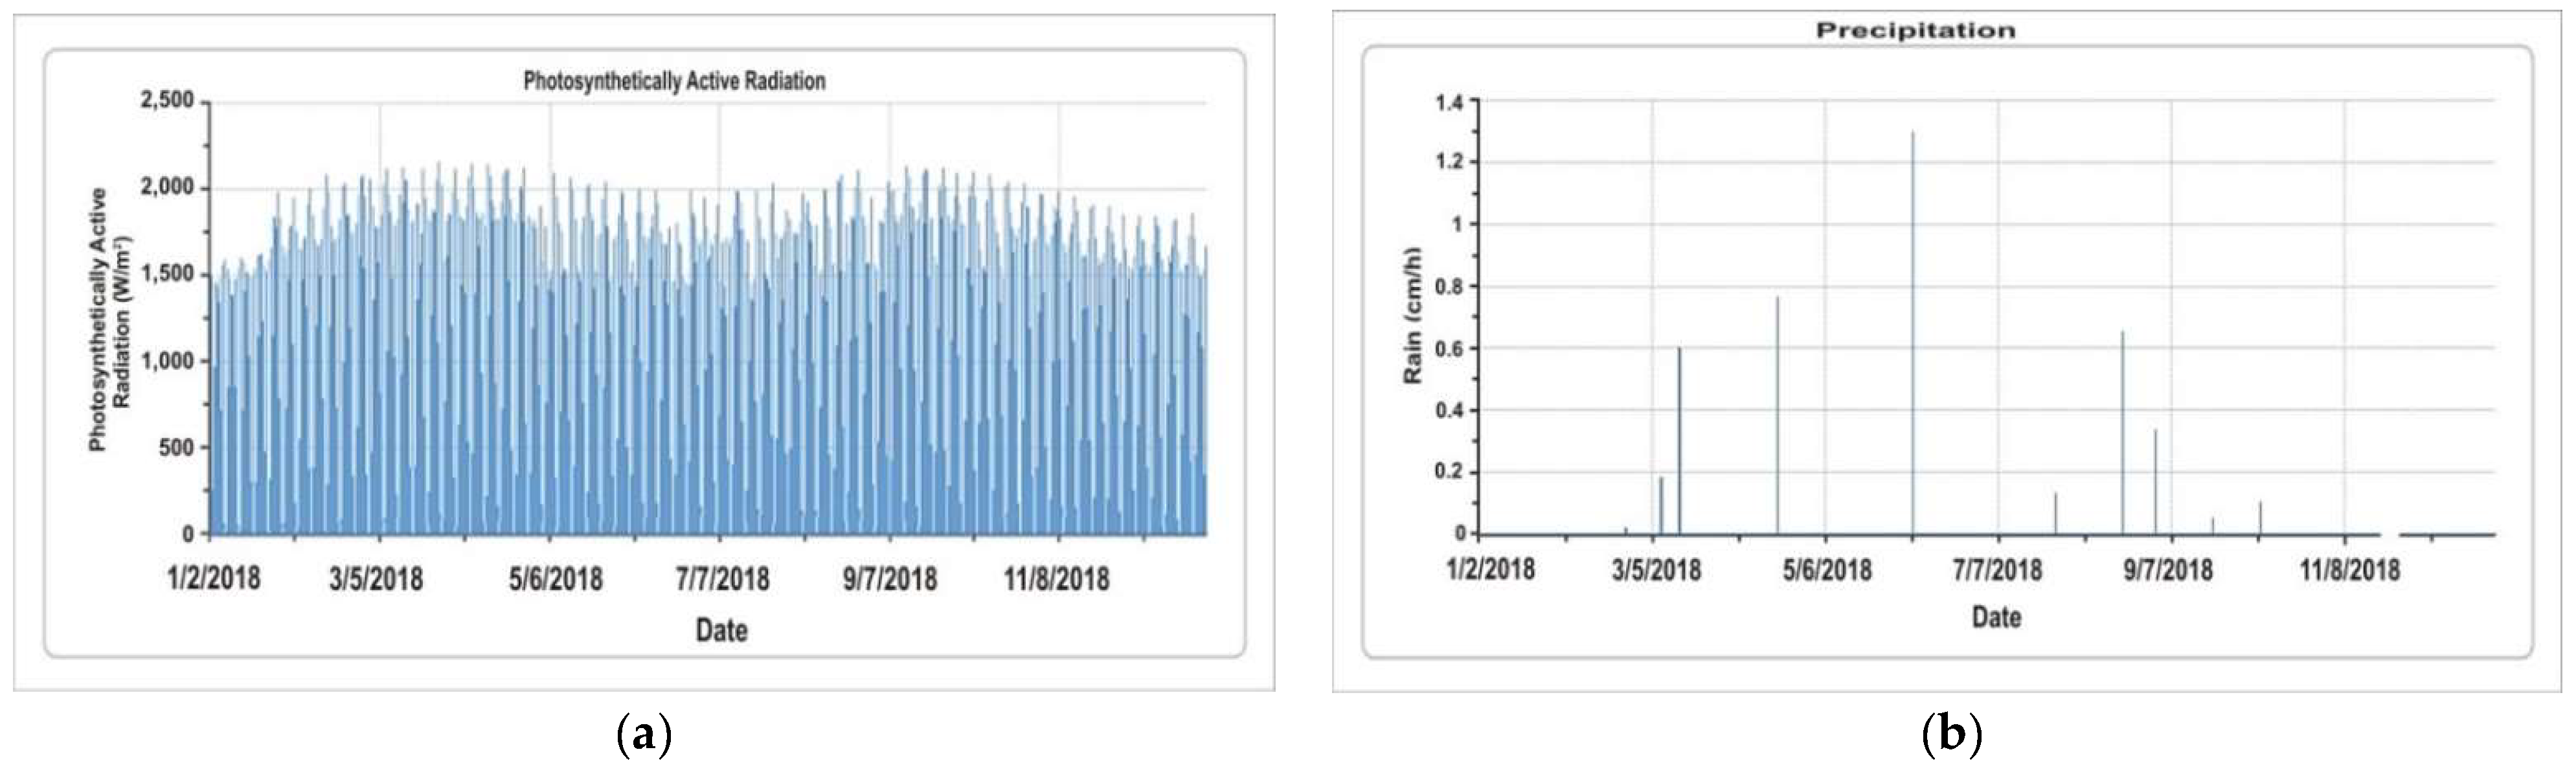
The data report (Figure 11a) displays the hourly photosynthetically active radiation based on weather data that is available in the 150 sample frames of the study area. The precipitation report (Figure 11b) displays the hourly precipitation based on weather data. This report displays results in a line chart for the user-designated weather year 2018. The months of May and August witness the highest photosynthetically active radiation while June has the highest amount of hourly precipitation and December records barely a limited or no precipitation at all.
Figure 11.
(a) Photosynthetically Active Radiation. (b) Precipitation. Please note that the blue colour density and variation identify the quantity of isoprene and monoterpene emitted. It is high where blue lines are more dense and limited in quantity whereas the blue lines are less-dense and loosely arranged.

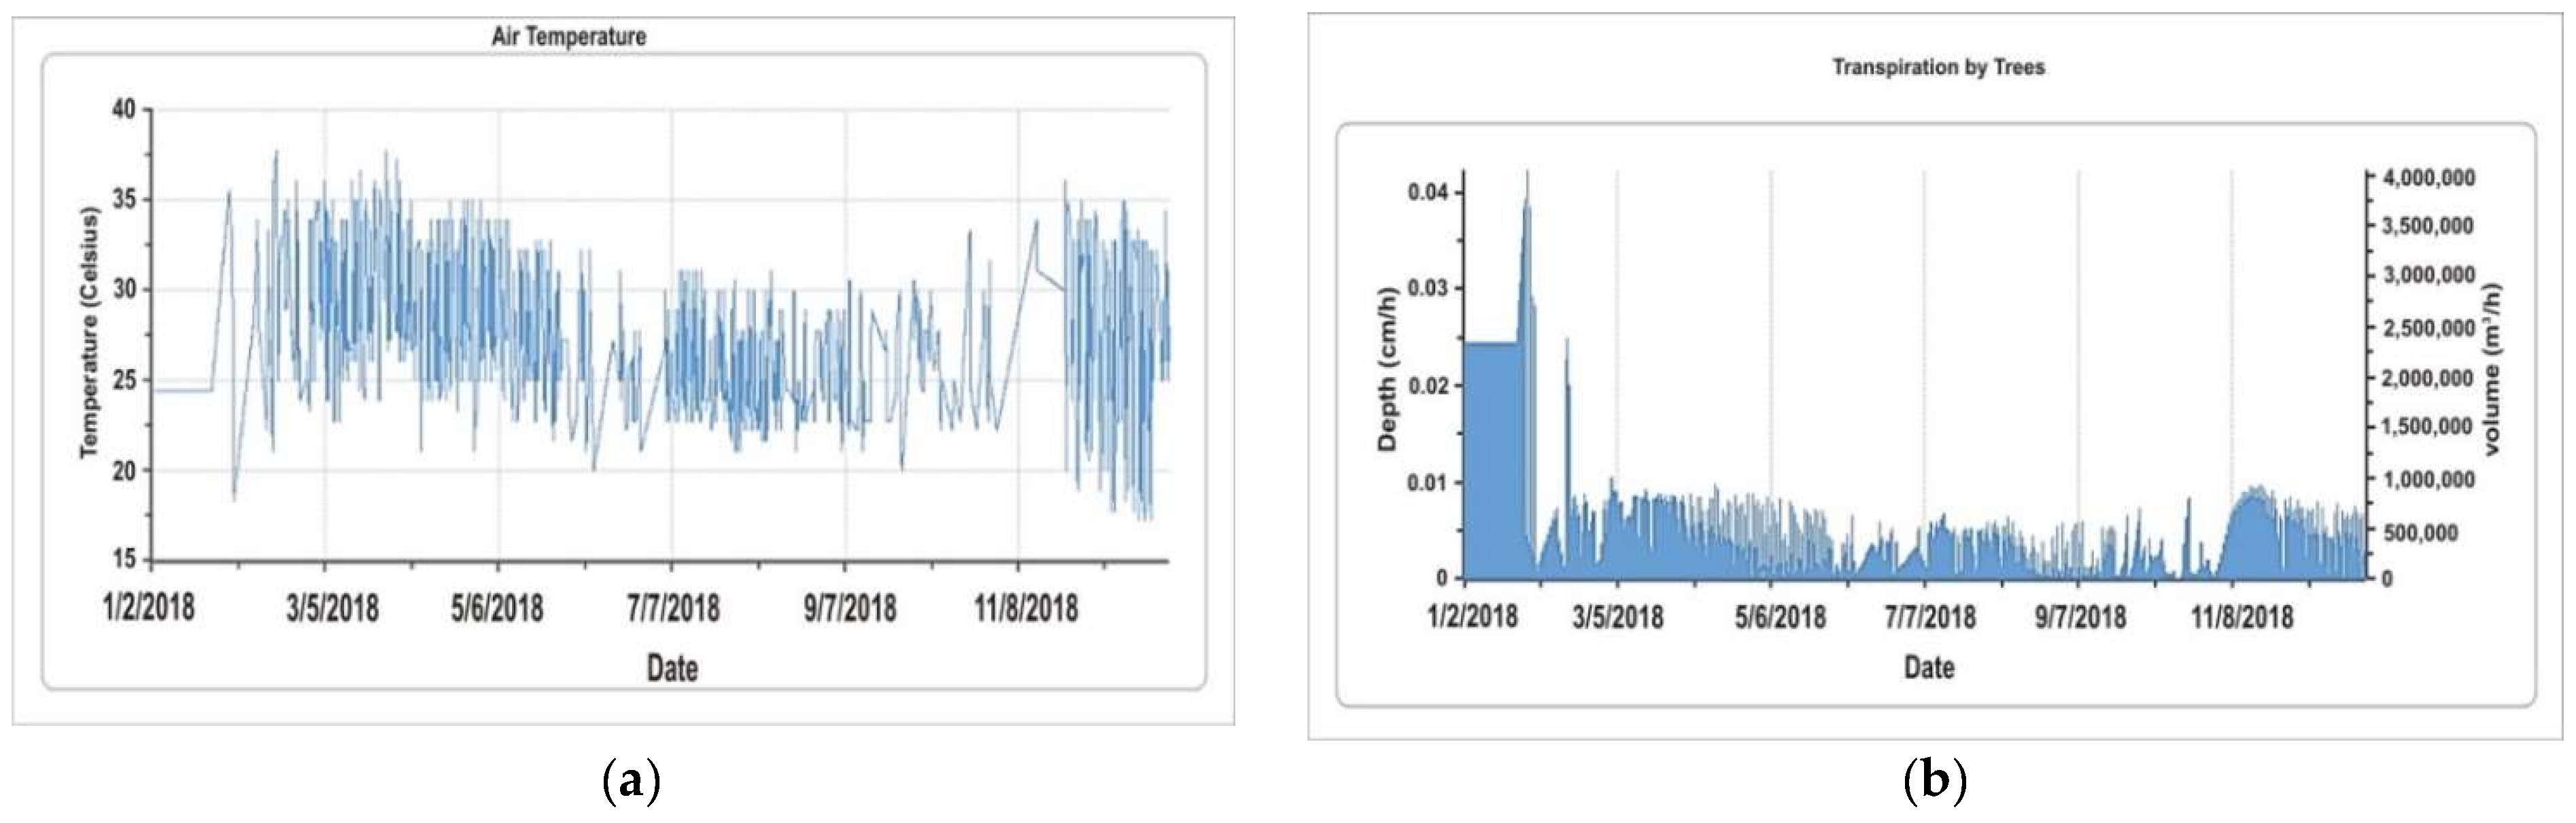
5.1.2. Temperature and Transpiration
The report (Figure 12a) displays hourly air temperature based on the weather data. The report (Figure 12b) also displays the hourly transpiration by trees. Transpiration is the amount of water moved through plants and released into the atmosphere. March and November recorded the highest amount of air temperature with hourly temperature (36–38 degrees) varying unevenly throughout the year and Transpiration invariably occurring mostly in January and February having as high as 0.04 cm/h (4,000,000 m3/h) and below 0.01cm/h in August.
Figure 12.
(a) Air Temperature. (b) Hourly Transpiration by trees. Please note that the blue colour density and variation identify the volume of evaporation of the selected tree species within a given period of the year. More volume evaporated where the blue colour is denser and the blue-grey (less-dense) indicates that the runoff and evaporation are limited per a given period of the year.

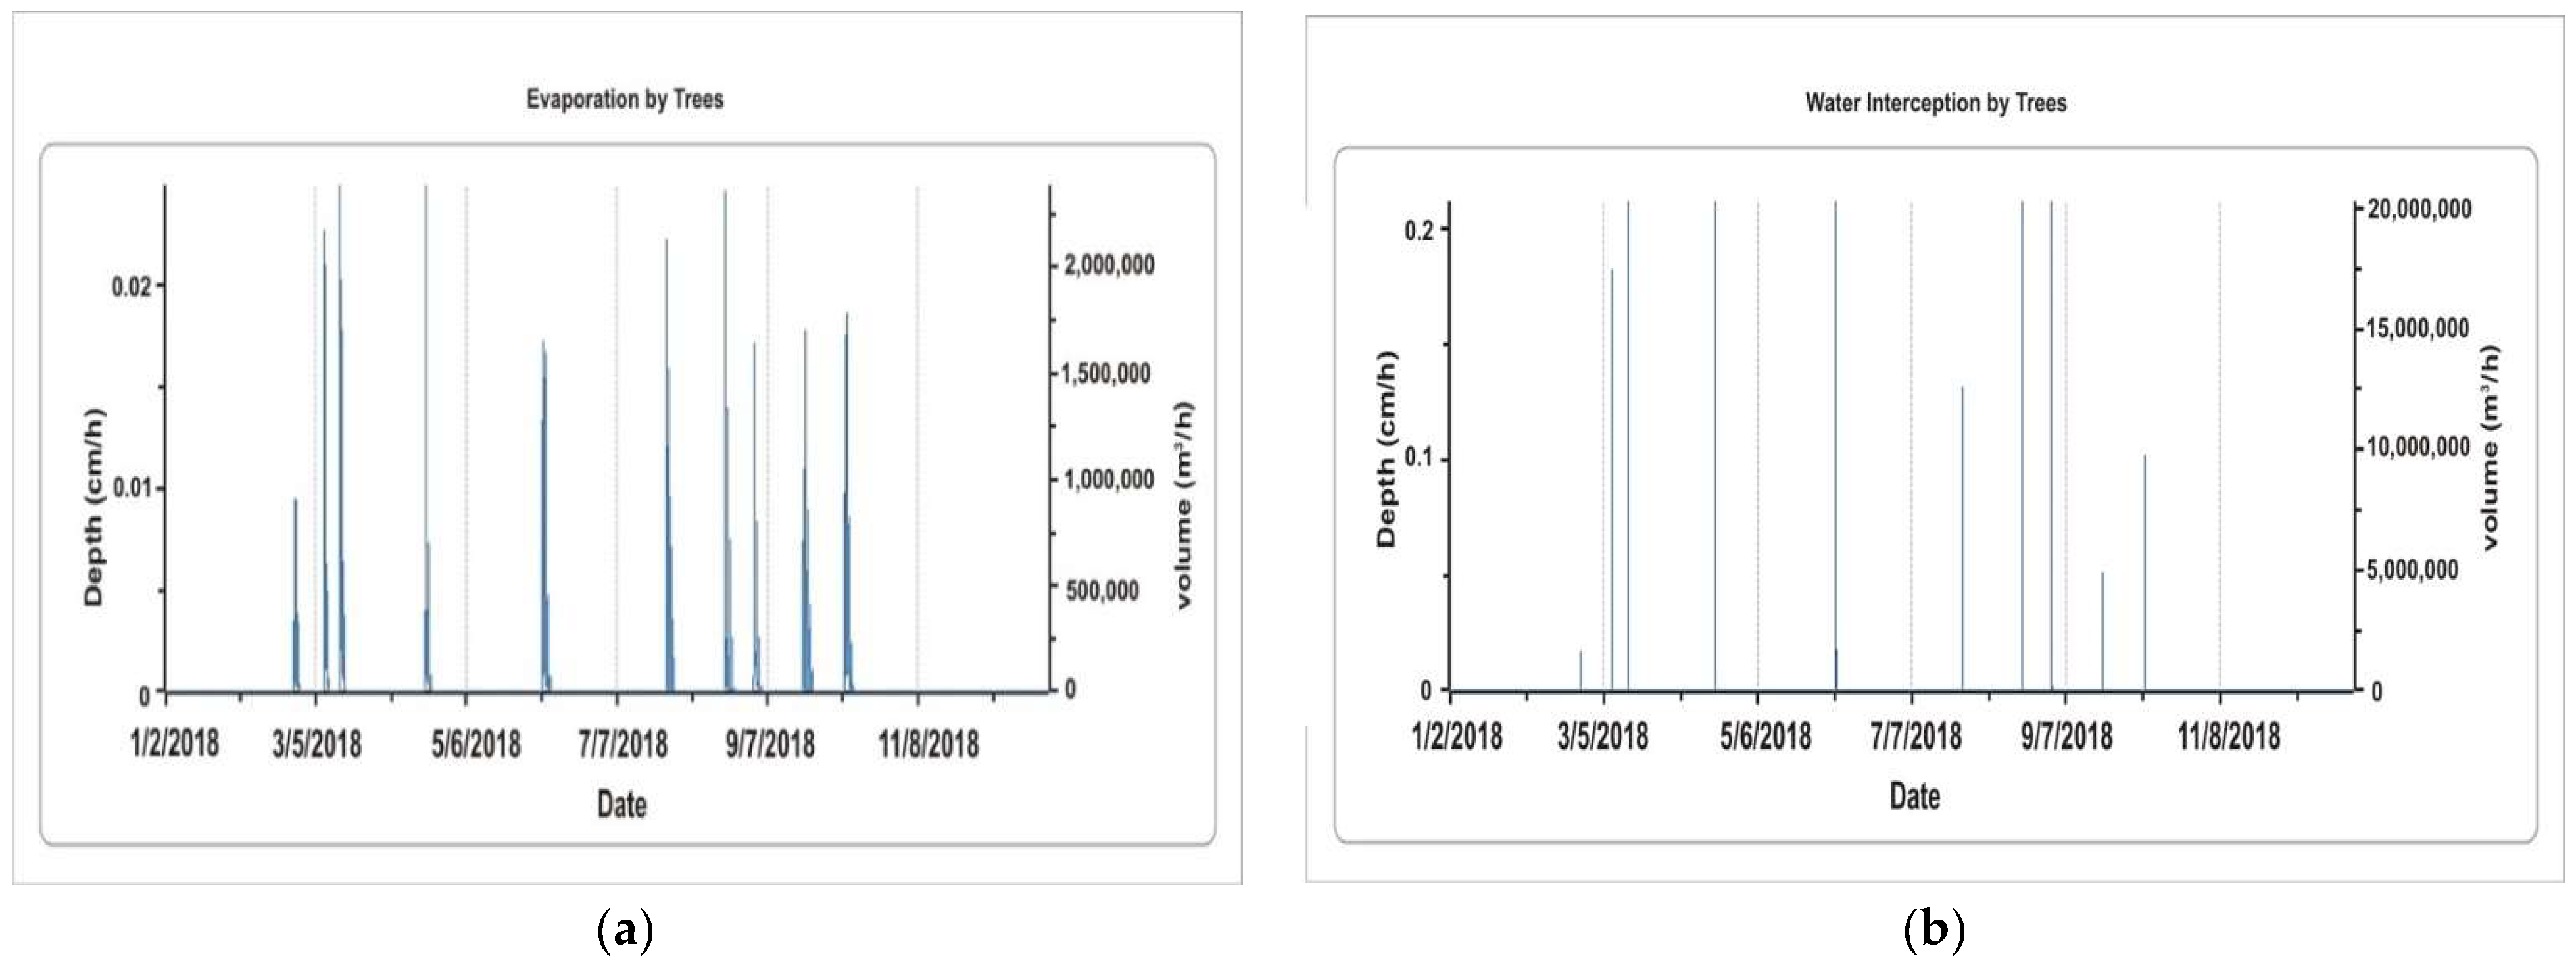
5.1.3. Evaporation and Water Intercepted by Trees
The hourly evaporation by trees is shown in the data report (Figure 13a). The amount of water released into the atmosphere from a plant’s surface is referred to as evaporation. The hourly water interception by trees is shown in the data report (Figure 13b). The amount of rainwater that fell on plants and was intercepted by the leaves and stems is referred to as rainwater captured that evaporates into the atmosphere eventually. This varies throughout the year and appears more in May and July respectively above 2,000,000 m3/h. This data is also similar to the previous but the volume of water interception differs running to over 10,000,000 m3/h according to the metadata recorded in the study area.
Figure 13.
(a) Evaporation. (b) Water Intercepted by trees.

5.1.4. Avoided Runoff by Trees and Potential Evaporation by Trees
The hourly prevented runoff by trees is shown in the report (Figure 14a). The quantity of water that would otherwise become surface runoff into streams but does not is known as avoided runoff. Water interception by plants, ground depression storage, infiltration on pervious ground covers, and overland flow on impermeable ground covers are all factored into the calculations.
Figure 14.
(a) Avoided Runoff by trees. (b) Potential Evaporation by trees. Please note that the blue colour density and variation identify the volume of evaporation and transpiration of the selected tree species within a given period of the year. More volume evaporated where the blue colour is denser and the blue-grey (less-dense) indicates that the runoff and evaporation are limited.

The report (Figure 14b) displays the hourly potential evapotranspiration by trees. Potential evapotranspiration is the sum of the evaporation from the soil and the transpiration from plants that would occur if an unlimited amount of water were available.
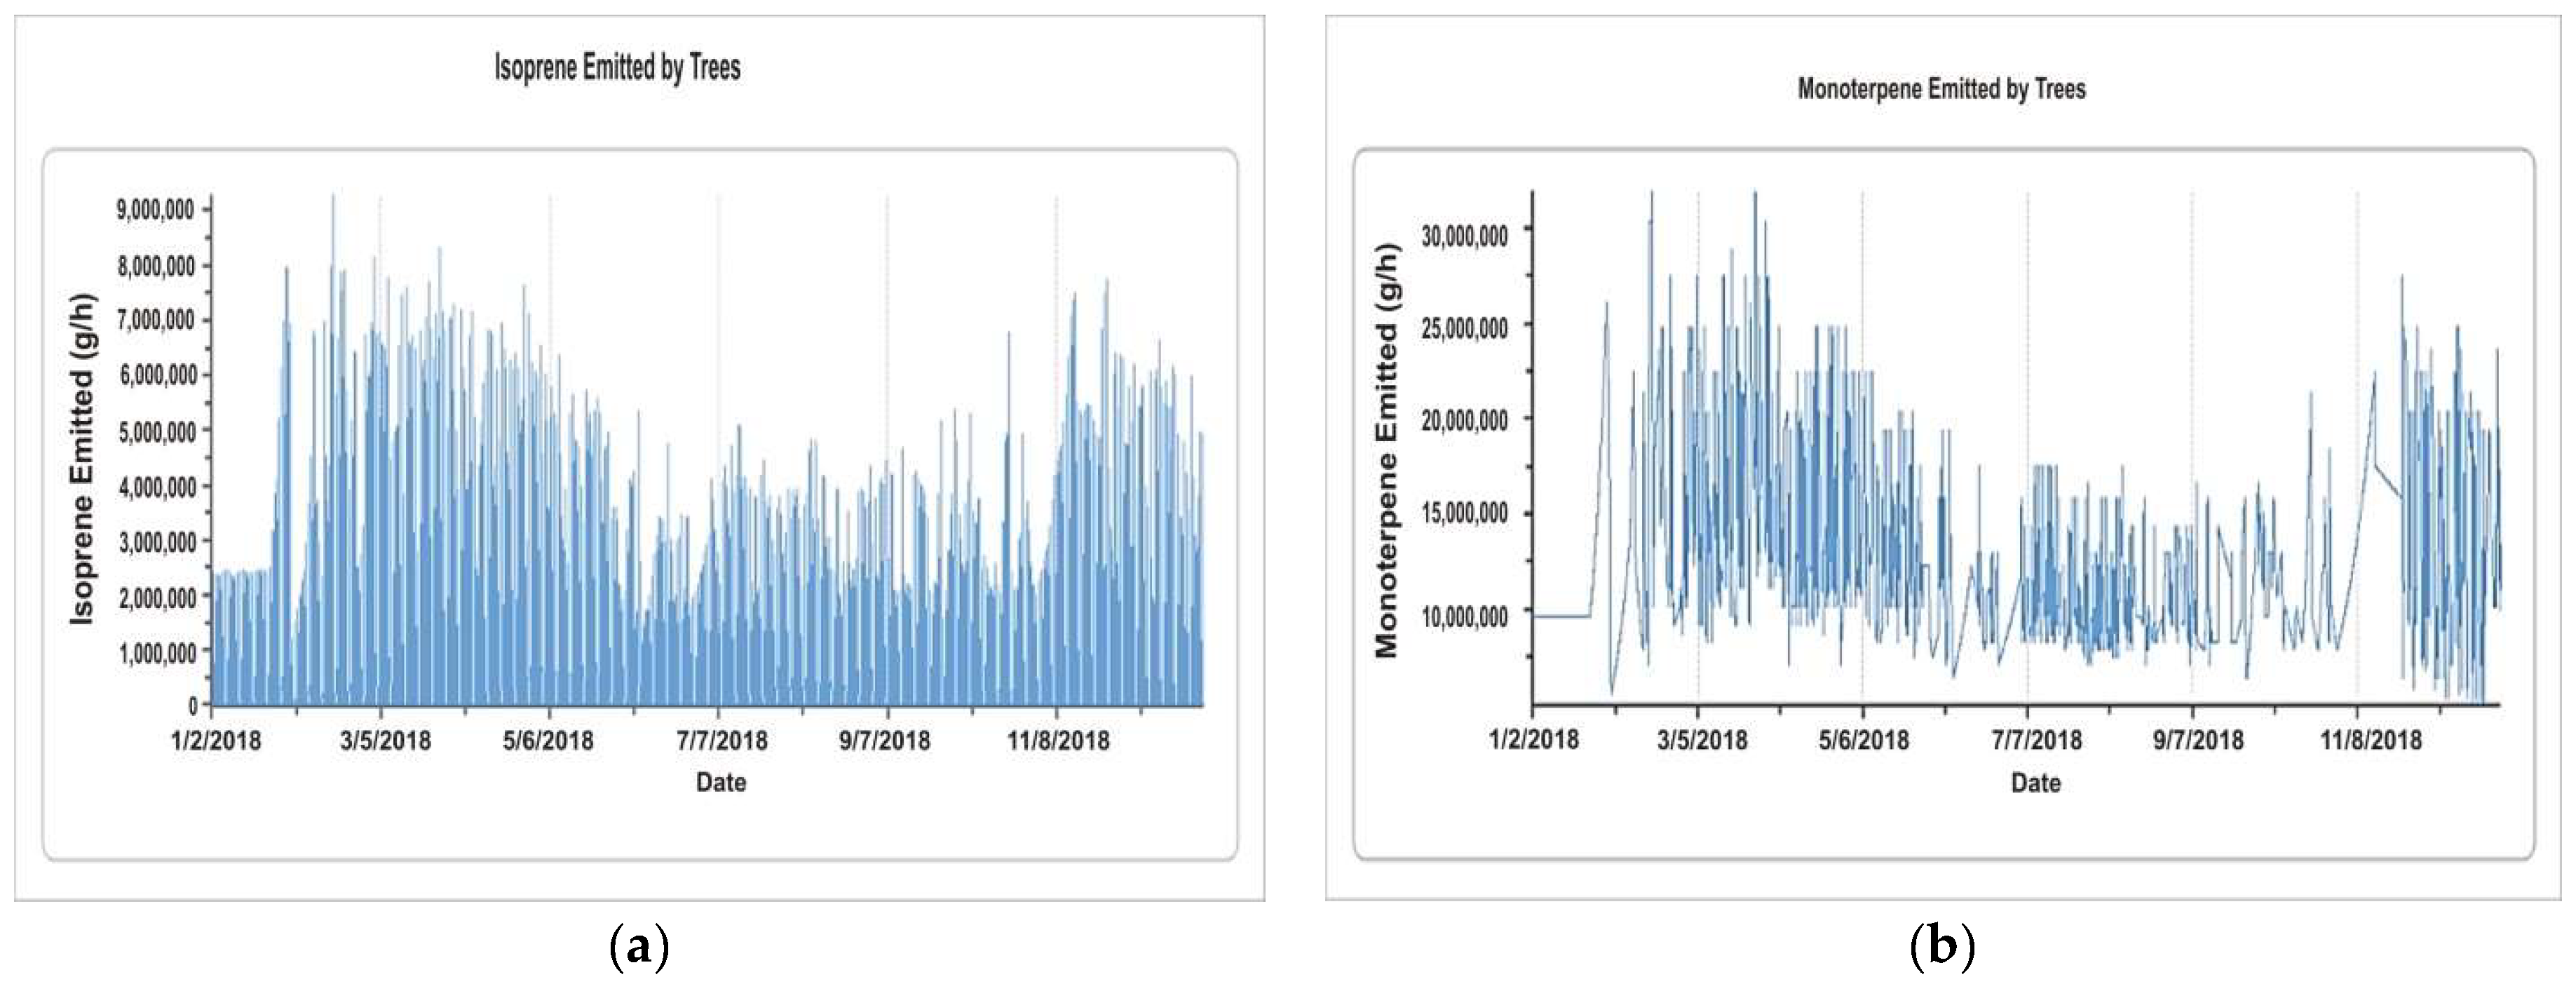
5.1.5. Isoprene and Monoterpene by Trees
The report (Figure 15a) displays hourly estimates of the isoprene emissions of all trees. The report (Figure 15b) also displays hourly estimates of the monoterpene emissions of all trees. Isoprene is generated and exhaled by a wide range of tree species present in this study area. Isoprene emissions by vegetation are estimated to be over 600 million metric tons per year, with half coming from subtropical deciduous forests as well as the rest predominantly through vegetation. This amounts to around one out of all compounds emitted into the atmosphere, roughly similar to methane production. Isoprene accounts for around 80% of hydrocarbon emissions in deciduous woods. Algae, both microscopic and macroscopic, create isoprene, albeit in minor amounts compared to trees. Plant-emitted monoterpenes play an essential role in atmospheric composition by modifying the oxygen consumption of the atmosphere and producing new nanoparticles and pollutants aerosols. Climate change may have an impact on monoterpene emission rates and patterns (Figure 15b).
Figure 15.
(a) Isoprene by trees. (b) Monoterpene by trees. Please note that the blue colour density and variation identify the quantity of isoprene and monoterpene emitted. It is high where blue lines are more dense and limited in quantity whereas the blue lines are less-dense and loosely arranged.

5.2. Air Pollution Removal by Urban Trees
Poor air quality is a problem in many urban areas. It has the potential to negatively impact human health, landscape materials, and ecological processes, as well as reduce visibility. The urban forest can help to improve air quality by decreasing air temperatures, removing pollutants from the air directly, and lowering energy usage in buildings, which reduces power plant air pollution emissions [24]. Dwyer and Nowak [25] earlier stated that trees emit volatile organic compounds that contribute to ozone generation. To estimate pollution clearance by trees in Kainji Park, it is expedient to analyze field data, present pollution, and meteorological data. The most pollutant eliminated was carbon monoxide. Trees are predicted to remove at least 10,000 tons of ozone (O3), carbon monoxide (CO), nitrogen dioxide (NO2), microscopic particles less than 2.5 microns (PM2.5), including sulfur dioxide (SO2) from the atmosphere per year, with an associated value.
The research area’s trees released an estimated 133.1 thousand tons of volatile organic compounds (VOCs) in 2021. (12.45 thousand tons of isoprene and 120.7 thousand tons of monoterpenes). Emissions vary per species, depending on species features (for example, some genera, like oaks, produce a lot of isoprenes) and leaf biomass. Fir spp. and Balsam fir accounted for approximately 80% of the VOC emissions in the urban forest (Table 8). The VOC (volatile organic compound) emissions of each tree in Kainji National Park. Emissions are displayed for monoterpene, isoprene, and the sum of both. These compounds with a high vapour pressure but low water solubility are known as volatile organic compounds. Many VOCs are man-made substances that are utilized and created in the production of paints, cosmetics, and refrigerants, among other things. Chemical solvents, such as trichloroethylene; fuel oxygenates, such as methyl tert-butyl ether (MTBE); or chlorination by-products, such as chloroform, are examples of VOCs. Biofuels, mechanical fluids, spray paint, and dry cleaning solvents all contain VOCs. VOCs are typical pollutants found in the environment.
5.3. Carbon Storage and Sequestration
Anthropogenic global warming and its ramifications on the environment are important worldwide concerns. Every year, trees trap carbon in new growth, reducing the quantity of carbon in the atmosphere. The size and health of the trees affect the quantity of carbon stored each year. The gross sequestration of Kainji National Park trees is about 11.5 million tons of carbon per year. Net carbon sequestration captured in the forest is about 5.207 million tons (see Table 6 and Table 7). Another method that which trees might impact global climate change is through carbon storage [26,27,28,29]. A tree stores more carbon as it develops by storing it in its accumulated tissue. When a tree dies and decays, much of the carbon it has stored is released back into the atmosphere. As a result, carbon storage is a measure of how much carbon may also be released if trees are left to die and degrade. When a tree dies, the wood may be used to make long-lasting wood products, heat buildings, or generate electricity, reducing carbon emissions from decomposition or fossil-fuel or wood-based power plants. Kainji National Park’s trees are believed to contain 573,000,000 tons of carbon (40.1 trillion) in their trunks. Adenaria floribunda stores the most carbon (about 18.7% of the total carbon stored) and Abyssinian Gooseberry sequesters the most among the species studied (approximately 16.2% of all sequestered carbon).
5.4. Oxygen Production
One of the most widely touted benefits of trees is the creation of oxygen (Table 9). The quantity of carbon stored by a tree, which is linked to the buildup of tree biomass, is directly proportional to its net yearly oxygen output. The amount of oxygen produced by trees in the research region is estimated to be 13.89 million tons per year. However, because of the vast and relatively consistent amount of oxygen in the atmosphere and massive generation by aquatic systems, this tree’s benefit is very minor compared to the trees in the Southern region of the country. Most national parks and nature-protected places have a large reservoir of oxygen in their atmosphere. Table 9 shows the number of trees, the net oxygen production, the net carbon sequestration by individual trees and the leaf area annually(kg/year) which varies depending on the bioclimatic features and the season of the year.
Dovyalis abyssinica and Abies species appear to have the highest oxygen production while Acacia adunca has the least and a total of 741 kg of oxygen is been produced in each identified stratum of 25 × 25 km frames covering over 150 sample frames per year in the study area (see Table 9 above).
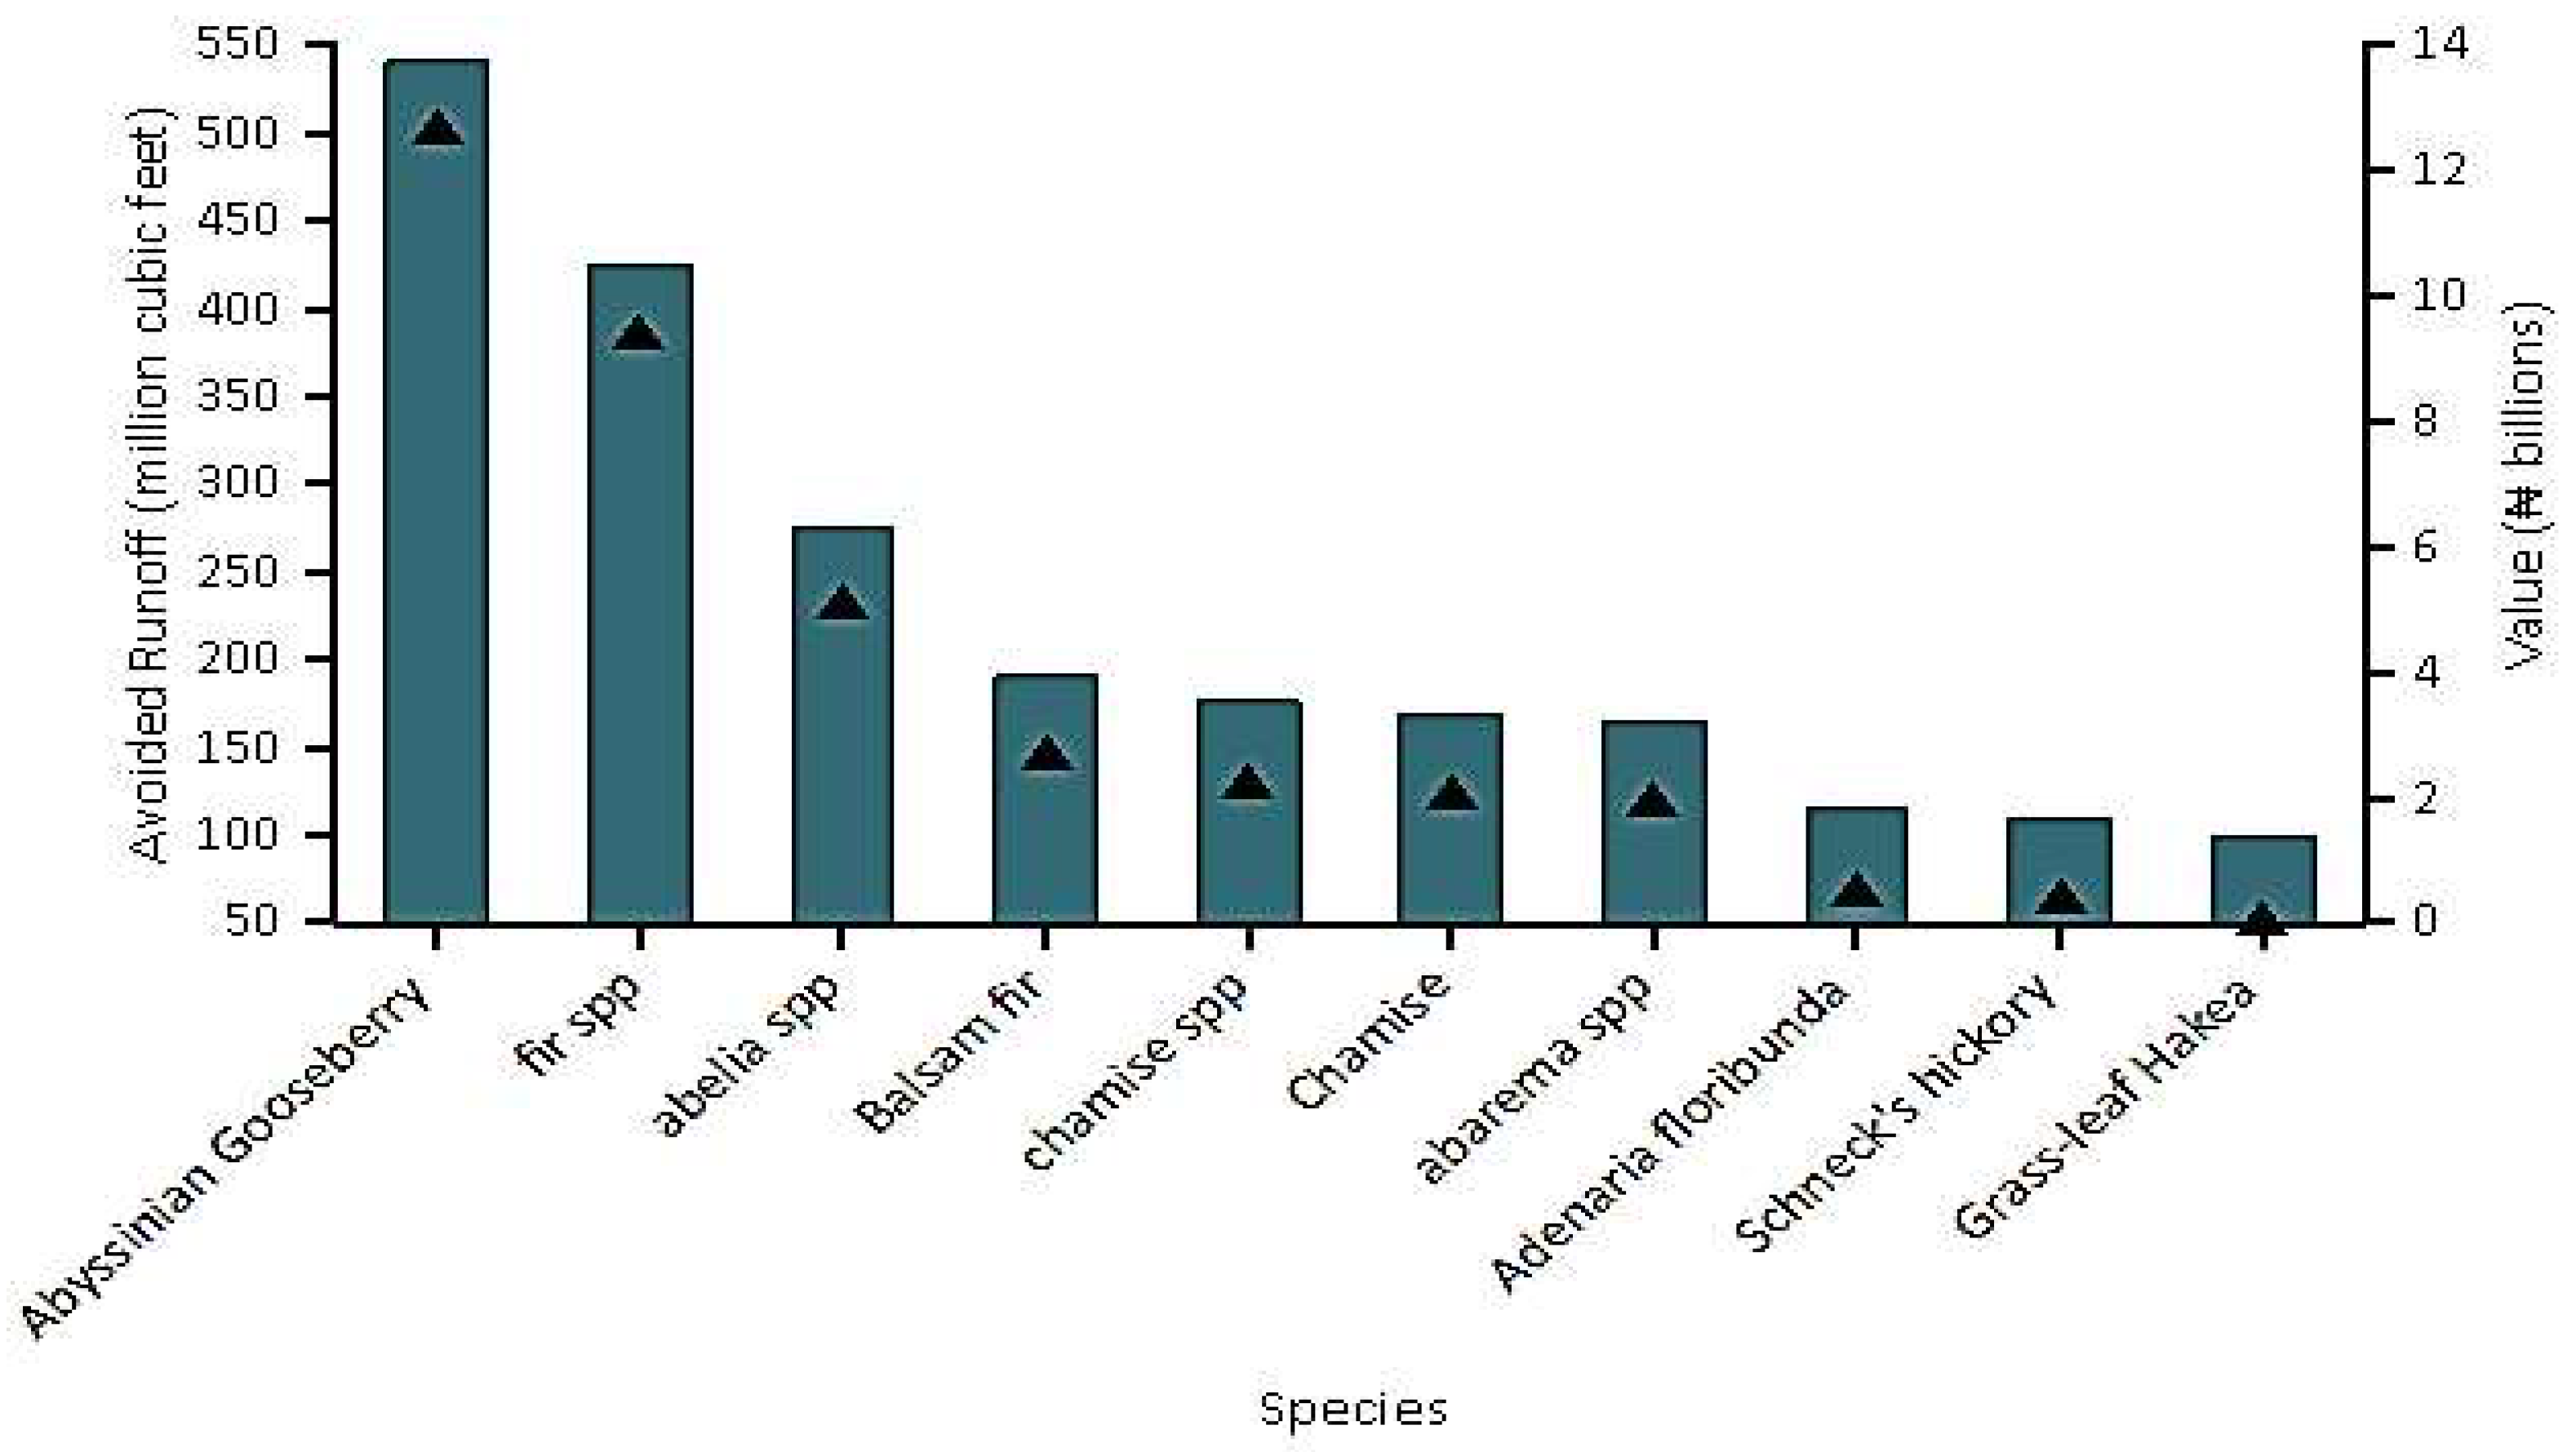
5.5. Avoided Runoff
Surface water runoff from most protected areas may be a source of pollution in streams, marshes, rivers, lakes, and seas, which is a source of worry in many metropolitan areas [30,31,32]. During precipitation events, vegetation (trees and bushes) intercepts some of the precipitation, while the rest reaches the ground (Figure 16 shows the tree species in the study area and the avoided runoff of each). The enormous number of impermeable surfaces in metropolitan areas increases the level of stormwater while the reverse is the case for rural areas where permeable surfaces are enormous. These variations are common in most emerging urban-rural areas of West Africa [33]. Figure 16 identifies and selected the ten (10) most dominant trees and it further revealed that the overall impact of runoff varies according to the tree species. Some of the dominant trees have the greatest impact on intercepting runoffs.
Abyssinian Gooseberry has the most among the species having the highest overall impact of runoff followed by Fir spp, whereas Grass-leaf Hakea appears to be the least tree specie having the least impact of runoff (Figure 16).
However, measuring the changes in the land use and land covers (LULCs) is essential for the sustainable conservation of natural resources, biodiversity protection, food security monitoring, global warming and environmental research [33,34,35,36,37,38,39,40]. The fast-changing LULC not only reduces biodiversity but further depletes the ecosystem services and its values [41]. A better assessment of land-use changes in a protected area is more important than ever, given the growing fast changes in LULC in response to human population expansion in the emerging city mainly due to human factors and impacts [41,42]. Although there are numerous LULC assessment methods available, none of them provides a complete picture of changes and their underlying causes [43,44,45]. Precipitation, underground water, and other drainage basin components in Africa’s floodplain are largely altered by natural pursuits and processes. In both the mountains and the valleys, these operations impact river runs and the availability of sustainable freshwater resources [46]. The findings of the study have extensively highlighted and assessed the microclimatic data that were captured and analyzed the following; the photosynthetically active radiation, rain/precipitation, temperature, transpiration, evaporation, water intercepted by trees, avoided a runoff by trees, potential evaporation by trees, isoprene and monoterpene by trees. The tree benefits of a green, low carbon and sustainable environment within the context of biodiversity conservation can not be downplayed considering carbon storage, carbon sequestration, hydrology effects, pollution removal, oxygen production, and volatile organic compounds (VOCs).
6. Conclusions
Urban trees and bushes, on the other hand, help to reduce surface runoff by doing so, it enhances the ecosystem sustainability and purifies the air quality. Trees and bushes collect rainwater, while their root systems aid in absorption and soil retention. The research site’s trees and bushes assist to minimize runoff by 1.85 billion cubic meters per year. Local weather from the user-designated weather station is used to estimate avoided runoff. The total yearly precipitation in 2018 was 248.92 mm, and the gross oxygen produced was also 740.9 kg/year according to the data gathered for the year 2018 which has slightly increased or decreased as the case may be for the recent years. However, this is relative compared to the remaining regions of the country most especially the south-eastern and south-western regions where the volume of rainfall is higher and the amount of sunshine is low. The study also reveals that the volume of oxygen production reduces according to the individual trees and the leaf area annually (kg/year) and that declines year after year since the recognition of Kainji national park and the immediate forest reserves (nature-protected areas) around the host communities.
This study concludes by stating the need to develop national parks and nature-protected departments and/or forest management committees to help improve biodiversity conservation, forest, and urban air quality. The conservation strategies can come in the form of strict legislation or an increase in the number of healthy flora and fauna. The need to sustain large, healthy trees can not be overemphasized. The usage of fossil fuels to maintain vegetation is being reduced. Experts in conservation must plant trees in energy-saving sites, as well as trees to shade wooded regions. The provision of sufficient water so that the park does not suffer from a long drought or water deficit might result in the extinction of trees and species. The elimination of air pollution by urban trees is equally critical in the maintenance of protected forests, reserved areas and national parks. According to this study, the areas around national parks should not have a high population density and urbanization encroachment since multiple human activities harm biodiversity. Deforestation, uncontrolled burning, and illegal grazing are among the human effects that are particularly prominent in the Kainji National Park’s Zugurma zone. Illegal hunting has resulted in relatively low concentrations of wild animals. Due to the sheer large amount of illicit fishing that takes place in and around Kainji Lake, the lake’s fish farming industry has experienced a significant and incremental loss in the past years, affecting the socio-economic wellbeing of the local host communities.
Remotely-sensed information usually provided a good presentation of national parks and protected areas changing LULCs. The aerial photographs are necessary to research as tools and instruments for mapping, evaluation studies, landscape analysis, and threat identifications. This can also help to achieve biodiversity evaluation and environmental impact assessment. It is also an indication that future strategies of conserving biodiversity in national parks should focus as much on both the community-based participatory approach and the socio-economic dimension of biodiversity conservation while also exploring deeply the scientific study of species (biota) and habitats (ecosystems). At the national level, there have to be strict government policies against illegal logging of forest wood and non-wood and timber products and illegal poaching activities causing deforestation in all the reserved forest areas and national parks in the country, West Africa and entire Sub-Saharan Africa.
Supplementary Materials
The following supporting information can be downloaded at: https://www.mdpi.com/article/10.3390/su14127322/s1. Supplementary Materials File: i-Tree Eco Metadata Report_Appendix_Tang & Adesina, 2021.
Author Contributions
Conceptualization, X.T.; Data curation, J.A.A.; Formal analysis, X.T. and J.A.A.; Funding acquisition, X.T.; Methodology, J.A.A.; Project administration, X.T.; Resources, X.T.; Software, J.A.A.; Supervision, X.T.; Validation, X.T. and J.A.A.; Visualization, X.T. and J.A.A.; Writing—original draft, J.A.A.; Writing—review and editing, X.T. and J.A.A. All authors have read and agreed to the published version of the manuscript.
Funding
This research received funding from the General project of the National Natural Science Foundation of China, 31270746; Project of the research center for forest heritage and forest environmental history of National Forestry and Grassland Administration in 2021, 2021LYYB02; Project of agricultural and forestry work committee of China Graduate Degree and Education Association in 2019, 2019-NLZX-ZD15; Case base of professional degree postgraduate courses in Nanjing Forestry University in 2018, 2018AL07.
Institutional Review Board Statement
Not applicable.
Informed Consent Statement
Not applicable.
Data Availability Statement
Not applicable.
Acknowledgments
The authors express sincere appreciation to the editorial team and anonymous reviewers for reviewing this manuscript.
Conflicts of Interest
The authors declare no conflict of interest.
References
- Conservation International. 2007. Available online: https://www.yumpu.com/en/document/view/37491711/annual-report-2008-library-conservation-international (accessed on 1 December 2021).
- United Nations Environment Programme, World Conservation Monitoring Centre. Kainji Lake National Park. 2007. Available online: https://web.archive.org/web/20070930012150/unep-wcmc.org/sites/pa/0302p.htm (accessed on 1 December 2021).
- Kapos, V.; Werner, A.; Kurz, T.; Gardner, J.F.; Guariguata, M.; Koh, L.P.; Mansourian, S. Impacts of forest and land management on biodiversity and carbon. IUFRO World Ser. 2012, 31, 53–80. Available online: https://www.fs.usda.gov/treesearch/pubs/47890 (accessed on 1 December 2021).
- Eagles, P.F.J.; McCool, S.F. Tourism in National Parks and Protected Areas: Planning and Management; Cabi: Wallingford, UK, 2002. [Google Scholar]
- Brown, J.; Brent, M. Extending the reach of national parks and protected areas: Local stewardship initiatives. In National Parks and Protected Areas; Springer: Berlin/Heidelberg, Germany, 1997; pp. 103–116. [Google Scholar] [CrossRef]
- Clerici, N.; Salazar, C.; Pardo-Díaz, C.; Jiggins, C.D.; Richardson, J.E.; Linares, M. Peace in Colombia is a critical moment for Neotropical connectivity and conservation: Save the northern Andes–Amazon Biodiversity Bridge. Conserv. Lett. 2019, 12, e12594. [Google Scholar] [CrossRef]
- Mittermeier, R.A. Conservation International and biodiversity conservation. Nature 2000, 405, 254. [Google Scholar] [CrossRef]
- Mallon, C.A.; Poly, F.; Le Roux, X.; Marring, I.; van Elsas, J.D.; Salles, J.F. Resource pulses can alleviate the biodiversity–invasion relationship in soil microbial communities. Ecology 2015, 96, 915–926. [Google Scholar] [CrossRef] [PubMed] [Green Version]
- International Union for Conservation of Nature; International Union for Conservation of Nature, Natural Resources; Species Survival Commission; IUCN Species Survival Commission. IUCN Red List Categories and Criteria; IUCN: Gland, Switzerland, 2001. [Google Scholar]
- Imarhiagbe, O.; Egboduku, W.O.; Nwankwo, B.J. A review of the biodiversity conservation status of Nigeria. J. Wildl. Biodivers. 2020, 4, 73–83. [Google Scholar] [CrossRef]
- Akindele, E.O.; Ekwemuka, M.C.; Apeverga, P.; Amusa, T.O.; Olajuyigbe, S.; Coker, O.M.; Fatsuma, O.; Abiodun, A. Assessing awareness on biodiversity conservation among Nigerians: The Aichi Biodiversity Target 1. Biodivers. Conserv. 2021, 30, 1947–1970. [Google Scholar] [CrossRef]
- Radić, B.; Gavrilovic, S. Natural Habitat Loss: Causes and Implications of Structural and Functional Changes. In Life on Land; Springer: Berlin/Heidelberg, Germany, 2021; pp. 699–712. [Google Scholar]
- Mukherjee, S. Globalisation and the political economy of protected areas. In Globalisation, Environment and Social Justice; Routledge: Delhi, India, 2018; pp. 109–129. Available online: https://www.taylorfrancis.com/chapters/edit/10.4324/9780429455766-5/globalisation-political-economy-protected-areas-sudeshna-Mukherjee (accessed on 1 December 2021).
- Day, J.; Dudley, N.; Hockings, M.; Holmes, G.; Laffoley, D.D.A.; Stolton, S.; Wells, S.M. Guidelines for Applying the IUCN Protected Area Management Categories to Marine Protected Areas; IUCN: Gland, Switzerland, 2012. [Google Scholar]
- Ortiz, M.J. Aichi biodiversity targets direct and indirect drivers of biodiversity loss. Environ. Law Rev. 2011, 13, 100–106. [Google Scholar] [CrossRef]
- Newbold, T.; Adams, G.L.; Robles, G.A.; Boakes, E.H.; Ferreira, G.B.; Chapman, A.S.A.; Etard, A.; Gibb, R.; Millard, J.; Outhwaiteet, C.L.; et al. Climate and land-use change homogenise terrestrial biodiversity, with consequences for ecosystem functioning and human well-being. Emerg. Top. Life Sci. 2019, 3, 207–219. [Google Scholar] [CrossRef]
- Essl, F.; Guillaume, L.; Lenzner, B.; Pagad, S.; Seebens, H.; Smith, K.; Wilson, J.R.U.; Genovesi, P. The Convention on Biological Diversity (CBD)’s Post-2020 target on invasive alien species—What should it include and how should it be monitored? NeoBiota 2020, 62, 99. Available online: https://neobiotapensoft.net/article/53972/download/pdf (accessed on 1 December 2021). [CrossRef]
- Morgera, E. Dawn of a New Day: The Evolving Relationship between the Convention on Biological Diversity and International Human Rights Law. Wake For. Rev. 2018, 53, 691. Available online: https://heinonline.org/hol-cgi-bin/get_pdf.cgi?handle=hein.journals/wflr53§ion=30 (accessed on 1 December 2021). [CrossRef] [Green Version]
- Prip, C. The Convention on Biological Diversity as a legal framework for safeguarding ecosystem services. Ecosyst. Serv. 2018, 29, 199–204. [Google Scholar] [CrossRef] [Green Version]
- Opoku, A. Biodiversity and the built environment: Implications for the Sustainable Development Goals (SDGs). Resour. Conserv. Recycl. 2019, 141, 1–7. [Google Scholar] [CrossRef]
- Osunsina, I.O.O.; Osunsina, J.; Oduntan, O.O.; Oladiran, Y.; Moyaki, O.T. Awareness and perception of climate change and variability among indigenous people living around Nigerian national parks. Afr. J. Agric. Technol. Environ. 2019, 8, 47–61. Available online: https://www.researchgate.net/profile/Israel-Osunsina/publication/.pdf (accessed on 1 December 2021).
- Elijah, E.; Ojeh, V.N.; Philip, A.H.; Joshua, M.M.; Bonchak, G. Land Transformation of Tropical Forest Conservation of Gashaka-Gumti National Park, Nigeria from 1987–2014. Asian J. Environ. Ecol. 2019, 9, 1–17. Available online: https://www.researchgate.net/publication/332975202_Land_Transformation_of_Tropical_Forest_Conservation_of_Gashaka-Gumti_National_Park_Nigeria_from_1987-2014 (accessed on 1 December 2021).
- Brankov, J.; Glavonjić, T.J.; Pešić, A.M.; Petrović, M.D.; Tretiakova, T.N. Residents’ perceptions of tourism impact on the community in national parks in Serbia. Eur. Ctry. 2019, 11, 124–142. Available online: https://www.researchgate.net/publication/332456114_Residents'_Perceptions_of_Tourism_Impact_on_Community_in_National_Parks_in_Serbia (accessed on 1 December 2021). [CrossRef] [Green Version]
- Convention on Biological Diversity Secretariat of the Convention on Biological Diversity. 2007. Montreal. Available online: https://www.cbd.int/doc/reports/cbd-report-2006-en.pdf (accessed on 1 December 2021).
- Dwyer, J.F.; Nowak, D.J. A national assessment of the urban forest: An overview. Soc. Am. For. 2000, 2000, 157–162. Available online: https://www.researchgate.net/publication/279562620_Sustaining_urban_forests (accessed on 1 December 2021).
- Rana, K.; Munesh, K.; Amit, K. Assessment of annual shoot biomass and carbon storage potential of Grewia optiva: An approach to combat climate change in Garhwal Himalaya. Water Air Soil Pollut. 2020, 231, 1–13. [Google Scholar] [CrossRef]
- Nunes, L.J.R.; Meireles, C.I.R.; Pinto Gomes, C.J.; Almeida Ribeiro, N. Forest contribution to climate change mitigation: Management oriented to carbon capture and storage. Climate 2020, 8, 21. [Google Scholar] [CrossRef] [Green Version]
- Tschora, H.; Cherubini, F. Co-benefits and trade-offs of agroforestry for climate change mitigation and other sustainability goals in West Africa. Glob. Ecol. Conserv. 2020, 22, e00919. [Google Scholar] [CrossRef]
- Goodwin, M.J.; North, M.P.; Zald, H.S.J.; Hurteau, M.D. Changing climate reallocates the carbon debt of frequent-fire forests. Glob. Chang. Biol. 2020, 26, 6180–6189. [Google Scholar] [CrossRef]
- Jovanelly, T.J.; Rodríguez-Montero, L.; Sánchez-Gutiérrez, R.; Mena-Rivera, L.; Thomas, D. Evaluating watershed health in Costa Rican national parks and protected areas. Sustain. Water Resour. Manag. 2020, 6, 1–14. [Google Scholar] [CrossRef]
- Abd-Elaty, I.; Alban, K.; El Shahawy, A. Environmental rethinking of wastewater drains to manage environmental pollution and alleviate water scarcity. Nat. Hazards 2021, 110, 2353–2380. [Google Scholar] [CrossRef]
- Sikdar, P.K. Environmental Management: Issues and Concerns. In Environmental Management: Issues and Concerns in Developing Countries; Springer: Berlin/Heidelberg, Germany, 2021; pp. 1–21. [Google Scholar] [CrossRef]
- Thakholi, L. Conservation labour geographies: Subsuming regional labour into private conservation spaces in South Africa. Geoforum 2021, 123, 1–11. [Google Scholar] [CrossRef]
- Cotillon, S.E. West Africa Land Use and Land Cover Time Series; No. 2017-3004; US Geological Survey: Reston, VA, USA, 2017. [Google Scholar] [CrossRef]
- Akodéwou, A.; Oszwald, J.; Saïdi, S.; Gazull, L.; Akpavi, S.; Akpagana, K.; Gond, V. Land use and land cover dynamics analysis of the Togodo Protected Area and its surroundings in Southeastern Togo, West Africa. Sustainability 2020, 12, 5439. [Google Scholar] [CrossRef]
- Bah, O.A.; Tidiani, K.; Yaffa, S.; Ndiaye, M.L. Land use and land cover dynamics in central river region of The Gambia, West Africa from 1984 to 2017. Am. J. Mod. Energy 2019, 5, 5–18. [Google Scholar] [CrossRef]
- Reid, R.S.; Kruska, R.L.; Muthui, N.; Taye, A.; Wotton, S.; Wilson, C.J.; Mulatu, W. Land-use and land-cover dynamics in response to changes in climatic, biological and socio-political forces: The case of southwestern Ethiopia. Landsc. Ecol. 2020, 15, 339–355. [Google Scholar] [CrossRef]
- Ouedraogo, I.; Tigabu, M.; Savadogo, P.; Compaoré, H.; Odén, P.C.; Ouadba, J.M. Land cover change and its relation with population dynamics in Burkina Faso, West Africa. Land Degrad. Dev. 2010, 21, 453–462. [Google Scholar] [CrossRef]
- Houessou, L.G.; Teka, O.; Imorou, I.T.; Lykke, A.M.; Sinsin, B. Land use and land-cover change at “W” Biosphere Reserve and its surrounding areas in the Benin Republic (West Africa). Environ. Nat. Resour. Res. 2013, 3, 87. [Google Scholar] [CrossRef]
- Kumi, S.; Addo-Fordjour, P.; Fei-Baffoe, B.; Belford, E.J.D.; Ameyaw, Y. Land use land cover dynamics and fragmentation-induced changes in woody plant community structure in a mining landscape, Ghana. Trees For. People 2021, 4, 100070. [Google Scholar] [CrossRef]
- Makwinja, R.; Mengistou, K.S.; Alamirew, T. Impact of land use/land cover dynamics on ecosystem service value—A case from Lake Malombe, Southern Malawi. Environ. Monit. Assess. 2021, 193, 1–23. [Google Scholar] [CrossRef]
- Sinonmatohou, T.D.; Hu, S.; Fan, X.; Ali, M.R. Tropical coastal land-use and land cover changes impact on ecosystem service value during rapid urbanization of Benin, West Africa. Int. J. Environ. Res. Public Health 2021, 18, 7416. [Google Scholar] [CrossRef]
- Gbedzi, D.D.; Ofosu, E.A.; Mortey, E.M.; Obiri-Yeboah, A.; Nyantakyi, E.K.; Siabi, E.K.; Abdallah, F.; Domfeh, M.K.; Amankwah-Minkah, A. Impact of mining on land use land cover change and water quality in the Asutifi North District of Ghana, West Africa. Environ. Chall. 2022, 6, 100441. [Google Scholar] [CrossRef]
- Kindu, M.; Tibebe, D.; Nigussie, D.; Schneider, T.; Döllerer, M.; Teketay, D.; Knoke, T. Understanding Land Use/Land Cover Dynamics in and Surrounding the Ethiopian Church Forests. In State of the Art in Ethiopian Church Forests and Restoration Options; Springer: Berlin/Heidelberg, Germany, 2022; pp. 11–30. [Google Scholar] [CrossRef]
- Achugbu, I.C.; Olufayo, A.A.; Balogun, I.A.; Adefisan, E.A.; Dudhia, J.; Naabil, E. Modeling the spatiotemporal response of dew point temperature, air temperature and rainfall to land use land cover change over West Africa. Modeling Earth Syst. Environ. 2022, 8, 173–198. [Google Scholar] [CrossRef]
- Tang, X.; Adesina, J.A. Integrated Watershed Management Framework and Groundwater Resources in Africa—A Review of West Africa Sub-Region. Water 2022, 14, 288. [Google Scholar] [CrossRef]
Figure 1.
The objectives and key components of biodiversity conservation.

Figure 2.
(a) Map showing the recognized National Parks of Nigeria. (b) Kainji Lake, Kainji National Park (Photo credit: Jeremy Weate, 2015).
Figure 2.
(a) Map showing the recognized National Parks of Nigeria. (b) Kainji Lake, Kainji National Park (Photo credit: Jeremy Weate, 2015).

Figure 3.
(a) Landsat Imageries of Kainji Lake National Park, 1972. (b) Landsat Imageries of Kainji Lake National Park, 1986. (c) Landsat Imageries of Kainji Lake National Park, 2015. Source: Maps adapted and modified from The U.S. Geological Survey, https://eros.usgs.gov/westafrica/biodiversity-protected-areas, (accessed on 1 December 2021).


Figure 4.
(a) Map of Kainji National Park (showing the three zones—Zugurma, Borgu, and Lake Kainji Zones) in 150 sample frames. (b) Soil elevation of the study area. (c) Stratification of the study area.
Figure 4.
(a) Map of Kainji National Park (showing the three zones—Zugurma, Borgu, and Lake Kainji Zones) in 150 sample frames. (b) Soil elevation of the study area. (c) Stratification of the study area.


Figure 5.
Tree species distribution within the study area.

Figure 6.
Distribution map showing the tree species sampling.

Figure 7.
Chart showing the percentage of tree species population by area of native origin.

Figure 8.
Percentage of species distribution by DBH Class.

Figure 9.
Pie chart showing the population summary by species.

Figure 10.
(a) Estimated annual gross Carbon Sequestration and value for park tree species with the greatest sequestration. (b) Estimated annual gross Carbon Storage and value for park tree species with the greatest storage. This ▲ indicates the progressive movement of the quantity (volume) and ecosystem services value gotten from each tree species.

Figure 16.
The chart shows the avoided runoff and the value for the species with the greatest overall impact of runoff. This ▲ indicates the progressive movement (increase) of the quantity(volume) and ecosystem services value gotten from each tree species.
Figure 16.
The chart shows the avoided runoff and the value for the species with the greatest overall impact of runoff. This ▲ indicates the progressive movement (increase) of the quantity(volume) and ecosystem services value gotten from each tree species.


Table 1.
Composition and structure of individual trees.
| Plot ID | Tree ID | Species Name | DBH | Height | Crown Height | Crown Width | Canopy Cover | Tree Condition | Leaf Area | Leaf Biomass | Leaf Area Index | Basal Area |
|---|---|---|---|---|---|---|---|---|---|---|---|---|
| (cm) | (m) | (m) | (m) | (m2) | (m2) | (kg) | (m2) | |||||
| 1 | 1 | Abies | 35.0 | 30.0 | 10.0 | 15.0 | 176.7 | Critical | 558.1 | 78.6 | 3.2 | 0.1 |
| 1 | 2 | Abelia | 35.4 | 20.0 | 9.0 | 8.0 | 50.3 | Poor | 334.1 | 17.5 | 6.6 | 0.1 |
| 1 | 3 | Dovyalis abyssinica | 35.0 | 60.0 | 10.0 | 20.0 | 314.2 | Critical | 728.9 | 62.3 | 2.3 | 0.1 |
| 1 | 4 | Abarema | 35.0 | 35.0 | 10.0 | 17.5 | 240.5 | Critical | 171.8 | 14.8 | 0.7 | 0.1 |
| 1 | 5 | Abies balsamea | 50.0 | 30.0 | 2.0 | 15.0 | 176.7 | Critical | 209.1 | 21.8 | 1.2 | 0.2 |
| 1 | 6 | Acacia adunca | 50.0 | 20.0 | 3.0 | 12.5 | 122.7 | Critical | 11.6 | 2.8 | 0.1 | 0.2 |
| 1 | 7 | Lagarostrobos franklinii | 15.0 | 30.0 | 6.0 | 12.5 | 122.7 | Poor | 11.5 | 1.4 | 0.1 | 0.0 |
| 1 | 8 | Adenostoma | 40.0 | 65.0 | 10.0 | 12.5 | 122.7 | Critical | 187.5 | 14.1 | 1.5 | 0.1 |
| 1 | 9 | Adenaria floribunda | 25.0 | 30.0 | 11.0 | 17.5 | 240.5 | Critical | 60.2 | 7.8 | 0.3 | 0.0 |
| 1 | 10 | Salix fragilis | 10.0 | 25.0 | 1.0 | 12.5 | 122.7 | Critical | 5.5 | 0.3 | 0.0 | 0.0 |
| 1 | 11 | Hakea francisiana | 20.0 | 20.0 | 2.0 | 12.5 | 122.7 | Critical | 73.6 | 9.0 | 0.6 | 0.0 |
| 1 | 12 | Acacia argyrophylla | 40.0 | 35.0 | 12.0 | 17.0 | 227.0 | Critical | 43.6 | 10.5 | 0.2 | 0.1 |
| 1 | 13 | Adenaria floribunda | 50.0 | 40.0 | 15.0 | 25.0 | 490.9 | Dying | 36.3 | 4.7 | 0.1 | 0.2 |
| 1 | 14 | Carya x schneckii | 28.0 | 30.0 | 10.0 | 16.5 | 213.8 | Critical | 89.4 | 6.0 | 0.4 | 0.1 |
| 1 | 15 | Adenostoma fasciculatum | 45.0 | 35.0 | 5.0 | 10.0 | 78.5 | Dying | 177.2 | 13.3 | 2.3 | 0.2 |
| Total | 2822.7 | 2698.6 | 265.0 | 1.6 |
Table 2.
Composition of individual trees by species.
| Species Name | Tree Count Value % | Canopy Cover (m2) Value % | Leaf Area (m2) Value % | Leaf Biomass (kg) Value % | Basal Area (m2) Value % | |||||
|---|---|---|---|---|---|---|---|---|---|---|
| Abarema | 1 | 6.7 | 240.5 | 8.5 | 171.8 | 6.4 | 14.8 | 5.6 | 0.1 | 6.2 |
| Abelia | 1 | 6.7 | 50.3 | 1.8 | 334.1 | 12.4 | 17.5 | 6.6 | 0.1 | 6.3 |
| Abies | 1 | 6.7 | 176.7 | 6.3 | 558.1 | 20.7 | 78.6 | 29.7 | 0.1 | 6.2 |
| Abies balsamea | 1 | 6.7 | 176.7 | 6.3 | 209.1 | 7.7 | 21.8 | 8.2 | 0.2 | 12.6 |
| Acacia adunca | 1 | 6.7 | 122.7 | 4.3 | 11.6 | 0.4 | 2.8 | 1.1 | 0.2 | 12.6 |
| Acacia argyrophylla | 1 | 6.7 | 227.0 | 8.0 | 43.6 | 1.6 | 10.5 | 4.0 | 0.1 | 8.1 |
| Adenaria floribunda | 2 | 13.3 | 731.4 | 25.9 | 96.5 | 3.6 | 12.5 | 4.7 | 0.2 | 15.8 |
| Adenostoma | 1 | 6.7 | 122.7 | 4.3 | 187.5 | 6.9 | 14.1 | 5.3 | 0.1 | 8.1 |
| Adenostoma fasciculatum | 1 | 6.7 | 78.5 | 2.8 | 177.2 | 6.6 | 13.3 | 5.0 | 0.2 | 10.2 |
| Carya x schneckii | 1 | 6.7 | 213.8 | 7.6 | 89.4 | 3.3 | 6.0 | 2.3 | 0.1 | 4.0 |
| Dovyalis abyssinica | 1 | 6.7 | 314.2 | 11.1 | 728.9 | 27.0 | 62.3 | 23.5 | 0.1 | 6.2 |
| Hakea francisiana | 1 | 6.7 | 4.3 | 4.3 | 73.6 | 2.7 | 9.0 | 3.4 | <0.1 | 2.0 |
| Lagarostrobos franklinii | 1 | 6.7 | 122.7 | 4.3 | 11.5 | 0.4 | 1.4 | 0.5 | <0.1 | 1.1 |
| Salix fragilis | 1 | 6.7 | 122.7 | 4.3 | 5.5 | 0.2 | 0.3 | 0.1 | <0.1 | 0.5 |
| Total | 15 | 100 | 2822.7 | 100 | 2698.6 | 100 | 265.0 | 100 | 1.6 | 100 |
Table 3.
Summary of the biodiversity data and corresponding values.
| Summary | Ecosystem Service Values (Approx Values) |
|---|---|
| The number of trees | 563,500,000 (an average of 3,700,000 in each sample frame) |
| Tree Cover | 63.0% |
| Most common species of trees | Adenaria floribunda, Crack willow, Huon Pine connoted species. |
| Percentage of trees less than 15.2 cm diameter | 13.3% |
| Pollution Removal | N/A—data not collected |
| Carbon Storage | 519.4 million metric tons (40.1 trillion NGN) |
| Carbon Sequestration | 10.44 million metric tons (806 billion NGN /year) |
| Oxygen Production | 12.6 million metric tons/year |
| Avoided Runoff | 52.5 million cubic meters/year (50.9 billion NGN/year). |
Table 4.
Table showing the percentage of live tree population by area of native origin.
| Stratum | Africa | Europe and Asia | North America | North America + | Oceania | South America | Unknown |
|---|---|---|---|---|---|---|---|
| Urban | 6.7 | 6.7 | 20.0 | 6.7 | 26.7 | 13.3 | 20.0 |
The ‘+’ symbol denotes that the species is native to a continent other than those specified in the grouping. Europe and Asia +, for example, denotes that the species is native to Europe, Asia, and at least one additional continent.
Table 5.
Tables showing the population summary by species.
| Species | Number of Trees | Percentage of Population |
|---|---|---|
| Adenaria floribunda | 75,128,717 | 13.3% |
| Salix fragilis | 37,564,359 | 6.7% |
| Lagarostrobos franklinii | 37,564,359 | 6.7% |
| Hakea francisiana | 37,564,359 | 6.7% |
| Carya x schneckii | 37,564,359 | 6.7% |
| Adenostoma fasciculatum | 37,564,359 | 6.7% |
| Adenostoma | 37,564,359 | 6.7% |
| Acacia argyrophylla | 37,564,359 | 6.7% |
| Acacia adunca | 37,564,359 | 6.7% |
| Abies balsamea | 37,564,359 | 6.7% |
| Dovyalis abyssinica | 37,564,359 | 6.7% |
| Abarema | 37,564,359 | 6.7% |
| Abelia | 37,564,359 | 6.7% |
| Abies | 37,564,359 | 6.7% |
| Total | 563,465,378 | 100% |
Table 6.
The table shows the Carbon Storage of Individual Trees.
| Plot ID | Tree ID | Species Name | Carbon Storage (kg) | % of Total |
|---|---|---|---|---|
| 1 | 1 | Abies | 851.1 | 6.2 |
| 1 | 2 | Abelia | 598.0 | 4.3 |
| 1 | 3 | Dovyalis abyssinica | 1605.9 | 11.6 |
| 1 | 4 | Abarema | 980.1 | 7.1 |
| 1 | 5 | Abies balsamea | 592.5 | 4.3 |
| 1 | 6 | Acacia adunca | 1128.4 | 8.2 |
| 1 | 7 | Lagarostrobos franklinii | 88.5 | 0.6 |
| 1 | 8 | Adenostoma | 2206.9 | 16.0 |
| 1 | 9 | Adenaria floribunda | 459.5 | 3.3 |
| 1 | 10 | Salix fragilis | 28.5 | 0.2 |
| 1 | 11 | Hakea francisiana | 147.9 | 1.1 |
| 1 | 12 | Acacia argyrophylla | 1251.8 | 9.1 |
| 1 | 13 | Adenaria floribunda | 2129.1 | 15.4 |
| 1 | 14 | Carya x schneckii | 565.5 | 4.1 |
| 1 | 15 | Adenostoma fasciculatum | 1193.4 | 8.6 |
| Total | 13,827.0 | 100% |
This study used the tropical carbon equations of i-Tree Eco will limit carbon storage to a maximum of 7500 kg (16,534.7 lbs) in these estimates, analysis and empirical projections.
Table 7.
The table shows the Carbon Sequestration of Individual Trees.
| Plot ID | Tree ID | Species Name | Carbon Sequestration (kg/year) | % of Total |
|---|---|---|---|---|
| 1 | 1 | Abies | 44.9 | 16.2 |
| 1 | 2 | Abelia | 27.9 | 10.0 |
| 1 | 3 | Dovyalis abyssinica | 45.1 | 16.2 |
| 1 | 4 | Abarema | 29.6 | 10.6 |
| 1 | 5 | Abies balsamea | 8.9 | 3.2 |
| 1 | 6 | Acacia adunca | 0.9 | 0.3 |
| 1 | 7 | Lagarostrobos franklinii | 9.0 | 3.2 |
| 1 | 8 | Adenostoma | 34.4 | 12.4 |
| 1 | 9 | Adenaria floribunda | 25.0 | 9.0 |
| 1 | 10 | Salix fragilis | 5.3 | 1.9 |
| 1 | 11 | Hakea francisiana | 9.2 | 3.3 |
| 1 | 12 | Acacia argyrophylla | 14.6 | 5.3 |
| 1 | 13 | Adenaria floribunda | 0.1 | 0.0 |
| 1 | 14 | Carya x schneckii | 20.2 | 7.3 |
| 1 | 15 | Adenostoma fasciculatum | 2.7 | 1.0 |
| Total | 277.8 | 100% |
Table 8.
The table shows the VOC Emissions by Individual Trees.
| Plot ID | Tree ID | Species Name | Isoprene (g/year) | Monoterpene (g/year) | VOCs (g/year) |
|---|---|---|---|---|---|
| 1 | 1 | Abies | 118.1 | 1875.7 | 1993.9 |
| 1 | 2 | Abelia | 0.0 | 0.0 | 0.0 |
| 1 | 3 | Dovyalis abyssinica | 4.1 | 49.6 | 53.6 |
| 1 | 4 | Abarema | 90.4 | 38.6 | 128.9 |
| 1 | 5 | Abies balsamea | 32.7 | 519.7 | 552.4 |
| 1 | 6 | Acacia adunca | 0.1 | 54.6 | 54.6 |
| 1 | 7 | Lagarostrobos franklinii | 0.0 | 0.0 | 0.0 |
| 1 | 8 | Adenostoma | 0.0 | 40.4 | 40.4 |
| 1 | 9 | Adenaria floribunda | 25.8 | 27.9 | 53.7 |
| 1 | 10 | Salix fragilis | 13.2 | 0.9 | 14.1 |
| 1 | 11 | Hakea francisiana | 0.6 | 14.2 | 14.8 |
| 1 | 12 | Acacia argyrophylla | 0.2 | 204.7 | 205.0 |
| 1 | 13 | Adenaria floribunda | 15.6 | 16.8 | 32.4 |
| 1 | 14 | Carya x schneckii | 0.0 | 33.3 | 33.3 |
| 1 | 15 | Adenostoma fasciculatum | 0.0 | 38.2 | 38.2 |
| Total | 300.7 | 2914.7 | 3215.4 |
Table 9.
The table shows Oxygen Production by Trees.
| Plot ID | Tree ID | Species Name | Oxygen Production (kg/year) |
|---|---|---|---|
| 1 | 1 | Abies | 119.8 |
| 1 | 2 | Abelia | 74.3 |
| 1 | 3 | Dovyalis abyssinica | 120.3 |
| 1 | 4 | Abarema | 78.9 |
| 1 | 5 | Abies balsamea | 23.7 |
| 1 | 6 | Acacia adunca | 2.3 |
| 1 | 7 | Lagarostrobos franklinii | 24.0 |
| 1 | 8 | Adenostoma | 91.8 |
| 1 | 9 | Adenaria floribunda | 66.7 |
| 1 | 10 | Salix fragilis | 14.3 |
| 1 | 11 | Hakea francisiana | 24.7 |
| 1 | 12 | Acacia argyrophylla | 38.9 |
| 1 | 13 | Adenaria floribunda | 0.3 |
| 1 | 14 | Carya x schneckii | 53.7 |
| 1 | 15 | Adenostoma fasciculatum | 7.2 |
| Total | 740.9 |
Publisher’s Note: MDPI stays neutral with regard to jurisdictional claims in published maps and institutional affiliations. |
© 2022 by the authors. Licensee MDPI, Basel, Switzerland. This article is an open access article distributed under the terms and conditions of the Creative Commons Attribution (CC BY) license (https://creativecommons.org/licenses/by/4.0/).
Share and Cite
MDPI and ACS Style
Tang, X.; Adesina, J.A. Biodiversity Conservation of National Parks and Nature-Protected Areas in West Africa: The Case of Kainji National Park, Nigeria. Sustainability 2022, 14, 7322. https://doi.org/10.3390/su14127322
AMA Style
Tang X, Adesina JA. Biodiversity Conservation of National Parks and Nature-Protected Areas in West Africa: The Case of Kainji National Park, Nigeria. Sustainability. 2022; 14(12):7322. https://doi.org/10.3390/su14127322
Chicago/Turabian StyleTang, Xiaolan, and John Adekunle Adesina. 2022. "Biodiversity Conservation of National Parks and Nature-Protected Areas in West Africa: The Case of Kainji National Park, Nigeria" Sustainability 14, no. 12: 7322. https://doi.org/10.3390/su14127322
Note that from the first issue of 2016, this journal uses article numbers instead of page numbers. See further details here.