
Analyzing the Characteristics of Green Bond Markets to Facilitate Green Finance in the Post-COVID-19 World


1
Social Science Research Institute, Tokai University, Hiratsuka-shi 259-1292, Japan
2
Faculty of Economics, Keio University, Tokyo 108-8345, Japan
3
Economic Research Institute for ASEAN and East Asia (ERIA), Jakarta 10270, Indonesia
*
Author to whom correspondence should be addressed.
Sustainability 2021, 13(10), 5719; https://doi.org/10.3390/su13105719
Submission received: 7 April 2021
/
Revised: 2 May 2021
/
Accepted: 9 May 2021
/
Published: 20 May 2021
(This article belongs to the Collection Secure and Sustainable Energy System)
Abstract
:The COVID-19 pandemic and the global recessions have reduced the investments in green projects globally that would endanger the achievement of the climate-related goals. Therefore, the post-COVID-19 world needs to adopt the green financial system by introducing new financial instruments. In this regard, green bonds—a type of debt instrument aiming to finance sustainable infrastructure projects—are growing in popularity. While the literature does not contest their effectiveness in fighting climate change, research highlights the high level of risks and low returns associated with this instrument. This study analyzes the green bond markets in different regions with a focus on Asia and the Pacific. It aims to fill the gap in the literature by conducting a comparative study of the characteristics, risks, and returns of green bonds based on the region. The study is based on theoretical background and empirical analysis using the data retrieved from Bloomberg New Energy Finance and the Climate Bonds Initiative. The empirical results are based on several econometrics tests using panel data analysis estimation methods, namely pooled ordinary least squares and generalized least squares random effects estimator. Our findings prove that green bonds in Asia tend to show higher returns but higher risks and higher heterogeneity. Generally, the Asian green bonds market is dominated by the banking sector, representing 60% of all issuance. Given that bonds issued by this sector tend to show lower returns than average, we recommend policies that could increase the rate of return of bonds issued by the banking sector through the use of tax spillover. In the era of post-COVID-19, diversification of issuers, with higher participation from the public sector and de-risking policies, could also be considered.
1. Introduction
Since the beginning of the century, the world has been consistently growing at around 3%, without following a sustainable path. The past decade (2010–2020) has been marked by rising environmental awareness and demand for the promotion of renewable energy sources. Alarming reports from the Intergovernmental Panel on Climate Change have shown that climate change is a pressing matter that needs to be addressed, and in 2015, United Nations members agreed on keeping global warming below 2 °C through Nationally Determined Contributions. The United Nations also acknowledged the matter by including ‘Climate Action’ in the Sustainable Development Goals (SDGs). Yet, the Intergovernmental Panel on Climate Change and the United Nations Environment Program reports highlight that further actions need to be taken to reach this goal and fulfill the SDGs. Several SDGs are directly and indirectly related to green and low-carbon energy developments and the environment. SDG 7 (affordable and clean energy) and SDG13 (climate action) are directly related. SDG3 (good health and well-being), SDG14 (life below water), and SDG15 (life on land) are indirectly related. This means that the UN global agenda clarified the importance of green energy and reducing pollutions (CO2 or NOx).
One of the biggest barriers in the development of renewable energy is the low level of investment [1]. As of 2018, the majority of the world’s investment in energy still went to carbon-emitting sources—fossil fuels. For instance, while 39% of investments in power supply generation went to renewable energy, they only represented 19% of total investments in the energy sector [2]. In comparison, fossil fuels received about 60% of total investments in the same year [2], with the remainder going to nuclear, biofuels, or battery storage, which are still, to a lesser extent, sources of greenhouse gas (GHG) emissions.
In 2020–2021 due to the COVID-19 pandemic and the global economic recession, the ongoing investment in renewable power, energy efficiency, and other green projects fell drastically. The COVID-19 pandemic and the economic downturns resulted in a drastic reduction in fossil fuel prices. Low fossil fuel price is harmful to developing renewable energy projects, making solar, wind, and other renewable energy resources less competitive electricity sources. This reduces investors’ interest in clean fuels that would threaten the Paris Agreement on climate change and several SDGs.
Funding green infrastructure projects remains an issue. In general, these projects require large borrowings, as they are capital-intensive [3]. In addition, green projects are usually associated with ‘high risk and low returns at the initial research and development stage’ [4]. Difficulties in accessing finance for green projects is especially the case in Asia, whose financial sector is dominated by banks; hence, banks are the main source of funding [1]. Venture capitalists are scarce in Asia, including East and Southeast Asia [3], although they are more likely to provide funds for green projects, while banks generally deem green projects risky [4]. In addition to risk overvaluation, the authors of [5] highlighted the existence of a maturity mismatch between bank loans, which are generally short-term, and green projects, which are thought to be medium- to long-term projects. Thus, banks are not usually well-suited to providing loans for green projects. Second-level financial institutions (e.g., insurance or pension funds) may provide funds for longer-term projects as they hold long-term money but are reluctant to invest in electricity projects whose tariffs are generally regulated by the public sector [5]. Overall, traditional finance is failing to provide enough funding for green projects, so there is a need for innovative finance or the establishment of a green financial system to fill this gap. Introducing new financial instruments such as green bonds besides the conventional banking system will help fill the green finance gap required to achieve the related SDGs.
This research aims at analyzing green bonds—a special type of green finance instrument and an essential part of the green financial system.
Green bonds are fixed-income securities whose popularity has increased significantly in the past few years. While their definition varies, they are usually understood as a form of debt instrument used to finance green projects, such as renewable energy infrastructure or projects that comprise an energy efficiency dimension. The Asia and the Pacific regions have been increasing the use of this instrument to bridge the gap between infrastructure projects and access to financing. In 2018, Asia and the Pacific achieved the highest regional growth of green bond issuance, with an annual rate of 35% [6]. The region has consistently been the second-largest issuer of green bonds by volume since 2016 and accounts for the most diverse pool of issuers in the world, with 345 different institutions [7]. While this new instrument may be favored in Asia, one cannot help but wonder how the peculiar nature of the Asian financial sector, which is dominated by traditional forms of banking, may affect the characteristics of green bonds issued in the region, in terms of associated returns and risks. The recent literature on the topic has shown that green bonds tend to show lower returns than their conventional counterparts [8,9,10,11]. The lower return of the green bonds is due to their intrinsic characteristics. Green bonds are financial instruments designed to fund green infrastructure and green technologies. Green technologies and generally green projects (such as renewable energy technologies) are often earlier in the development stage and not always commercially viable compared to the brown projects (such as fossil fuel-based energy projects) field, where many of them date back to 100 years ago [12,13]. This makes green technologies more expensive and riskier ventures. As a result, the rate of return of green bonds is expected to lower compared to conventional bonds. In addition to this, other reasons make green projects more expensive. According to the OECD Companion to the Inventory of Support Measures for Fossil Fuels 2015, the production or consumption of fossil fuels is supported by almost 800 individual policies [14]. Another form of subsidy, an indirect one, takes place when fossil fuel companies are not taxed efficiently [15].
Refer. [16,17] showed that the green bond market was more volatile and hence riskier than the conventional bond market. However, the studies mentioned above conducted global analyses of green bonds, even though issuers’ regional characteristics may play a crucial role in determining the risks and returns of these instruments.
There are several reasons behind the hypothesis that the characteristics of green bonds may depend on the region of issuance. First, economic theory and empirical research confirm that the performance of fixed-income instruments is highly dependent on macroeconomic variables such as changes in financial markets, economic uncertainty, or daily economic activity [18]. Therefore, it is likely that the performance and associated risks of green bonds vary depending on the region’s economic activity or the investors’ uncertainty evaluation and risk aversion. A second rationale for this hypothesis comes from the difference in the inherent characteristics of financial markets, based on the region, as previously explained. The research questions of this study are (i) how do green bonds in Asia compare in terms of size and time to maturity with green bonds issued in other regions? Do they differ because of the characteristics of Asian financial markets? (ii) In terms of return and risk, how do green bonds in Asia compare with green bonds from the rest of the world? (iii) Does the type of issuer affect the performance of the bond? In particular, does the influence of the issuer depend on the region?
This research aims to fill the gap in the literature by conducting a comparative study of the characteristics of green bonds, based on the region. In particular, we seek to determine whether the domination of traditional banking has an impact on the return of green bonds issued in Asia and the Pacific.
The study is organized as follows: Section 2 presents a literature review, which discusses green finance and recent academic debates related to green bonds. Section 3 introduces the dataset used in this study and discusses our methodology. Section 4 shows the empirical results of this research, and Section 5 concludes this paper and provides policy recommendations.
2. Literature Review
2.1. An Introduction to Green Finance and Green Bonds
The concept of green finance emerged in the 2010s and can be defined as ‘a type of future-oriented finance that simultaneously pursues the development of financial industry, improvement of the environment, and economic growth’ [4]. Green finance is a broad concept that includes sustainable finance for socially inclusive green projects, environmental finance to promote environmental protection, carbon finance, targeting a reduction in GHG emissions, and climate finance, focusing on climate change adaptation and mitigation [4]. The term ‘green finance’ also covers a wide range of instruments, from private loans to insurance, and includes equity, derivatives, and fiscal or investment funds [4].
Increasing green finance, climate finance, and low-carbon investments are directly and indirectly related to various SDGs. Investments in green energy projects are crucial to achieve the SDGs and meet the Paris Agreements [1]. Fiscal policy has an essential role in assuring the sustainable use of resources and keeping the environment for meeting the related SDGs. This applied to both sides of the government budget. In the revenue side, carbon taxation adjusted with greenness efforts and green bonds are two essential tools, and their importance is increasing. Various fiscal measures could help green-specific priority sectors. Green-adjusted tax on polluting gases can help generate revenue for environmental purposes and redirect the flow of investments from brown to green and low-carbon sectors by introducing green floating rate bonds [5,13]. Another fiscal measure is global taxation on CO2, NOX, and other pollutions, for bringing back optimal portfolio allocation in green investments.
In this research, we focus on green bonds. Since their creation in 2007, USD754 billion worth of green bonds have been issued—primarily in the United States, China, and France—in compliance with the Green Bond Principles [7]. Green bonds can be issued by central and local governments, banks, or corporations, and include any debt format [6]. Since 2014, Asia-Pacific’s bond issuance has been growing at 35%, placing the region second in terms of green bond volume [6]. Figure 1 shows the evolution of the amount issued for green bonds, per region of issuance. The graph clearly shows that green bonds are a relatively new form of financial instrument, as their issuance started timidly in the early 2010s and skyrocketed after 2015. Europe is the leading issuer of green bonds, although Asia-Pacific has witnessed steady growth in recent years.
Increasing awareness of climate change could be the reason behind the surge in popularity of this instrument. Typically, green bonds are a form of fixed-income finance which can be applied to many debt formats, such as private placements, securitizations, and covered bonds, as well as green loans [7]. The particularity of this form of finance is their target, as the term only encompasses finance for climate change solutions whose proceeds go to green assets [7]. To clarify which bonds could be qualified as such, a consortium of investment banks established the Green Bonds Principles in 2014, based on four main components: (i) the use of the proceeds, (ii) the process for project evaluation and selection, (iii) the management of the proceeds, and (iv) reporting [19]. The principles do not define what is ‘green’ about the bonds, but merely list target sectors in which green bonds are considered valid. However, these principles simply have an indicative value, and were only agreed on by the investment banks that created them. To date, there is no general taxonomy for green bonds, although the European Union has proposed including one in the upcoming European Green Deal [7].
2.2. Characteristics and Challenges of Green Bonds
The increasing popularity of this instrument has attracted the attention of academic researchers. Studies have provided some empirical proof that green bonds can be useful in fighting climate change [20]. The main academic debate regarding green bonds is the existence of the ‘green premium’, also called ‘greenium’, defined as ‘a discount that makes green bonds funded cheaper than other bonds from the same issuer’ [8,21]. Many recent studies have attempted to compare the yields of green bonds with those of conventional bonds, and the results vary depending on the methodology used. The authors of [11] conducted a global study, matching green bonds with similar conventional bonds and applying a two-step regression method, and concluded that green bonds had lower yields, on average. This effect was especially pronounced for bonds issued by the financial sector and low-rated bonds [11]. This conclusion is shared by recent studies such as [8,10,11].
Other studies, however, tend to have mixed results. For instance, [22] showed that the green premium was actually positive, meaning that matched green bonds had higher yields than their closest brown counterparts. The authors explain their results by arguing that the sign of the green premium depends on the issuer, and that privately issued bonds generally have a positive premium [22]. Similarly, [23] found that the sign of the green premium was not obvious, and depended on the rating achieved by the bond. In particular, highly rated green bonds consistently showed higher returns, which, the authors argued, could make up for the external costs of issuance [23,24]. Finally, [25] could not find statistically significant evidence of the existence of the green premium, even though they used several methodologies such as matching with difference-in-differences and traditional panel techniques (fixed effect). Due to the lack of consensus regarding the green premium, [26] provided a comprehensive literature review on the topic, detailing the methodology of each paper. The authors concluded that the majority of the studies on the topic prove the existence of a green premium in secondary markets.
Interestingly, there does not appear to be a consensus on the riskiness of green bonds either. While [22] found that green bonds had lower variance than conventional bonds, the results of [16], who studied the volatility of the green bond market using a multivariate GARCH approach, contradict this theory. The authors of [16] proved that the market of labeled green bonds was highly volatile—far more so than the unlabeled market of conventional bonds. There is a close link between green bonds and fixed-income and currency markets, with the latter’s green bonds receiving price spillover from the latter [27]. Generally, green bonds are strongly affected by changes in stock, changes in energy, and high-yield corporate bond markets [28], as well as the liquidity risk of the bond market [29].
Apart from their generally low returns and high risks, green bonds also represent a challenge for their issuers. Both [23] and [27] highlighted that issuing green bonds tends to be more expensive than issuing a conventional bond due to additional costs arising from the certification, reporting, and administrative burden of the proceeds. The authors of [27] also pointed out the need to bridge the informational gap between issuers and investors and offer clear and unified green criteria to provide assurance of the green nature of the investment [27]. The major issue faced by green bonds is generally the lack of uniform definition and labeling. While the Green Bonds Principles are a major step towards this direction, they remain an informal form of labeling that was only generated by a handful of private actors. Hence, it does not have global legitimacy.
A review of the literature has revealed the evolution and contribution of green bonds. As fixed-income instruments, green bonds can be useful in fighting climate change and bridging the investment gap for green projects. At the same time, these bonds are characterized by lower returns and higher risks than their conventional counterparts. Administrative costs arising from certification and lack of uniform taxonomy have added to their relative lack of attractiveness. Nevertheless, there is ongoing debate regarding the characteristics of green bonds, particularly the existence of a green premium, while results tend to vary depending on the bond rating and issuer [22,23].
A literature review shows that green bonds are essential financial instruments for financing ecological and green projects, and that their importance is increasing. However, we could not find any study that provides a comparative study of the characteristics of green bonds, based on the region. In particular, we could not find any study that determines whether the domination of traditional banking impacts the return of green bonds issued in Asia and the Pacific. Hence, from this aspect, this study is novel and contributes to the literature.
3. Methodology and Data Description
In this section, we detail the approach taken in this study to determine the regional characteristics of green bonds, with a specific focus on those issued in Asia and the Pacific.
3.1. Data and Description of Variables
The study combined two datasets from Bloomberg New Energy Finance (BNEF) and the Climate Bonds Initiative (CBI). The BNEF database only provides bonds with an issued amount of at least $100. Both sources are considered authorities on data related to green finance and have been employed in many recent studies (e.g., [9,11,22,23,24]). In this research, we only focus on green bonds with a minimum of $100 in size, issued from 2017 to 2020. Hence, this study presents an analysis of unbalanced panel data of 1014 bonds, from 2017 to 2020, for a total of 1174 observations. To be precise, since we are missing many observations of the rate of return of bonds in 2017 and 2018, the length of the panel is about two time periods. A description of the variables used in the study is provided in Table 1.
3.2. Methodology
To determine the characteristics of green bonds, we propose several methods, each assessing different dimensions of bonds. First, an analysis of the distribution of issuers, maturity, and issued size is proposed, to determine whether green bonds issued in Asia present an inherent difference in their nature. We then move on to a mean-variance analysis, distinguishing between regions and sectors of issuance, to discuss how Asian green bonds compare with their counterparts in terms of risks and returns. Finally, the latter part of the empirical analysis is devoted to investigating the impact of the sector of issuance on the performance of green bonds, as measured by the rate of return, depending on the region.
To this end, we develop an econometric model, which is given by the following equation:
where denotes the rate of return of bond i at year t, is a set of dummy variables denoting the bond i’s issuing sector, is a set of dummy variables for time fixed-effects, is the bond i’s coupon rate, denotes the number of days until the bond i reaches maturity at year t, and and are idiosyncratic and time-varying error terms, respectively.
While many studies use yield as a dependent variable [11,22,23], we decided to use the rate of return of the bonds as our dependent variable, as an approximation of the bond’s performance, due to limitations on data availability. Since this study aims to determine the impact of the type of issuer on the bond’s performance, we also include a set of four dummy variables, representing the issuer’s sector, constructed based on the issuer name provided by BNEF. Sectors analyzed in the study are grouped into five categories: public, banking and finance, manufacturing, power and utilities, and other issuers. Public issuers are generally state and regional development banks and international organizations, but we do not include state-owned enterprises in this category. Banking and finance are essentially composed of national and local banking institutions, but investment banks and insurance are also considered. Finally, manufacturing in our sample is mostly composed of information technology and paper companies, while other issuers are dominated by companies belonging to real estate and construction.
The choice of remaining control variables is based on existing literature on the topic. The coupon rate, issued size, and maturity are often used in studies tackling the existence of the green premium, as they are essential components for matching green and brown bonds [11,22] or as control variables in regression [8,23,24]. Furthermore, we decided to include year fixed-effects to control for variation over time since our other control variables describe fixed characteristics of bonds. The variable is time-dependent, but its variation is fixed over time so it cannot fully capture changes in time periods. We aim to capture the effects of changes in the financial market and economic policy uncertainty through these dummy variables, as these macroeconomic variables were shown to have a significant impact on green bonds’ returns. The authors of [18,25] took a similar approach by including year fixed-effects as a control variable in their regression.
4. Empirical Analysis
This section presents the results of the empirical analysis and is divided into three parts. The study will first discuss the characteristics of green bonds, based on summary statistics and a general description of the dataset, and will move on to mean-variance and regression analysis.
4.1. Summary Statistics
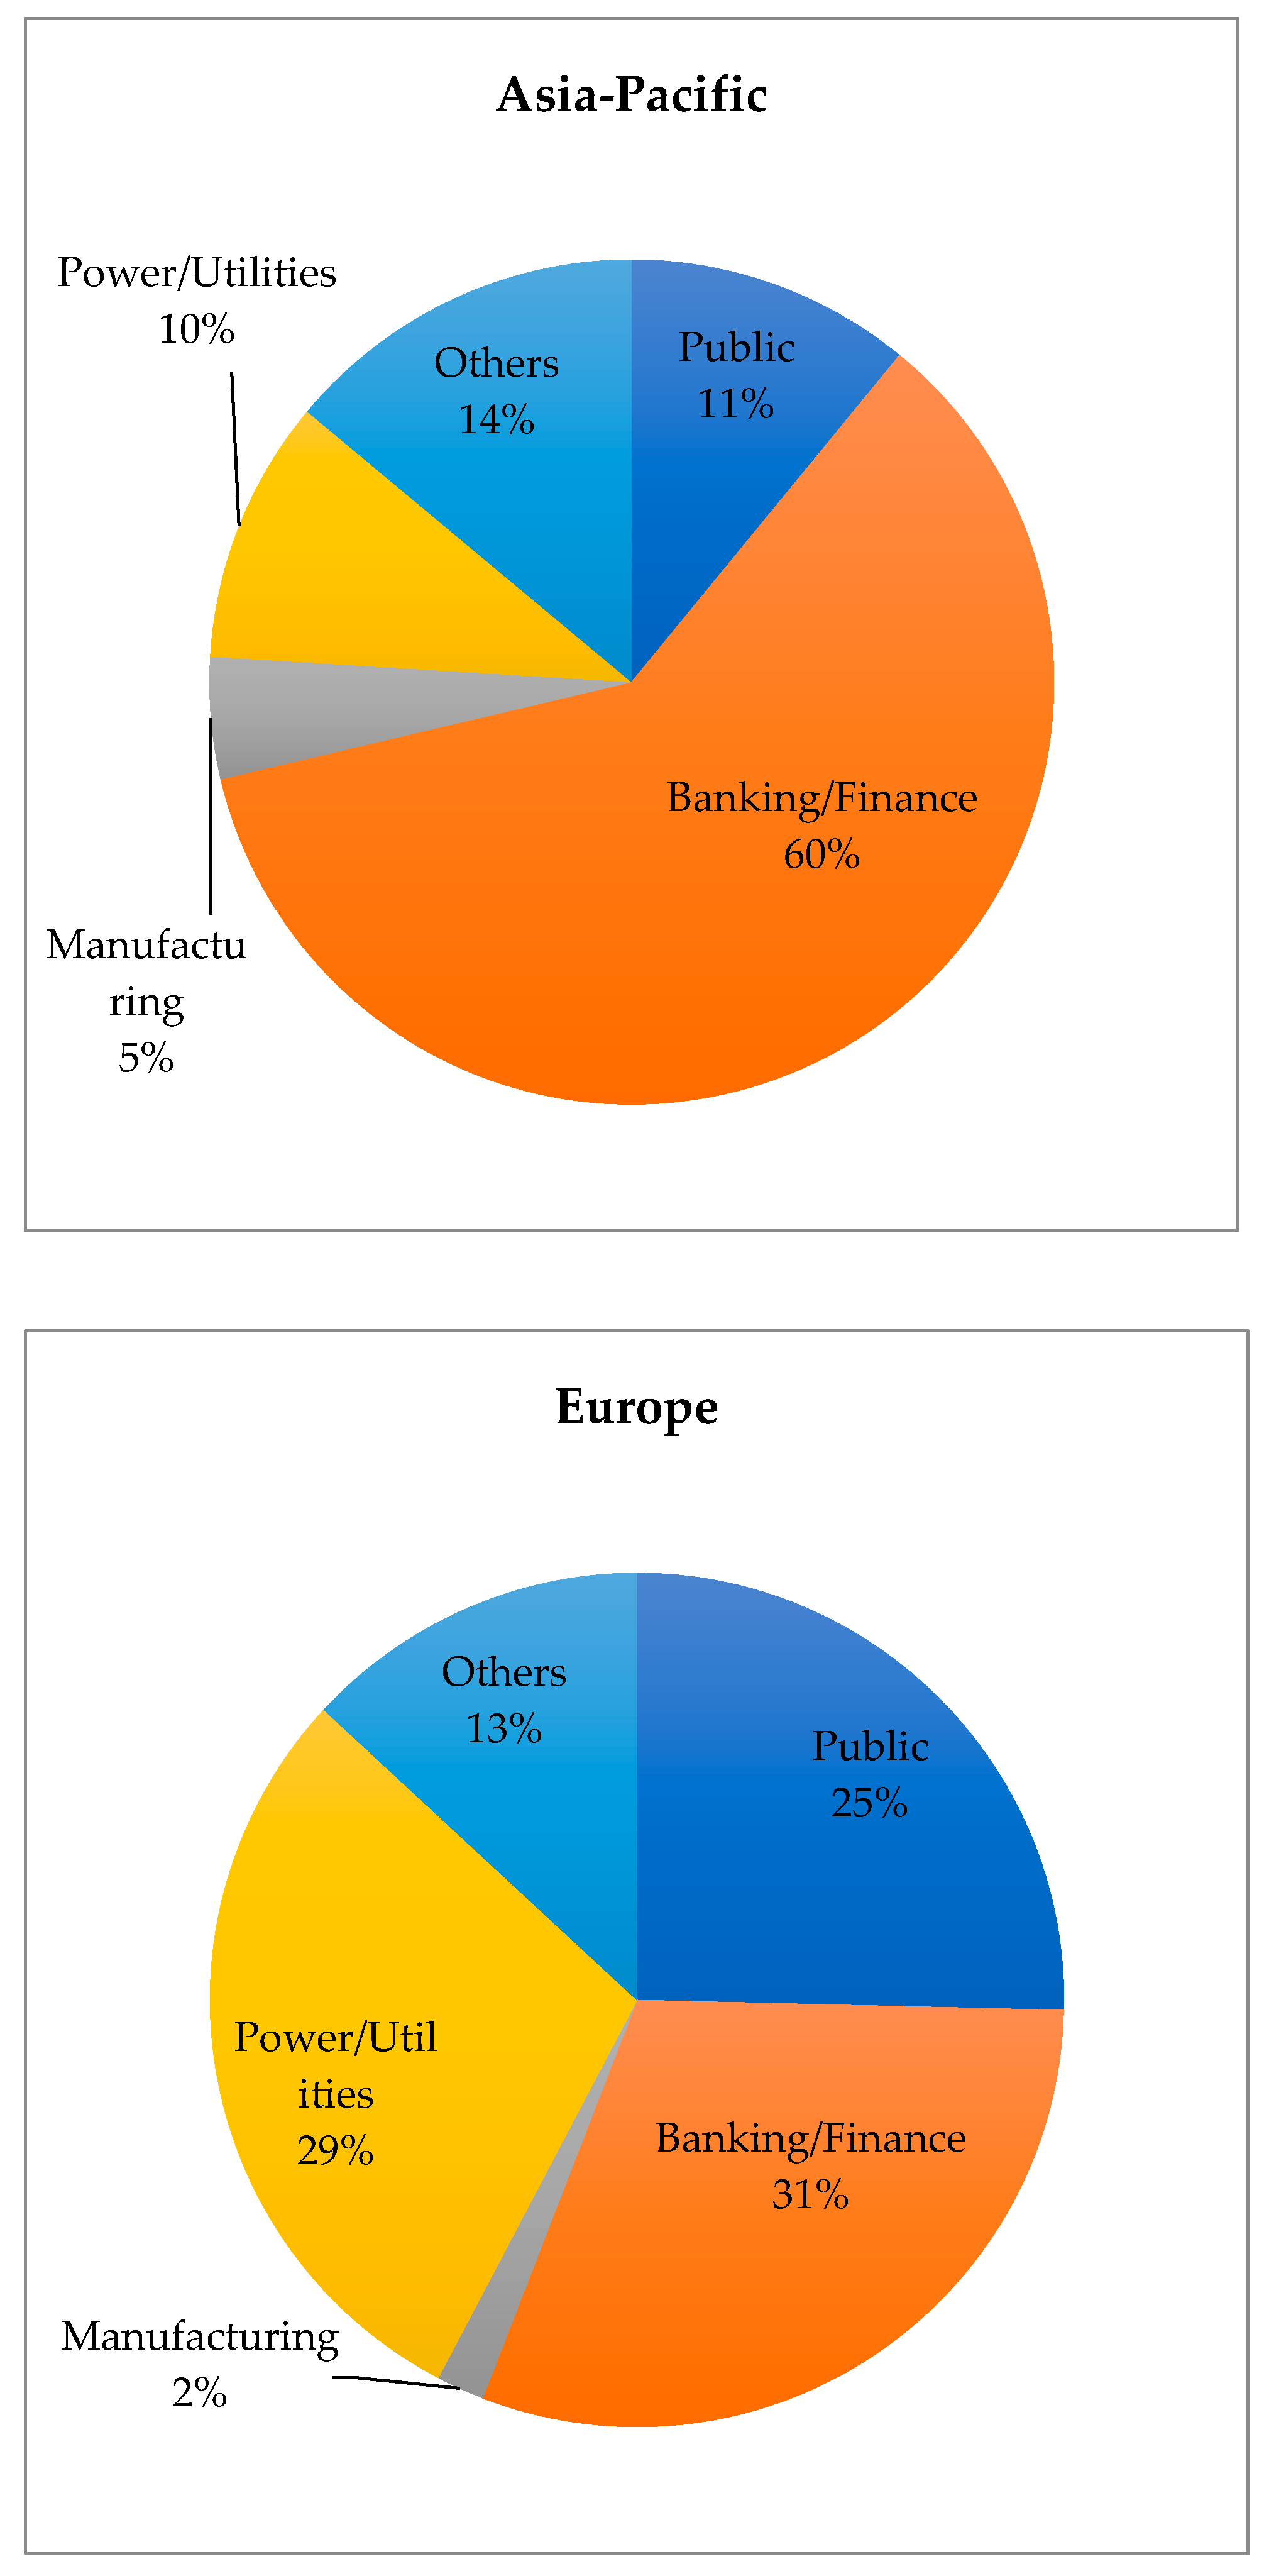
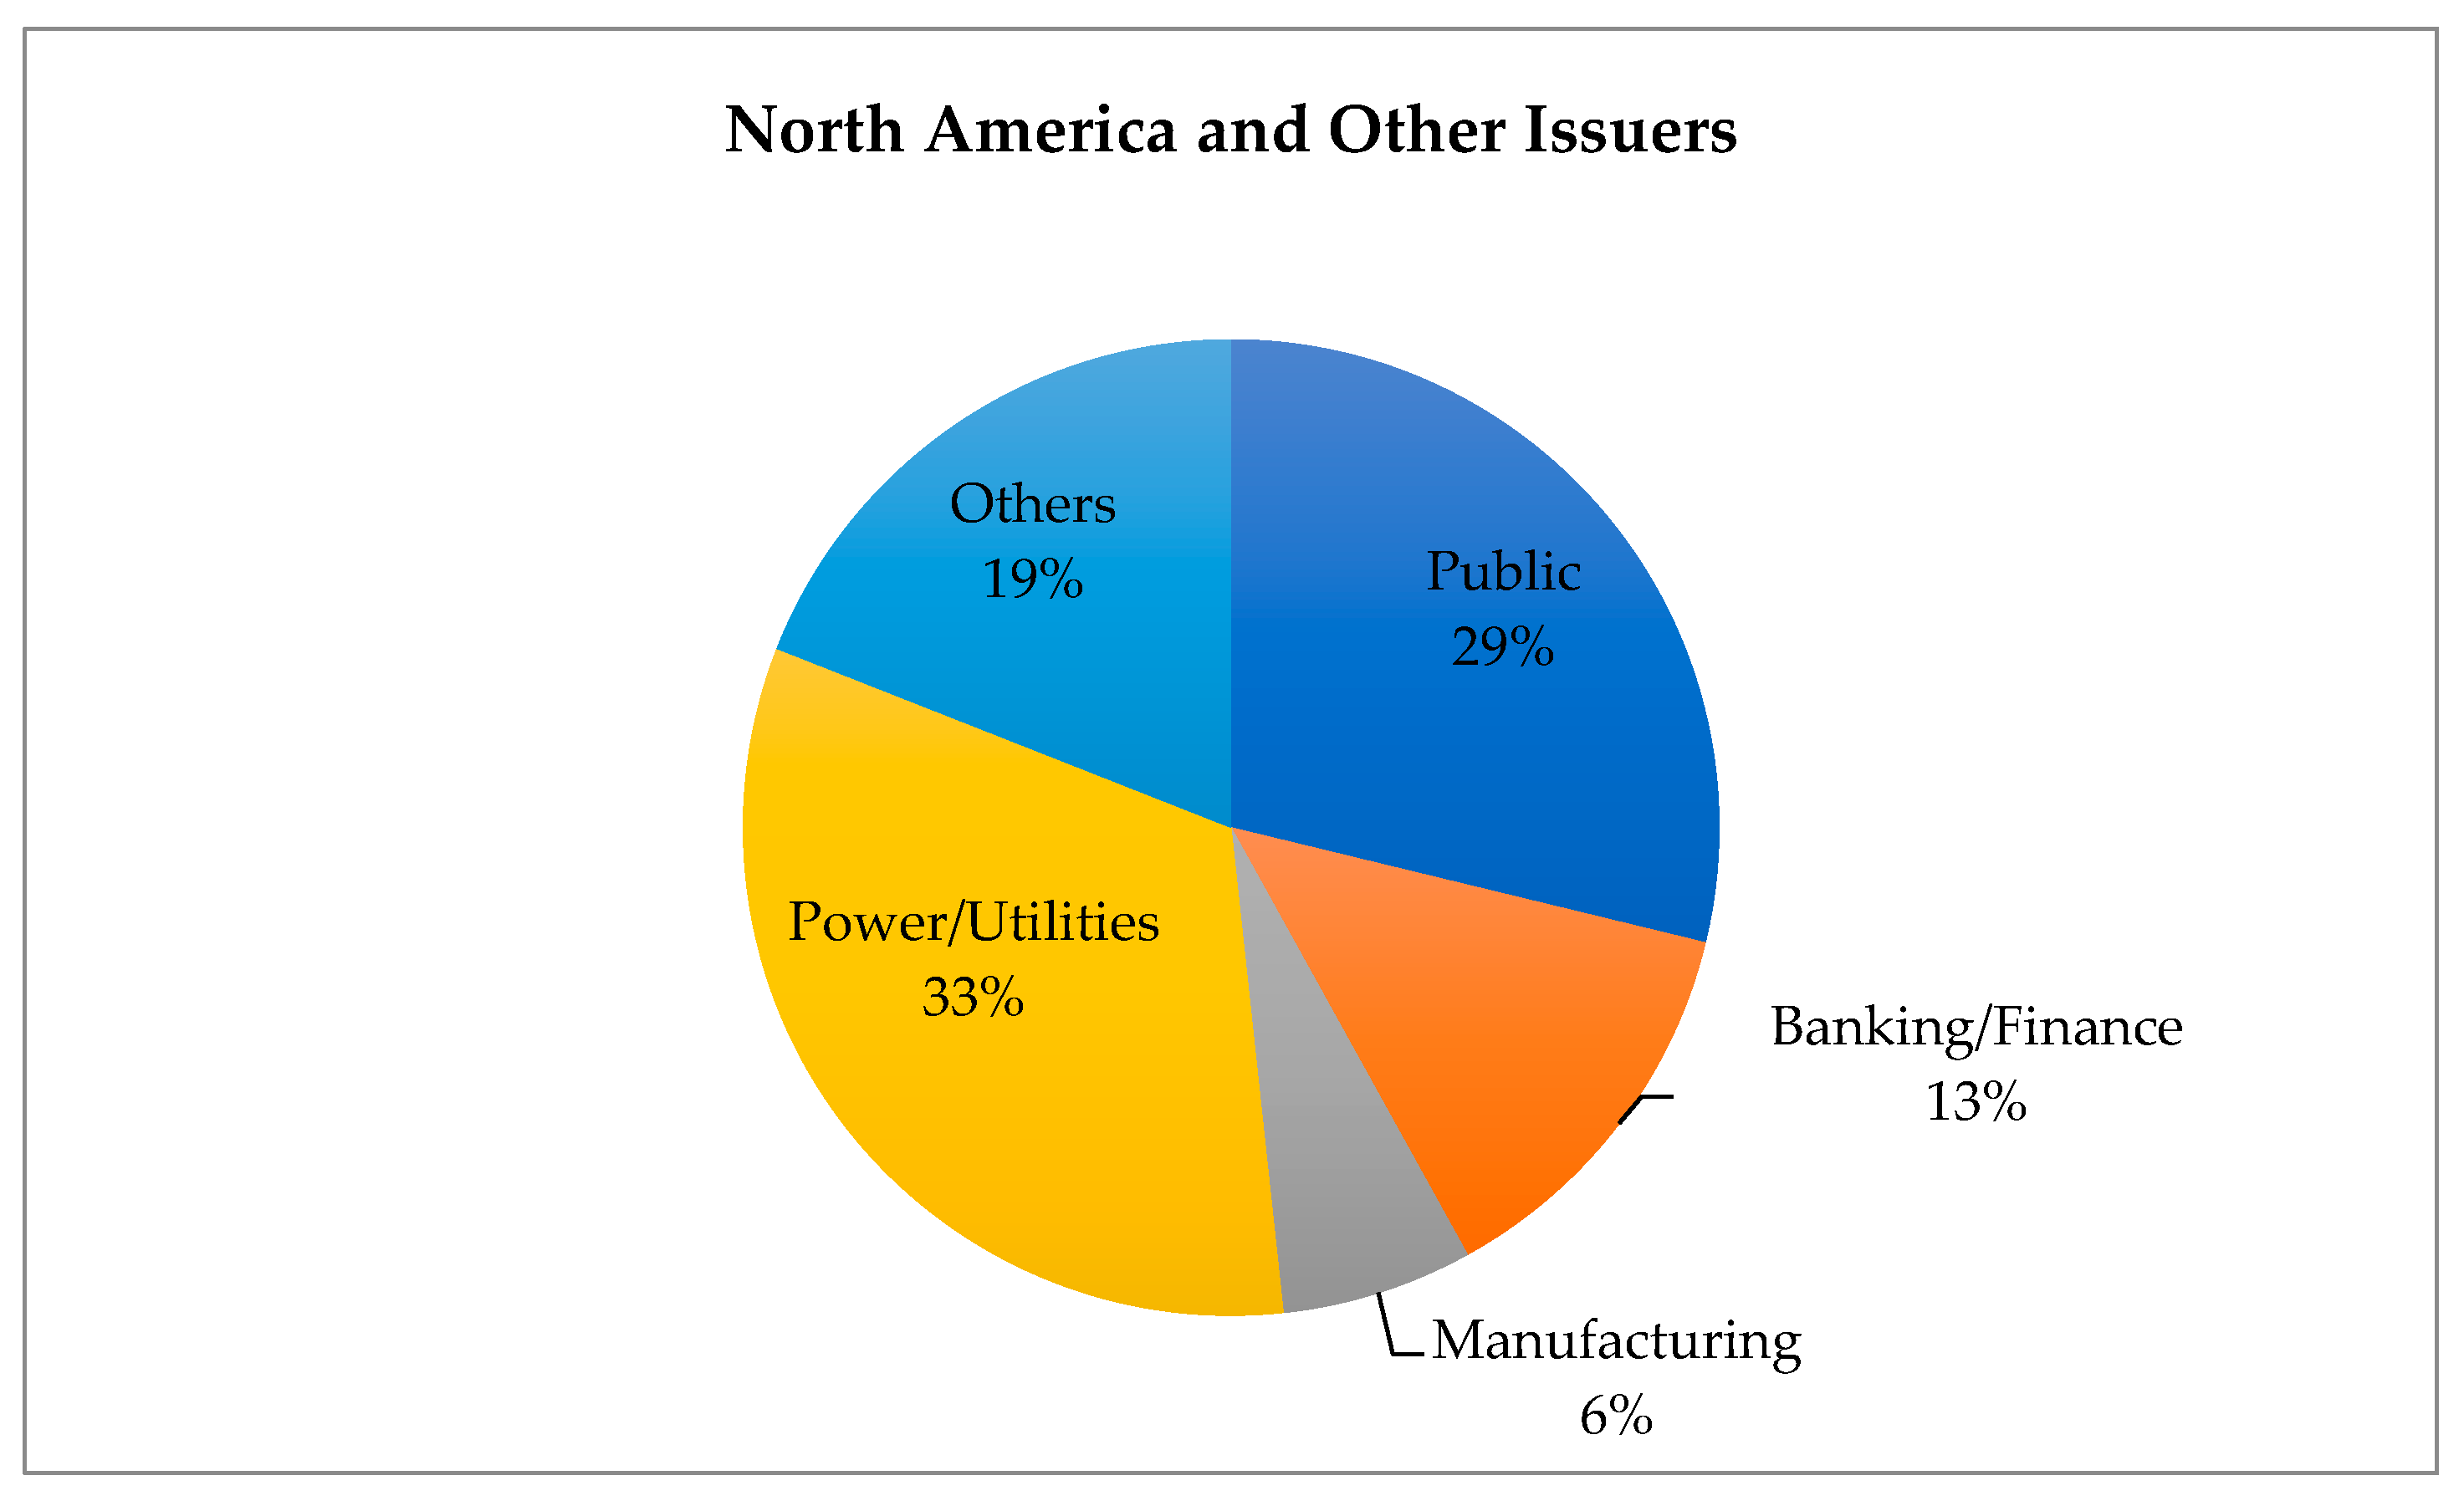
Since this study aims at identifying the regional characteristics of green bonds, we first delve into the description of our dataset. To this end, we present summary statistics in Table 2, while Figure 2 presents the distribution of issuers per sector and per region. Note that the summary statistics of Table 2 are constructed using data from [19] due to the larger amount of bonds in their database. Summary statistics of the dataset from BNEF are presented in Appendix A, for reference.
There are already several takeaways regarding the regional characteristics of green bonds, based on Table 2. The number of green bonds issued in North America is a little less than three times the amount of bonds issued in Asia-Pacific and Europe combined. However, North American bonds are characterized by their small issued amount, which explains why the region is lagging the Asia-Pacific and Europe in the overall green bonds market, as shown in Figure 1. The dominance of small green bonds also explains the small share of North American bonds in the BNEF sample size. While bonds issued in the Asia-Pacific are comparable in size to their European counterparts, they are characterized by a long-term orientation, as the number of days before reaching maturity is almost twice that of European and North American bonds. Nonetheless, it is essential to note that Asian bonds are far more diverse in terms of maturity, and to a lesser extent, size, than bonds issued in other regions of the world. Therefore, it might be challenging to reach an overall conclusion on the characteristics of Asian bonds, solely based on an analysis of summary statistics.
Since this study aims to determine whether green bonds present different characteristics based on the region of issuance, we use the Kolmogorov–Smirnov test to check whether distribution in the sample differs, depending on the region. Results of the test are presented in Table 3. The test only compares two samples. Hence, each region was tested against the remaining two. Four variables were used, all of which define some crucial characteristics of bonds, namely issued amount, time to maturity, coupon rate, and rate of return, based on the data provided by BNEF. Regardless of the variable, the results suggest a rejection of the null hypothesis of identical distribution. Each region possesses a unique distribution when it comes to essential characteristics of green bonds.
The sectoral distribution of green bond issuers provides another insight into the particular nature of Asian green bonds. While the share of issuers in Europe, North America, and the rest of the world is quite balanced between the public, utilities, and banking categories, the banking and finance sector share in the Asia-Pacific represents almost two-thirds of the total issuance. Regardless of the region, however, issuance from manufacturers, real estate, construction, and other types of firms is relatively uniform. The imbalance observed in the Asia-Pacific comes from the low shares of the public and utility sectors, with the amount of bonds issued even lower than that of real estate, construction, and other sectors (Figure 2). This observation confirms our initial hypothesis of the dominance of traditional forms of banking in Asia. As the literature review showed, the Asian financial sector is mostly composed of traditional banking institutions [3], but this result confirms that this trend is also passed on to green finance instruments such as green bonds. Due to the risk of overvaluation and maturity mismatch in traditional forms of banking [5], banking dominance likely has a significant impact on the performance of green bonds.
4.2. Mean-Variance Analysis
Since the dominance of banking and finance—as the issuers of green bonds in Asia—may affect the bonds’ performance, we present a mean-variance analysis of the rate of return of bonds, based on the region of issuance and the type of issuer. The results of this analysis on the overall sample are presented in Figure 3, and numerical values for mean and variance are provided in Appendix A.
The overall analysis of the mean and variance of the returns of bonds shows high variation between regions of issuance. The relatively high variance of Asian bonds reflects the diversity of these bonds (confirmed in Section 4.1). In Europe, the bonds issued appear to have higher risks, with relatively low returns, and, in comparison with Asian and North American bonds, do not seem to be appealing to investors.
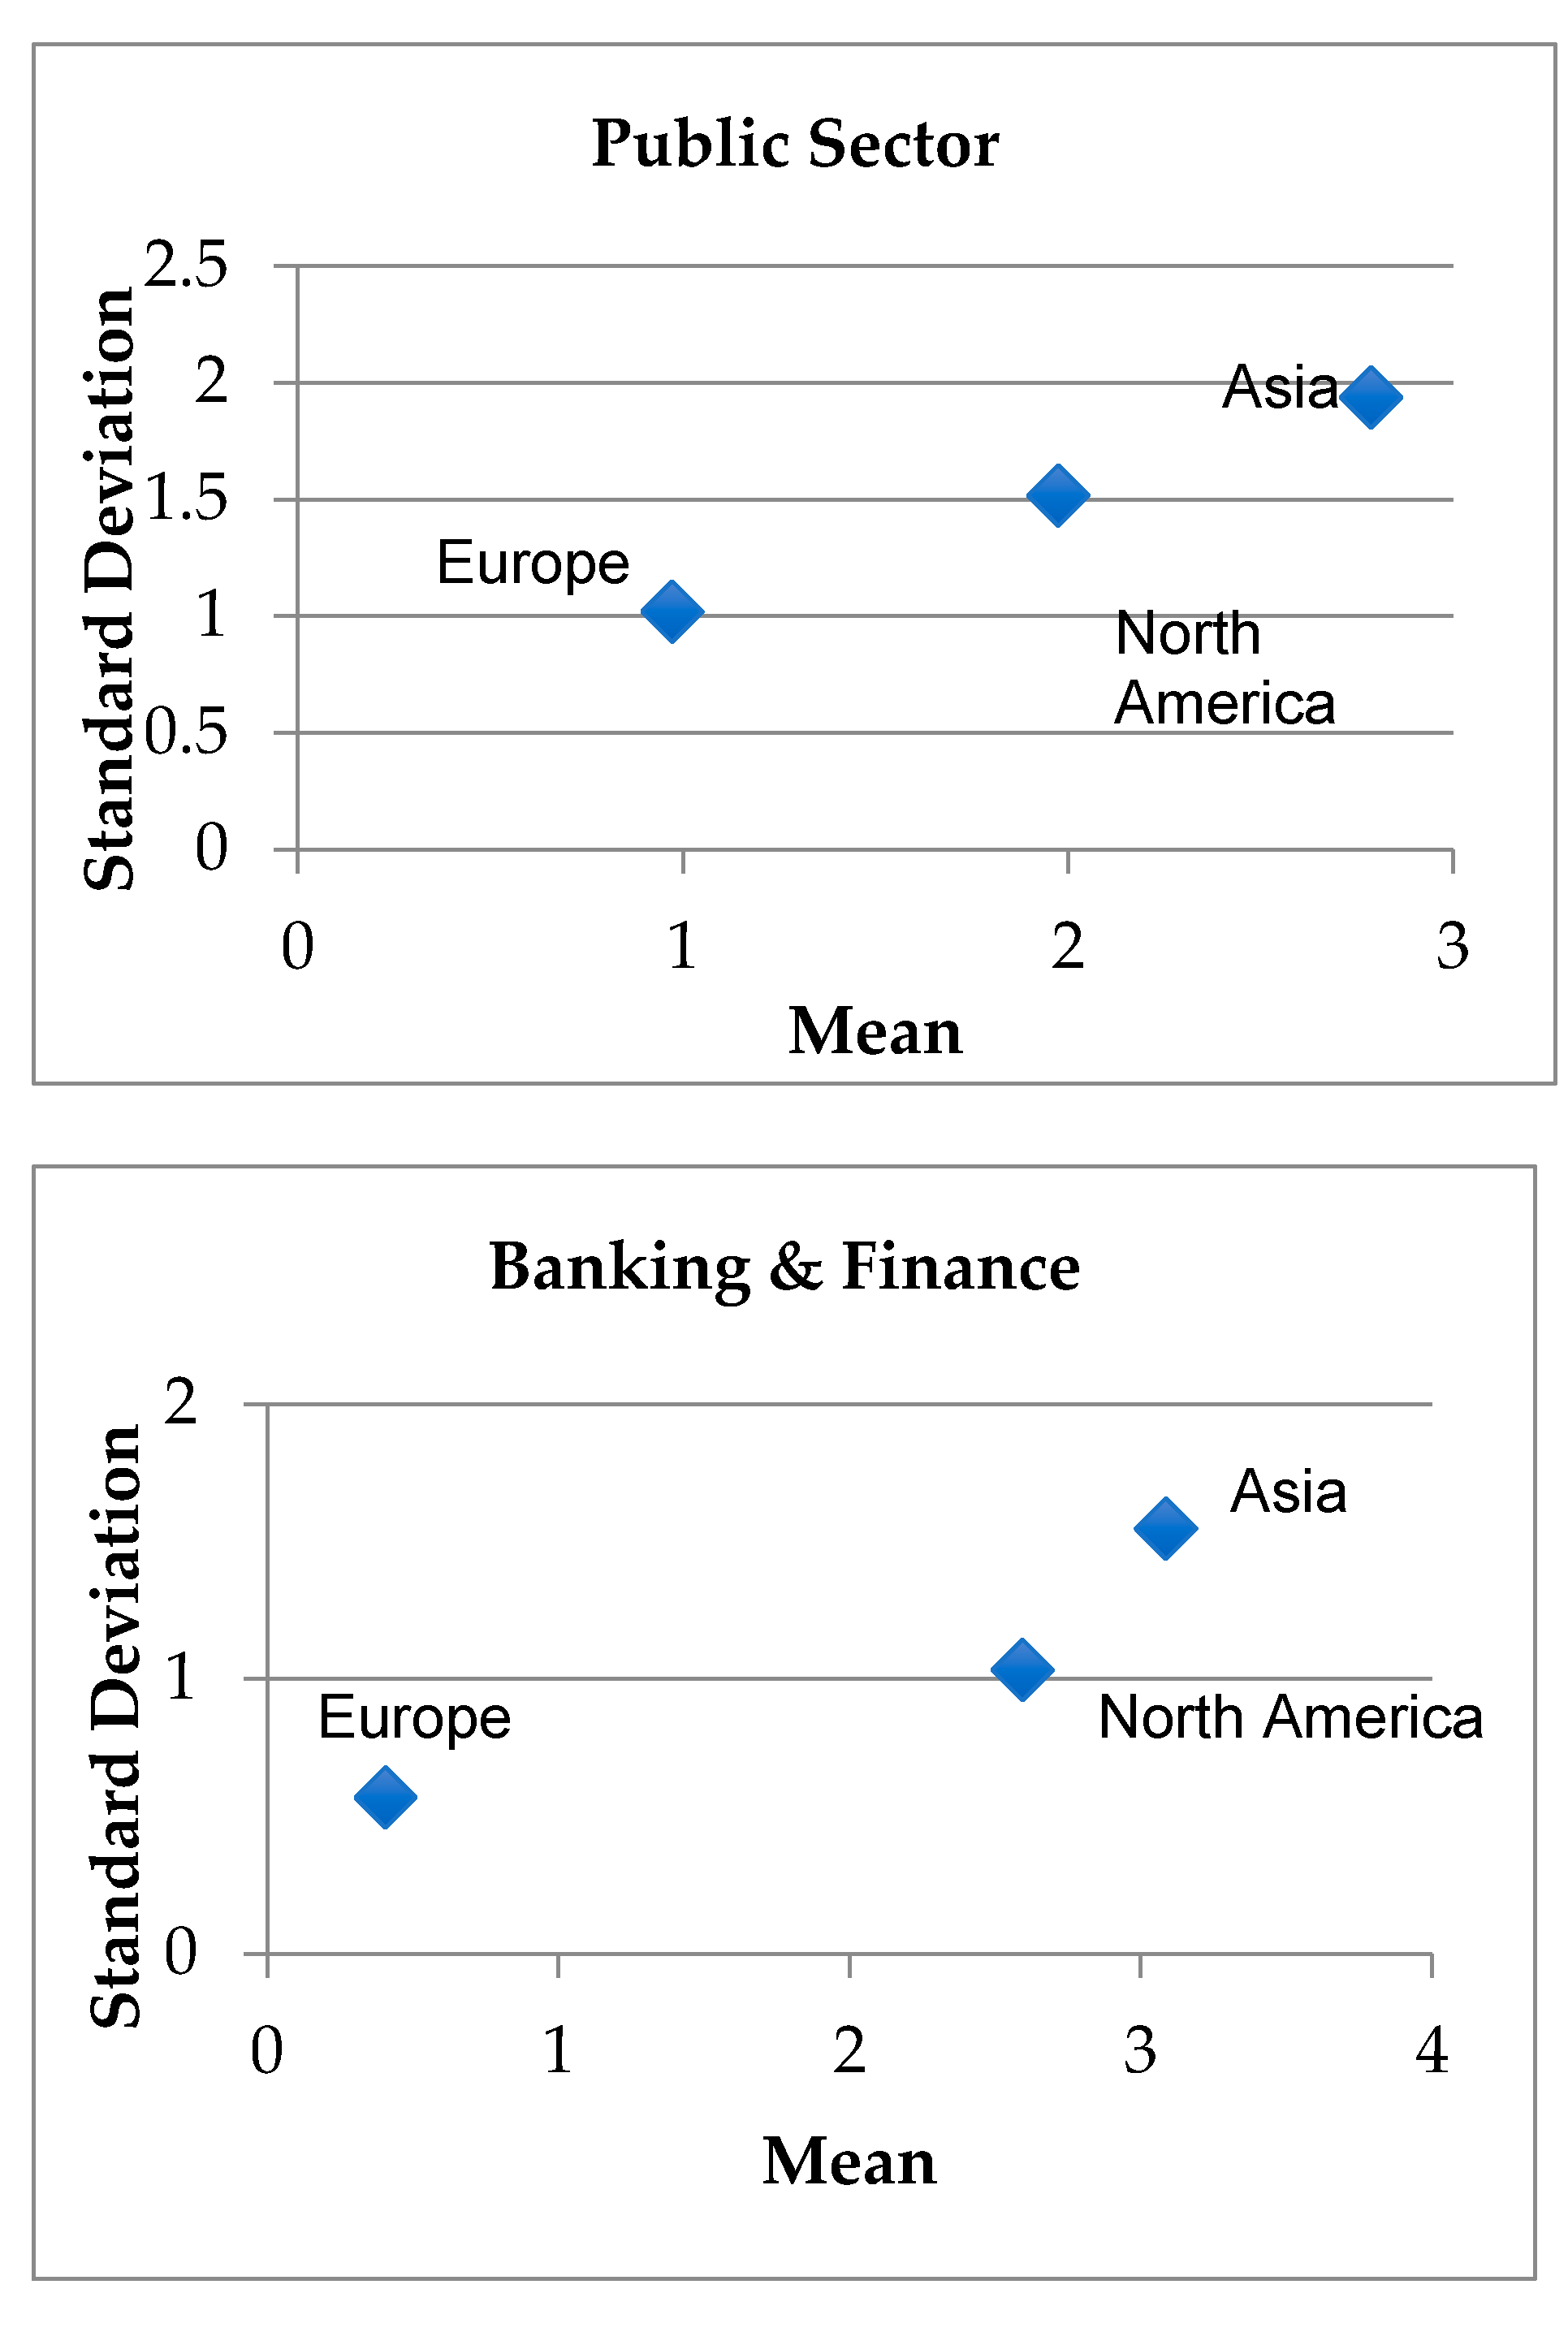
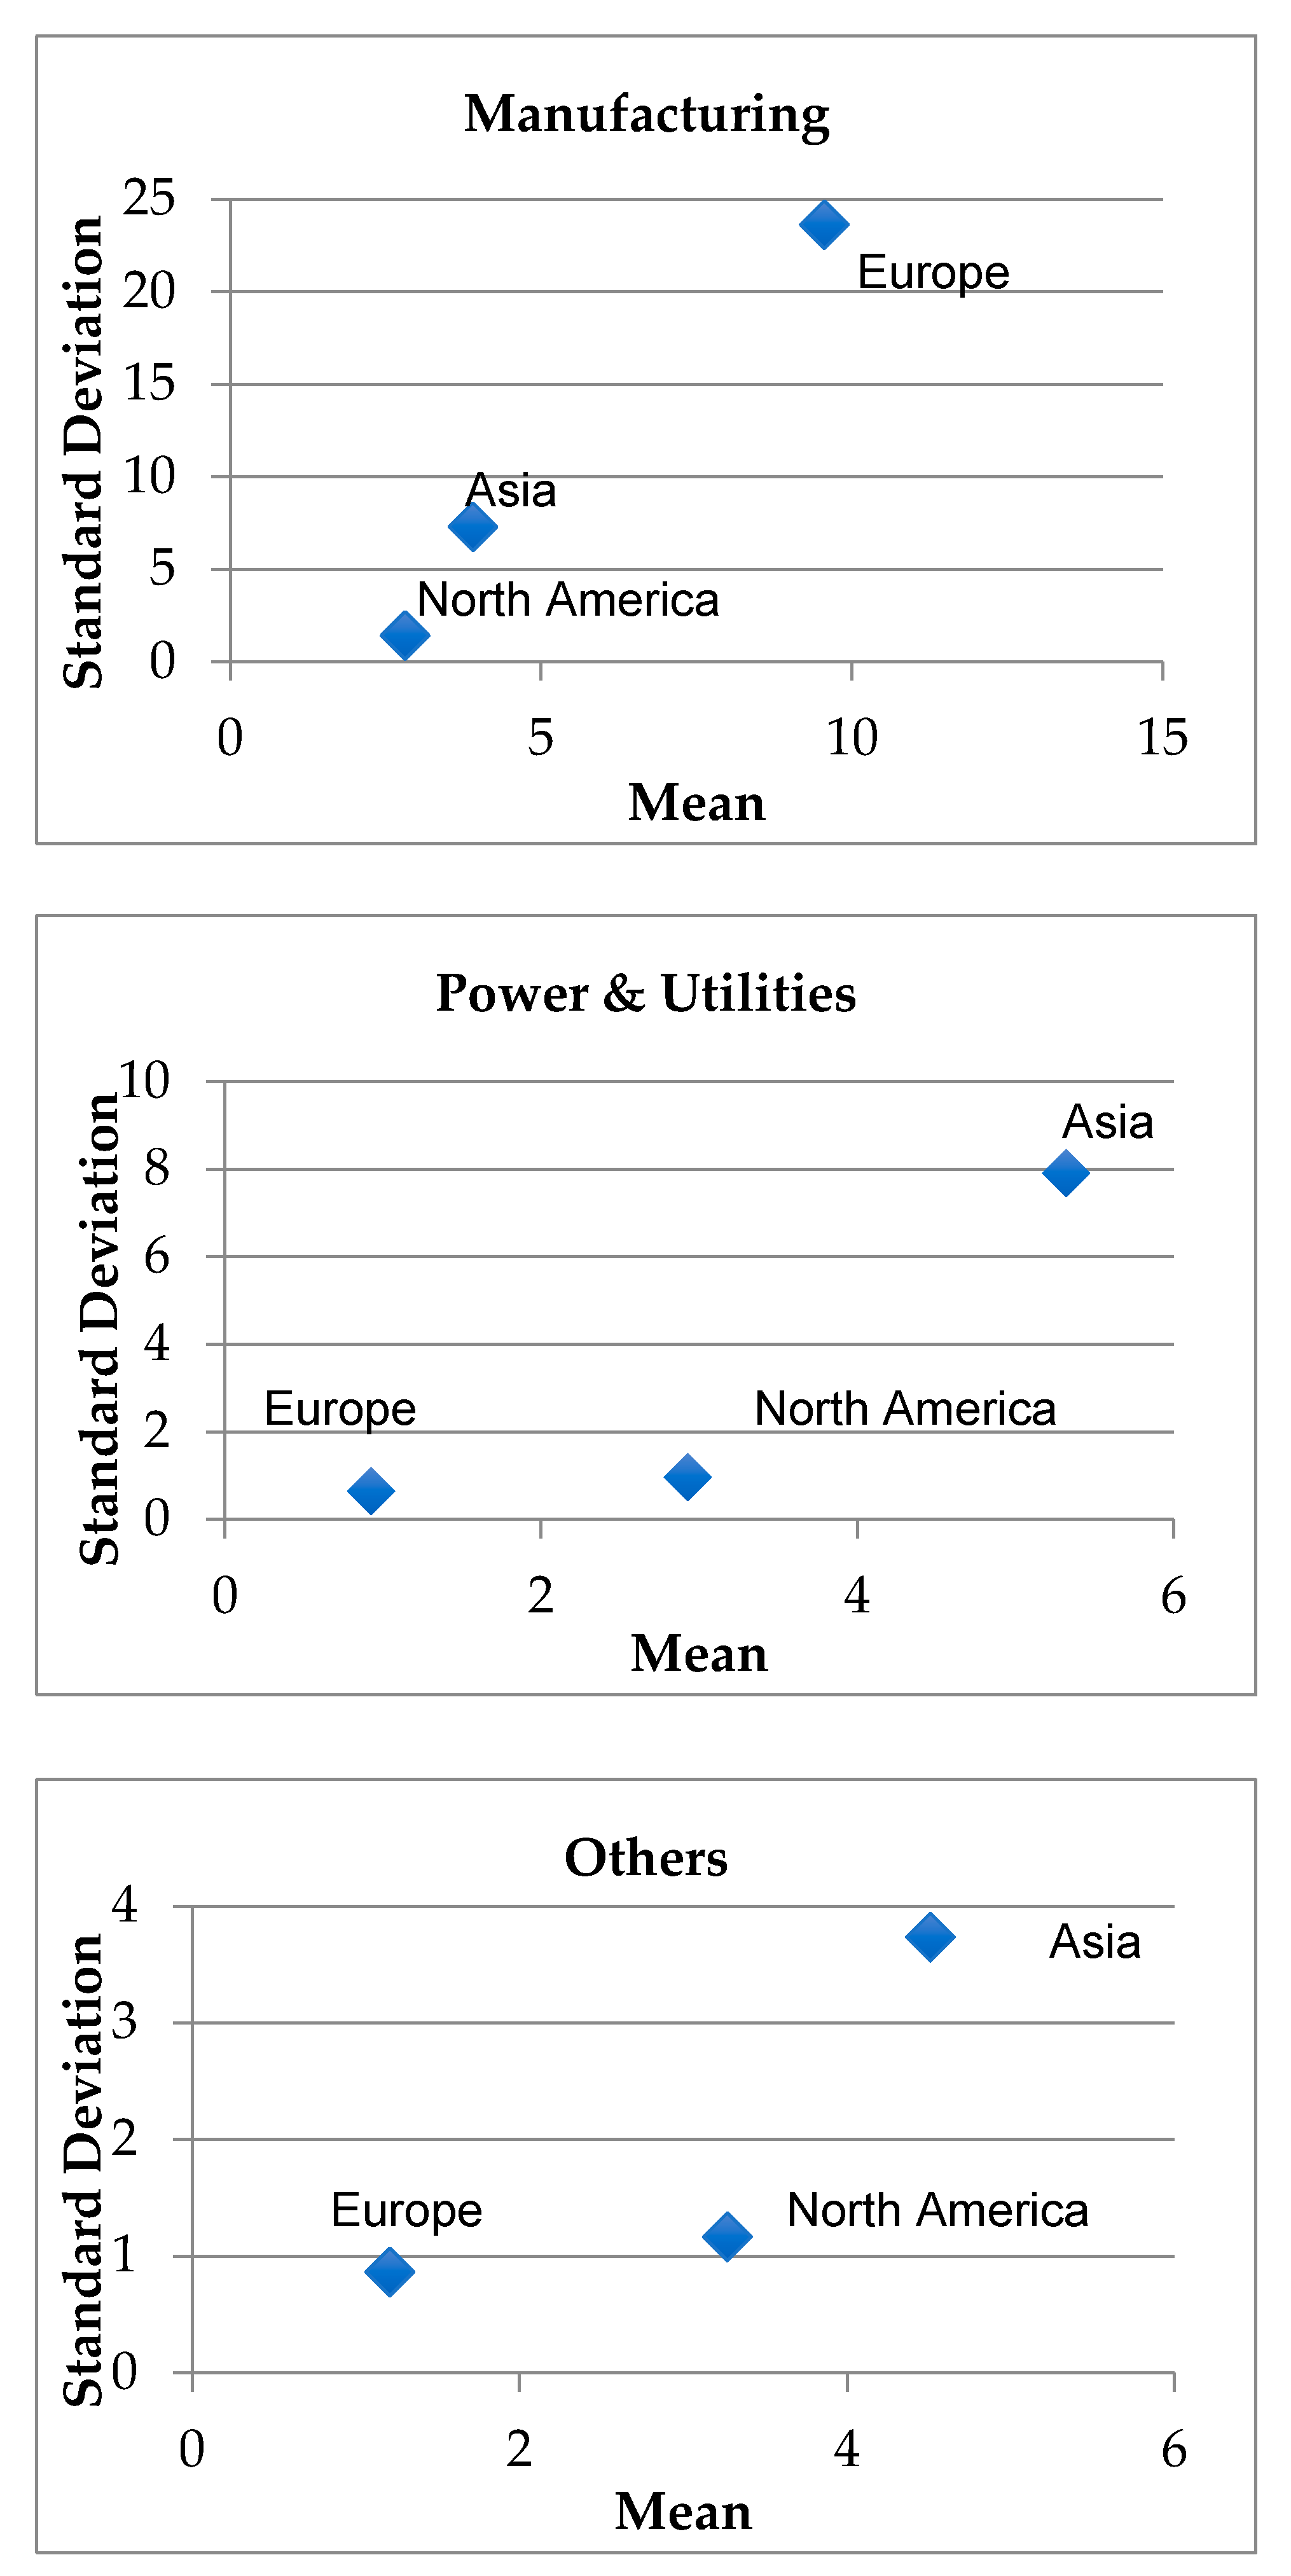
Figure 4 represents the main focus of our mean-variance analysis, as it provides a sectoral analysis of the risks and returns of green bonds, based on the region of issuance. As in Figure 3, specific numerical values for the mean and variance are reported in Appendix A.2. First, the mean and variance values for the manufacturing sector stand out, as they are twice as large as those of other sectors, especially in the case of European bonds. These extreme values could be explained by the size of this particular subsample, as manufacturers represent around 5% of all issuance on average. With the notable exception of the manufacturing sector, Asian bonds tend to offer higher returns than those issued in Europe and North America, but also come with higher risks. It is interesting to note that bonds issued by companies in banking and finance in Asia do not present a striking difference with those issued by other sectors, contrary to what our hypothesis would suggest. On the other hand, bonds issued by power and utilities stand out due to their high variance, compared with other sectors. This feature could explain the small share of issuance of power and utilities in the Asia-Pacific, especially as their low risk characterizes bonds issued by power and utilities companies in Europe and North America. Indeed, if bonds issued by power and utilities are deemed risky, then it is not surprising that they attract few investors, hence their relatively low share. Generally, European bonds are characterized by low returns but have low associated risks, with both the mean and variance around 1. This could explain the dominance of Europe in the green bond markets, as they could be considered more reliable assets by investors.
4.3. Regression Analysis
The core of our empirical findings lies in the regression analysis. While summary statistics and mean-variance analysis can highlight the characteristics and features of data on sectoral issuers and the difference in performance depending on the region and type of issuer, it cannot provide a conclusion on the relationship between the issuer and performance, nor can it help elucidate the significance of the difference in performance, depending on the region and issuer.
To answer these questions, the study introduces a regression analysis, estimated based on the equation provided in sub-Section 3.2, whose results are presented in Table 4. Equations are estimated on the full sample (using dummy variables to represent each region), as well as on each of the three regional subsamples, using White robust standard errors to control for model misspecifications, such as heteroskedasticity. The relatively short length of the panel (t = 2 for most observations) exempts us from additional time series testing on the data. Therefore, we use traditional panel data analysis estimation methods: pooled ordinary least squares (OLS) and generalized least squares (GLS) random effects (RE) estimator. The lack of time-varying independent variables precludes the use of a fixed-effect (FE) estimator. Indeed, the inclusion of a cross-sectional FE dummy variable (for each bond) does not allow us to determine the impact of the bonds’ characteristics, such as the sector of issuance. Instead, adding both FE and sectorial dummy variables provokes issues of multicollinearity, as individual characteristics are both captured by FE dummy and sectorial dummy variables. Therefore, the study prefers the RE estimator, in line with [17]. Since we are interested to see the effect of the banking sector on green bonds, we further include interaction terms between each region and the banking dummy variable. Regional and interaction dummy variables for North America are used as references and excluded so as not to cause a multicollinearity issue.
The regression analysis provides further information on the characteristics of green bonds, as the level of significance of the variables tends to vary depending on the region of issuance. It is interesting to note the difference in significance, depending on the analyzed sample. First, and regardless of the sample, the level of significance of the control variables is in line with the literature on the topic. For instance, the coupon rate was also found to be a significant variable in [22,24]. Similarly, maturity is often used as a control variable in studies assessing bonds’ performance but is generally not found to be significant [23,24]. However, apart from these control variables, no sectorial dummy, or regional dummy, or even their interaction terms, appears to be significant. This is all the more surprising that, when conducting regressions on regional sample, sectorial dummy variables show significance, to an extent. This could potentially be explained and improved by using a larger sample of analysis.
The majority of sectoral dummy variables show a lack of significance, with the notable exception of banking and finance in the Asia-Pacific. Our results prove that bonds issued by companies in the banking and financial sector consistently display lower rates of return. Not only does this sector issue low-performing bonds, but the size of the associated coefficient (0.62 or 0.57, depending on the method of estimation) is relatively large, as the average return of Asian bonds is 3.52. Even when using the full sample, being a green bond issued from the banking sector in Asia is shown to have a slightly significant negative sign. This is all the more striking as it appears that no other sectoral dummy variable shows such high levels of significance in other regions. This result confirms that the dominance of traditional forms of banking in the Asian financial sector has an impact on the characteristics of green bonds, specifically on the performance of bonds.
The significance of year dummy variables also provides a few other takeaways from this study. As the rate of return is measured on 10 January each year, each dummy captures the state of the market at the beginning of the year. Keeping this in mind, it comes as no surprise that bonds performed relatively poorly at the beginning of 2020 in the Asia-Pacific. As the majority of Asian bonds were issued in China, their performance took a severe hit from the outbreak of the coronavirus disease (COVID-19) at the end of 2019, as shown by the negative and large coefficient linked with the 2020 dummy variable. The negative sign of the same variable in the North American sample could reflect the level of dependence of the United States economy on China: the negative expected performance of Asian bonds could therefore bring down American bonds as well.
4.4. Test and Diagnostics
This section provides a discussion of the results of the tests and diagnostics to assess the quality of the results presented in the previous section. The results of the poolability test are shown in Table 5, while Table 6 displays the diagnostics, and more specifically, the distribution of standard errors between idiosyncratic and time-invariant terms.
Table 5 presents the results of the poolability test, related to model misspecification, and allows us to decide between the pooled OLS estimates and the FE/RE estimates. The test results suggest that results from RE are more reliable in the case of Asia and the Pacific and North America. In the case of Europe, however, the test seems to favor pooled OLS, even though the model showed a lower R-squared overall. Overall, the results of the misspecification tests confirm the validity of our results.
Finally, we introduce empirical estimates of and , time-varying and idiosyncratic error terms, in Table 6. As one would expect, the size of the idiosyncratic error term is rather large in all models. It is worth noting that, for European bonds, the majority of the unobserved terms are captured by time-varying factors, meaning that European bonds are quite homogenous in terms of risks. This was already observed by the mean-variance analysis of European bonds. As for the region of interest in this study, it appears that variance due to heterogeneity across bonds accounts for 36% of unobserved factors determining performance, thereby confirming the high risks associated with Asian green bonds. Indeed, if the performance of Asian bonds has such high variation, they are naturally considered less reliable by investors in general.
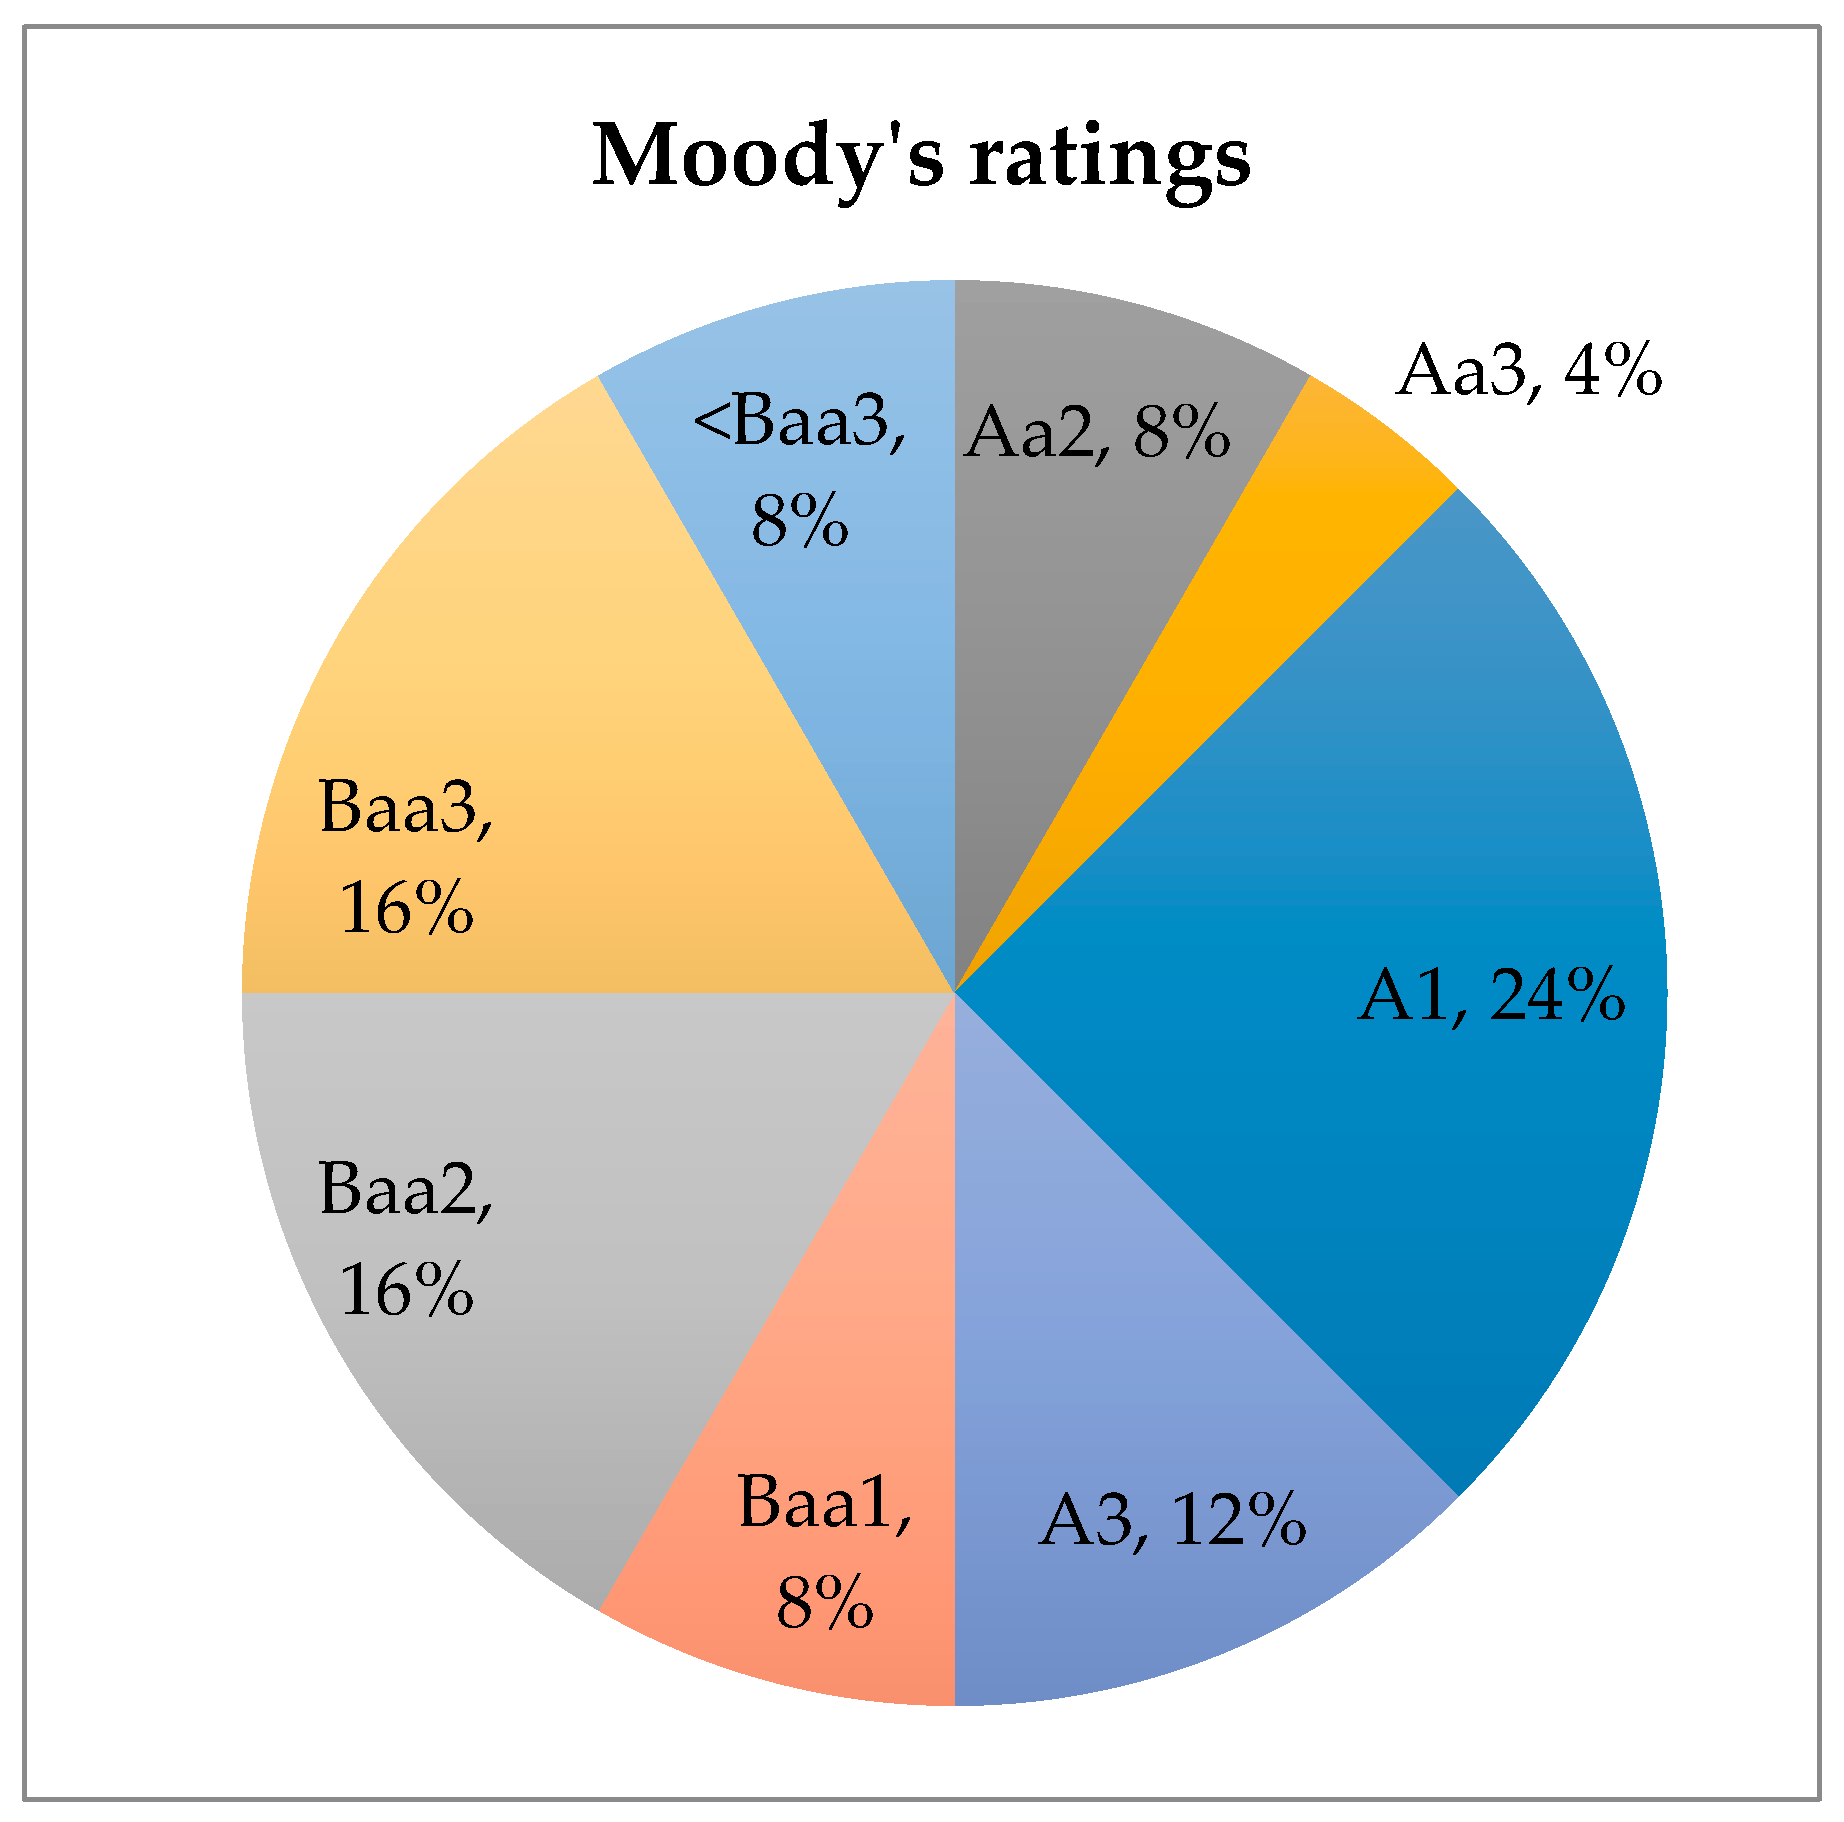
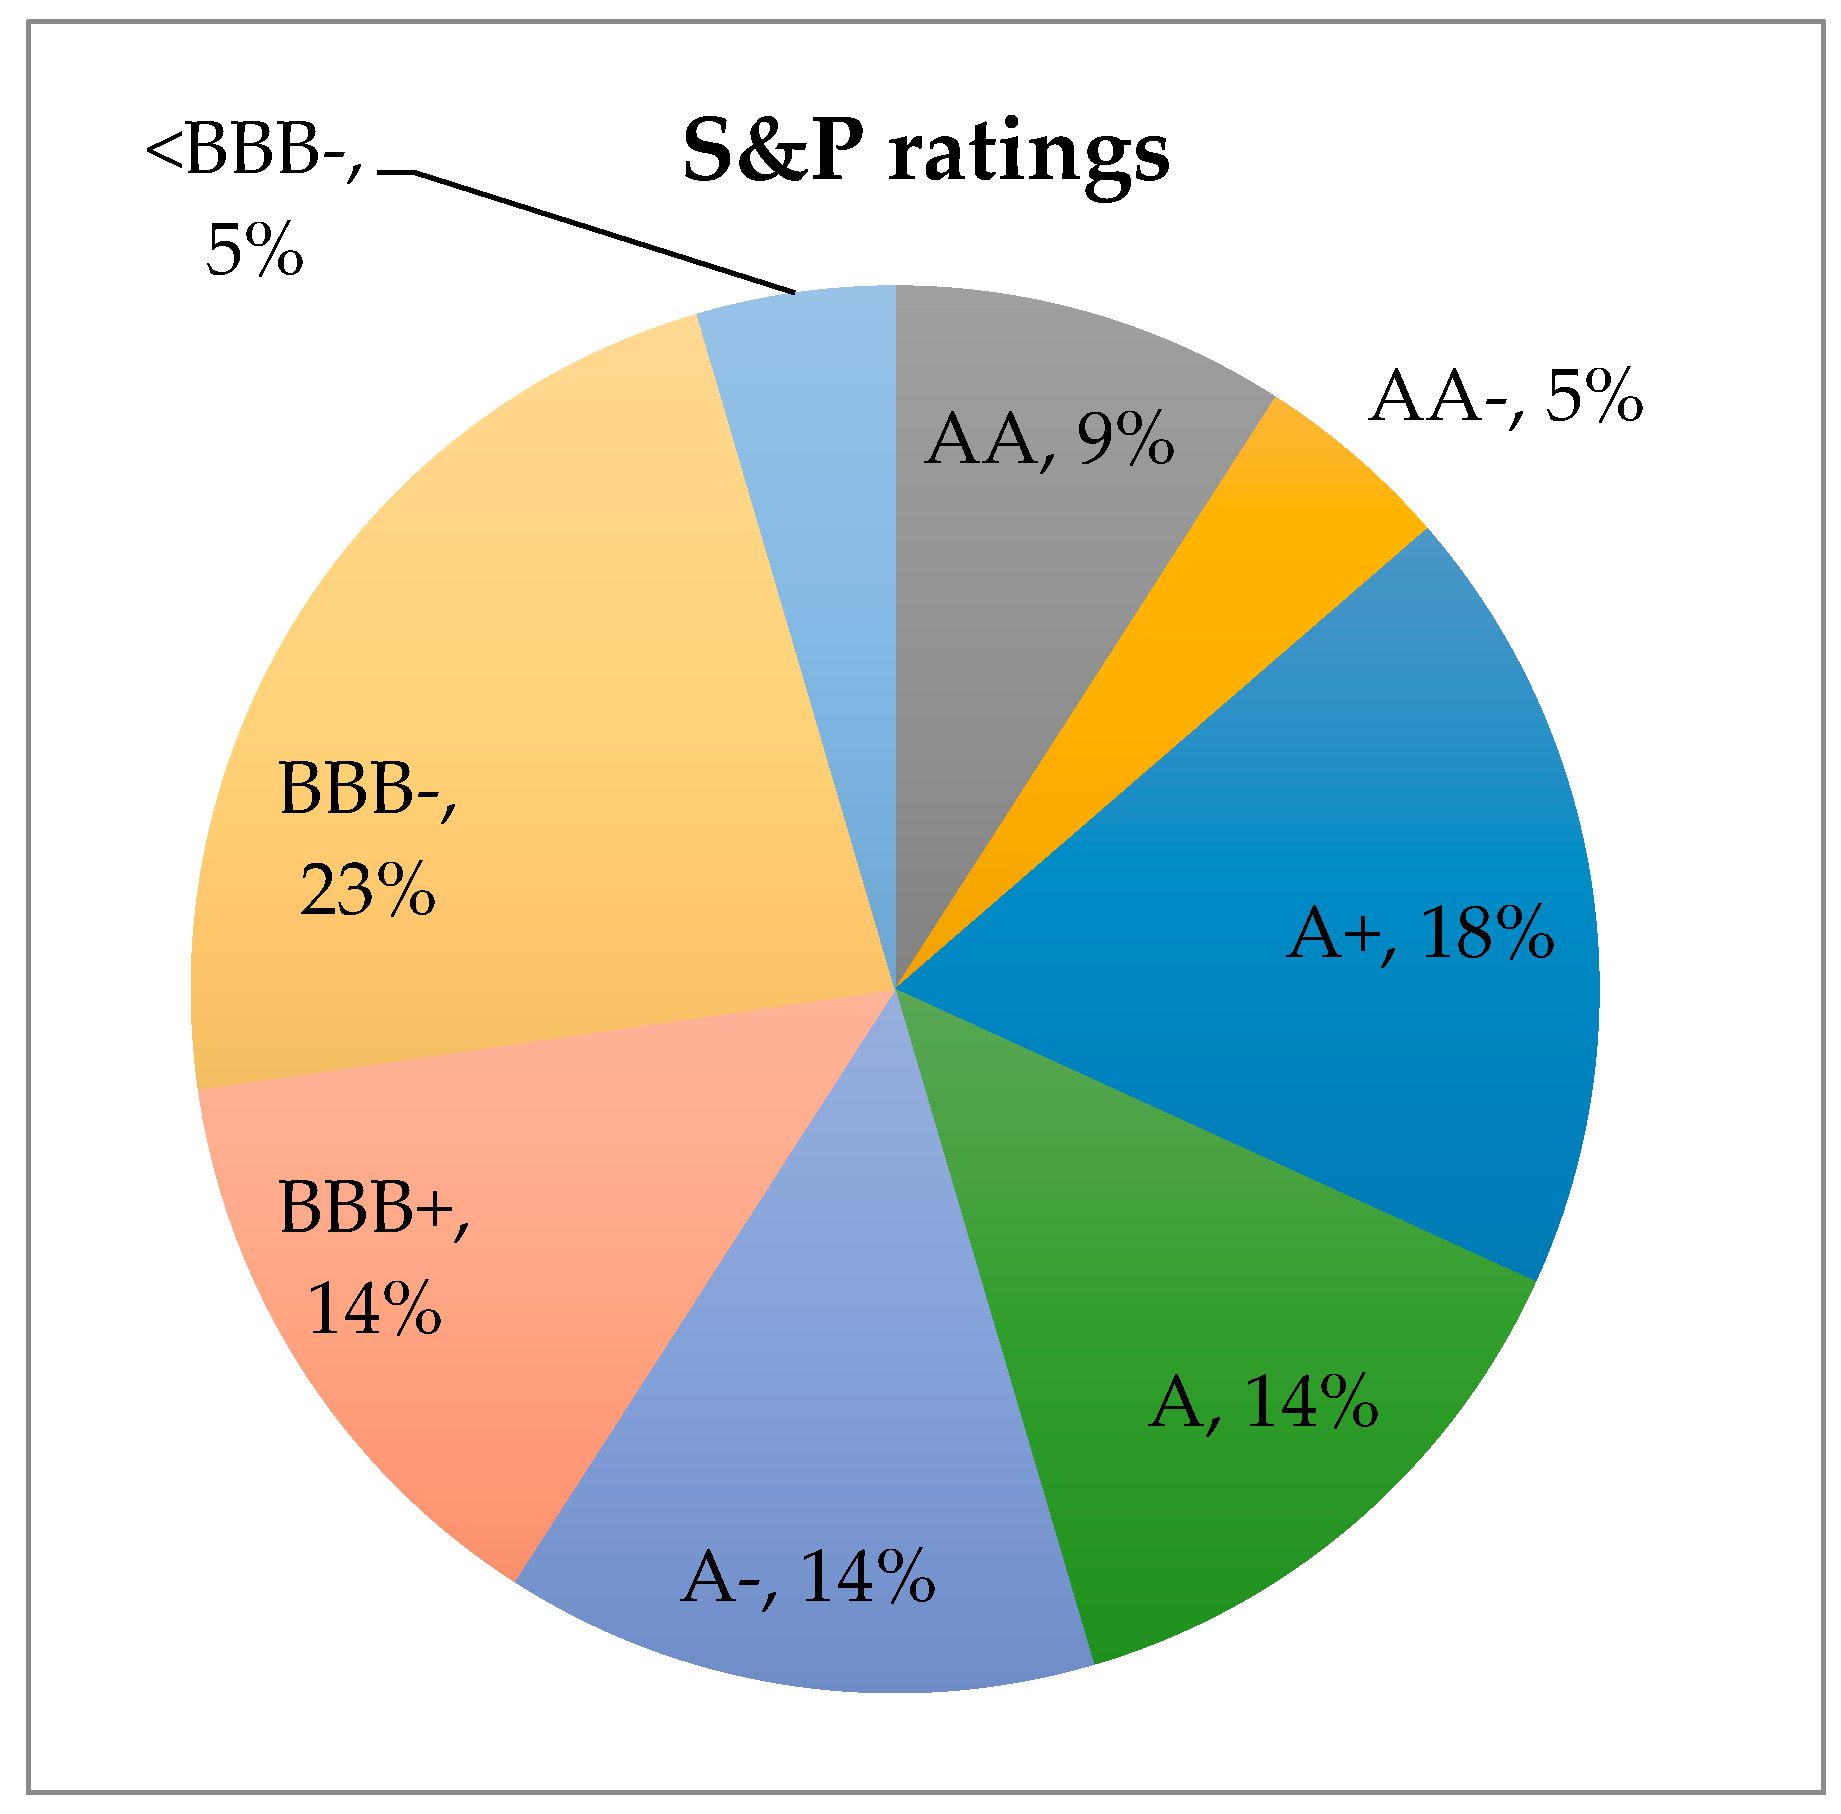
To prove this last point, we also provide ratings of Asian green bonds by major agencies, namely S&P and Moody’s. Due to the lack of data availability, we only provide ratings for 48 bonds, all issued in Asia. The distribution of ratings is shown in Figure 5. This figure shows the heterogeneity of Asian green bonds, as no rating category dominates the sample. That being said, one can also see that the majority of bond ratings are mid-tier (A+, A, and A– for S&P, and A1, A3, Baa1, and Baa2 for Moody’s). Furthermore, 5% to 8% of Asian green bonds are below BBB and Baa3, and hence considered risky investments, which is a relatively high percentage. Of course, agencies are not infallible, but Asian green bonds could be seen as relatively risky investments, based on their ratings.
5. Conclusions and Policy Implications
5.1. Conclusions and Further Steps
The increasing prominence of green bonds as a financial tool to fight climate change has sparked the interest of many researchers in recent years. While it has been recognized that green bonds can be useful for climate policy, the existence of a green bond premium—meaning that green bonds show a lower rate of return than their brown or conventional counterparts—remains open to academic debate. Furthermore, researchers seem to have reached a consensus that green bonds tend to be riskier assets. However, research on green bonds provides general conclusions on the global green bonds market. No study so far has looked at the regional characteristics of green bonds, based on the place of issuance, with the focus on Asia and the Pacific.
The financial sector in Asia and the Pacific is dominated by traditional banking, with venture capitalists being quite scarce [3]. However, [5] highlighted that traditional banking is not necessarily an appropriate source of funding for green bonds due to maturity mismatch and the conservative approach of banking. Indeed, the study argued that maturity mismatch occurs as bank liabilities are short- to medium-term, while infrastructure projects are more long-term oriented, leading to risk overvaluation. Therefore, this study aimed to provide a comparative analysis of regional characteristics and green bonds’ performance.
Using data from both BNEF and CBI, we gathered panel data composed of a total of 1174 observations and divided them into regional subsamples. Then, the study combined summary statistics as well as mean-variance and regression analysis to reach its conclusion. The results of this research are summarized in Table 7.
Based on the empirical results, we were able to show that green bonds issued in Asia and the Pacific had different characteristics from those issued in Europe and North America. Specifically, Asian bonds proved to have higher returns, but also higher associated risks, as these bonds showed higher levels of heterogeneity than their European or North American counterparts. In the sample, bonds from Asia and the Pacific were generally issued in the long term, as their time to maturity was almost twice as long as that of bonds issued in other regions. However, the summary statistics revealed the dominance of the banking and finance sector in Asia—a trend that is not found in other regions. The empirical analysis proved that bonds issued by banks in Asia consistently showed lower returns; hence, there is an urgent need for diversification of issuers in Asia and the Pacific.
5.2. Policy Implications
As restrictions of the COVID-19 are easing and economies are opening, governments are beginning to unveil their economic recovery plans. However, there is a lack of motivation to strengthen the green agenda in recovery plans. This is because the recovery outlook seems to follow the ‘growth first and green when possible’ approach of existing development plans. This will endanger meeting the SDGs and the Paris Agreement on climate change.
Therefore, in the current insufficient investment level in the green sector, especially in the post-COVID-19 era, imperative financial and fiscal policy reforms, such as global or regional carbon taxation, regulations, and strategies on green financing, supporting policies for facilitating the issuance of green bonds, the establishment of green credit rating to measure the greenness of the projects, targeting the energy subsidies, reducing the direct and indirect subsidies to fossil fuels, and introducing public de-risking tools such as a green credit guarantee scheme for reducing the risk of green investments, are required. In other words, the world is required to establish a green financial system in order to facilitate the public and private financing of the green projects.
A major takeaway from this study is the relatively high risk and return associated with bonds issued in Asia and the Pacific. Most importantly, the research showed that bonds issued by banks in Asia were associated with lower returns. Thus, the study proposes several policy recommendations to address each of the weaknesses of Asian bonds, and eventually encourage their issuance, as green bonds are useful tools against climate change.
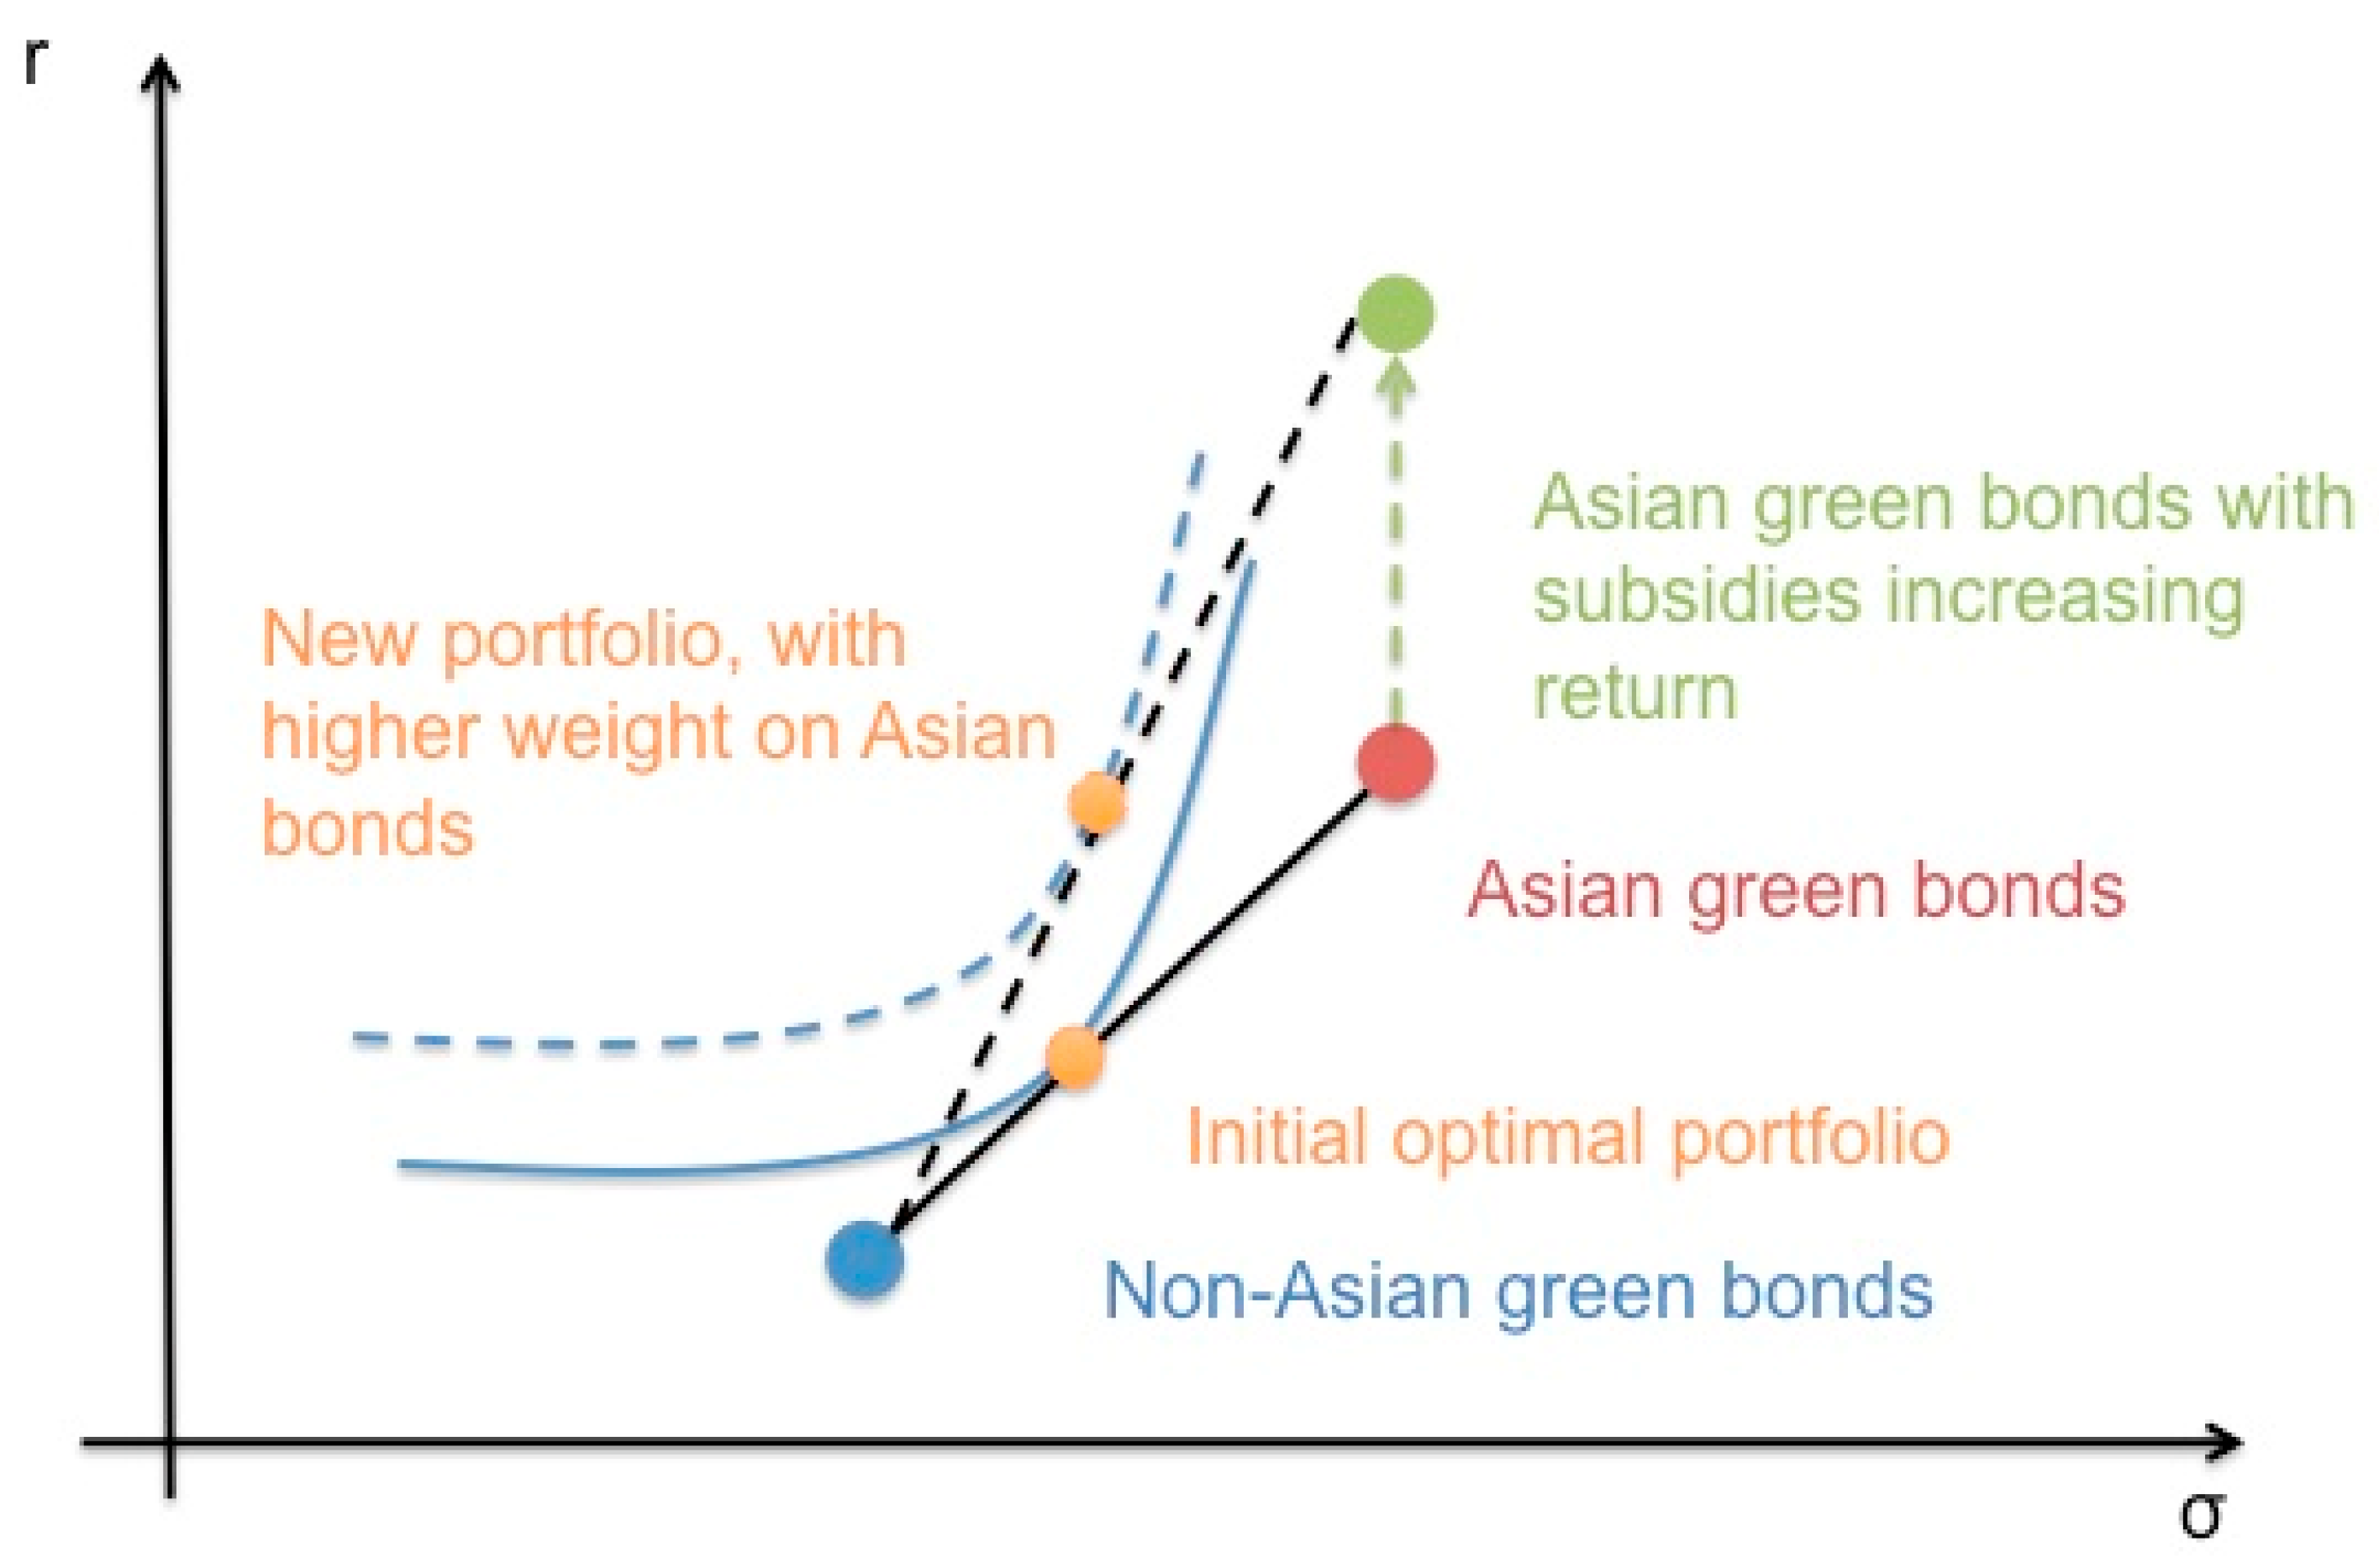
First, this study proposes using tax spillover to increase the rate of return of green bonds issued by banking and finance. Since this sector represents 60% of issuance in Asia, it is likely that traditional banking will keep playing a decisive role in green finance in the region. While green infrastructure requires high up-front costs, these projects create employment and revenue in the long term. Subsidizing green bonds in the early stages of project development could be a solution, as in the long term, these subsidies could be repaid to the public sector through tax spillover generated by employment and increased economic activity. A similar idea is developed by [5], although not applied to green bonds in particular. Figure 6 displays how an increase in the rate of return can directly impact investors’ portfolios and contribute to making Asian green bonds more attractive. Detailed calculations behind this policy recommendation are provided in Appendix A.3.
Since bonds issued by the banking and finance sector in Asia are shown to have lower returns, another solution to increase their attractiveness would simply be to encourage the diversification of issuers, and generally by promoting the involvement of the public sector. As shown in Figure 4, bonds issued by the public sector in Asia have high associated risks and relatively high returns. Diversification is not necessarily limited to the sector of issuance, however, and [30] highlighted the possibility of increased financial connectivity between Asian and European public institutions in financing green infrastructure.
Finally, a last remedy to increase the amount of green bonds issued in Asia and the Pacific is to reduce the risks associated with these instruments. Several studies have highlighted the risks associated with green infrastructure projects and proposed de-risking approaches for policymakers. The authors of [31] suggested a simplification of administrative procedures linked with project developments. They also proposed the establishment of agreements with local governments or companies, as green infrastructure projects are often more oriented towards the long term. The authors of [32] also proposed a wide array of de-risking solutions—ranging from general measures such as the unbundling of the electricity market, corruption control mechanisms, or reforms of fossil fuel subsidies, to financial de-risking measures such as credit guarantees or guaranteed power prices and the establishment of public–private partnerships to reduce political risks generally associated with green policies. Specifically, [33] proposed a model green credit guarantee scheme, where a public entity absorbs the risks related to green infrastructure projects by providing a credit guarantee. As many companies involved in green projects tend to be small- and medium-sized enterprises, credit guarantee schemes can allow these firms to receive higher funding, as the public entity acts as a form of collateral. Utilizing tax spillover to increase the rate of return of green bonds, diversifying sectors and regions, and de-risking policies could surely contribute to increasing the attractiveness of Asian green bonds and help to accelerate the fight against climate change in the region [13].
In order to have a well-developed green bond market, it is crucial to have a clear definition of what green is. This means an unambiguous definition of green bond is needed. In the meantime, green labeling has helped somewhat, but it is not enough. Currently, 80% brown and 20% green is called green, and 90% green and 10% brown is also called green. There are many different definitions of greenness that are all called green, and green bonds are used for financing them. Therefore, we need a clear greenness credit rating to show the ratio of greenness. Nowadays, satellite photos can show how much CO2 is exposed by each company or each project, and it is possible to detect and measure the emissions that would be used to assess the greenness of the projects. Globally, having unified green rating agencies rather than having different standards for each country is required [26,34,35,36].
Finally, in bank-oriented financial systems such as in Asia and several other regions, just relying on green bond issuance might not be an adequate solution to fill the green finance gap. Green bond is a complementary financial instrument that needs to be used besides banking solutions. There are several mechanisms and instruments that can help to bridge the green finance gap for meeting SDGs. These mechanisms include the modification of the collateral framework, changes in capital adequacy ratios, a market of SDG lending certificates, the introduction of rediscounting policies, the establishment of a green credit guarantee scheme, green credit rating, etc. [37,38].
Another fundamental problem is ‘decoupling,’ i.e., the fact that green bonds apply a financial logic to solve an ecological issue, which is created in the first place by the economic system and its financial indicators. As a result, green bond investment strategies prioritize ecosystem services generating the most significant and most stable payment flows to the detriment of other invisible ecosystem services, but just as essential. The author of [39,40] uses the term a financial “logos” (defined as a structuring discourse integrated into financial practices’ management tools and belief systems) to describe this problem. His article argues that any ecological finance theory devised to fit the SDGs needs a paradigm shift in the morphology of randomness underlying financial risk modeling by integrating the characteristics of “nature” and sustainability into the modeling carried out. Most recently, the authors of [41] have proposed a strategy to incorporate ecological issues into financial economics. They used the concepts of resilience, diversity, self-thinning, self-regulated mitosis, and ecological transparency from biology and introduced them to the field of financial economics.
In addition, public financial institutions (PFIs)—or those publicly created and/or mandated financial institutions that have often been created to correct for the lack of market-based finance through the provision of missing financial services—have a potentially vital role to play to scale-up private sector investments in green projects for meeting SDGs. However, there are four critical points for the involvement of PFIs in green projects: (1) They need to provide long-term financing (long-term loans) compared to private commercial banks, (2) setting up the interest rate lower than private banks, stable and fixed, and (3) avoid harmful effects of government lending through PFIs. This means avoid increasing the government’s role in the economy and avoid crowding out private deposits and loans. (4) Make loans by PFIs, where the private sector cannot make loans.
Author Contributions
Conceptualization, F.T.-H.; Formal analysis, F.T.-H. and H.P.; Methodology, N.Y.; Project administration, H.P.; Software, F.T.-H.; Supervision, H.P.; Validation, N.Y.; Writing—original draft, F.T.-H.; Writing—review and editing, N.Y. and H.P. All authors have read and agreed to the published version of the manuscript.
Funding
Economic Research Institute for ASEAN and East Asia (ERIA) financially supported this project and the article processing fee.
Institutional Review Board Statement
Not applicable.
Informed Consent Statement
Not applicable.
Data Availability Statement
Data sharing not applicable.
Acknowledgments
This paper results from a research project titled ‘Energy Sustainability and Climate Change in ASEAN and East Asia’ for the Economic Research Institute for ASEAN and East Asia (ERIA). The authors are grateful to Fukunari Kimura and Jun Arima and all members of the working group in the aforementioned project for their valuable comments and inputs, which significantly contributed to improving the quality of this study. The authors are also grateful to the Climate Bonds Initiative (CBI) for providing part of the data used in this research. The authors are grateful to Aline Mortha for her research assistance throughout this project.
Conflicts of Interest
The authors declare no conflict of interest.
Appendix A
Appendix A.1. Summary Statistics with the Reduced Sample, Using Data from Bloomberg New Energy Finance

Table A1.
Asian subsample.
| Item | Observations | Mean | Std. Dev. | Min | Max |
|---|---|---|---|---|---|
| Rate of return | 366 | 3.515615 | 3.595249 | −0.216 | 48.955 |
| Days to maturity | 760 | 1806.713 | 1212.08 | 145 | 11,217 |
| Amount issued | 760 | 4.38 × 10⁸ | 5.52 × 10⁸ | 9.98 × 10⁷ | 4.33 × 10⁹ |
| Coupon rate | 760 | 3.425405 | 2.185087 | 0 | 15.5 |
| Private | 760 | 0.9052632 | 0.293044 | 0 | 1 |
| Banking | 760 | 0.5578947 | 0.4969639 | 0 | 1 |
| Manufacturing | 760 | 0.0578947 | 0.2336981 | 0 | 1 |
| Power/Utilities | 760 | 0.1263158 | 0.3324237 | 0 | 1 |
| Others | 760 | 0.1631579 | 0.369753 | 0 | 1 |
Std. dev. = standard deviation. Source: Authors’ compilation.
Table A2.
European subsample.
| Item | Observations | Mean | Std. Dev. | Min | Max |
|---|---|---|---|---|---|
| Rate of return | 603 | 0.9731144 | 3.362978 | −0.572 | 80.075 |
| Days to maturity | 1140 | 5578.874 | 30,351.63 | 147 | 36,6305 |
| Amount issued | 1140 | 6.66 × 10⁸ | 4.68 × 10⁸ | 1.00 × 10⁸ | 4.46 × 10⁹ |
| Coupon rate | 1140 | 1.162737 | 0.9079918 | 0 | 7.125 |
| Private | 1140 | 0.7894737 | 0.4078614 | 0 | 1 |
| Banking | 1140 | 0.322807 | 0.4677548 | 0 | 1 |
| Manufacturing | 1140 | 0.0210526 | 0.1436228 | 0 | 1 |
| Power/Utilities | 1140 | 0.2877193 | 0.4528983 | 0 | 1 |
| Others | 1140 | 0.1578947 | 0.3648023 | 0 | 1 |
Std. dev. = standard deviation. Source: Authors’ compilation.
Table A3.
North American and Other Issuers subsample.
| Item | Observations | Mean | Std. Dev. | Min | Max |
|---|---|---|---|---|---|
| Rate of return | 205 | 2.666659 | 1.306911 | −0.3 | 7.72 |
| Days to maturity | 432 | 4122.398 | 3229.278 | 245 | 13,655 |
| Amount issued | 432 | 5.26 × 10⁸ | 3.72 × 10⁸ | 9.51 × 10⁷ | 2.25 × 10⁹ |
| Coupon rate | 432 | 2.958718 | 1.474915 | 0 | 8 |
| Private | 432 | 0.7222222 | 0.4484225 | 0 | 1 |
| Banking | 432 | 0.1388889 | 0.3462315 | 0 | 1 |
| Manufacturing | 432 | 0.0555556 | 0.229327 | 0 | 1 |
| Power/Utilities | 432 | 0.3333333 | 0.4719511 | 0 | 1 |
| Others | 432 | 0.1944444 | 0.3962313 | 0 | 1 |
Std. dev. = standard deviation. Source: Authors’ compilation.
Appendix A.2. Summary Statistics by Sector
Table A4.
Asian subsample.
| Item | Observations | Mean | Std. Dev. | Min | Max | |
|---|---|---|---|---|---|---|
| Public sector | Rate of return | 40 | 2.78625 | 1.938086 | −0.216 | 9.03 |
| Days to maturity | 72 | 2501.5 | 1105.893 | 555 | 4815 | |
| Amount issued | 72 | 6.47 × 10⁸ | 4.60 × 10⁸ | 1.10 × 10⁸ | 2.24 × 10⁹ | |
| Coupon rate | 72 | 2.273056 | 1.815014 | 0 | 7.125 | |
| Banking/Finance | Rate of return | 221 | 3.086752 | 1.548352 | −0.059 | 6.95 |
| Days to maturity | 424 | 1466.811 | 820.2578 | 145 | 4797 | |
| Amount issued | 424 | 5.05 × 10⁸ | 6.85 × 10⁸ | 1.02 × 10⁸ | 4.33 × 10⁹ | |
| Coupon rate | 424 | 3.296255 | 1.611012 | 0 | 6.5 | |
| Manufacturing | Rate of return | 17 | 3.903 | 7.30048 | −0.184 | 26.092 |
| Days to maturity | 44 | 1914.045 | 939.1773 | 472 | 4305 | |
| Amount issued | 44 | 2.69 × 10⁸ | 1.71 × 10⁸ | 1.00 × 10⁸ | 7.05 × 10⁸ | |
| Coupon rate | 44 | 2.105455 | 2.437531 | 0 | 7.5 | |
| Power/Utilities | Rate of return | 37 | 5.32027 | 7.92042 | 0.744 | 48.955 |
| Days to maturity | 96 | 1922.677 | 1069.983 | 218 | 4723 | |
| Amount issued | 96 | 2.85 × 10⁸ | 1.42 × 10⁸ | 9.98 × 10⁷ | 5.90 × 10⁸ | |
| Coupon rate | 96 | 3.845875 | 1.855951 | 0.85 | 7.9 | |
| Others | Rate of return | 51 | 4.507686 | 3.735481 | 0.231 | 17.395 |
| Days to maturity | 124 | 2437.669 | 1938.155 | 174 | 11,217 | |
| Amount issued | 124 | 2.67 × 10⁸ | 1.44 × 10⁸ | 1.00 × 10⁸ | 6.00 × 10⁸ | |
| Coupon rate | 124 | 4.678968 | 3.273824 | 0.09 | 15.5 |
Std. dev. = standard deviation. Source: Authors’ compilation.
Table A5.
European subsample.
| Item | Observations | Mean | Std. Dev. | Min | Max | |
|---|---|---|---|---|---|---|
| Public sector | Rate of return | 153 | 0.9720131 | 1.020399 | −0.556 | 3.263 |
| Days to maturity | 240 | 2667.183 | 1878.802 | 147 | 11,266 | |
| Amount issued | 240 | 8.56 × 10⁸ | 7.43 × 10⁸ | 1.16 × 10⁸ | 4.46 × 10⁹ | |
| Coupon rate | 240 | 1.16585 | 0.8552492 | 0 | 3.3 | |
| Banking/Finance | Rate of return | 184 | 0.4063315 | 0.5703005 | −0.572 | 2.615 |
| Days to maturity | 368 | 2601.359 | 1844.092 | 151 | 12,251 | |
| Amount issued | 368 | 6.35 × 10⁸ | 3.32 × 10⁸ | 1.06 × 10⁸ | 1.74 × 10⁹ | |
| Coupon rate | 368 | 0.6791848 | 0.5777155 | 0 | 2.5 | |
| Manufacturing | Rate of return | 11 | 9.553909 | 23.62808 | 0.221 | 80.075 |
| Days to maturity | 24 | 2298.333 | 1084.292 | 753 | 4692 | |
| Amount issued | 24 | 3.65 × 10⁸ | 2.55 × 10⁸ | 1.08 × 10⁸ | 8.37 × 10⁸ | |
| Coupon rate | 24 | 2.371333 | 2.296941 | 0.5 | 7.125 | |
| Power/Utilities | Rate of return | 176 | 0.9256023 | 0.6572373 | −0.224 | 3.602 |
| Days to maturity | 328 | 12,709.1 | 55,942.4 | 473 | 366,305 | |
| Amount issued | 328 | 6.79 × 10⁸ | 3.68 × 10⁸ | 1.09 × 10⁸ | 1.93 × 10⁹ | |
| Coupon rate | 328 | 1.374195 | 0.7278362 | 0 | 4.496 | |
| Others | Rate of return | 79 | 1.206405 | 0.8654128 | −0.202 | 4.732 |
| Days to maturity | 180 | 2993.033 | 1406.762 | 888 | 9954 | |
| Amount issued | 180 | 4.93 × 10⁸ | 2.89 × 10⁸ | 1.00 × 10⁸ | 1.14 × 10⁹ | |
| Coupon rate | 180 | 1.600711 | 0.9940294 | 0.1 | 5 |
Std. dev. = standard deviation. Source: Authors’ compilation.
Table A6.
North American and Other Issuers subsample.
| Item | Observations | Mean | Std. Dev. | Min | Max | |
|---|---|---|---|---|---|---|
| Public sector | Rate of return | 59 | 1.973627 | 1.518473 | −0.3 | 7.72 |
| Days to maturity | 120 | 3083.367 | 2605.471 | 265 | 12,148 | |
| Amount issued | 120 | 4.47 × 10⁸ | 3.33 × 10⁸ | 1.00 × 10⁸ | 1.20 × 10⁹ | |
| Coupon rate | 120 | 2.060917 | 1.905424 | 0 | 8 | |
| Banking/Finance | Rate of return | 27 | 2.594 | 1.033445 | −0.004 | 4.205 |
| Days to maturity | 60 | 2902.767 | 2313.379 | 245 | 10,886 | |
| Amount issued | 60 | 7.24 × 10⁸ | 6.14 × 10⁸ | 1.10 × 10⁸ | 2.25 × 10⁹ | |
| Coupon rate | 60 | 2.847733 | 1.344723 | 0.25 | 5.25 | |
| Manufacturing | Rate of return | 13 | 2.812 | 1.428624 | 0.05 | 5.219 |
| Days to maturity | 24 | 3279.167 | 1107.982 | 1140 | 5422 | |
| Amount issued | 24 | 9.77 × 10⁸ | 3.39 × 10⁸ | 4.50 × 10⁸ | 1.50 × 10⁹ | |
| Coupon rate | 24 | 2.633333 | 1.938997 | 0 | 5.5 | |
| Power/Utilities | Rate of return | 67 | 2.92809 | 0.9791559 | 0.068 | 4.512 |
| Days to maturity | 144 | 5643.694 | 3752.187 | 705 | 12,103 | |
| Amount issued | 144 | 4.31 × 10⁸ | 1.68 × 10⁸ | 9.51 × 10⁷ | 7.50 × 10⁸ | |
| Coupon rate | 144 | 3.449056 | 0.7427922 | 1 | 4.6 | |
| Others | Rate of return | 39 | 3.267821 | 1.166826 | 0.789 | 7.079 |
| Days to maturity | 84 | 4110.881 | 3026.646 | 894 | 13,655 | |
| Amount issued | 84 | 5.33 × 10⁸ | 5.33 × 10⁸ | 1.00 × 10⁸ | 1.23 × 10⁹ | |
| Coupon rate | 84 | 3.572952 | 0.8995293 | 1.625 | 5.875 |
Std. dev. = standard deviation. Source: Authors’ compilation.
Appendix A.3. Theoretical Framework for Policy Recommendation
Policy implications for this research are based on a theoretical framework, detailed below. Since Asian bonds are characterized by higher relative risks and returns, we derive the optimal portfolio of a theoretical investor, who can choose to assign a weight on green bonds not issued in Asia and a weight on Asian bonds.
The rate of return and associated variance of this portfolio is given by Equations (A.1) and (C.2), respectively:
where , and denote the rate of return of portfolio, non-Asian bonds, and Asian bonds respectively, and , , , and denote the variance of portfolio, non-Asian bonds, Asian bonds, and covariance between Asian and non-Asian bonds.
Then, the theoretical investor aims at maximizing the utility derived from their portfolio. This study assumes that their utility function is given by:
Substituting (A1) and (A2) into (A3), we obtain:
Thus,
The investor’s utility maximization problem is given by Equation (A5):
The first-order condition, with respect to , is:
Solving this equation for , we obtain the optimal weight the investor can put on non-Asian bonds:
To change this optimal weight, policymakers in Asia and the Pacific can act on parameters of this utility maximization problem, namely on and .
For instance, one can increase the weight put on Asian bonds by increasing the rate of return, , by subsidising bonds through tax spillover, denoted by . The new rate of return of this subsidised portfolio, denoted by , is given by Equation (A8):
Then, the investor’s utility becomes:
Solving the utility maximization problem, we obtain the new optimal weight for this investor:
Note that
where the equality holds if and only if .
Since denotes the optimal portfolio weight attributed to bonds not issued in Asia and the Pacific, policymakers can make green bonds more attractive for investors by using spillover from tax returns.
References
- Sachs, J.; Woo, T.W.; Yoshino, N.; Taghizadeh-Hesary, F. Handbook of Green Finance : Energy Security and Sustainable Development; Springer Singapore and Asian Development Bank Institute: Singapore, 2019. [Google Scholar]
- Paris: International Energy Agency. World Energy Investment 2019—Data Tables. Available online: https://www.iea.org/reports/world-energy-investment-2019 (accessed on 22 November 2020).
- Peimani, H. Financial Barriers for Development of Renewable and Green Energy Projects in Asia. In Handbook of Green Finance: Energy Security and Sustainable Development; Sachs, J., Wing, T.W., Yoshino, N., Taghizadeh-Hesary, F., Eds.; Springer Singapore and Asian Development Bank Institute: Singapore, 2019; pp. 15–34. [Google Scholar]
- Noh, H.J. Financial Strategies to Accelerate Green Growth. In Handbook of Green Finance: Energy Security and Sustainable Development; Sachs, J., Wing, T.W., Yoshino, N., Taghizadeh-Hesary, F., Eds.; Springer Singapore and Asian Development Bank Institute: Singapore, 2019; pp. 37–62. [Google Scholar]
- Yoshino, N.; Taghizadeh-Hesary, F.; Nakahigashi, M. Modelling the Social Funding and Spillover Tax for Addressing the Green Energy Financing Gap. Econ. Model. 2019, 77, 34–41. [Google Scholar] [CrossRef]
- London: Climate Bonds Initiative. Green Bonds: The State of the Market. 2018. Available online: https://www.climatebonds.net/files/reports/cbi_gbm_final_032019_web.pdf (accessed on 22 November 2020).
- London: Climate Bonds Initiative. Green Bonds: Global State of the Market. 2019. Available online: https://www.climatebonds.net/resources/reports/green-bonds-global-state-market-2019 (accessed on 22 November 2020).
- Agliardi, E.; Agliardi, R. Financing Environmentally-Sustainable Projects with Green Bonds. Environ. Dev. Econ. 2019, 24, 608–623. [Google Scholar] [CrossRef] [Green Version]
- Baker, M.; Bergstresser, D.; Serafeim, G.; Wurgler, J. Financing the Response to Climate Change: The Pricing and Ownership of U.S. Available online: https://www.nber.org/system/files/working_papers/w25194/w25194.pdf (accessed on 22 November 2020).
- Gianfrate, G.; Peri, M. The Green Advantage: Exploring the Convenience of Issuing Green Bonds. J. Clean. Prod. 2019, 219, 127–135. [Google Scholar] [CrossRef]
- Zerbib, O. The Effect of Pro-Environmental Preferences on Bond Prices: Evidence from Green Bonds. J. Bank. Financ. 2019, 98, 39–60. [Google Scholar] [CrossRef]
- Zou, C.; Zhao, Q.; Zhang, G.; Xiong, B. Energy revolution: From a fossil energy era to a new energy era. Nat. Gas Ind. B 2016, 3, 1–11. [Google Scholar] [CrossRef] [Green Version]
- Taghizadeh-Hesary, F.; Yoshino, N. Sustainable Solutions for Green Financing and Investment in Renewable Energy Projects. Energies 2020, 13, 788. [Google Scholar] [CrossRef] [Green Version]
- OECD. OECD Companion to the Inventory of Support. Measures for Fossil Fuels 2015; OECD Publishing: Paris, France, 2015. [Google Scholar] [CrossRef]
- Coady, D.; Parry, I.; Sears, L.; Shang, B. How Large Are Global Energy Subsidies? IMF Working Paper No. WP/15/105; International Monetary Fund: Washington, DC, USA, 2015. [Google Scholar]
- Pham, L. Is It Risky to Go Green? A Volatility Analysis of the Green Bond Market. J. Sustain. Financ. Invest. 2016, 6, 263–291. [Google Scholar] [CrossRef]
- Naeem, M.A.; Nguyen, T.T.H.; Nepal, R.; Ngo, Q.-T.; Taghizadeh-Hesary, F. Asymmetric relationship between green bonds and commodities: Evidence from extreme quantile approach. Financ. Res. Lett. 2021, 101983. [Google Scholar] [CrossRef]
- Broadstock, D.; Cheng, L. Time-Varying Relation Between Black and Green Bond Price Benchmarks: Macroeconomic Determinants for the First Decade. Financ. Res. Lett. 2019, 29, 17–22. [Google Scholar] [CrossRef]
- CBI. Green Bond Principles & Climate Bonds Standard. Available online: https://www.climatebonds.net/market/best-practice-guidelines (accessed on 22 November 2020).
- Flaherty, M.; Gevorkyan, A.; Radpour, S.; Semmler, W. Financing Climate Policies Through Climate Bonds—A Three Stage Model and Empirics. Res. Int. Bus. Financ. 2017, 42, 468–479. [Google Scholar] [CrossRef]
- Hyun, S.; Park, D.; Tian, S. Pricing of Green Labeling: A Comparison of Labeled and Unlabeled Green Bonds. Financ. Res. Lett. 2020, 101816. [Google Scholar] [CrossRef]
- Bachelet, M.J.; Becchetti, L.; Manfredonia, S. The Green Bonds Premium Puzzle: The Role of Issuer Characteristics and Third-Party Verification. Sustainable 2019, 11, 1098. [Google Scholar] [CrossRef] [Green Version]
- Hachenberg, B.; Schiereck, D. Are Green Bonds Priced Differently from Conventional Bonds? J. Asset Manag. 2018, 19, 371–383. [Google Scholar] [CrossRef]
- Chiesa, M.; Barua, S. The Surge of Impact Borrowing: The Magnitude and Determinants of Green Bond Supply and Its Heterogeneity Across Markets. J. Sustain. Financ. Invest. 2019, 9, 138–161. [Google Scholar] [CrossRef]
- Tang, D.; Zhang, Y. Do Shareholders Benefit from Green Bonds? J. Corp. Financ. 2020, 61. [Google Scholar] [CrossRef]
- MacAskill, S.; Roca, E.; Liu, B.; Stewart, R.A.; Sahin, O. Is There a Green Premium in the Green Bond Market? Systematic Literature Review Revealing Premium Determinants. J. Clean. Prod. 2021, 280 Pt 2. [Google Scholar] [CrossRef]
- Sartzetakis, E. Green Bonds as an Instrument to Finance Low Carbon Transition. Econ. Chang. Restruct. 2020, 1–25. [Google Scholar] [CrossRef]
- Reboredo, J.; Ugolini, A. Price Connectedness Between Green Bond and Financial Markets. Econ. Model. 2020, 88, 25–38. [Google Scholar] [CrossRef]
- Febi, W.; Schäfer, D.; Stephan, A.; Sun, C. The Impact of Liquidity Risk on the Yield Spread of Green Bonds. Financ. Res. Lett. 2018, 27, 53–59. [Google Scholar] [CrossRef]
- Yoshino, N.; Hossain, M.; Taghizadeh-Hesary, F. Enhancing Financial Connectivity Between Asia and Europe: Implications for Infrastructure Convergence Between the Two Regions. Asian Econ. Pap. 2020, 19, 84–101. [Google Scholar] [CrossRef]
- Komendantova, N.; Schinko, T.; Patt, A. De-Risking Policies as a Substantial Determinant of Climate Change Mitigation Costs in Developing Countries: Case Study of the Middle East and North African Region. Energy Policy 2019, 127, 404–411. [Google Scholar] [CrossRef] [Green Version]
- Carafa, L.; Frisari, G.; Vidican, G. Electricity Transition in the Middle East and North Africa: A De-Risking Governance Approach. J. Clean. Prod. 2016, 128, 34–47. [Google Scholar] [CrossRef]
- Taghizadeh-Hesary, F.; Yoshino, N. The Way to Induce Private Participation in Green Finance and Investment. Financ. Res. Lett. 2019, 31, 98–103. [Google Scholar] [CrossRef]
- Revelli, C. Re-embedding Financial Stakes Within Ethical and Social Values in Socially Responsible Investing (SRI). Res. Int. Bus. Financ. 2016, 38, 1–5. [Google Scholar] [CrossRef]
- Paranque, B.; Revelli, C. Ethico-economic Analysis of Impact Finance: The Case of Green Bonds. Res. Int. Bus. Financ. 2019, 47, 57–66. [Google Scholar] [CrossRef]
- Willmott, H. Creating ‘Value’ Beyond the Point of Production: Branding, Financialization and Market Capitalization. Organization 2010, 17, 517–542. [Google Scholar] [CrossRef]
- Lagoarde-Segot, T. Financing the Sustainable Development Goals. Sustainability 2020, 12, 2775. [Google Scholar] [CrossRef] [Green Version]
- Yoshino, N.; Taghizadeh-Hesary, F.; Otsuka, M. Covid-19 and Optimal Portfolio Selection for Investment in Sustainable Development Goals. Financ. Res. Lett. 2020, 101695. [Google Scholar] [CrossRef]
- Chiapello, E. The work of Financialisation. In The Making of Finance; Lenglet, M., Chambost, I., Tadjeddine, Y., Eds.; Routledge: London, UK, 2019; pp. 192–200. [Google Scholar]
- Walter, C. Sustainable Financial Risk Modelling Fitting the SDGs: Some Reflections. Sustainability 2020, 12, 7789. [Google Scholar] [CrossRef]
- Lagoarde-Segot, T.; Martínez, E.A. Ecological finance theory: New foundations. Int. Rev. Financ. Anal. 2021, 75, 101741. [Google Scholar] [CrossRef]
Figure 1.
Evolution of the amount issued for green bonds per region. Note: ‘North America’ includes issuers from other regions of the world, apart from Europe and Asia-Pacific. However, the majority of the issuance in this category is from the United States and Canada. Source: Authors’ compilation, using data from [7].

Figure 2.
Distribution of green bonds issuers by sector and by region. Source: Authors’ compilation.
Figure 2.
Distribution of green bonds issuers by sector and by region. Source: Authors’ compilation.


Figure 3.
Mean-variance analysis of the rate of return of green bonds. Source: Authors’ compilation.
Figure 3.
Mean-variance analysis of the rate of return of green bonds. Source: Authors’ compilation.

Figure 4.
Mean-variance analysis of rate of return of green bonds, by sector of issuance. Source: Authors’ calculation.
Figure 4.
Mean-variance analysis of rate of return of green bonds, by sector of issuance. Source: Authors’ calculation.


Figure 5.
Probability of default of Asian green bonds—ratings distribution. Source: Authors’ compilation. (Aa3, Aa2, A1, A3, Baa1, Baa2, Baa3, <Baa3) And (AA, AA-, A+, A, A-, BBB+, BBB-, <BBB-) are the credit ranges by the two credit rating agencies.
Figure 5.
Probability of default of Asian green bonds—ratings distribution. Source: Authors’ compilation. (Aa3, Aa2, A1, A3, Baa1, Baa2, Baa3, <Baa3) And (AA, AA-, A+, A, A-, BBB+, BBB-, <BBB-) are the credit ranges by the two credit rating agencies.


Figure 6.
Effect of tax spillover on rate of return of green bonds. Source: Authors’ depiction.

Table 1.
Description of variables.
| Name of Variable | Observations | Unit | Description | Source |
|---|---|---|---|---|
| Rate of return | 1174 | % | Rate of return on investment, as measured on 10 January each year. | Bloomberg NEF |
| Days to maturity | 1174 | Days | Remaining days before the principal of a security is due and payable. | Bloomberg NEF |
| Amount issued | 1174 | $ | Cumulative amount issued from the original security pricing date through to the current date for debt securities. The amount will include taps/increases or reopenings. | Bloomberg NEF |
| Coupon rate | 1174 | % | Current interest rate of the security. | Bloomberg NEF |
| Issuer name | 1174 | / | Name of the issuing entity. | Bloomberg NEF |
| Region of issuance | 1174 | / | Set of dummy variables, with possible values being Asia and the Pacific, Europe, and North America/Others. | Bloomberg NEF |
| Sector of issuance | 1174 | / | Set of dummy variables, with possible values being banking and finance, public, manufacturing, power and utilities, construction, and others. | Authors’ compilation, based on issuer name provided by Bloomberg NEF |
Source: Authors’ compilation.
Table 2.
Summary statistics.
| Amount Issued (USD million) | Time to Maturity | |||||
|---|---|---|---|---|---|---|
| Item | Asia-Pacific | Europe | North America | Asia-Pacific | Europe | North America |
| Observations | 624 | 835 | 3899 | 608 | 823 | 3886 |
| Mean | 288.28 | 349.73 | 49.71 | 8505.14 | 4624.98 | 4502.73 |
| Standard deviation | 443.31 | 628.25 | 129.91 | 46,149.90 | 25,339.42 | 2067.03 |
| Minimum | 0.99 | 0.38 | 0.02 | 161 | 19 | 24 |
| Maximum | 4355.1 | 7558.6 | 2250.0 | 364,635.0 | 364,877.0 | 36,594.0 |
Source: Authors’ compilation.
Table 3.
Kolmogorov–Smirnov test for equality of distribution.
| Asia–Europe vs. North America | Asia–North America vs. Europe | Europe–North America vs. Asia | |
|---|---|---|---|
| Rate of Return | 0.43 *** (0.00) | 0.66 *** (0.00) | 0.52 *** (0.00) |
| Amount Issued | 0.12 *** (0.00) | 0.43 *** (0.00) | 0.41 *** (0.00) |
| Time to Maturity | 0.26 *** (0.00) | 0.23 *** (0.00) | 0.43 *** (0.00) |
| Coupon Rate | 0.39 *** (0.00) | 0.63 *** (0.00) | 0.46 *** (0.00) |
Source: Authors’ compilation. Associated probability in parenthesis. *** denotes significance at the 1% level.
Table 4.
Regression results.
| Item | Full Sample | Asia-Pacific | Europe | North America | ||||
|---|---|---|---|---|---|---|---|---|
| Pooled OLS | GLS Regression (Random Effect) | Pooled OLS | GLS Regression (Random Effect) | Pooled OLS | GLS Regression (Random Effect) | Pooled OLS | GLS Regression (Random Effect) | |
| Days to maturity | −9.78 × 10⁻⁷ (1.07 × 10⁻⁶) | −9.78 × 10⁻⁷ (1.15 × 10⁻⁶) | 8.80 × 10⁻⁶ (7.28 × 10⁻⁵) | 4.97 × 10⁻⁶ (8.85 × 10⁻⁵) | −1.15 × 10⁻⁶ (1.74 × 10⁻⁶) | −1.15 × 10⁻⁶ (1.51 × 10⁻⁶) | 3.87 × 10⁻⁵ *** (1.08 × 10⁻⁵) | 4.85 × 10⁻⁵ *** (1.28 × 10⁻⁵) |
| Coupon Rate | 1.20 *** (0.20) | 1.20 *** (0.20) | 1.14 *** (0.13) | 1.14 *** (0.16) | 1.57 ** (0.69) | 1.57 *** (0.56) | 0.78 *** (0.04) | 0.76 *** (0.04) |
| Banking | −0.05 (0.20) | −0.05 (0.27) | −0.62 *** (0.19) | −0.57 ** (0.24) | 0.33 (0.38) | 0.33 (0.31) | −0.07 (0.14) | −0.04 (0.18) |
| Manufacturing | 2.27 (1.82) | 2.27 (1.85) | 1.84 (1.20) | 1.79 (1.50) | 5.30 (4.87) | 5.30 (4.70) | −0.06 (0.11) | 0.05 (0.13) |
| Power/Utilities | −0.13 (0.18) | −0.13 (0.21) | 1.04 (1.00) | 0.97 (1.05) | −0.30 * (0.15) | −0.30 (0.20) | −0.07 (0.11) | 0.03 (0.15) |
| Others | −0.45 ** (0.23) | −0.45 * (0.25) | −0.52 (0.34) | −0.42 (0.45) | −0.35 (0.33) | −0.35 (0.33) | −0.04 (0.12) | 0.05 (0.16) |
| 2018 | 0.11 (0.11) | 0.11 (0.08) | 0.06 (0.23) | 0.25 * (0.13) | 0.07 (0.22) | 0.07 (0.15) | 0.10 (0.13) | −0.00496 (0.06) |
| 2019 | 0.25 ** (0.11) | 0.25 *** (0.08) | −0.05 (0.25) | −0.01 (0.19) | 0.33 * (0.18) | 0.33 *** (0.11) | 0.27 ** (0.12) | 0.36 *** (0.07) |
| 2020 | −0.20 (0.17) | −0.20 (0.16) | −0.63 ** (0.24) | −0.60 *** (0.17) | 0.08 (0.30) | 0.08 (0.29) | −0.66 *** (0.10) | −0.69 *** (0.05) |
| Asia | 0.65 * (0.38) | 0.65 (0.43) | ||||||
| Europe | 0.49 (0.56) | 0.49 (0.55) | ||||||
| Asia—Banking | −0.76 * (0.41) | −0.76 (0.51) | ||||||
| Europe—Banking | 0.08 (0.24) | 0.08 (0.31) | ||||||
| Constant | −0.90 (0.70) | −0.90 (0.70) | 0.06 (0.33) | 5.83 × 10⁻³ (0.40) | −1.11 (0.96) | −1.11 (0.77) | 0.51 *** (0.13) | 0.50 *** (0.13) |
| Observations | 1174 | 1174 | 366 | 366 | 603 | 603 | 205 | 205 |
| R-squared | 0.41 | 0.61 | 0.47 | 0.56 | 0.26 | 0.49 | 0.86 | 0.87 |
GLS = generalized least squares, OLS = ordinary least squares. Notes: Standard errors, presented in parentheses, are obtained using the White method, robust with heteroskedasticity and serial correlation. ***, **, and * denote significance at the 1%, 5%, and 10% levels, respectively. Source: Authors’ calculation.
Table 5.
Misspecification tests.
| Item | Regional sample | Test Statistic | Probability |
|---|---|---|---|
| Full Sample | 2.22 | 0.00 *** | |
| Poolability test | Asia and the Pacific | 5.00 | 0.00 *** |
| Europe | 1.08 | 0.24 | |
| North America and other issuers | 31.13 | 0.00 *** |
Source: Authors’ calculation. *** denotes significance at the 1% level.
Table 6.
Diagnostics.
| Item | Full Sample | Asia-Pacific | Europe | North America |
|---|---|---|---|---|
| Idiosyncratic error term, | 2.67 | 2.03 | 3.31 | 0.28 |
| <0.00 | 1.52 | <0.00 | 0.33 | |
| Fraction of variance due to individual heterogeneity | <0.00 | 0.36 | <0.00 | 0.59 |
Source: Authors’ calculation.
Table 7.
Regional characteristics of green bonds.
| Item | Asia and the Pacific | Europe | North America |
|---|---|---|---|
| Risks | High | Low | Moderate |
| Return | High | Low | Moderate |
| Homogeneity between bonds | Heterogeneous | Homogenous | Heterogeneous |
| Sector of issuance | Dominated by banking and finance | Well-balanced between public, utilities, and banking and other issuers | Well-balanced, between public, utilities, and banking and other issuers |
| Size | Large | Large | Small |
| Maturity | Long-term | Medium-term | Medium-term |
Source: Authors’ compilation.
Publisher’s Note: MDPI stays neutral with regard to jurisdictional claims in published maps and institutional affiliations. |
© 2021 by the authors. Licensee MDPI, Basel, Switzerland. This article is an open access article distributed under the terms and conditions of the Creative Commons Attribution (CC BY) license (https://creativecommons.org/licenses/by/4.0/).
Share and Cite
MDPI and ACS Style
Taghizadeh-Hesary, F.; Yoshino, N.; Phoumin, H. Analyzing the Characteristics of Green Bond Markets to Facilitate Green Finance in the Post-COVID-19 World. Sustainability 2021, 13, 5719. https://doi.org/10.3390/su13105719
AMA Style
Taghizadeh-Hesary F, Yoshino N, Phoumin H. Analyzing the Characteristics of Green Bond Markets to Facilitate Green Finance in the Post-COVID-19 World. Sustainability. 2021; 13(10):5719. https://doi.org/10.3390/su13105719
Chicago/Turabian StyleTaghizadeh-Hesary, Farhad, Naoyuki Yoshino, and Han Phoumin. 2021. "Analyzing the Characteristics of Green Bond Markets to Facilitate Green Finance in the Post-COVID-19 World" Sustainability 13, no. 10: 5719. https://doi.org/10.3390/su13105719
Note that from the first issue of 2016, this journal uses article numbers instead of page numbers. See further details here.