The Influence of Cleaning Frequency of Photovoltaic Modules on Power Losses in the Desert Climate


1
Department of Electrical Engineering, United Arab Emirates University, P.O. Box 15551 Al Ain, UAE
2
Department of Architectural Engineering, United Arab Emirates University, P.O. Box 15551 Al Ain, UAE
3
Department of Chemical and Petroleum Engineering, United Arab Emirates University, P.O. Box 15551 Al Ain, UAE
*
Author to whom correspondence should be addressed.
Sustainability 2020, 12(22), 9750; https://doi.org/10.3390/su12229750
Submission received: 31 August 2020
/
Revised: 18 November 2020
/
Accepted: 18 November 2020
/
Published: 23 November 2020
Abstract
:Dust accumulation on the photovoltaic (PV) surface decreases the solar radiation penetration to the PV cells and, eventually, the power production from the PV system. To prevent dust-based power losses, PV systems require frequent cleaning, the frequency of which depends on the geographical location, PV integration scheme, and scale of the PV power plant. This study aims to measure the drop-in radiation intensity, as well as power output, due to dust and to determine the optimal time interval for PV cleaning in the United Arab Emirates (UAE) climate. In this research, a dusting study experiment was carried out at the Renewable Energy Laboratory, Falaj Hazza Campus, UAE University, Al Ain, UAE, for 3.5 months, from 22 April 2018 to 7 August 2018. To measure the pure radiation losses caused by the dust, four transparent glasses were used to mimic the top glass cover of the PV modules. The dusting induced power losses were measured for four selected PV cleaning frequencies (10 days, 20 days, 1 month, and 3 months). This study revealed that up to 13% of power losses occurred in PV panels that remained dusty for 3 months, compared to panels that were cleaned daily. PV cleaning after 15 days brought the losses down to 4%, which was found the most feasible time for PV cleaning in this study, considering a reasonable balance between the cleaning cost and energy wasted due to soiling.
1. Introduction
The energy produced by photovoltaic modules has a direct relation with the incident radiation on the photovoltaic (PV) cell passing through the glazed cover [1]. PV panels do not convert all the striking radiation into electrical power, as most of the radiation gets wasted due to several factors that affect PV panel performance. Major factors that affect the conversion efficiency of solar panels include dust accumulation, module temperature elevation, sunlight spectrum, panel direction, and tilt angle [2]. However, PV performance deteriorates more rapidly in the desert environment, due to increased dust accumulation over time, generally termed as soiling losses [3,4]. A variety of research studies shows that soiling substantially diminishes the performance, electrical power, and efficiency of photovoltaic cells [5,6]. Standard dirt particles are less than 10 μm in diameter, depending primarily on the place and surroundings [7]. Dust accumulation increases the soiling effects over time and decreases the total energy generated by the PV module [8,9].
Two primary factors examine the effect of dust on PV performance: the properties of the dust, and the local environment in which the PV system is installed. Dust properties include the size, shape, and color of the particles. The stickiness of the dust particles at any surface also varies from sample to sample. The local environment comprises the system installation location, which means whether the system is installed in a desert, grassy, plain, or mountainous region, and the height of the installed system from the ground. This also includes weather conditions, such as humidity and wind speed, which affect the adhesion of dust particles to the surface of modules [10].
An adhesive and rough PV module surface is more likely to build up dust than a less adhesive and smoother surface. It is also a fact that dust itself causes an increase in dust; if the initial layer of dust is deposited at any surface, it provides better ground for other dust particles to stick there, which means the surface becomes more dust-friendly. Horizontal surfaces tend to build up more dust than vertical and tilted ones because of gravity. This also depends upon the speed and direction of the wind. Winds with low speed generally support the dust accumulation at the module surfaces, while winds with high speed remove dust and clean the surfaces instead. However, the dust accumulation at the PV surface varies according to the geometry of the installed PV system and the direction and speed of the winds at that specific geographical location [11]. Horizontally inclined PV panels can retain both fine and coarse particles, while vertical panels retain only fine particles [12].
Both quantitative and qualitative methods are applied to understand the deposition of dust particles over the PV surface in various climates and PV tilts [10,13]. The effects of tilt angle on the deposition of dust particles on the PV panel front surface and the relationship between output power, dust particle size, and irradiance were studied experimentally and mathematically [14,15]. The cleaning frequency for PV panels installed in different climate zones depends upon the weather, tilt angle, energy tariffs, cleaning overheads, and dust level [16].
Most of the utility-scale PV power plants are installed in the desert to avail low-value lands, as well as to assure there is no PV shading from the surroundings, to achieve economic feasibility [17]. Desert environments, however, simultaneously render increased levels of dust and a lack of infrastructure to keep the panels cleaned, factors which eventually increase PV cleaning costs tremendously. The cost of cleaning includes the costs of cleaning materials and labor costs [18]. The PV cleaning costs vary based on the soiling type and the geographical location where the PV is installed [19]. In the Middle East, soiling is mostly caused by the deposition of dust; therefore, cleaning is relatively easy, compared to the areas where bird droppings and pollution are the major sources of soiling. In Saudi Arabia, a 100 MW solar power plant has a strong seasonal pattern of soil accumulation rate. The losses vary from ∼2% to ∼16% in the least dusty month to the dustiest months, with cleaning costs of 0.190 USD/kW and 0.032 USD/kW or 0.030 USD/m2/cycle and 0.005 USD/m2/cycle for the manual and machinery cleaning, respectively [20]. Mohammed Al-Hosani et al. [21] estimated the cleaning cost in Qatar conditions using different cleaning techniques. The lowest calculated cost per unit PV area—by using a microfiber cloth wiper—was about 0.290 USD/m2/cycle, while the highest calculated cleaning cost was 0.830 USD/m2/cycle by using a combined technique of vacuum cleaner and brush. Mohammed Abu Naser [13] derived a formula to find the optimal number of days between the cleaning cycle of PV array based on the environment, cleaning cost, and lost revenue from dusty panels. He proposed that 22 days is the optimal time after which to clean the PV array. Bashar Hammad et al. [22] proposed a cleaning frequency by developing a multivariate linear regression and artificial neural network models to calculate the conversion efficiency of the PV modules and, based on that, the calculated cleaning frequency was 12–15 days. Mariam et al. also monitored the soiling losses for different time intervals from 3 days to 30 days and, based on the cleaning cost and energy losses cost, proposed that 8 days is the optimal cleaning interval [23]. PV installation configuration is also an important factor to consider when optimizing the cleaning cycle. K. Chiteka et al. [24] proposed that the North-Northwest (NNW) configuration produces the best result, in terms of dust deployment, and hence, the duration for the cleaning cycle increased. The optimization results indicated that, for the North-Northeast (NNE), North (N), and NNW configurations, cleaning is necessary every 18 days, 28 days, and 35 days, respectively.
There are limited data in the United Arab Emirates (UAE) context about the cleaning frequency of PV panels from accumulated dust. However, for the feasibility and sustainability of technology in the UAE, there is a real need for this study. This study aims to measure the drop-in radiation intensity, as well as the power output, due to dusting in the UAE context. The measured power loss due to dusting is employed to determine the feasible time interval between cleaning the panels. The time interval is considered optimal when the cost incurred in cleaning the panels is lower than the benefit of cleaning, in terms of increased power output from the PV panels.
This paper firstly introduces the review of relevant literature, possible soiling effects on PV performance in terms of radiation and power drop, PV cleaning cost, and reported cleaning frequency in different regions. Section 2 focuses on the experimental methodology, where methods to measure purely radiation losses and power losses due to dust adhering at the surface of PV modules are clearly explained. In Section 3, the results and discussion are presented, including the radiation and power losses due to dust and optimal cleaning frequency for PV based on cleaning cost and power recovery. Section 4 summarizes the main findings and conclusions of the study as well as recommendations.
2. Description of Experimental Methodology and Setup
In the first experimental step, the pure radiation losses due to dust were measured by comparing the radiation penetration through the glass surface representing PV glazing for dusted and cleaned PV panels. The power losses due to soiling losses were measured by comparing the power produced by the dusted and cleaned PV panels through their electrical parameters. Four frequencies were selected for cleaning the PV modules (10 days, 20 days, 1 month, and 3 months). The experiments were conducted on the final day of each frequency. The optimal frequency of cleaning was determined by employing radiation and power losses due to dust and considering the reasonable balance between cleaning cost and energy saving.
The data acquisition system (DAQ), used to measure voltage, current, temperature, and humidity, was interfaced with LabView. For the measurement of temperature, thermocouples were connected with the DAQ and the measuring surface (PV). Firstly, the radiation was measured in the form of voltages by using the pyranometers SP-100. The voltage obtained by the pyranometers using National Instruments (NI) voltage modules multiplied with a calibration factor (5 W/m2 per mV or 5000 W/m2 per V), which is provided by the pyranometer manufacturers. The weather data, to establish ambient conditions (ambient temperature, solar radiations, wind speed, and humidity), were measured through onsite weather station “Davis Vantage Pro2”. All the devices used and their measurement uncertainties are listed in Table 1.
The experiment was carried out at the ‘‘Renewable Energy Laboratory’’ Falaj Hazza Campus, United Arab Emirates University, Al Ain, United Arab Emirates. The site is situated at latitude and Longitude of 24.9° N and 55.5° E, respectively. The campus is located in the city between a residential and an industrial area, surrounded by some date palm trees. Near the building is a road with relatively high traffic flows, which may further enhance the airborne particles. The site is far from the industrial zone, which limits the dust accumulation due to pollutants emitted from industries. The particulate matter concentration (PM-10) remains around 130 (µg/m3) on average in Falaj Hazza, Al Ain, which affects the cleaning frequency.
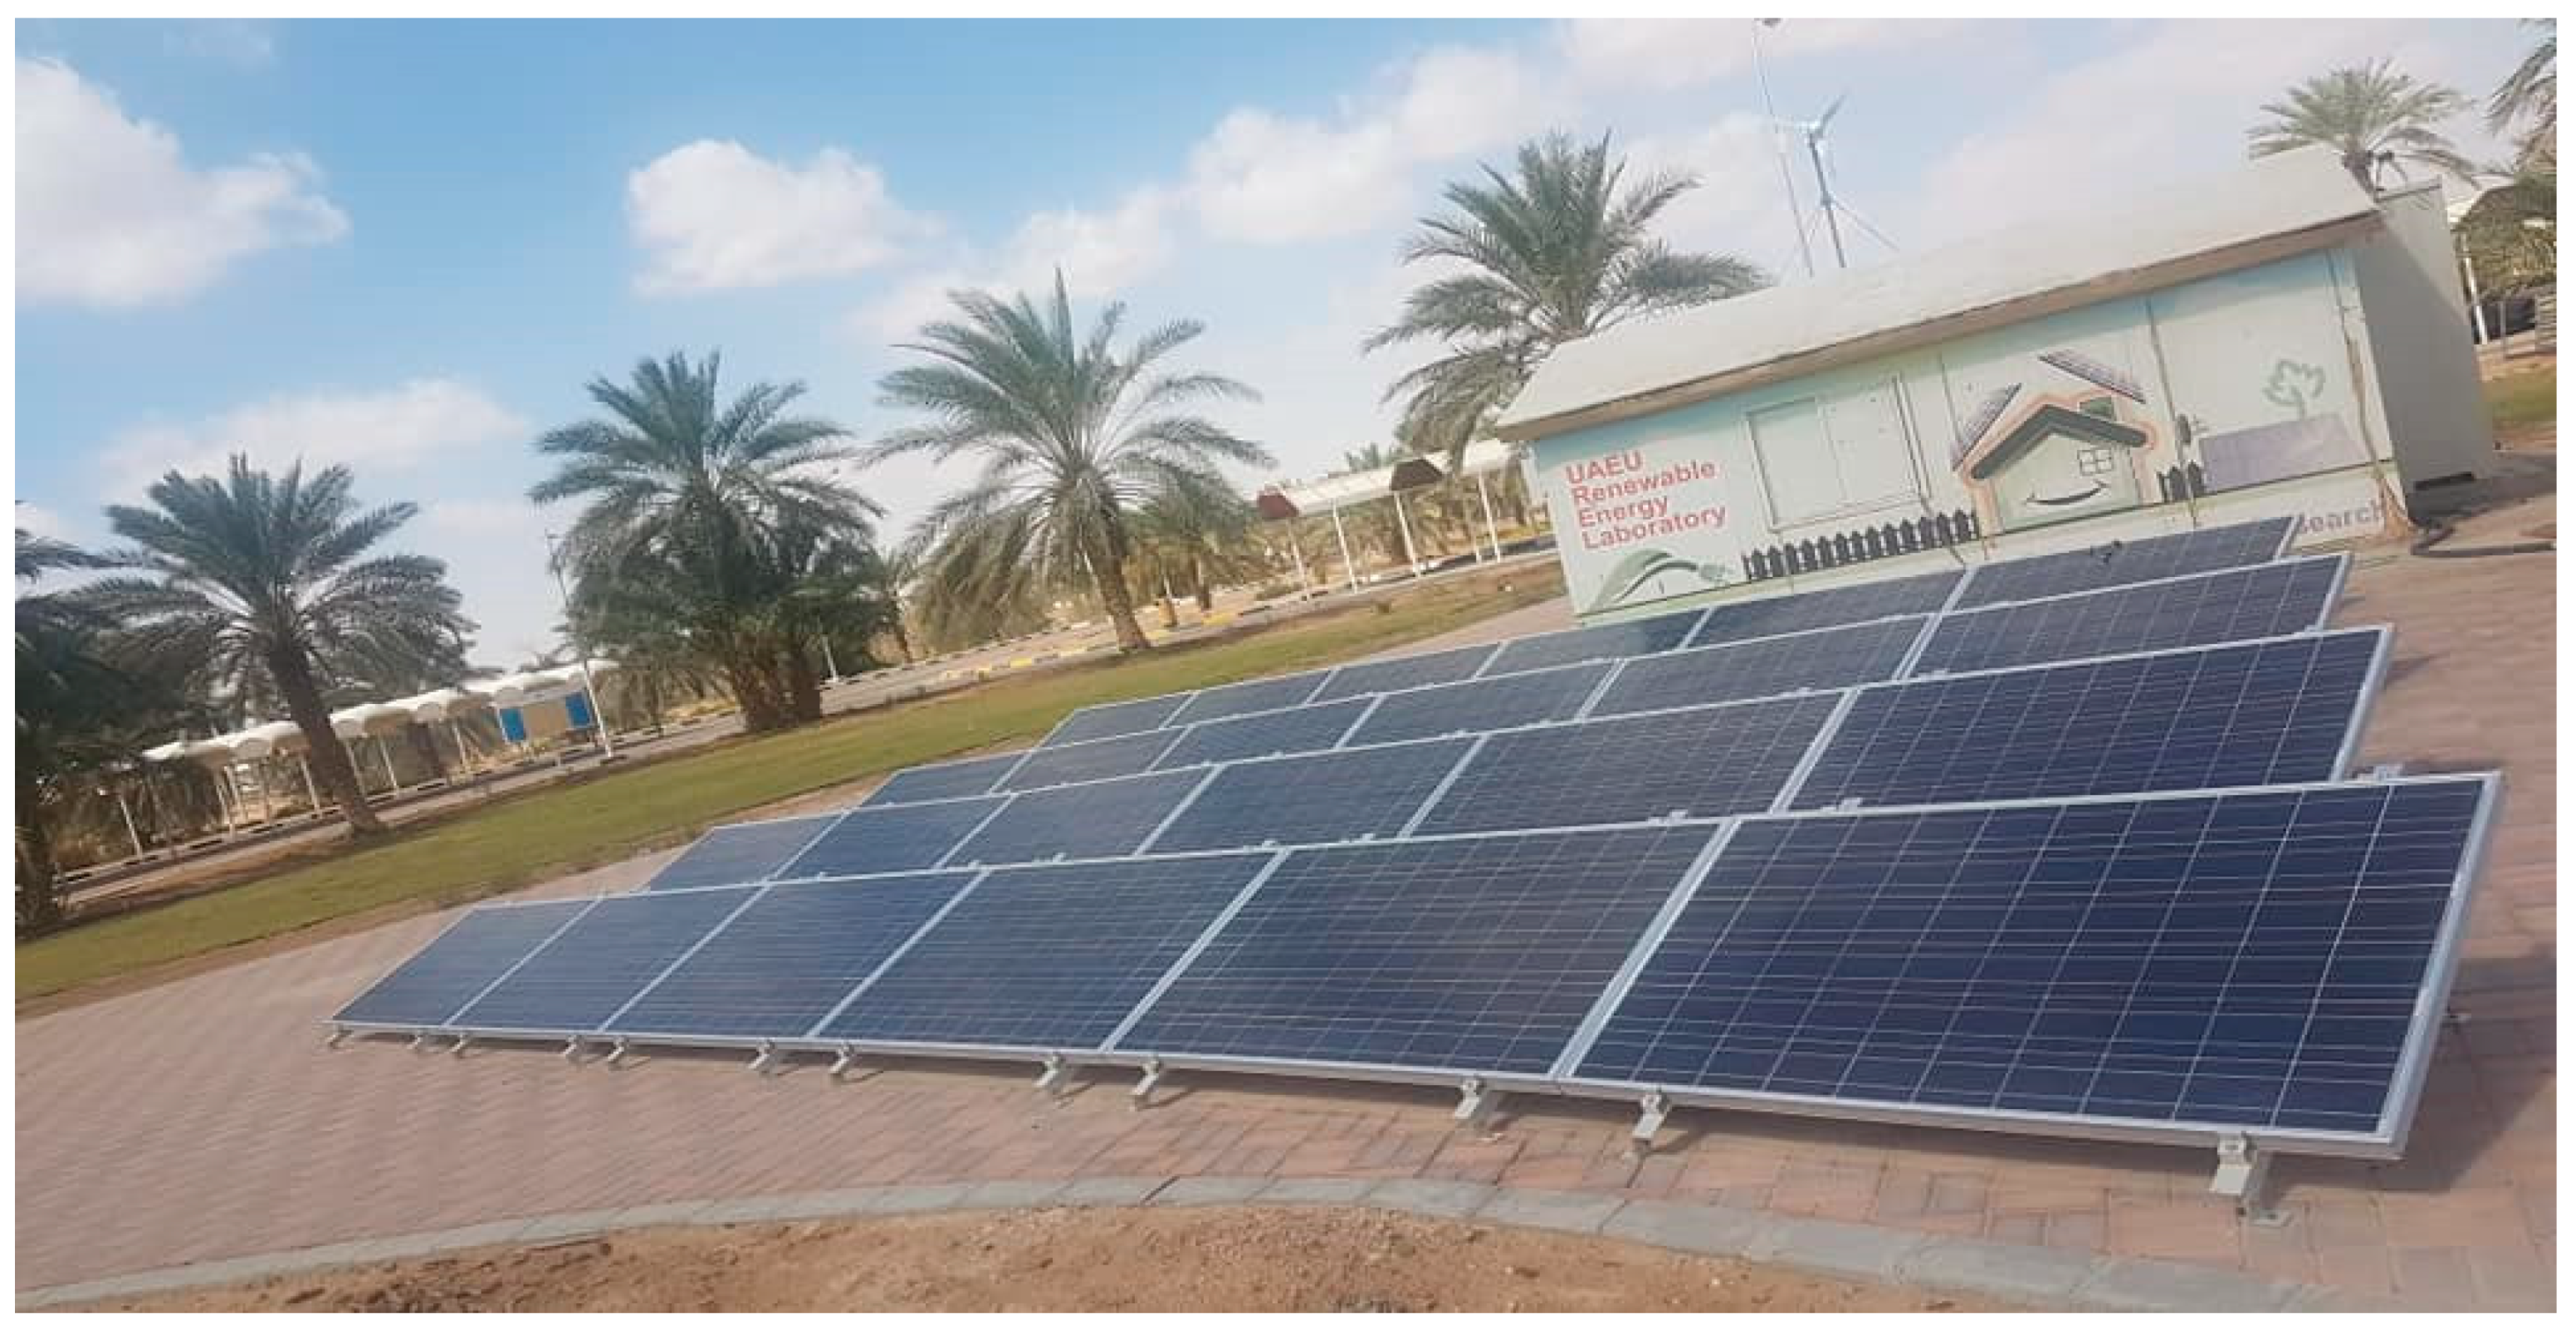
Five monocrystalline photovoltaic modules with dimensions of 99 cm × 134 cm and a rated capacity of 160 W were used to measure the output power after their respective frequencies. The installed PV array at Renewable Energy Laboratory is shown in Figure 1. The reference module was cleaned every morning before starting the experiment; the other four kept dusty for 10 days, 20 days, 1 month, and 3 months, respectively. The cleaning interval was selected in accordance with the practice observed for PV cleaning in UAE. The PVs were cleaned with varying intervals, due to the variance of dust deposition in different seasons and locations, along with the choice of the PV plant owners. The electrical performance of the modules was confirmed by measuring an open-circuit voltage () and short circuit current () prior to the dusting study.
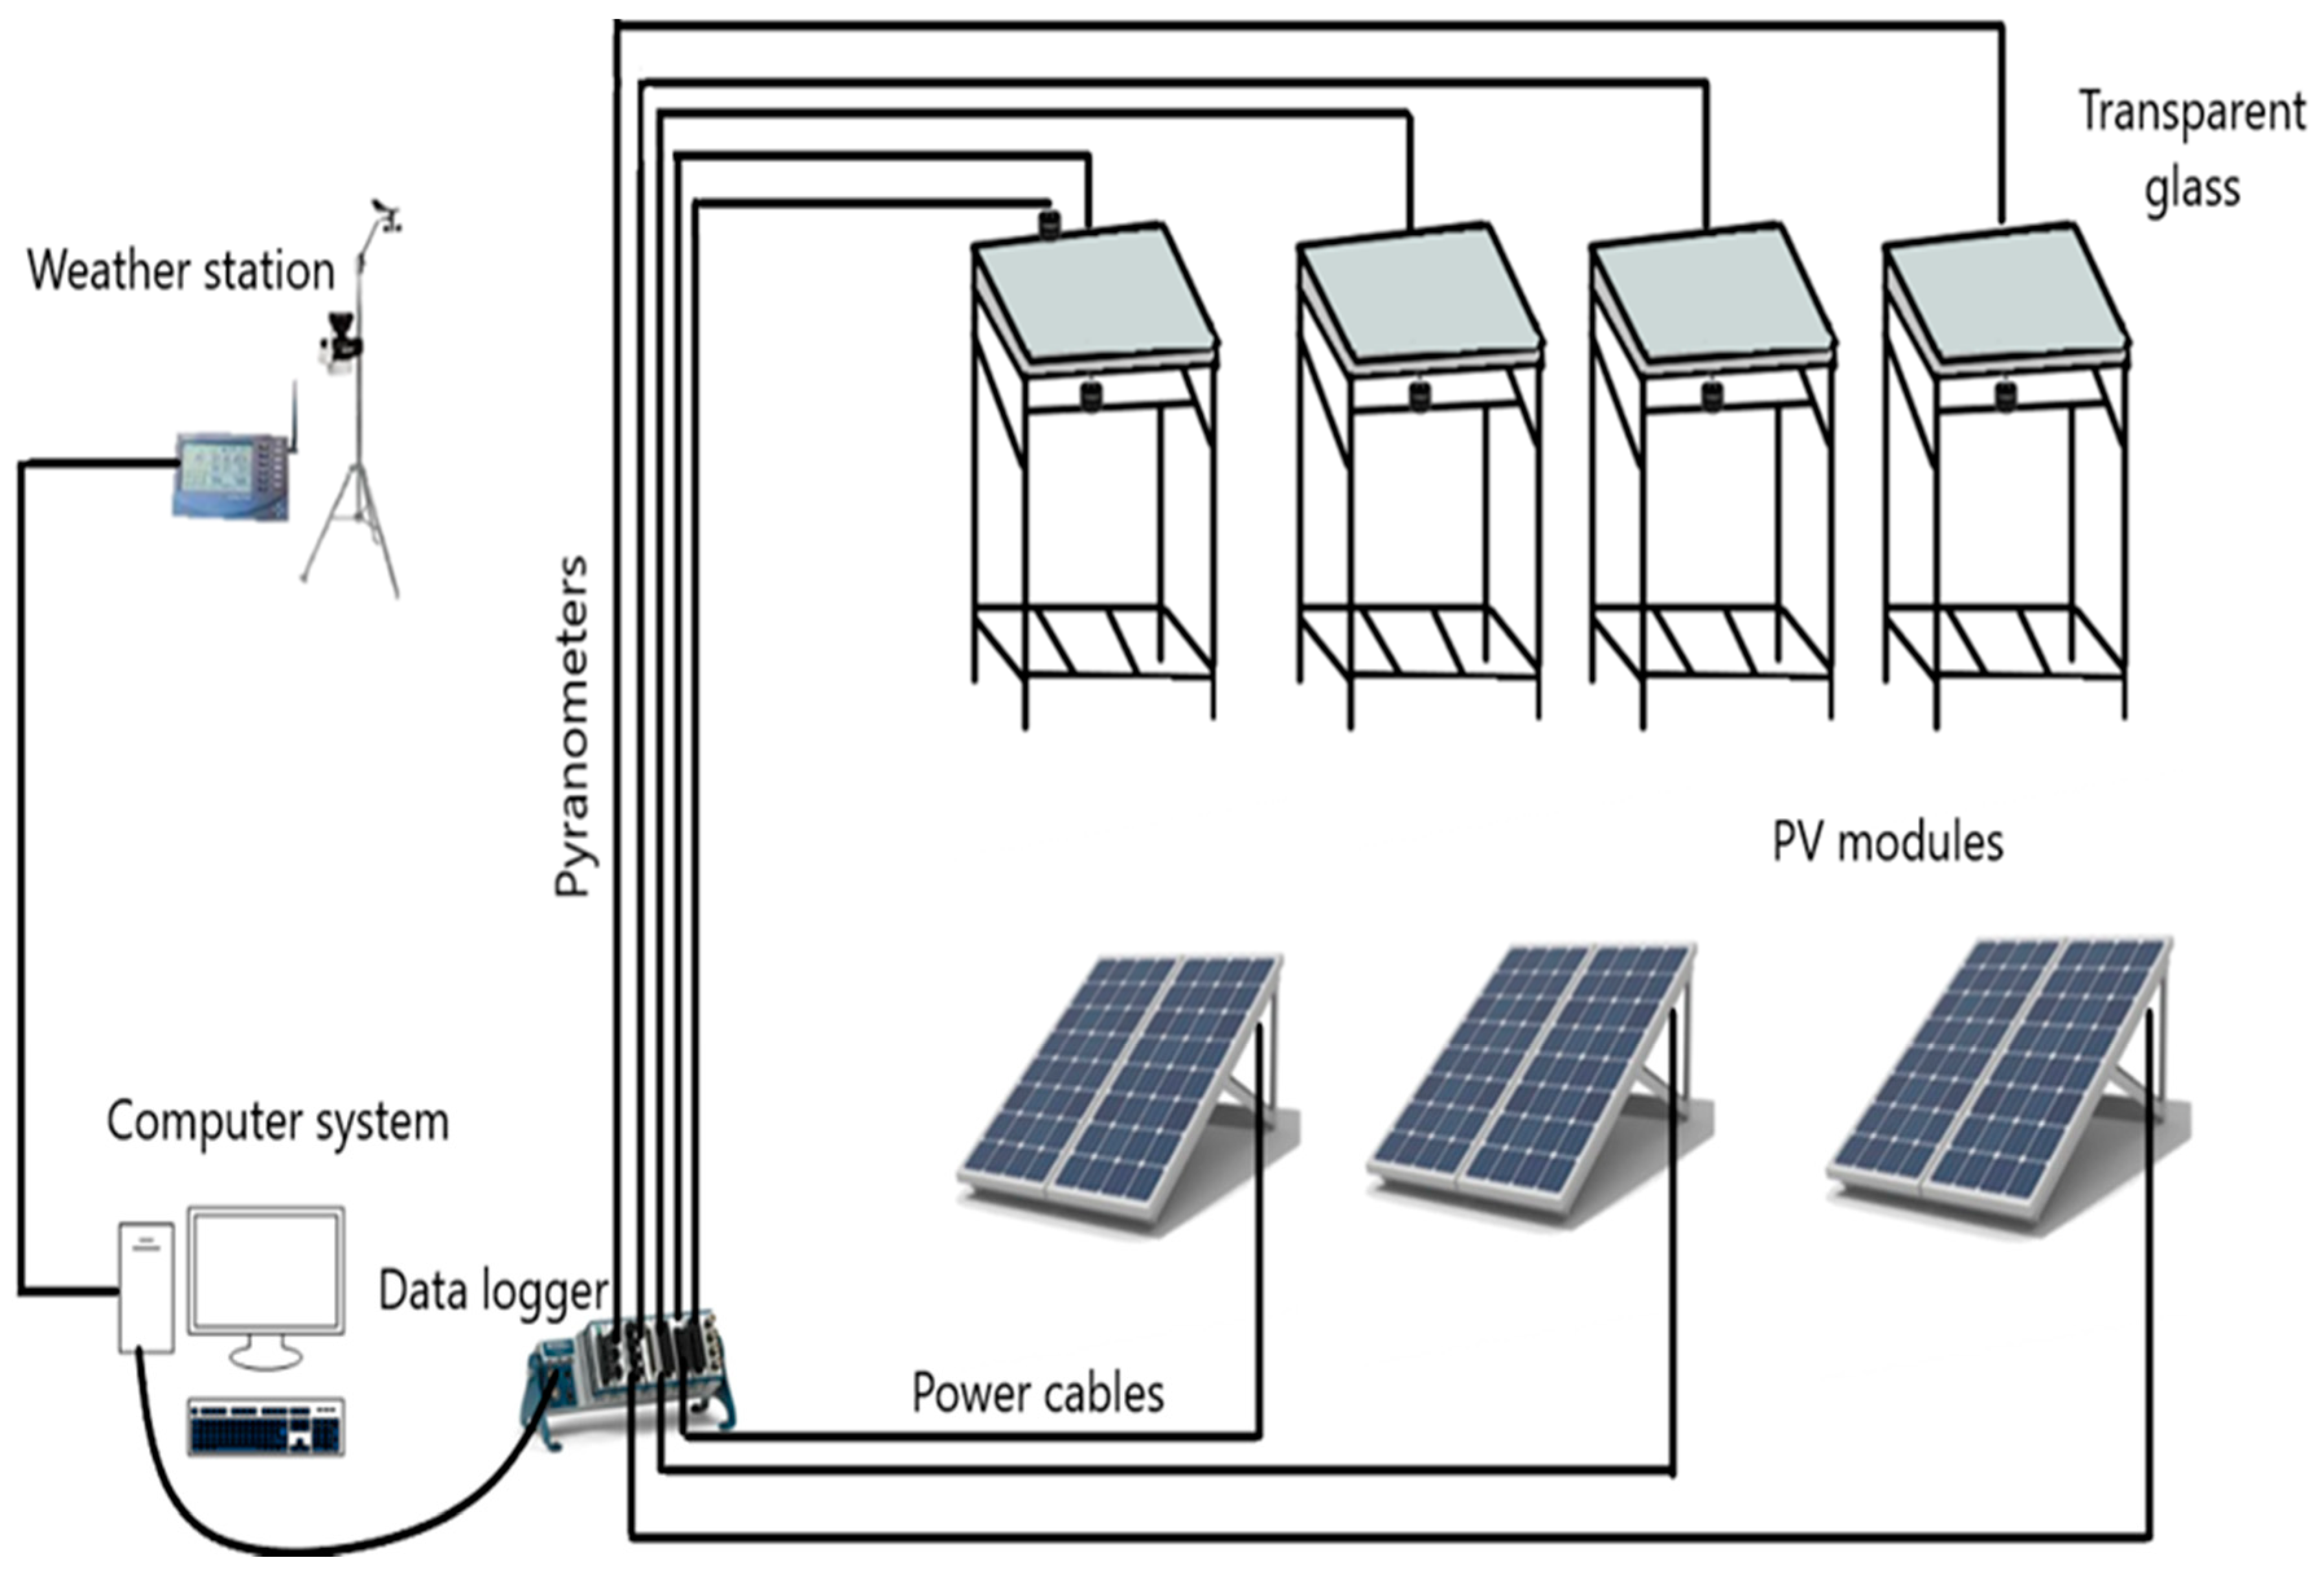
To measure the pure radiation losses caused by dust, four transparent glasses with 3 mm thickness were used in this research to mimic the top glass cover of the PV modules’ understudy. Four self-powered SP-110 Pyranometers were installed at the back sides of the transparent glasses, and one was installed at the latitude angle at the front side of the glass modules to measure solar radiation intensity (G) falling on each module’s surface before and after transmission through the glass. One of the reference glass modules was cleaned daily, while the other four were cleaned after 10 days, 20 days, 30 days, and 3 months, representing a seasonal scale, respectively. Meanwhile, the pyranometers were also placed at the latitude angle at the top side of PV panels, so that they could directly face the sun to obtain the maximum amount of radiation.
All the sensors and the power output cables from the PV modules were connected to a NI-Compact DAQ through current and voltage modules to log the data, as shown in the schematic of the experimental setup in Figure 2.
The dust influence on the received radiation by the pyranometers could be assessed by comparing the recorded irradiance values measured via the pyranometers, which were installed beneath the “daily cleaned” reference glass module, with those values corresponding to pyranometers which were installed below the modules and kept dusty for 10 days, 20 days, 30 days, and 3 months. As a result, the power losses caused by dust were determined by comparing the measured power produced by the daily cleaned and the dusty PV panels.
The experiments were conducted for almost 3.5 months from 22 April 2018 to 7 August 2018, starting at 06:30 AM and ending at 06:30 PM; usually, solar radiation remains high during these months. The results were obtained and recorded on the 10th day, 20th day, 30th day, and after 3 months to optimize the cleaning frequency. The results are described below, with figures in detail. The data were logged for all systems with a time step of 5 min. The weather remained dry without any rain during this period.
3. Results and Discussion
PV panels work efficiently under standard weather conditions, but in the real operating conditions, the weather is changeable; the performance of a PV system depends not only on its basic characteristics but also on the environmental factors. Environmental factors, such as ambient temperature, wind speed, radiations, and humidity, play an important role in the PV conversion process.
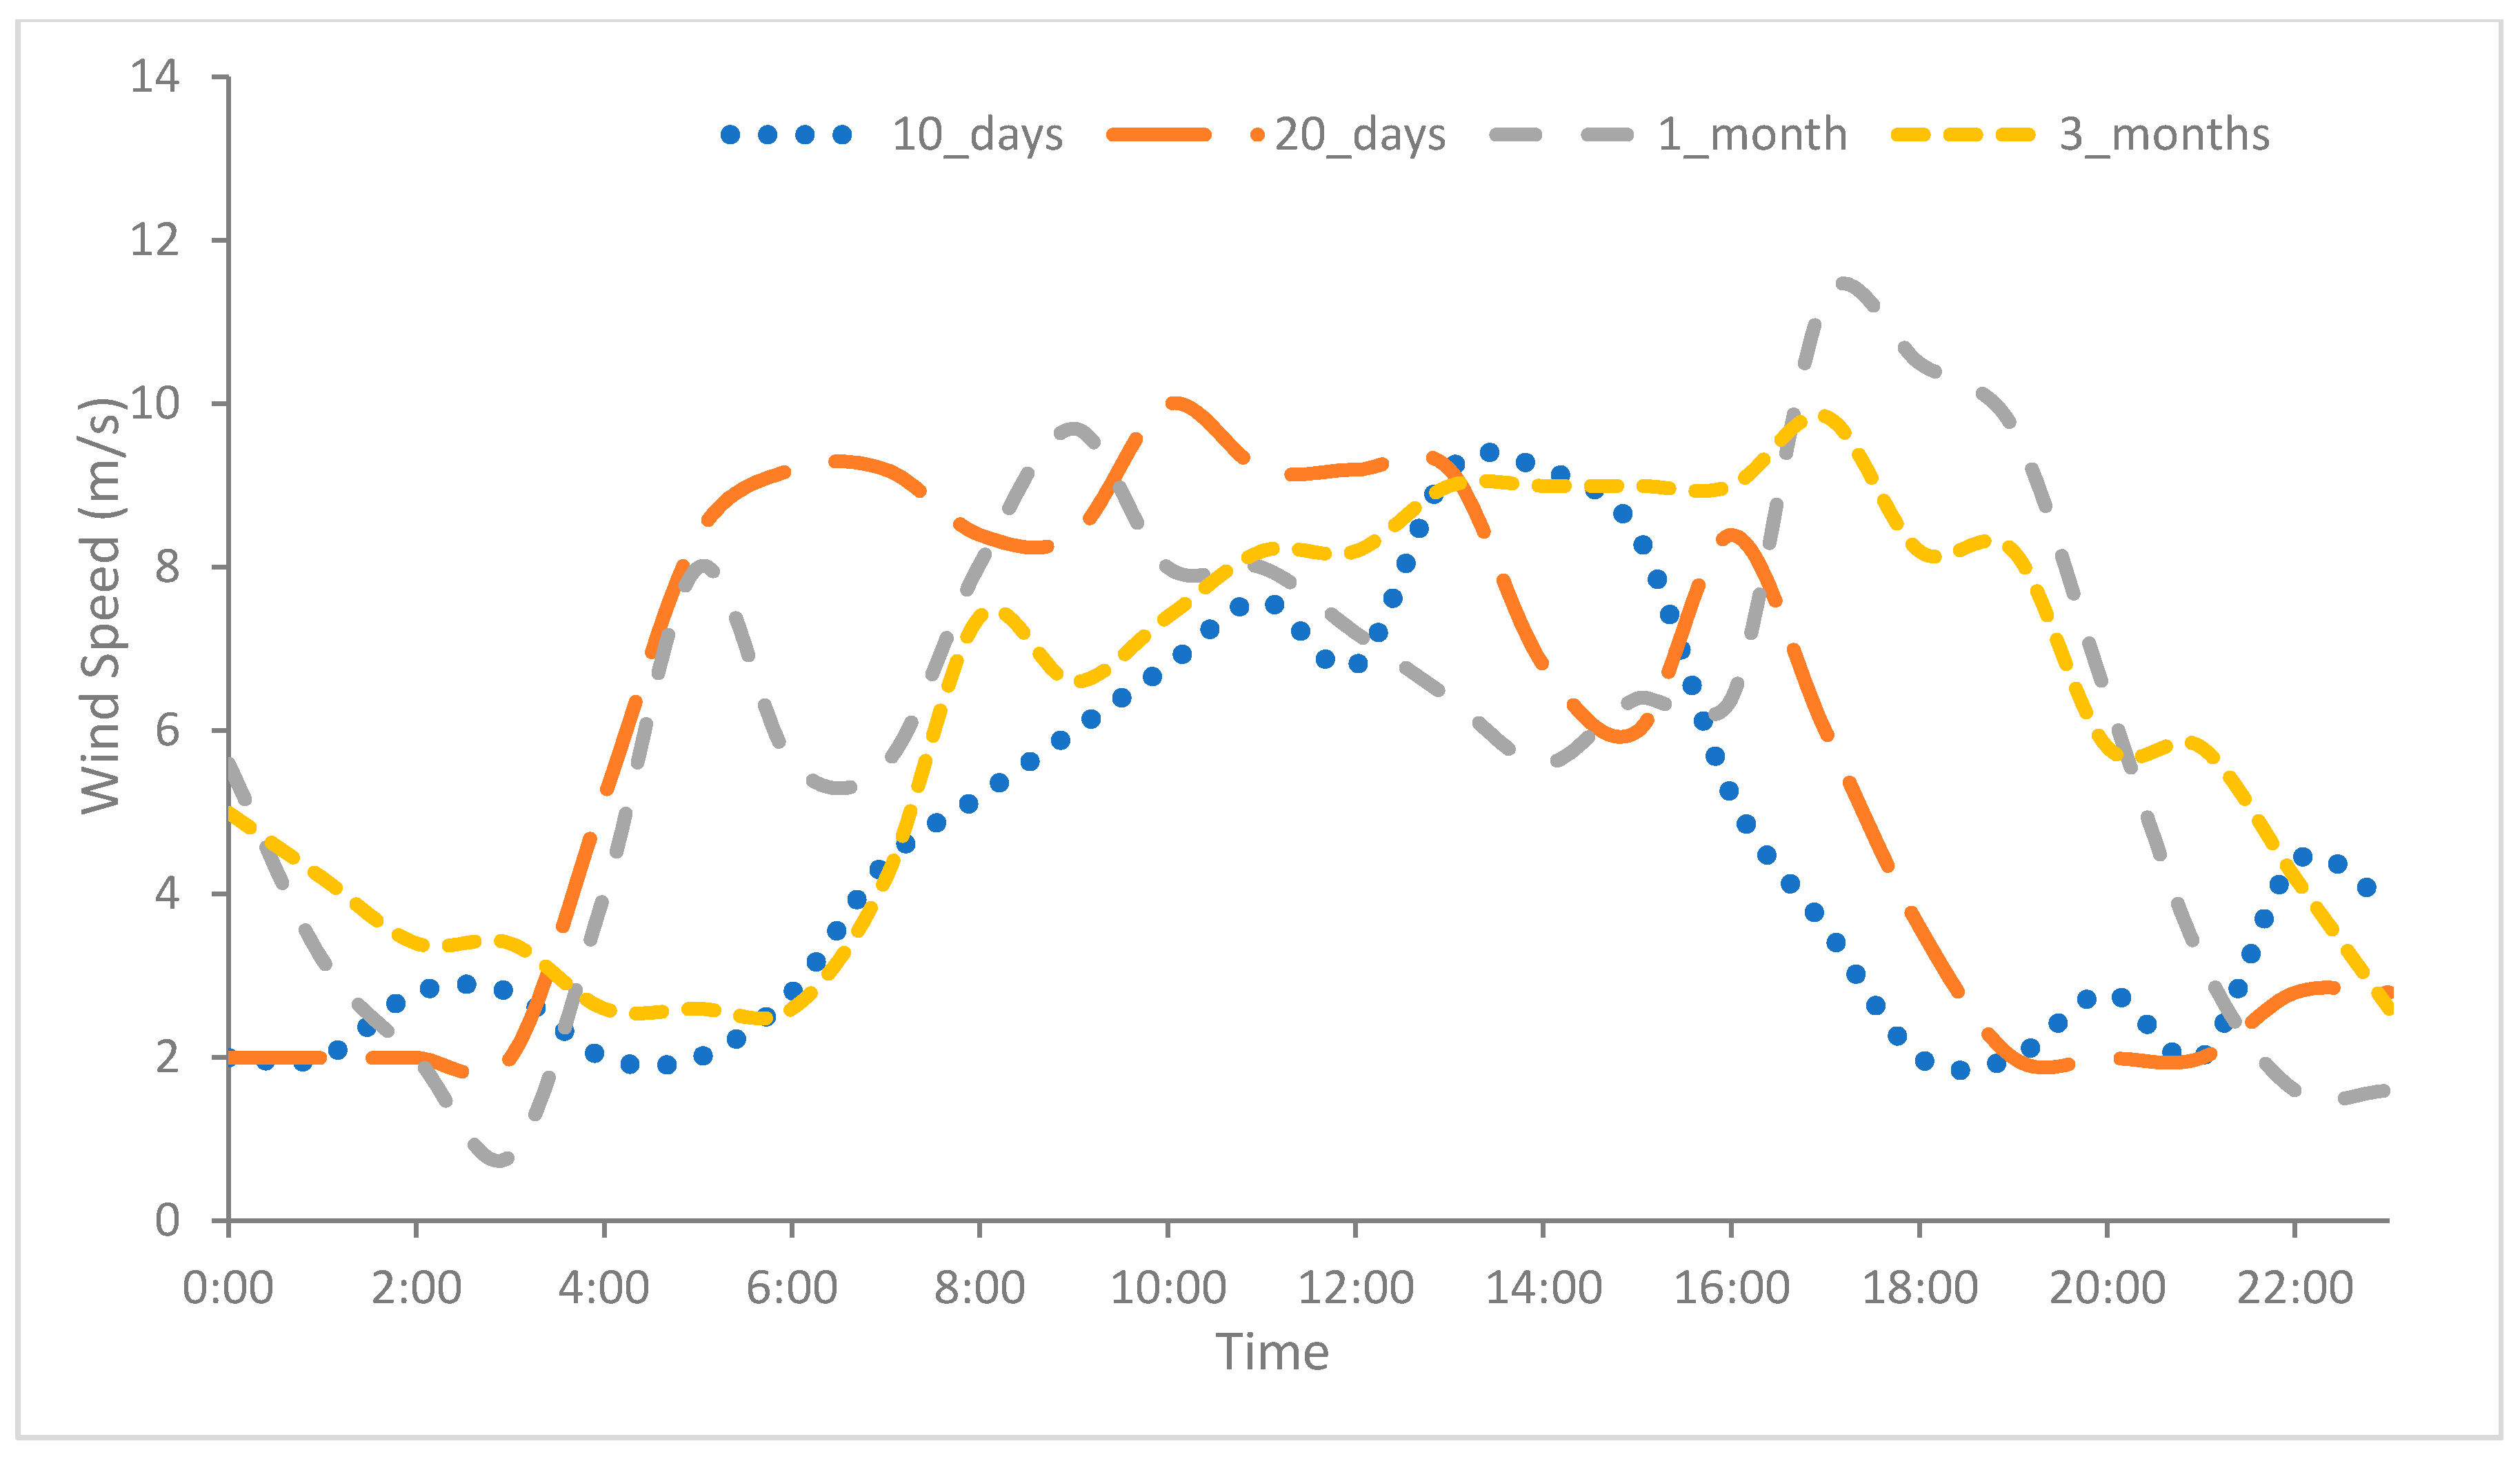
When air flows on the surface of panels, it is expected to blow away dust particles and remove the heat from the panel surface, primarily through convection. This decreases the temperature of panels and also results in the decrease of local relative humidity, and overall results in increased efficiency of the panels. Figure 3 indicates the wind speed () for the specified days after the 10th day, 20th day, 30th day, and 3rd month of the experiment. The average wind speed () remained around 4.4 m/s and 5.7 m/s for a typical day after the 10th and 20th day of the experiment. For 1 month and 3 months, the average wind speed value stayed almost the same, with a value of 6 m/s. As the average wind speed remained almost the same for all particular days of the experiment with the spikes at different times, the overall impact of air on PV performance was considered the same.
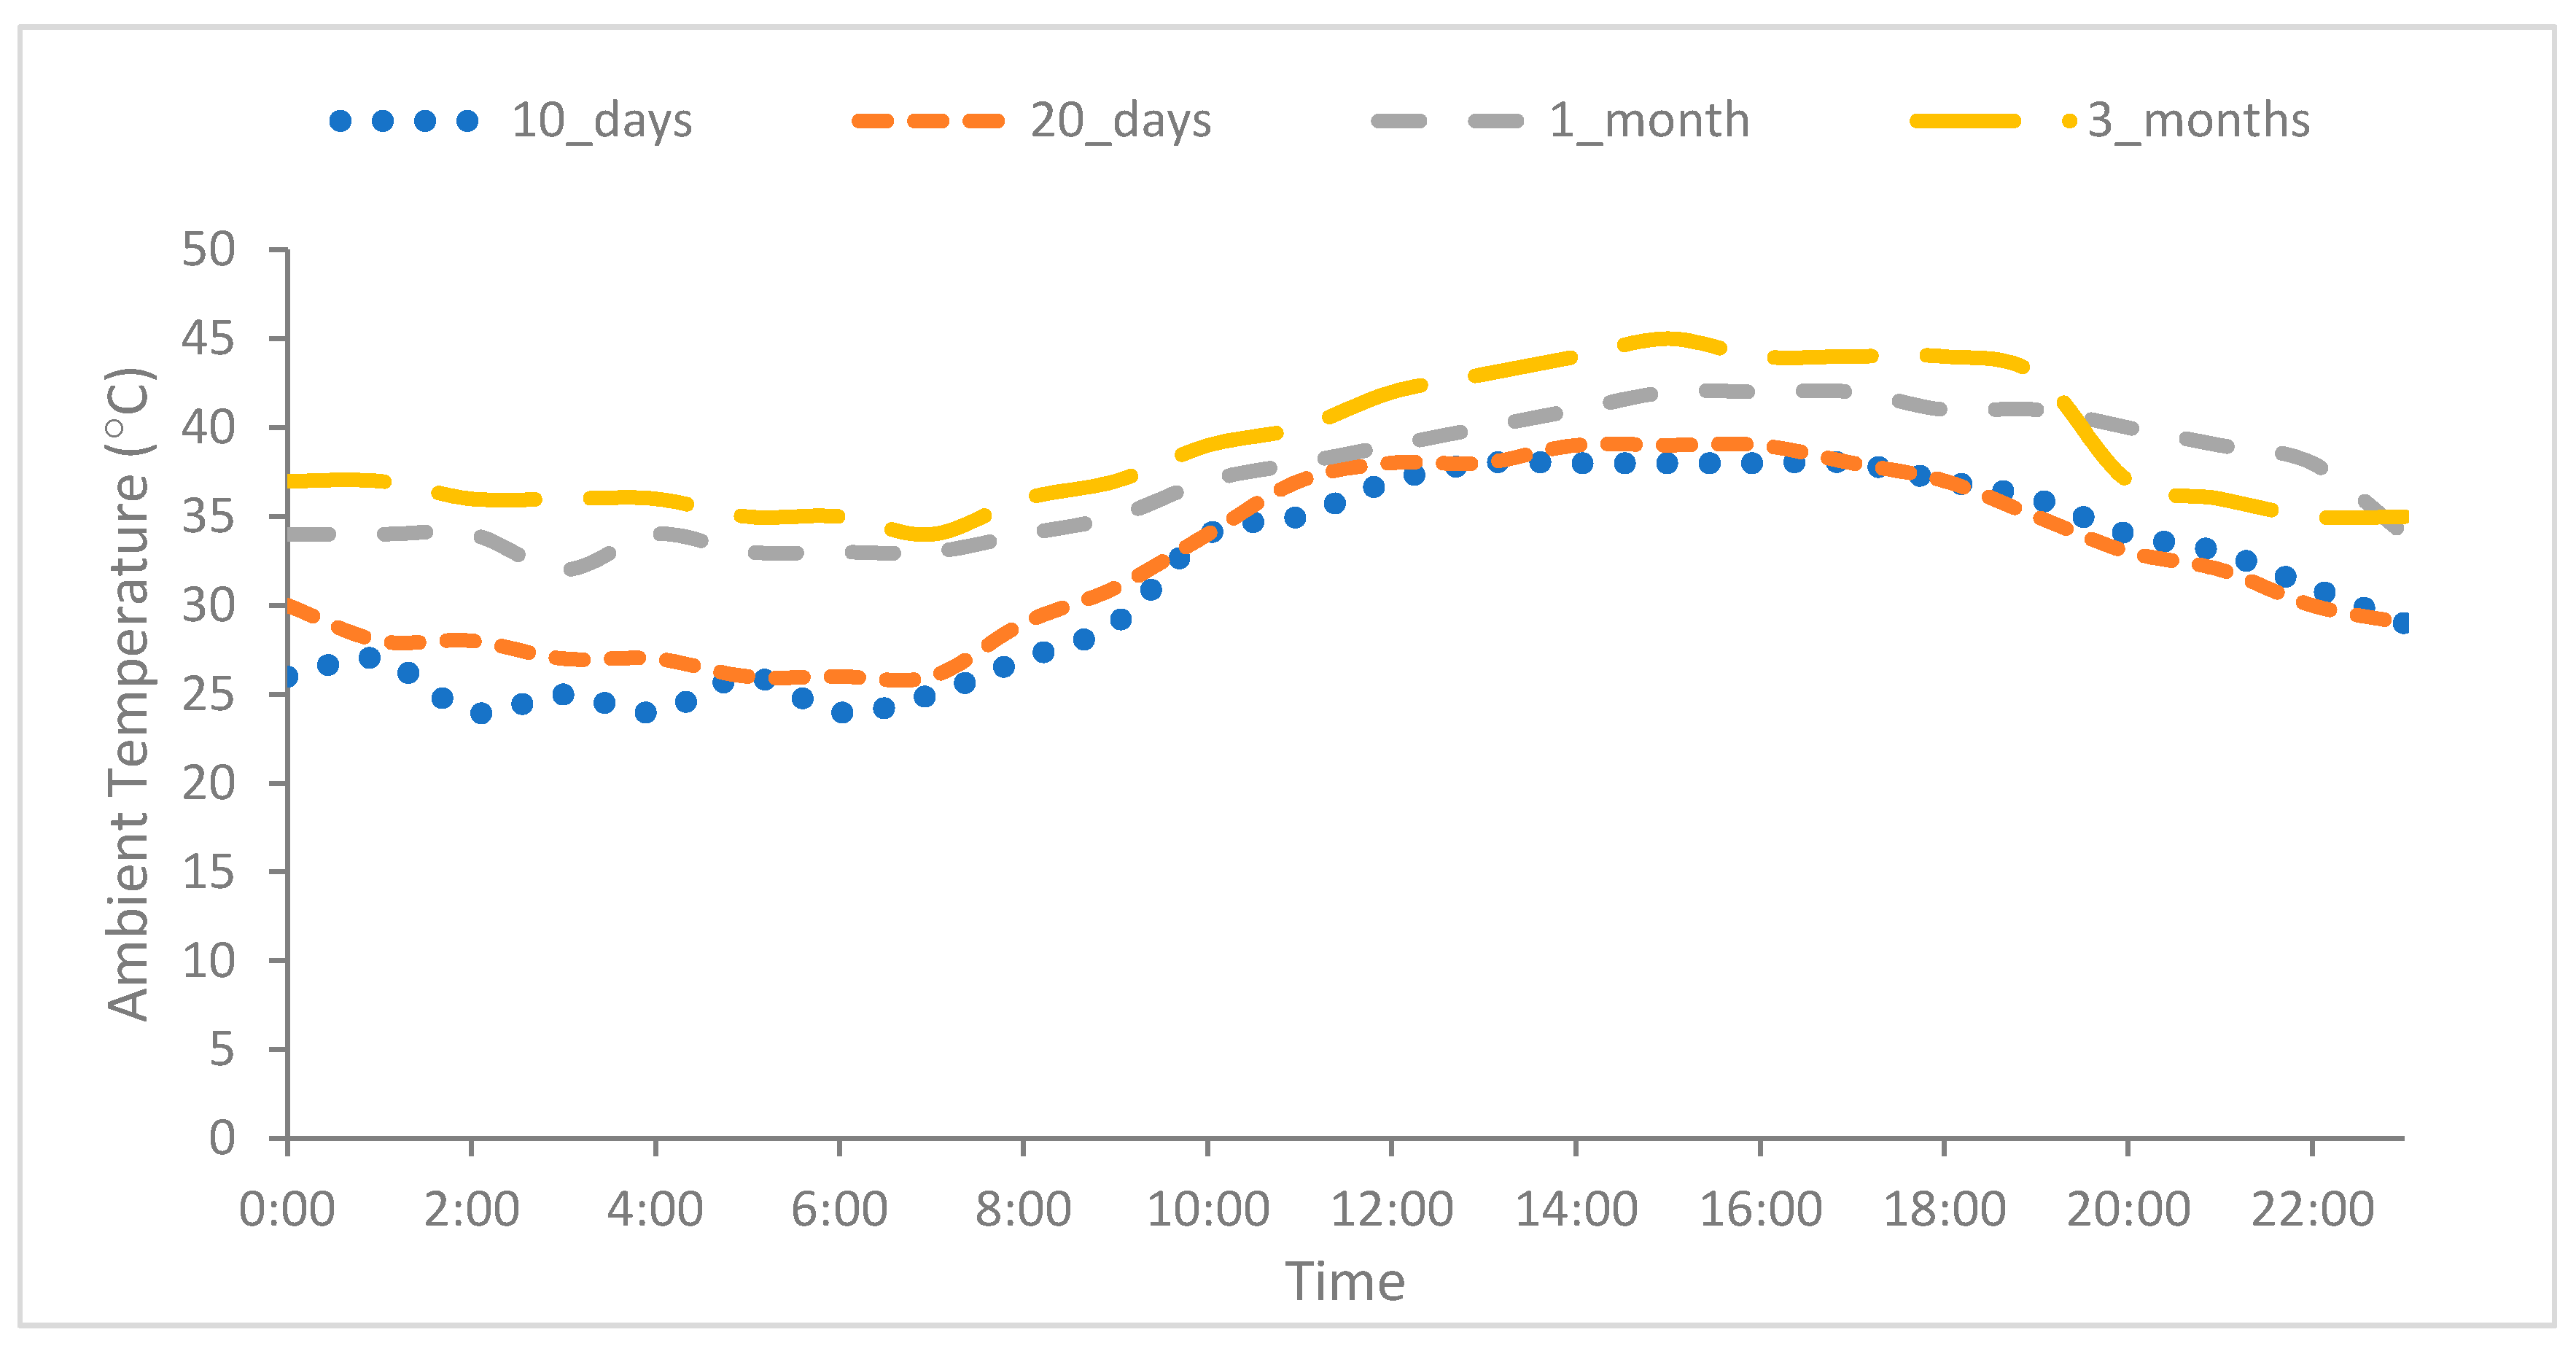
Solar radiation intensity was directly proportional to the PV output power, whereas increased air temperature affects PV performance negatively [32]. Increased air temperature decreases electrical power output by affecting the output voltage of the PV panel. To mitigate the temperature effect, several active and passive cooling techniques are used worldwide [33]. The measured Tamb, for the specified days after 10th day, 20th day, 1 month, and 3 months, is presented in Figure 4. Figure 4 illustrates that Tamb for the typical day after the 10th day of the experiment continued to be low, with an average value of 31 °C, and for a typical day after the 3rd month, measurements remained high, with average and peak values of 39 °C and 45 °C, respectively. The average temperatures for a typical day after the 20th day and 1 month of experimentation were 32 °C and 37 °C, respectively.
Wind speed and humidity both help to reduce the panel temperature and enhance the output power by cooling down the solar panel. Figure 5 shows relative humidity for the specified days after the 10th day, 20th day, 30th day, and 3rd month of the experiment. The average relative humidity remained 20%, 23%, 18%, and 23% and peak relative humidity was at 29%, 33%, 26%, and 36%, respectively, for the particular days of the experiment.
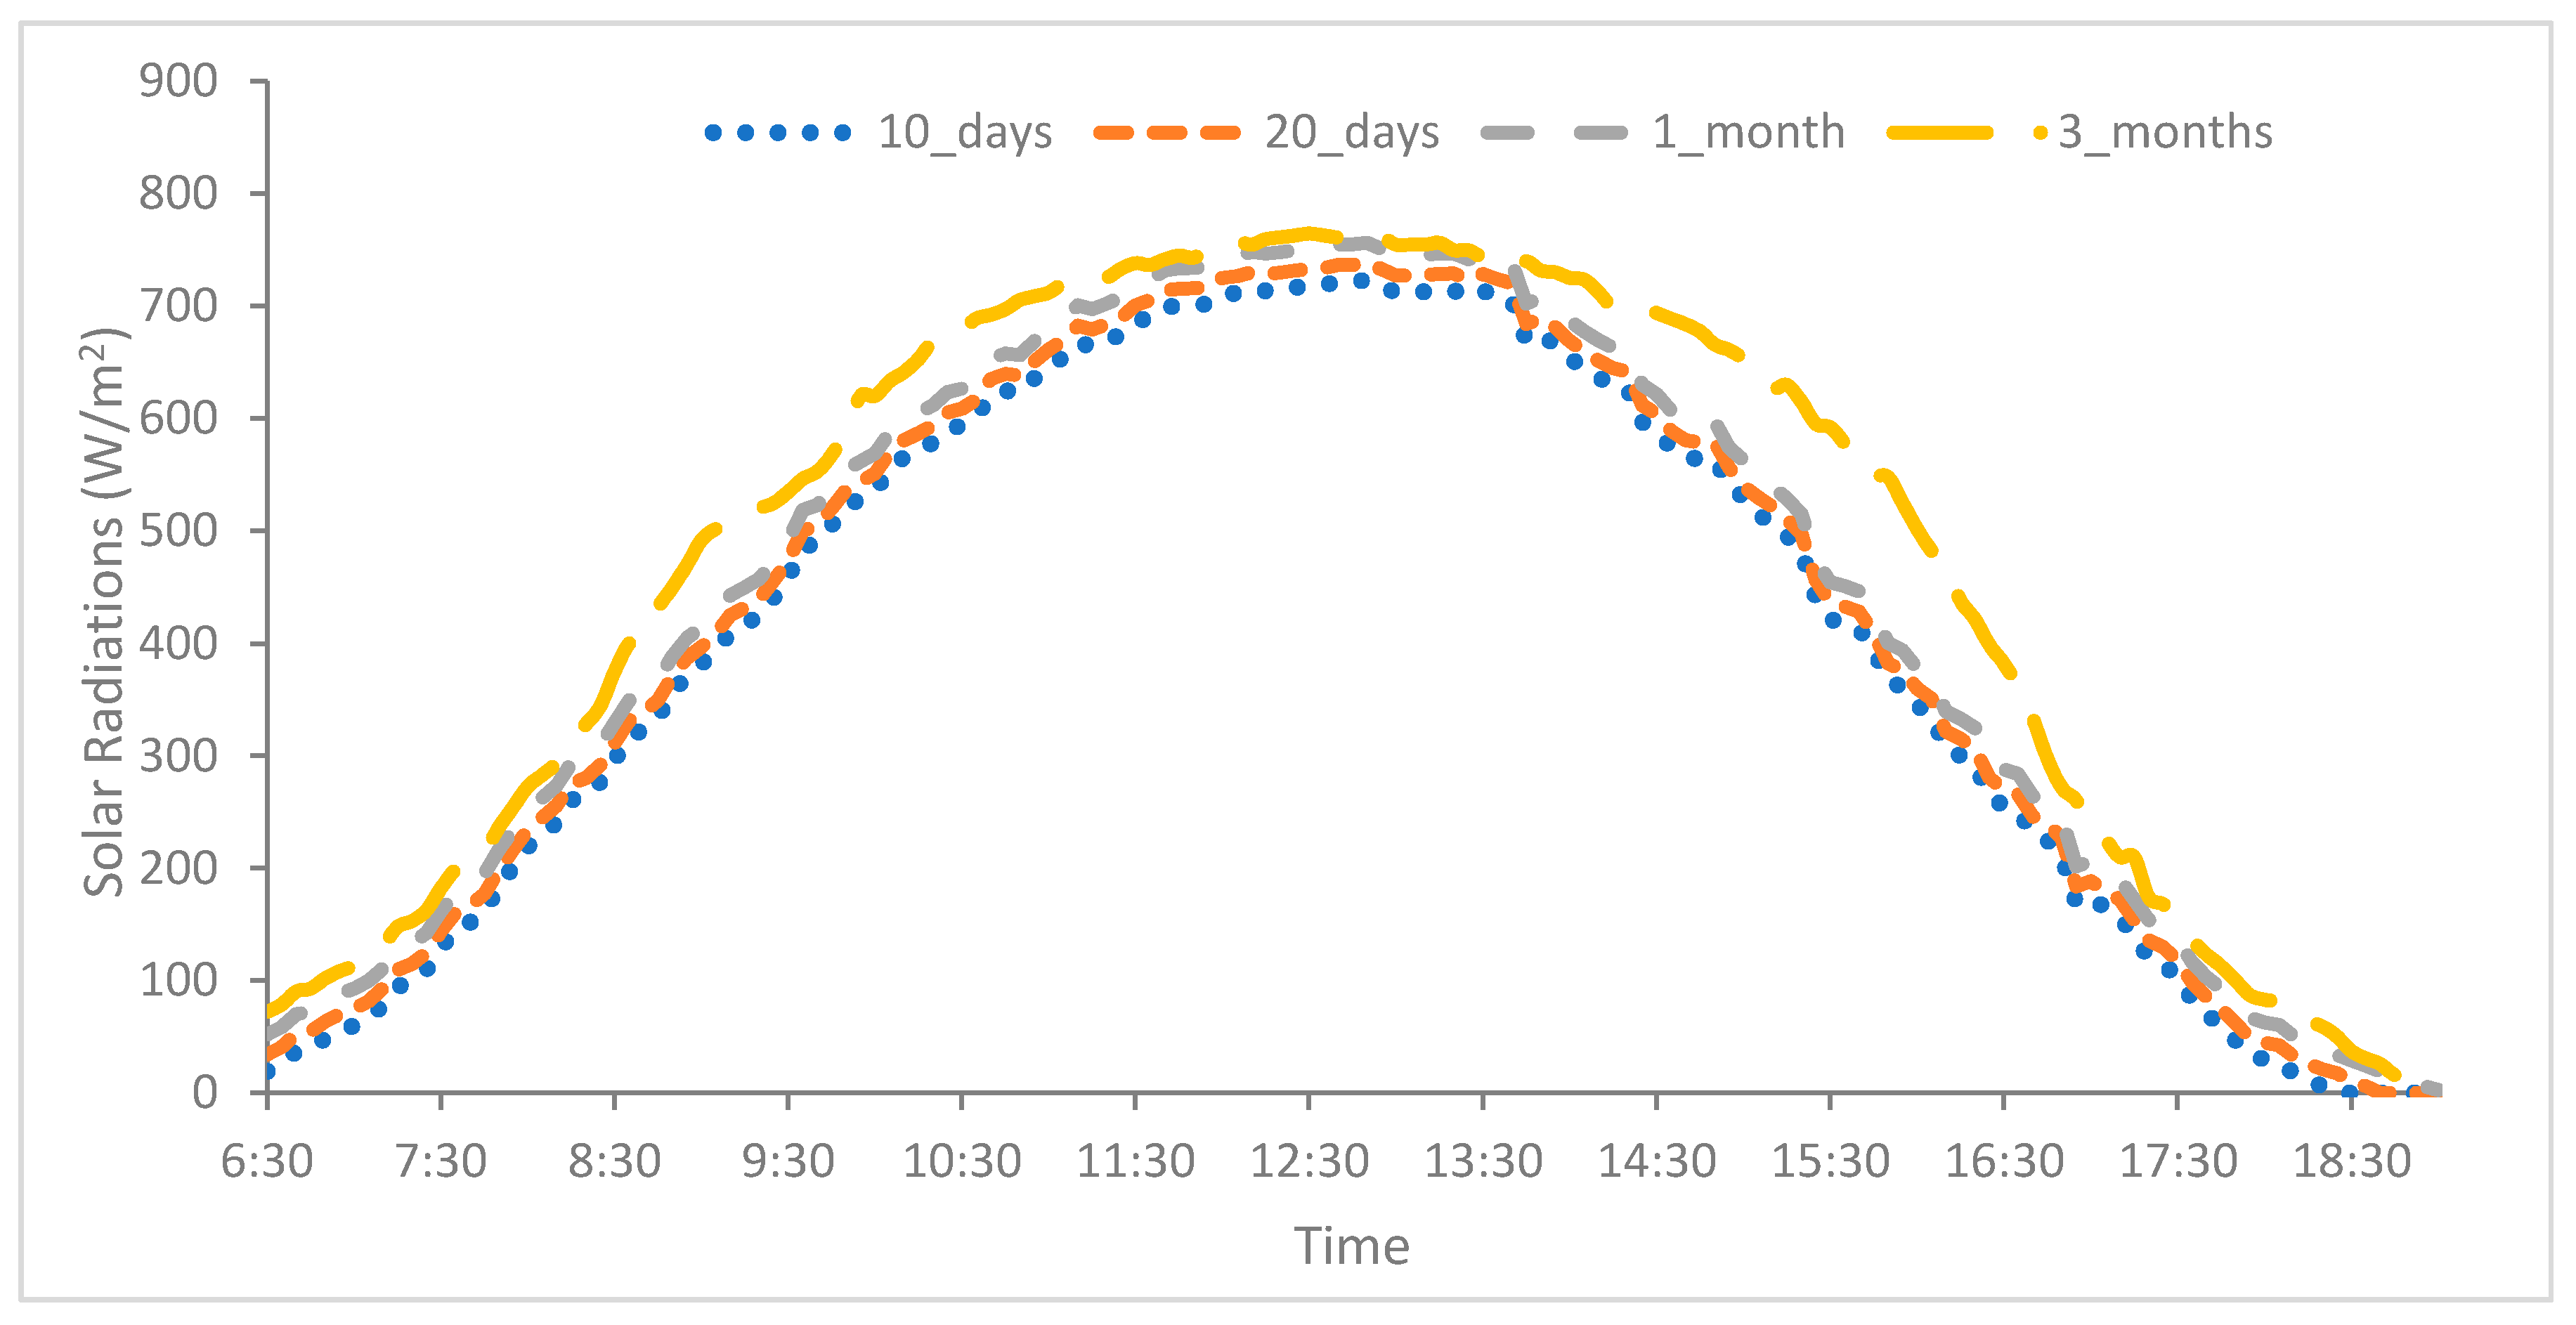
It is well-established fact that the increase in solar radiation, striking the PV surface, increases the output current, which eventually results in enhanced power and efficiency of PV panels. Figure 6 shows the global radiation for the specified days after the 10th day, 20th day, 30th day, and 3rd month of the experiment. Figure 6 depicts that the insolations increase as the summer approaches its peak. The average solar radiation for the 10th and 20th days of the experiment were around 397 W/m2 and 411 W/m2, respectively. The average solar radiation was 424 W/m2 and 471 W/m2 after 1 month and 3 months of experimentation, respectively. The sun’s hours increased as summer gains its strength in UAE; therefore, the average radiation increased as the experiment proceeded from April to August.
Solar radiation that is absorbed by the PV () depends on the surface area (A) and the dusting coefficient (), which represent the PV surface cleanliness and absorptance (α) of the PV panel, as given by Equation (1) [34].
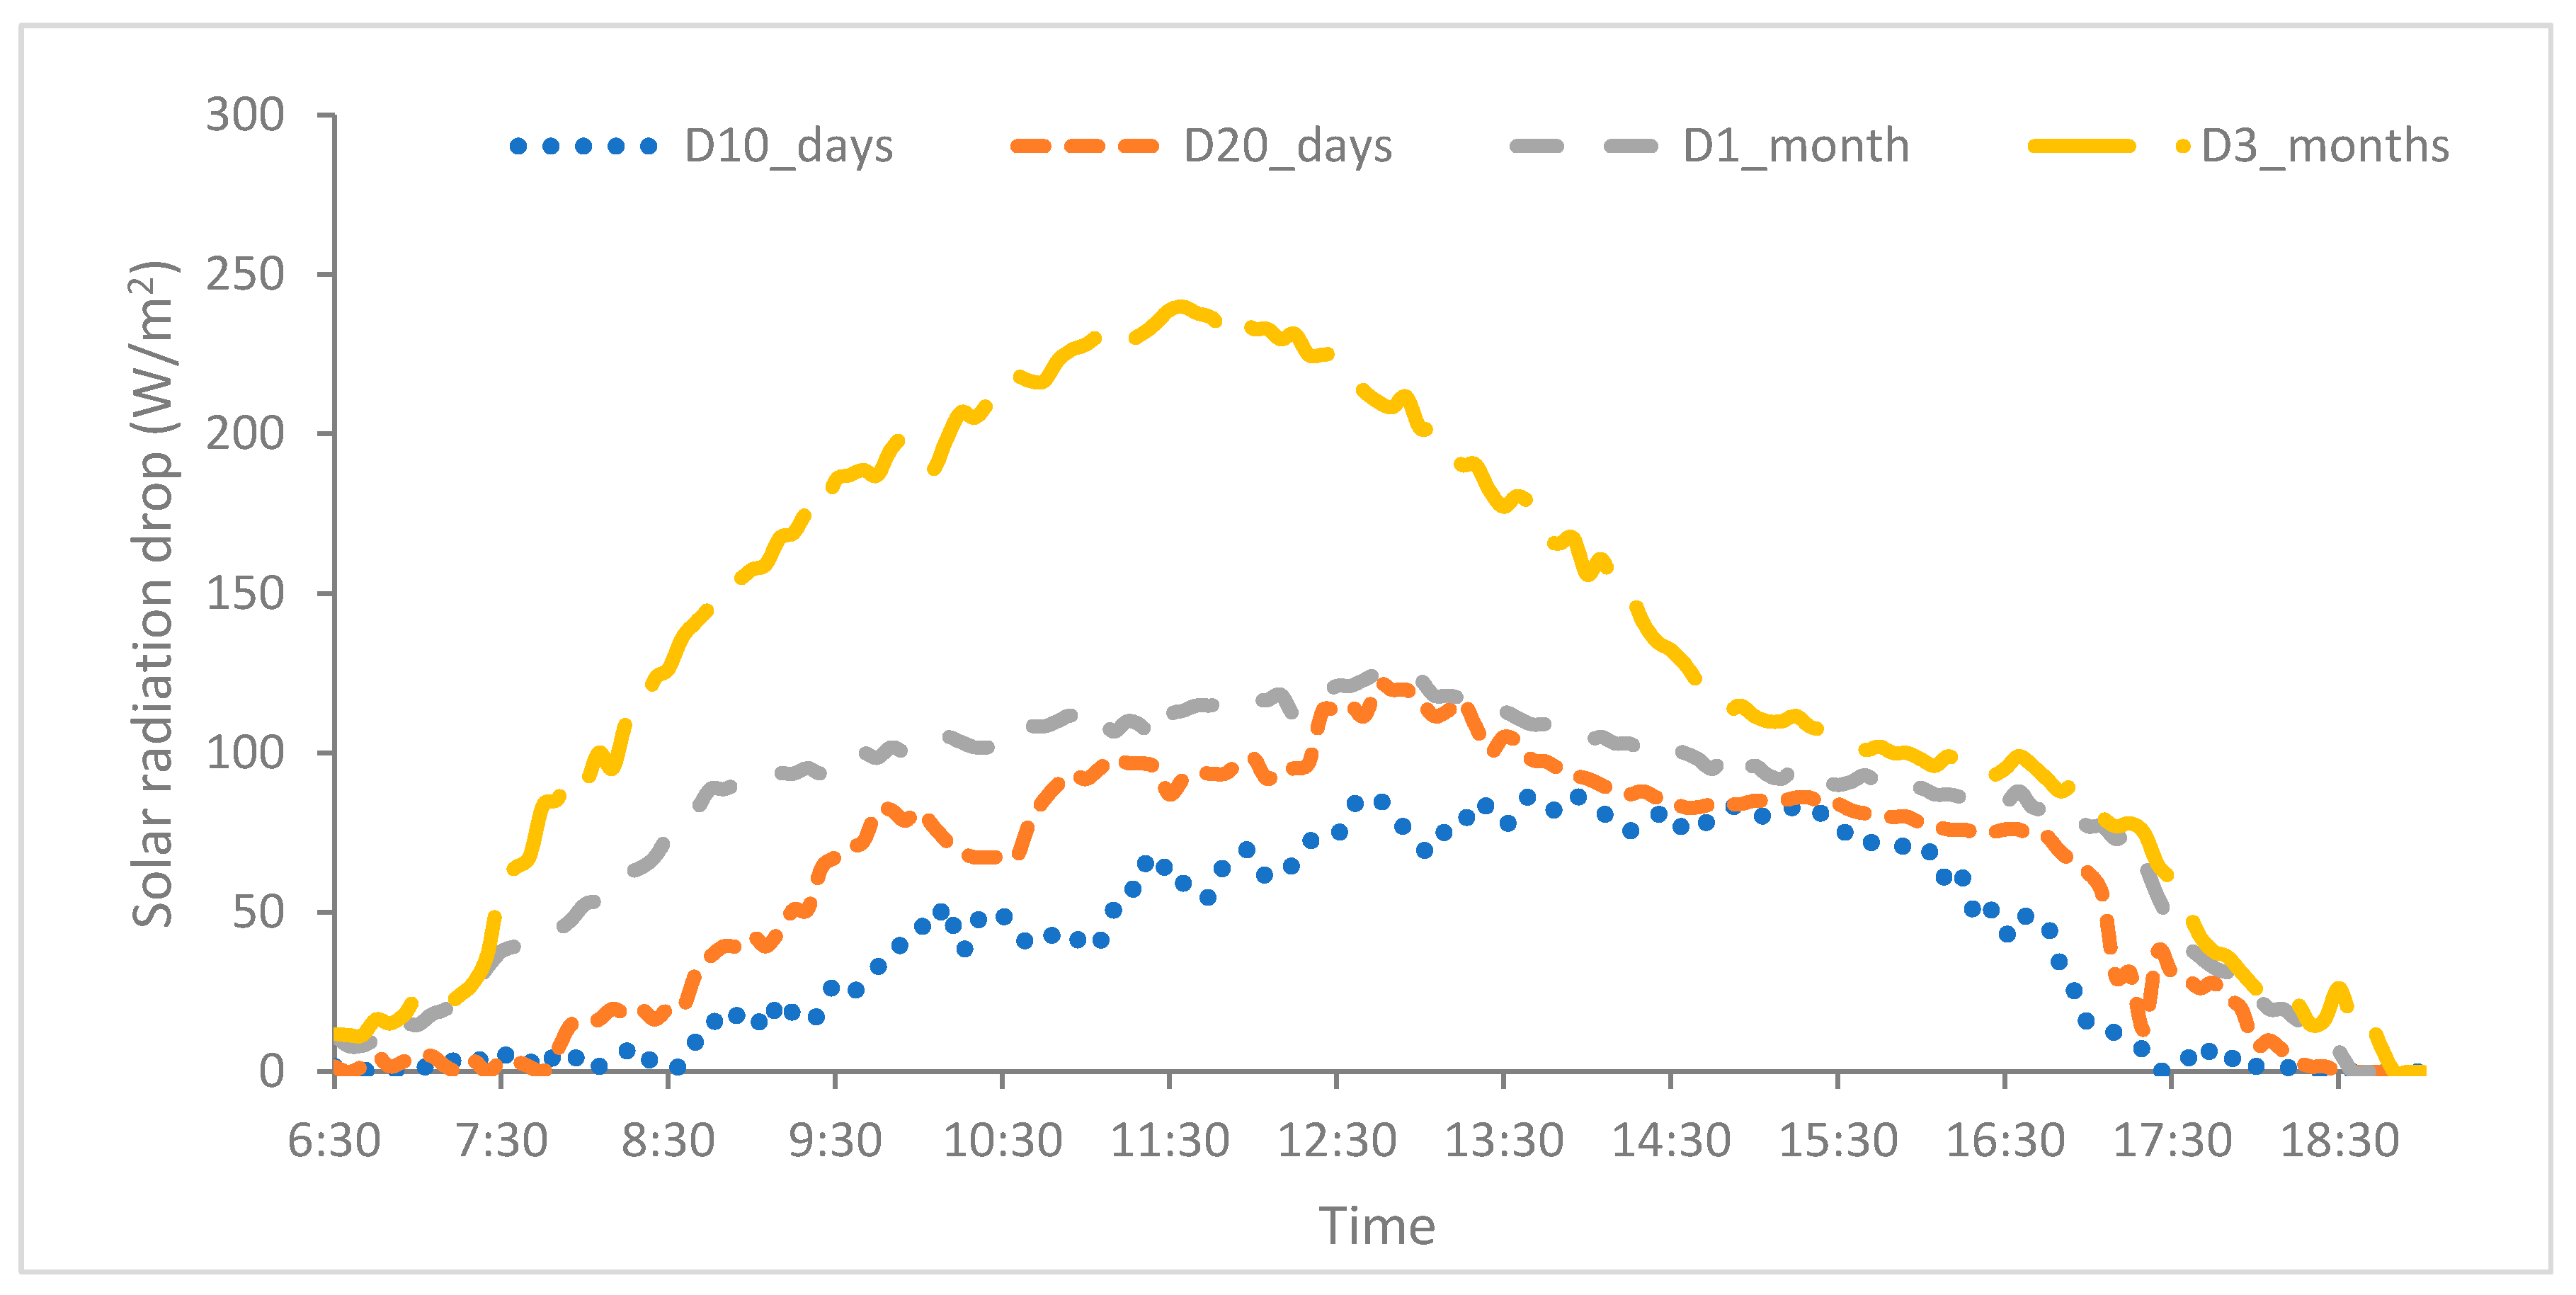
Figure 7 shows the trend for radiation penetration difference between daily clean glass modules and the other glass modules, which were dusty for 10 days, 20 days, 1 month, and 3 months. The glass module, which was dusty for 10 days, had 10% less average radiation penetration as compared to the reference cleaned glass module. The average radiation penetration difference for 20 days, 1 month, and 3 months of dusty glass modules, compared to the reference cleaned glass module are 15%, 19%, and 32%, respectively. A study conducted in Spain shows that the daily radiation losses reached up to 14.8% when the panels were not cleaned for 2 months, and the soiling can cause 20% radiation losses if the panels kept are dusty for about 4 months [35].
Table 2 represents the average radiation drop for the glass modules which were dusted for 10 days, 20 days, 1 month and 3 months, respectively, as compared to the reference cleaned glass module.
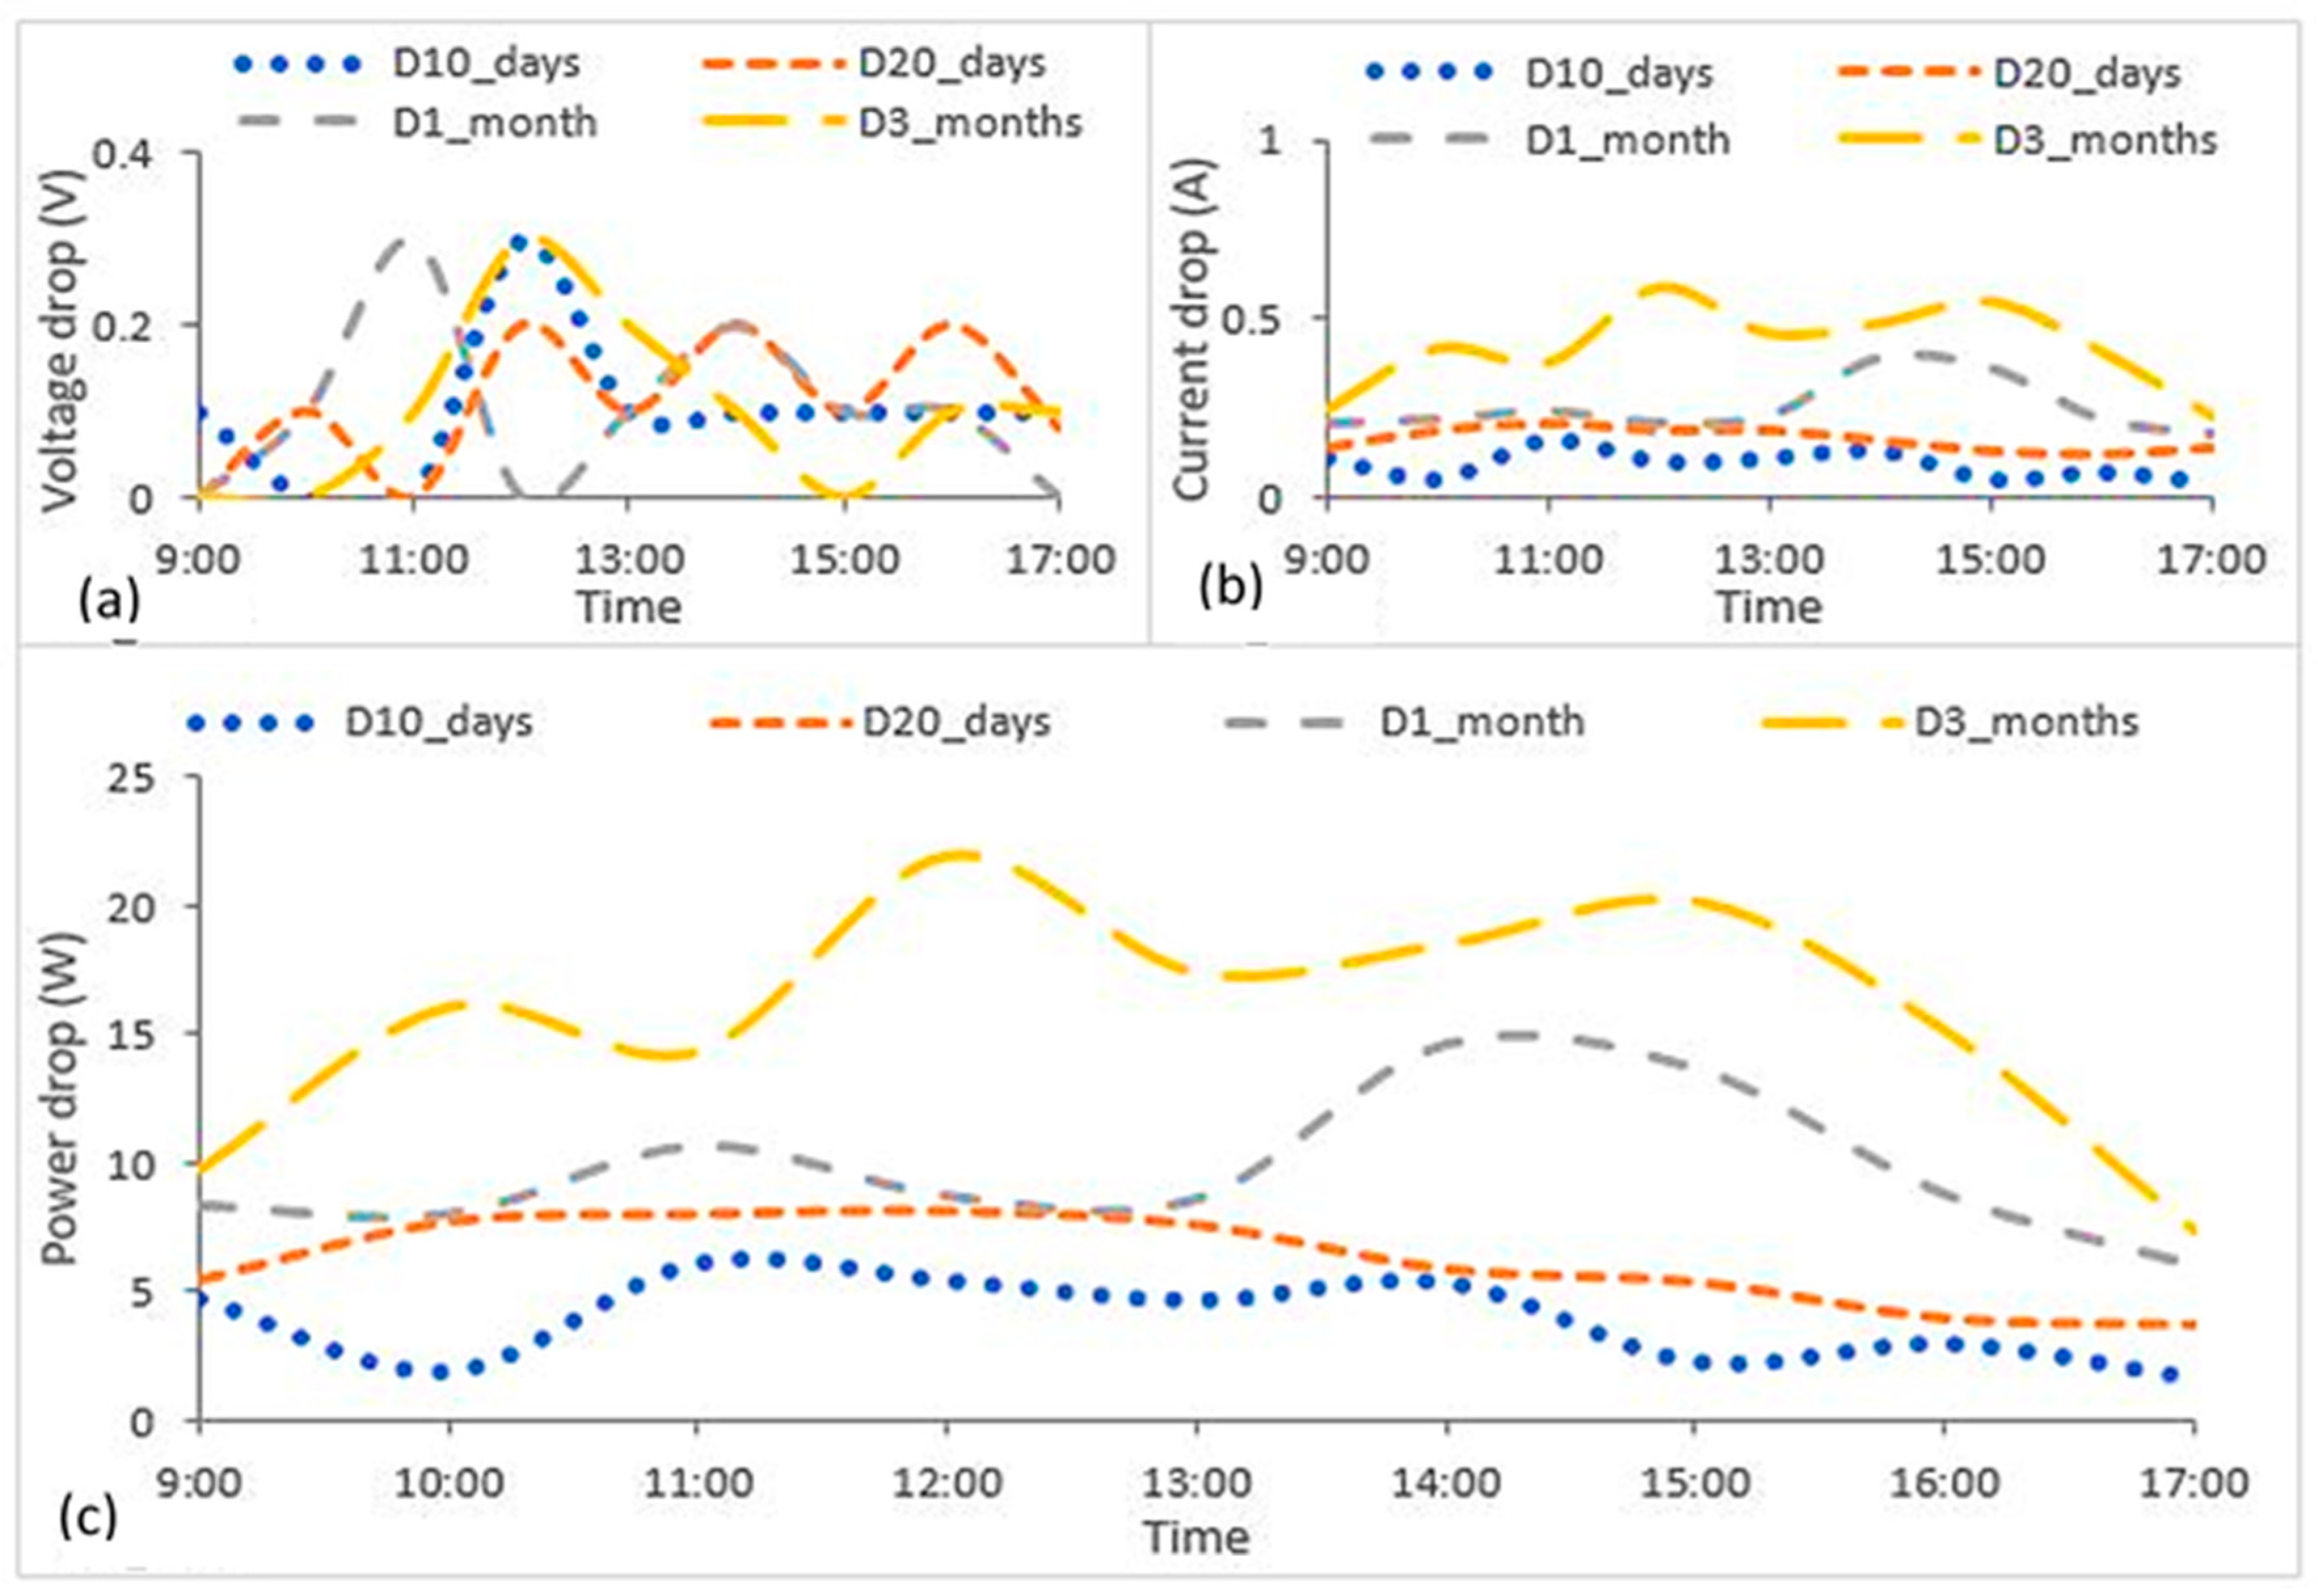
The dust accumulation had a negative effect on the measured current, due to the reduced penetration of solar radiation, which causes a decrease in charge mobility. The measured Isc differences between Cr and D10_days, D20_days, D1_month, and D3_months are shown in Figure 8a. The Isc drop for D10_days, D20_days, D1_month, and D3_months are 2%, 3.9%, 6.8%, and 12.8%, respectively, with respect to CR.
The average measured Voc for D10-days and Cr are 38.2 V and 39.3 V, respectively, which shows a negligible voltage drop. Almost the same amount of average voltage drop was observed for the rest of the cases, which mimic the drop of less than 1%. The measured Voc drop trends for all the cases (D10_days, D20_days, D1_month, and D3_months), with respect to the Cr module are shown in Figure 8b.
The electrical power output of the four PV modules is calculated from the measured electrical parameters (Voc and Isc) by employing the fill factor, as shown in Equation (2):
where P is the PV generated electrical power and the FF is considered to be constant (0.74), deduced by multiplying the rated voltage with rated current over and , as given by Equation (3). The , , , and are listed in the PV datasheet from the factory.
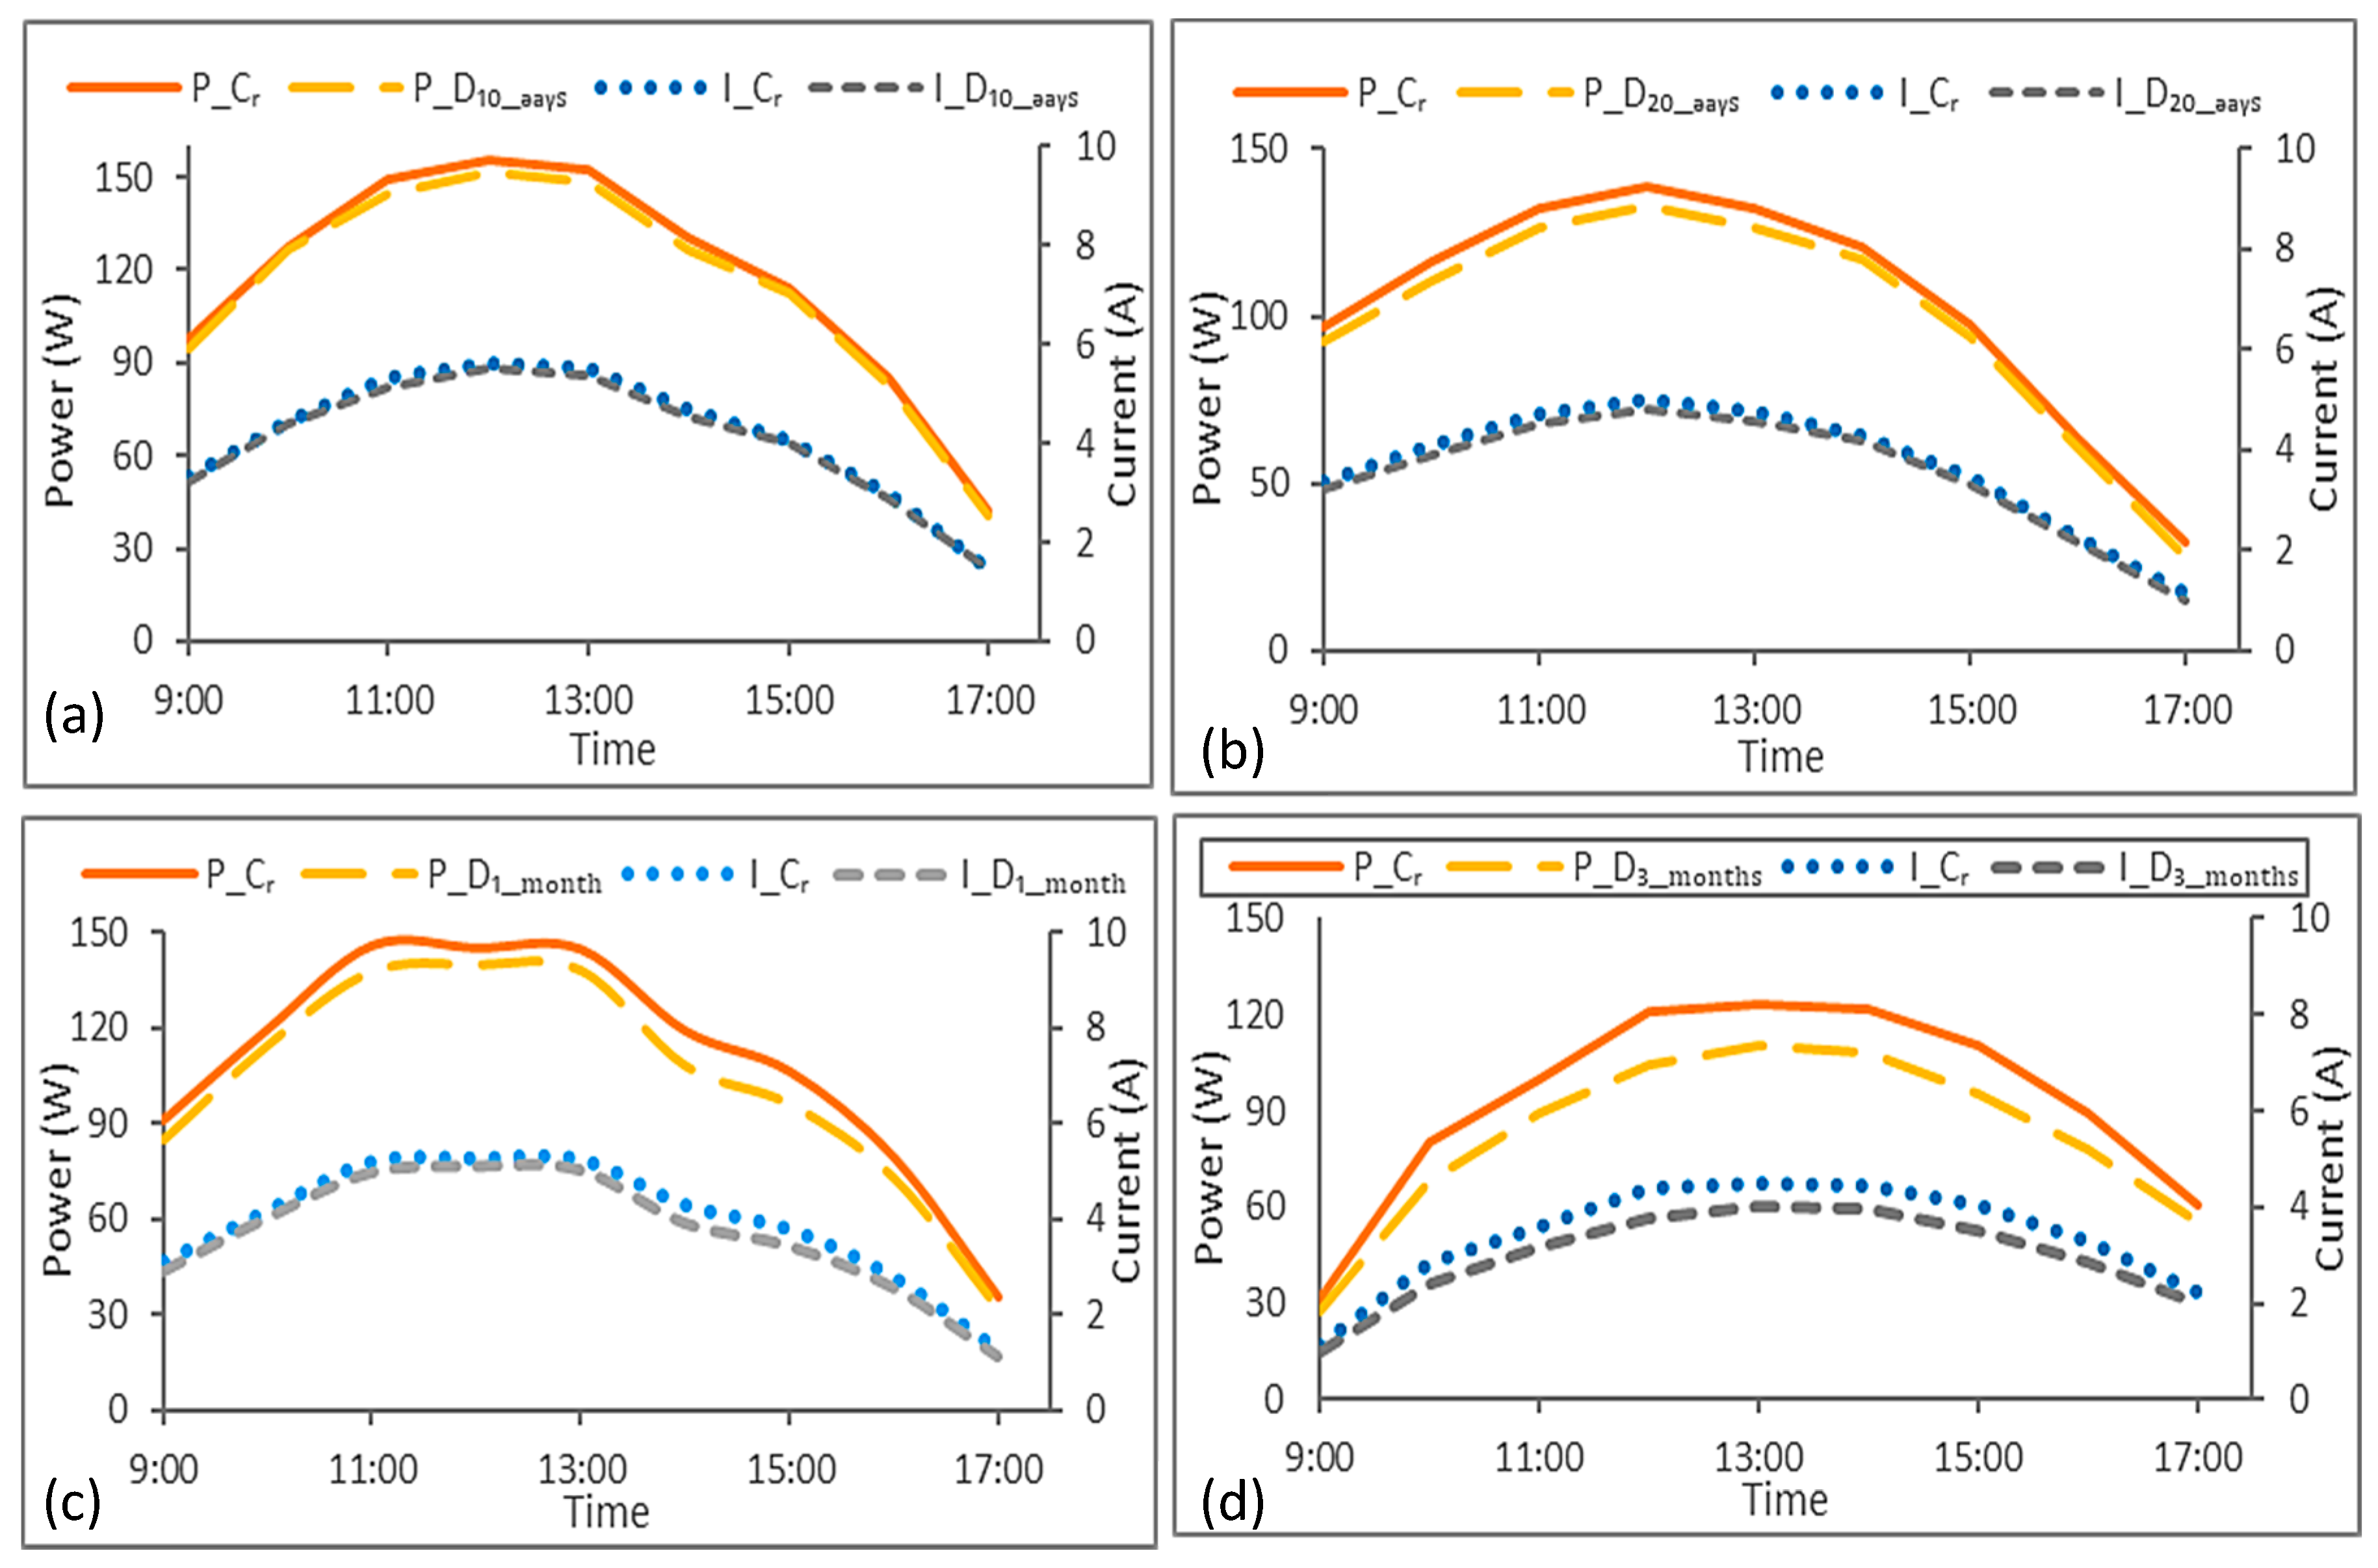
In the UAE, in atmospheric conditions and with no major sandstorms, the PV panel lost around 3% of power without being cleaned for 10 days, against the reference cleaned PV module. Similarly, the power comparison shows a 5% power drop for a 20-day dusty PV panel, compared to the reference cleaned PV panel. The power drop for 1 month and 3-month dusty modules are 7% and 13%, correspondingly, as compared to the reference cleaned PV module. Mohandes et al. [36] reported a 10% power drop in 5 weeks due to dust accumulation at the surface of the PV module, and this power drop could reach more than 50% in 6 months [37]. In another study, the soiling losses increased up to 12.7% within 5 months and the soiling density reached up to 5.44 g/m2 in this duration [38]. Figure 9a–d show the current and power for reference cleaned PV module (Cr), compared to PV panels dusty for 10 days, 20 days, 1 month, and 3 months, respectively. The power drop trends are shown in Figure 8c for D10_days, D20_days, D1_month, and D3_months modules, compared to the Cr module. The power drop increased as the dust adhesion on the surface of the PV module increased with respect to time.
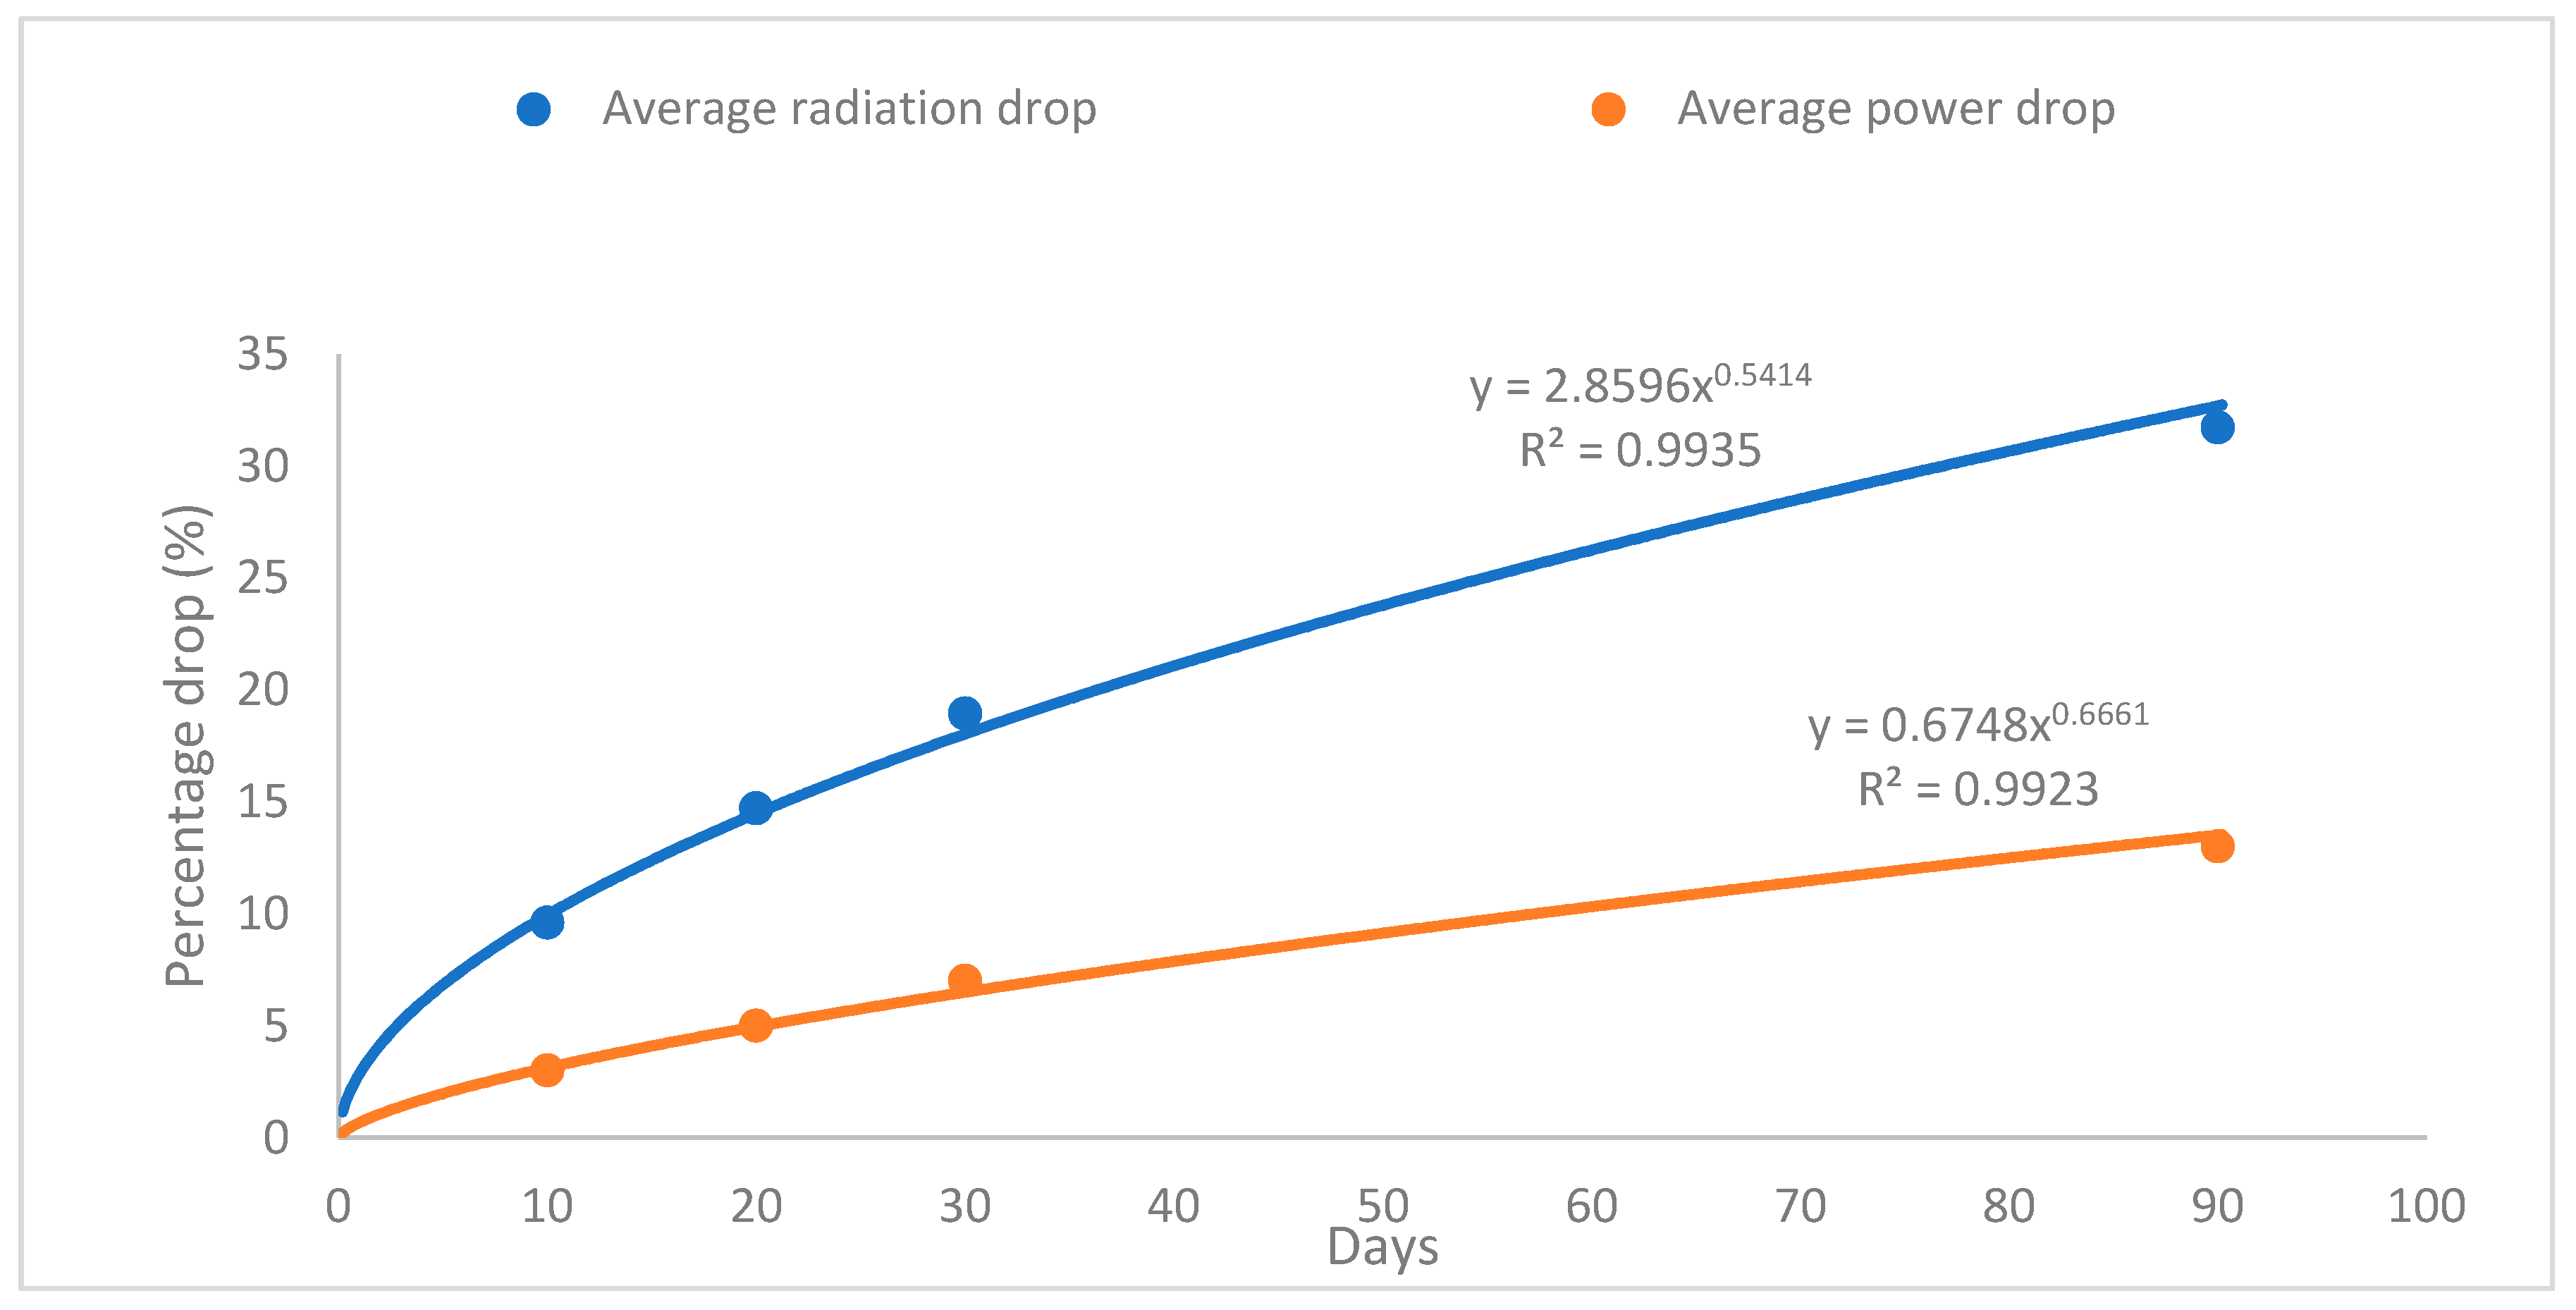
Figure 10 depicts the radiation loss and power loss overtime for all the cases (D10_days, D20_days, D1_month, and D3_months), with respect to the Cr module. As the drop in power and radiation are the discrete values, so to check the overall trend of percentage drop, the curve fitting using the power function was added. The power difference between reference cleaned PV panel and dusty PV panel for the specific period (10 days, 20 days, 1 month, and 3 months), increasing as the radiation penetration decreases between the daily cleaned and dusty glass modules.
As mentioned in the introduction section, in Saudi Arabia, the cleaning cost of a 100 MW PV power plant is about 0.030 USD/m2/cycle and 0.005 USD/m2/cycle for the manual and machinery cleaning, respectively. The UAE has almost identical environmental conditions as in Saudi Arabia, so the cleaning cost of the PV plant will also be the same. To find the optimal time of cleaning, the cleaning cost and the energy saved by cleaning is the main point of consideration. The frequency of cleaning, as well as the surface area of the PV panel, has a definitive role in the total cost of PV cleaning. Employing Al Ain weather data, the power drop for the 1-month dusty modules is 7% as compared to the reference cleaned PV module. This 7% power drop in PV modules can be recovered by cleaning the PV panels using a microfiber cloth wiper. In calculations; the Energy cost per kWh in UAE = 0.090 USD, was considered.
The selected PV module has a total area of 1.3266 m2 with dimensions of 0.99 m × 1.34 m and the cleaning cost associated with this area is 0.0398 USD. If cleaning being processed after 10 days, then the cleaning cost remains higher than the energy wasted cost, as shown in Table 3. However, if PV cleaning is carried out after 15 days, then the PV cleaning cost (0.0398 USD) is less than the energy wasted cost (0.053 USD). Table 3 shows the details of the calculations which led to the conclusion. By relating the cleaning frequency (CF) cycles and net energy wasted cost per panel per year (NEWC/panel/year), the curve fitting estimates the frequency to be 12 days when NEWC/panel/year is zero; however, to accommodate for the experimental errors, a slightly higher energy wasted cost than the cleaning cost was considered. Accordingly, the average of 10 days and 20 days of the experimental studies, i.e., 15 days, was considered as an optimal determined frequency.
Based on the results presented in Table 3, a time interval of 15 days between cleaning PV panels is considered optimal in the UAE context. Since the study is conducted in a specific location during a specific time frame, it possesses an intrinsic limitation of generalizing the results. Additionally, the cost of cleaning and energy substantially varies from place to place based on the method of cleaning and electricity tariff rates; the optimal cleaning time is only indicative at this stage. A more comprehensive study is underway to establish a generalized optimal cleaning time frame for different locations in UAE, in specific, and the desert climate, in general, to be published in the future.
4. Conclusions
Data about the cleaning frequency of PV panels from accumulated dust are limited in the UAE. To measure the optimal cleaning period for PV modules in UAE climate, the effects of dust accumulation on PV panels in terms of radiation losses and power losses were measured over a pre-defined period (10 days, 20 days, 30 days, and 90 days). The pure radiation losses due to dust were measured by comparing the radiation penetration through the glass surface representing PV glazing for dusted and cleaned PV panels. The average radiation penetration differences of 10% and 15% were observed between a daily clean glass module and the modules that kept dusty for 10 days and 20 days, respectively. The drop in radiation substantially increased to 19% and 32% for modules that kept dusty for 30 days and 90 days, respectively.
The power losses caused by the dust are also calculated by comparing the powers produced by the clean PV panels and the dusty PV panels. In the UAE, in atmospheric conditions and with no major sandstorms, results showed that the 10 days dusty PV module caused a 3% drop in electric power. Meanwhile, the PV panel, which kept dusty for 20 days, produced 5% less power. Power losses of 7% and 13% were observed for 30 days and 90 days of dusted panels, respectively. Many researchers proposed cleaning of PV modules between 8 to 35 days based on their geographical location, energy wasted due to soiling, and cost associated with cleaning, as mentioned in the introduction section. An appropriate period of 15 days for PV cleaning has been proposed in this research, by analyzing and quantifying the effect of dust on solar radiation penetration and PV modules performance, in terms of power drop and the cost involved to clean the PV panel per meter square per cycle.
Author Contributions
A.A.: Funding acquisition, project administration, aiding in results analyses and interpretation, and writing review and editing. A.H.: Conceptualization, methodology, and writing review and editing. M.S.L.: Supervision and writing original draft. A.H.S.: Data curation, formal analysis, investigation, writing review and editing. All authors have read and agreed to the published version of the manuscript.
Funding
This research received an external funding from Dubai Electricity and Water Authority (DEWA). The center-based research grant number 21R049.
Acknowledgments
The authors would like to thank the College of Engineering for the facilities to conduct the experiments, and for DEWA for providing the financial support.
Conflicts of Interest
The authors declare no conflict of interest.
Abbreviations
| C | Cleaning |
| CC | Cleaning cost |
| CF | Cleaning frequency |
| Cr | Reference cleaned module |
| D10_days | Dusty PV module for the period of 10 days |
| D20_days | Dusty PV module for the period of 20 days |
| D1_month | Dusty PV module for 1 month |
| D3_months | Dusty PV module for 3 months |
| DAQ | Data acquisition |
| DC | Direct current |
| Eq | Equation |
| EW | Energy wasted |
| EWC | Energy wasted cost |
| ECC | Estimated cleaning cost |
| FF | Fill factor |
| MPP | Maximum Power Point |
| NEWC | Net energy wasted cost |
| NI | National instruments |
| N | North |
| NNE | North-Northeast |
| NNW | North-Northwest |
| PV | Photovoltaic |
Symbols
| A | Area (m2) |
| dc | Dusting coefficient |
| G | Global solar radiation intensity (W/m2) |
| hc | Heat coefficient |
| Isc | Short-circuit current (A) |
| I | Current (A) |
| P | Power (W) |
| Tamb | Ambient temperature (°C) |
| Voc | Open-circuit voltage (V) |
| Vw | Wind speed (m/s) |
| V | Voltage (V) |
| α | Absorptance of clear glass (%) |
References
- Mondal, A.K.; Bansal, K. A brief history and future aspects in automatic cleaning systems for solar photovoltaic panels. Adv. Robot. 2015, 29, 515–524. [Google Scholar]
- Vidyanandan, K.V. An overview of factors affecting the performance of solar PV systems. Energy Scan 2017, 27, 2–8. [Google Scholar]
- Bubnova, O. Photovoltaics: Self-cleaning solar cells. Nat. Nanotechnol. 2016, 1. [Google Scholar] [CrossRef]
- Tian, W.; Wang, Y.; Ren, J.; Zhu, L. Effect of urban climate on building integrated photovoltaics performance. Energy Convers. Manag. 2007, 48, 1–8. [Google Scholar]
- El-Shobokshy, M.S.; Hussein, F.M. Degradation of photovoltaic cell performance due to dust deposition on to its surface. Renew. Energy 1993, 3, 585–590. [Google Scholar]
- He, G.; Zhou, C.; Li, Z. Review of self-cleaning method for solar cell array. Procedia Eng. 2011, 16, 640–645. [Google Scholar]
- Maghami, M.R.; Hizam, H.; Gomes, C.; Radzi, M.A.; Rezadad, M.I.; Hajighorbani, S. Power loss due to soiling on solar panel: A review. Renew. Sustain. Energy Rev. 2016, 59, 1307–1316. [Google Scholar]
- Cordero, R.R.; Damiani, A.; Laroze, D.; MacDonell, S.; Jorquera, J.; Sepúlveda, E.; Feron, S.; Llanillo, P.; Labbe, F.; Carrasco, J.; et al. Effects of soiling on photovoltaic (PV) modules in the Atacama Desert. Sci. Rep. 2018, 8, 1–14. [Google Scholar]
- Ghosh, A. Soiling Losses: A Barrier for India’s Energy Security Dependency from Photovoltaic Power. Challenges 2020, 11, 9. [Google Scholar]
- Mani, M.; Pillai, R. Impact of dust on solar photovoltaic (PV) performance: Research status, challenges and recommendations. Renew. Sustain. Energy Rev. 2010, 14, 3124–3131. [Google Scholar]
- Ahmed, Z.; Kazem, H.A.; Sopian, K. Effect of dust on photovoltaic performance: Review and research status. Latest Trends Renew. Energy Environ. Inform. 2013, 193–199. [Google Scholar] [CrossRef]
- Hegazy, A. Effect of dust accumulation on solar transmittance through glass covers of plate-type collectors. Renew. Energy 2001, 22, 525–540. [Google Scholar]
- Abu-Naser, M. Solar panels cleaning frequency for maximum financial profit. Open J. Energy Effic. 2017, 6, 80–86. [Google Scholar]
- Mani, F.; Pulipaka, S.; Kumar, R. Characterization of power losses of a soiled PV panel in Shekhawati region of India. Sol. Energy 2016, 131, 96–106. [Google Scholar]
- Kaldellis, J.; Kapsali, M. Simulating the dust effect on the energy performance of photovoltaic generators based on experimental measurements. Energy 2011, 36, 5154–5161. [Google Scholar]
- Alquthami, T.; Menoufi, K. Soiling of photovoltaic modules: Comparing between two distinct locations within the framework of developing the photovoltaic soiling index (PVSI). Sustainability 2019, 11, 4697. [Google Scholar]
- Yoon, Y.-H.; Kim, J.-M. Photovoltaic system application performance in extreme environments like desert conditions. J. Int. Counc. Electr. Eng. 2016, 6, 214–223. [Google Scholar]
- Faifer, M.; Lazzaroni, M.; Toscani, S. Dust effects on the PV plant efficiency: A new monitoring strategy. In Proceedings of the 20th IMEKO TC4 International Symposium and 18th International Workshop on ADC Modelling and Testing, Benevento, Italy, 15–17 September 2014. [Google Scholar]
- Pavan, A.M.; Mellit, A.; De Pieri, D. The effect of soiling on energy production for large-scale photovoltaic plants. Sol. Energy 2011, 85, 1128–1136. [Google Scholar]
- Jones, R.K.; Baras, A.; Al Saeeri, A.; Al Qahtani, A.; Al Amoudi, A.O.; Al Shaya, Y.; Alodan, M.; Al-Hsaien, S.A. Optimized cleaning cost and schedule based on observed soiling conditions for photovoltaic plants in central Saudi Arabia. IEEE J. Photovolt. 2016, 6, 730–738. [Google Scholar]
- Al-Housani, M.; Bicer, Y.; Koç, M. Assessment of various dry photovoltaic cleaning techniques and frequencies on the power output of cdte-type modules in dusty environments. Sustainability 2019, 11, 2850. [Google Scholar]
- Hammad, B.; Al–Abed, M.; Al–Ghandoor, A.; Al–Sardeah, A.; Al–Bashir, A. Modeling and analysis of dust and temperature effects on photovoltaic systems’ performance and optimal cleaning frequency: Jordan case study. Renew. Sustain. Energy Rev. 2018, 82, 2218–2234. [Google Scholar]
- Mohamed, M.; Attia, M.A.; Asim, A.M.; Abdelaziz, A.Y.; Kanwar, N. Optimization of cleaning frequency and dust accumulation effect on photovoltaic panels. J. Interdiscip. Math. 2020, 23, 53–68. [Google Scholar]
- Chiteka, K.; Arora, R.; Sridhara, S.; Enweremadu, C.C. Cleaning cycle optimisation in non-tracking ground mounted solar PV systems using Particle Swarm Optimisation. Int. J. Simul. Multidiscip. Des. Optim. 2020, 11, 9. [Google Scholar]
- Apogee Instrument. SP-110-SS: Self-Powered Pyranometer. Available online: https://www.apogeeinstruments.com/sp-110-ss-self-powered-pyranometer/ (accessed on 1 March 2019).
- National Instruments. cDAQ-9178 CompactDAQ Chassis. Available online: http://www.ni.com/en-lb/support/model.cdaq-9178.html (accessed on 28 February 2019).
- National Instrument. C Series Current Input Module NI-9227. Available online: http://www.ni.com/en-lb/support/model.ni-9227.html (accessed on 28 February 2019).
- National Instruments. C Series Voltage Input Module NI-9221. Available online: http://www.ni.com/en-lb/support/model.ni-9221.html (accessed on 28 February 2019).
- National Instruments. C Series Temperature Input Module NI-9213. Available online: http://www.ni.com/en-lb/support/model.ni-9213.html (accessed on 28 February 2019).
- RS components. Thermocouple Wire Type K, −75 → +250 °C 1 Core Unscreened PTFE Sheath 25 m. Available online: https://uk.rs-online.com/web/p/products/3630389/ (accessed on 3 March 2019).
- Davis Instruments. Davis Instruments 6152 Vantage Pro 2 Wireless Weather Station. Available online: http://www.davis.com/Product/Davis_Instruments_6152_Vantage_Pro_2_Wireless_Weather_Station/DO-86403-03 (accessed on 1 March 2019).
- Razak, A.; Irwan, Y.; Leow, W.; Irwanto, M.; Ibrahim, S.; Zhafarina, M. Investigation of the effect temperature on photovoltaic (PV) panel output performance. Int. J. Adv. Sci. Eng. Inf. Technol. 2016, 6, 682. [Google Scholar]
- Dwivedi, P.; Sudhakar, K.; Soni, A.; Solomin, E.; Kirpichnikova, I. Advanced cooling techniques of P.V. modules: A state of art. Case Stud. Therm. Eng. 2020, 21, 100674. [Google Scholar]
- Hasan, A.; Alnoman, H.; Hasan, A. Energy efficiency enhancement of photovoltaics by phase change materials through thermal energy recovery. Energies 2016, 9, 782. [Google Scholar]
- Zorrilla-Casanova, J.; Philiougine, M.; Carretero, J.; Bernaola, P.; Carpena, P.; Mora-López, L.; Sidrach-de-Cardona, M. Analysis of dust losses in photovoltaic modules. In Proceedings of the World Renewable Energy Congress-Sweden, Linköping, Sweden, 8–13 May 2011; No. Linköping University Electronic Press, 2011. [Google Scholar]
- Mohandes, B.M.A.; El-Chaar, L.; Lamont, L.A. Application study of 500 W photovoltaic (PV) system in the UAE. Appl. Sol. Energy 2009, 45, 242–247. [Google Scholar]
- Adinoyi, M.J.; Said, S.A. Effect of dust accumulation on the power outputs of solar photovoltaic modules. Renew. Energy 2013, 60, 633–636. [Google Scholar]
- Hachicha, A.A.; Al-Sawafta, I.; Said, Z. Impact of dust on the performance of solar photovoltaic (PV) systems under United Arab Emirates weather conditions. Renew. Energy 2019, 141, 287–297. [Google Scholar]
Figure 1.
Photovoltaic modules array installed at UAE University, Falaj Hazza Campus.

Figure 2.
Schematic diagram to measure the power and radiation losses due to dust to determine the optimal cleaning frequency of Photovoltaic (PV) modules.
Figure 2.
Schematic diagram to measure the power and radiation losses due to dust to determine the optimal cleaning frequency of Photovoltaic (PV) modules.

Figure 3.
The wind speed for the typical day after the 10th day, 20th day, 30th day, and 3rd month of the experiment.
Figure 3.
The wind speed for the typical day after the 10th day, 20th day, 30th day, and 3rd month of the experiment.

Figure 4.
The ambient temperature for the typical day after the 10th day, 20th day, 30th day, and 3rd month of the experiment.
Figure 4.
The ambient temperature for the typical day after the 10th day, 20th day, 30th day, and 3rd month of the experiment.

Figure 5.
The relative humidity for the typical day after the 10th day, 20th day, 30th day, and 3rd month of the experiment.
Figure 5.
The relative humidity for the typical day after the 10th day, 20th day, 30th day, and 3rd month of the experiment.

Figure 6.
The solar radiation for the typical day after 10th day, 20th day, 30th day, and 3rd month of the experiment.
Figure 6.
The solar radiation for the typical day after 10th day, 20th day, 30th day, and 3rd month of the experiment.

Figure 7.
The radiation penetration difference between reference cleaned glass module and for 10-day, 20-day, 1-month, and 3-month dusty glass modules.
Figure 7.
The radiation penetration difference between reference cleaned glass module and for 10-day, 20-day, 1-month, and 3-month dusty glass modules.

Figure 8.
(a) Average voltage drop (b) Average current drop (c) Average power drop.

Figure 9.
(a) Current and power for the Cr PV panel compared to D10_days. (b) Current and power for the Cr PV panel compared to D20_days. (c) Current and power for the Cr PV panel compared to D1_month. (d) Current and power for the Cr PV panel compared to D3_month.
Figure 9.
(a) Current and power for the Cr PV panel compared to D10_days. (b) Current and power for the Cr PV panel compared to D20_days. (c) Current and power for the Cr PV panel compared to D1_month. (d) Current and power for the Cr PV panel compared to D3_month.

Figure 10.
Average power and radiation drop for D10_days, D20_days, D1_month, and D3_months modules, compared to the reference cleaned module (Cr).
Figure 10.
Average power and radiation drop for D10_days, D20_days, D1_month, and D3_months modules, compared to the reference cleaned module (Cr).


Table 1.
The measurement uncertainties for all used devices.
| Parameter | Device | Model | Range | Accuracy |
|---|---|---|---|---|
| Solar radiation | Apogee Pyranometer [25] | SP–110 | 0–400 mV 0–2000 W/m2 | ±1% |
| Data acquisition | NI-Compact DAQ [26] | 9178 | - | ±0.02% |
| Current | NI-Analogue module [27] | 9227 | 5 Arms–20 A | ±0.01% |
| Voltage | NI-Analogue module [28] | 9221 | −60–60 V | ±0.25% |
| Temperature | Ni-Analogue module [29] | 9213 | −75–250 °C | ±1% |
| Thermocouple K-type [30] | 363-0389 | −75–250 °C | ±1.5 (°C) | |
| Ambient temperature | Davis vantage pro2 weather station [31] | 6152 | −40–65 °C | ±0.5 °C |
| Wind speed | Davis vantage pro2 weather station [31] | 6152 | 1–89 ms−1 | ±5% |
Table 2.
Average percentage radiation penetration drop between reference cleaned glass module and 10 days, 20 days, 1 month, and 3 months dusty glass modules.
Table 2.
Average percentage radiation penetration drop between reference cleaned glass module and 10 days, 20 days, 1 month, and 3 months dusty glass modules.
| Average Radiation Drop (%) | ||
|---|---|---|
| D10_days | 10 | |
| D20_days | 15 | |
| D1_month | 19 | |
| D3_month | 32 | |
Table 3.
Cleaning frequencies and their associated cleaning and energy losses cost.
| a* CF (Days) | b* NO. of CC | c* EW (%) | d* EWC/Panel | f* EWC/Panel/Year | ECC/Panel/Cycle | e* ECC/Panel/Year | g* NEWC/Panel/Year |
|---|---|---|---|---|---|---|---|
| USD | |||||||
| 10 | 36 | 3 | 0.030 | 1.080 | 0.0398 | 1.4328 | −0.3528 |
| 20 | 18 | 5 | 0.080 | 1.440 | 0.7164 | 0.7236 | |
| 30 | 12 | 7 | 0.163 | 1.956 | 0.4776 | 1.4784 | |
| 90 | 4 | 13 | 0.680 | 2.720 | 0.1592 | 2.5608 | |
a* First column based on current experimental studies. b* Second column obtained by dividing 360 days (i.e., year) over frequency days. c* Third column is percentage power drop for different frequencies. d* EWC = EW in KWh * EC per kWh. e* ECC/panel/year = NO. of CC/year * ECC/panel/cycle. f* EWC/panel/year = EWC/panel * NO. of CC/year. g* NEWC/panel/year = EWC/panel/year—ECC/panel/year.
Publisher’s Note: MDPI stays neutral with regard to jurisdictional claims in published maps and institutional affiliations. |
© 2020 by the authors. Licensee MDPI, Basel, Switzerland. This article is an open access article distributed under the terms and conditions of the Creative Commons Attribution (CC BY) license (http://creativecommons.org/licenses/by/4.0/).
Share and Cite
MDPI and ACS Style
Shah, A.H.; Hassan, A.; Laghari, M.S.; Alraeesi, A. The Influence of Cleaning Frequency of Photovoltaic Modules on Power Losses in the Desert Climate. Sustainability 2020, 12, 9750. https://doi.org/10.3390/su12229750
AMA Style
Shah AH, Hassan A, Laghari MS, Alraeesi A. The Influence of Cleaning Frequency of Photovoltaic Modules on Power Losses in the Desert Climate. Sustainability. 2020; 12(22):9750. https://doi.org/10.3390/su12229750
Chicago/Turabian StyleShah, Ali Hasan, Ahmed Hassan, Mohammad Shakeel Laghari, and Abdulrahman Alraeesi. 2020. "The Influence of Cleaning Frequency of Photovoltaic Modules on Power Losses in the Desert Climate" Sustainability 12, no. 22: 9750. https://doi.org/10.3390/su12229750
Note that from the first issue of 2016, this journal uses article numbers instead of page numbers. See further details here.