Smallholders’ Preferences for Improved Quinoa Varieties in the Peruvian Andes

1
Division of Bioeconomics, Department of Earth and Environmental Sciences, KU Leuven, Celestijnenlaan 200E, 3001 Leuven, Belgium
2
Departamento Académico de Economía y Planificación, Universidad Nacional Agraria La Molina, Av. La Molina s/n, La Molina, 15024 Lima, Perú
*
Author to whom correspondence should be addressed.
Sustainability 2018, 10(10), 3735; https://doi.org/10.3390/su10103735
Submission received: 30 August 2018
/
Revised: 8 October 2018
/
Accepted: 11 October 2018
/
Published: 17 October 2018
Abstract
:Due to an increase in international demand, quinoa production has boomed tremendously in the Andes since the early 2010s. This has led to significant investments into developing improved varieties for large-scale agribusinesses, but breeding programs are not tailored to the needs of smallholders. In this paper, we study farmers’ preferences and willingness to pay for improved quinoa varieties in the Junín region in Peru. We use data from a choice experiment among 458 smallholders and estimate generalized multinomial logit models to control for preference and scale heterogeneity. We find that farmers generally prefer improved varieties over traditional varieties, with mildew-resistance as the most important crop trait. In general, farmers prefer varieties that are characterized by larger grain sizes, higher yield levels, lower levels of saponin, and a reduced maturation period. Yet, food-insecure farmers are found to be indifferent to early maturity and a larger grain size, which can be explained by a lower degree of commercialization among these farmers. Our results imply that developing mildew-tolerant and higher-yielding varieties with a medium to low saponin content is a priority if investments in quinoa technologies are to benefit small-scale and food insecure farmers in the Andean highlands of Peru.
1. Introduction
Traditionally, quinoa is one of the oldest crops being cultivated in the Andes region for over 7000 years [1,2]. It has been recognized for its high nutritional value by the pre-Inca cultures [2] and is one of the most important Andean farmer’s staple crop [3]. Recently, quinoa has been widely promoted as a highly nutritious food outside the Andes, and demand from high-income countries is rapidly increasing [4,5]. As a consequence, production of quinoa has boomed tremendously in the Andes region since 2010, with Peru as main producing and exporting country. While quinoa is traditionally cultivated as a common staple and subsistence crop by smallholders in the Andes region, it is increasingly produced by large-scale farms in the Peruvian coastal areas as a high-value export crop [6]. In addition, the number of countries growing quinoa outside the Andean region, like the United States of America, United Kingdom and Denmark among others, has risen sharply since 2014 but their production volumes are very small compared to Andean production [7,8,9]. This transition has been supported by recent investments into the development of improved quinoa varieties, focusing on higher yields, a reduced maturation period and a sweeter taste [9].
It is unlikely that the current developments towards improved quinoa varieties will benefit small-scale producers and improve local food security in Andean regions. Investments are mainly targeted to the export sector and large-scale producers in coastal areas. Smallholders face different constraints to crop production and marketing than large-scale producers and might have different preferences for certain traits of improved quinoa varieties. For example, taste preference in Andean regions where quinoa belongs to the traditional diet may differ from taste preferences in international markets where quinoa has become healthy food type that has the highest content of protein compared with conventional grains like wheat, corn and rice [10] and that contains all essential amino acids [11], is gluten-free [12,13] and easy to digest [14]. In addition, one of the major impediments to reaching high productivity in the Andes region is quinoa’s susceptibility to mildew, a plant disease caused by fungi [4,15]. This pathogen causes the development of chlorotic and necrotic spots in the leaves and premature leaf fall, leading to yield reductions of up to 99% in susceptible cultivars [9,16]. Given that smallholders in the Andes region still cultivate almost 90% of the total area allocated to quinoa production in Peru, the development of mildew-resistant varieties might a priority for researchers and policy makers.
In order to increase adoption rates of improved varieties among quinoa producers, it is crucial to take into account their specific requirements and needs ex-ante, before new varieties are developed and introduced [17]. From a policy making perspective, it is important to know how much farmers are willing to pay for new varieties and to evaluate the most important crop traits in order to optimize investments in breeding programs. In this paper, we study farmers’ preferences and willingness to pay for improved quinoa varieties in the Junín region in Peru, using a choice experiment among 458 Andean smallholders. A choice experiment is a stated preference method to assess which specific traits of a certain hypothetical scenario (in this case improved quinoa varieties) are valued most. Previous research has used choice experiments to investigate farmers’ preferences and willingness to pay for improved seed varieties of different staple food crops, such as maize in Zimbabwe [18] and Mexico [19], pearl millet in India [20], beans in Burundi [21], rice in India [22], and sorghum and teff in Ethiopia [23]. These studies show that farmers’ preferences for improved staple crop seeds are heterogeneous and depend on the local context, and demonstrate the usefulness of using choice experimental research to provide ex-ante insights on farmers’ preferences for agricultural technologies. To the best of our knowledge, no studies have analyzed the preferences of Andean quinoa farmers for improved quinoa seeds. This paper thereby makes a relevant contribution as quinoa is an increasingly important crop in local as well as international markets. For smallholder Andean quinoa farmers to benefit fully from lucrative market opportunities and ongoing investments in quinoa research and technology development, it is imperative to understand their preferences. In addition, we use an approach that allows us to analyze preference heterogeneity as well as scale heterogeneity while most existing choice experiment studies do not distinguish between these two sources of heterogeneity.
The rest of the paper is structured as follows. The second section provides background information on quinoa production and the development of improved varieties in Peru. The third section describes the data and methodology while the fourth section presents the results. In the fifth section we discuss the results and the sixth section concludes.
2. Background
2.1. Export and Production of Quinoa
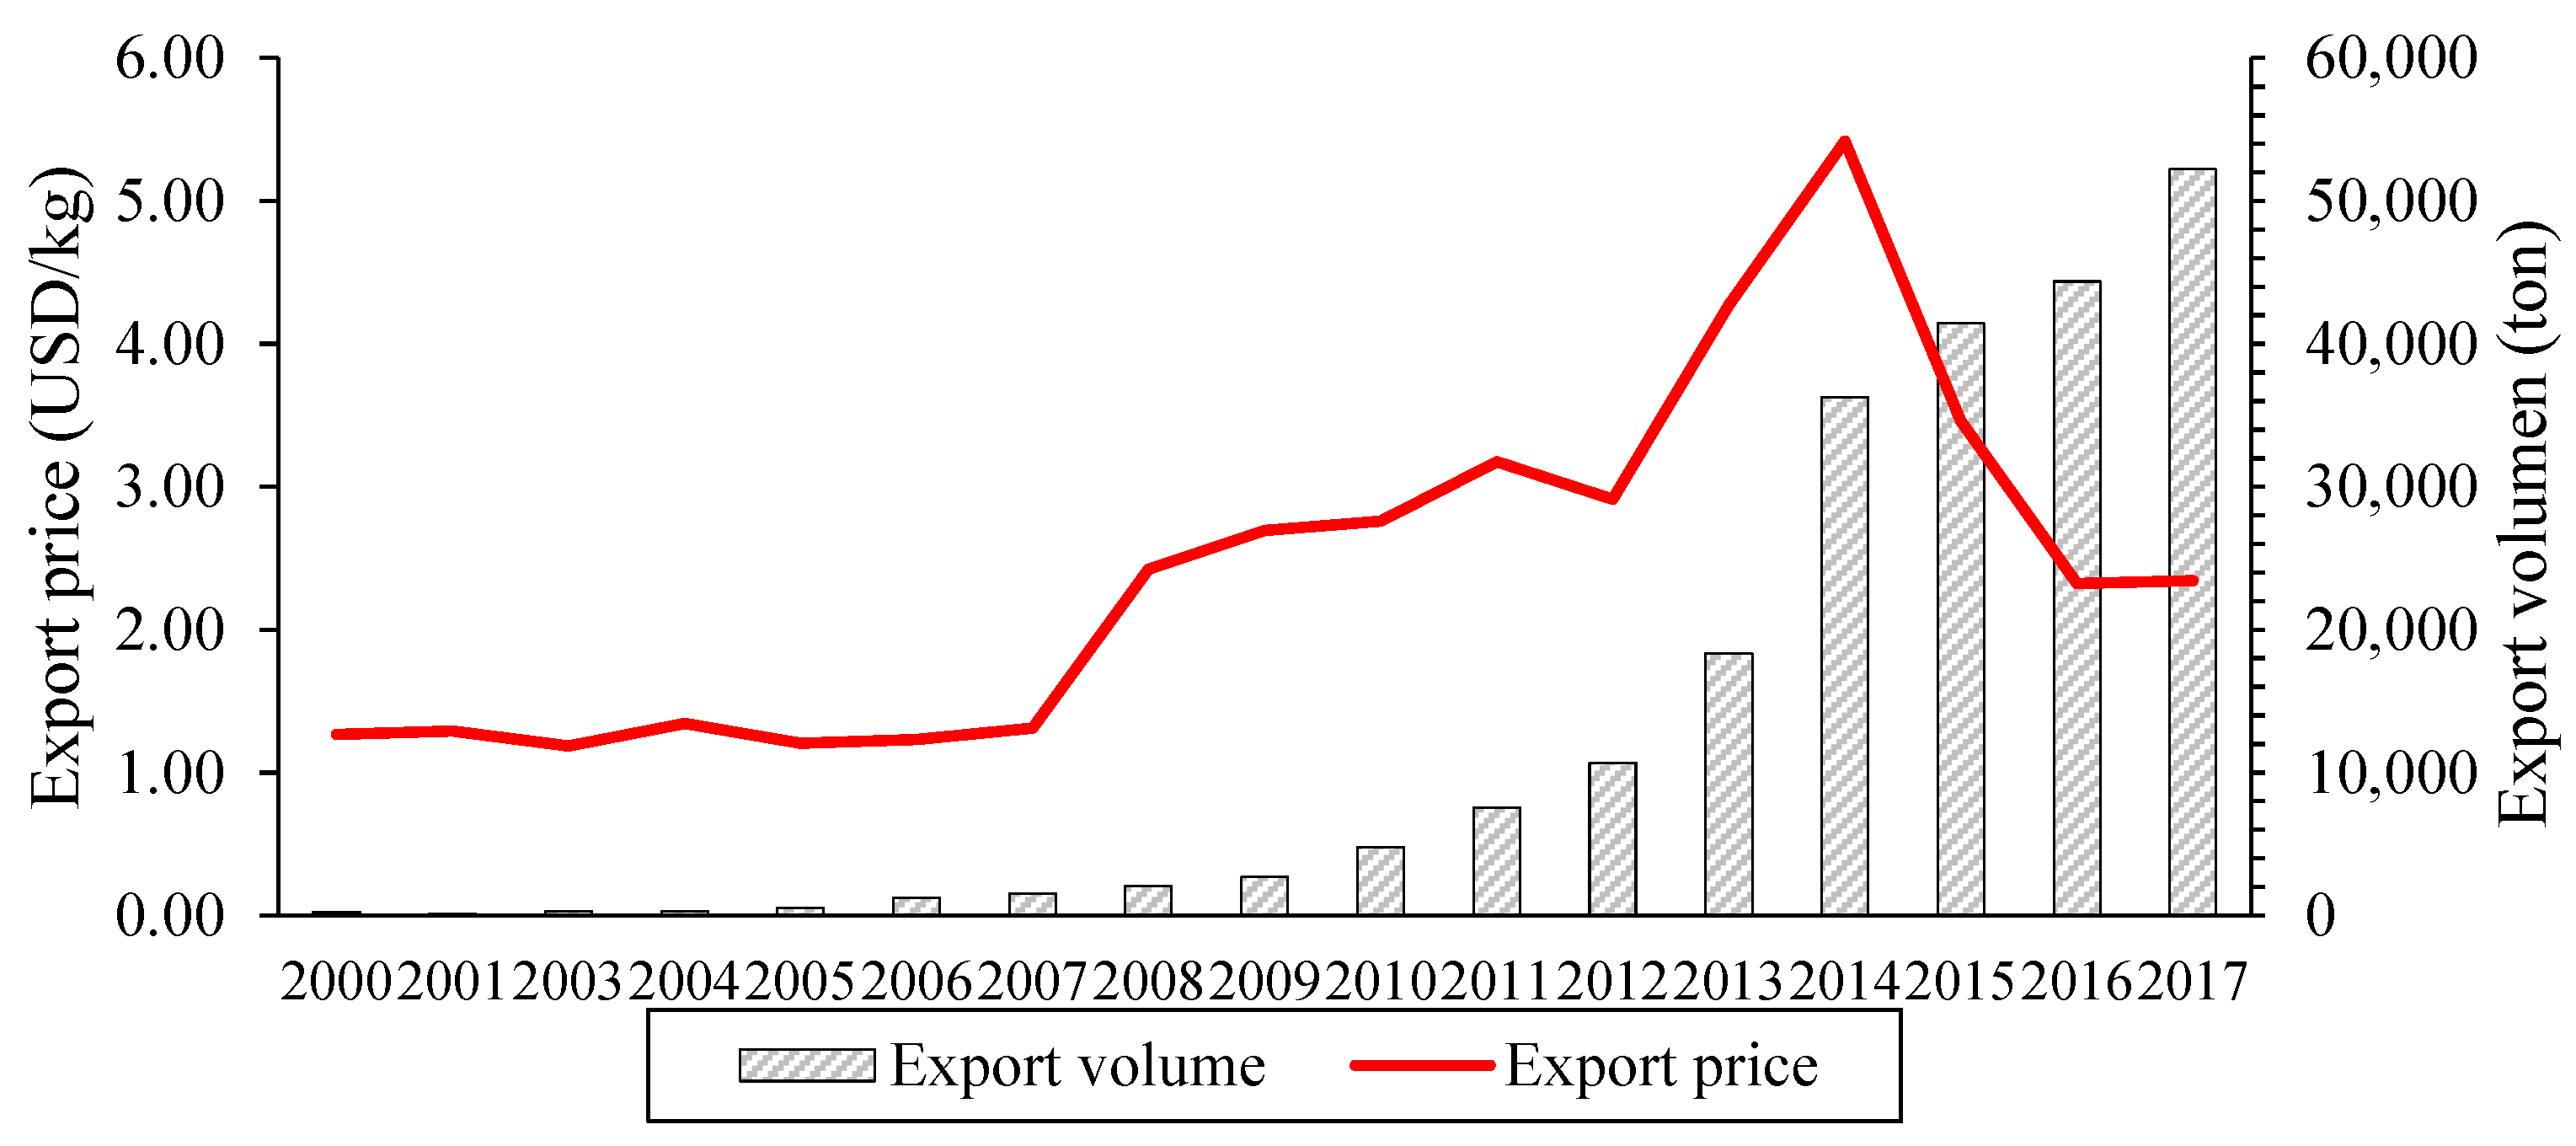
The international demand for quinoa as a highly nutritious food has increased rapidly since 2007 [24]. Peru has consolidated its position as market leader in quinoa exports, bypassing Bolivia to be the largest quinoa exporter since 2014. The export volume in Peru increased with an average annual growth rate of 37% during the period 2000-2017 (Figure 1). At the same time, the export price in Peru increased considerably, from 1.27 USD/kg on average in 2000 to 2.34 USD/kg in 2017, corresponding to an average annual price increase of 3.69%. The sharpest increase is observed between 2008 and 2014 when the price jumped from 2.42 to 5.42 USD/kg. After 2014, the price decreased again to a similar level as in 2008.
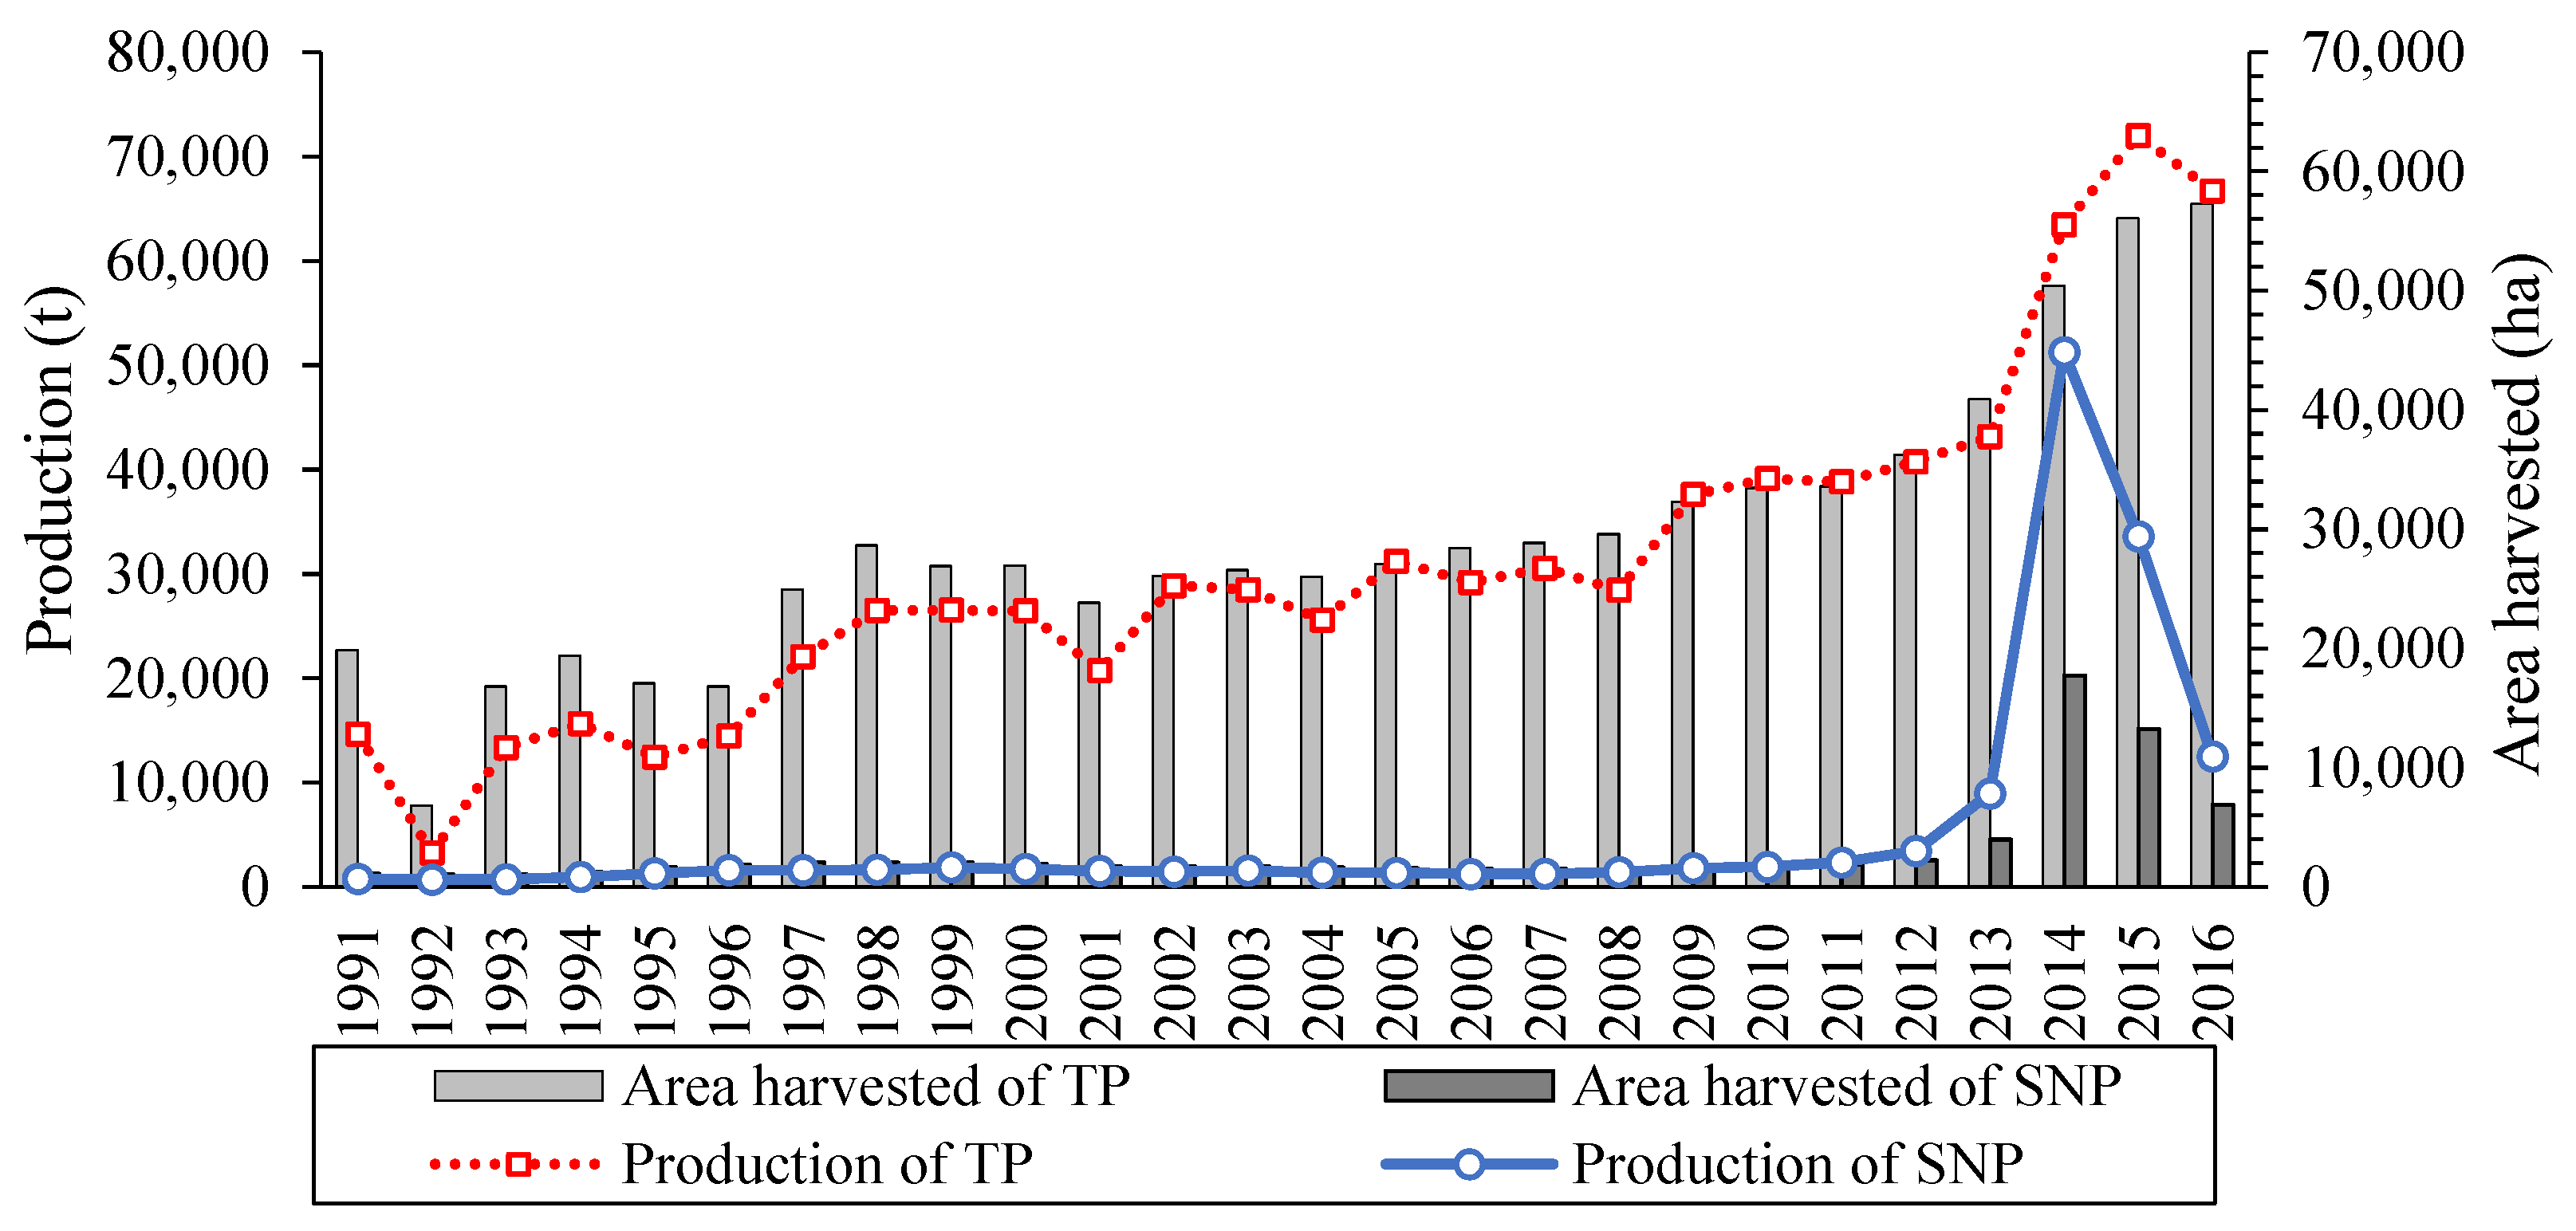
To meet this international demand, the area allocated to quinoa production has increased tremendously in Peru. Quinoa is cultivated in 18 out of the 24 regions in Peru [25]. An important distinction can be made between the six traditional producer-regions in the Andes (Apurimac, Ayacucho, Cajamarca, Cusco, Junín and Puno), which account for 89% of national quinoa area in 2016, and 12 secondary and new producer-regions (Arequipa, Ancash, Huancavelica, Huánuco, Ica, Lambayeque, La Libertad, Lima, Moquegua, Pasco, Piura and Tacna), which account for 11% of the national area (Figure 2). These new producer-regions are mainly located in the coastal agro-industrial zones of Peru, where the government has actively promoted the expansion of quinoa cultivation since 2014. Because of the large adaptability of quinoa to other environmental conditions and a more efficient water and soil use, productivity in these areas is higher than in the traditional producer-regions; with average yields of 1.9 ton/ha, compared to 1.3 ton/ha in traditional regions [26].
In the traditional producer-regions in the Andes, quinoa production is constrained by adverse climate and agro-ecological conditions such as drought, frost, wind, hail, soil salinity and poor soil fertility [2,15,27]. Also the occurrence of mildew, the most important plant disease in quinoa production, can seriously constraint productivity [4,15]. The maturation period for quinoa is relatively long—six months for the most common variety used in the research area—which is a limiting factor for farmers seeking several crop rotations per year. In addition, farmers face constraints to meet requirements in export markets due to a high saponin content in the seed hull, and small and non-uniform grain sizes [26,28].
2.2. Development of Improved Quinoa Varieties
For centuries, Andean farmers have been involved in the domestication and selection of quinoa varieties, which has led to a high level of genetic diversity [28]. Based on quinoa’s ability to adapt to different agro-ecological conditions in the Andes, five main ecotypes can be distinguished: inter-valleys, altiplano, salare, coastal and yungas [7]. However, many varieties are not well adapted to environmental conditions outside their ecotypes. The great genetic diversity of quinoa in the Andes entails the possibility to develop varieties that are tailored to the specific conditions in each ecosystem, and that lead to a higher productivity [7].
The current development of improved quinoa varieties mostly focuses on production for the international market. In Europe and North America, breeding programs concentrate on early maturity, high yield, uniformity of seeds and sweet cultivars for commercial production [28]. In Peru, the Cereal and Native Grain Research Program at the National Agricultural University La Molina is developing genetically improved quinoa seeds, with a focus on early maturation and reduction in plant height for easier introduction of quinoa in modern agricultural systems [29].
Recently, there has been an effort to develop improved varieties for the traditional producer-regions in Peru. Nationally, 35 quinoa varieties have been identified, of which eight are improved (Table A1) [30,31]. The improved varieties have been obtained through conventional breeding methods, such as selection and hybridization, by the experimental stations of the National Institute of Agricultural Research (INIA) [25]. Breeding programs have mainly focused on tolerance to plagues and diseases, high yield, and large grain size. The varieties have been developed for specific producer-regions, such as Puno (INIA 420-Negra Collana, INIA 415-Pasankalla, Salcedo INIA, Ilpa INIA and INIA 431-Altiplano), Cusco (Quillahuaman INIA and INIA 427-Amarilla Sacaca) and Junín (INIA 433-SantaAna/AIQ/FAO). The uptake of these improved varieties among smallholder farmers is rather limited. This could be related to a lack of farmer awareness about improved quinoa varieties; a high cost of improved varieties combined with capital constraints and risk aversion among farmers; or the traits of the improved varieties not being in line with farmers’ preferences.
2.3. Quinoa and Food Security
Quinoa is one of the main grain crops supplying highly nutritious food for farm-households in the Andean region. It also has the potential to contribute to food security in other regions of the developing word [15]. Compared with other grains, like wheat, corn and rice, quinoa has a higher protein content, contains all essential amino acids, and is easy to digest as it is gluten free [10,11,12,13,14]. Being a strategic Andean crop in the region, quinoa has attracted political and research interest since 1999. The Peruvian government has been promoting quinoa cultivation to improve the food security of the impoverished Andean population through various social programs [1,26]. In 2008, the food assistance program “National Food Support Program - PRONAA” was authorized by the state to purchase Andean agricultural products, with quinoa being one of those products, directly from local small farmers. Since 2012, the National Program School Food Qali Warma provides a quality food service, that is adapted to local consumption habits, to girls and boys who are enrolled in public educational institutions at the primary and kindergarten levels. The program incorporates quinoa as a processed product.
The boom in quinoa production and trade entails important opportunities for upward income mobility and improved food security among Andean smallholders [32]. Farmers benefit from higher prices and larger sales volumes, which can indirectly contribute to an increased access to food through market purchases [9]. On the other hand, the increased price of quinoa creates a shift in local farm-household diets towards cheaper and less nutritious food [6]. In addition, the international market has created pressure for the intensification of quinoa production, focusing on only a few varieties, which in some cases created environmental problems and a decreased quinoa variety diversity [33]. By introducing improved varieties that are tailored to smallholders’ needs, quinoa production might improve food security in the Andean region through higher productivity levels and lower prices.
3. Data and Methodology
3.1. Research Area
In this paper, we focus on traditional quinoa producers in the Junín region, located in the central highlands of Peru. In 2012, this region was considered to be moderately vulnerable to food insecurity [34]. Before 2013, quinoa was a subsistence crop for smallholder farmers and was mainly produced on small plots of land for self-consumption [35] (Table A2). Andean farmers usually diversify crop production with potato, barley and maize as the most common crops in the Junín region [36]. Quinoa is cultivated in two agro-ecological zones in the Andean region of Junín, namely Quechua and Suni zones with altitudes between 2300–3500 m.a.s.l. and 3400–3800 m.a.s.l., respectively, and average annual temperature around 11–16 °C and annual rainfall between 500 and 1200 mm [37].
The quinoa production in this region is highly prone to mildew (Peronospora farinosa) [38]. It affects the germination and the formation of the first leaves of quinoa and causes a risk of yield loss. The Junín region is one of the five sub-centers of genetic diversity of quinoa and smallholders use five local commercial varieties, like Hualhuas, Junín white, Junín pink, Huancayo and Mantaro [25]. However, farmers do not always know which varieties they use, so in practice the number of varieties will be higher.
3.2. Choice Experiment
3.2.1. Concept
We employ a discrete choice experiment to ex-ante analyze farmers’ preferences and willingness to pay for an improved quinoa variety in the Junín region by presenting various hypothetical quinoa variety scenarios. Discrete choice experiments are a stated-preference method and are based on Lancaster’s consumer model, in which respondents are presented with several choice sets, each containing a number of alternatives between which respondents are asked to choose. Each alternative is described by its attributes and each attribute takes one of several levels that describe ranges over which the attributes vary [39]. As a result, respondents derive utility from the different attributes of a good rather than the good as a whole [40]. It has been shown that choice experiments model respondents’ preferences better than other stated preference methods, like contingent valuation where respondents are asked to state one value that they are willing to pay for the whole product [41]. It is assumed that respondents choose the alternative which maximizes utility among the available options [42]. Experimental choice modeling allows to assess ex-ante preferences, when the good or service is not available in the market.
Choice experiments have become a popular tool to evaluate the preferences of respondents in marketing research [43,44], labor economics [45,46], agricultural technology studies [18,21,22,23], and studies on the adoption of sustainability standards [47,48]. Several studies have used choice experiments to analyze the adoption of improved varieties among smallholder farmers in some staple food crop sectors, including a study on maize in Zimbabwe [18], on rice and pearl millet in India [20,22], on beans in Burundi [21], and on sorghum and teff in Ethiopia [23].
3.2.2. Design
The design of a choice experiment entails different steps. The first step includes the identification of relevant attributes and attribute levels. Based on a review of the literature on quinoa seed, household survey data from 2014, semi-structured interviews with quinoa breeders at the National Institute of Agricultural Innovation (INIA), the Experimental Station of Santa Ana—Huancayo and agricultural experts at La Molina Agrarian University (UNALM), and four focus group discussions with quinoa farmers in the Junín region, we identify six attributes: (1) seed price, (2) grain size, (3) susceptibility to mildew, (4) maturation period, (5) yield and (6) saponin content (Table 1).
The first attribute is seed price, which is a monetary attribute and is expressed as the price of one kilogram of seed. The six levels (4, 9, 14, 24, 34 and 40 PEN/kg) were chosen based on the average seed price in 2014 (about 9 PEN/kg), and the maximum and minimum price that focus group respondents found acceptable. We expect farmers to prefer a lower seed price.
The second attribute, grain size, describes the diameter of the grain expressed by two levels: (1) small grain with less than 1.8 mm, and (2) large grain with a diameter major of 1.8 mm. The current varieties that farmers use have a small grain size, which is more difficult to transform into pearled seeds or flakes by the food industry. We expect that farmers prefer a large grain size in order to receive a better price and sell to the food industry.
The third attribute, susceptibility to mildew, represents a factor of risk to farmers, as mildew leads to yield losses when it affects quinoa. This attribute is a key factor in smallholders’ preferences for improved quinoa varieties, as mildew-resistant or mildew-tolerant varieties ensure more stable yields. We include three attribute levels: (1) resistance, with a risk of yield loss between 0% and 5%, (2) tolerance, with a risk of yield between 6% and 10% and (3) susceptible to mildew, with a risk of yield loss by more than 10%. We expect farmers to be risk averse and to dislike a susceptible quinoa seed.
The fourth attribute, maturation period, is expressed as the number of months between sowing and harvesting of quinoa. It represents another factor of risk for farmers, which is related to extreme weather events. If the maturation period is shorter, frost and drought are less likely to affect quinoa production and the opportunity costs of land (and labor) is reduced. Three levels (4, 5 and 6 months) have been chosen based on the minimum and maximum time to mature. We expect that farmers prefer early maturity varieties as a way to reduce the risk of extreme weather events.
The fifth attribute, yield, is expressed as the expected output (in tons) of quinoa for one hectare. The yield levels (1, 2, 3, 4, 5 and 6 ton/ha) are based on the maximum level that experts deem to be feasible. The yield attribute is independent from the dosage of fertilizers and agricultural management. We expect that farmers have a strong preference for higher yields.
The sixth attribute, saponin content, is related to the level of saponin in the quinoa grain. We include three attribute levels: (1) bitter with a high level of saponin, (2) semi-sweet with low content of saponin, and (3) sweet without saponin. Saponin is found in the pericarp (outer shell) and gives the grain a bitter taste. It must be removed before the quinoa is edible, which increases the processing cost. We expect that farmers dislike seeds with higher saponin levels.
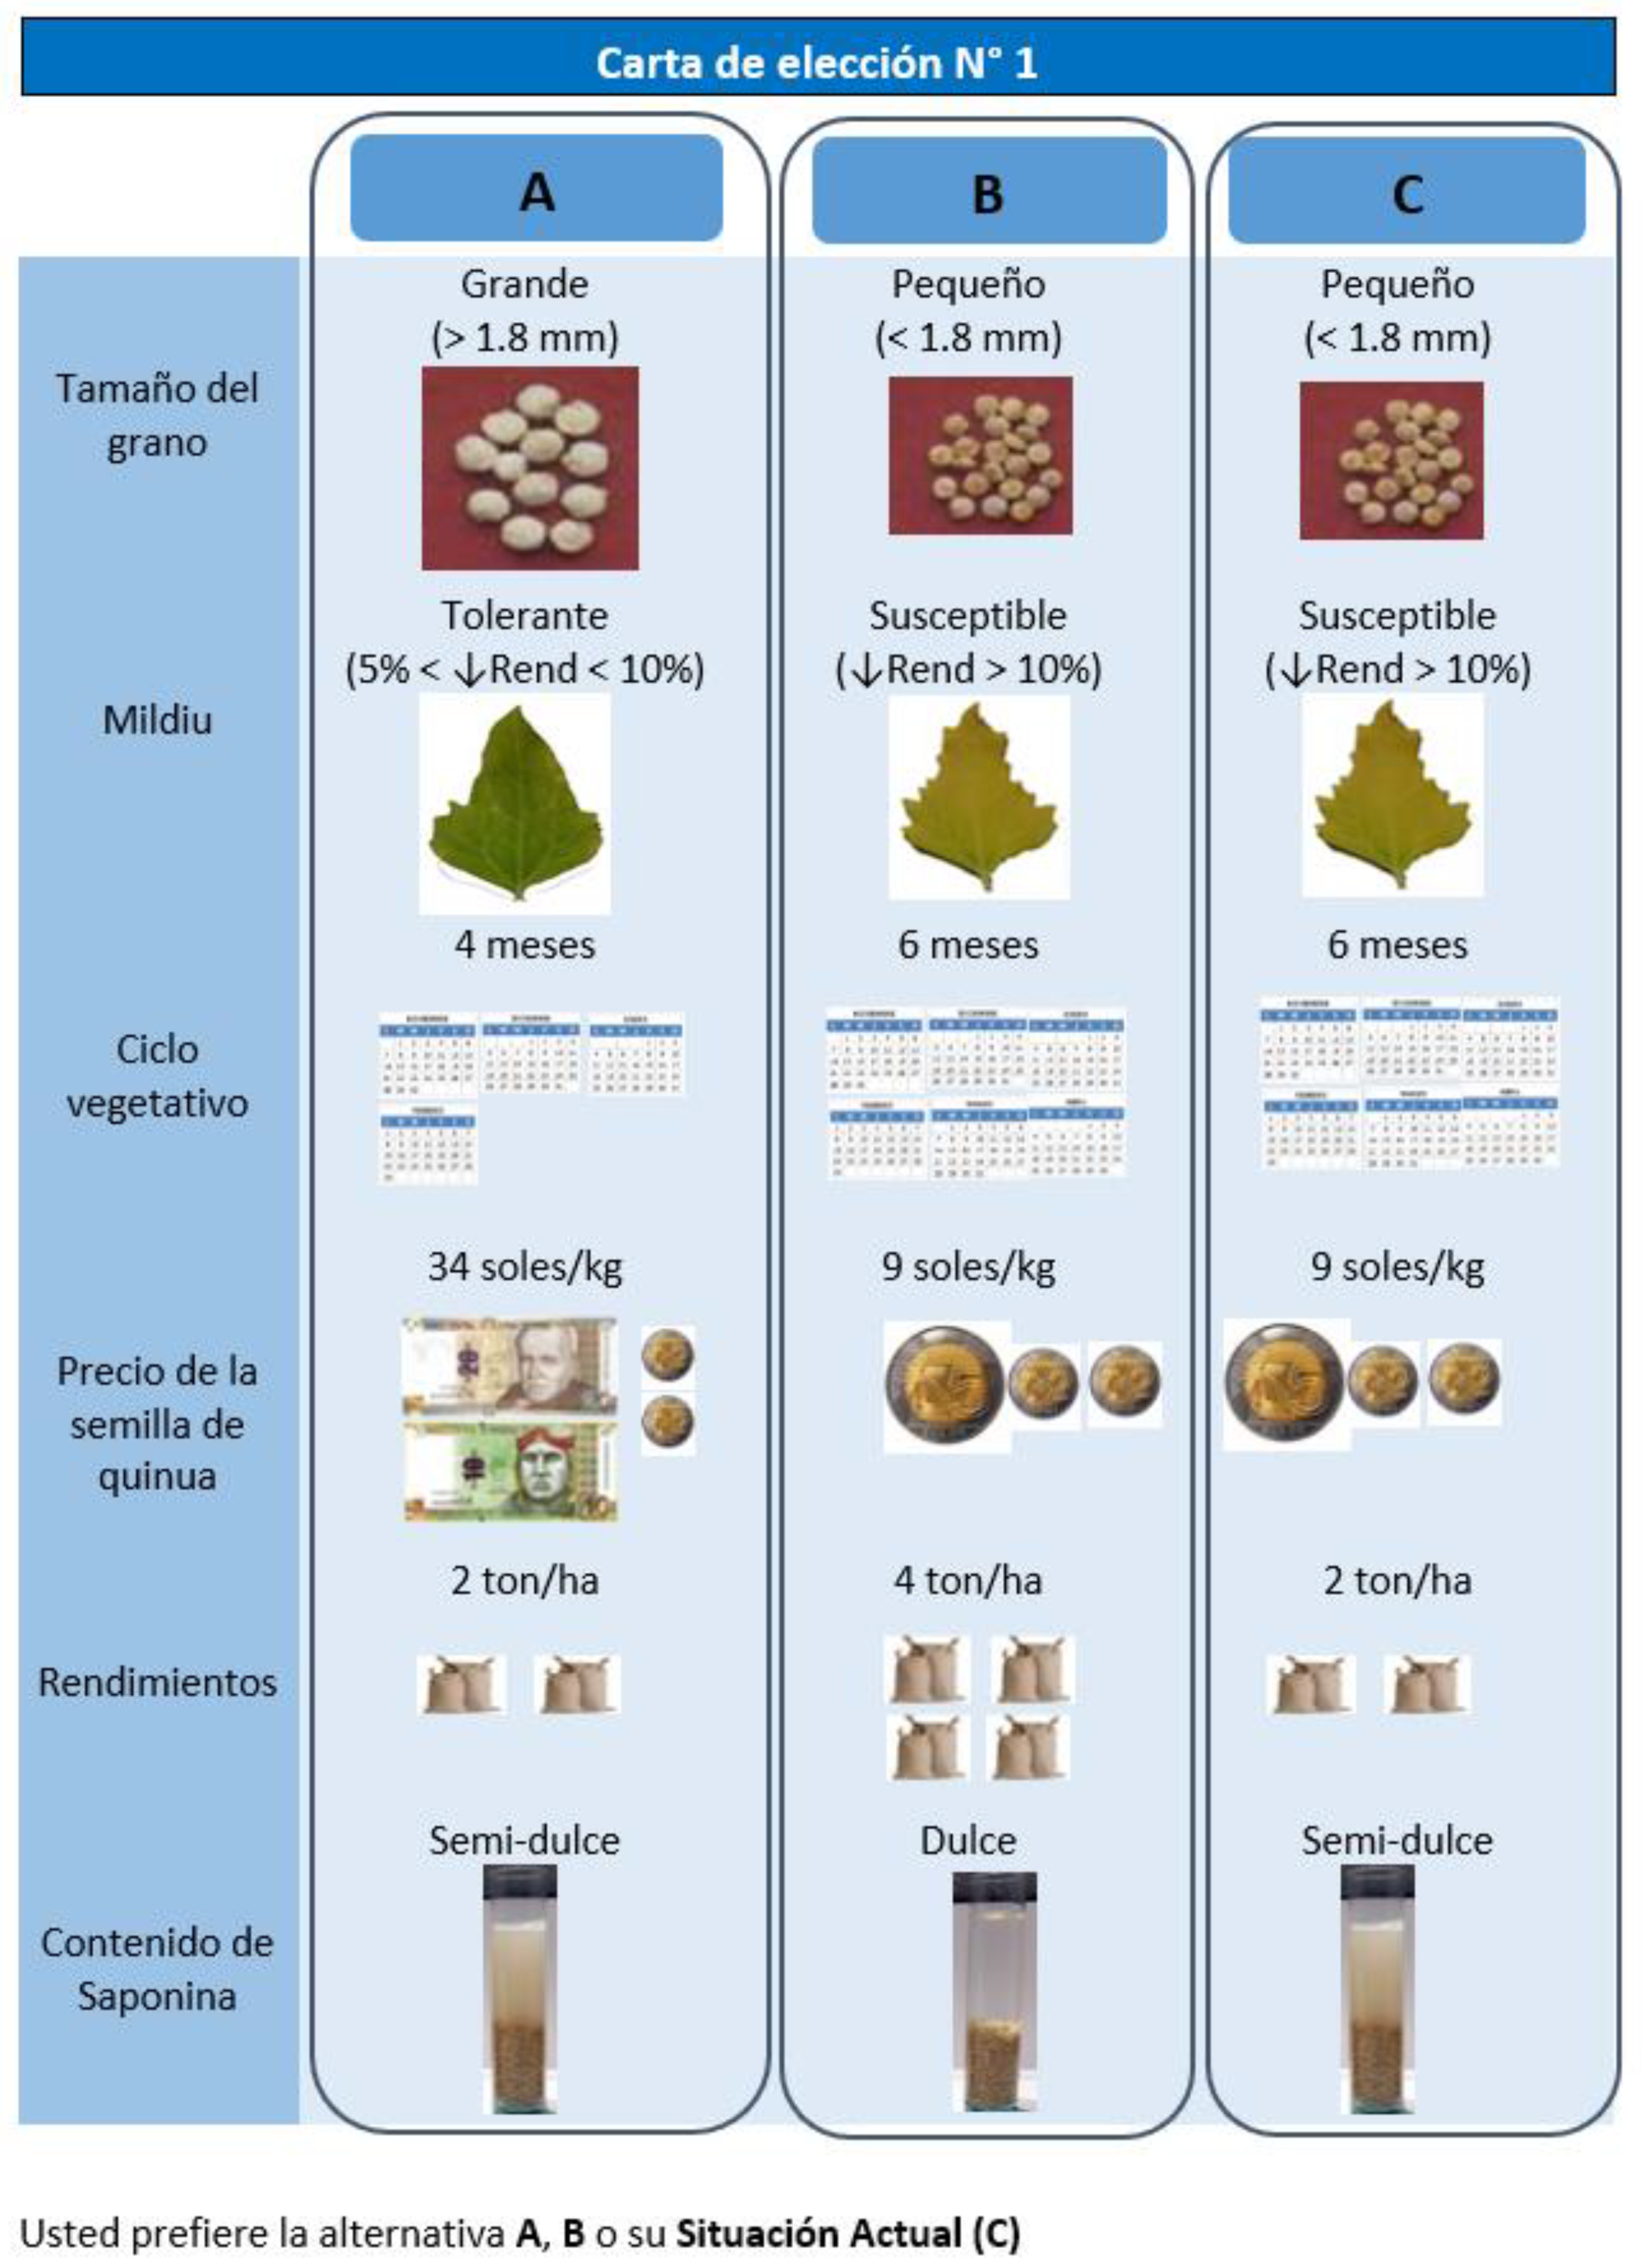
The second step of the design entails the construction of the choice cards. Each choice card includes two unlabeled alternatives that represent a hypothetical improved quinoa variety, described by the six attributes with varying levels. In addition, we include a status quo or opt-out option, indicating that the respondent is not willing to adopt an improved quinoa variety. If a farmer chooses this option, (s)he uses a white quinoa variety called Hualhuas. We chose this variety as the status quo, as it is the most common variety cultivated by farmers in Junín region. During the 2014 season, it was cultivated by 78% of farmers in the sample. It is a long-maturation (6 months) variety and is yielding approximately 2 tons/ha under normal conditions. It is a small grain with a low content of saponin (semi-sweet) and susceptible to mildew. The average seed price for this variety was about 9 PEN/kg in 2014.
Each farmer evaluated 12 choice cards. The total number of possible combinations of the two alternatives, the six attributes and its associated levels is (2 × 33 × 62)2 = 3,779,136, which is too much to be evaluated by the farmers. We use a D-efficient design to reduce the number of choice cards to 12 (Table A3). This design aims to minimize the correlation between the attribute levels in the choice experiment and to minimize the standard errors of the parameter estimates. In a first phase, we use a small positive or negative number (0.001 and −0.001) to indicate whether we expect a positive or negative effect for a specific attribute. We expect that yield, grain size, mildew, and saponin content will positively influence the probability that an improved quinoa variety is chosen, while we expect a negative effect for maturation period and seed price. This preliminary design is used in a pilot test among 32 farmers who live in the Junín region. In a second phase, we use the parameter estimates from the pilot test in order to improve the efficiency of the design. The D-error of the preliminary design is 0.0933 while this is 0.0896 in the final design. We use Ngene software to generate the design. An example of a choice card is given in Figure A1.
3.2.3. Data Collection
Data were collected in two phases. First, we collected farm-household survey data between February and March 2015. As a sampling frame of quinoa-producing households does not exist from census data and quinoa farmers are not evenly spread across districts and villages in the Junín region, we used a specific sampling strategy to be able to identify a representative sample of quinoa farmers who are clustered in villages. We employed a three-stage sampling design with purposive selection in the first stage and stratified random selection in the second and third stage. In the first stage, based on statistics collected from Regional Direction of Agriculture of Junín (DRAJ, 2016), we identified 61 districts where quinoa was produced in 2014 and selected 25 that were more specialized in quinoa cultivation (with the median of the location ratios in the last three years more than one). The location ratios ( represent the relationship between the participation of sector “i” in region “j” and the participation of the same sector in the national total and therefore, it is used as a measure of “relative or interregional specialization”. The relative specialization of a region in an activity (sector) would be associated with ; and it is measured with the harvested area between quinoa and total area cultivated (Lira, L., Quiroga, B., 2009. In the second stage, based on reports and personal communication with employees from the agricultural agencies of Concepción, Chupaca and Jauja, we identified 154 villages in total from which we randomly sampled 47 villages. Due to incomplete information about the number of quinoa farmers per district, we could not select the villages proportional to size but we selected them proportional to population density. In the third stage, we randomly selected 518 farm-households, with the number of households in each village proportional to the population of quinoa producers. The strength of this sampling strategy is that a sufficiently large sample of quinoa farmers could be identified in a limited number of villages that could be surveyed within feasible budget and time limits. A drawback of the sampling strategy is that quinoa farmers in more specialized quinoa areas and in larger and more densely populated villages might be oversampled. We used a quantitative structured questionnaire which provides household-level data on socio-demographic characteristics; land ownership; quinoa production and marketing; other crop production and marketing; livestock and animal production; off-farm activities and other income; and food security and quinoa consumption.
Second, we implemented a choice experiment in November and December 2016 using the same sample of farmers from the farm-household survey. From the 518 farmers in the sample, 458 farmers could be re-surveyed. This amounts to an attrition of 11.6%, which is due to local migration and refusal to participate in the survey. To ensure that the respondents understand the choice tasks, enumerators carefully explained the purpose of the choice experiment. They stressed that farmers should select the variety that they are most interested in, but that they should also be willing to pay the price indicated on the choice card. Each attribute and its levels were described into detail, and were visually represented on the choice cards. To test whether the choice experiment was understood by the farmers, we first presented a choice card in which there was one clearly dominant alternative before we proceeded with the actual choice experiment. In order to mitigate bias from respondents’ fatigue or a learning effect, we presented the choice cards in a random order to each respondent. The choice experiment lasted about twenty minutes, and was accompanied by a small survey on current quinoa seed use and production/marketing practices.
3.2.4. Econometric Analysis
To estimate farmers’ preferences for different traits of improved quinoa varieties, we use a generalized multinomial logit (G-MNL) model [49]. The model incorporates both preference and scale heterogeneity, as it nests both the mixed logit (MXL) model and the scale heterogeneity multinomial logit (S-MNL) model. Preference heterogeneity relates to the fact that preferences for specific attributes are individual-specific and vary across respondents, while scale heterogeneity relates to the fact that choice consistency varies across respondents, implying an individual-specific error variance. Although preference heterogeneity has been widely acknowledged in the literature, there are few empirical studies that take scale heterogeneity into account [18]. Not taking into account scale heterogeneity might lead to biased estimates [50]. The utility () to farmer i (i = 1, …, 458) from choosing alternative j (i = 1, 2, 3) in choice card t (t = 1, …, 12) in the generalized multinomial logit model (G-MNL) is given by:
where is the vector of attributes; is the vector of individual-specific parameters; and is the idiosyncratic error, which is assumed to be independently and identically distributed (i.i.d.) (Equation (1)). The specification of (Equation (2)) depends on , which is a vector of mean attribute utility weights; a person-specific scale heterogeneity of the idiosyncratic error which is log-normal with mean 1 and standard deviation , or LN(1, τ2); , which is a vector of individual specific deviations from the mean distributed MVN (0, Ʃ); and , which is a scalar parameter that governs the variance of residual taste heterogeneity. We assess the robustness of our results to scale heterogeneity by comparing three models in which is specified as its two extremes (zero and one), and a value in between. If is set to zero, the model G-MNL-I implies , whereas if is set to 1, the model G-MNL-II implies . The difference is that in the G-MNL-I model, the standard deviation of is independent of the scaling of , whereas in G-MNL-II, it is proportional to [49]. This implies that the vector of utility weights is scaled up or down proportionally across farmers by the scaling factor . If the model with an unspecified value of leads to similar coefficient estimates, then we can conclude that the unrestricted model takes scale heterogeneity sufficiently into account [51]. All models are estimated using Stata MP V.15 software (StataCorp. 2017. Stata Statistical Software: Release 15. College Station, TX, USA: StataCorp LLC).
Our model includes an alternative specific constant (ASC) to account for the alternative in which the farmer does not choose an improved variety but a traditional variety instead (meaning a positive α coefficient). The ASC is a dummy variable, coded zero for the improved varieties and one for the traditional variety. The ASC reflects a farmer’s general attitude to the adoption of improved (quinoa) varieties, capturing factors not included by attributes in the choice experiment. We assume that farmers have a homogeneous preference for lower quinoa seed prices and we specify the price attribute to have a fixed coefficient. This is in line with other studies like Ochieng et al. (2017) [45] and Meemken et al. (2017) [47]. All other attributes and the ASC are specified as random and normally distributed. To account for preference heterogeneity, we estimate the G-MNL model for the full sample of farmers and for subsamples of food secure and food insecure farmers separately—with food security calculated as explained below. We use this approach to identify preference heterogeneity instead of the more common approaches based on interaction terms in mixed logit models or latent class models as these approaches did not results in additional relevant insights. Assuming a linear utility function, the mean marginal willingness to pay (WTP) for a certain attribute x is given by the negative ratio of the coefficient for attribute x and cost (price of quinoa seed) [41]. It represents the marginal rate of substitution between a certain attribute and the cost attribute, or in other words, how much the farmer is willing to pay for a one-unit change in a specific trait. This measure allows us to compare whether food secure farmers and food insecure farmers have different preferences for improved quinoa varieties.
3.3. Measurement of Food Security
We measured food security using the Food Insecurity and Hunger Module (FIHM) developed by the United States Department of Agriculture (USDA). Food security is defined as “Access by all people at all times to enough food for an active, healthy life. It includes (1) the availability of nutritionally adequate and safe foods, and (2) the ability to acquire acceptable foods in socially acceptable ways” [52]. The FIHM is a questionnaire consisting of 18 multiple-choice questions, which measure the food security situation at the household level during the last twelve months prior to the survey (Table A4). When a household experiences food insecurity, the frequency is assessed as well (ranging from “often” to “some months but not every month”), which are coded as a positive response. Based on the sum of these responses, a score on the “Household Food Security Scale” is determined. This is a single numerical value ranging from 0 to 10, which measures the degree of severity of food insecurity/hunger experienced by a household. This measure allows us to classify households according to their food security status into four categories, each one representing a meaningful range of severity on the underlying scale: (1) food secure (from 0 to 2.2), (2) food insecure without hunger (from 2.4 to 4.4), (3) food insecure with moderate hunger (from 4.7 to 6.4), and (4) food insecure with severe hunger (from 6.6 to 10). We recode this household food security status into a binary variable “Food Insecure”, equaling one if a household is food insecure (irrespective of hunger status) and equaling zero if a household is food secure.
We acknowledge that other measures of food security, such as food consumption, energy and micronutrient intake, and anthropometric measures, have been shown to more correctly estimate food and nutrition insecurity than self-reported measures, like the FIHM [53]. However, the FIHM has been demonstrated to be a useful, rapidly implementable, low-cost tool [34], which captures both physical and psychological elements of food insecurity.
4. Results
4.1. Descriptive Statistics
Seventy percent of the sampled farm-households are classified as food secure and 30% as food insecure. The latter class includes households classified as “food insecure without hunger” (21%), as “food insecure with moderate hunger” (6%) and “food insecure with severe hunger” (3%). Table 2 presents household and farm characteristics for the full sample, and across food secure and food insecure farm-households. Most (87%) of the sampled households are male headed and the average age of the household head is 50 years. While for food insecure households only 14% has a household head with completed tertiary education, this is 25% for food secure households. An average household consists of 3.7 members with food-insecure households having larger households. A small minority (19%) of farmers are member of a farmer organization, with food secure farmers being more likely to be member. In terms of household welfare, we find that the income of food secure farmers is more than triple the income of food insecure farmers, and that the propensity to be poor is 15% for food insecure farmers while this is only 3% for food secure farmers. These statistics confirm that households’ food security status is highly correlated with welfare, which corroborates the validity of the food security measure.
Farmers in the research area cultivate on average 4.7 ha in total and allocate 1.9 ha to quinoa production. Food secure farmers produce more quinoa than food insecure farmers but this is due to a larger farm size and not to higher yield levels. The average quinoa yield is 2 tons/ha. Farmers cultivate quinoa mainly for commercial purposes; they retain on average 7% of the total quinoa production for household consumption, with food-insecure households having a larger degree of self-consumption of quinoa (11%). They are also less likely to have received agricultural training and have been cultivating quinoa for a shorter period (about three years less) than food secure farmers. There are no differences related to quinoa seed use. The majority of farmers either store and reuse the harvested quinoa grain as seeds in the next season or buy it from other farmers. The five most common varieties are Hualhuas, Blanca de Junín, Rosada de Junín, Huancayo, and INIA 433 varieties, with Hualhuas as the most common variety (78% of farmers cultivating it during harvest 2014).
The production of quinoa entails some risks, which are mainly related to pests and diseases (e.g., mildew) and extreme weather events. Twenty percent of the sampled farm-households has suffered yield losses due to pests and diseases at least one time during the last three years. This has led to a reduction of about 75% of their quinoa production. In the harvest season of 2014, 82% of the farmers experienced mildew. They mainly controlled this through the use of fungicides, but this represents a large cost for the farmers while harvests can still fail due to the incorrect application or ineffectiveness of fungicides. In addition, 40% of the sampled farm-households has suffered yield losses due to frost at least one time during the last three years, which has led to a reduction of about 50% of their quinoa production. In the harvest season of 2014, 78% of the farmers cultivated the Hualhuas variety, which has a long maturation period of about six months. As a consequence, farmers are more exposed to unpredictable, variable weather events.
4.2. GMNL Model Results
Table 3 presents the empirical results of the generalized multinomial logit model (GMNL). The scale parameter τ is 0.6 with a standard error of 0.07, implying substantial scale heterogeneity in the data. We account for this in the models with gamma fixed at zero (GMNL I) and gamma fixed at one (GMNL II) (Table A5). The results of these models are very similar to the results of the unrestricted GMNL model, so we can assume that our results are robust to scale heterogeneity. We proceed with the analysis with the unrestricted GMNL model and estimate this for food secure and food insecure farm-households separately.
Regarding the full sample, we find that the ASC estimate is negative and significant. This suggests that farmers generally prefer improved varieties over traditional varieties. All attribute coefficients are significant with expected signs (except for sweet quinoa, which is not significant). This suggests that all of these attributes matter in farmers’ choice for improved varieties. Farmers prefer cheaper varieties that are tolerant/resistant to mildew, and that have a larger grain size, higher yield levels and a shorter maturation period. Farmers dislike a high level of saponin but are indifferent between low levels of saponin and no saponin at all. However, we also find significant standard deviations for all of these attributes (except for tolerance to mildew and sweet quinoa), which suggests that preferences differ across farmers. We indeed find differences across food secure and food insecure farmers. The preferences for quinoa variety traits of food insecure farmers differ from those of food secure farmers with respect to maturation period and grain size, for which these farmers are indifferent.
4.3. Willingness to Pay for Quinoa Traits
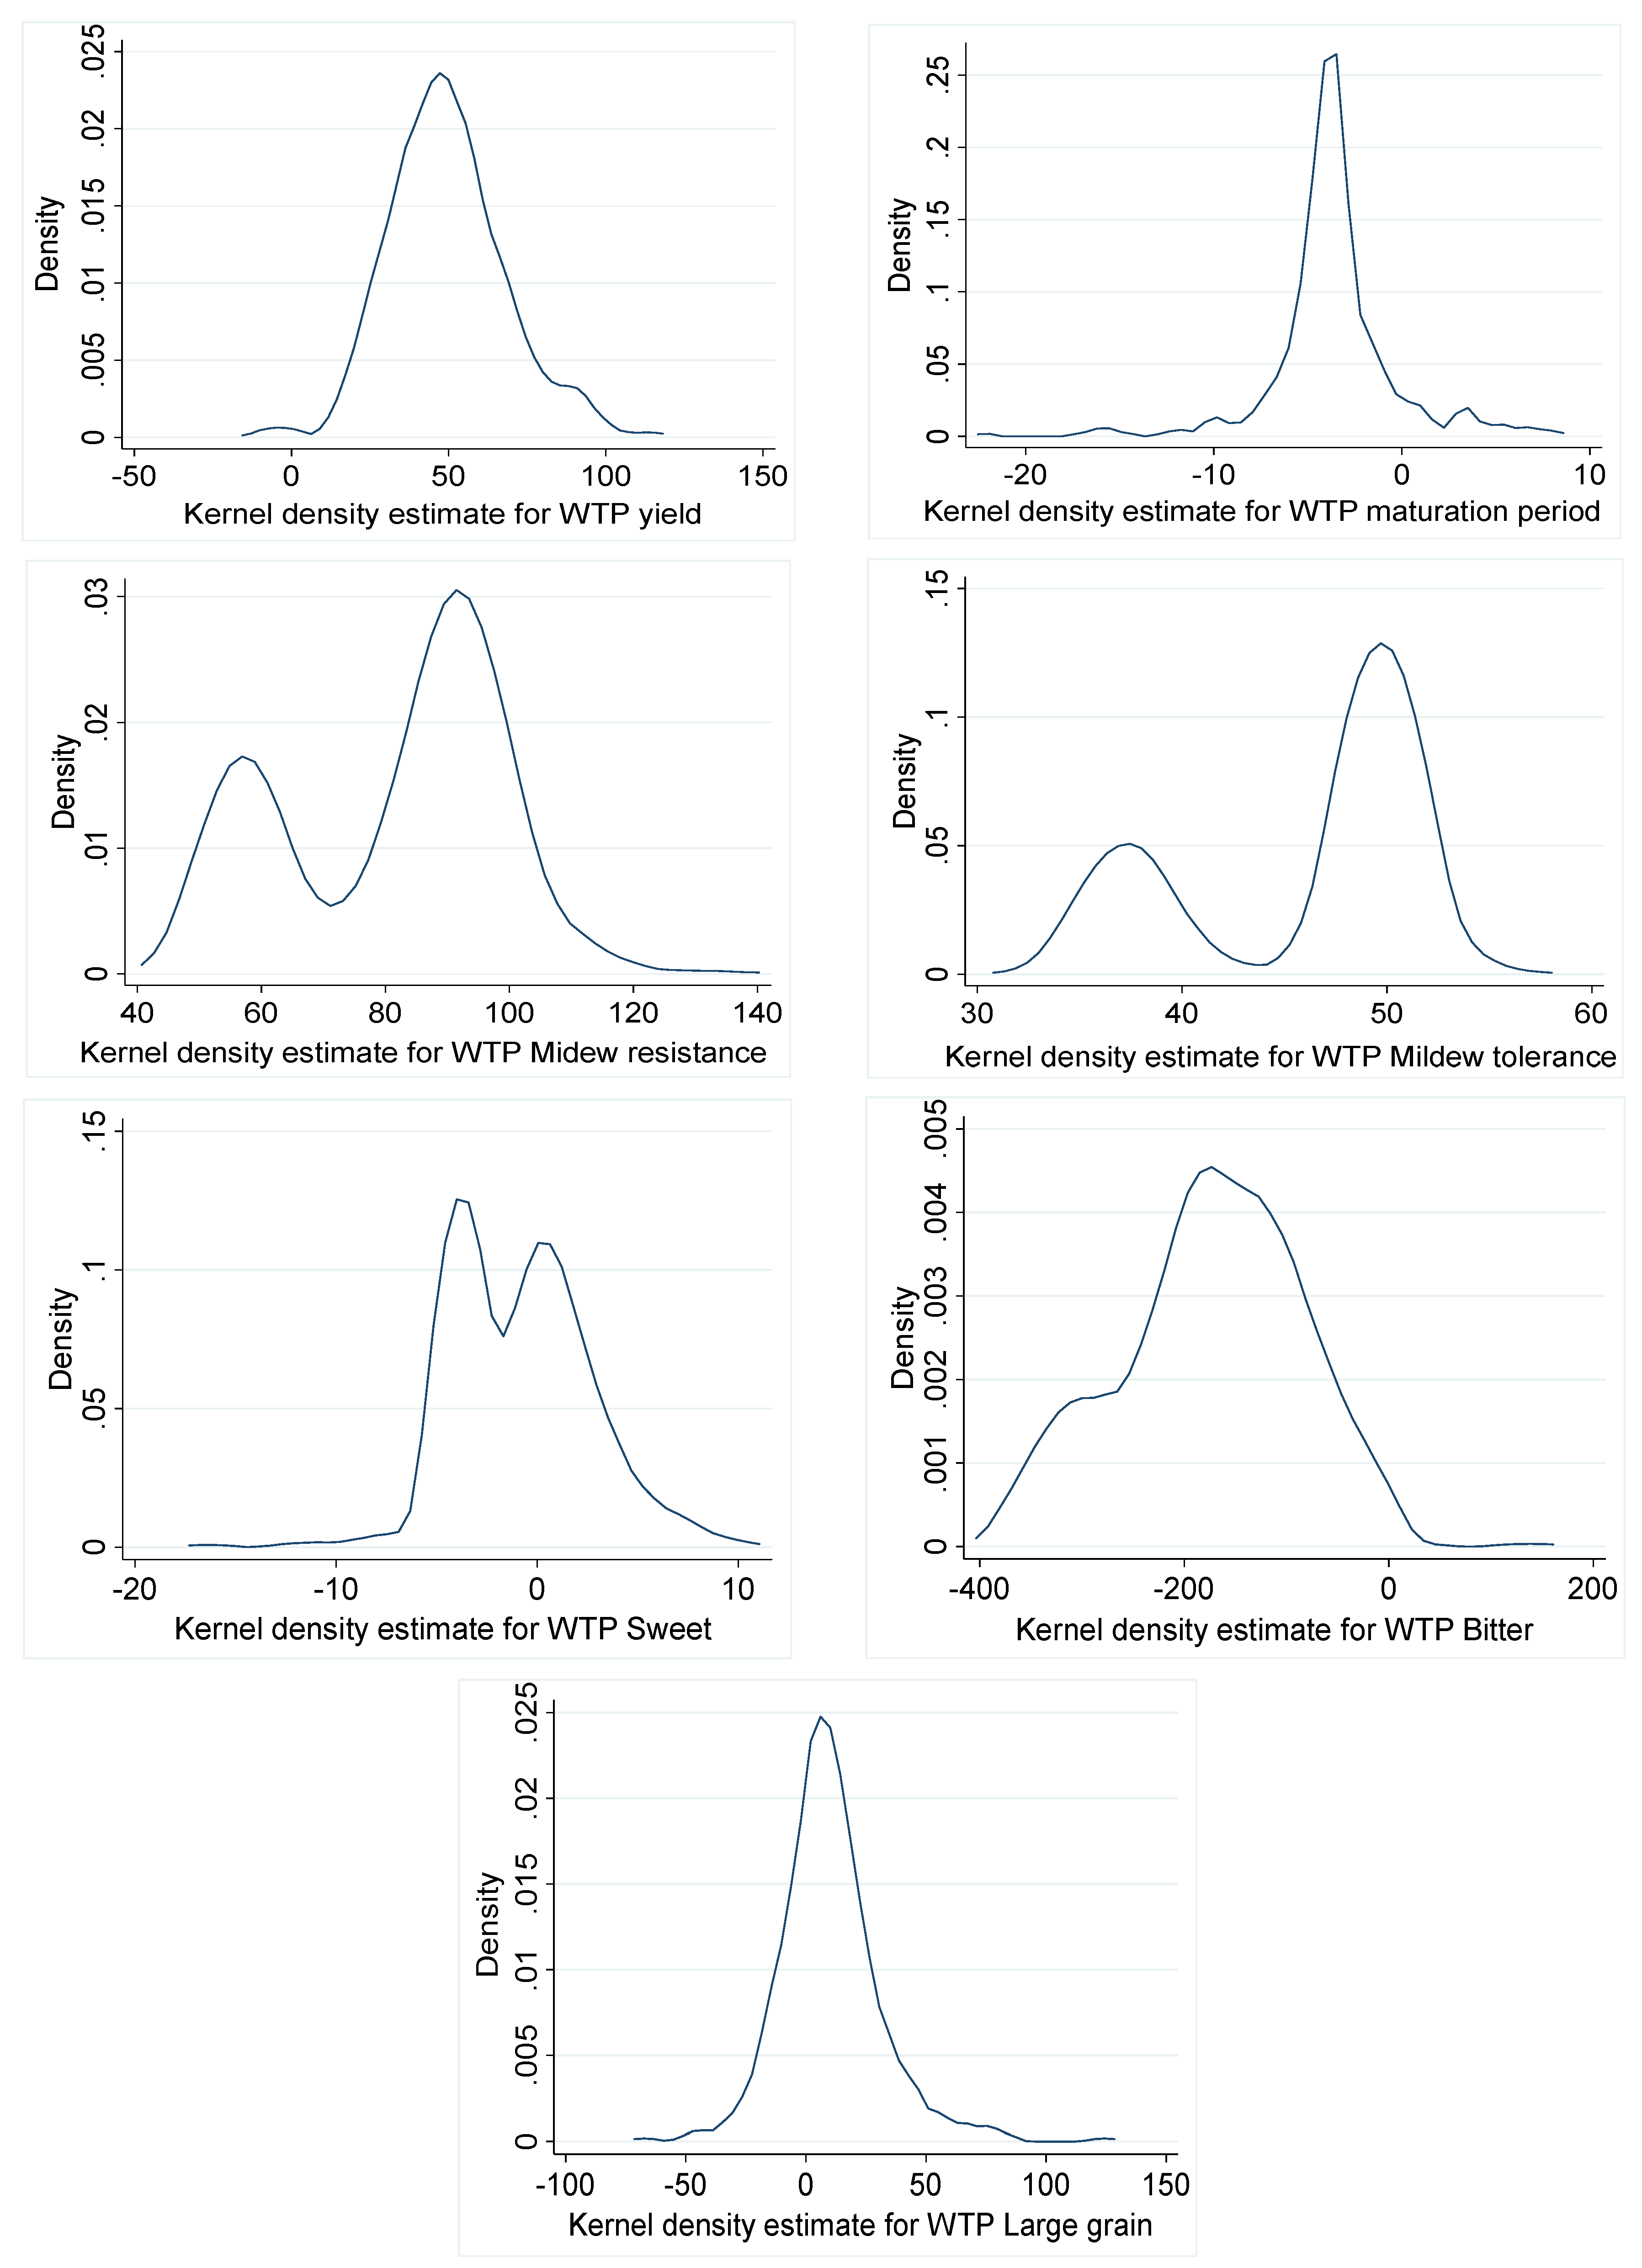
The estimated WTP values for each attribute level are given in Table 4 for the full sample as well as for food secure and food insecure households. These WTP estimates and their distributions (Figure A2) highlight the extent to which farmers value characteristics of an improved quinoa variety. We find an average WTP of 49 PEN per kg of quinoa seed for a one ton higher yield and an average WTP of 81 PEN per kg of quinoa seed for mildew resistant varieties. These WTP values are high in comparison with current quinoa seed prices. According to the National Institute of Agricultural Innovation (INIA), the average price of quinoa seed during the time of our survey was 25 PEN/kg for a traditional variety (Hualhuas) and 40 PEN/kg for an improved variety (INIA 433—SANTA ANA/AIQ/FAO) in the Junín region. Given the discrepancy between current seed prices and the estimated WTP values, we need to interpret the WTP estimates cautiously and we do so in relative terms rather than in absolute terms.
Our results suggest that farmers are willing to pay most for an improved quinoa variety that is resistant to mildew. This is justified as mildew disease is the most important challenge for quinoa production in the Junín region. Farmers are even prepared to pay double for a mildew-resistant variety than for a mildew-tolerant variety. Compared to the other traits, farmers value a mildew-resistant variety 1.6 times higher than a one-ton increase in yield level, 8.1 times higher than a variety with large grain size, and 22.5 times higher than a one-month reduction in maturation period. However, farmers are not willing to buy a seed with a high saponin content, because the bitter taste does not allow for household consumption and makes it difficult to sell to food processors, as it increases their cost to remove the saponin.
Food secure farmers have the same ranking of attribute importance as food insecure farmers, but food secure farmers are in general willing to pay more for improved quinoa variety traits than food insecure farmers; e.g., 59.46% more for mildew-resistant varieties, 33.16% more for mildew-tolerant varieties, 55.83% more for a one-ton increase in yield level.
5. Discussion
In general, we find that traditional quinoa producers in the central highlands of Peru have a strong preference for improved varieties over traditional varieties—and a relatively high willingness to pay for improved quinoa varieties. Farmers have a strong preference for varieties that are resistant or tolerant to mildew. In addition, farmers prefer varieties that have higher yield levels, a larger grain size, and a shorter maturation period but their willingness to pay for these variety traits is substantially lower. Farmers dislike a high level of saponin. We find that farmers have heterogeneous preferences and that this preference heterogeneity can partially be explained by the food security status of the farm-household. Food insecure farmers, accounting for 30% of the sample, are found to be indifferent for maturation period and grain size, and to have a lower willingness to pay for improved varieties than food secure farmers. The indifference to maturation period and grain size likely relates to the fact that food insecure farmers produce less quinoa and have a larger degree of self-consumption of quinoa (Table 2). As quinoa is less important as a cash crop for food insecure farmers, they do not appreciate a larger grain size, a characteristic that is valued in the market, nor a shorter maturation period, which may result in early marketing and better market prices and a lower opportunity cost of land. The lower willingness to pay likely relates to lower income levels, a higher incidence of poverty and higher capital constraints among food insecure farmers.
Mildew resistance is the most important attribute for the adoption of improved quinoa varieties among smallholder farmers in Junín region. This is in line with the reported high incidence of mildew in Junín region [38], causing yield reductions of up to 99% in susceptible cultivars [9] and large income shocks. Farmers are willing to pay nearly twice as much for a mildew-resistant variety, which limits yield losses to less than 5%, than for a variety that leads to a one ton yield increase per ha. They are willing to pay about the same amount for the yield-increasing variety as for a mildew-tolerant variety, which limits yield losses to maximal 10% (Table 4). The result that mildew resistance/tolerance, and hence yield stability, is more important to quinoa farmers than higher yield levels is consistent with farmers being risk averse. Other studies document similar findings—for example that drought tolerance is a more important trait than yield level for improved maize varieties in Zimbabwe [18], and that farmers in Ethiopia are willing to forego a higher yield for more stability in yield with improved sorghum and teff varieties [23].
Our result that quinoa farmers prefer a shorter maturation period but that this trait is less important than mildew resistance and yield levels, might indicate that farmers are less averse for risk related to extreme weather events than for pests and diseases. In the harvest season of 2014, mildew affected more farmers than frost, and the yield losses due to mildew were much more severe (Table 2). In addition, mildew-resistant/tolerant varieties require less fungicides, so farmers might save costs by using such varieties, while a farmer does not make expenses related to frost protection. Our result is in line with a study on climbing beans in Burundi [21] in which maturation period was found to be a less important trait than yield levels. Yet, other studies indicate stronger farmer preferences for yield levels than for yield variability. For example, farmers were found to have a strong preference for rice and bean seed varieties that result in higher yields in India and Burundi respectively [21,22]. This implies that farmers’ preferences for improved staple food crop varieties is context specific. We find that preference heterogeneity can be partially explained by food security status, which is in line with other choice experiment studies on staple food crop varieties [18,21,22,23]. A drawback of our study is that we were not able to explore preference heterogeneity more in depth, as we found few significant interactions with farm and farmer characteristics in the G-MNL model and derived no additional insights from latent class models. A novelty in our approach is the inclusion of scale heterogeneity, leading to results that are robust to heterogeneity in choice consistency across respondents—this source of heterogeneity was not accounted for in previous choice experiment studies on staple food crop varieties.
This paper unravels farmers’ preferences for improved quinoa varieties, and entails important implications for seed developers and breeding programs. In Peru, recent breeding programs focus on generating varieties with early maturity and short plant height for the introduction of quinoa in large-scale, modern and mechanized agricultural systems [29]—such as quinoa production in two seasons in high-technology farms along the Peruvian coast. However, small-scale and food insecure farmers who grow quinoa in non-irrigated and lowly mechanized systems in the highlands, do not benefit from these investments and improved varieties. From a public policy perspective, our results imply that developing mildew-resistant and higher-yielding varieties with a medium to low saponin content is a priority if investments in quinoa technologies are to benefit small-scale and food insecure farmers in the Andean highlands of Peru. Yet, even if preferred varieties would be developed and disseminated to farmers, there might still be constraints for actual adoption of improved varieties (even if these are in line with farmers’ preferences). These constraints might relate to risk behavior of farmers, capital constraints and lack of information [54,55]. Nevertheless, a first step in the development of improved varieties is to take farmers’ needs into account—which is what our paper contributes to.
6. Conclusions
In this paper, we study farmers’ preferences and willingness to pay for improved quinoa varieties using a choice experiment and data from 458 smallholder farmers in the Peruvian Andes. We find that farmers have a strong preference for improved quinoa varieties over traditional varieties, with mildew-tolerance or -resistance as the most important crop trait. Farmers are found to prefer varieties that are characterized by higher yield levels, a larger grain size, lower levels of saponin (causing a bitter taste), and a reduced maturation period. Yet, food insecure farmers are found to be indifferent to early maturation and a larger grain size, which likely relates to quinoa being less important as a cash crop for these farmers—and have a lower willingness to pay for improved quinoa varieties. Our results imply that improved quinoa varieties entail the highest potential for a rapid diffusion among smallholder Andean farmers if ongoing investments focus on the development of mildew-resistant and higher-yielding varieties with a medium to low saponin content. This paper contributes to the literature on ex ante adoption of improved varieties for staple food crops with new evidence on smallholders’ preferences for quinoa varieties. Our study underscores the importance of studying farmers’ preferences ex ante to better inform agricultural research and development initiatives. This holds especially in the case of quinoa, given the sharp increase in attention for and investment in this crop in recent years.
Author Contributions
C.G. and G.V.d.B. designed the choice experiment; C.G. implemented the choice experiment in the Junín region in Peru; C.G. analyzed the data; G.V.d.B. and M.M. provided support in the econometric analysis; C.G. wrote the paper; G.V.d.B. and MM provided support in the manuscript preparation and in the editing.
Funding
This research was funded by Vlaamse Interuniversitaire Raad, grant number ZIU S2018AP020 UNALM.
Acknowledgments
We are thankful to José Falconi for useful comments on the identification of the attributes and attribute levels that are relevant for the adoption of improved quinoa varieties and to the Dirección Regional de Agricultura and the Agencias Agrarias for supporting the data collection in Junín region in Peru.
Conflicts of Interest
The authors declare no conflict of interest.
Appendix A

Table A1.
Improved quinoa varieties.
| Quinoa Varieties | Diameter (mm) | Color of Grain | Vegetative Cycle (days) | Saponin Content | Reaction to Mildew | Yield (ton/ha) | Experimental Stations in |
|---|---|---|---|---|---|---|---|
| Quillahuaman INIA | Large | White | 190–220 | Semi-sweet | Tolerance | 2.8 | Cusco |
| INIA 420—Negra collana | Small | Black | 140 | Sweet | Tolerance | 3.01 | Puno |
| INIA 415—Pasankalla | Large | Red | 144 | Sweet | Resistance | 3.5 | Puno |
| INIA 427—Amarilla Sacaca | Small-Large | Yellow orange | 160–180 | Bitter | Tolerance | 2.3 | Cusco |
| Salcedo INIA | Large | White | 150 | Sweet | Tolerance | 2.5 | Puno |
| ILLPA INIA | Large | White | 140 | Sweet | Tolerance | 3.1 | Puno |
| INIA 433—SANTA ANA/AIQ/FAO | Large | White | 160 | Bitter | Tolerance | 1.5–2 | Junín |
| INIA 431—Altiplano | Large | White | 150 | Sweet | Tolerance | 2.86 | Puno |
Source: National Institute of Agricultural Research (INIA).
Table A2.
Quinoa harvested area, production, yield and consumption in quinoa-producing farmers in Peru.
Table A2.
Quinoa harvested area, production, yield and consumption in quinoa-producing farmers in Peru.
| 2010 | 2011 | 2012 | Average | ||||
|---|---|---|---|---|---|---|---|
| Mean | SD | Mean | SD | Mean | SD | ||
| N° farmers | 424 | 354 | 573 | ||||
| Area harvested (has) | 0.21 | 0.53 | 0.16 | 0.38 | 0.19 | 0.44 | 0.18 |
| Yield (kg/ha) | 1770 | 2250 | 1156 | 1066 | 1026 | 1736 | 1317 |
| Production (kg) | 228.91 | 763.98 | 163.56 | 489.56 | 234.51 | 1109.90 | 208.99 |
| % of sell (Sale/Production) | 0.18 | 0.30 | 0.17 | 0.30 | 0.15 | 0.29 | 0.16 |
| % of Self-consumption (Self-consumption/Production) | 0.56 | 0.31 | 0.60 | 0.33 | 0.60 | 0.34 | 0.59 |
| Price (soles/kg) | 3.71 | 1.02 | 3.74 | 0.84 | 4.12 | 1.10 | 3.86 |
| Consumption per capita | 19.98 | 41.93 | 15.02 | 18.72 | 15.70 | 22.33 | 16.90 |
| Consumption per adult equivalent | 31.63 | 71.48 | 20.65 | 24.94 | 21.40 | 27.74 | 24.56 |
Source: Author’s calculation based on micro data from National Survey of Strategic Programs (ENAPRES) [35], over 2010–2012.
Table A3.
Choice experiment design.
| Choice Situation | Alternative | Grain Size | Mildew | Life Cycle (months) | Seed Price (PEN) | Yield (ton/ha) | Saponin Content |
|---|---|---|---|---|---|---|---|
| 1 | A | Large | Tolerance | 4 | 34 | 2 | Medium sweet |
| B | Small | Susceptible | 6 | 9 | 4 | Sweet | |
| 2 | A | Large | Resistance | 6 | 40 | 4 | Sweet |
| B | Small | Tolerance | 4 | 4 | 4 | Medium sweet | |
| 3 | A | Large | Susceptible | 5 | 24 | 1 | Sweet |
| B | Small | Tolerance | 5 | 14 | 1 | Bitter | |
| 4 | A | Small | Susceptible | 5 | 40 | 5 | Medium sweet |
| B | Large | Resistance | 5 | 4 | 2 | Sweet | |
| 5 | A | Small | Tolerance | 6 | 9 | 5 | Sweet |
| B | Large | Resistance | 4 | 34 | 3 | Medium sweet | |
| 6 | A | Small | Resistance | 4 | 4 | 3 | Medium sweet |
| B | Large | Tolerance | 6 | 40 | 6 | Bitter | |
| 7 | A | Large | Susceptible | 4 | 9 | 6 | Bitter |
| B | Small | Resistance | 6 | 34 | 3 | Medium sweet | |
| 8 | A | Large | Tolerance | 6 | 14 | 3 | Medium sweet |
| B | Small | Resistance | 4 | 24 | 6 | Bitter | |
| 9 | A | Small | Tolerance | 4 | 34 | 4 | Sweet |
| B | Large | Susceptible | 6 | 9 | 5 | Medium sweet | |
| 10 | A | Small | Resistance | 5 | 24 | 2 | Bitter |
| B | Large | Tolerance | 5 | 14 | 2 | Sweet | |
| 11 | A | Large | Resistance | 6 | 4 | 6 | Bitter |
| B | Small | Susceptible | 4 | 40 | 5 | Sweet | |
| 12 | A | Small | Susceptible | 5 | 14 | 1 | Bitter |
| B | Large | Susceptible | 5 | 24 | 1 | Bitter | |
| Status quo | C | Small | Susceptible | 6 | 9 | 2 | Medium sweet |
Source: Author’s design in Ngene software.
Table A4.
Food Insecurity and Hunger Module (FIHM).
| Question Description | Yes | No | Percentage (N = 458) | ||||
|---|---|---|---|---|---|---|---|
| Often | Sometimes | Never | Refused | ||||
| Q2 | Worried whether food would run out | -- | -- | 3.71 | 47.82 | 46.51 | 1.97 |
| Q3 | Food that we bought just did not last | -- | -- | 1.75 | 34.72 | 61.79 | 1.75 |
| Q4 | Could not afford to eat balanced meals | -- | -- | 1.09 | 22.93 | 75.11 | 0.87 |
| Q5 | Relied on only a few kinds of low-cost food to feed children | -- | -- | 0.66 | 13.54 | 84.93 | 0.87 |
| Q6 | Could not feed the children a balanced meal | -- | -- | 0.44 | 10.04 | 88.65 | 0.87 |
| Q7 | Children were not eating enough | -- | -- | 0.22 | 6.33 | 92.58 | 0.87 |
| Q8 | Adult cut the size of meals or skipped them | 14.41 | 85.59 | 0.44 | 12.45 | 85.59 | 1.53 |
| Q9 | Eat less than felt should | 16.38 | 83.62 | -- | -- | -- | -- |
| Q10 | Hungry but did not eat | 12.88 | 87.12 | -- | -- | -- | -- |
| Q11 | Lose weight | 12.45 | 87.55 | -- | -- | -- | -- |
| Q12 | Adult did not eat for a whole day | 6.77 | 93.23 | 0.22 | 5.02 | 93.23 | 1.53 |
| Q13 | Cut the size of children’s meals | 5.02 | 94.98 | -- | -- | -- | -- |
| Q14 | Children ever skip meals | 3.28 | 96.72 | 0.00 | 2.40 | 96.72 | 0.87 |
| Q15 | Children ever hungry | 2.40 | 97.60 | -- | -- | -- | -- |
| Q16 | Children did not eat for a whole day | 2.18 | 97.82 | -- | -- | -- | -- |
Note: For questions 8, 12 and 14, “Often” is “Almost every month” and “Sometimes” is “Some months but not every month”.
Table A5.
Generalized multinomial logit model.
| Full GMNL | GMNL-II | GMNL-I | |||||||
|---|---|---|---|---|---|---|---|---|---|
| Mean | SE | Mean | SE | Mean | SE | ||||
| Parameters | |||||||||
| ASC | −0.69 | 0.10 | *** | −0.71 | 0.11 | *** | −0.71 | 0.10 | *** |
| Seed price | −0.02 | 0.00 | *** | −0.02 | 0.00 | *** | −0.02 | 0.00 | *** |
| Yield | 0.88 | 0.06 | *** | 0.84 | 0.05 | *** | 0.76 | 0.04 | *** |
| Maturation period | −0.07 | 0.03 | *** | −0.06 | 0.03 | ** | −0.05 | 0.02 | * |
| Large grain | 0.16 | 0.06 | *** | 0.15 | 0.06 | *** | 0.12 | 0.05 | ** |
| Resistance | 1.40 | 0.10 | *** | 1.38 | 0.10 | *** | 1.23 | 0.07 | *** |
| Tolerance | 0.83 | 0.07 | *** | 0.80 | 0.07 | *** | 0.72 | 0.06 | *** |
| Bitter | −3.08 | 0.22 | *** | −2.96 | 0.17 | *** | −2.64 | 0.14 | *** |
| Sweet | −0.03 | 0.04 | −0.03 | 0.05 | −0.01 | 0.04 | |||
| Standard Deviations | |||||||||
| ASC | 1.22 | 0.12 | *** | 1.23 | 0.10 | *** | 1.19 | 0.10 | *** |
| Yield | 0.39 | 0.04 | *** | 0.39 | 0.04 | *** | 0.36 | 0.03 | *** |
| Maturation period | −0.14 | 0.05 | *** | −0.15 | 0.07 | ** | −0.19 | 0.04 | *** |
| Large grain | 0.55 | 0.11 | *** | 0.41 | 0.10 | *** | 0.52 | 0.08 | *** |
| Resistance | −0.21 | 0.16 | −0.29 | 0.11 | *** | 0.19 | 0.28 | ||
| Tolerance | 0.06 | 0.08 | 0.11 | 0.10 | 0.19 | 0.12 | |||
| Bitter | 1.82 | 0.19 | *** | 1.75 | 0.15 | *** | 1.49 | 0.11 | *** |
| Sweet | 0.07 | 0.11 | 0.01 | 0.23 | −0.08 | 0.09 | |||
| Tau | 0.60 | 0.09 | *** | 0.57 | 0.08 | *** | 0.35 | 0.08 | *** |
| Gamma | 0.24 | 0.18 | 0.00 | (FIXED) | 1.00 | (FIXED) | |||
| Observations | 16,488 | 16,488 | 16,488 | ||||||
| Chi squared | 343.11 | 465.41 | 817.56 | ||||||
| p-value | 0.00 | 0.00 | 0.00 | ||||||
| Log likelihood | −4452.19 | −4444.82 | −4464.48 | ||||||
| AIC | 8942.378 | 8925.647 | 8964.966 | ||||||
| BIC | 9088.875 | 9064.434 | 9103.753 | ||||||
Note: * p < 0.1, ** p < 0.05, *** p < 0.01.
Figure A1.
Example of a choice card N° 1 as shown to quinoa producers during the interview.

Figure A2.
Distribution of willingness to pay for yield, maturation period, mildew-resistance, mildew-tolerance, sweet, bitter and large grain attributes. Note: Authors’ elaboration.
Figure A2.
Distribution of willingness to pay for yield, maturation period, mildew-resistance, mildew-tolerance, sweet, bitter and large grain attributes. Note: Authors’ elaboration.

References
- Hellin, J.; Higman, S. Crop Diversity and Livelihood Security in the Andes. Dev. Pract. 2005, 15, 165–174. [Google Scholar] [CrossRef]
- Jacobsen, S.E.; Mujica, A.; Ortiz, R. The Global Potential for Quinoa and Other Andean Crops. Food Rev. Int. 2003, 19, 139–148. [Google Scholar] [CrossRef]
- Padulosi, S.; Amaya, K.; Jäger, M.; Gotor, E.; Rojas, W.; Valdivia, R. A Holistic Approach to Enhance the Use of Neglected and Underutilized Species: The Case of Andean Grains in Bolivia and Peru. Sustainability 2014, 6, 1283–1312. [Google Scholar] [CrossRef] [Green Version]
- Ruiz, K.B.; Biondi, S.; Oses, R.; Acuña-Rodríguez, I.S.; Antognoni, F.; Martinez-Mosqueira, E.A.; Coulibaly, A.; Canahua-Murillo, A.; Pinto, M.; Zurita-Silva, A.; et al. Quinoa Biodiversity and Sustainability for Food Security under Climate Change. A Review. Agron. Sustain. Dev. 2014, 34, 349–359. [Google Scholar] [CrossRef]
- Lester, G.E. Organic versus Conventionally Grown Produce: Quality Differences, and Guidelines for Comparison Studies. HortScience 2006, 41, 296–300. [Google Scholar]
- Ofstehage, A. The Construction of an Alternative Quinoa Economy: Balancing Solidarity, Household Needs, and Profit in San Agustín, Bolivia. Agric. Hum. Values 2012, 29, 441–454. [Google Scholar] [CrossRef]
- Bazile, D.; Bertero, D.; Nieto, C. State of the Art Report on Quinoa around the World in 2013; FAO: Rome, Italy, 2015. [Google Scholar]
- Bazile, D.; Pulvento, C.; Verniau, A.; Al-Nusairi, M.S.; Ba, D.; Breidy, J.; Hassan, L.; Mohammed, M.I.; Mambetov, O.; Otambekova, M.; et al. Worldwide Evaluations of Quinoa: Preliminary Results from Post International Year of Quinoa FAO Projects in Nine Countries. Front. Plant Sci. 2016, 7, 850. [Google Scholar] [CrossRef] [PubMed] [Green Version]
- Zurita-Silva, A.; Fuentes, F.; Zamora, P.; Jacobsen, S.E.; Schwember, A.R. Breeding Quinoa (Chenopodium Quinoa Willd.): Potential and Perspectives. Mol. Breed. 2014, 34, 13–30. [Google Scholar] [CrossRef]
- Nowak, V.; Du, J.; Charrondière, U.R. Assessment of the Nutritional Composition of Quinoa (Chenopodium Quinoa Willd.). Food Chem. 2016, 193, 47–54. [Google Scholar] [CrossRef] [PubMed]
- Escuredo, O.; González Martín, M.I.; Wells Moncada, G.; Fischer, S.; Hernández Hierro, J.M. Amino Acid Profile of the Quinoa (Chenopodium quinoa Willd.) Using near Infrared Spectroscopy and Chemometric Techniques. J. Cereal Sci. 2014, 60, 67–74. [Google Scholar] [CrossRef]
- Elgeti, D.; Nordlohne, S.D.; Föste, M.; Besl, M.; Linden, M.H.; Heinz, V.; Jekle, M.; Becker, T. Volume and Texture Improvement of Gluten-Free Bread Using Quinoa White Flour. J. Cereal Sci. 2014, 59, 41–47. [Google Scholar] [CrossRef]
- Alvarez-Jubete, L.; Arendt, E.K.; Gallagher, E. Nutritive Value of Pseudocereals and Their Increasing Use as Functional Gluten-Free Ingredients. Trends Food Sci. Technol. 2010, 21, 106–113. [Google Scholar] [CrossRef]
- Simnadis, T.G.; Tapsell, L.C.; Beck, E.J. Physiological Effects Associated with Quinoa Consumption and Implications for Research Involving Humans: A Review. Plant Foods Hum. Nutr. 2015, 70, 238–249. [Google Scholar] [CrossRef] [PubMed]
- Jacobsen, S.-E. The Worldwide Potential for Quinoa (Chenopodium quinoa Willd.). Food Rev. Int. 2003, 19, 167–177. [Google Scholar] [CrossRef]
- Danielsen, S.; Munk, L. Evaluation of Disease Assessment Methods in Quinoa for Their Ability to Predict Yield Loss Caused by Downy Mildew. Crop Prot. 2004, 23, 219–228. [Google Scholar] [CrossRef]
- Sibiya, J.; Tongoona, P.; Derera, J.; Makandaa, I. Farmers’ Desired Traits and Selection Criteria for Maize Varieties and Their Implications for Maize Breeding: A Case Study from Kwazulu-Natal Province, South Africa. J. Agric. Rural Dev. Trop. Subtrop. 2013, 114, 39–49. [Google Scholar]
- Kassie, G.T.; Abdulai, A.; Greene, W.H.; Shiferaw, B.; Abate, T.; Tarekegne, A.; Sutcliffe, C. Modeling Preference and Willingness to Pay for Drought Tolerance (DT) in Maize in Rural Zimbabwe. World Dev. 2017, 94, 465–477. [Google Scholar] [CrossRef] [PubMed]
- Sánchez-Toledano, B.I.; Kallas, Z.; Gil-Roig, J.M. Farmer Preference for Improved Corn Seeds in Chiapas, Mexico: A Choice Experiment Approach. Span. J. Agric. Res. 2017, 15, e0116. [Google Scholar] [CrossRef]
- Smale, M.; Diressie, M.T.; Birol, E. Understanding the Potential for Adoption of High-Iron Varieties of Pearl Millet in Maharashtra, India: What Explains Their Popularity? Food Secur. 2016, 8, 331–344. [Google Scholar] [CrossRef]
- Lambrecht, I.; Vranken, L.; Merckx, R.; Vanlauwe, B.; Maertens, M. Ex Ante Appraisal of Agricultural Research and Extension: A Choice Experiment on Climbing Beans in Burundi. Outlook Agric. 2015, 44, 61–67. [Google Scholar] [CrossRef] [Green Version]
- Ward, P.S.; Ortega, D.L.; Spielman, D.J.; Singh, V. Heterogeneous Demand for Drought-Tolerant Rice: Evidence from Bihar, India. World Dev. 2014, 64, 125–139. [Google Scholar] [CrossRef]
- Asrat, S.; Yesuf, M.; Carlsson, F.; Wale, E. Farmers’ Preferences for Crop Variety Traits: Lessons for on-Farm Conservation and Technology Adoption. Ecol. Econ. 2010, 69, 2394–2401. [Google Scholar] [CrossRef]
- MINAGRI. Ministry of agriculture and Irrigation. Time Series of Agricultural Production. Available online: http://frenteweb.minagri.gob.pe/sisca/?mod=consulta_cult (accessed on 10 March 2018).
- Apaza, V.; Cáceres, G.; Estrada, R.; Pinedo, R. Catalogue of Commercial Varieties of Quinoa in Perú; FAO: Rome, Italy, 2015. [Google Scholar]
- Bedoya-Perales, N.S.; Pumi, G.; Mujica, A.; Talamini, E.; Padula, A.D. Quinoa Expansion in Peru and Its Implications for Land Use Management. Sustainability 2018, 10, 532. [Google Scholar] [CrossRef]
- Jacobsen, S.-E.; Mujica, A.; Jensen, C.R. The Resistance of Quinoa (Chenopodium quinoa Willd.) to Adverse Abiotic Factors. Food Rev. Int. 2003, 19, 99–109. [Google Scholar] [CrossRef]
- Bazile, D.; Jacobsen, S.-E.; Verniau, A. The Global Expansion of Quinoa: Trends and Limits. Front. Plant Sci. 2016, 7, 622. [Google Scholar] [CrossRef] [PubMed] [Green Version]
- Gomez-Pando, L.R.; Eguiluz-de la Barra, A. Developing Genetic Variability of Quinoa (Chenopodium quinoa Willd.) with Gamma Radiation for Use in Breeding Programs. Am. J. Plant Sci. 2013, 4, 349–355. [Google Scholar] [CrossRef]
- Mujica, A. Granos y Leguminosas Andinas. In Cultivos Marginados: Otra Perspectiva de 1492; Hernández Bermejo, J.E., León, J., Eds.; FAO: Rome, Italy, 1992; pp. 129–146. [Google Scholar]
- Bojanic, A. La Quinua: Cultivo Milenario Para Contribuir a La Seguridad Alimentaria Mundial; FAO: Rome, Italy, 2011. [Google Scholar]
- Repo-Carrasco, R.; Espinoza, C.; Jacobsen, S.-E. Nutritional Value and Use of the Andean Crops Quinoa (Chenopodium quinoa) and Kañiwa (Chenopodium pallidicaule). Food Rev. Int. 2003, 19, 179–189. [Google Scholar] [CrossRef]
- Jacobsen, S.E. The Situation for Quinoa and Its Production in Southern Bolivia: From Economic Success to Environmental Disaster. J. Agron. Crop Sci. 2011, 197, 390–399. [Google Scholar] [CrossRef]
- MIDIS. Mapa de Vulnerabilidad a La Inseguridad Alimentaria 2012; MIDIS: Lima, Perú, 2012. [Google Scholar]
- INEI. National Institute of Statistics and Informatics. National Survey of Strategic Programs (ENAPRES). Available online: http://iinei.inei.gob.pe/microdatos/ (accessed on 3 January 2018).
- DRAJ. Regional Direction of Agricultur of Junin. Time Series of Agricultural Production. Available online: http://www.agrojunin.gob.pe/?page_id=356 (accessed on 3 June 2018).
- Tapia, M.E.; Fries, A.M. Guía de Campo de Los Cultivos Andinos; FAO and ANPE: Lima, Perú, 2007.
- Rojas, W.; Pinto, M.; Alanoca, C.; Gómez Pando, L.; Leon-Lobos, P.; Alercia, A.; Diulgheroff, S.; Padulosi, S.; Bazile, D. Quinoa Genetic Resources and Ex Situ Conservation. In State of the Art Report on Quinoa around the World in 2013; FAO: Rome, Italy, 2015; pp. 56–82. [Google Scholar]
- Lancsar, E.; Fiebig, D.G.; Hole, A.R. Discrete Choice Experiments: A Guide to Model Specification, Estimation and Software. Pharmacoeconomics 2017, 35, 697–716. [Google Scholar] [CrossRef] [PubMed]
- Lancaster, K. A New Approach to Consumer Theory. Chic. J. 1966, 74, 132–157. [Google Scholar] [CrossRef]
- Louviere, J.J.; Flynn, T.N.; Carson, R.T. Discrete Choice Experiments Are Not Conjoint Analysis. J. Choice Model. 2010, 3, 57–72. [Google Scholar] [CrossRef]
- McFadden, D. Conditional Logit Analysis of Qualitative Choice Behavior. In Frontiers in Econometrics; Zarembka, P., Ed.; Academic Press: New York, NY, USA, 1973; pp. 105–142. [Google Scholar]
- Alfnes, F.; Guttormsen, A.G.; Steine, G.; Kolstad, K. Consumers’ Willingness to Pay for the Color of Salmon: A Choice Experiment with Real Economic Incentives. Am. J. Agric. Econ. 2006, 88, 1050–1061. [Google Scholar] [CrossRef]
- Loureiro, M.L.; Umberger, W.J. A Choice Experiment Model for Beef: What US Consumer Responses Tell Us about Relative Preferences for Food Safety, Country-of-Origin Labeling and Traceability. Food Policy 2007, 32, 496–514. [Google Scholar] [CrossRef]
- Ochieng, D.O.; Veettil, P.C.; Qaim, M. Farmers’ Preferences for Supermarket Contracts in Kenya. Food Policy 2017, 68, 100–111. [Google Scholar] [CrossRef]
- Van den Broeck, G.; Van Hoyweghen, K.; Maertens, M. Employment Conditions in the Senegalese Horticultural Export Industry: A Worker Perspective. Dev. Policy Rev. 2016, 34, 301–319. [Google Scholar] [CrossRef]
- Meemken, E.M.; Veettil, P.C.; Qaim, M. Toward Improving the Design of Sustainability Standards—A Gendered Analysis of Farmers’ Preferences. World Dev. 2017, 99, 285–298. [Google Scholar] [CrossRef]
- Ibnu, M.; Glasbergen, P.; Offermans, A.; Arifin, B. Farmer Preferences for Coffee Certification: A Conjoint Analysis of the Indonesian Smallholders. J. Agric. Sci. 2015, 7, 20–35. [Google Scholar] [CrossRef]
- Fiebig, D.G.; Keane, M.P.; Louviere, J.; Wasi, N. The Generalized Multinomial Logit Model: Accounting for Scale and Coefficient Heterogeneity. Mark. Sci. 2010, 29, 393–421. [Google Scholar] [CrossRef]
- Dalemans, F.; Muys, B.; Verwimp, A.; Van den Broeck, G.; Bohra, B.; Sharma, N.; Gowda, B.; Tollens, E.; Maertens, M. Redesigning Oilseed Tree Biofuel Systems in India. Energy Policy 2018, 115, 631–643. [Google Scholar] [CrossRef]
- Keane, M.; Wasi, N. Comparing Alternative Models of Heterogeneity in Consumer Choice Behavior. J. Appl. Econom. 2013, 28, 1018–1045. [Google Scholar] [CrossRef]
- Bickel, G.; Nord, M.; Price, C.; Hamilton, W.; Cook, J. Guide to Measuring Household Food Security Revised 2000; USDA: Washington, DC, USA, 2000.
- Lele, U.; Masters, W.A.; Kinabo, J.; Meenakshi, J.V.; Ramaswami, B.; Tagwireyi, J.; Goswami, S. Measuring Food and Nutrition Security: An Independent Technical Assessment and User’s Guide for Existing Indicators; FAO: Rome, Italy, 2016. [Google Scholar]
- Shiferaw, B.; Kassie, M.; Jaleta, M.; Yirga, C. Adoption of Improved Wheat Varieties and Impacts on Household Food Security in Ethiopia. Food Policy 2014, 44, 272–284. [Google Scholar] [CrossRef]
- Khonje, M.; Manda, J.; Alene, A.D.; Kassie, M. Analysis of Adoption and Impacts of Improved Maize Varieties in Eastern Zambia. World Dev. 2015, 66, 695–706. [Google Scholar] [CrossRef]
Figure 1.
Export volume and export price of Peruvian quinoa. Source: Authors’ elaboration from Ministry of Agriculture and Irrigation (MINAGRI) [24], over 2000–2017.
Figure 1.
Export volume and export price of Peruvian quinoa. Source: Authors’ elaboration from Ministry of Agriculture and Irrigation (MINAGRI) [24], over 2000–2017.

Figure 2.
Evolution of quinoa area harvested and production in Peru in traditional quinoa-producing (TP) regions and secondary and new producing (SNP) regions. Source: Authors’ elaboration from MINAGRI, over 1991–2016
Figure 2.
Evolution of quinoa area harvested and production in Peru in traditional quinoa-producing (TP) regions and secondary and new producing (SNP) regions. Source: Authors’ elaboration from MINAGRI, over 1991–2016

Table 1.
Quinoa seed attributes and attribute levels used in the choice experiment.
| Attribute | Levels | Dummy Coding |
|---|---|---|
| Seed price | 4 PEN/kg | Continuous variable |
| 9 PEN/kg (SQ) | ||
| 14 PEN/kg | ||
| 24 PEN/kg | ||
| 34 PEN/kg | ||
| 40 PEN/kg | ||
| Grain size | Small (SQ) | 0 |
| Large | 1 | |
| Susceptibility to mildew | Susceptible (SQ) | MD1 = 0; MD2 = 0 |
| Tolerance | MD1 = 0; MD2 = 1 | |
| Resistance | MD1 = 1; MD2 = 0 | |
| Maturation period | 4 months | Continuous variable |
| 5 months | ||
| 6 months (SQ) | ||
| Yield | 1 tons/ha | Continuous variable |
| 2 tons/ha (SQ) | ||
| 3 tons/ha | ||
| 4 tons/ha | ||
| 5 tons/ha | ||
| 6 tons/ha | ||
| Saponin content | High level (bitter) | SC1 = 1; SC2 = 0 |
| Low content (semi-sweet) (SQ) | SC1 = 0; SC2 = 0 | |
| Without saponin (sweet) | SC1 = 0; SC2 = 1 |
Note: SQ: Status quo; MD: Mildew; SC: Saponin content.
Table 2.
Household and farm characteristics by food security status.
| Full Sample | Food Insecure Households | Food Secure Households | p-Value | |||||
|---|---|---|---|---|---|---|---|---|
| Mean | SD | Mean | SD | Mean | SD | |||
| Household head characteristics | ||||||||
| Age (year) | 50.42 | 13.25 | 49.71 | 12.79 | 50.72 | 13.45 | 0.454 | |
| Education level | ||||||||
| Primary education | 0.21 | 0.27 | 0.18 | 0.028 | *** | |||
| Secondary education | 0.49 | 0.47 | 0.50 | 0.529 | ||||
| Technical/university education | 0.22 | 0.14 | 0.25 | 0.007 | *** | |||
| Female head (dummy) | 0.13 | 0.11 | 0.14 | 0.354 | ||||
| Household characteristics | ||||||||
| Household size total | 3.74 | 1.52 | 4.03 | 1.50 | 3.62 | 1.51 | 0.008 | *** |
| Household size children | 1.09 | 1.20 | 1.33 | 1.27 | 0.98 | 1.16 | 0.005 | *** |
| Organization member (dummy) | 0.19 | 0.12 | 0.22 | 0.020 | ** | |||
| Net income 2014 | 20,435 | 45,242 | 8414 | 14,068 | 25,619 | 52,515 | 0.000 | *** |
| Net income per capita | 6442 | 14,236 | 2422 | 4385 | 8176 | 16,494 | 0.000 | *** |
| Net income per adult equivalent | 10,084 | 21,672 | 4042 | 7048 | 12,690 | 25,079 | 0.000 | *** |
| Poor household MPI 1 (dummy) | 0.07 | 0.15 | 0.03 | 0.000 | *** | |||
| Off-farm employment (dummy) | 0.11 | 0.05 | 0.00 | 0.13 | 0.00 | 0.008 | *** | |
| Farm characteristics | ||||||||
| Farm size (ha) | 4.65 | 6.04 | 2.56 | 2.57 | 5.56 | 6.84 | 0.000 | *** |
| Number of crops | 3.60 | 1.51 | 3.33 | 1.42 | 3.73 | 1.53 | 0.009 | ** |
| Number of tropical livestock units | 3.42 | 5.24 | 3.04 | 5.66 | 3.58 | 5.05 | 0.309 | |
| Quinoa area (ha) | 1.85 | 2.88 | 1.02 | 1.19 | 2.20 | 3.30 | 0.000 | *** |
| Specialization a | 0.43 | 0.24 | 0.44 | 0.24 | 0.42 | 0.24 | 0.387 | |
| Quinoa price (PEN/kg) | 6.86 | 2.20 | 6.49 | 2.45 | 7.02 | 2.07 | 0.026 | *** |
| Quinoa yield (kg/ha) | 2053 | 988 | 2126 | 1016 | 2022 | 975 | 0.305 | |
| Quinoa production (kg) | 4185 | 7884 | 2149 | 3178 | 5064 | 9063 | 0.000 | *** |
| Self-consumption (%) | 0.07 | 0.13 | 0.11 | 0.16 | 0.06 | 0.10 | 0.001 | *** |
| Seed-saving (%) | 0.03 | 0.05 | 0.04 | 0.06 | 0.03 | 0.05 | 0.182 | |
| Storage (%) | 0.13 | 0.27 | 0.11 | 0.24 | 0.14 | 0.28 | 0.198 | ** |
| Sell (%) | 0.76 | 0.31 | 0.75 | 0.30 | 0.76 | 0.31 | 0.620 | |
| Experience growing quinoa (year) | 10.51 | 11.09 | 8.29 | 8.79 | 11.43 | 11.80 | 0.007 | *** |
| Source of quinoa seeds | ||||||||
| from its last harvest (dummy) | 0.47 | 0.43 | 0.49 | 0.239 | ||||
| from other farmers (dummy) | 0.46 | 0.51 | 0.44 | 0.170 | ||||
| buying from INIA b (dummy) | 0.05 | 0.06 | 0.05 | 0.835 | ||||
| Use of Insecticide (dummy) | 0.69 | 0.76 | 0.66 | 0.037 | ** | |||
| Use of Fungicide (dummy) | 0.81 | 0.79 | 0.82 | 0.522 | ||||
| Mildew problem (dummy) | 0.82 | 0.78 | 0.84 | 0.164 | ||||
| Experience of frost | 0.40 | 0.40 | 0.41 | |||||
| Extension on quinoa (dummy) | 0.26 | 0.18 | 0.29 | 0.0116 | *** | |||
| Observations (number) | 458 | 138 | 320 | |||||
Note: T-tests are used to test differences between food secure and food insecure households. Significant differences are indicated with ** p < 0.05, *** p < 0.01. a Specialization is measured as the ratio of the surface devoted to quinoa area and its total surface cultivated, both measured in hectares. b INIA: National Institute of Agricultural Innovation. 1 The Multidimensional Poverty Index (MPI) identifies multiple deprivations at the household level in health, education and standard of living and it was developed by the United Nations in 2010. Each household is assigned a deprivation score according to his deprivations in each of the 10 component indicators. The maximum deprivation score is 100 percent, with each dimension equally weighted. The health dimension has two indicators, nutrition and mortality, in which indicator is worth 16.7 percent. The education dimension has two indicators, years of schooling and child attendance to school, in with each indicator is worth 16.7 percent. The standard of living dimension has six indicators: cooking fuel, sanitation, water, electricity, floor and assets, in which indicator is worth 5.6 percent. Each household is classified as poor if the deprivation score is 33.3 percent or higher.
Table 3.
Generalized multinomial logit model estimates.
| Full Sample | Food Insecure Farmers | Food Secure Farmers | |||||||
|---|---|---|---|---|---|---|---|---|---|
| Mean | SE | Mean | SE | Mean | SE | ||||
| Parameters | |||||||||
| Seed price (PEN/kg) | −0.019 | 0.002 | *** | −0.027 | 0.009 | *** | -0.016 | 0.003 | *** |
| ASC | −0.724 | 0.109 | *** | −0.740 | 0.223 | *** | -0.741 | 0.138 | *** |
| Yield (ton) | 0.971 | 0.060 | *** | 0.991 | 0.224 | *** | 0.946 | 0.122 | *** |
| Maturation period (months) | −0.061 | 0.027 | ** | −0.076 | 0.058 | -0.063 | 0.032 | ** | |
| Large grain a | 0.184 | 0.060 | *** | 0.207 | 0.227 | 0.189 | 0.104 | * | |
| Resistance to Mildew b | 1.528 | 0.108 | *** | 1.565 | 0.325 | *** | 1.514 | 0.178 | *** |
| Tolerance to Mildew b | 0.903 | 0.078 | *** | 1.017 | 0.196 | *** | 0.814 | 0.103 | *** |
| Bitter c | −3.308 | 0.222 | *** | −3.493 | 0.909 | *** | -3.194 | 0.451 | *** |
| Sweet c | −0.027 | 0.048 | −0.106 | 0.098 | 0.012 | 0.058 | |||
| Standard Deviations | |||||||||
| ASC | 1.231 | 0.084 | *** | 1.145 | 0.205 | *** | 1.298 | 0.112 | *** |
| Yield | 0.465 | 0.047 | *** | 0.410 | 0.151 | *** | 0.409 | 0.050 | *** |
| Maturation period | −0.127 | 0.049 | ** | 0.276 | 0.120 | ** | -0.079 | 0.063 | |
| Large grain | 0.638 | 0.088 | *** | 0.773 | 0.422 | * | 0.608 | 0.150 | *** |
| Resistance to Mildew | 0.364 | 0.120 | *** | −0.359 | 0.816 | -0.363 | 0.165 | ** | |
| Tolerance to Mildew | −0.012 | 0.072 | 0.178 | 0.322 | -0.094 | 0.083 | |||
| Bitter | 2.095 | 0.196 | *** | 2.163 | 0.640 | *** | 1.952 | 0.290 | *** |
| Sweet | 0.129 | 0.082 | 0.064 | 0.366 | -0.173 | 0.142 | |||
| τ | 0.651 | 0.067 | *** | 0.730 | 0.284 | ** | 0.653 | 0.155 | *** |
| γ | −0.483 | 0.203 | ** | −0.022 | 0.353 | -0.393 | 0.246 | ||
| Observations | 16488 | 4968 | 11520 | ||||||
| Chi squared | 386.641 | 66.485 | 155.771 | ||||||
| p-value | 0.000 | 0.000 | 0.000 | ||||||
| Log likelihood | −4425.066 | −1317.405 | −3103.917 | ||||||
| BIC | 9034.629 | 2796.514 | 6385.519 | ||||||
| AIC | 8888.132 | 2672.809 | 6245.834 | ||||||
Note: ASC, alternative specific constant (refers to traditional quinoa variety). a Reference category is a small grain. b Reference category is susceptible to Mildew. c Reference category is semi-sweet quinoa. * p < 0.1, ** p < 0.05, *** p < 0.01.
Table 4.
Willingness to pay (WTP) estimates (PEN per kilogram of quinoa).
| Attribute Level | Total | Food Insecure Farmers | Food Secure Farmers | ||||
|---|---|---|---|---|---|---|---|
| Mean | SD | Mean | SD | Mean | SD | ||
| Yield | 49.39 | 18.49 | 35.52 | 9.60 | 55.36 | 18.19 | *** |
| Maturation period | −3.62 | 3.31 | −3.01 n.s. | 5.50 | −3.89 | 1.57 | |
| Large grain | 10.06 | 20.78 | 8.00 n.s. | 18.02 | 10.95 | 21.83 | |
| Resistance to Mildew | 81.34 | 17.81 | 57.47 | 5.06 | 91.64 | 9.52 | *** |
| Tolerance to Mildew | 46.02 | 5.90 | 37.37 | 1.72 | 49.76 | 1.48 | *** |
| Bitter | −172.73 | 87.69 | −126.18 | 59.25 | −192.81 | 90.36 | *** |
| Sweet | −0.84 | 3.44 | −3.98 n.s. | 0.50 | 0.52 n.s. | 3.27 | |
| Observations | 458 | 138 | 320 | ||||
Note: WTP estimates were derived from generalized multinomial logit model parameter estimates. T-tests are used to test differences between households with food security or not. Significant differences are indicated with *** p < 0.01. n.s. Not significant.
© 2018 by the authors. Licensee MDPI, Basel, Switzerland. This article is an open access article distributed under the terms and conditions of the Creative Commons Attribution (CC BY) license (http://creativecommons.org/licenses/by/4.0/).
Share and Cite
MDPI and ACS Style
Gamboa, C.; Van den Broeck, G.; Maertens, M. Smallholders’ Preferences for Improved Quinoa Varieties in the Peruvian Andes. Sustainability 2018, 10, 3735. https://doi.org/10.3390/su10103735
AMA Style
Gamboa C, Van den Broeck G, Maertens M. Smallholders’ Preferences for Improved Quinoa Varieties in the Peruvian Andes. Sustainability. 2018; 10(10):3735. https://doi.org/10.3390/su10103735
Chicago/Turabian StyleGamboa, Cindybell, Goedele Van den Broeck, and Miet Maertens. 2018. "Smallholders’ Preferences for Improved Quinoa Varieties in the Peruvian Andes" Sustainability 10, no. 10: 3735. https://doi.org/10.3390/su10103735
Note that from the first issue of 2016, this journal uses article numbers instead of page numbers. See further details here.