Article

Life Cycle Environmental Impact of Biomass Co-Firing with Coal at a Power Plant in the Greater Houston Area

by
Raghava Rao Kommalapati
1,*,
Iqbal Hossan
2,
Venkata Sai Vamsi Botlaguduru
2,
Hongbo Du
2 and
Ziaul Huque
3
1
Center for Energy & Environmental Sustainability, and Department of Civil & Environmental Engineering, Prairie View A & M University, Prairie View, TX 77446, USA
2
Center for Energy & Environmental Sustainability, Prairie View A & M University, Prairie View, TX 77446, USA
3
Center for Energy & Environmental Sustainability, and Department of Mechanical Engineering, Prairie View A & M University, Prairie View, TX 77446, USA
*
Author to whom correspondence should be addressed.
Sustainability 2018, 10(7), 2193; https://doi.org/10.3390/su10072193
Submission received: 26 April 2018 / Revised: 12 June 2018 / Accepted: 24 June 2018 / Published: 27 June 2018

Abstract

:
Electricity generation from coal is one of the leading contributors to greenhouse gas emissions in the U.S. and has adverse effects on the environment. Biomass from forest residue can be co-fired with coal to reduce the impact of fossil-fuel power plants on the environment. W. A. Parish power plant (WAP, Richmond, TX, USA) located in the greater Houston area is the largest coal and natural gas-based power generation facility in Texas and is the subject of the current study. A life cycle assessment (LCA) study was performed with SimaPro® and IMPACT 2002+ method, for the replacement of 5%, 10%, and 15% coal (energy-basis) with forest residue at the WAP power plant in Texas. Results from the LCA study indicate that life cycle air emissions of CO2, CO, SO2, PM2.5, NOX, and VOC could reduce by 13.5%, 6.4%, 9.5%, 9.2%, 11.6%, and 7.7% respectively when 15% of coal is replaced with forest residue. Potential life cycle impact decreased across 9 mid-point impact categories of, human/aquatic toxicity, respiratory organics/inorganics, global warming, non-renewable energy, mineral extraction, aquatic acidification, and terrestrial acidification/nitrification. The potential impact across damage/end-point categories of human health, ecosystem quality, climate change, and resources reduced by 8.7%, 3.8%, 13.2%, and 14.8% respectively for 15% co-firing ratio.

1. Introduction

Coal is a major source of electricity generation, and as of 2017, accounts for 30.1% of total U.S. electricity production [1]. In Texas, about 30.6% of total electricity is generated from coal, and less than 1% is generated from biomass [2]. Coal combustion creates significant environmental impacts, and is responsible for 26.3% of total energy-related CO2 emissions during 2016 in the U.S [3]. Co-firing of biomass with coal is a valuable process modification for reducing air pollutant emissions and decreasing the overall environmental impact of coal-fired power plants [4,5,6,7,8,9]. Coal can be replaced by 15% (mass-basis) biomass in an existing power plant with only minor modifications, and co-firing with 10–25% (mass basis) biomass is possible without significant impact on heat release characteristics of most boilers [10,11]. The use of biomass in existing electricity generating units also reduces capital investment and the potential cost of the resulting renewable electricity [12]. Life Cycle Assessment (LCA), conducted according to ISO 14040, is an analytical tool that assists in the comprehensive evaluation of the total life cycle environmental impact of a product/process [13]. Several studies were reported for assessing the economic and environmental impacts of direct- and co-firing of biomass with coal from a life cycle perspective [14,15,16,17,18]. A study on LCA for direct torrefied wood co-firing at 20% co-firing ratio, showed a reduction of 12% for global warming, and 7% for acidification impact potentials [5]. Nine impact categories (acidification, ecotoxicity, eutrophication, global warming, ozone depletion, photochemical oxidation, human health-carcinogenic, non-carcinogenic, and respiratory effects) were studied in an LCA study considering the co-firing of wood pellets with coal in the Southeastern United States and observed significant reductions across all impact categories except ozone depletion [9]. The reduction in environmental impacts due to co-firing of raw and torrefied wood pellets with coal at 20% co-firing ratio in Chile were analyzed to be as high as 28–26% for acidification potential and 16–6% for global warming potential [19]. Greenhouse gas emissions on a CO2-equivalent basis were observed to reduce by 18.2% for 15% co-firing with wood residue at a 360 MW power plant, and other air pollutants such as sulfur oxides (SO2) and nitrogen oxides (NOX) reduced by 12% and 8%, respectively [20]. At present, low levels (5–15% co-firing) of co-firing are economically feasible if affordable biomass feedstocks are available [21].
Local availability of sufficient quantity of biomass is a major controlling factor for determining the cost-effectiveness of co-firing. Texas has a great resource of diverse biomass such as crop residues, logging residues and mill residues [22,23,24,25]. Logging residue, the unused portions of harvested trees left in the woods, are potentially available for co-firing including tops, limbs, and unutilized cull trees, whereas stumps are not viable due to costs being prohibitively high [22]. Total logging residue in Texas for the year 2008 is 2,906,361 t. In Northeast Texas, 50% of logging residue is from hardwood, and 50% from softwood; in Southeast Texas, 78% is from softwood and 22% from hardwood [22,23,24,25]. Currently, logging residues are either burned or left in open fields by forestland owners, as markets for logging residues are nonexistent [24]. This resource is also not utilized due to issues of harvest and transportation. Integrating forest residue in coal-fired power plants is an attractive option due to lower investment risk, low costs, and greater efficiency for reducing greenhouse gas (GHG) emissions [24,26]. The forest products industry produces considerable volumes of mill residue in the manufacturing process, and this residue can be utilized as it is clean, uniform, on-site, and low in moisture content [23]. Currently, most of the East Texas mill residue has been utilized or marketed. In Northeast Texas, 74% of mill residues came from softwood, and 26% came from hardwood; in Southeast Texas, 92% of mill residue is from softwood [23]. The current study evaluates the environmental impact of co-firing forest residue from Texas at the W. A. Parish (WAP) power plant, in Houston, TX. The eight counties of Texas which comprise the Houston-Galveston-Brazoria (HGB) ozone non-attainment area, have 18 active electricity generation facilities, of which the WAP power plant is the largest (3653 MW) [27]. WAP has eight units, of which Units 1–4 operate on natural gas and generate 1191 MW; Units 5–8 generate 2462 MW electricity with coal consumption 36,000 t/day. WAP power plant is one of the significant contributors to ozone precursor emissions in the Greater Houston area, and the leading point source for emissions of four criteria air pollutants (CO, SO2, NOX, PM2.5) during peak summer ozone episodes [27,28]. The objective of the current study is to evaluate the change in potential life cycle environmental impacts due to co-firing of forest residue biomass from Texas, at the WAP power plant in the Greater Houston area.

2. Materials and Methods

2.1. Life Cycle Assessment

A comprehensive Life Cycle Assessment (LCA) is conducted by SimaPro® 8.3.0 software and ecoinvent database is used in this analysis. IMPACT 2002+ method is used for life cycle impact assessment at both mid-point and end-point impact categories. There are three co-firing techniques commonly used: direct, indirect, and parallel co-firing [29]. Direct co-firing is taken into consideration in this study due to the lower investment requirements. Three co-firing scenarios (5%, 10%, and 15%, energy basis) are analyzed along with base case (no co-firing). This study considers a functional unit as one kWh of electricity produced in the power plant. The cradle-to-gate system boundaries are depicted in Figure 1. Biomass supply chain included bundling, forwarding, transportation, and chipping. The coal supply chain consists of two stages: coal mining and coal transportation. Biomass chipping is considered to be conducted at the power plant to account for cost and energy effectiveness reported for plants larger than 300 MW [4]. This study does not consider biomass production, as available forest residue is directly taken into account for co-firing. Harvesting of biomass is excluded from the system boundary, and biogenic carbon neutrality is assumed as in Zhang et al., (2010) [30]. In the power plant, consumption of materials and energy that are needed in excess for co-firing are excluded from system boundary, due to negligible contribution to emissions [20,31]. Thus, water consumption is assumed to be constant throughout the base- and co-firing cases.

2.2. Inventories

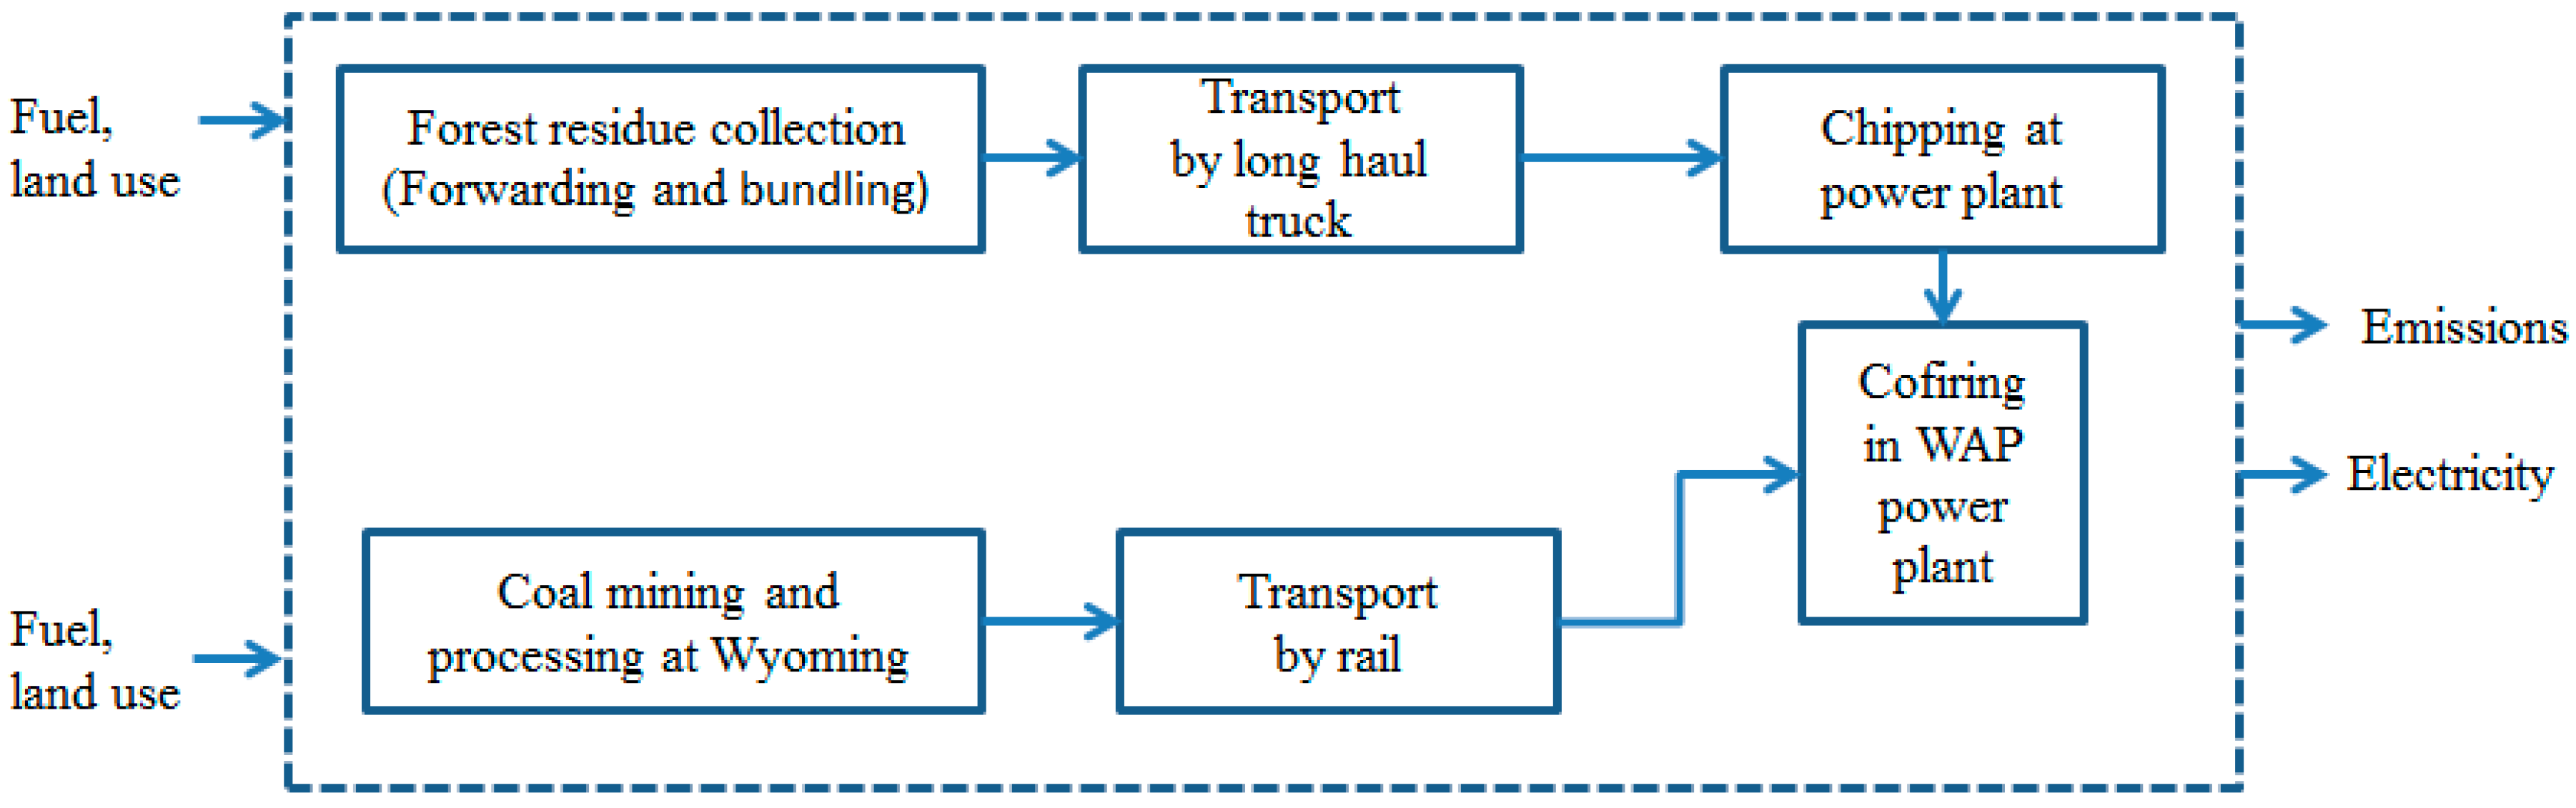
2.2.1. Biomass Collection

Logging residues are partially piled along the roadside or left dispersed in the harvesting area, and Forwarder is typically used for collection and piling of residues. The removal volume attributed to logging residues is directly related to harvesting areas. In East Texas, 43.5 t per acre were utilized while 10.1 t per acre were left as logging residue, excluding the residual stumps in 2008, that were only for trees taller than 5 inches [32]. Assuming a 20% recovery rate for trees shorter than 5 inches as per Mathison et al., (2009), an additional 0.9 t per acre was added that made total logging residue 11.0 t per acre in 2008 [32]. In this study, John Deere 1010E was considered as forwarder with an engine power of 115.5 KW. Forwarders of 80–120 kW output power (class II) with a load capacity of 10–12 t were considered, and fuel consumption was estimated as per Equation (1) [33,34]. Y is the fuel consumption (L/h), and X is the engine output power (kW). Productivity of forwarder largely depends on hauling distance and can be calculated as in Equation (2), P is productivity (m3/PMH), and L is the average hauling distance (m) [35]. It is assumed that average distance per trip is 300 m, as per Akay et al., (2004) and SimaPro input data is prepared by considering 8 h/day machine operation and lubricants consumption of 0.349 L/green t. Table 1 describes the inventory data [36]. Bulk density of biomass is relatively low and has an effect on transportation stage emissions. Bundling allows for achieving maximum bulk density, which is important for transportation and is referred to as composite residues logs (CRL) or bundles. John Deere 1490D is a common bundler for CRL operations, and the maximum productivity of John Deere 1490D bundler is 30 bundles/PMH, which consumes 3 gal/h fuel [37,38]. This bundler compacts and wraps slash into 10 ft long bundles with an average diameter of 27 inches. The volume of one bundle is approximately 0.7 m3 and average bundle weight is 0.55 t [39]. Moisture content, harvested tree species, forest residue density, forest residue arrangement, and operator skill are critical parameters for productivity of bundler [40]. Inventories for SimaPro® are prepared considering 8 h per day of operation, as described in Table 1.
  Y = ( 46.4 10 3   X ) + 7.222
  P = ( 17.0068 L 13.2533 L   )

2.2.2. Biomass Transportation and Chipping

Long haul truck is commonly used for transporting biomass from forest site to power plant, and the current study considers a long long-haul truck that can carry 41 t of biomass with fuel consumption of 0.0319 L/tonne-km (t-km), as specified in Table 2 [7,42]. There are different types of chippers that grind the residues, but a large-scale chipper that can reduce the cost, along with terminal on-site chipping is considered in the current study [43]. An open drum chipper, Biber 92 that has 358 kW power and sieve size of 50, with fuel consumption of 2.8 L/t and productivity of 25.8 t/h is used, as specified in Table 2 [43]. The higher heating values (HHV) of logging residues are 12,401 kJ/kg and 13,951 kJ/kg for hardwood and softwood, respectively [44]. The percentage of hardwood logging residues and softwood are 33.80% and 66.20%, respectively [23]. Residues collected from different counties in Texas have variable distance from the W. A. Parish (WAP) power plant, and a weighted average distance of 183.9 miles is calculated for transportation stage. Details on the counties and distances to WAP plant are provided in Table 1 and Table 2 of the Supplementary Information.

2.2.3. Coal Mining and Transportation

WAP uses powder basin river sub-bituminous (PRB) coal from Wyoming, with a moisture content of 27.66%, gross calorific value of 19,119.72 kJ/kg [45]. PRB coal has 36% of fixed carbon, 30.10% volatile matter, and 0.25% of organic sulfur. This study considers standard mining inventories from ecoinvent database in SimaPro. Fuel requirement for coal transportation was taken as the default US standard from U.S. life cycle inventory (LCI) database in SimaPro, and details of the calculation are provided in Appendix A. Diesel-powered train is selected as the mode of transportation, with diesel consumption of 0.006482 L/t-km. The inventories in Table 3 were calculated based on the distance from Wyoming to WAP power plant (1378 miles). Coal losses in the supply chain are considered to be 4% [46].

2.2.4. Co-Firing at Power Plant

The average emissions of all air pollutants for the WAP power plant was obtained from Airs Facility Subsystem (AFS) file for inventory of base case (no co-firing) operational stage emissions. AFS file was developed by Texas Commission on Environment Quality (TCEQ) and contains hourly emissions from power plant [27]. For the base case, the average emissions of CO, NH3, SO2, NOX, PM2.5, and VOC are 0.235107 kg/MWh, 0.0001467 kg/MWh, 2.142404 kg/MWh, 0.213116 kg/MWh, 0.089681 kg/MWh, and 0.006434 kg/MWh, respectively. These emissions are used as emissions from combustion stage for the base case. The amount of water and fuel were taken from SimaPro US LCI database. The CO2 emissions from coal-fired electricity production are 939 kg/MWh [30,42]. The coal amount (0.554 kg/kWh) was calculated by assuming a 34% overall efficiency and a calorific value of 19,120 kJ/kg. In this study, biomass co-firing was considered on an energy basis. If HVb is average heating value of biomass, HVC is the average heating value of coal, and Hb is the heating ratio, then biomass requirements based on the heat basis (Mb) in percentage are represented in Equation (3) [47]. Here, HVC = 19,120 kJ/kg and HVb = 13,426 kJ/kg, which gives 6.973%, 13.662%, and 20.084% on mass basis for energy basis ratios of 5%, 10%, and 15%, respectively.
  M b = H b × 1 H V b H b 100 × H V b   +   1 H b 100 H V c
More than 100 successful field demonstrations in 16 different countries have taken place for co-firing that use major type of biomass (wood, animal waste, herbaceous waste) combined with various types of coal in a pulverized fuel boiler (tangential, wall, and cyclone fired) [48,49]. The estimates for SO2 emissions reduction were 3.84% for 5% co-firing ratio (energy basis) and 6.89% for 10% co-firing (energy basis) at Albright Generating Station and Michigan City Generation Station, respectively, by using PRB coal and woody biomass [11,50]. A study conducted with wood waste co-firing with PRB coal in Michigan provided the relation (RNOx = 0.75B) of NOx emissions reduction in combustion stage, where RNOx is the NOx emissions reduction, and B is the percentage of biomass in the fuel blend (mass basis) [11]. Carbon monoxide (CO) reductions of 1% and 5% for 5% and 15% energy-based co-firing were obtained from Mann and Spath’s 2002 study that considered wood residues as biomass [20]. Another study reported 10.05% reduction of CO for 20% energy basis co-firing coal with woody biomass [19]. Decrease in particulate matters (PM) emissions was reported with co-firing of forest residue with coal, and a linear equation was developed (y = 0.9x − 1.5633, where x is the co-firing ratio, and y is the percentage reduction of emission) by considering emissions reduction as 3%, 7.31%, and 12% for 5%, 10%, and 15% co-firing, respectively. Volatile organic compounds emission reduced 11.20% for 20% co-firing of wood pellets with coal [19]. The estimates for CO2 reductions due to co-firing (9.82%, 15%, and 27.23% reduction for 10%, 20%, and 25% co-firing) were obtained from previously published studies [19,20,51,52,53]. Ammonia emissions do not have any significant change due to co-firing [51]. The inventories for base case are summarized in Table 4.

3. Results

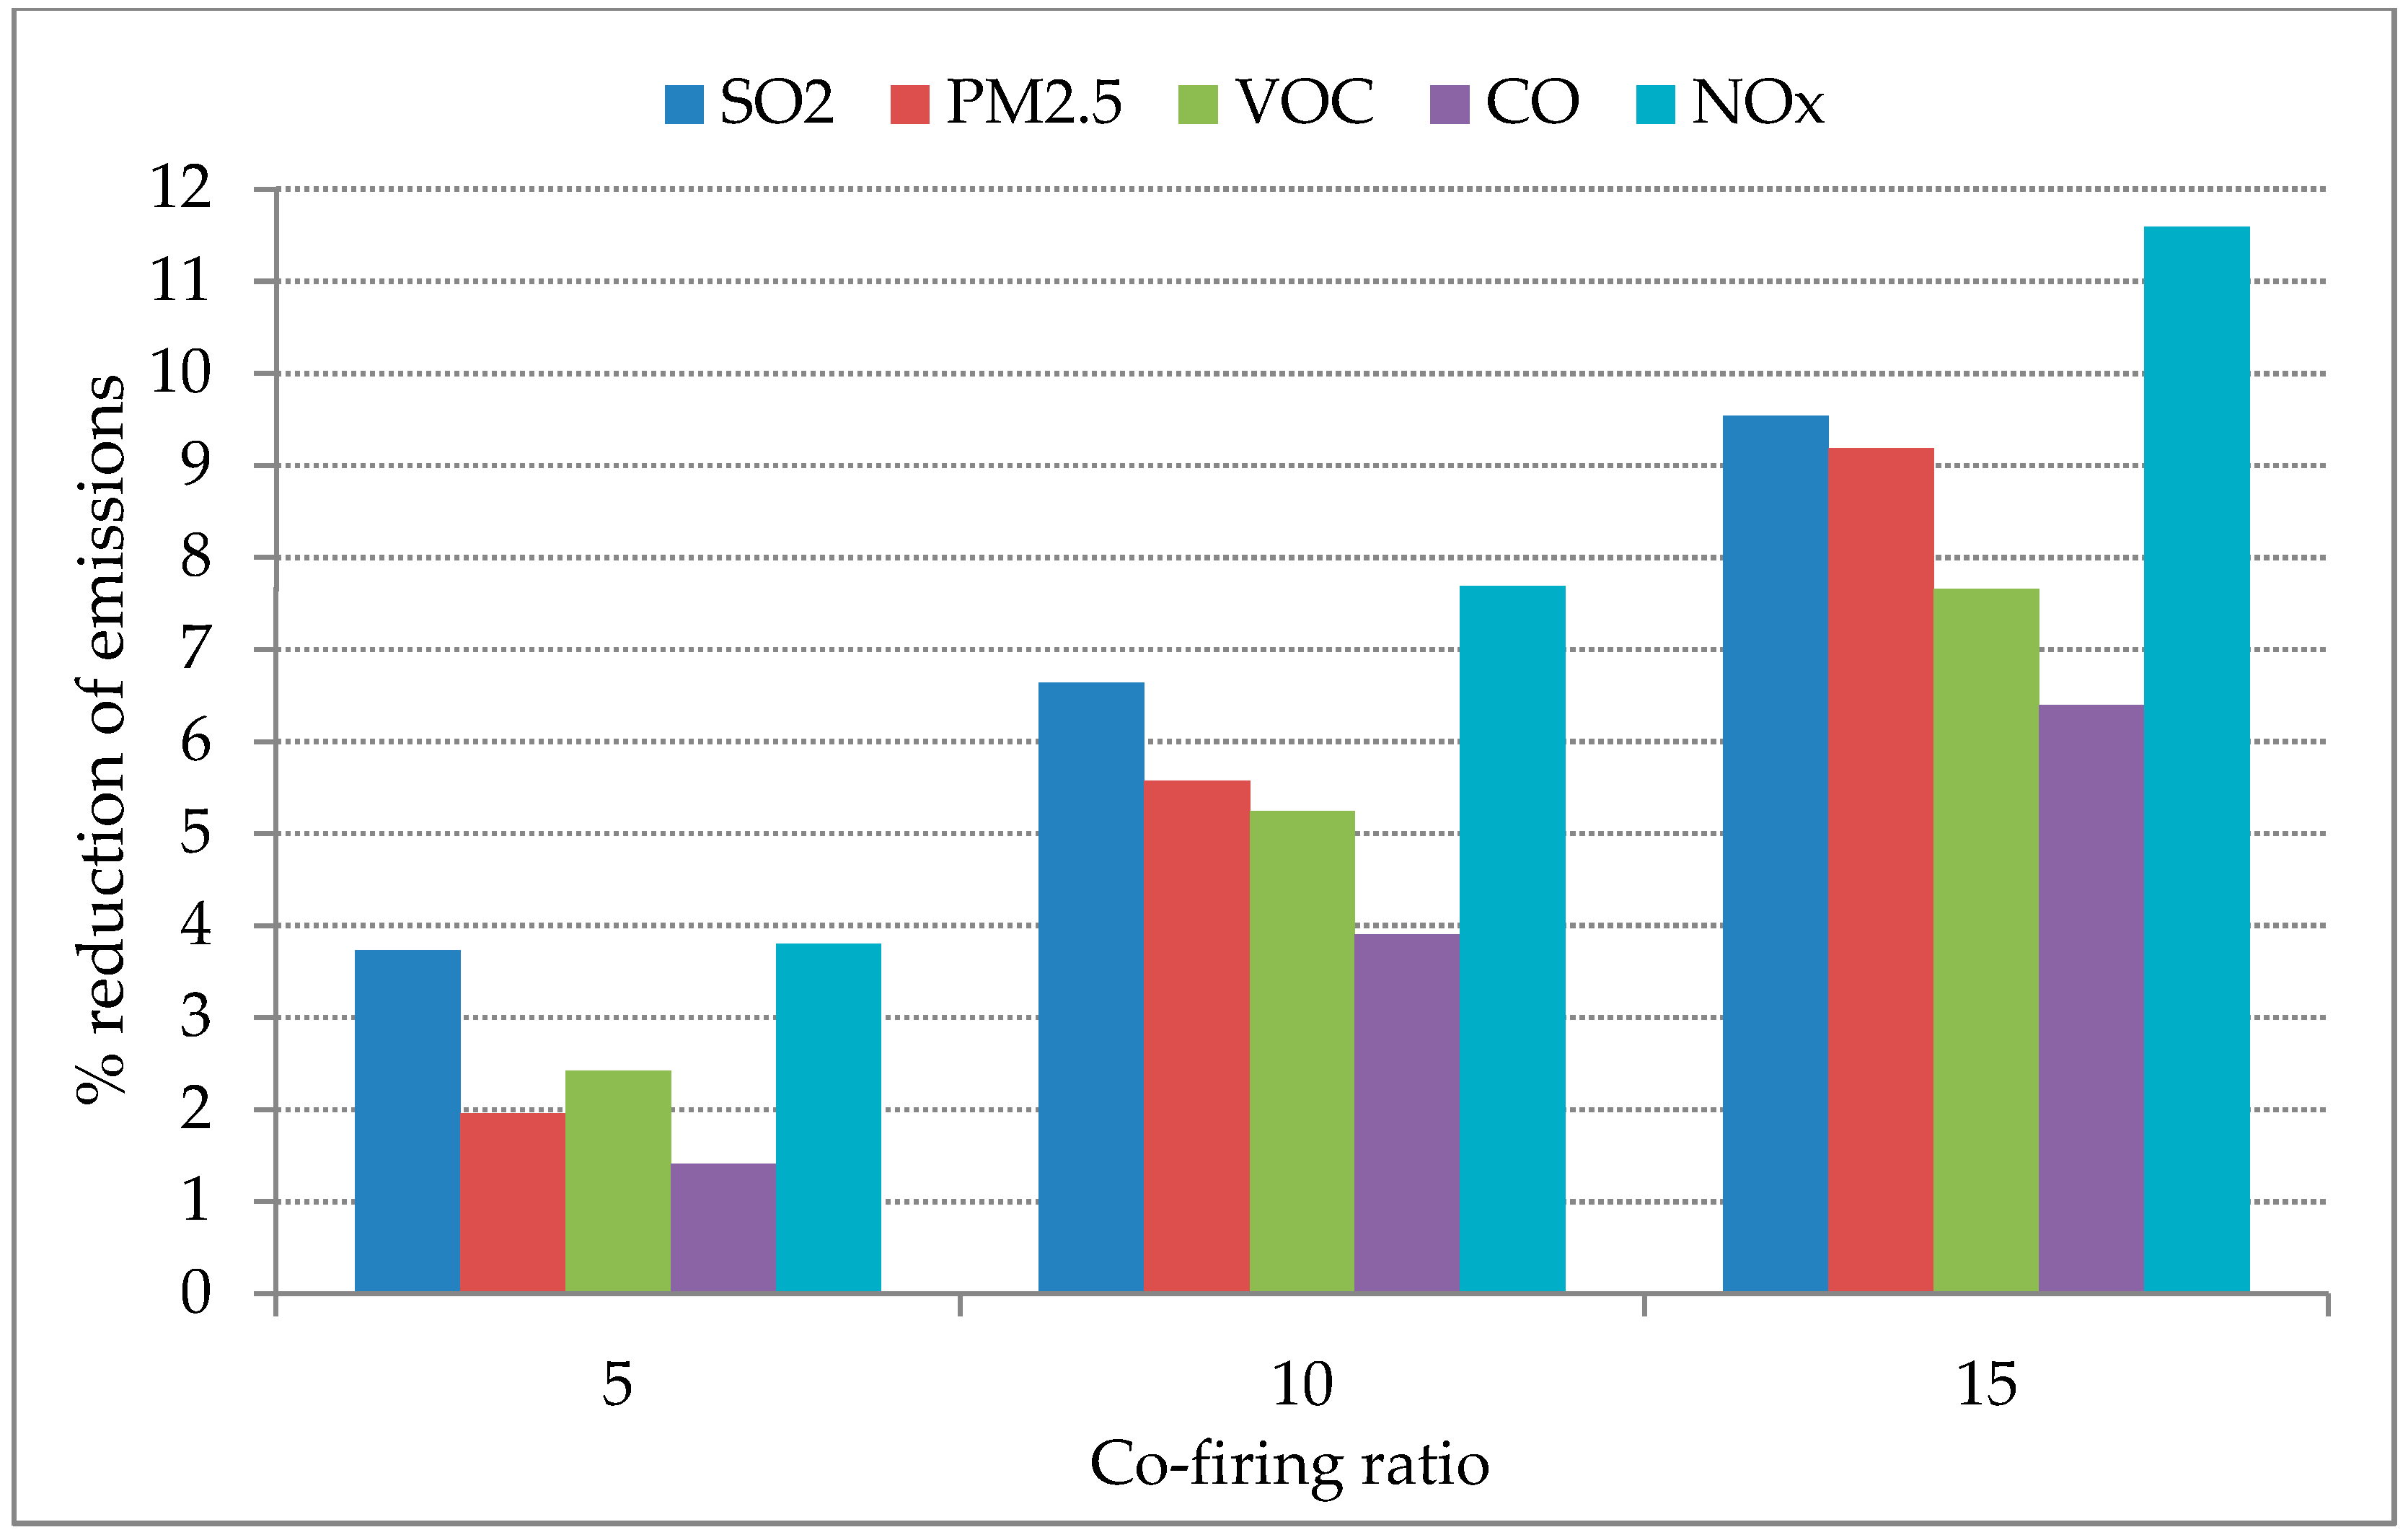
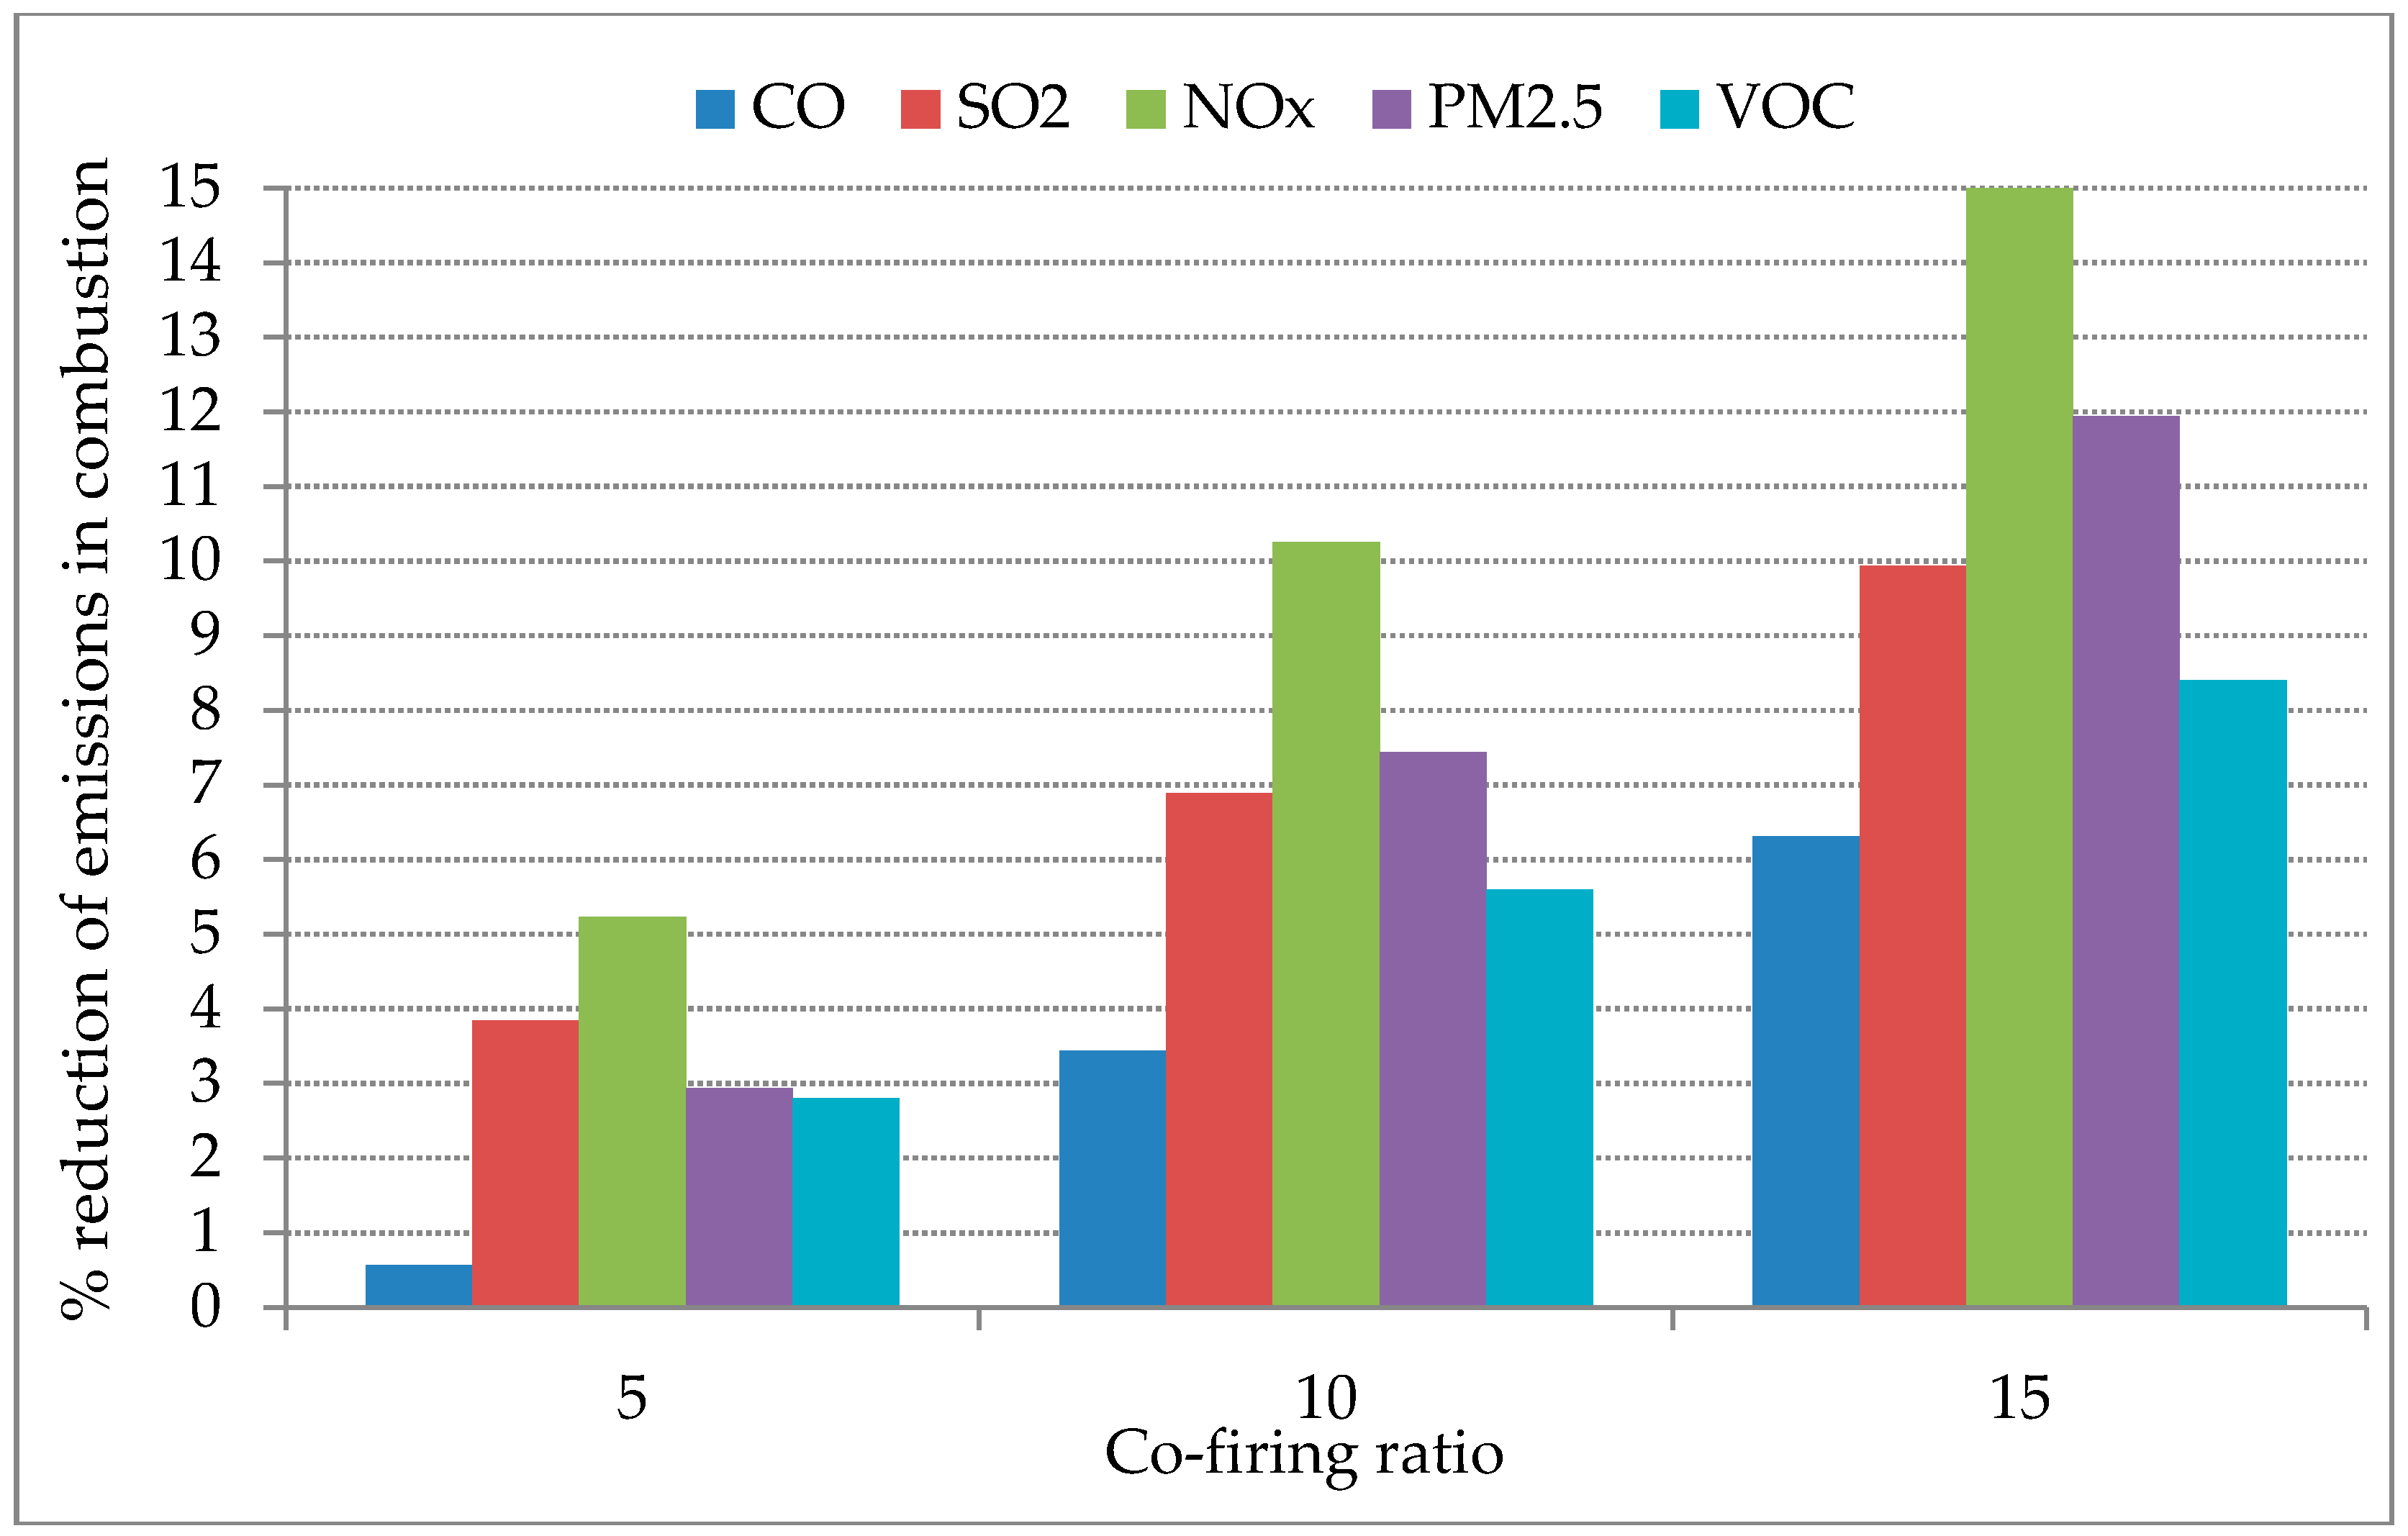
3.1. Emissions from Coal and Biomass Supply Chains

The summary of emissions from biomass and coal supply chains is presented in Table 5. Forwarding, bundling, and chipping machines use low-sulfur diesel, and the transportation process in SimaPro database uses varying grades of diesel fuel. Transporting 1 t of biomass to power plant requires 7.85 kg of diesel fuel, whereas forwarding, bundling, and chipping requires 1.0162 kg, 0.6069 kg, and 2.4679 kg, respectively. Transportation of biomass is the stage responsible for highest CO2 emissions followed by other stages of biomass handling such as chipping. The lowest CO2 emissions are from the forwarding stage. Forwarder and bundler operated over distances of 25 km and 60 km per day, respectively, that contributed to air emissions presented in Table 5 (SimaPro database). Even though diesel consumption in operational stage of bundling is lower than the forwarding stage, emissions for bundling are higher due to higher material input and more processes. Transportation emits highest CO2 followed by chipping in accordance with previous studies [4]. Carbon monoxide emissions follow a similar trend as CO2 emissions, with transportation stage being the largest contributor and forwarding stage being the lowest, as CO emissions are from incomplete combustion where the oxidation process is not stoichiometrically balanced [54].
NOx emissions are highest for transportation and lowest for bundling. A study in California noted that NOx emissions from 1 t forest biomass collection and processing are 123.64 g excluding transportation; all the off-road equipment consumed 12.5496 L of diesel for 1 t of biomass [55]. Our study shows that biomass collection and processing emits 88.8 g excluding transportation where fuel consumption by off-road equipment is 4.87 L. The difference could be due to the varying nature of forestry equipment between the two studies and geographic differences. In our study, PM2.5 is the major pollutant that needs to be analyzed. No PM10 emissions were reported for transportation stage, but emission of PMC (>2.5, and <10) was 0.904 g. Chipping emits all three sizes of particulate matter, and combined emissions are the highest source for PM. The bundling process has higher emissions for both PM10 and PMC. The dominant source of PM is the use of diesel in the biomass supply chain [56]. According to SimaPro database, the diesel selected for transportation does not result in quantifiable PM10 emissions during combustion. Sulfur dioxide emissions are also highest during transportation stage and lowest in the forwarding stage. Non-methane volatile organic compounds (NMVOC) and methane also follow the same trend as SO2. Methane emissions are about nine times higher during transportation stage compared to forwarding stage. NMVOC and methane both are lowest during forwarding of residue and highest during transportation.
Coal cleaning is part of the coal mining process and one t coal washing requires 6.52 kWh of electricity, which can be converted into 2.18 kg of coal [8]. One t of coal mining emits 63.1 kg of CO2, and transport to WAP from Wyoming emits 47.2 kg. Emissions during mining are greater than transportation for coal life cycle. Diesel combustion and electricity used in mining results in emission of 24.4 kg and 22.4 kg of CO2, respectively. The remaining process of mining emits 15.7 kg. In the case of transportation, 42.2 kg of CO2 emits from diesel consumption. The average carbon dioxide emission from 1 t-km of diesel based train is 22 g [57]. Considering this rate, 1 t of coal transportation from Wyoming to WAP should result in 44.4 kg of CO2. Gasoline combustion in the mining stage results in emission of 116 g of CO, which is the single process responsible for maximum contribution, followed by emissions from diesel consumption at the refinery. Nitrogen oxides also follow a similar trend with respect to contribution of individual stages, due to electricity obtained from bituminous coal needed for mining. SO2 emissions from transportation are lower than mining. According to this study, only PMC is emitted during coal mining and transportation, with transportation stage for 1 t coal resulting in emissions of 28.5 g of PMC. The higher emissions from transportation stage is principally due to diesel combustion by train (27.6 g). Mining of coal emits more VOC than transportation stage, but NMVOC emissions are higher in transportation stage.

3.2. Life Cycle Emissions for 1 kWh Electricity Generation

WAP power plant uses NOx control by selective catalytic reduction (SCR) system, baghouse for PM control, and flue gas desulfurization (FGD) for SO2 control. Considering these processes from SimaPro database, along with water use that is needed for cooling the system and fuel oil for start-up of the power plant, life cycle emissions are calculated and presented in Table 6. It is assumed that all these systems will remain functional for co-firing scenarios. More than 90% of emissions during the life cycle are from combustion stage. Life cycle emissions of CO2 were reported to be 1050 g/kWh, considering PC boiler, FGD, and SCR [58]. However, the varying nature of coal (sub-bituminous) that affects the carbon content is responsible for the deviation in our results. Life cycle emission of CO2 reduces by 13.45%, 8.31%, and 3.26% for 15%, 10%, and 5% co-firing, respectively, as shown in Figure 2. This result is comparable to the reduction in CO2 emissions of 8% for 10% co-firing with forest biomass as per a study in Colorado [53]. The life cycle emissions of CO reduce by 6.40%, 3.90%, and 1.41% for 15%, 10%, and 5% co-firing, which is relatively lower reduction compared to CO2 emissions. A study conducted in Vietnam with wood residue co-firing with bituminous coal reported that, for 5% and 15% co-firing ratios, CO emissions reduce by 1% and 5%, respectively [59].
NOX is a major pollutant that causes ground level ozone in the Greater Houston area. Co-firing of biomass with coal decreases life cycle emissions of NOx by 3.80%, 7.69%, and 11.59% for 5%, 10%, and 15% co-firing, respectively [28]. Biomass contains higher oxygen content and is more volatile fuel than coal. The volatile content establishes a fuel-rich zone early in the flame and leads to reduction in NOx emissions. The combustion stage is responsible only for 22.45% of NOx emissions, while coal processing and transportation accounts for the major portion. This result is in contrast to the co-firing study conducted in Vietnam, that reported that the highest NOX emissions are from combustion stage [59]. However, the discrepancy could be due to the consideration of the SCR system for NOx control in the current study that can reduce more than 80% of NOX emissions from WAP power plant [60]. Life cycle emission of SO2 reduces by 3.73%, 6.64%, and 9.54% for 5%, 10%, and 15% co-firing ratio, respectively, and the primary reason is low-sulfur content in the biomass.
Life cycle PM2.5 emission reduces by 9.19% for 15% co-firing, due to the combination of baghouses at WAP power plant and low sulfur content of biomass. Volatile organic compounds are mostly emitted from upstream processes, and life cycle VOC emissions reduced by 2.42%, 5.24%, and 7.66% for 5%, 10%, and 15% co-firing ratios, respectively. There is no significant change in ammonia emission due to co-firing, in accordance with previous studies [51]. The emissions reduction from the combustion stage, which has a direct impact on the air quality of the Greater Houston area, is depicted in Figure 3.

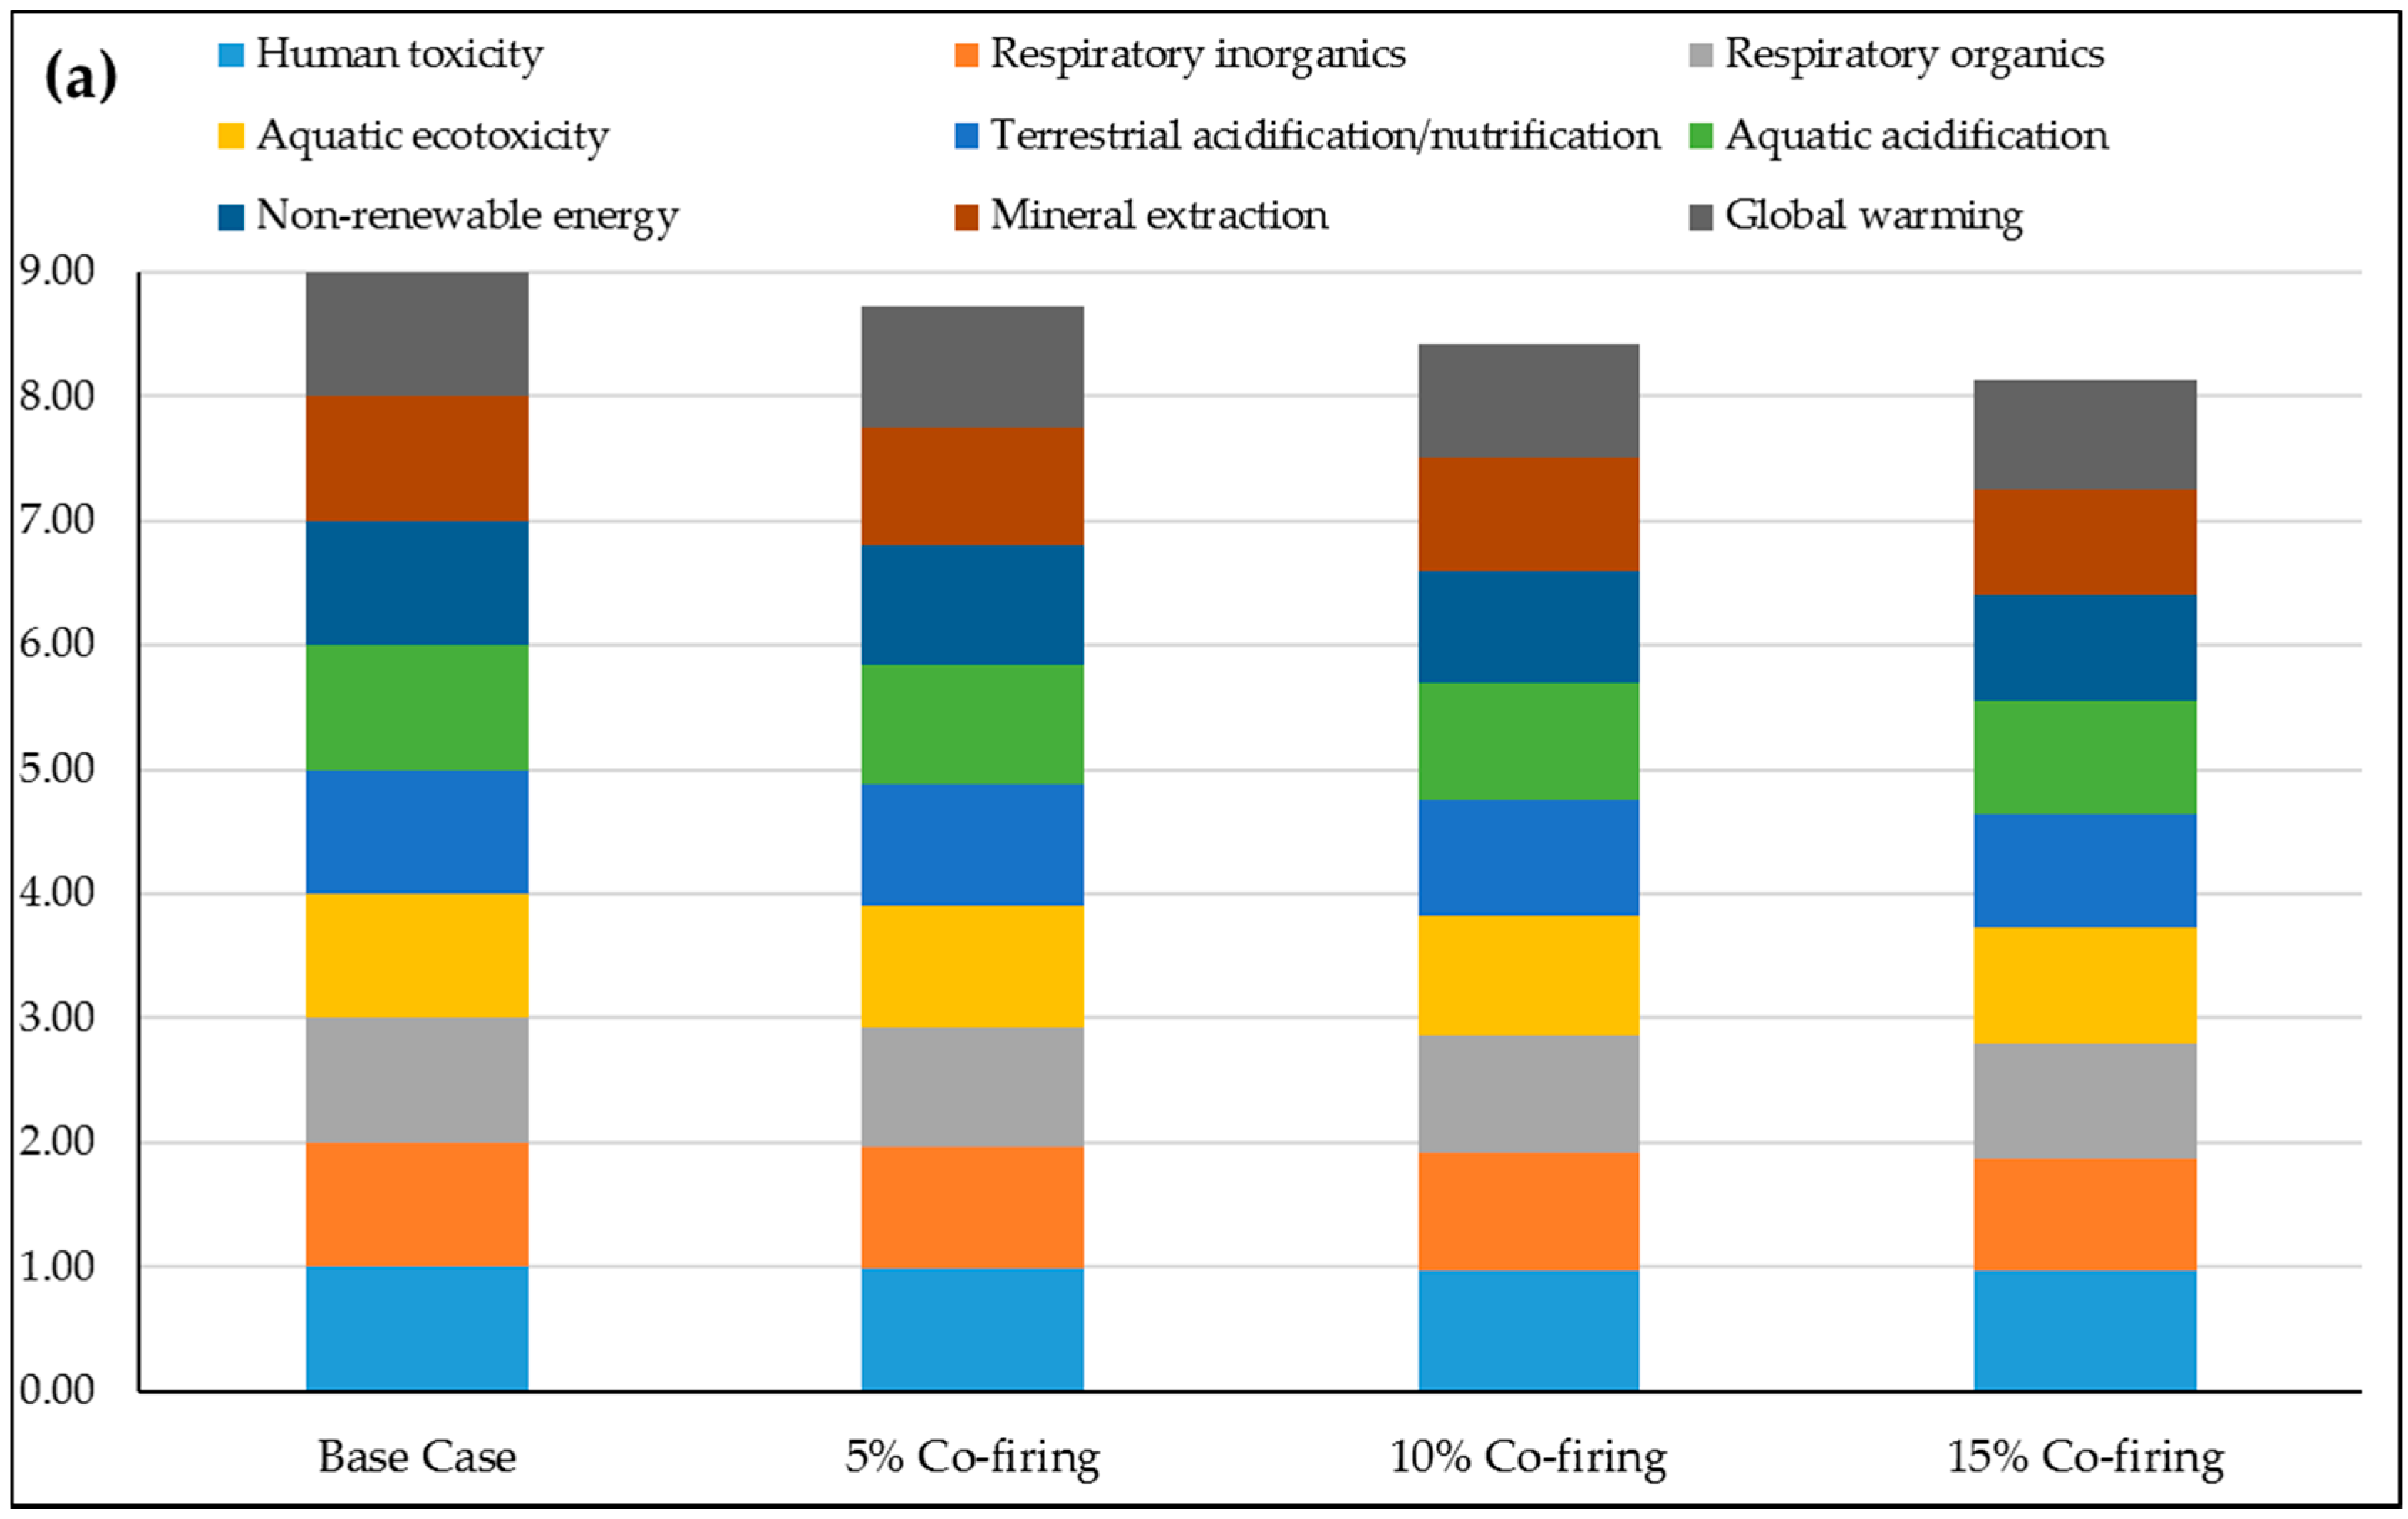
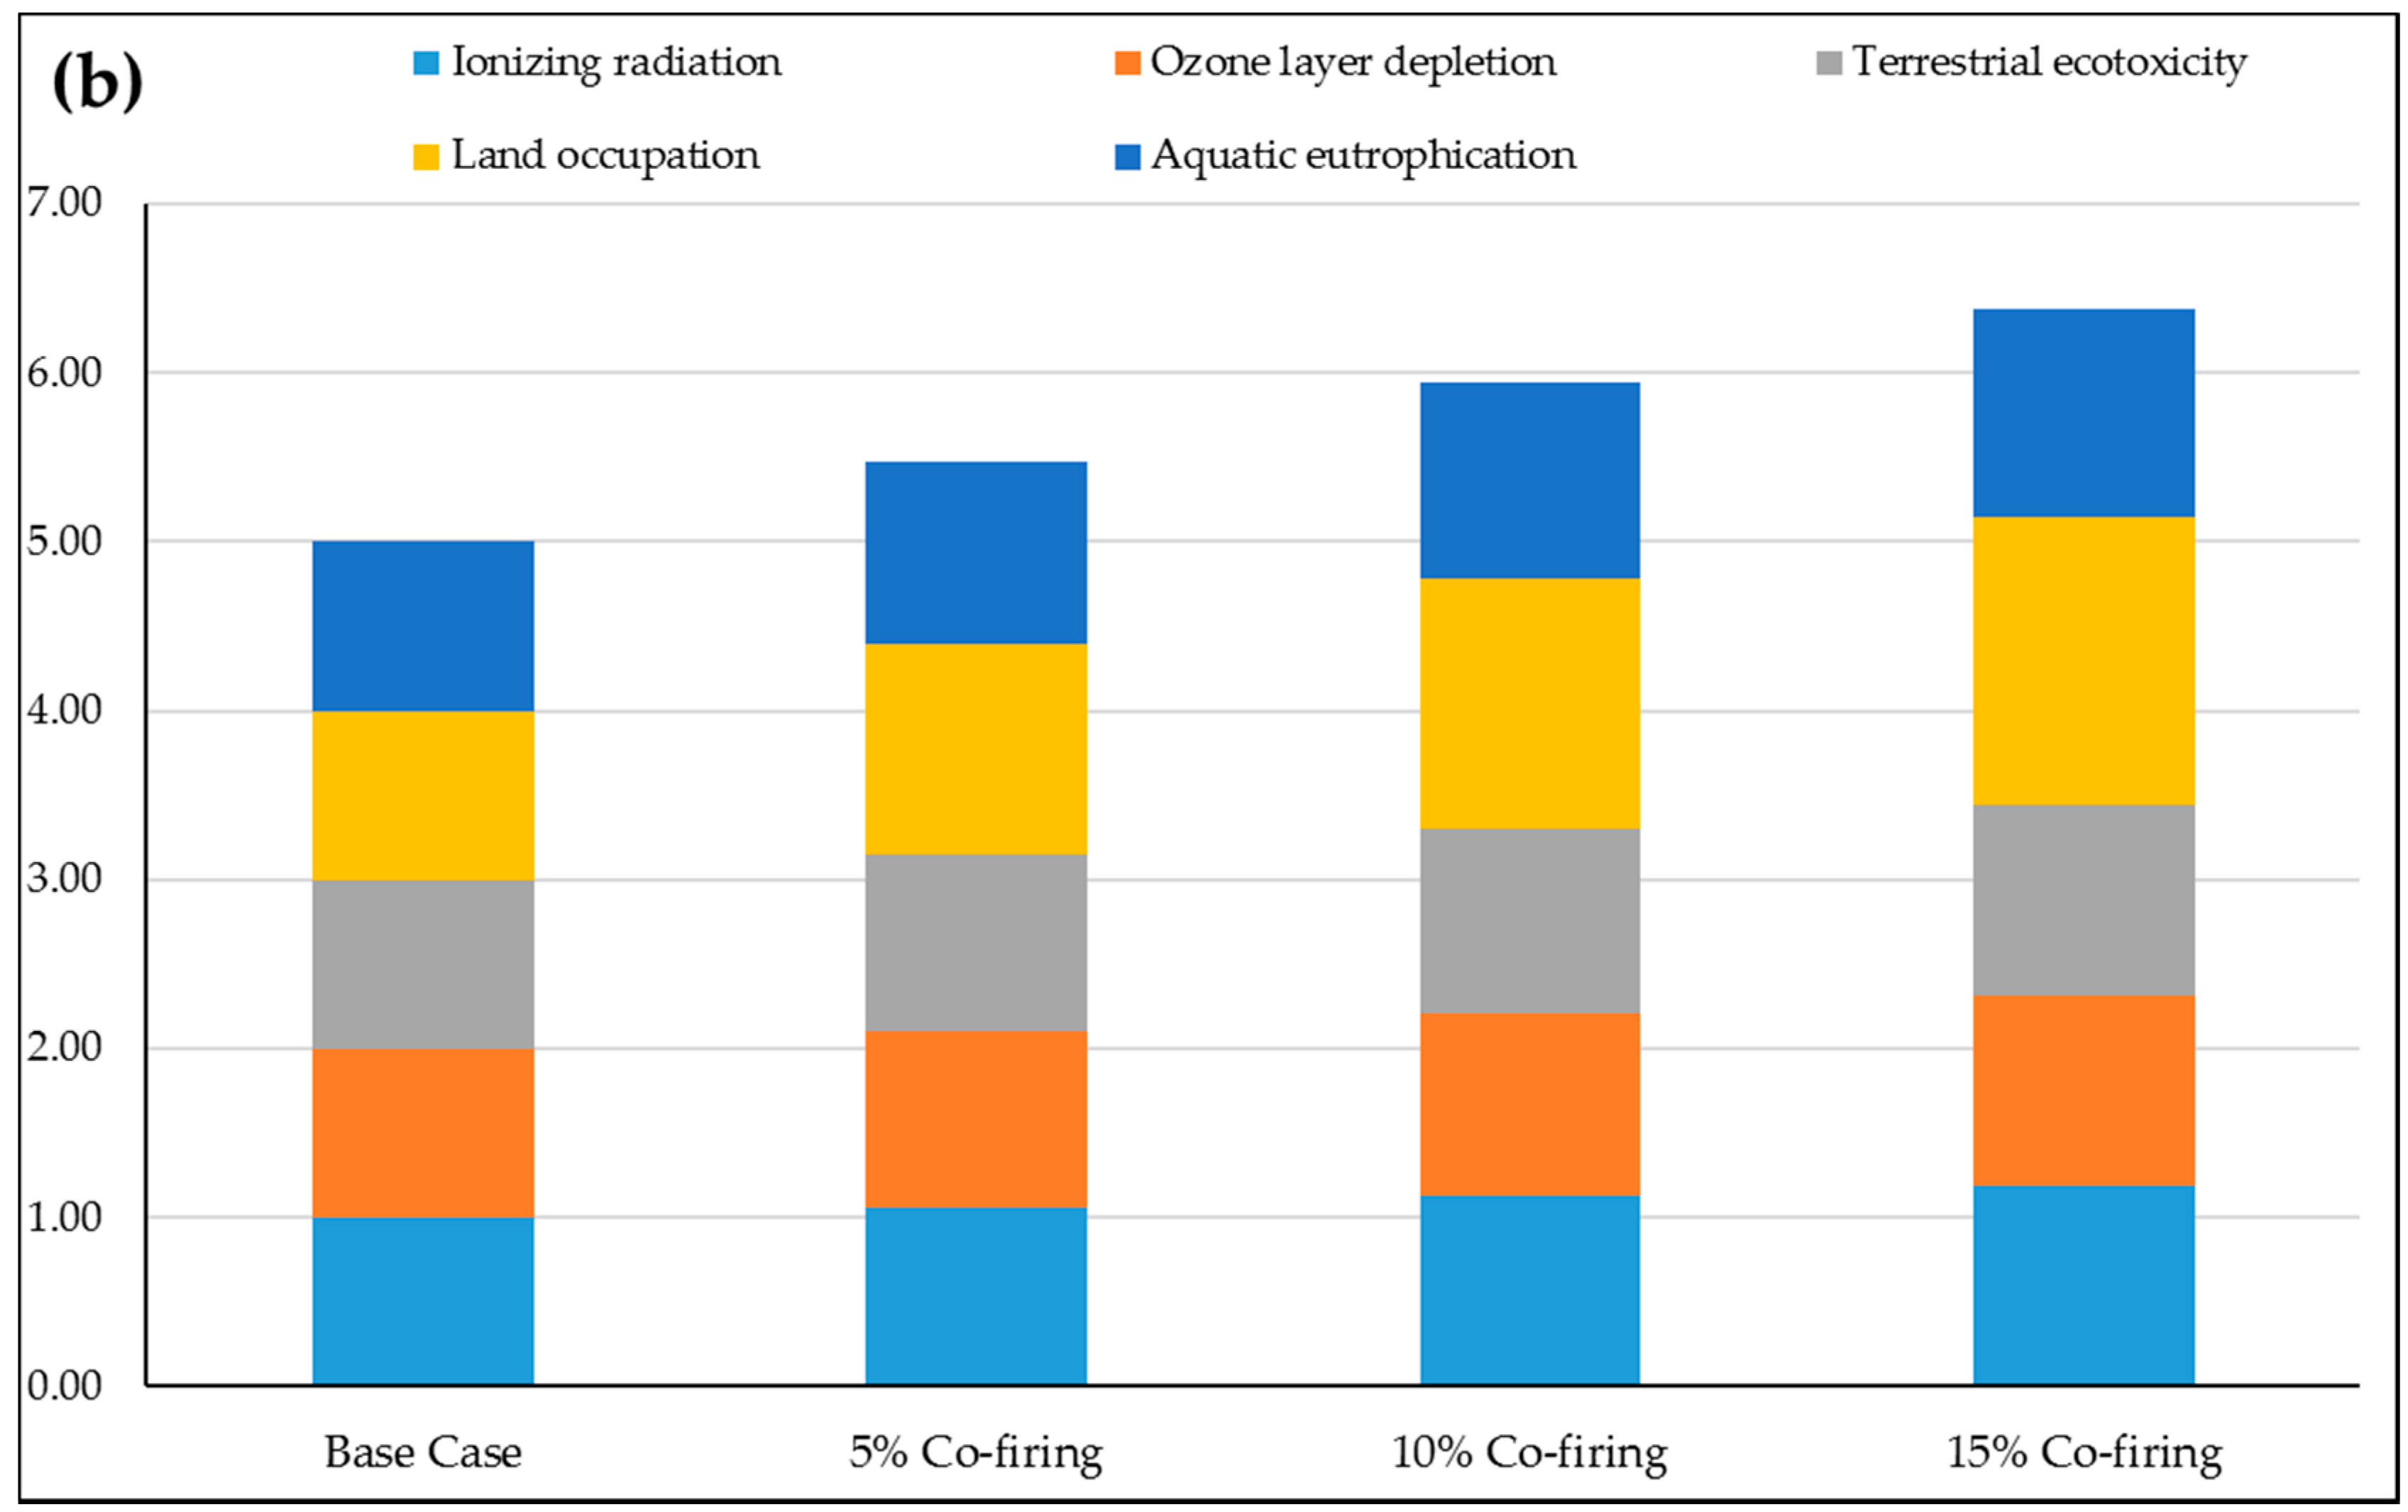
3.3. Mid-Point Impact Assessment

Life Cycle Impact Assessment (LCIA) is a method that assesses the environmental aspects and potential impacts associated with a goods or a service [13]. LCIA results can be linked to damage categories via midpoint categories. There are 14 mid-point impact categories in the IMPACT 2002+ method, where 9 categories (human toxicity, respiratory inorganics, respiratory organics, aquatic ecotoxicity, terrestrial acidification/nitrification, aquatic acidification, non-renewable energy, mineral extraction, and global warming) show a reduction in potential impact due to co-firing with forest residue at the WAP power plant. The five impact categories of ionizing radiation, ozone layer depletion, terrestrial ecotoxicity, land utilization, and aquatic eutrophication show an increase in potential impact. Human toxicity includes both carcinogenic and non-carcinogenic effects; processing of coal is mostly responsible for non-carcinogens and heavy metals such as mercury [60]. In co-firing, use of coal decreases, causing overall reductions in heavy metals and thereby leading to lowering of human toxicity. This result aligns with the finding that co-firing of coal with woody biomass reduces impact on human toxicity [19]. Acidification is driven by the release of acidic gases like SO2, and NH3. Biomass has lower sulfur content, which results in lowering oxides of sulfur due to combustion, and thereby reduces the potential for aquatic and terrestrial acidification. In addition, life cycle impacts from the current study show that PM reduction can contribute to lowering of human toxicity. Coal mining and transportation are responsible for higher emissions of VOCs, and co-firing with lower mass of coal would have thus contributed to lowering of respiratory organics. Mining of coal is mostly responsible for aquatic ecotoxicity; lower coal use reduces aquatic ecotoxicity impact. Coal processing is responsible for more than 99% of non-renewable energy impacts. For instance, coal processing has contributed 49.5 MJ primary/kWh in the 15% co-firing case. Using lower amounts of coal has low non-renewable energy impacts. Mineral extraction category also follows the same trend as non-renewable energy impact. The biggest decrease at midpoint impact is the non-renewable energy category, followed by mineral extraction and global warming potential (GWP). Global warming potential decreased by 13.24% for 15% co-firing. The atmospheric accumulation of greenhouse gases, such as CO2, N2O, and CH4 will be lowered due to co-firing due to the lack of net CO2 accumulation from existing forest residue. GWP reduces by 15.63% for 20% raw pellets co-firing with coal. Table 7 summarizes the midpoint impacts.
Five midpoint impact categories have an increase in potential impact due to co-firing of which aquatic eutrophication and ionizing radiation are the most concerning. The higher level of nutrients and ionizing radiation in the aquatic system might be due to the sub-processes in the machinery used for forest residue collection and the use of electricity generated from nuclear power in manufacturing of the machinery [61]. In co-firing, forest residue uses more land, which is the main reason for increasing impact. In the case of biomass, eutrophication impacts mainly come from use of fertilizer in forestry process, while the mining stage is responsible for eutrophication impacts from coal [6]. It occurs due to phosphate emissions from a different stage of LCA. Eutrophication potential of electricity production increased by 16% from 20% biomass (rice, wheat) co-firing with coal in a study conducted in Turkey [6]. Ozone layer depletion (OLD) also increases with co-firing. This finding is consistent with a study of co-firing with using raw wood, which suggested OLD could increase by 22.67% for 20% co-firing ratio [19]. Terrestrial ecotoxicity and land occupation also has greater impact in co-firing than base case. The relative increase and decrease in mid-point impact potentials with reference to base case (treated as 1.00) is described in Figure 4.

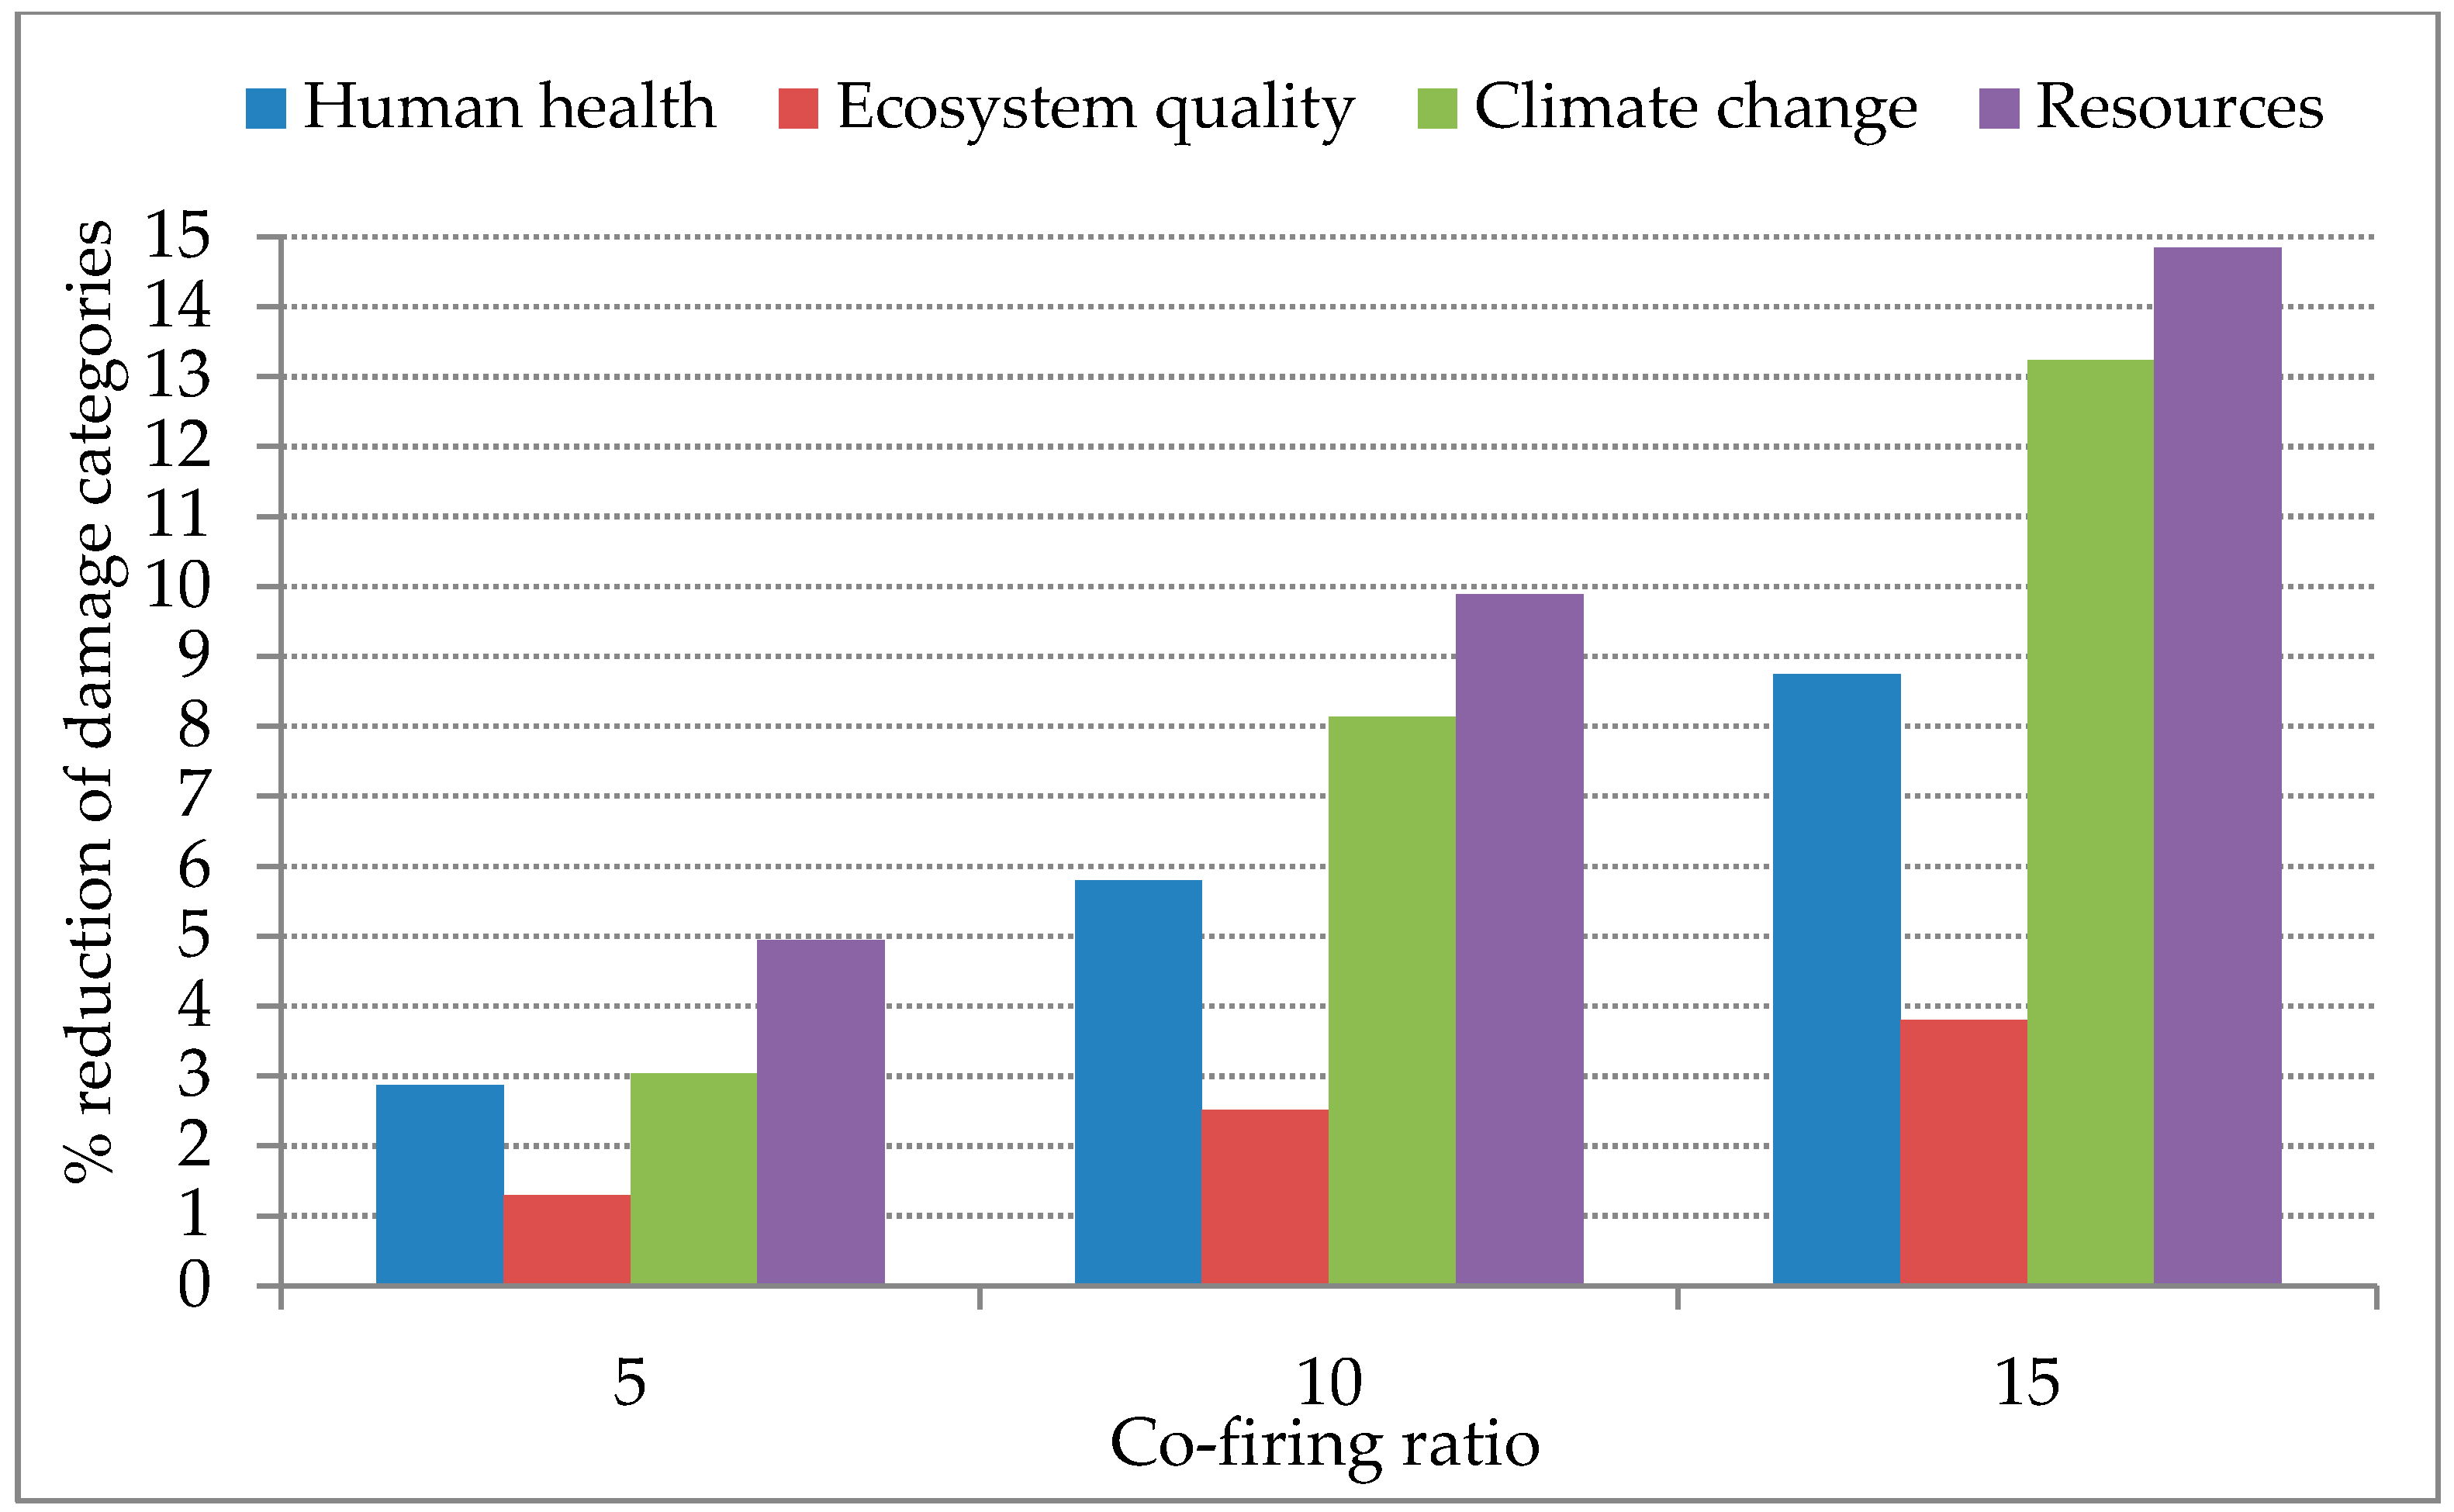
3.4. End-Point Impact Assessment

All the midpoint categories can be classified into four damage categories as presented in Table 8 and Figure 5. Some midpoint categories have an increase in impact due to co-firing, but all the end-point/damage categories show a reduced impact. This is primarily due to the low-weighting associated with categories such as land occupation that are not of primary concern in a state like Texas. The maximum reduction for 15% co-firing is in the resources category (14.85%), followed by climate change (13.24%), as described in Figure 5. Previous end-point assessments made for biochar co-firing with coal suggested that the potential impacts of all damage categories except human health would improve [61]. Potential impact from the human health category increased for biochar, due to processing of biochar being associated with increase of carcinogens, non-carcinogens, and respiratory organics categories [61]. Our result indicates that forest residue would lead an improvement across all damage categories. The current key constraint to the commercial scale use of biomass for electricity production is profitability [62]. The market price of biomass-based energy often exceeds the fossil fuel-based energy. The main reasons for exceeding market price are collection of biomass, transportation, conversion and other costs. A study of co-firing (up to 15%) forest residue with coal for electricity generation in East Texas estimated that logging residue costs of $21.01–$26.95 per t are competitive with coal cost of $27.30/t considering average hauling distance of 200 miles [63]. The study also reported that, for distances greater than 200 miles, the forest residue cost is not competitive for energy production and increases with increase of co-firing ratio. Additionally, hauling distance increases with the increase in required quantity of biomass, due to availability constraints. In our study, the average hauling distance is 183.9 miles. This could be a limiting factor that determines the cost-effectiveness of large-scale implementation of forest residue co-firing.

3.5. Uncertainty Analysis

Results presented in Table 9 describe the effect of introducing uncertainty in the transportation of forest residue supply chains on the potential mid-point impacts. An analysis for 15% uncertainty in the transportation of biomass at 10% and 15% co-firing ratios suggests that aquatic ecotoxicity, human toxicity, respiratory organics/inorganics, and terrestrial acidification/nitrification would be impact categories most affected. The emissions from diesel used in trucks that transport biomass to the WAP Power plant is the major factor that results in higher impact for respiratory organics/inorganics and human toxicity when distances increase. Negligible change was observed for categories such as ozone layer depletion, ionizing radiation, land occupation, and terrestrial ecotoxicity because truck transportation is not a major source of chlorofluoro carbons and solid/hazardous landfill waste, in comparison to coal combustion that generates fly ash at the power plant. The emissions of air pollutants such as NOx and NH3 increase with distances which biomass is transported, as listed in Table 10, thereby causing higher levels of aquatic acidification. Changes in VOC and PM2.5 described in Table 10 also contribute to the mid-point impact categories of human toxicity and respiratory organics/inorganics. The relative changes observed for increase or decrease in transportation distances are not symmetrical, as noticed for the respiratory inorganics mid-point category. For an increase of +15% transportation distance, there is an increase of 0.58% impact potential, whereas lowering the transportation distance by 15%, only lowers the impact by 0.27%. The variation in fuel efficiency of trucks, and non-proportional changes in emissions of VOC, NMVOC, and CO could be the reasons for this asymmetrical behavior. The changes in emissions of NOx, PM2.5, and NH3 are symmetrical with uncertainty in transportation.

4. Discussion

Profitability is a key current constraint to the commercial use of biomass for electricity production. The market price of biomass-based energy often exceeds that of fossil-fuel-based energy [62]. The main reasons for exceeding market price are costs involved with collection of biomass, transportation, and conversion. A study of co-firing (up to 15%) forest residue with coal for electricity generation by Ismayilova, (2007), estimated that logging residue costs $21.01–$26.95 per ton are competitive with coal cost of $27.30/t considering average hauling distance of 200 miles [63]. The study also reported that for distances greater than 200 miles, the forest residue cost is not competitive for energy production, and cost is increaseds with increase of co-firing ratio, because hauling distance increases with the increase in required amount of biomass. The same study also reported that using forest residue can increase the new jobs that help the local economy. In our study, the average hauling distance is 183.90 miles. It suggests that co-firing at WAP will be economical up to 15%.
The majority of impact categories have lower life cycle environmental impact in co-firing, except ionizing radiation, ozone layer depletion, terrestrial ecotoxicity, land utilization, and aquatic eutrophication. In co-firing, use of coal decreases, causing an overall reduction in human toxicity. Co-firing of coal with woody biomass reduces impact on human toxicity [19]. Acidification is the response of acid gases like SO2, NH3, and NOx. As biomass contains less amount of sulfur, reduction in acidification potential is intuitive. Also, the life cycle analysis of this study concludes that PM reduced in co-firing cases. These factors are responsible for the reduction of impact categories: respiratory inorganics, respiratory organics, terrestrial acidification and nitrification, and aquatic acidification. Coal mining and transportation emits higher respiratory organics than biomass case. Mining of coal is mostly responsible for aquatic ecotoxicity; lower coal use reduces aquatic ecotoxicity impact. Coal processing is responsible for more than 99% of non-renewable energy impacts. Coal processing has contributed 49.5 MJ primary/kWh in the 15% co-firing case. The biggest decrease of midpoint impacts is in non-renewable energy impact followed by mineral extraction and global warming potential (GWP). The atmospheric accumulation of GHG, such as CO2, N2O, and CH4 due to biomass does not lead to a net increase in GHG accumulation. There is no significant ionizing radiation impact from coal mining and transportation. But forest residue collection and processing has a contribution to this category. One of the possible reasons is the use of electricity generated from nuclear power in the sub-process of machinery [61]. Ozone layer depletion (ODP) also increases with co-firing which is 12.47% for 15% co-firing. A study of co-firing by using raw wood and coal concluded that ODP increases 22.67% for 20% co-firing ratio [19]. Terrestrial ecotoxicity and land occupation also has greater impact in co-firing than base case. In co-firing, forest residue uses more land which is the main reason for increasing impact. Coal mining and transportation does not have significant contribution in this impact category. In case of biomass, eutrophication impacts mainly come from use of fertilizer in forestry process, while mining stage is responsible for eutrophication impacts from coal [19]. It occurs due to phosphate emissions from a different stage of LCA. Eutrophication potential of electricity production increased by 16% from 20% biomass (rice, wheat) co-firing with coal as per Huang et al., (2013). Results from our study also show agreement with eutrophication potential increasing with co-firing [61]. The variation involved with transportation in the biomass supply chain represents the largest source of uncertainty in estimating life cycle impacts in the current study. The uncertainty analysis conducted for a ±15% change in the transportation distances indicates that global warming potential would not vary significantly, although emissions of air pollutants such as CO, NOx, and VOC contribute to increases in human toxicity and respiratory organics/inorganics. This finding is particularly significant for the Greater Houston Area, often confronted with high levels of ground-level ozone. The interpretation of results from the current study should also consider some of the limitations involved, such as geographical constraint, use of built-in Simapro machinery, and exclusion of waste, ash and recycling outputs of the power plant from the system boundary.

5. Conclusions

Co-firing of forest residue with coal at the WAP power plant results in significant reduction in emissions of all criteria air pollutants. The maximum reduction in life cycle emissions was observed for CO2 (13.45%), followed by NOx (11.70%) for the 15% co-firing scenario. For the combustion stage, emissions reduction was highest for NOx (15.06%), followed by CO2 (13.79%), indicating the potential alleviation of ozone precursors in the Greater Houston area. Nine midpoint impact categories (human toxicity, aquatic ecotoxicity and acidification, global warming, respiratory organics and inorganics, terrestrial acidification/nutrification, non-renewable energy, and mineral extraction) showed reduction in potential impact due to co-firing with forest residue, with GWP decreasing by 13.24% for 15% co-firing. The life cycle impact increased across five midpoint impact categories (ionizing radiation, land occupation, aquatic eutrophication, ozone layer depletion, terrestrial ecotoxicity); the maximum increase (69.93%) was for the land occupation category, due to biomass accumulation from forest residue. All four damage categories showed reduction of potential impact due to co-firing. The end-point impact category of climate change resulted in 13.24% lowering of impact, suggesting the positive contribution that forest residue can make toward a more sustainable energy production in Texas. The primary limitations of co-firing with forest residue include commercial wood demand and regulatory concerns, and any associated increases in the market price of electricity. In addition, the uncertainty induced due to the varying transportation distances in the biomass supply chain could increase the impact of co-firing in categories such as human toxicity and aquatic ecotoxicity, thereby controlling the environmental costs-benefit ratio of co-firing forest residue at the WAP power plant.

Supplementary Materials

The following are available online at https://www.mdpi.com/2071-1050/10/7/2193/s1.

Author Contributions

R.R.K. conceived the idea, R.R.K. and H.D. designed the study outline; I.H. performed the literature review and conducted the life cycle assessment with SimaPro®; I.H. and V.S.V.B. analyzed the data and drafted the paper.

Acknowledgments

This work is supported by the National Science Foundation (NSF) through the Center for Energy and Environmental Sustainability (CEES) at Prairie View A&M University, an NSF CREST Center, Award No. 1036593.

Conflicts of Interest

The authors declare no conflict of interest. The sponsors had no role in the design of the study; in the collection, analyses, or interpretation of data; in the writing of the manuscript, and in the decision to publish the results.

Appendix A

Table A1. Fuel requirement in kg/MWh, for different co-firing scenarios.
FuelCo-Firing Ratio
Base Case (0% Co-Firing)5% Co-Firing10% Co-Firing15% Co-Firing
Coal553.8526.1498.4470.7
Biomass038.6275.66111.2
Table A2. Inventory of coal at power plant.
AmountUnitComment [45]
Output
PRB sub-bituminous coal at Power plant1kg
Input: (From nature)
Moisture content0.277kgMoisture content of PRB coal is 27.66%
Ash content0.064kgAsh content of PRB coal is 6.44%
Energy, gross calorific value19,120kJ
Inputs: (From technosphere, materials/fuels)
Coal, at mine1.004kgCoal losses in supply chain is considered to be 4%
Transport, train, diesel powered/US2.227t-kmtonne-kilometre is expressed as
Table A3. Inventory of forest residue at power plant.
AmountUnitComment [32,44,64]
Output
Forest residues at power plant1tWood category
Input (from nature)
Biomass1.05tAssuming 5% loss
Energy, gross calorific value12,180MJ
Transformation, from forest land, extensive367.9m211 t per acre residues were utilized at 2008 in Texas
Ash content0.03tAsh content 3%
Moisture content0.33tMoisture content 33.3%
Input (material and fuels)
Forwarding of forest residues0.096hUsing Table 4 and Table 5
Bundling of forest residues0.064hUsing Table 6 and Table 7
Transport, long-haul truck281.9t-kmWeighted average distance is 183.9 mile
Chipping of biomass by Biber 920.041h

References

  1. The U.S. Energy Information Administration. U.S. Electricity Generation by Energy Source. 2017. Available online: https://www.eia.gov/tools/faqs/faq.php?id=427&t=3 (accessed on 12 June 2017).
  2. The U.S. Energy Information Administration. Texas Net Electricity Generation by Source, December 2017. 2017. Available online: https://www.eia.gov/state/?sid=TX#tabs-4 (accessed on 30 June 2017).
  3. The U.S. Energy Information Administration. U.S. Energy-Related Carbon Dioxide Emissions, 2016; U.S. Department of Energy: Washington, DC, USA, 2017.
  4. Thakur, A.; Canter, C.E.; Kumar, A. Life-cycle energy and emission analysis of power generation from forest biomass. Appl. Energy 2014, 128, 246–253. [Google Scholar] [CrossRef]
  5. Tsalidis, G.-A.; Joshi, Y.; Korevaar, G.; de Jong, W. Life cycle assessment of direct co-firing of torrefied and/or pelletised woody biomass with coal in The Netherlands. J. Clean. Prod. 2014, 81, 168–177. [Google Scholar] [CrossRef]
  6. Atilgan, B.; Azapagic, A. Life cycle environmental impacts of electricity from fossil fuels in Turkey. J. Clean. Prod. 2015, 106, 555–564. [Google Scholar] [CrossRef]
  7. Zhang, F.; Johnson, D.; Wang, J. Life-Cycle Energy and GHG Emissions of Forest Biomass Harvest and Transport for Biofuel Production in Michigan. Energies 2015, 8, 3258–3271. [Google Scholar] [CrossRef] [Green Version]
  8. Yin, L.; Liao, Y.; Zhou, L.; Wang, Z.; Ma, X. Life cycle assessment of coal-fired power plants and sensitivity analysis of CO2 emissions from power generation side. IOP Conf. Ser. Mater. Sci. Eng. 2017, 199, 012055. [Google Scholar]
  9. Morrison, B.; Golden, J.S. Life cycle assessment of co-firing coal and wood pellets in the Southeastern United States. J. Clean. Prod. 2017, 150, 188–196. [Google Scholar] [CrossRef]
  10. Kline, D.; Hargrave, T.; Vanderlan, C. The Treatment of Biomass Fuels in Carbon Emissions Trading Systems; Center for Clean Air Policy: Washington, DC, USA, 1998. [Google Scholar]
  11. Tillman, D.A. Biomass cofiring: The technology, the experience, the combustion consequences. Biomass Bioenergy 2000, 19, 365–384. [Google Scholar] [CrossRef]
  12. Boylan, D.M. Southern company tests of wood/coal cofiring in pulverized coal units. Biomass Bioenergy 1996, 10, 139–147. [Google Scholar] [CrossRef]
  13. Baumann, H.; Tillman, A.-M. The Hitch Hiker’s Guide to LCA; Studentlitteratur AB: Lund, Sweden, 2004. [Google Scholar]
  14. Liu, W.; Wang, J.; Bhattacharyya, D.; Jiang, Y.; DeVallance, D. Economic and environmental analyses of coal and biomass to liquid fuels. Energy 2017, 141, 76–86. [Google Scholar] [CrossRef]
  15. Man, Y.; Xiao, H.; Cai, W.; Yang, S. Multi-scale sustainability assessments for biomass-based and coal-based fuels in China. Sci. Total Environ. 2017, 599–600, 863–872. [Google Scholar] [CrossRef] [PubMed]
  16. Weldu, Y.W.; Assefa, G.; Jolliet, O. Life cycle human health and ecotoxicological impacts assessment of electricity production from wood biomass compared to coal fuel. Appl. Energy 2017, 187, 564–574. [Google Scholar] [CrossRef]
  17. Yang, S.; Yang, Y.; Kankala, R.K.; Li, B. Sustainability assessment of synfuels from biomass or coal: An insight on the economic and ecological burdens. Renew. Energy 2018, 118, 870–878. [Google Scholar] [CrossRef]
  18. Zastrow, P.; Molina-Moreno, F.; García-Segura, T.; Martí, J.V.; Yepes, V. Life cycle assessment of cost-optimized buttress earth-retaining walls: A parametric study. J. Clean. Prod. 2017, 140, 1037–1048. [Google Scholar] [CrossRef]
  19. Arteaga-Pérez, L.E.; Vega, M.; Rodríguez, L.C.; Flores, M.; Zaror, C.A.; Ledón, Y.C. Life-Cycle Assessment of coal–biomass based electricity in Chile: Focus on using raw vs. torrefied wood. Energy Sustain. Dev. 2015, 29, 81–90. [Google Scholar] [CrossRef]
  20. Mann, M.; Spath, P. A life cycle assessment of biomass cofiring in a coal-fired power plant. Clean Prod. Process. 2001, 3, 81–91. [Google Scholar] [CrossRef]
  21. Cuellar, A.; Herzog, H. A Path Forward for Low Carbon Power from Biomass. Energies 2015, 8, 1701–1715. [Google Scholar] [CrossRef] [Green Version]
  22. Texas Department of Agriculture. Texas Bioenergy 2010 Status Report; Texas Department of Agriculture: Austin, TX, USA, 2010.
  23. VanderSchaaf, C.L. Biomass from Logging Residue and Mill Residue in East Texas, 2008; Texas Forest Service: Austin, TX, USA, 2009. [Google Scholar]
  24. Dwivedi, P.; Bailis, R.; Khanna, M. Is Use of Both Pulpwood and Logging Residues Instead of Only Logging Residues for Bioenergy Development a Viable Carbon Mitigation Strategy? Bioenergy Res. 2014, 7, 217–231. [Google Scholar] [CrossRef]
  25. Bentley, J.W.; Johnson, T.G. Eastern Texas Harvest and Utilization Study, 2003; Resour.Bull.SRS-97; U.S. Department of Agriculture, Forest Service, Southern Research Station: Asheville, NC, USA, 2004; p. 28.
  26. Domke, G.M.; Becker, D.R.; D’Amato, A.W.; Ek, A.R.; Woodall, C.W. Carbon emissions associated with the procurement and utilization of forest harvest residues for energy, northern Minnesota, USA. Biomass Bioenergy 2012, 36, 141–150. [Google Scholar] [CrossRef]
  27. TCEQ. Index of /pub/EI/2012_episodes/hgb_sip/base_2012/point/basecase/AFS/. 2012. Available online: ftp://amdaftp.tceq.texas.gov/pub/EI/2012_episodes/hgb_sip/base_2012/point/basecase/AFS/ (accessed on 2 June 2017).
  28. Washenfelder, R.A.; Trainer, M.; Frost, G.J.; Ryerson, T.B.; Atlas, E.L.; Gouw, J.A.D.; Flocke, F.M.; Fried, A.; Holloway, J.S.; Parrish, D.D.; et al. Characterization of NOx, SO2, ethene, and propene from industrial emission sources in Houston, Texas. J. Geophys. Res. Atmos. 2010, 115, D16311. [Google Scholar] [CrossRef]
  29. Sjaak van Loo, J.K. The Handbook of Biomass Combustion and Co-Firing, 1st ed.; Routledge: London, UK, 2008. [Google Scholar]
  30. Zhang, Y.; McKechnie, J.; Cormier, D.; Lyng, R.; Mabee, W.; Ogino, A.; MacLean, H.L. Life Cycle Emissions and Cost of Producing Electricity from Coal, Natural Gas, and Wood Pellets in Ontario, Canada. Environ. Sci. Technol. 2010, 44, 538–544. [Google Scholar] [CrossRef] [PubMed]
  31. Damen, K.; Faaij, A. A Life Cycle Inventory of Existing Biomass Import Chains for “Green” Electricity Production; Universiteit Utrecht, Copernicus Institute, Department of Science, Technology and Society: Utrecht, The Netherlands, 2003. [Google Scholar]
  32. Mathison, R.M.; Bentley, J.W.; Johnson, T.G. East Texas Harvest and Utilization Study, 2008; USDA Forest Service: Asheville, NC, USA, 2009. [Google Scholar]
  33. Athanassiadis, D.; Lidestav, G.; Wästerlund, I. Fuel, Hydraulic Oil and Lubricant Consumption in Swedish Mechanized Harvesting Operations, 1996. J. For. Eng. 1999, 10, 59–66. [Google Scholar]
  34. Klvac, R.; Skoupy, A. Characteristic fuel consumption and exhaust emissions in fully mechanized logging operations. J. For. Res. 2009, 14, 328–334. [Google Scholar] [CrossRef]
  35. Jiroušek, R.; Klvac, R.; Skoupý, A. Productivity and costs of the mechanised cut-to-length wood harvesting system in clear-felling operations. J. For. Sci. 2007, 53, 476–482. [Google Scholar] [CrossRef]
  36. Akay, A.E.; Erdaş, O.; Sessions, J. Determining Productivity of Mechanized Harvesting Machines. J. Appl. Sci. 2004, 4, 100–105. [Google Scholar]
  37. Liška, S.; Klavc, R.; Skoupý, A. Evaluation of John Deere 1490D operation phase in typical conditions of the Czech Republic. J. For. Sci. 2011, 57, 394–400. [Google Scholar] [CrossRef] [Green Version]
  38. Harrill, H.; Han, H.-S.; Pan, F. Combining slash bundling with in-woods grinding operations. In Proceedings of the Council on Forest Engineering (COFE) Conference, Lake Tahoe, CA, USA, 15–18 June 2009. [Google Scholar]
  39. Mitchell, D. Bundling Logging Residues with a Modified John Deere B-380 Slash Bundler. In Proceedings of the International Conference on Woody Biomass Utilization, Starkville, MS, USA, 4–5 August 2009; Forest Products Society: Starkville, MS, USA. [Google Scholar]
  40. Rummer, B.; Len, D.; O’Brien, O. New Technology for Residue Removal in Forest Residues Bundling Project; U.S. Forest Service: Auburn, AL, USA, 2004. [Google Scholar]
  41. Klvac, R.; Ward, S.; Owende, P.M.O.; Lyons, J. Energy Audit of Wood Harvesting Systems. Scand. J. For. Res. 2003, 18, 176–183. [Google Scholar] [CrossRef]
  42. Zhang, F.; Handler, R.; Johnson, D.; Shonnard, D.R. Comparative Analysis of Life Cycle Greenhouse Gas Emissions of Supply Chains for Biofuel and Fossil Fuel Production. In Proceedings of the POMS 22nd Anuual Conference, Reno, NV, USA, 20 April–2 May 2011. [Google Scholar]
  43. Eriksson, L.; Gustavsson, L. Comparative analysis of wood chips and bundles—Costs, carbon dioxide emissions, dry-matter losses and allergic reactions. Biomass Bioenergy 2010, 34, 82–90. [Google Scholar] [CrossRef]
  44. Latta, G.S.; Baker, J.S.; Beach, R.H.; Rose, S.K.; McCarl, B.A. A multi-sector intertemporal optimization approach to assess the GHG implications of U.S. forest and agricultural biomass electricity expansion. J. For. Econ. 2013, 19, 361–383. [Google Scholar] [CrossRef]
  45. Ellis, M.S. Quality of economically extractable coal beds in the Gillette coal field as compared with other Tertiary coal beds in the Powder River basin, Wyoming and Montana. In Open-File Report; U.S. Geological Survey: Reston, VA, USA, 2002. [Google Scholar]
  46. Baruya, P. Losses in the Coal Supply Chain; IEA Clean Coal Centre: London, UK, 2012. [Google Scholar]
  47. NREL. Biomass Cofiring in Coal-Fired Boilers. In Energy Efficiency and Renewable Energy; U.S. DOE: Washington, DC, USA, 2004. [Google Scholar]
  48. Baxter, L. Biomass cofiring overview. In Proceedings of the Second World Conference on Biomass for Energy, Indsutry and World Climate Protection, Rome, Italy, 10–14 May 2004. [Google Scholar]
  49. Karampinis, E.; Grammelis, P.; Agraniotis, M.; Violidakis, I.; Kakaras, E. Co-firing of biomass with coal in thermal power plants: Technology schemes, impacts, and future perspectives. Wiley Interdiscip. Rev. Energy Environ. 2014, 3, 384–399. [Google Scholar] [CrossRef]
  50. Tillman, D.A. Final Report: Epri-Usdoe Cooperative Agreement: Cofiring Biomass with Coal; Electric Power Research Institute: Palo Alto, CA, USA, 2001. [Google Scholar]
  51. Hartmann, D.; Kaltschmitt, M. Electricity generation from solid biomass via co-combustion with coal: Energy and emission balances from a German case study. Biomass Bioenergy 1999, 16, 397–406. [Google Scholar] [CrossRef]
  52. Khorshidi, Z.; Ho, M.T.; Wiley, D.E. Techno-Economic Study of Biomass Co-Firing with and without CO2 Capture in an Australian Black Coal-Fired Power Plant. Energy Procedia 2013, 37, 6035–6042. [Google Scholar] [CrossRef]
  53. Loeffler, D.; Anderson, N. Emissions tradeoffs associated with cofiring forest biomass with coal: A case study in Colorado, USA. Appl. Energy 2014, 113, 67–77. [Google Scholar] [CrossRef]
  54. Reşitoğlu, İ.A.; Altinişik, K.; Keskin, A. The pollutant emissions from diesel-engine vehicles and exhaust aftertreatment systems. Clean Technol. Environ. Policy 2015, 17, 15–27. [Google Scholar] [CrossRef]
  55. Cooper, J. Life Cycle Assessment of Producing Electricity from California Forest Wildfire Fuels Treatments. In California Energy Commission, Public Interest Energy Research (PIER) Program; USDA Forest Service: Washington, DC, USA, 2009. [Google Scholar]
  56. Adams, P.W.R.; Shirley, J.E.J.; McManus, M.C. Comparative cradle-to-gate life cycle assessment of wood pellet production with torrefaction. Appl. Energy 2015, 138, 367–380. [Google Scholar] [CrossRef] [Green Version]
  57. IEA. Coal Mining and Logistics in Energy Technology Systems Analysis Programme; IEA: Paris, France, 2014. [Google Scholar]
  58. Koornneef, J.; van Keulen, T.; Faaij, A.; Turkenburg, W. Life cycle assessment of a pulverized coal power plant with post-combustion capture, transport and storage of CO2. Int. J. Greenh. Gas Control 2008, 2, 448–467. [Google Scholar] [CrossRef]
  59. Chinh, L.D.; Gheewala, S. Life Cycle Inventory of Air Emissions from a Typical Coal-fired Power Plant in Vietnam. Asian J. Energy Environ. 2007, 8, 476–482. [Google Scholar]
  60. Miller, P.J.; Atten, C.V. North American Power Plant Air Emissions; Commission for Environmental Cooperation of North America: Montréal, QC, Canada, 2004. [Google Scholar]
  61. Huang, Y.-F.; Syu, F.-S.; Chiueh, P.-T.; Lo, S.-L. Life cycle assessment of biochar cofiring with coal. Bioresour. Technol. 2013, 131, 166–171. [Google Scholar] [CrossRef] [PubMed]
  62. Walsh, M.E. U.S. bioenergy crop economic analyses: Status and needs. Biomass Bioenergy 1998, 14, 341–350. [Google Scholar] [CrossRef]
  63. Ismayilova, R.M. An analysis of producing ethanol and electric power from woody residues and agricultural crops in East Texas. In Urban and Regional Science; Texas A&M University: College Statio, TX, USA, 2007. [Google Scholar]
  64. Ruhul Kabir, M.; Kumar, A. Comparison of the energy and environmental performances of nine biomass/coal co-firing pathways. Bioresour. Technol. 2012, 124, 394–405. [Google Scholar] [CrossRef] [PubMed]
Figure 1. System boundary for Life Cycle Assessment (LCA) study.
Sustainability 10 02193 g001
Figure 2. Percentage reduction of life cycle air emissions due to co-firing.
Sustainability 10 02193 g002
Figure 3. Percentage reduction of air emissions from combustion stage.
Sustainability 10 02193 g003
Figure 4. Relative change in impact across mid-point impact categories (base-case impact treated as 1.00 for each category), due to co-firing: (a) categories that showed reduction in impact with co-firing, and (b) categories that showed increase in impact due to co-firing.
Sustainability 10 02193 g004aSustainability 10 02193 g004b
Figure 5. Reduction in Impact for Damage categories due to co-firing.
Sustainability 10 02193 g005
Table 1. Inventory data for biomass collection.
ItemValueUnitReferences and Assumptions
Forwarding of residue (1 h)
Forwarder6.85 × 10−5P *Assuming service life is 14,600 PMH * [4]
Lubricating oil0.515kg[41]
Diesel, low sulfur10.6kgDensity of diesel 0.84 kg/L (Ecoinvent database).
Bundling of residue (1 h)
Bundler6.85 × 10−5P *Assuming service life is 14,600 PMH * [4]
Diesel, low sulfur9.54kgDensity of diesel 0.84 kg/L
Lubricating oil0.608kgConsumption rate of lubricating oil were taken from and density is 0.98 g/cm3 [35]
Packaging film, low-intensity polyethylene2.4kgUsed to fix bundles, 0.08 kg of PA per bundle (Ecoinvent database)
Vegetable oil0.354kgUsed for lubricating chainsaw [41]
* P is unit of machinery as per SimaPro® library; PMH is productive machine hour.
Table 2. Inventory data for biomass transportation and processing.
ItemValueUnitReferences and Assumptions
Transport, long haul truck (1 t-km)
Diesel2.68 × 10−2kgDensity of diesel 0.84 kg/L (Ecoinvent database).
Chipping of biomass (1 h)
Diesel, low sulfur60.7kgDensity of diesel 0.84 kg/L (Ecoinvent database).
Lubricating oil0.925kgEcoinvent database
Table 3. Inventory of coal at power plant.
ItemAmountUnitComment
PRB sub-bituminous coal at Power plant1Kg
Moisture content0.277KgMoisture content of PRB coal is 27.66% [45]
Ash content6.44 × 10−2KgAsh content is 6.44% [45]
Energy, gross calorific value19,119kJ
Coal, at mine1.00KgConsidering coal loses in supply chain [45]
Transport, train, diesel powered/US2.23t-kmtonne-kilometer is expressed as t-km
Table 4. Co-firing stage inventories for base case (0% co-firing, energy basis) for 1 kWh electricity.
ItemAmountUnitComment
Output
Electricity, sub bituminous coal, at power plant
1kWh
Inputs
(materials/fuels)
Light fuel oil [18] market for/Conseq,U1.58 × 10−4kgDefault data from electricity [WECC]/US, SimaPro database. Used for start-up the power plant.
Water, decarbonized, at user {GLO}/market for/Conseq,U1.39kgDefault data from electricity[WECC]/US, SimaPro database
NOX retained, by selective catalytic reduction{GLO}/market for/Consec,U1.05 × 10−3kgDefault data from electricity[WECC]/US, SimaPro database
Water, completely softened, from decarbonized water, at user {GLO}/market for/Conseq,U5.57 × 10−2kgDefault data from electricity[WECC]/US, SimaPro database
PRB sub-bituminous coal at Power plant0.554kgCalculated by considering plant efficiency 34%.
Forest residue at power plant0kgBase case (0% co-firing)
Table 5. Summary of emissions from 1 t of biomass and coal supply chains.
PollutantCoal (1 t)Biomass (1 t)
MiningTransportationForwardingBundlingTransportationChipping
CO2 (kg)63.147.24.285.0026.510.1
CO (g)26829015.016.516030.9
NOx (g)168115034.821.019333.0
SO2 (g)21922.46.947.7616.614.8
PMc (g)4.4828.50.771.580.900.84
Table 6. Life cycle emissions (air) from biomass co-firing in WAP power plant.
PollutantBase Case5% Co-Firing10% Co-Firing15% Co-Firing
CO2 (g/kWh)1010977927875
CO (g/kWh)0.5580.5500.5360.523
SO2 (g/kWh)2.4102.3202.2502.180
NOx (g/kWh)0.9490.9130.8760.839
PM2.5 (g/kWh)9.140 × 10−28.960 × 10−28.630 × 10−28.300 × 10−2
PM (>2.5, <10)
(g/kWh)
2.420 × 10−22.350 × 10−22.270 × 10−22.200 × 10−2
VOC (g/kWh)2.480 × 10−22.420 × 10−22.350 × 10−22.290 × 10−2
NMVOC (g/kWh)7.210 × 10−27.090 × 10−26.970 × 10−26.840 × 10−2
Methane, fossil (g/kWh)1.840 × 10−21.880 × 10−21.910 × 10−21.950 × 10−2
NH3 (g/kWh)3.720 × 10−33.730 × 10−33.750 × 10−33.770 × 10−3
Table 7. Mid-point impacts of biomass co-firing at WAP power plant.
Impact CategoryUnitBase Case5% Co-Firing10% Co-Firing15% Co-Firing
Human toxicitykg C2H3Cl eq/kWh7.18 × 10−37.10 × 10−37.02 × 10−36.93 × 10⁻³
Respiratory inorganicskg PM2.5 eq/kWh4.04 × 10−43.92 × 10−43.80 × 10−43.67 × 10⁻⁴
Ionizing radiationBq C-14 eq/kWh5.63 × 10−25.99 × 10−26.35 × 10−26.69 × 10⁻²
Ozone layer depletionkg CFC-11 eq/kWh3.02 × 10−93.16 × 10−93.28 × 10−93.40 × 10⁻⁹
Respiratory organicskg C2H4 eq/kWh7.48 × 10−57.28 × 10−57.08 × 10−56.87 × 10⁻⁵
Aquatic ecotoxicitykg TEG water/kWh22.922.421.921.3
Terrestrial ecotoxicitykg TEG soil/kWh0.3000.3140.3270.340
Terrestrial acidification
and nutrification
kg SO2 eq/kWh7.72 × 10−37.48 × 10−37.25 × 10−37.03 × 10⁻³
Land occupationm2 org.arable/kWh5.67 × 10−57.05 × 10−58.37 × 10−59.64 × 10⁻⁵
Aquatic acidificationkg SO2 eq/kWh3.45 × 10−33.34 × 10−33.25 × 10−33.16 × 10⁻³
Aquatic eutrophicationkg PO4 P-lim/kWh1.20 × 10−61.30 × 10−61.39 × 10−61.48 × 10⁻⁶
Non-renewable energyMJ primary/kWh58.355.452.549.6
Mineral extractionMJ surplus/kWh9.35 × 10−38.90 × 10−38.45 × 10−38.00 × 10⁻³
Global warmingkg CO2 eq/kWh1.0300.9980.9460.893
Table 8. Damage category (end-point) impact of co-firing.
Damage CategoryUnitBase Case5% Co-Firing10% Co-Firing15% Co-Firing
Human healthDALY/kWh3.03 × 10−72.95 × 10−72.86 × 10−72.77 × 10⁻⁷
Ecosystem qualityPDF * m2 * yr/kWh1.16 × 10−21.15 × 10−21.13 × 10−21.12 × 10⁻²
Climate changeKg CO2 eq/kWh1.031.000.950.89
ResourcesMJ primary58.355.452.549.6
* DALY: Disability-Adjusted Life Years; PDF: Potentially disappeared fraction of species.
Table 9. Relative change in mid-point impacts due to uncertainty in transportation of biomass.
Impact CategoryUnit10% Co-Firing Ratio15% Co-Firing Ratio
+15%−15%+15%−15%
Human toxicityKg C2H3Cl eq/kWh0.28%−0.28%0.58%−0.43%
Respiratory inorganicskg PM2.5 eq/kWh0.26%−0.26%0.54%−0.27%
Ionizing radiationBq C-14 eq/kWh0.00%0.00%0.00%0.00%
Ozone layer depletionkg CFC-11 eq/kWh0.00%0.00%0.00%0.00%
Respiratory organicskg C2H4 eq/kWh0.14%0.00%0.29%−0.44%
Aquatic ecotoxicitykg TEG water/kWh0.46%−0.91%1.41%−0.94%
Terrestrial ecotoxicitykg TEG soil/kWh0.00%0.00%0.00%0.00%
Terrestrial acidificationand nutrificationkg SO2 eq/kWh0.41%−0.28%0.43%−0.57%
Land occupationm2 org.arable/kWh0.00%0.00%0.00%0.00%
Aquatic acidificationkg SO2 eq/kWh0.00%−0.31%0.00%−0.32%
Aquatic eutrophicationkg PO4 P-lim/kWh0.00%0.00%0.00%0.00%
Non-renewable energyMJ primary/kWh0.00%0.00%0.00%0.00%
Mineral extractionMJ surplus/kWh0.00%0.00%0.00%0.00%
Global warmingkg CO2 eq/kWh0.00%0.00%0.11%0.00%
Table 10. Relative change in air pollutant emissions due to uncertainty in transportation of biomass.
Pollutant10% Co-Firing Ratio15% Co-Firing Ratio
+15%−15%+15%−15%
CO2 (g/kWh)0.01%−0.10%0.01%−0.05%
CO (g/kWh)0.37%−0.30%0.19%−0.76%
SO2 (g/kWh)0.00%0.00%0.00%0.00%
NOx (g/kWh)0.23%−0.23%0.36%−0.36%
PM2.5 (g/kWh)0.12%−0.12%0.12%−0.12%
PM (>2.5, <10) (g/kWh)0.00%0.00%0.00%−0.45%
VOC (g/kWh)0.85%−0.43%0.87%−0.87%
NMVOC (g/kWh)0.29%−0.29%0.00%−0.44%
Methane, fossil (g/kWh)0.00%0.00%0.00%−0.51%
NH3 (g/kWh)0.27%−0.27%0.27%−0.27%

