Article

Regional Variability of Agriculturally-Derived Nitrate-Nitrogen in Shallow Groundwater in China, 2004–2014

1
Linze Inland River Basin Research Station, Chinese Ecosystem Research Network, Key Laboratory of Eco-hydrology of Inland River Basin, Northwest Institute of Eco-Environment and Resources, Chinese Academy of Sciences, Lanzhou 730000, China
2
University of Chinese Academy of Sciences, Beijing 100049, China
*
Author to whom correspondence should be addressed.
Sustainability 2018, 10(5), 1393; https://doi.org/10.3390/su10051393
Submission received: 10 March 2018 / Revised: 20 April 2018 / Accepted: 25 April 2018 / Published: 2 May 2018

Abstract

:
Increasing diffuse nitrate loading of groundwater has long been a major environmental and health concern in China, but little is known about the spatial and temporal variability of nitrate concentrations in groundwater at regional scales. The aim of this study was to assess the spatial distribution and variation of nitrate-nitrogen (NO3-N) concentrations in groundwater. We used groundwater quality monitoring data and soil physical characteristics from 21 agro-ecosystems in China for years 2004 to 2014. The results indicated that NO3-N concentrations were highly variable in shallow groundwater across the landscape. Over the study period, most of the NO3-N concentrations were below the World Health Organization permissible limit for drinking water (<10 mg N·L). NO3-N concentrations in groundwater neither significantly increased nor decreased in most agro-ecosystems, but fluctuated with seasons. In addition, groundwater NO3-N under purple soil (6.81 mg·L−1) and Aeolian sandy soil (6.02 mg·L−1) were significantly higher (p < 0.05) than that under other soil types, and it was medium-high (4.49 mg·L−1) under aquic cinnamon soil. Elevated nitrate concentrations occurred mainly in oasis agricultural areas of northwestern China, where farmlands with coarse-textured soils use flood irrigation. Therefore, arid and semi-arid areas are expected to sustain high NO3-N concentrations in groundwater. Mitigation strategies can prevent this problem, and include control of N fertilizer input, balanced fertilization, proper rotation system, adoption of improved irrigation methods, and establishment of environmental policies.

1. Introduction

Anthropogenic activities across the world affect the quality of groundwater, and result in a severe problem for society [1]. Increasing diffuse nitrate (NO3) loading of groundwater has emerged as a serious environmental issue, due to its adverse effects on human populations and natural ecosystems [2,3]. The ingestion of nitrate by humans in drinking water was linked to methemoglobinemia in infants, and to stomach cancers in adults [4,5]. Additionally, high nitrate-nitrogen (NO3-N) concentrations have also led to eutrophication in aquatic systems inducing depletion of dissolved oxygen (O2) (hypoxia) due to increased biological activity [6,7]. Moreover, nitrate can persist in groundwater for decades, and it can also take decades for nitrate leached from the soil to discharge into freshwaters. Once groundwater is contaminated, it is expensive, and, in many cases, virtually impossible to clean up [8]. Because of those concerns, the U.S. Environmental Protection Agency (U.S. EPA) established a maximum contaminant level (MCL) of 10 mg·L−1 NO3 N in drinking water [9]. In China, the permissible NO3-N concentration in groundwater is 20 mg·L−1 [10]. In recent years, groundwater nitrate contamination has been found in the United States, UK, The Netherlands, The Czech Republic, Denmark, Lebanon, China, Japan, India, Israel, New Zealand, and many other countries. In some regions of Denmark and The Netherlands, nitrate concentrations have been increasing by 0.2 to 1.3 mg·L−1 per year [5]. Research on groundwater nitrate in China has been carried out in agricultural regions since the 1990s. Studies have indicated that the Circum-Bohai-Sea Region, including the provinces of Beijing, Hebei, Henan, Shandong, Liaoning, Tianjin, and Shanxi, had high NO3-N concentrations in groundwater, with an average value of 11.9 mg·L−1; about 34.1% of the groundwater exceeded the WHO (World Health Organization) limit of 10 mg·L−1 for drinking water [11]. In addition, many studies also suggested that 32.4% of wells in the middle of the Heihe River irrigation areas exceeded the limit of 10 mg NO3-N L−1 [12].
Generally, anthropogenic nitrogen inputs, primarily via the application of synthetic fertilizers and the cultivation of leguminous crops, were the main sources of nitrate contamination in soil and groundwater in many agricultural areas of the world [13]. In several cases, groundwater under agricultural ecosystems was at a greater risk of contamination by nitrate than that under other types of ecosystems [14]. Empirical correlations relating increased use of inorganic fertilizers, their application rates, and nitrate leaching suggest that inorganic fertilizers contribute nitrate to the soil directly. Moreover, field studies also have confirmed that high N fertilizer rates increased the risks of nitrate (NO3) accumulation in the soil profile and of groundwater nitrate pollution [15,16]. Unfortunately, rates of N inputs have now reached the levels of diminishing returns for crop yield in China, and China has one of the lowest nationally-averaged NUE (nitrogen use efficiency) values in the world [17]. For example, regions where N-fertilizer application rates were above 500 kg N ha−1 and N use efficiency was less than 40% were at a high risk of nitrate pollution of shallow groundwater [18]. Additionally, nitrate concentration in groundwater had a significant spatial variability, which may be mainly controlled by land use type, soil texture, thickness of the vadose zone, timing of fertilizer application, and regional climate [19]. Finally, groundwater nitrate pollution may be the consequence of long-term nitrogen accumulation rather than current practices. In brief, the possible mechanisms that affect nitrate pollution in groundwater likely include multiple factors.
For several decades, nitrate contamination in surface waters and groundwater in China has received considerable attention, and many studies of nitrate pollution of groundwater have been conducted in intensive farming regions. However, little is known about the spatial and temporal variation of nitrate concentrations over wide geographical areas and in different soil types. The aims of this study were to assess the spatial and temporal characteristics of groundwater nitrate on a national scale; to identify and document the long-term trends of nitrate concentrations in groundwater; and to analyze the variability of nitrate especially due to key decision variables such as soil type distribution. The assessment is carried out using monitoring data of the China Ecosystem Research Network (CERN) from 2004 to 2014. This assessment is intended to increase the understanding of the space-time variability in nitrate concentrations in groundwater in agro-ecosystems of China, and to provide recommendations related to future groundwater environmental management.

2. Materials and Methods

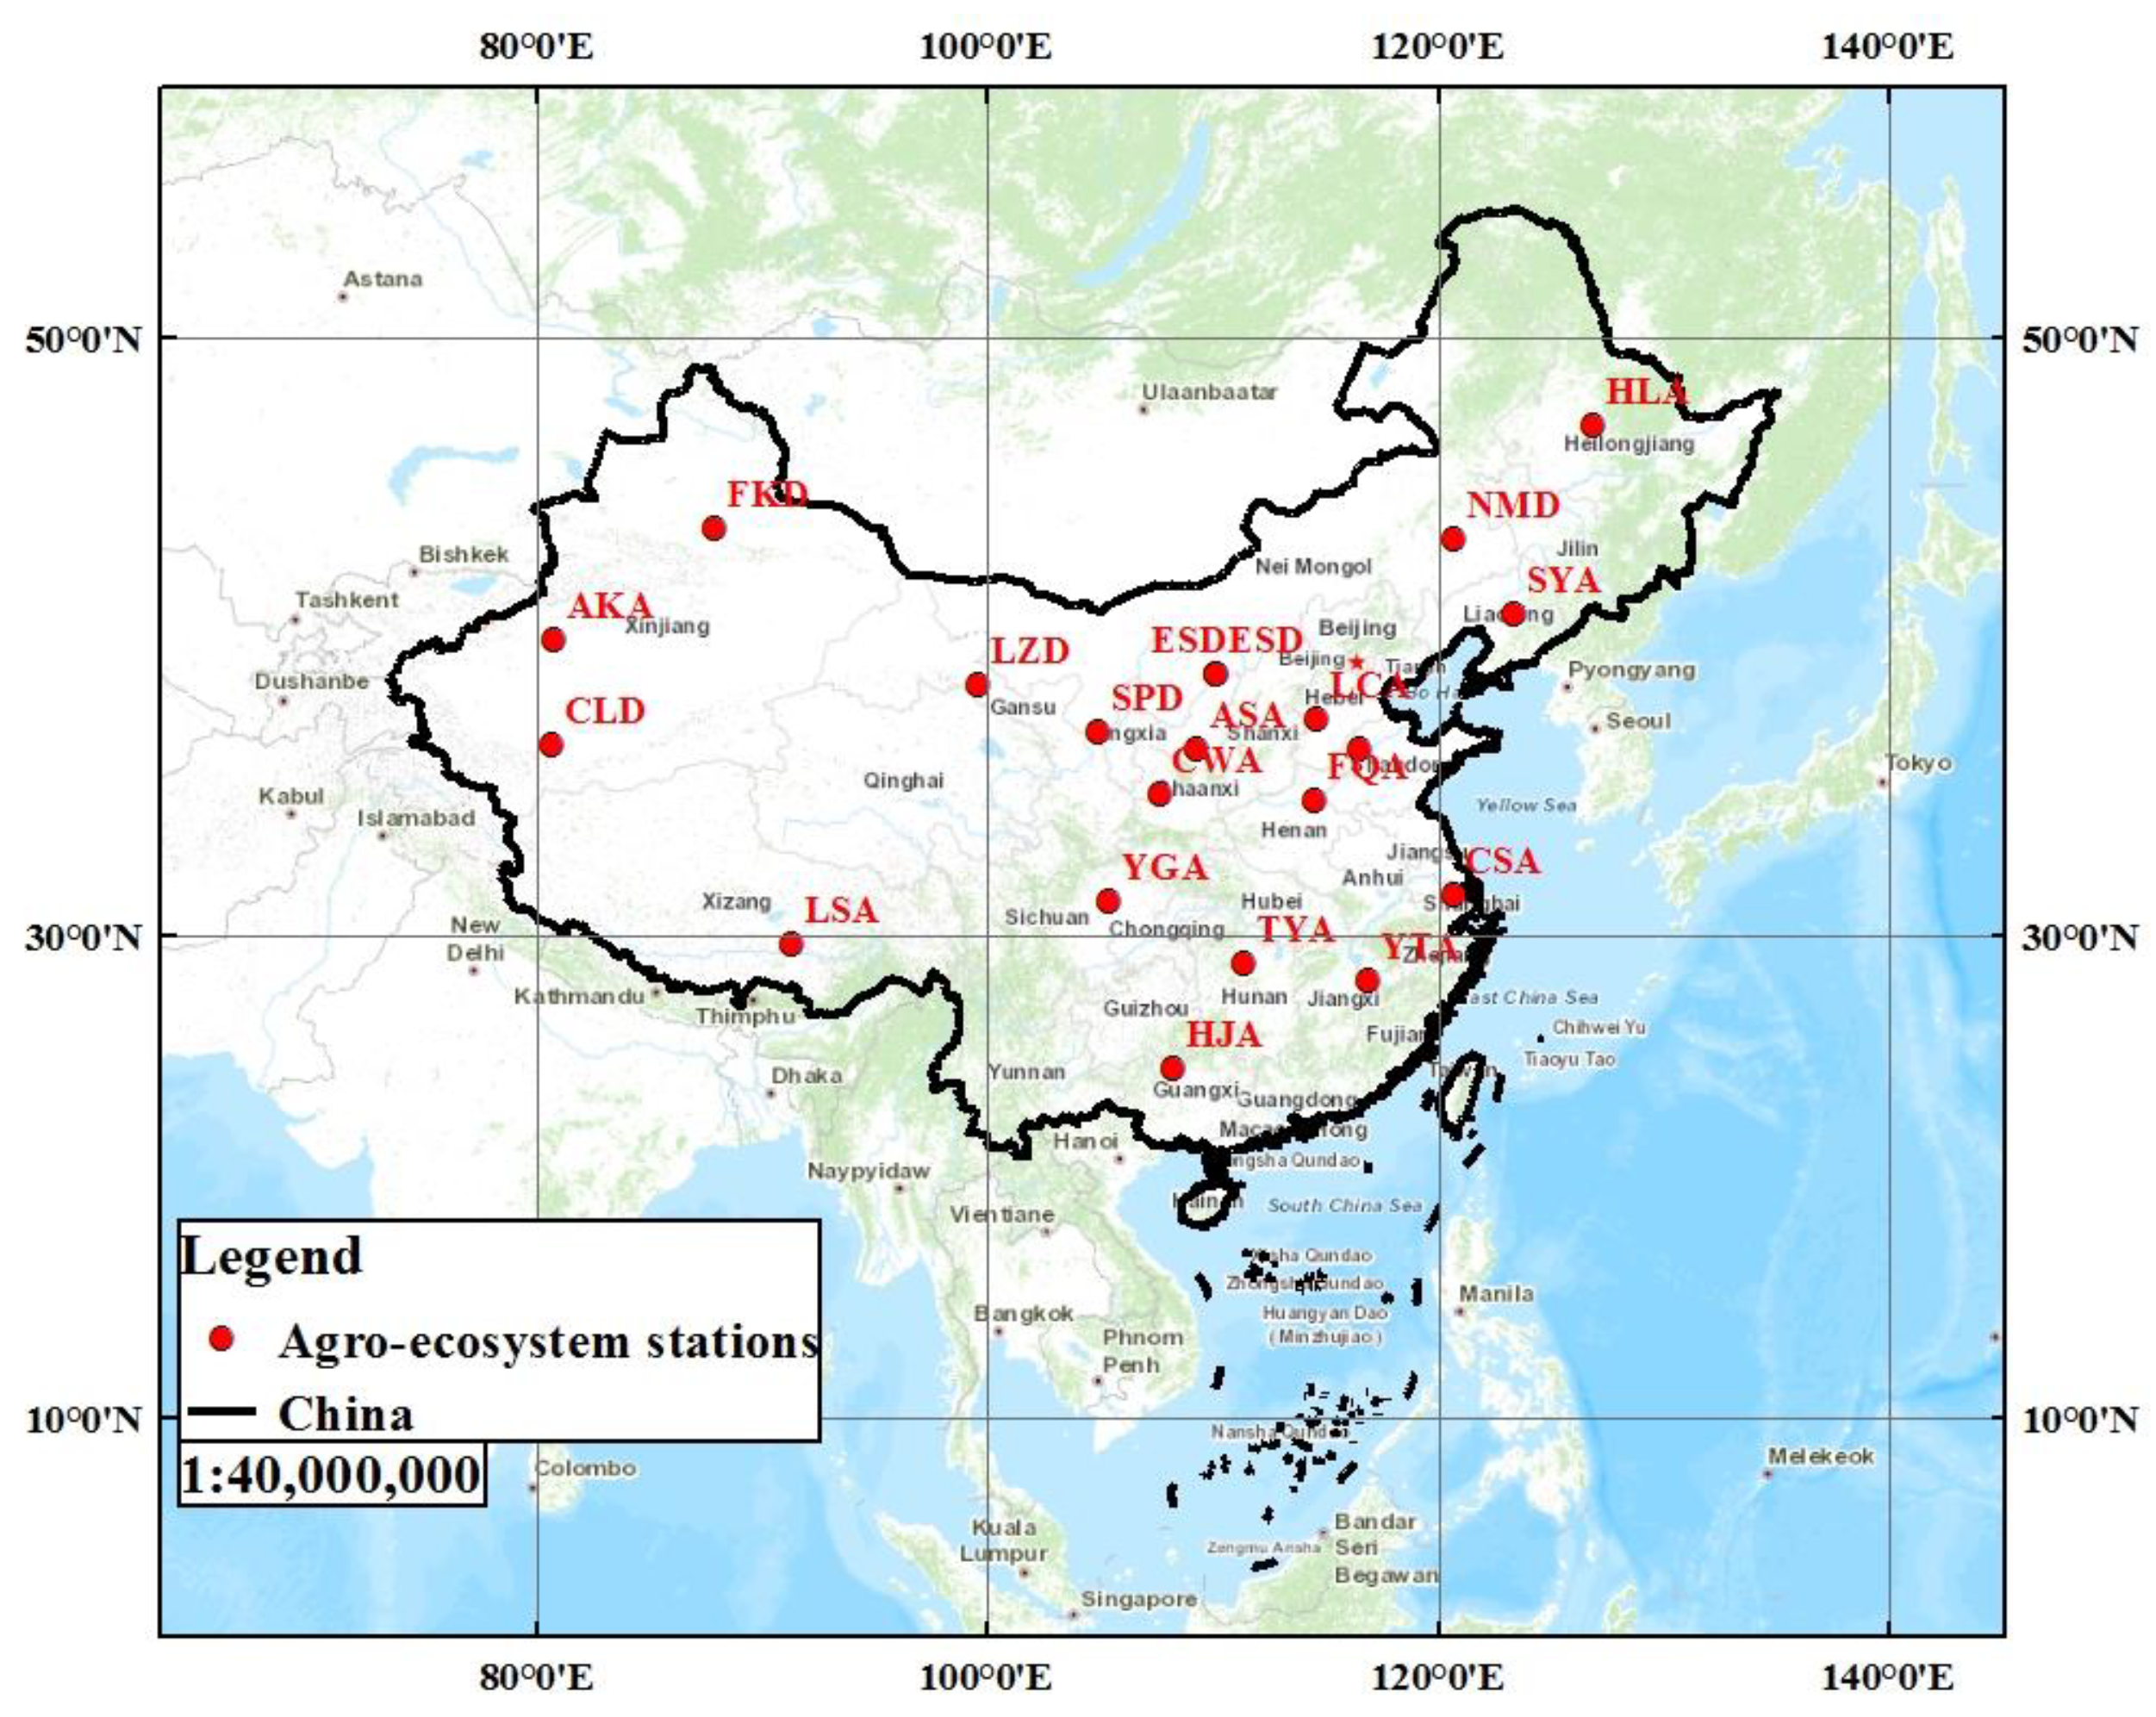
2.1. Monitoring Sites

The mission of CERN is to promote ecosystem conservation and improvement, and monitor changes in the natural environment in China. CERN consists of 31 research stations, including 13 in agricultural ecosystems, 9 in forest ecosystems, 6 in desert ecosystems, 2 in grasslands, and 1 in a wetland ecosystem. All the stations are engaged in monitoring work, research, experiment and demonstration. Water quality monitoring work of CERN had begun in 1998, and consisted mainly of long-term monitoring of the quality of liquid surface water, stationary water, groundwater, and precipitation at each station. We selected 21 of the CERN monitoring sites and obtained data for years 2004 to 2014 to evaluate the distribution of groundwater nitrate. Background information, such as mean annual air temperature, mean annual precipitation, N application rates, crop rotation, and soil type was recorded for each sampling event at each monitoring well. The ecosystems represented by the 21 stations in this study were agricultural and desert, distributed across a range of climatic zones (Figure 1). These agro-ecosystems included (1) northeast agricultural area (HLA, SYA), (2) north oasis agricultural area and pastoral area (CLD, EDS, LZD, NMD, SPD, FKD), (3) north China agricultural area (AKA, ASA, CWA, FQA, YCA, LCA), (4) Tibetan Plateau agricultural and pastoral area (LSA), (5) south agricultural area (YGA, TYA, CSA, YTA, QYA, HJA). The altitude of the selected agro- and desert ecosystems ranged from 1.3 m (CSA) to 3688 m (LSA). Mean annual air temperature (MAAT) across the stations ranged from 1.5 °C at HLA (northeast) to 19.9 °C at HJA (south), and the mean annual precipitation (MAP) ranged from 33 mm at CLD (north) to 1785 mm at YTA (south) (Table 1). In addition, data on soil physical properties used in this study were also obtained from CERN.

2.2. Monitoring Methods

Groundwater water sampling and analysis were strictly based on the Water Monitoring Protocol of the Chinese Ecosystem Research Network [20]. In order to ensure data quality, a three-tier (i.e., field stations, water sub-center, and synthesis center) data quality control was used for the CERN monitoring data. The field stations conduct groundwater water sampling and analysis according to the laboratory quality control standards. Water sub-center is responsible for the quality data. The synthesis center mainly assesses data quality of the entire CERN [21]. NO3-N values that were larger than the total N concentration for any sample, were eliminated from analysis database. For this study, 39 groundwater monitoring wells were selected for long-term monitoring, including 16 wells under farmland to evaluate variability in groundwater nitrate under conditions of long-term fertilization and crop planting. About 1660 groundwater samples were collected and analyzed by field station personnel. Most datasets spanned years 2004 to 2014 (FKD, NMD, SPD, CWA, LSA, HLA, SYA, YCA, FQA, LCA, CSA, TYA, YGA, QYA), some datasets spanned years 2005 to 2014 (CLD, LZD, ESD, ASA), one spanned years 2007 to 2014 (HJA), one spanned years 2006 to 2014 (YTA), and one spanned years 2008 to 2014 (AKA). At most stations, groundwater was sampled 4 times per year, but at YCA, FQA, CSA, YTA, sampling was conducted monthly. Nitrate was measured by ion chromatography, also known as phenoldisulfonic acid spectrophotometry, using Bran-Lubbe AA3, (Germany). Non-parametric methods were used to test for outliers in the datasets. The Kruskal-Wallis test was used to test the differences among different soil types.
Soil samples were analyzed at the Chinese Science Academy’s laboratory, following standard protocols and methods [20]. Soil sampling protocol is detailed in Zhang et al. [22]. Soil data were used to determine soil textures and soil water characteristics of farmland in agro-ecosystems of CERN. Soil sampling was conducted every five years to depths of 40 to 400 cm of total soil depth to bedrock. Nitrate concentration of soil profiles was measured before and after planting, and after fertilization. Because soil data in agro-ecosystems were not fully analyzed, complete datasets from 15 stations (HLA, SYA, CSA, TYA, YTA, YGA, QYA, SPD, LDZ, ASA, CWA, FQA, YCA, LCA, LSA) only were used to evaluate the effects of soil texture on nitrate concentrations in soil and groundwater (Table 2).

2.3. Statistical Methods

All statistical analyses were performed by IBM SPSS Statistics ver. 19.0 (Chicago, IL, USA). Analysis of variance (ANOVA) was used to assess significant differences in nitrate N concentrations between different soil types. Simple linear fitting was used to fit the trends of nitrate concentration in groundwater in LZD and YGA stations.

3. Results

3.1. Nitrate Concentrations in Groundwater under Different Agro-Ecosystems

Concentrations of NO3-N in most of the groundwater samples were below the permissible limits for drinking water (<10 mg N·L−1), except for that at ASA (33.26 ± 22.47 mg N·L−1) (Table 3). This was despite nitrate N fertilization rates in these fields of 75 to 510 kg·hm−2. The average NO3-N concentration across the 39 wells beneath the 21 field stations was 4.26 mg·L−1. The average groundwater level ranged from 0.54 to 84.5 m, and mean NO3-N concentration ranged from 0.23 to 33.26 mg·L−1. In that, mean NO3-N concentrations in groundwater at most of the monitored stations in the Northeast and South agricultural areas were below 2 mg·L−1 (HLA, SYA, CSA, HJA, TYA, YTA, QYA). Mean NO3-N concentration in groundwater at the Northwest oasis agricultural and pastoral area ranged from 0.97 to 8.42 mg·L−1. Mean groundwater NO3-N concentration at the Northwest oasis (CLD, FKD, LZD, NMD, SPD, ESD) was 3.84 mg·L−1, higher than that in the Northeast (HJA, SYA) (mean value was 0.26 mg·L−1) and South agricultural ecosystems (CSA, HJA, TYA, YTA, YGA, QYA) (mean value was 2.0 mg·L−1).

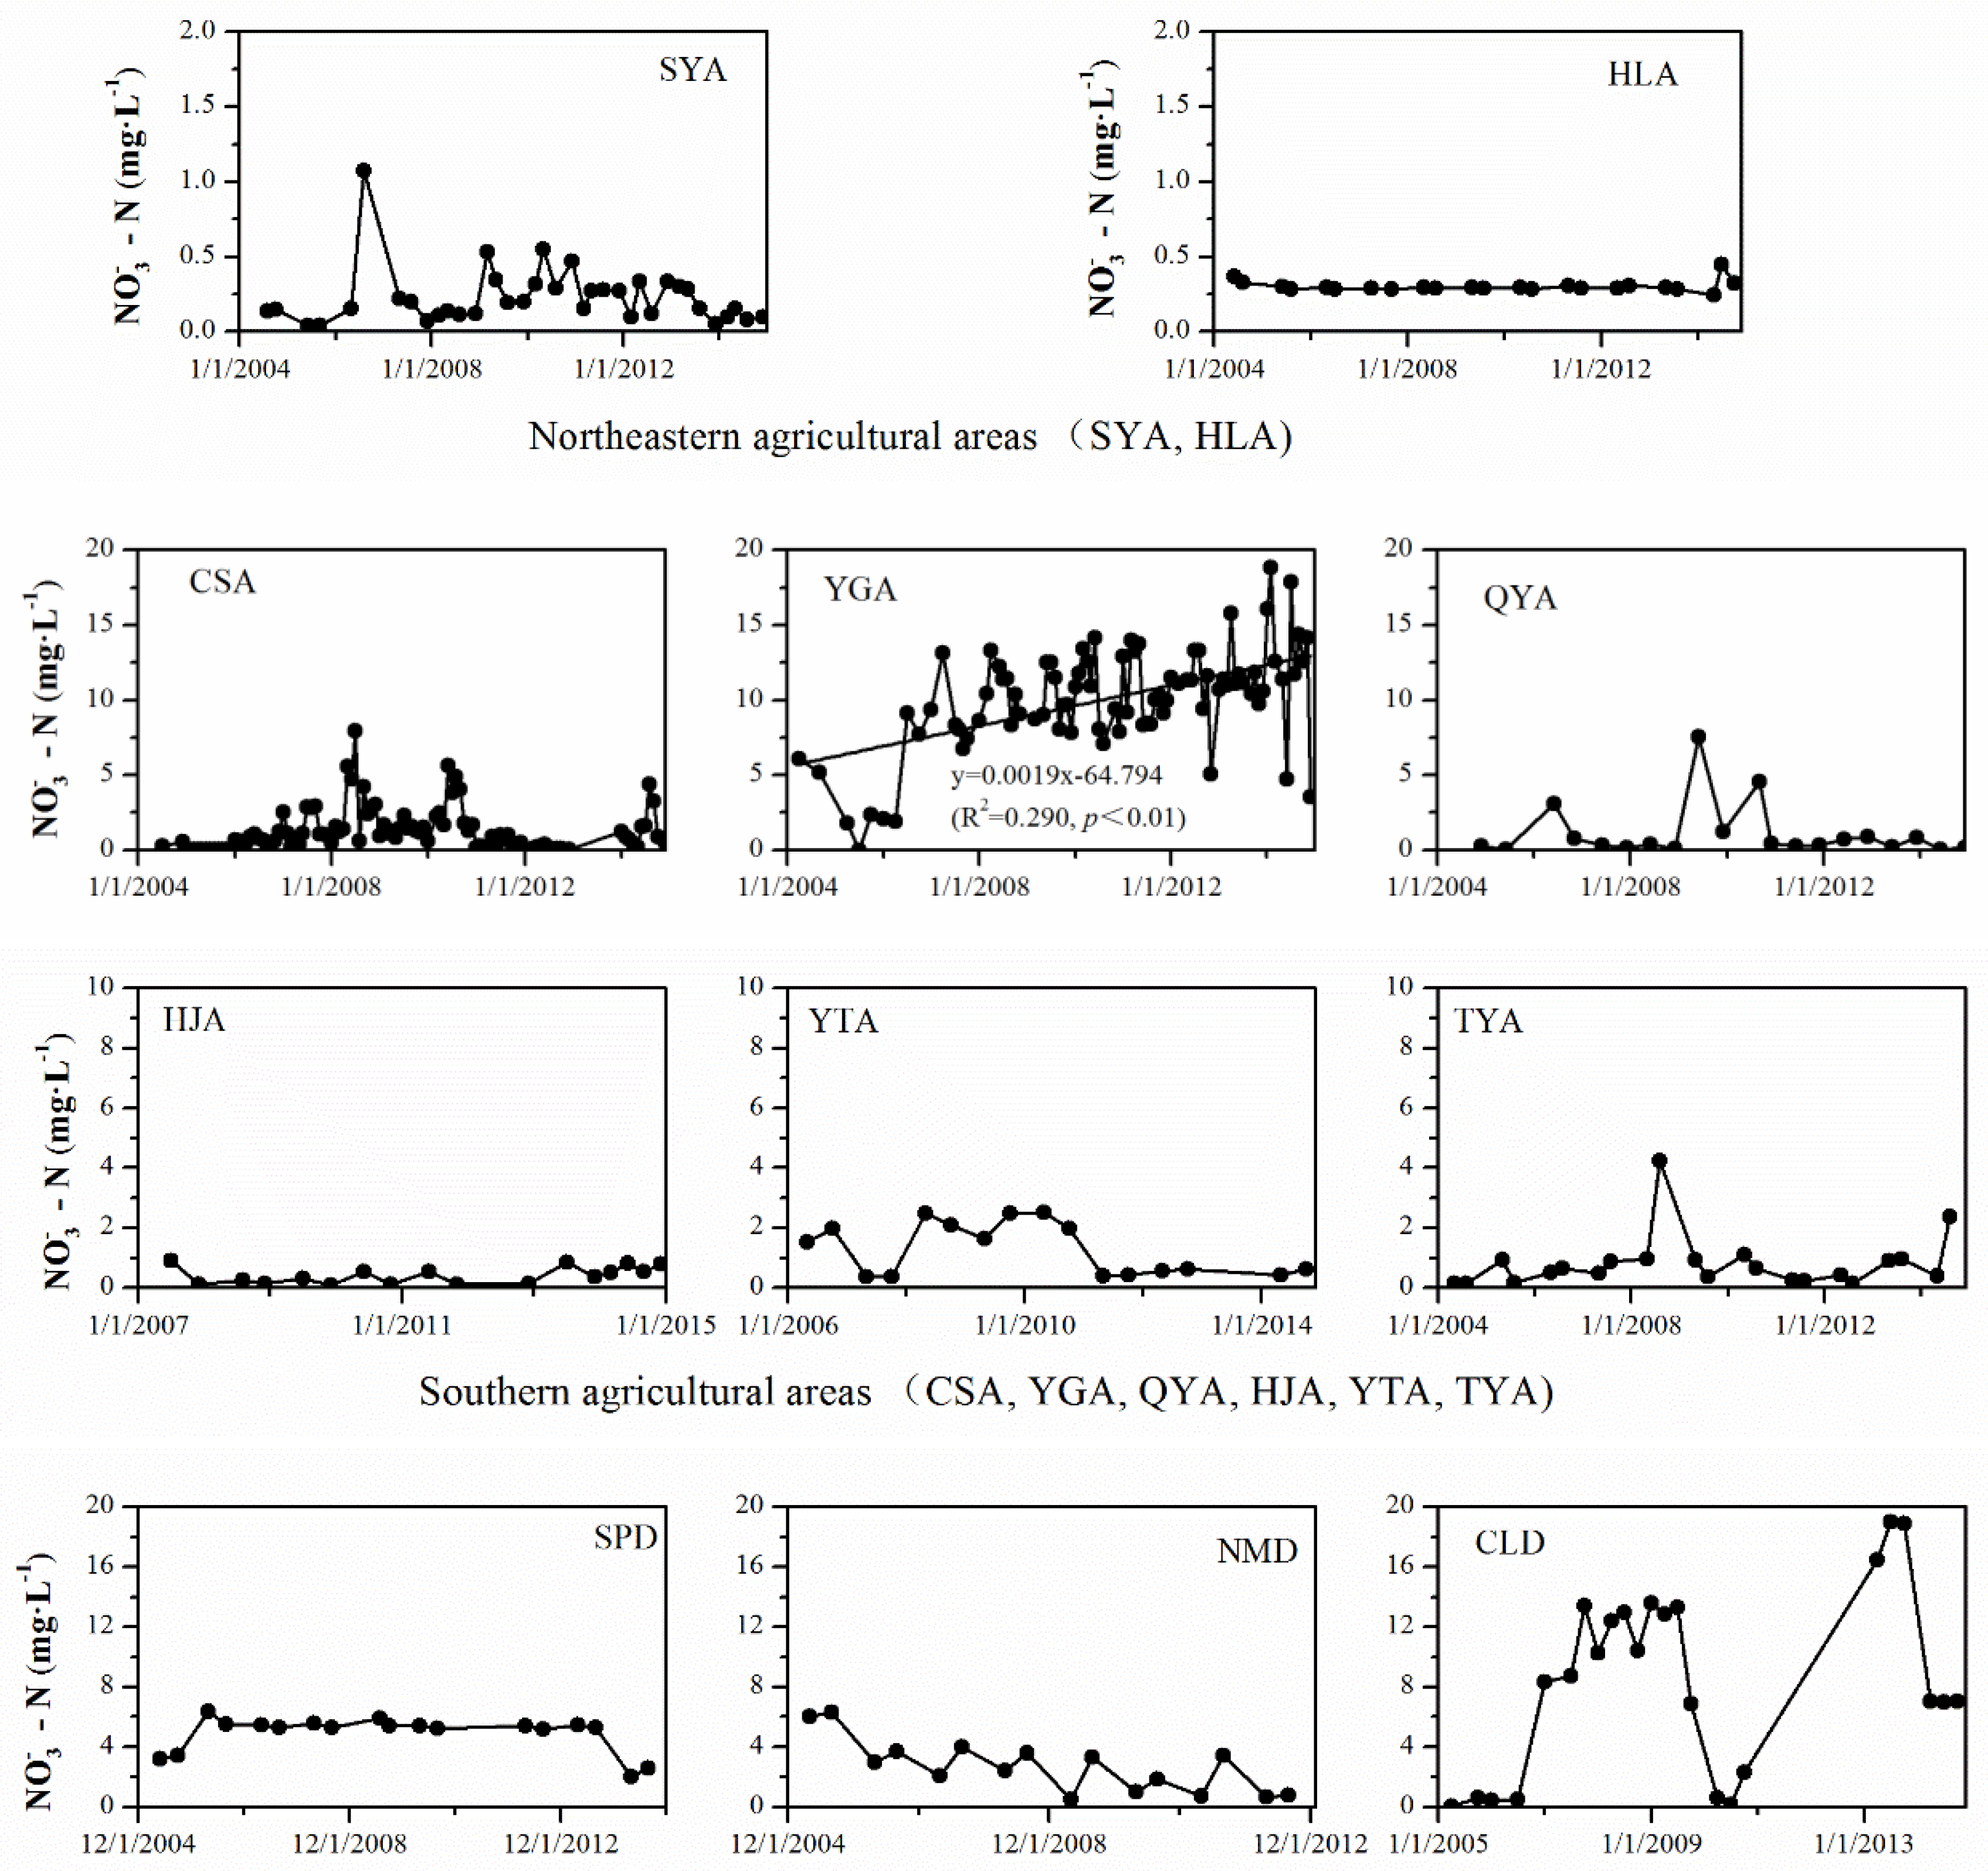
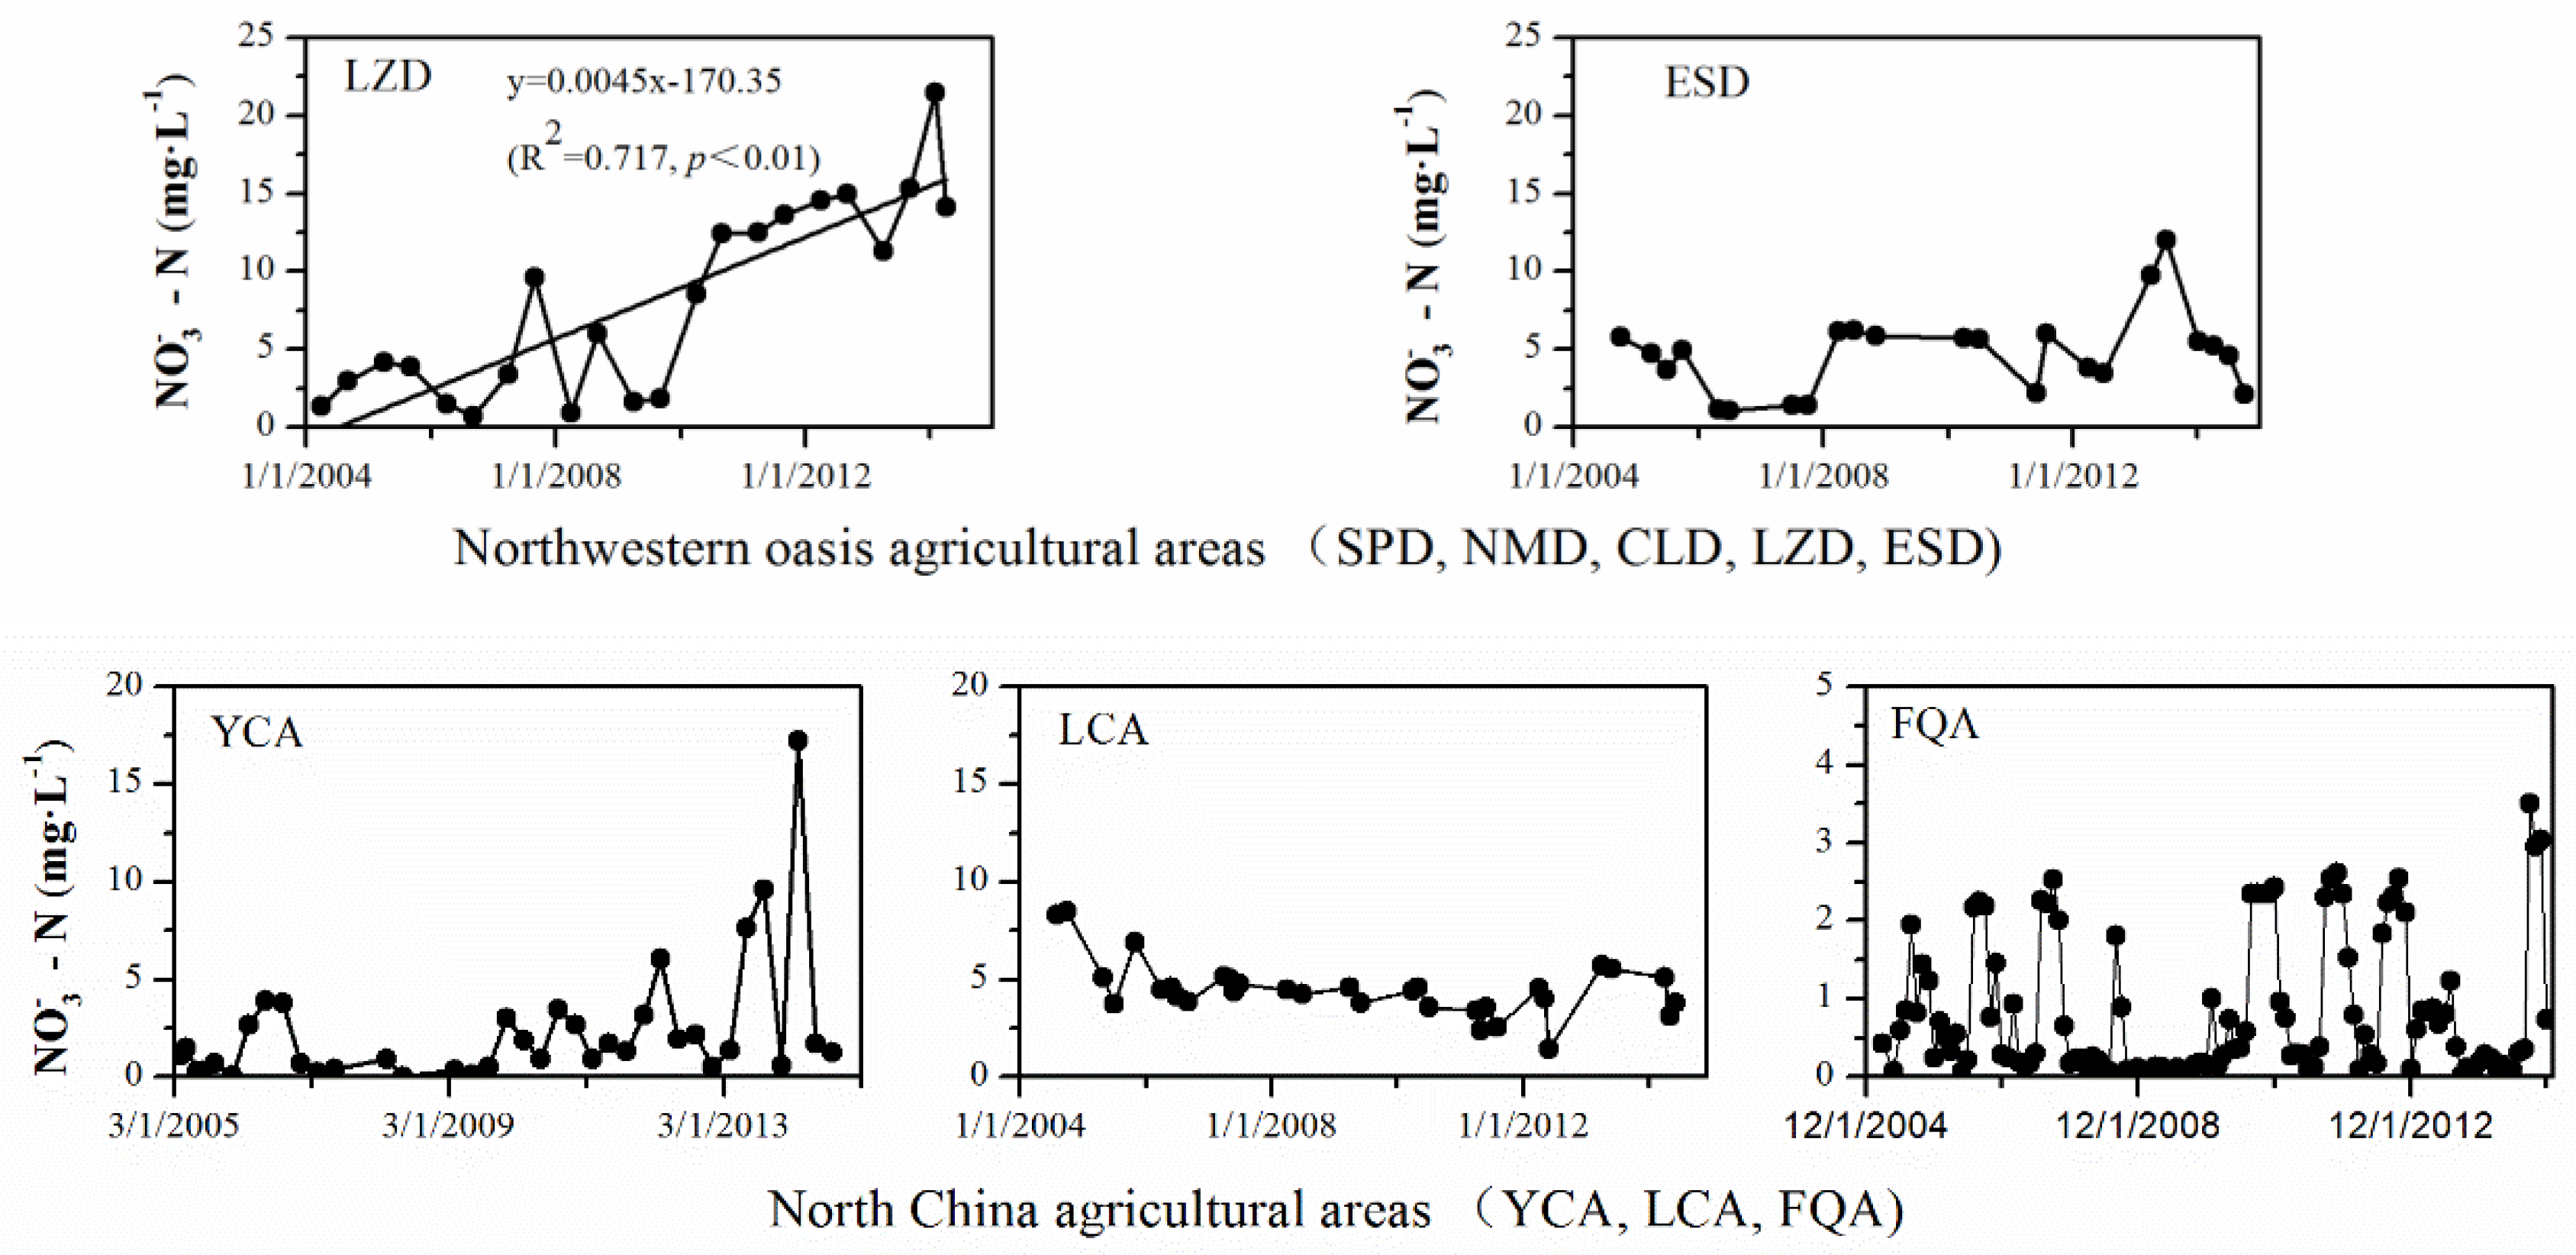
3.2. Temporal Variation of Nitrate Concentrations in Groundwater under Different Agro-Ecosystems

The results of groundwater monitoring indicated that the variability in NO3-N concentration presented a significant seasonal trend in most agro-ecosystems (Figure 2). NO3-N concentrations in SYA and HLA agro-ecosystems were high in May and June, respectively, while those in northwestern (NMD) and North China agro-ecosystems (FQA) were significantly higher in August and September than in any other months. Additionally, maximum groundwater nitrate concentration was observed in June in southern agro-ecosystems, such as YGA.
We also found that nitrate concentration in groundwater did not increase under intensive cultivation and under the present rate of heavy fertilization in most typical agro-ecosystems of CERN except for LZD and YGA (Figure 2). However, at LZD, nitrate concentration in groundwater tended to increase over time (R2 = 0.717, p < 0.01). The minimum and maximum values of NO3-N concentrations in groundwater in LZD were 0.72 and 21.49 mg·L1, respectively, with an average of 8.42 mg·L1. Further, (1) the annual average NO3-N concentration in 2014 was 7.1 times higher than that in 2004, (2) NO3-N concentrations exceeded the WHO-established limits for drinking water of 10 mg N·L−1 starting in August 2011. Meanwhile, groundwater nitrate concentration at YGA also had an increasing trend from 2004 to 2014 (R2 = 0.290, p < 0.01), and the average NO3-N concentration in the monitoring well beneath this farmland was 9.82 mg·L1. In fact, about 16.8% of 86 monitored samples at the YGA station exceeded the threshold value.

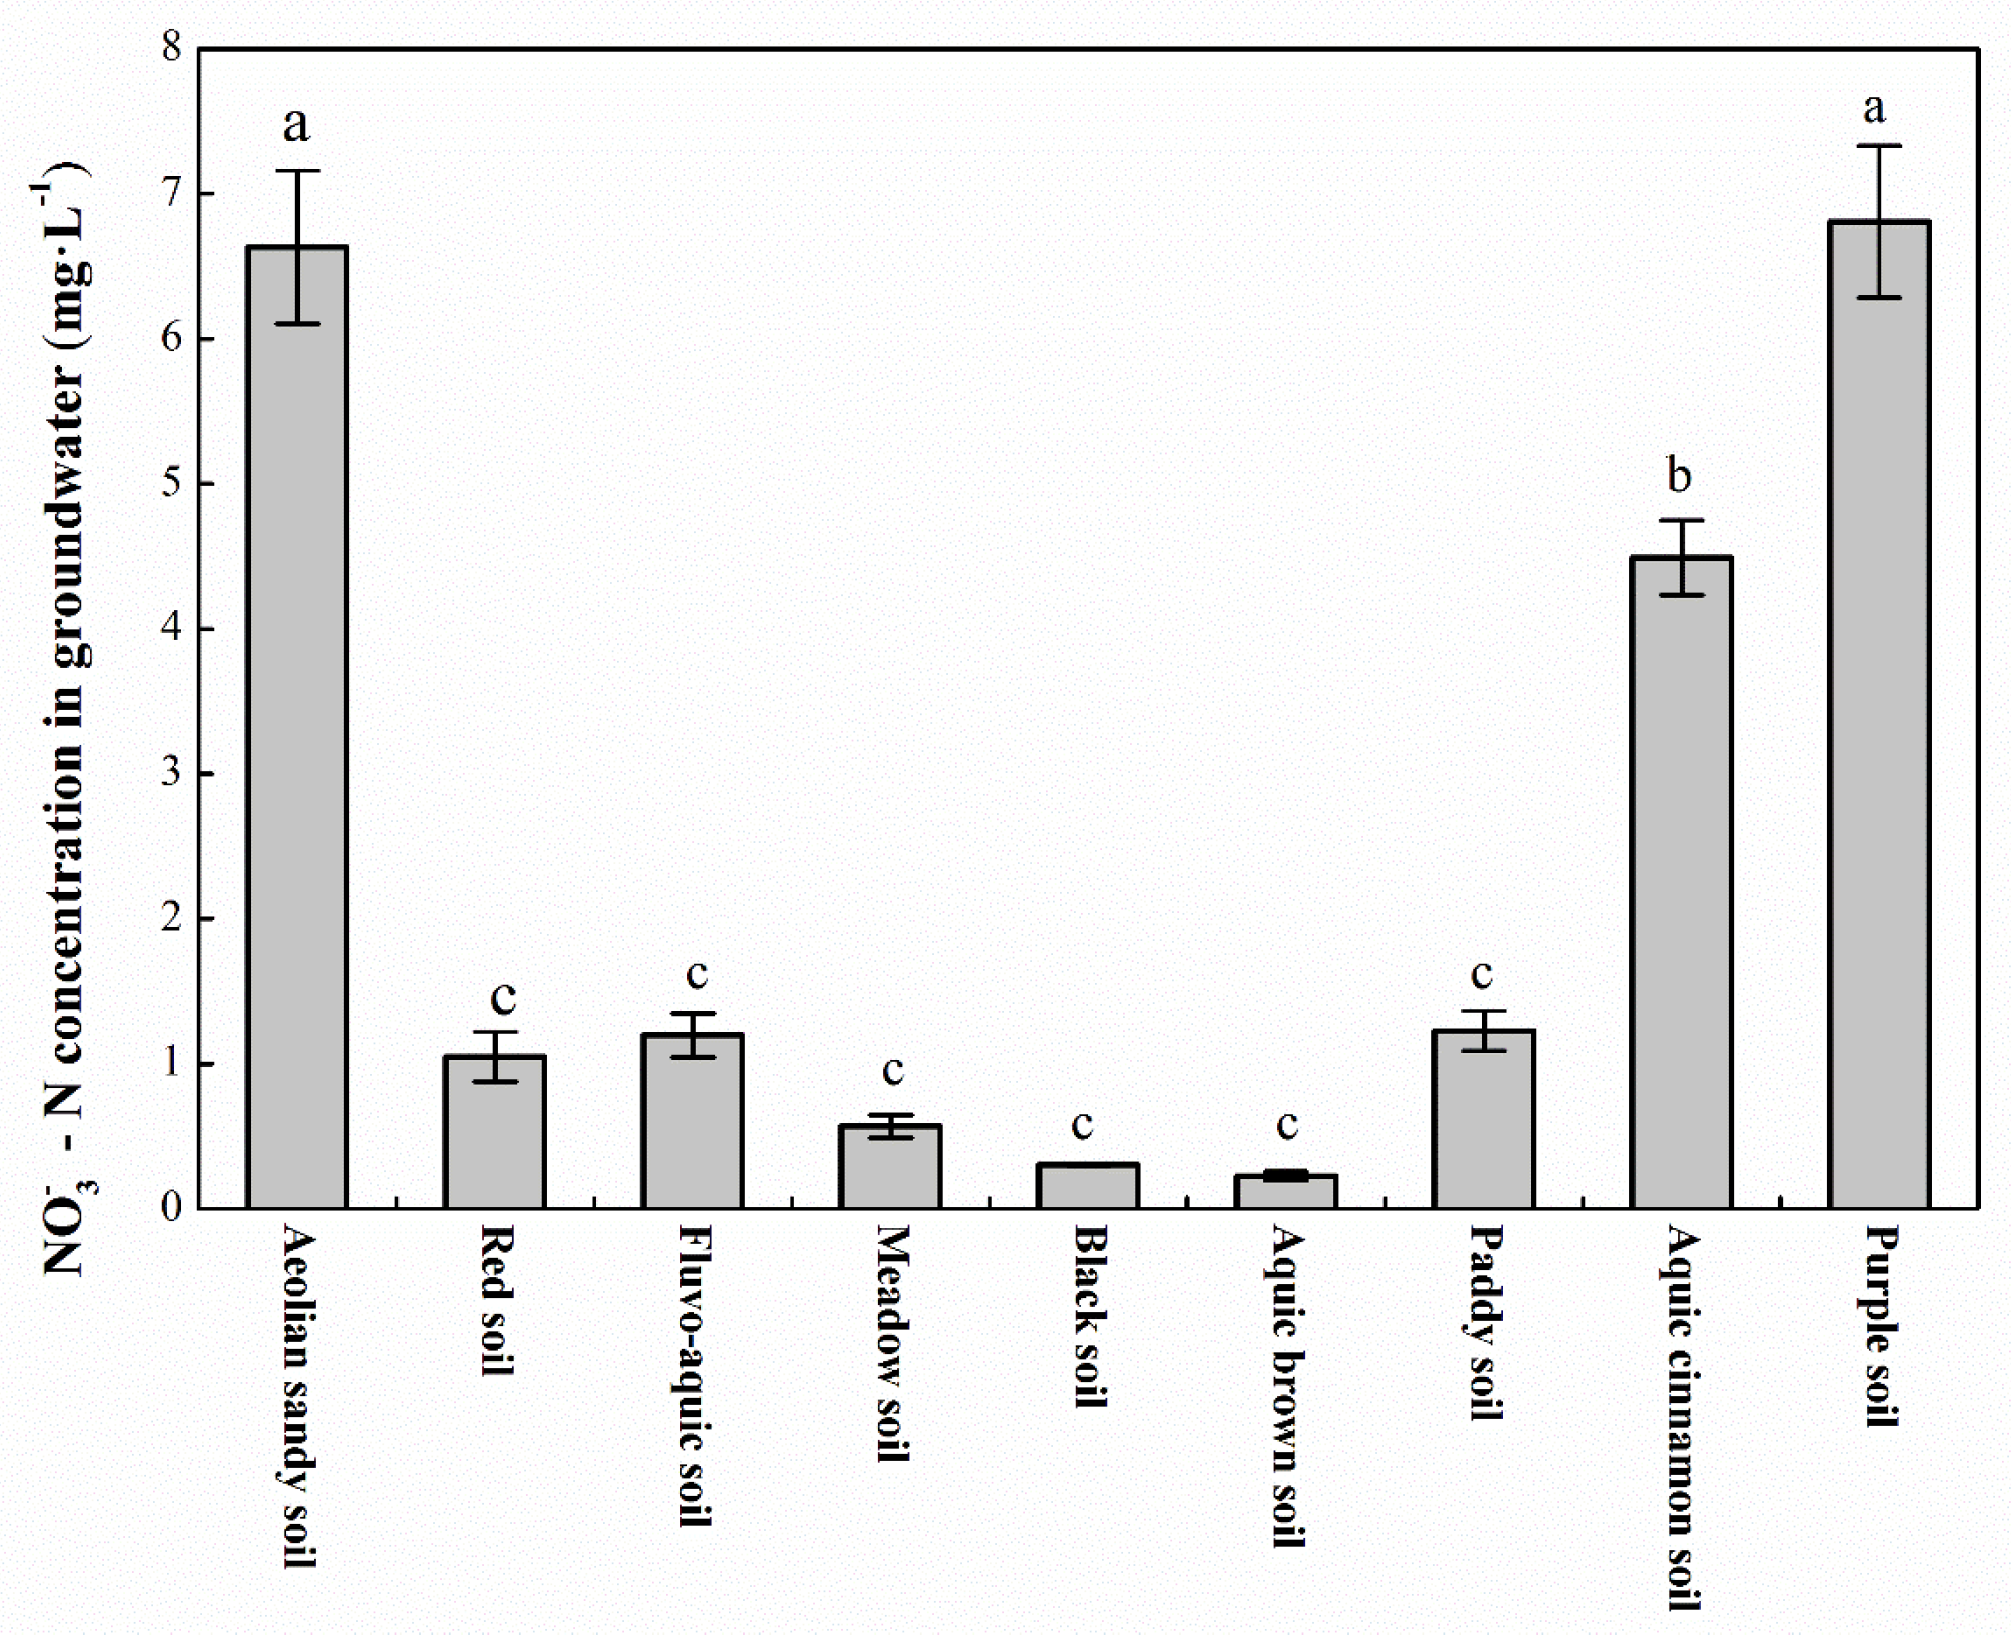
3.3. Nitrate Concentration in Groundwater under Different Soil Types

NO3-N concentrations in groundwater from CERN agro-ecosystems showed significant differences among soil types (Figure 3). Groundwater NO3-N concentration under purple soil (6.81 mg·L−1) and aeolian sandy soil (6.02 mg·L−1) was significantly higher (p < 0.05) than that under other soil types. Aquic cinnamon soil in the LCA agro-ecosystem exhibited medium-high groundwater NO3-N concentration (4.49 mg·L−1), while red, fluvo-aquic, meadow, black, aquic brown, and paddy soil had low groundwater NO3-N concentrations with no significant differences. At SPD and LZD stations, sand contents of aeolian sandy soil were highest of all at 72.7% and 86.6%, respectively, in the 0- to 100-cm soil, with mean soil NO3-N concentrations of 1.5 mg kg−1 and 3.2 mg kg−1 (20 cm depth), respectively (Table 2). Fluvo-aquic soil (FQA, YCA) and aquic cinnamon soil (LCA) had lower sand and higher silt contents than soils at SPD and LZD, with the mean soil NO3-N of 29 mg kg−1. Similarly, paddy soil (CAS) and red soil (TYA, YTA) had low sand and high silt contents, and mean soil NO3-N of 8.7 mg kg−1, and 2.4 mg kg−1, respectively.

4. Discussion

4.1. Spatial Variation of Nitrate-N Concentrations in Groundwater

To date, there is still lack of a comprehensive understanding of the distribution of nitrate in the groundwater in China, due to the limited sampling density or lack of necessary hydraulic data. Long-term investigations of site-specific pollution within an isolated region usually provide more information than extensive random sampling with limited numbers of samples. Therefore, in our study, the spatial and temporal variation patterns of nitrate concentrations in groundwater under agricultural activities were investigated based on nearly a decade of groundwater quality data from 21 agro-ecosystems of CERN in China, which could excluded the interference of individual climate events. Our results indicated that concentrations of NO3-N in groundwater of CERN agro-ecosystems were mostly below the permissible limits for drinking water (<10 mg N·L1). During 2004 to 2014, the average NO3-N concentration for the 39 monitoring wells beneath 21 agro-ecosystems was 4.26 mg·L−1, higher than observed in a study conducted from 2004 to 2010 (4.1 ± 0.33 mg·L1; [22]). This indicated that NO3-N concentration has been increasing at 0.05 mg·L−1 per year (from 2010 to 2014). Generally, in agricultural ecosystems, agricultural activity is the most significant human factor influencing nitrogen sources and generating nitrate pollution in groundwater. High application rates of N fertilizer have a significant potential for nitrate leaching [3,23]. Research suggests that 8-12% of the applied fertilizer, applied at 120 kg N·ha−1·y−1, leaked toward the hydrosphere [24]. In China, 15–30% of the labeled fertilizer N, applied at 160 kg N·ha−1·y−1, remained in the soil after harvest [25]. In this study, the rate of N fertilization varied widely among regions and crops, and elevated NO3-N concentrations were observed in sites with high and with low rates of applied N fertilizer. For example, in the CLD and LCA agro-ecosystem, the annual average N fertilizer application rates were 468 and 390 kg N·ha−1, respectively, with the corresponding mean NO3-N concentrations of 4.04 and 4.49 mg·L1. However, the average N fertilizer application rates in ASA and LZD were relatively low (120 and 122 kg N·ha−1), while the mean NO3-N concentrations (33.26 and 8.42 kg N·ha−1) were relatively high.
Additionally, we also found that nitrate concentrations in groundwater in all agro-ecosystems differed significantly with climate. For example, relatively high nitrate concentrations were observed in arid and semi-arid climate of the Northwest oasis agricultural ecosystem (CLD, FKD, LZD, NMD, SPD, ESD), where the mean nitrate concentration of groundwater was higher than that in humid and semi-humid region of the Northeast (HJA, SYA) and in humid region of the South agricultural ecosystems (CSA, HJA, TYA, YTA, YGA, QYA). In southern high-rainfall areas, nitrate leaching is the main cause of groundwater pollution [25], while in arid and semi-arid regions, rainfall is relatively scarce, and continuous recharge of groundwater from precipitation is almost negligible [26,27]. However, occasional heavy rainfall can transport surface NO3 deep into the soil profile, and cause N loss by surface runoff, especially in the Loess Plateau [28]. For example, ASA agro-ecosystem is a typical hilly loess terrain of the Loess Plateau. Because topography of the loess area is fragmented, and loess soil is very thick with low porosity, rates of nitrification are high (2–5 mg kg−1 d−1) [28]. Also, in-depth studies revealed that the chemical characteristics of shallow groundwater in the loess area exhibited a significant spatial variability, with high nitrate. Moreover, irrigation was another important influencing factor in elevated nitrate concentration in groundwater, because irrigation water not only promoted the leaching of N fertilizer into shallow groundwater, but also reduced the potential for ammonia volatilization [29]; ammonia volatilization is a major pathway for reducing nitrate concentrations [30]. In arid and semi-arid agro-ecosystems such as ASA, YCA, LZD, NMD, FKD, CLD, and SPD, crop productivity depends heavily on irrigation, which may make groundwater susceptible to nitrate-N pollution. Our results suggested that high application rates of N fertilizer combined with flood irrigation may cause nitrate-N pollution in specific regions, but not necessarily act as the sole factor influencing nitrate-N pollution of groundwater. This finding further supports the idea that the hydrographical and geographical conditions were involved in a possible mechanism affecting the spatial characteristics of nitrate diffusion to groundwater on the national scale.

4.2. Temporal Variation of Nitrate-N Concentrations in Groundwater

Generally, the dynamic changes and temporal trends of nitrate concentrations were explored using long-term monitoring datasets [22,31,32]. Based on the long-term observation data, we investigated the dynamic of groundwater nitrate-N concentrations under agricultural activities. The results of our study showed that NO3-N concentrations neither significantly increased nor decreased in the majority of the wells except for those in the LZD and YGA agro-ecosystems. In LZD and YGA stations, we found that NO3-N concentration had an increasing trend from 2004 to 2014; increasing nitrate levels may accumulate over time and pollute groundwater. For instance, the mean NO3-N concentration at the LZD monitoring wells in the Zhangye Oasis was 8.42 mg·L1. Similarly, Yang et al. [12] observed in the Zhangye Oasis that mean NO3-N concentration in groundwater was 10.66 mg·L1, and 32.4% of 71 wells exceeded the WHO-established limits for drinking water (10 mg N·L1), confirm that groundwater in long-term oasis agro-ecosystems was seriously contaminated NO3-N. At the YGA station in Sichuan Province, NO3-N concentration in 16.8% of the samples was above 10 mg N·L1, suggesting that nitrate pollution had occurred in this area due to facilitation of accumulated nitrate movement into subsurface flow by the slopes and purple soil [33]. Moreover, vegetable cultivation was another main contributor to NO3-N content in groundwater, while precipitation and well depth also influenced groundwater NO3-N contents [22,33,34].
Here, temporal trends showed that NO3-N concentrations neither significantly rose nor fell in majority of the wells (Figure 2), but in general, it exhibited a seasonal fluctuation in monitored regions. However, the highest and lowest NO3-N concentrations in different agro-ecosystems were observed in different seasons. Thus, NO3-N peaked in wet season, and dropped to the lowest level in dry season in regions which included irrigation areas in northern China; this was similar to the seasonal concentration patterns reported for two farmlands in northern China [35]. In contrast, high values of nitrate were observed during the rainy season in July and August in some rain-fed farming regions of southern China (CSA, YGA, TYA). It is very likely that the seasonal increase in nitrate concentration occurred due to nitrogen leaching into groundwater with rainfall or irrigation. For most northern agricultural areas, elevated nitrate concentrations in winter were likely associated with winter irrigation. Field experiments with a continuous winter wheat-summer maize double-cropping rotation showed that residual nitrate from summer moved out of the 0–100 cm soil profile during winter due to winter flood irrigation [36].

4.3. Nitrate-N Concentrations in Groundwater under Different Soil Types

In this study, we found that NO3-N concentrations in wells beneath purple and aeolian sandy soils were significantly higher (p < 0.05) than those under other soil types, and that aquic cinnamon soil in the LCA agro-ecosystem exhibited medium-high concentration of groundwater NO3-N (4.49 mg·L−1). Purple soil is characterized by a shallow soil layer (60 cm), and a low- infiltration parent material. Subsurface runoff was the main pathway of nitrate leaching in purple soil in the rainy season [35]. Annual average loss of NO3-N through subsurface flow was 27.29 kg·ha−1, accounting for 10% of total N fertilizer application rate (280 kg·hm−2) within a year [37]. Therefore, nitrate leaching from hilly crop land in purple soils results in groundwater pollution. In northern China, most soils are calcareous, including aeolian sandy and aquic cinnamon soils (with a pH of about 8), where NO3 cannot be retained. Research has shown a negative correlation between the retention of NO3-N and sandy contents in soils [38]. Sandy soils usually have higher water permeability rates than do loam soils [39], promoting leaching of N fertilizer into shallow groundwater in arid and semiarid oasis agricultural ecosystems. This corresponds with the results of Su et al. [40], who found that newly-cultivated sandy farmlands were prone to nitrate leaching, and at high-risk for groundwater nitrate pollution.
Here, we also found that there was no significant difference in NO3-N concentrations in wells in the red, fluvo-aquic, meadow, black, aquci brown and paddy soils. In southern humid and semi-humid areas, NO3-N concentration in groundwater in paddy ecosystems (CSA, TYA, QYA) was usually lower than in other land use types because of finer-grained sediments and favorable drainage. Lowest amounts of NO3-N in the 0- to 400 cm soil profile were observed near Beijing City in paddy fields compared with commercial vegetables, orchards, winter wheat-summer maize rotation, and spring corn fields [35].

4.4. Mitigation Measures

NO3-N pollution of groundwater jeopardizes the sustainability of groundwater resources and agricultural productivity in some regions. However, implementation of preventive management and legislation can help to reduce NO3-N accumulation and leaching from soil.
Typically, reducing total N input is the most effective and direct way to reduce NO3-N leaching [28]. Because soil fertility varies significantly from location to location, it is necessary to optimize N fertilizer applications, and to incorporate a fertilizer formula based on soil fertility status and plant N demand. Further, research has shown that the application of phosphorus in combination with N can reduce leaching of NO3-N in the soil profile [41,42], and that this effect can be enhanced by the use of manure [40,43].
Additionally, extreme rainfall events or excessive irrigation may promote nitrate leaching into deep soil. Therefore, reducing or eliminating summer fallow and planting catch crops during winter played an important role in decreasing residual soil N and minimizing NO3-N leaching [44,45]. The adoption of advanced irrigation methods, such as drip irrigation, soil-less culture, and greenhouses can reduce the quantity of nitrate available in the soil, thus reducing N leaching losses to groundwater and preventing groundwater pollution [46].
Finally, selecting proper rotation scheduling, reducing the frequency of summer fallow, and using alternative crops may be effective in preventing nitrate leaching after harvest. Raising awareness among farmers about the dangers of groundwater nitrate pollution, and formulating agricultural environmental policies and legislation need to be incorporated as critical components of efforts to address issues of water quality.

5. Conclusions

In China, NO3-N concentration in groundwater in agro-ecosystems varied significantly with climate and topography. Mean groundwater NO3-N concentration of 21 agro-ecosystems was 4.26 mg·L−1, and increased 0.4% after 2010. In general, NO3-N concentrations in northern and northwestern agro-ecosystems were relatively higher than those in northeast and southern agro-ecosystems. Temporal trends showed that NO3 - N concentrations neither significantly increased nor decreased in majority of the monitored wells except for LZD and YGA, but exhibited a seasonal fluctuation in monitored regions. NO3-N concentrations at the LZD and YGA stations were slowly increasing from 2004 to 2014, suggesting that nitrate may accumulate over time and pollute groundwater. Moreover, groundwater NO3-N concentrations under purple soil (6.81 mg·L−1) and aeolian sandy soil (6.02 mg·L−1) were significantly higher (p < 0.05) than those under other soil types. Aquic cinnamon soil in LCA agro-ecosystem exhibited medium-high groundwater nitrate-N concentration (4.49 mg·L−1), while red, fluvo-aquic, meadow, black, aquic brown and paddy soils had low groundwater NO3-N concentrations with no significant difference.
The problem of elevated nitrate concentration of groundwater was observed in specific areas. For example, the observation wells of agro-ecosystems in arid and semi-arid regions had elevated nitrate concentration, especially at LZD and ASA, where groundwater nitrate pollution is ongoing. Therefore, groundwater in arid, semi-arid, and loess plateau areas would be more vulnerable to contamination from nitrate. Authors should discuss the results and how they can be interpreted in perspective of previous studies and of the working hypotheses. The findings and their implications should be discussed in the broadest context possible. Future research directions may also be highlighted.
Because NO3-N pollution of groundwater can affect the sustainability of groundwater resources and agricultural productivity in some regions, it is necessary to increase the number of monitored groundwater wells and the frequency of monitoring work on a national scale. Further, we recommend implementing some mitigation strategies to alleviate NO3-N pollution of groundwater, such as control of N fertilizer input, balanced fertilization, proper rotation system, adoption of improved irrigation methods, and establishment of environmental policies. In addition, to pay attention to the serious issues of water quality, we recommend raising awareness among administrators, scientists and farmers.

Author Contributions

The authors contributed equally in research design, data collection and manuscript development.

Acknowledgments

This research was supported by the national key research and development program of China (No. 2017YFC0504306), the Major Program of National Natural Science Foundation of China (No. 41630861), the National Natural Science Foundation of China (No. 41501044) and the CAS “Light of West China” Program. We gratefully acknowledge the team of Chinese Ecosystem Research Network, who designed the monitoring networks and collected and analyzed the samples used in this study.

Conflicts of Interest

The authors declare no conflict of interest.

References

  1. Bárdossy, A. Copula-based geostatistical models for groundwater quality parameters. Water Resour. Res. 2006, 42, 11416. [Google Scholar] [CrossRef]
  2. Velthof, G.L.; Lesschen, J.P.; Webb, J.; Pietrzak, S.; Miatkowski, Z.; Pinto, M.; Kros, J.; Oenema, O. The impact of the Nitrates Directive on nitrogen emissions from agriculture in the EU-27 during 2000–2008. Sci. Total Environ. 2014, 468–469, 1225–1233. [Google Scholar] [CrossRef] [PubMed]
  3. Mencio, A.; Mas-Pla, J.; Otero, N.; Regas, O.; Boy-Roura, M.; Puig, R.; Bach, J.; Domenech, C.; Zamorano, M.; Brusi, D.; et al. Nitrate pollution of groundwater; all right..., but nothing else? Sci. Total Environ. 2016, 539, 241–251. [Google Scholar] [CrossRef] [PubMed] [Green Version]
  4. Gulis, G.; Czompolyova, M.; Cerhan, J.R. An ecologic study of nitrate in municipal drinking water and cancer incidence in Trnava District, Slovakia. Environ. Res. 2002, 88, 182–187. [Google Scholar] [CrossRef] [PubMed]
  5. Fazal, A.; Imaizumi, M.; Ishida, S.; Kawachi, T.; Tsuchihara, T.; Takenuchi, J.; Badiul Alam, A.H.M. Review on Groundwater Nitrate Contamination: Causes, Effects and Remedies: A Guideline for Efficient Management Strategies. J. Rainwater Catchment Syst. 2003, 8, 15–33. [Google Scholar] [CrossRef]
  6. Ju, X.T.; Xing, G.X.; Chen, X.P.; Zhang, S.L.; Zhang, L.J.; Liu, X.J.; Cui, Z.L.; Yin, P.; Christie, P.; Zhu, Z.L. Reducing environmental risk by improving N management in intensive Chinese agricultural systems. Proc. Natl. Acad. Sci. USA 2009, 106, 3041–3046. [Google Scholar] [CrossRef] [PubMed] [Green Version]
  7. Bailey, R.T.; Gates, T.K.; Romero, E.C. Assessing the effectiveness of land and water management practices on nonpoint source nitrate levels in an alluvial stream-aquifer system. J. Contam. Hydrol. 2015, 179, 2–15. [Google Scholar] [CrossRef] [PubMed]
  8. National Research Council. Ground Water Vulnerability Assessment: Contamination Potential under Conditions of Uncertainty. Committee on Techniques for Assessing Ground Water Vulnerability. In Water Science and Technology Board, Commission on Geosciences, Environment, and Resources; National Academy Press: Washington, DC, USA, 1993. [Google Scholar]
  9. U.S. Environmental Protection Agency Office of Water. Drinking Water Regulations and Health Advisories; US Environmental Protection Agency, Office of Water: Washington, DC, USA, 1996.
  10. Department of Geology and Mineral Resources. China National Standard: Quality Standard for Ground Water; GB/T 14848-93; Department of Geology and Mineral Resources: Beijing, China, 1994.
  11. Ma, H.; Li, X.X.; Hu, C.S. Status of Nitrate Nitrogen Contamination of Groundwater in China. Chin. J. Soil Sci. 2012, 43, 1532–1536. (In Chinese) [Google Scholar]
  12. Yang, R.; Liu, W.J. Nitrate contamination of groundwater in an agroecosystem in Zhangye Oasis, Northwest China. Environ. Earth Sci. 2009, 61, 123–129. [Google Scholar] [CrossRef]
  13. Sebilo, M.; Mayer, B.; Nicolardot, B.; Pinay, G.; Mariotti, A. Long-term fate of nitrate fertilizer in agricultural soils. Proc. Natl. Acad. Sci. USA 2013, 110, 18185–18189. [Google Scholar] [CrossRef] [PubMed]
  14. Almasri, M.N.; Kaluarachchi, J.J. Assessment and management of long-term nitrate pollution of ground water in agriculture-dominated watersheds. J. Hydrol. 2004, 295, 225–245. [Google Scholar] [CrossRef]
  15. Aulakh, M.S.; Malhi, S.S. Interactions of Nitrogen with Other Nutrients and Water: Effect on Crop Yield and Quality, Nutrient Use Efficiency, Carbon Sequestration, and Environmental Pollution. In Advances in Agronomy; Academic Press: Cambridge, MA, USA, 2005; pp. 341–409. [Google Scholar]
  16. Wakida, F.T.; Lerner, D.N. Non-agricultural sources of groundwater nitrate: A review and case study. Water Res. 2005, 39, 3–16. [Google Scholar] [CrossRef] [PubMed]
  17. Zhang, X.; Davidson, E.A.; Mauzerall, D.L.; Searchinger, T.D.; Dumas, P.; Shen, Y. Managing nitrogen for sustainable development. Nature 2015, 528, 51–59. [Google Scholar] [CrossRef] [PubMed]
  18. Zhang, W.L.; Tian, Z.X.; Zhang, N.; Li, X.Q. Nitrate pollution of groundwater in northern China. Agric. Ecosyst. Environ. 1996, 59, 223–231. [Google Scholar] [CrossRef]
  19. Mclay, C.D.; Dragten, R.; Sparling, G.; Selvarajah, N. Predicting groundwater nitrate concentrations in a region of mixed agricultural land use: A comparison of three approaches. Environ. Pollut. 2001, 115, 191–204. [Google Scholar] [CrossRef]
  20. Yuan, G.F.; Tang, D.Y.; Sun, X.M. Water Monitoring Protocol of Chinese Ecosystem Research Network; China Environmental Science Press: Beijing, China, 2007. [Google Scholar]
  21. Li, S.; Yu, G.; Yu, X.; He, H.; Guo, X. A brief introduction to Chinese Ecosystem Research Network (CERN). J. Resour. Ecol. 2015, 6, 192–196. [Google Scholar]
  22. Zhang, X.Y.; Xu, Z.W.; Sun, X.M.; Dong, W.Y.; Ballantine, D. Nitrate in shallow groundwater in typical agricultural and forest ecosystems in China, 2004–2010. J. Environ. Sci. 2013, 25, 1007–1014. [Google Scholar] [CrossRef]
  23. Kim, H.; Park, S. Hydrogeochemical Characteristics of Groundwater Highly Polluted with Nitrate in an Agricultural Area of Hongseong, Korea. Water 2016, 8, 345. [Google Scholar] [CrossRef]
  24. Castellano, M.J.; David, M.B. Long-term fate of nitrate fertilizer in agricultural soils is not necessarily related to nitrate leaching from agricultural soils. Proc. Natl. Acad. Sci. USA 2014, 111, E766. [Google Scholar] [CrossRef] [PubMed]
  25. Ju, X.T.; Liu, X.J.; Zhang, F.S.; Roelcke, M. Nitrogen Fertilization, Soil Nitrate Accumulation, and Policy Recommendations in Several Agricultural Regions of China. Ambio 2004, 33, 300–305. [Google Scholar] [CrossRef] [PubMed]
  26. Qi, S.Z.; Luo, F. Water environmental degradation of the Heihe River Basin in arid northwestern China. Environ. Monit. Assess. 2005, 108, 205–215. [Google Scholar] [CrossRef] [PubMed]
  27. Qin, D.J.; Qian, Y.P.; Han, L.F.; Wang, Z.M.; Li, C.; Zhao, Z.F. Assessing impact of irrigation water on groundwater recharge and quality in arid environment using CFCs, tritium and stable isotopes, in the Zhangye Basin, Northwest China. J. Hydrol. 2011, 405, 194–208. [Google Scholar] [CrossRef]
  28. Fan, J.; Hao, M.D.; Malhi, S.S. Accumulation of nitrate N in the soil profile and its implications for the environment under dryland agriculture in northern China: A review. Can. J. Soil Sci. 2010, 90, 423–429. [Google Scholar] [CrossRef]
  29. Di, H.J.; Cameron, K.C. Nitrate leaching in temperate agro-ecosystems, sources, factors and mitigating strategies. Nutr. Cycl. Agro-Ecosyst. 2002, 46, 237–256. [Google Scholar] [CrossRef]
  30. Zhang, S.L.; Cai, G.X.; Wang, X.Z.; Xu, Y.H.; Zhu, Z.L.; Ferney, J.R. Losses of urea-nitrogen applied to maize on a calcareous flubo-aquic soil in North China Plain. Pedosphere 1992, 2, 171–178. [Google Scholar]
  31. Harter, T.; Davis, H.; Mathews, M.C.; Meyer, R.D. Shallow groundwater quality on dairy farms with irrigated forage crops. J. Contam. Hydrol. 2002, 55, 287–315. [Google Scholar] [CrossRef]
  32. Williams, M. Groundwater Level and Nitrate Concentration Trends on Mountain Home Air Force Base, Southwestern Idaho. Open-File Rep. 2014. [Google Scholar] [CrossRef]
  33. Xu, Z.W.; Zhang, X.Y.; Sun, X.M.; Yuan, G.F.; Wang, S.Z.; Liu, W.H. Assessment of shallow groundwater nitrate concentrations in typical terrestrial ecosystems of Chinese Ecosystem Research Network (CERN) during 2004–2009. Environ. Sci. 2011, 32, 2827–2833. [Google Scholar]
  34. Wang, T.; Zhu, B.; Cao, M.R.; Xu, T.P.; Kuang, F.H. Nitrate pollution of groundwater in a typical small watershed in the Central Sichuan Hilly Region. J. Ecol. Rural Environ. 2006, 22, 84–87. [Google Scholar]
  35. Liu, H.B.; Li, Z.H.; Zhang, Y.G. Characteristics of Nitrate Distribution and Accumulation in Soil Profiles under Main Agro-land Use Types in Beijing. Sci. Agric. Sin. 2004, 37, 692–698. [Google Scholar]
  36. Ju, X.T.; Liu, X.J.; Zhang, F.S. Accumulation and movement of NO3-N in soil profile in winter wheat-summer maize rotation system. Acta Pedol. Sin. 2003, 40, 538–546. [Google Scholar]
  37. Zhu, B.; Wang, T.; Kuang, F.; Xu, T.; Tang, J.; Wu, Y. Characteristics of nitrate leaching from hilly cropland of purple soil. Acta Sci. Circumst. 2008, 28, 525–533. [Google Scholar]
  38. Gaines, T.P.; Gaines, S.T. Soil texture effect on nitrate leaching in soil percolates. Commun. Soil Sci. Plant Anal. 1994, 25, 2561–2570. [Google Scholar] [CrossRef]
  39. Jamieson, R.C.; Gordon, R.J.; Sharples, K.E.; Stratton, G.W.; Madani, A. Movement and persistence of fecal bacteria in agricultural soils and subsurface drainage water: A review. Can. Biosyst. Eng. 2002, 44, 1–1. [Google Scholar]
  40. Su, Y.Z.; Yang, R. Background concentrations of elements in surface soils and their changes as affected by agriculture use in the desert-oasis ecotone in the middle of Heihe River Basin, North-west China. J. Geochem. Explor. 2008, 98, 57–64. [Google Scholar] [CrossRef]
  41. Yuan, X.M.; Tong, Y.A.; Yang, X.Y.; Li, X.L.; Zhang, F.S. Effect of phosphate application on soil nitrate nitrogen accumulation. Plant Nutr. Fertil. Sci. 2000, 6, 397–403. [Google Scholar]
  42. Yang, Z.P.; Mei, X.; Gao, F.; Li, Y.; Guo, J. Effect of Different Nitrogen Fertilizer Types and Application Measures on Temporal and Spatial Variation of Soil Nitrate-Nitrogen at Cucumber Field. J. Environ. Prot. 2013, 4, 129–135. [Google Scholar] [CrossRef]
  43. Yang, R.; Su, Y.Z.; Wang, T.; Yang, Q. Effect of chemical and organic fertilization on soil carbon and nitrogen accumulation in a newly cultivated farmland. J. Integr. Agric. 2016, 15, 658–666. [Google Scholar] [CrossRef]
  44. Campbell, C.A.; Dejong, R.; Zentner, R.P. Effect of cropping, summer fallow and fertilizer nitrogen on nitrate-nitrogen lost by leaching on a Brown Chernozemic soil. Can. J. Soil Sci. 1984, 64, 61–74. [Google Scholar] [CrossRef]
  45. Vos, J.; van der Putten, P.E.L.; Hussein, M.H.; van Dam, A.M.; Leffelaar, P.A. Field observations on nitrogen catch crops. II. Root length and root length distribution in relation to species and nitrogen supply. Plant Soil 1998, 210, 149–155. [Google Scholar] [CrossRef]
  46. Malki, M.; Bouchaou, L.; Hirich, A.; Ait, B.Y.; Choukrallah, R. Impact of agricultural practices on groundwater quality in intensive irrigated area of Chtouka-Massa, Morocco. Sci. Total Environ. 2017, 574, 760–770. [Google Scholar] [CrossRef] [PubMed]
Figure 1. Distribution of groundwater wells used in this study. Groundwater wells are part of ecological stations in the Chinese Ecosystem Research Network (CERN). Letters in red font represent station names.
Sustainability 10 01393 g001
Figure 2. Temporal variation trends of nitrate-N concentrations in monitoring wells in agro-ecosystems of CERN.
Sustainability 10 01393 g002aSustainability 10 01393 g002b
Figure 3. Nitrate-N concentration in groundwater under different soil types in CERN agro-ecosystems. Aeolian sandy soil (CLD, SPD, LZD, ESD), Red soil (YTA, QYA, TYA), Fluvo-aquic soil (YCA, FQA,), Meadow soil (LSA), Black soil (HLA), Aquic brown soil (SYA), Paddy soil (CSA), Aquic cinnamon soil (LCA), Purple soil (YGA). Histograms labeled with different letters indicate significant differences at p < 0.05.
Sustainability 10 01393 g003
Table 1. Geographical location and environmental conditions of the 21 typical agricultural ecosystems in this study. MAAT: mean annual air temperature; MAP: mean annual precipitation.
Station NameLongitude (E)Latitude (N)Altitude (m)MAAT (°C)MAP (mm)N Application Rate (kg·hm−2)Irrigation Method
HLA126°55′39″47°27′15″2361.5400–650120Non-irrigation in growing season
SYA123°22′05″41°31′06″417–8650–70075Well irrigation
CSA120°25′08″31°19′46″1.315.51038466Surface water irrigation
HJA108°18′24°43′272.0–647.219.91389.1220Surface water irrigation
TYA111°26′26″28°55′46″106161448270Surface water irrigation
YTA116°33′18″28°07′23″4517.81785150Furrow irrigation
YGA105°27′21″31°16′18″42017.5826300Rain-fed
QYA115°02′04″26°26′40″76----320Surface water irrigation
CLD80°43′39″37°01′15″130611.933468Furrow irrigation
FKD87°55′58″44°17′26″4606.6164275Drip irrigation
LZD100°07′42″39°20′59″13757.7118.4122Flood irrigation
NMD120°42′00″42°55′47″3633–7350–500207Flood irrigation
SPD105°00′01″37°16′04″13509.6186256Surface water irrigation
ESD110°11′29″39°29′37″12906.2348175Furrow irrigation
AKA80°51′40″40°37′49″102811.245.7160Drip irrigation
ASA109°19′12″36°14′27″10838.8540120Rain-fed
CWA107°40′59″35°14′27″12009.1580345Rain-fed
YCA116°34′13″36°49′51″2213.3555510Flood irrigation
FQA114°19′43″35°00′40″67.513.9605345Well irrigation
LCA114°41′47″37°53′26″5013.1582390Sprinkling irrigation
LSA91°12′20″29°24′22″36884–8300–550144Surface water irrigation
Table 2. Physical characteristics of soil, and soil nitrate-N in agro-ecosystems of CERN.
SitesSoil Type (USDA)Land Use TypeSoil Saturation Moisture ContentSoil Field CapacitySandy Particle Content (0–100 cm)Soil Nitrate-N Content (20 cm Depth)
%(mg·kg−1)
HLABlack soilMaize-soybean41.335.327.0
SYAAquic brown soilMaize35.828.812.6
CSAPaddy soilPaddy-wheat33.929.89.48.7
TYARed soilPaddy29.026.617.02.4
YTARed soilPeanut33.826.521.62.4
YGAPurple soilMaize-wheat26.621.318.03.5
QYARed soilPaddy25.618.0
SPDAeolian sandy soilWheat-maize23.572.71.5
LZDAeolian sandy soilWheat-maize42.321.786.63.2
ASALoess soilMaize-soybean45.218.828.65.3
CWAMalan loessMaize-wheat38.721.010.77.1
FQAFluvo-aquic soilMaize-wheat65.838.831.529.0
YCAFluvo-aquic soilMaize-wheat51.436.415.347.0
LCAAquic cinnamon soilMaize-wheat51.036.752.728.6
LSAMeadow soilWheat-barley44.825.667.1
Table 3. Nitrate-N concentrations and background information on the monitoring wells in agro-ecosystems of CERN.
Station NameNumber of WellsAverage Groundwater Level (m)
(Mean ± S.E.)
NO3-N (mg·L−1)>10 mg·L−1
Frequency of Nitrate-N (%)
MaxMean ± S.E.
Northeast agricultural areaHLA120.4 ± 2.00.450.29 ± 0.050
SYA27.8 ± 3.71.070.23 ± 0.180
South agricultural areaCSA10.54 ± 0.47.951.33 ± 1.060
HJA13.53 ± 2.120.90.90 ± 0.090
TYA12.62 ± 0.634.230.81 ± 0.700
YTA23.85 ± 1.252.51.11 ± 0.790
YGA32.28 ± 1.3726.086.80 ± 4.0916.8
QYA22.57 ± 1.3312.091.06 ± 1.3815
Northwest oasis agricultural and pastoral areaCLD314.5 ± 0.29.624.04 ± 1.260
FKD23.4 ± 0.43.521.87 ± 0.630
LZD24.3 ± 0.621.58.42 ± 1.8540.9
NMD37.6 ± 0.26.350.97 ± 0.750
SPD115.2 ± 0.46.374.54 ± 1.600
ESD19.98 ± 2.1510.523.17 ± 2.0748.8
North China agriculturalAKA22.5 ± 0.213.684.81 ± 0.2950
ASA112.0 ± 0.497.3933.26 ± 22.4796
CWA184.5 ± 2.81.510.35 ± 0.320
YCA22.4 ± 0.617.182.33 ± 1.9229.7
FQA44.2 ± 0.433.90.79 ± 0.630
LCA137.3 ± 3.78.494.49 ± 1.400
Tibet plateau agriculturalLSA32.8 ± 1.68.136.05 ± 0.070

