Analytical Approach to Study Sensing Properties of Graphene Based Gas Sensor

 ,
,  and
and
Abstract
:1. Introduction
2. Materials and Methods
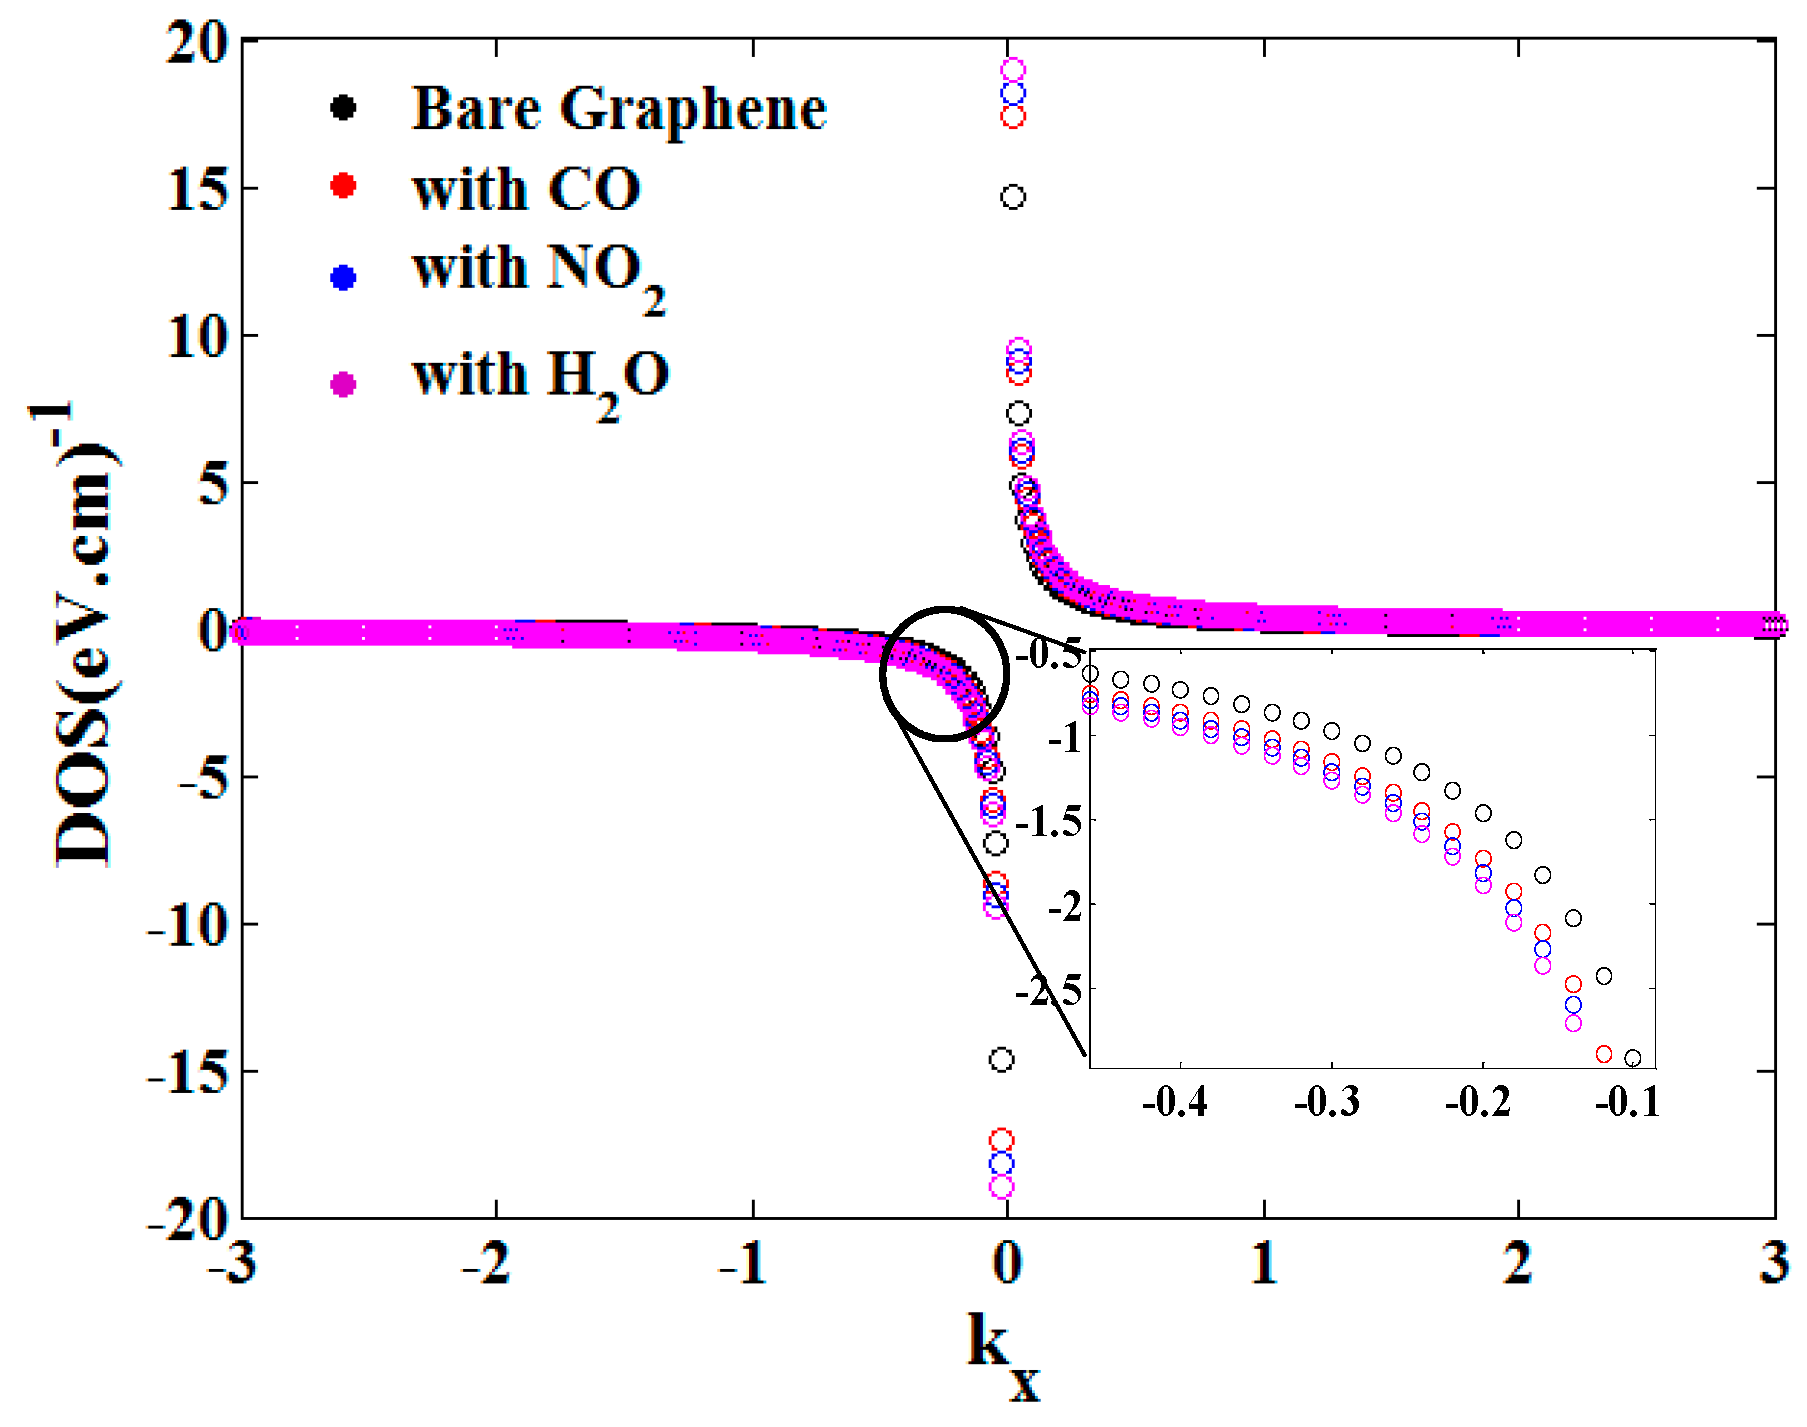
2.1. Energy Band Structure Modeling
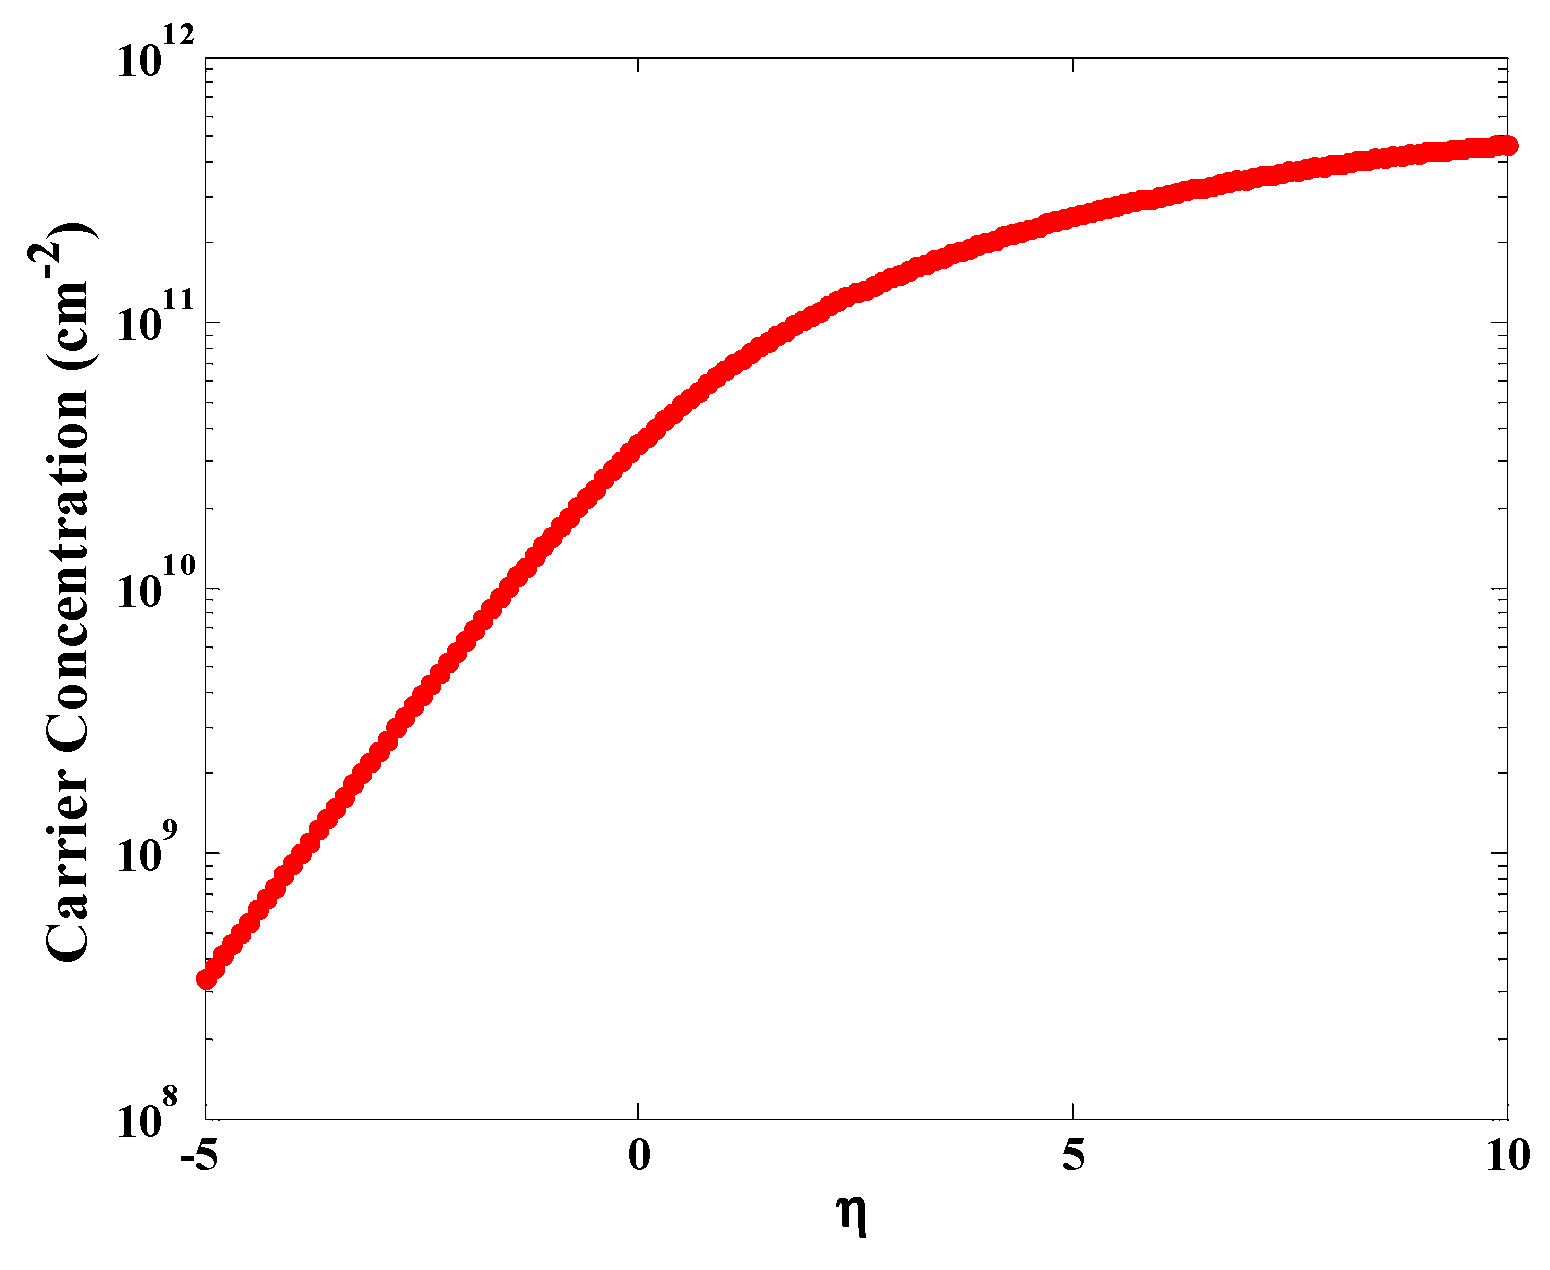
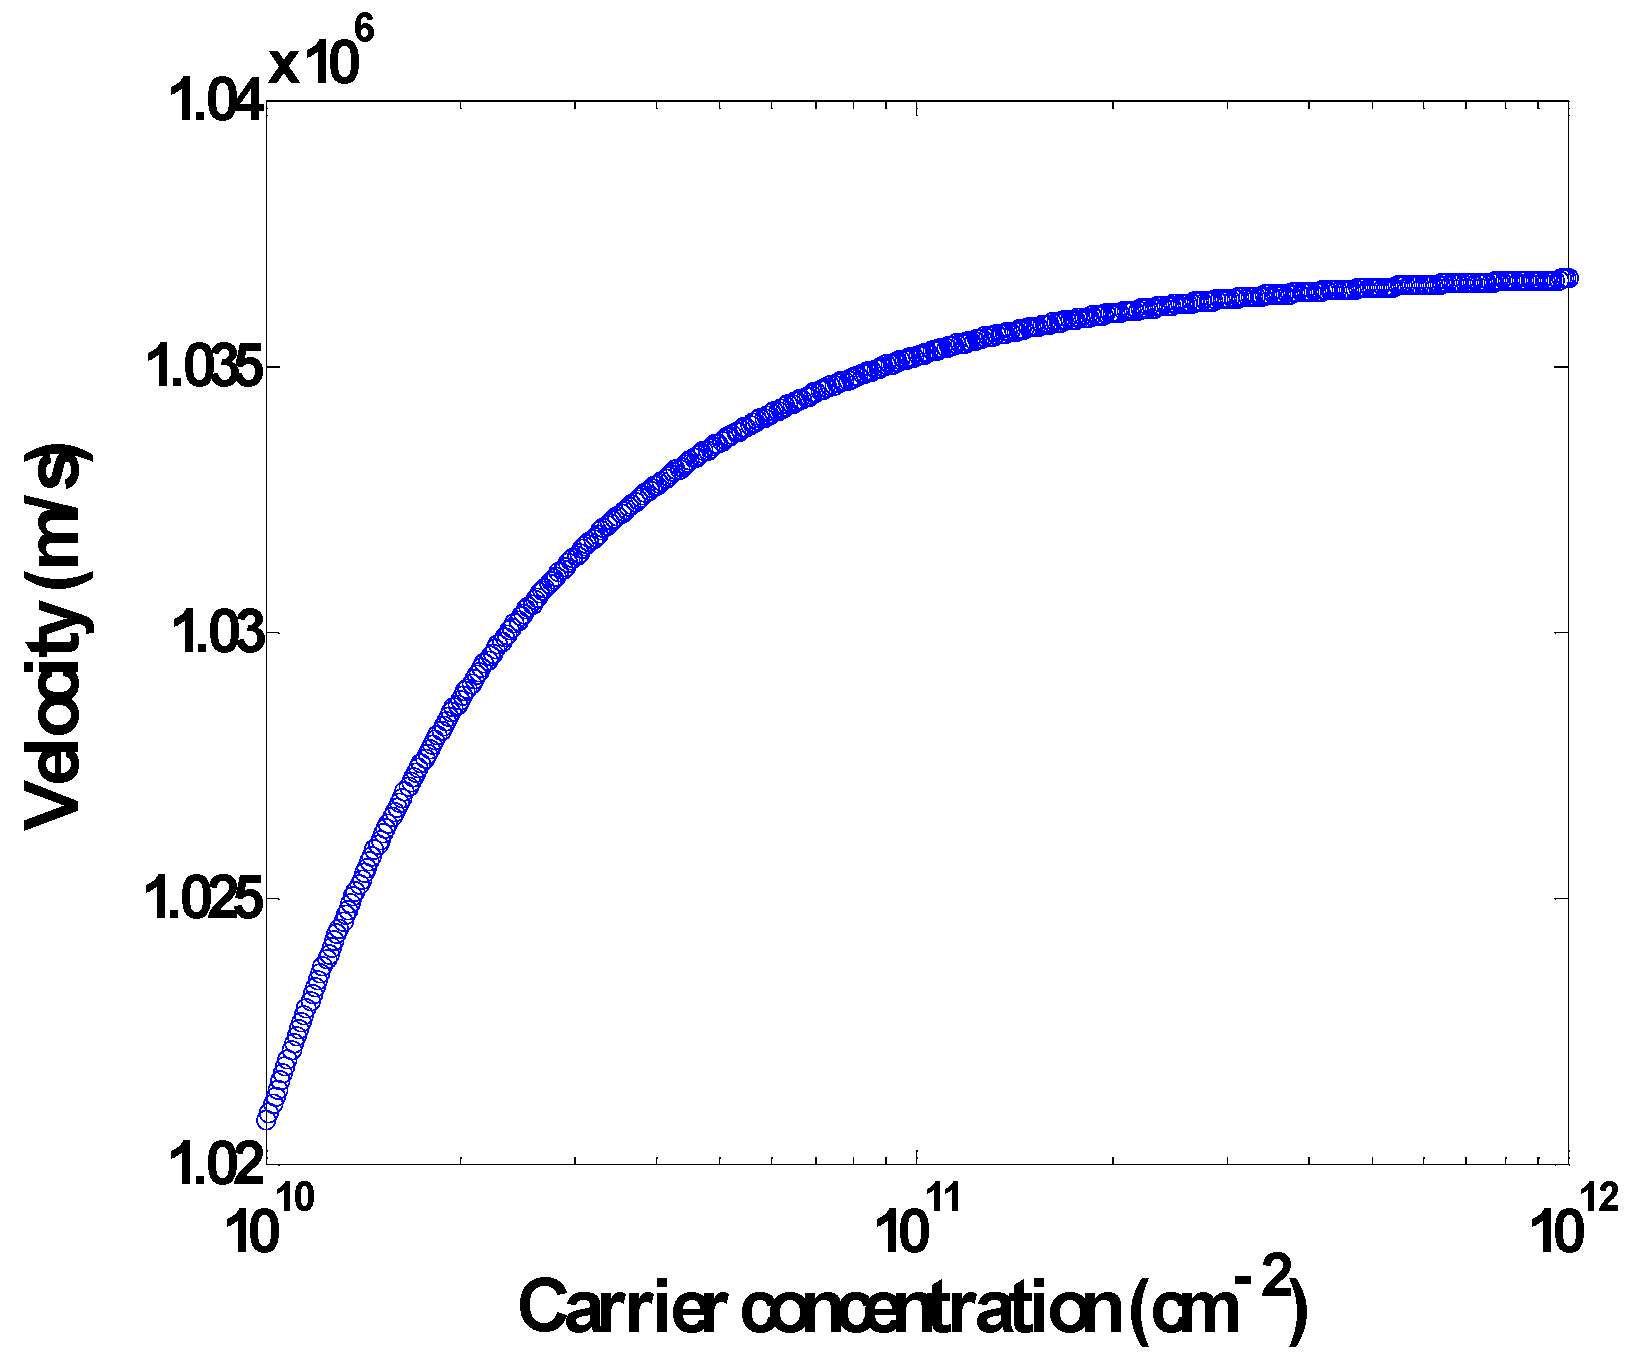
2.2. Carrier Velocity Model
3. Conclusions
Author Contributions
Funding
Acknowledgments
Conflicts of Interest
References
- Grieshaber, D.; MacKenzie, R.; Vörös, J.; Reimhult, E. Electrochemical Biosensors - Sensor Principles and Architectures. Sensors 2008, 8, 1400. [Google Scholar] [CrossRef]
- Ghadiry, M.; Ismail, R.; Naraghi, B.; Abed, S.T.; Kavosi, D.; Fotovatikhah, F. A new approach to model sensitivity of graphene-based gas sensors. Semicond. Sci. Technol. 2015, 30, 045012. [Google Scholar] [CrossRef]
- Ibrahim, I.; Lim, H.; Huang, N.; Pandikumar, A. Cadmium sulphide-reduced graphene oxide-modified photoelectrode-based photoelectrochemical sensing platform for copper (II) ions. PLoS ONE 2016, 11, e0154557. [Google Scholar] [CrossRef] [PubMed]
- Kabasawa, H.; Hiroshi, O.; Takahashi, K.; Mitani, S. Sensor Device and Electronic Apparatus. United States Patent US20160155927A1, 20 March 2014. [Google Scholar]
- Pourasl, A.H.; Ahmadi, M.T.; Rahmani, M.; Chin, H.C.; Lim, C.S.; Ismail, R.; Tan, M.L.P. Analytical modeling of glucose biosensors based on carbon nanotubes. Nanoscale Res. Lett. 2014, 9, 1–7. [Google Scholar] [CrossRef] [PubMed] [Green Version]
- Mohammad Ali Zanjani, S.; Dousti, M.; Dolatshahi, M. High-precision, resistor less gas pressure sensor and instrumentation amplifier in CNT technology. AEU Int. J. Electron. Commun. 2018, 93, 325–336. [Google Scholar] [CrossRef]
- Haroon Rashid, M.; Koel, A.; Rang, T. First Principles Simulations of Phenol and Methanol Detector Based on Pristine Graphene Nanosheet and Armchair Graphene Nanoribbons. Sensors 2019, 19, 2731. [Google Scholar] [CrossRef] [PubMed] [Green Version]
- Tehrani, F.; Reiner, L.; Bavarian, B. Rapid prototyping of a high sensitivity graphene based glucose sensor strip. PLoS ONE 2015, 10, e0145036. [Google Scholar] [CrossRef]
- Tao, M.; Seals, R. Multi-component gas mixture measurements using an array of gas sensors and an artificial neural network. J. Microcomput. Appl. 1993, 16, 203–210. [Google Scholar] [CrossRef]
- Yuan, W.; Shi, G. Graphene-based gas sensors. J. Mater. Chem. A 2013, 1, 10078–10091. [Google Scholar] [CrossRef]
- Pearce, R.; Iakimov, T.; Andersson, M.; Hultman, L.; Spetz, A.L.; Yakimova, R. Epitaxially grown graphene based gas sensors for ultra sensitive NO2 detection. Sens. Actuators B Chem. 2011, 155, 451–455. [Google Scholar] [CrossRef] [Green Version]
- Wetchakun, K.; Samerjai, T.; Tamaekong, N.; Liewhiran, C.; Siriwong, C.; Kruefu, V.; Wisitsoraat, A.; Tuantranont, A.; Phanichphant, S. Semiconducting metal oxides as sensors for environmentally hazardous gases. Sens. Actuators B Chem. 2011, 160, 580–591. [Google Scholar] [CrossRef]
- Sutter, P. Epitaxial graphene: How silicon leaves the scene. Nat. Mater. 2009, 8, 171–172. [Google Scholar] [CrossRef] [PubMed] [Green Version]
- Kim, K.; Choi, J.-Y.; Kim, T.; Cho, S.-H.; Chung, H.-J. A role for graphene in silicon-based semiconductor devices. Nature 2011, 479, 338–344. [Google Scholar] [CrossRef] [PubMed]
- Latif, U.; Dickert, F. Graphene hybrid materials in gas sensing applications. Sensors 2015, 15, 30504–30524. [Google Scholar] [CrossRef]
- Yoon, H.J.; Yang, J.H.; Zhou, Z.; Yang, S.S.; Cheng, M.M.-C. Carbon dioxide gas sensor using a graphene sheet. Sens. Actuators B Chem. 2011, 157, 310–313. [Google Scholar] [CrossRef]
- Farmer, D.B.; Golizadeh-Mojarad, R.; Perebeinos, V.; Lin, Y.M.; Tulevski, G.S.; Tsang, J.C.; Avouris, P. Chemical Doping and Electron-Hole Conduction Asymmetry in Graphene Devices. Nano Lett. 2009, 9, 388–392. [Google Scholar] [CrossRef] [Green Version]
- Pourasl, A.H.; Ahmadi, M.T.; Ismail, R.; Gharaei, N. Gas adsorption effect on the graphene nanoribbon band structure and quantum capacitance. Adsorption 2017, 23, 767–777. [Google Scholar] [CrossRef]
- Novoselov, K.S.; Geim, A.K.; Morozov, S.; Jiang, D.; Zhang, Y.; Dubonos, S.; Grigorieva, I.; Firsov, A. Electric field effect in atomically thin carbon films. Science 2004, 306, 666–669. [Google Scholar] [CrossRef] [Green Version]
- Abadi, H.K.F.; Ahmadi, M.; Yusof, R.; Saeidmanesh, M.; Rahmani, M.; Kiani, M.J.; Ghadiry, M. Development of Carbon Nanotube Based Biosensors Model for Detection of Single-Nucleotide Polymorphism. Sci. Adv. Mater. 2014, 6, 513–519. [Google Scholar] [CrossRef]
- Ghadiry, M.; Gholami, M.; Lai, C.; Ahmad, H.; Chong, W. Ultra-sensitive humidity sensor based on optical properties of graphene oxide and nano-anatase TiO2. PLoS ONE 2016, 11, e0153949. [Google Scholar] [CrossRef] [Green Version]
- Ko, G.; Kim, H.-Y.; Ahn, J.; Park, Y.-M.; Lee, K.-Y.; Kim, J. Graphene-based nitrogen dioxide gas sensors. Curr. Appl. Phys. 2010, 10, 1002–1004. [Google Scholar] [CrossRef]
- Lin, X.; Ni, J.; Fang, C. Adsorption capacity of H2O, NH3, CO, and NO2 on the pristine graphene. J. Appl. Phys. 2013, 113, 034306. [Google Scholar] [CrossRef]
- Joshi, N.; Hayasaka, T.; Liu, Y.; Liu, H.; Oliveira, O.N.; Lin, L. A review on chemiresistive room temperature gas sensors based on metal oxide nanostructures, graphene and 2D transition metal dichalcogenides. Microchim. Acta 2018, 185, 213. [Google Scholar] [CrossRef] [PubMed]
- Cai, J.; Ruffieux, P.; Jaafar, R.; Bieri, M.; Braun, T.; Blankenburg, S.; Muoth, M.; Seitsonen, A.P.; Saleh, M.; Feng, X. Atomically precise bottom-up fabrication of graphene nanoribbons. Nature 2010, 466, 470–473. [Google Scholar] [CrossRef]
- Wei, D.; Liu, Y.; Wang, Y.; Zhang, H.; Huang, L.; Yu, G. Synthesis of N-doped graphene by chemical vapor deposition and its electrical properties. Nano Lett. 2009, 9, 1752–1758. [Google Scholar] [CrossRef]
- Biabanifard, M.; Abrishamian, M.S. Multi-band circuit model of tunable THz absorber based on graphene sheet and ribbons. AEU Int. J. Electron. Commun. 2018, 95, 256–263. [Google Scholar] [CrossRef]
- Huang, X.; Zeng, Z.; Fan, Z.; Liu, J.; Zhang, H. Graphene-Based Electrodes. Adv. Mater. 2012, 24, 5979–6004. [Google Scholar] [CrossRef]
- Shao, Y.; Wang, J.; Wu, H.; Liu, J.; Aksay, I.A.; Lin, Y. Graphene based electrochemical sensors and biosensors: A review. Electroanalysis 2010, 22, 1027–1036. [Google Scholar] [CrossRef]
- Wu, W.; Liu, Z.; Jauregui, L.A.; Yu, Q.; Pillai, R.; Cao, H.; Bao, J.; Chen, Y.P.; Pei, S.-S. Wafer-scale synthesis of graphene by chemical vapor deposition and its application in hydrogen sensing. Sens. Actuators B Chem. 2010, 150, 296–300. [Google Scholar] [CrossRef]
- Su, P.-G.; Peng, S.-L. Fabrication and NO 2 gas-sensing properties of reduced graphene oxide/WO3 nanocomposite films. Talanta 2015, 132, 398–405. [Google Scholar] [CrossRef]
- Drewniak, S.; Muzyka, R.; Stolarczyk, A.; Pustelny, T.; Kotyczka-Morańska, M.; Setkiewicz, M. Studies of reduced graphene oxide and graphite oxide in the aspect of their possible application in gas sensors. Sensors 2016, 16, 103. [Google Scholar] [CrossRef] [PubMed]
- Yavari, F.; Chen, Z.; Thomas, A.V.; Ren, W.; Cheng, H.-M.; Koratkar, N. High sensitivity gas detection using a macroscopic three-dimensional graphene foam network. Sci. Rep. 2011, 1, 166. [Google Scholar] [CrossRef] [Green Version]
- El-Safty, S.A.; Shenashen, M.; Ismael, M.; Khairy, M.; Awual, M.R. Mesoporous aluminosilica sensors for the visual removal and detection of Pd (II) and Cu (II) ions. Microporous Mesoporous Mater. 2013, 166, 195–205. [Google Scholar] [CrossRef]
- Rahmani, M.; Ahmadi, M.; Karimi, H.; Kiani, M.; Akbari, E.; Ismail, R. Analytical modeling of monolayer graphene-based NO2 sensor. Sens. Lett. 2013, 11, 270–275. [Google Scholar] [CrossRef]
- Akbari, E.; Ahmadi, M.; Kiani, M.; Feizabadi, H.K.; Rahmani, M.; Khalid, M. Monolayer graphene based CO2 gas sensor analytical model. J. Comput. Theor. Nanosci. 2013, 10, 1301–1304. [Google Scholar] [CrossRef]
- Akbari, E.; Arora, V.K.; Enzevaee, A.; Ahmadi, M.T.; Saeidmanesh, M.; Khaledian, M.; Karimi, H.; Yusof, R. An analytical approach to evaluate the performance of graphene and carbon nanotubes for NH3 gas sensor applications. Beilstein J. Nanotechnol. 2014, 5, 726–734. [Google Scholar] [CrossRef] [Green Version]
- Khaledian, M.; Ismail, R.; Saeidmanesh, M.; Khalediana, P. Analytical modeling of the sensing parameters for graphene nanoscroll-based gas sensors. RSC Adv. 2015, 5, 54700–54709. [Google Scholar] [CrossRef]
- Zhao, K.; Zhao, M.; Wang, Z.; Fan, Y. Tight-binding model for the electronic structures of SiC and BN nanoribbons. Phys. E Low Dimens. Syst. Nanostruct. 2010, 43, 440–445. [Google Scholar] [CrossRef]
- Modarresi, M.; Roknabadi, M.; Shahtahmasbi, N. Transport properties of an armchair boron-nitride nanoribbon embedded between two graphene electrodes. Phys. E Low Dimens. Syst. Nanostruct. 2011, 43, 1751–1754. [Google Scholar] [CrossRef]
- Saffarzadeh, A. Modeling of gas adsorption on graphene nanoribbons. J. Appl. Phys. 2010, 107, 114309. [Google Scholar] [CrossRef] [Green Version]
- Tien, H.M.; Chau, N.H.; Loan, P.T.K. Tight-binding calculations of band structure and conductance in graphene nano-ribbons. Commun. Phys. 2009, 19, 1–8. [Google Scholar] [CrossRef] [Green Version]
- Moradian, R.; Mohammadi, Y.; Ghobadi, N. Investigation of gas sensing properties of armchair graphene nanoribbons. J. Phys. Condens. Matter 2008, 20, 425211. [Google Scholar] [CrossRef]
- Pourasl, A.H.; Ariffin, S.H.S.; Ahmadi, M.T.; Ismail, R.; Gharaei, N. A carrier velocity model for electrical detection of gas molecules. Beilstein J. Nanotechnol. 2019, 10, 644–653. [Google Scholar] [CrossRef] [PubMed]
- Zhang, Y.-H.; Chen, Y.-B.; Zhou, K.-G.; Liu, C.-H.; Zeng, J.; Zhang, H.-L.; Peng, Y. Improving gas sensing properties of graphene by introducing dopants and defects: A first-principles study. Nanotechnology 2009, 20, 185504. [Google Scholar] [CrossRef] [PubMed] [Green Version]
- Sanyal, B.; Eriksson, O.; Jansson, U.; Grennberg, H. Molecular adsorption in graphene with divacancy defects. Phys. Rev. B 2009, 79, 113409. [Google Scholar] [CrossRef] [Green Version]
- Zhou, S.Y.; Gweon, G.-H.; Fedorov, A.; First, P.d.; De Heer, W.; Lee, D.-H.; Guinea, F.; Neto, A.C.; Lanzara, A. Substrate-induced bandgap opening in epitaxial graphene. Nat. Mater. 2007, 6, 770. [Google Scholar] [CrossRef] [Green Version]
- Datta, S. Quantum Transport: Atom to Transistor; Cambridge University Press: Cambridge, UK, 2005. [Google Scholar]
- Garber, L. Graphene Use Growing in Transistors and Other Settings. IEEE Comput. Soc. 2011, 44, 17. [Google Scholar] [CrossRef]
- Harrison, W.A. Electronic Structure and the Properties of Solids: The Physics of the Chemical Bond; Courier Corporation: North Chelmsford, MA, USA, 2012. [Google Scholar]
- Ahmadi, M.T.I.; Razali Anwar, S. Handbook of Research on Nanoelectronic Sensor Modeling and Applications; IGI Global: Hershey, PA, USA, 2016. [Google Scholar]
- Ismail, R.; Ahmadi, M.T.; Anwar, S. Advanced Nanoelectronics; CRC Press: Boca Raton, FL, USA, 2012. [Google Scholar]


| Adsorption Type | Distance from Graphene Surface | Hopping Parameter |
|---|---|---|
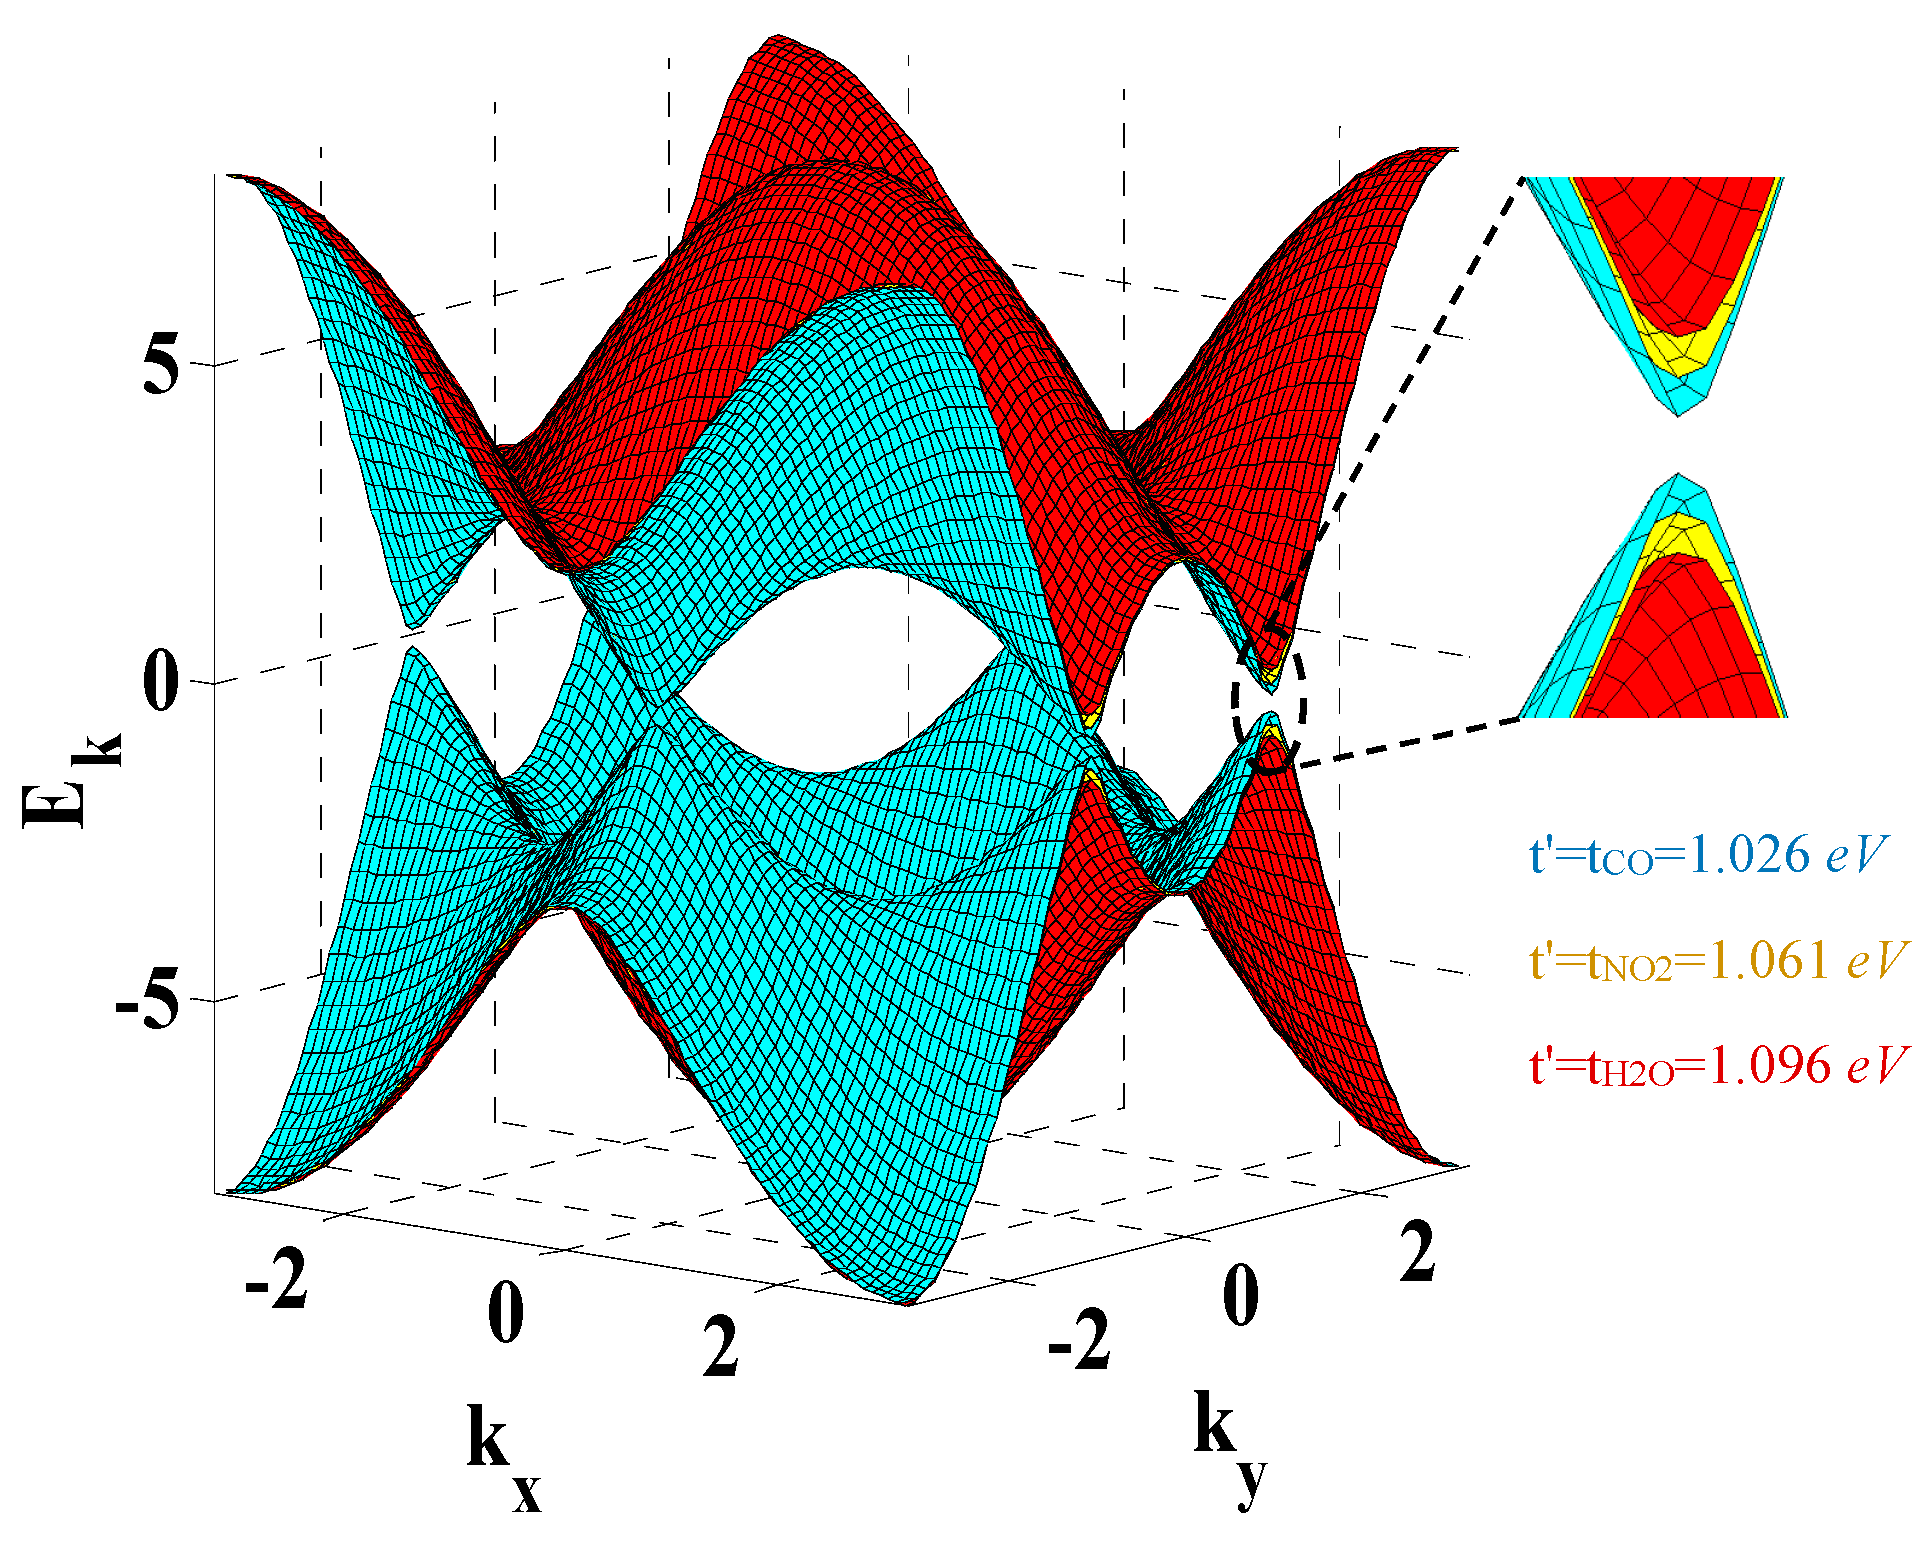
| H2O | dαβ = 3.5 Å | tC-H2O = 0.406 tR |
| NO2 | dαβ = 3.61 Å | tC-NO2 = 0.393 tR |
| CO | dαβ = 3.74 Å | tC-CO = 0.38 tR |
© 2020 by the authors. Licensee MDPI, Basel, Switzerland. This article is an open access article distributed under the terms and conditions of the Creative Commons Attribution (CC BY) license (http://creativecommons.org/licenses/by/4.0/).
Share and Cite
Hosseingholipourasl, A.; Hafizah Syed Ariffin, S.; Al-Otaibi, Y.D.; Akbari, E.; Hamid, F.K.; Koloor, S.S.R.; Petrů, M. Analytical Approach to Study Sensing Properties of Graphene Based Gas Sensor. Sensors 2020, 20, 1506. https://doi.org/10.3390/s20051506
Hosseingholipourasl A, Hafizah Syed Ariffin S, Al-Otaibi YD, Akbari E, Hamid FK, Koloor SSR, Petrů M. Analytical Approach to Study Sensing Properties of Graphene Based Gas Sensor. Sensors. 2020; 20(5):1506. https://doi.org/10.3390/s20051506
Chicago/Turabian StyleHosseingholipourasl, Ali, Sharifah Hafizah Syed Ariffin, Yasser D. Al-Otaibi, Elnaz Akbari, Fatimah. KH. Hamid, S. S. R. Koloor, and Michal Petrů. 2020. "Analytical Approach to Study Sensing Properties of Graphene Based Gas Sensor" Sensors 20, no. 5: 1506. https://doi.org/10.3390/s20051506