Experimental Study of Wireless Monitoring of Human Respiratory Movements Using UWB Impulse Radar Systems


1
Science and Technology on Electronic Test & Measurement Laboratory, The 41st Research Institute of CETC, Xiang Jiang Road 98th, Huangdao District, Qingdao 266555, China
2
China Electronics Technology Instruments Co. Ltd., Xiang Jiang Road 98th, Huangdao District, Qingdao 266555, China
3
The Key Laboratory of Electromagnetic Radiation and Sensing Technology, Institute of Electronics, Chinese Academy of Science, North 4th Ring West Road 19th, Haidian District, Beijing 100190, China
4
Department of Electrical Computer Engineering, University of Victoria, PO Box 1700, STN CSC, Victoria, BC V8W 2Y2, Canada
*
Author to whom correspondence should be addressed.
Sensors 2018, 18(9), 3065; https://doi.org/10.3390/s18093065
Submission received: 10 July 2018
/
Revised: 15 August 2018
/
Accepted: 22 August 2018
/
Published: 12 September 2018
(This article belongs to the Section Remote Sensors)
Abstract
:This paper analyzes and discusses the capability of human being detection using impulse ultra-wideband (UWB) radar with an improved detection algorithm. The multiple automatic gain control (AGC) technique is employed to enhance the amplitudes of human respiratory signals. Two filters with seven values averaged are used to further improve the signal-to-noise ratio (SNR) of the human respiratory signals. The maximum slope and standard deviation are used for analyzing the characteristics of the received pulses, which can provide two distance estimates for human being detection. Most importantly, based on the two distance estimates, we can accurately judge whether there are human beings in the detection environments or not. The data size can be reduced based on the defined interested region, which can improve the operation efficiency of the radar system for human being detection. The developed algorithm provides excellent performance regarding human being detection, which is validated through comparison with several well-known algorithms.
1. Introduction
The ultra-wideband (UWB) radar has been extensively used for the remote sensing of human subjects at short distances through walls and ruins [1]. A human subject can be detected based on his/her chest subtle motion from respiration and heartbeat, which is different from magnetic induction, thermal imaging, X-ray, and some other success-restrictive methods, and cannot be affected by temperature, the material of a non-metal wall, or target clothes [2,3]. UWB radar usually transmits electromagnetic waves with a large bandwidth (usually larger than 500 MHz) i.e., a short pulse period (usually a nanosecond or a picosecond). Most importantly, compared with the continuous wave radar system, UWB radar can acquire the localization of human subjects with higher accuracy. As a result, the UWB radar is considered to be perfect for localization and detection purposes, especially in natural disaster relief [4,5].
Non-invasive monitoring is more suitable for application in some situations where it is challenging to use complex wired connections, such as burn victims or electrocardiogram (ECG) monitoring for infants [6]. Usually, the microwave Doppler radar is considered an alternative to the non-invasive detection of life signs [7]. However, the Doppler radar cannot better penetrate materials and has the problem of null point [8]. Compared with Doppler radar, one of major advantages of UWB signals is its better capability of penetrating materials.
The UWB monitoring of life signs has been widely studied in the literature [9,10,11,12,13,14] as an alternative method to Doppler radar systems [15,16]. The measurements of life signs in different conditions have been widely studied by researchers [17,18,19]. Lazaro et al. analyzed a mathematical model for life sign detection [6]. The authors proved that the collected signals contain human respiration frequency and heartbeat rate. A filter-based harmonics canceller method is developed to extract heartbeat rate from spectrums using Fourier fast transform (FFT). However, the developed algorithm cannot deal with the random body motions for one time measurement. In [20], Van et al. employed the IR-UWB radar for the detection of human motion and posture change. However, this work doesn’t consider the influence of posture and motion detection on life signs. An autocorrelation-based method is developed for life sign detection by Khan et al. in [21]. UWB sensors are used for life sign measurements in through-wall conditions [22]. An improved algorithm is developed to estimate the frequency of human respiration based on the wavelet transform [23]. In [24], Schleicher et al. employed an IR-UWB hardware demonstrator to track objects and measure human breathing frequency. However, the authors cannot provide any method for the measurement of human heartbeat rate. The IR-UWB technology is utilized to alert medical personnel whenever to monitor vital signs and acquire the position of a patient [25]. The system for respiration frequency and heartbeat rate monitoring is discussed, and the results acquired from different sides of human body are obtained and analyzed. However, the authors did not discuss the results from the interval of position change, which may result in invalid measurements [26]. In [27], Yilmaz et al. reviewed various wireless technologies for life sign detection, including breathing frequency, heartbeat rate, blood pressure, and glucose level.
Based on UWB radars, life signs can be extracted accurately even in through-wall conditions, which is most important in natural disaster relief. Demodulation techniques have been used to remove random body movement in quadrature Doppler radar for life sign monitoring [28]. A noise reduction algorithm is presented using an improved ensemble empirical mode decomposition (EEMD) technique, and a separation algorithm based on continuous wavelet transform (CWT) is developed to improve the signal-to-noise ratio (SNR) for detecting respiration frequency and heartbeat rate accurately [29] without considering the strong harmonics of the human breathing signal. An analytical framework for life sign detection is proposed by the authors Venkatesh et al. in [30]. However, no effective algorithm is developed to suppress the harmonics of the human respiration signal when the heartbeat rate and respiration harmonics are located closely. In [31], the magnitude of maxima and minima is used to detect the body motion in the time domain by Javaid, which is inefficient when there is an actual change in the magnitude of the human respiration signal. One elderly-care motion sensor is developed using UWB pulses by Ota et al. [32]. In [33], the body state of the human is monitored using IR-UWB radar by Li et al., but a strategy to overcome the effect of motion on vital sign measurements was missing in these references. Immoreev et al. introduced the practical applications of UWB radar in [34]. The through-wall UWB radar is used to acquire respiration frequency and heartbeat rate, which is operated within a Federal Communications Commission (FCC) mask [35]. The authors Yarovoy et al. use the UWB radar to detect human subjects in a complex environment in [36]. In [37], the spectrums of human respiration are used to detect a human being behind a wall based on UWB radar. However, most algorithms only work well at short distances, and thus cannot be used effectively in complex environments. Therefore, one alternative method has to be required for life detection.
This paper proposes a novel algorithm for human being detection using the UWB impulse radar system. The contributions of the paper are summarized as:
- (1)
- The multiple automatic gain control (AGC) technique is employed to enhance the strength of the respiratory signals of human beings, which can better enhance human respiratory signals and reduce the noise based on the used gain values.
- (2)
- Two filters with seven values averaged are used for improving the SNR of human respiratory signals with one filter performed on the distance direction, and another filter performed on the frequency direction.
- (3)
- Two statistics, including the maximum slope and standard deviation, are used for analysing the characteristics of human respiratory signals. Based on the acquired results, the distance between the radar receiver and human beings can be calculated.
- (4)
- Based on the distance estimate, the interested region containing human respiratory signals can be determined, which can be used to improve the SNR and the accuracy of the frequency estimate of human respiratory movement.
- (5)
- The developed algorithm gives an excellent performance regarding human being detection, which is validated compared with several well-known algorithms.
The four sections are discussed as follows. In Section 2, the IR-UWB radar system is briefly described. Section 3 states the method for human being detection in different environments. Then, the experiment results are presented and analyzed in Section 4. Finally, the conclusion and some proposals for future work are provided in Section 5.
2. Experimental Statement
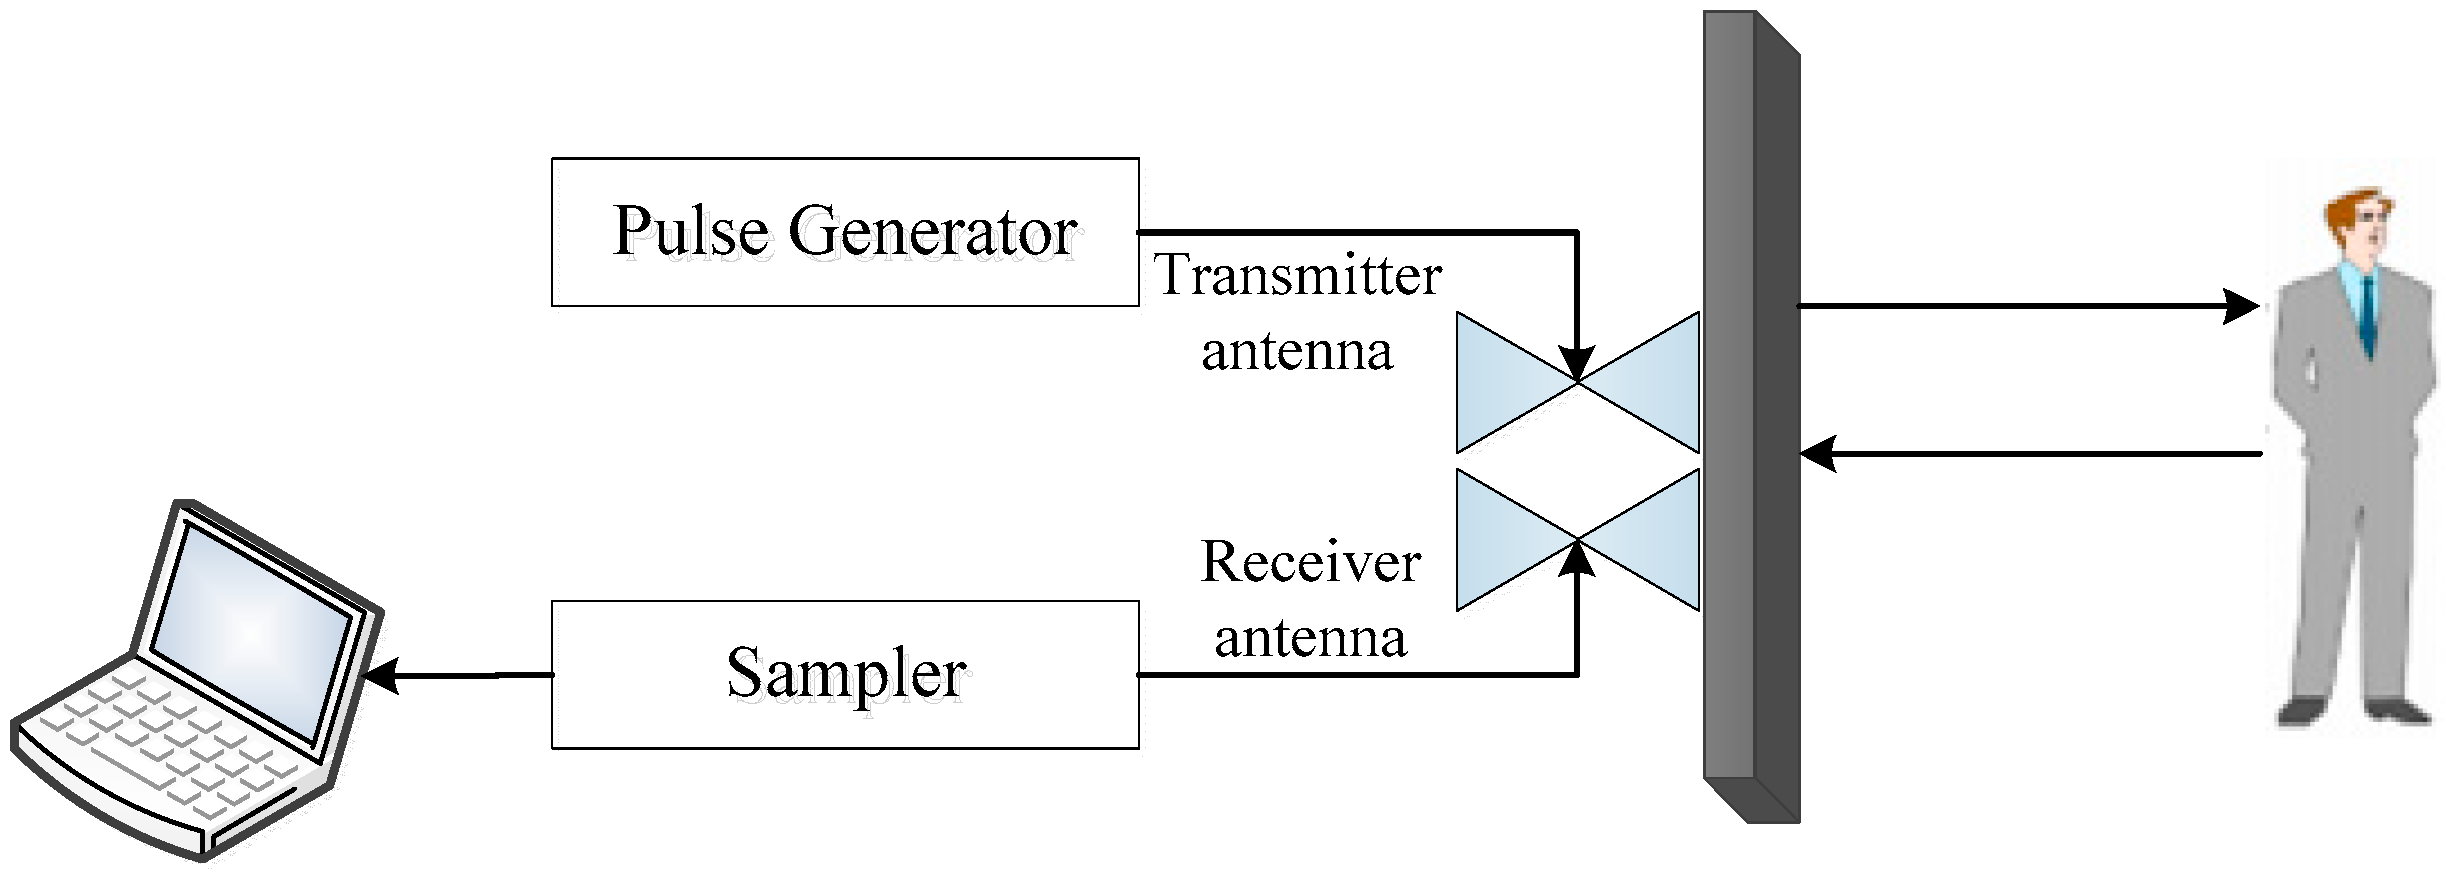
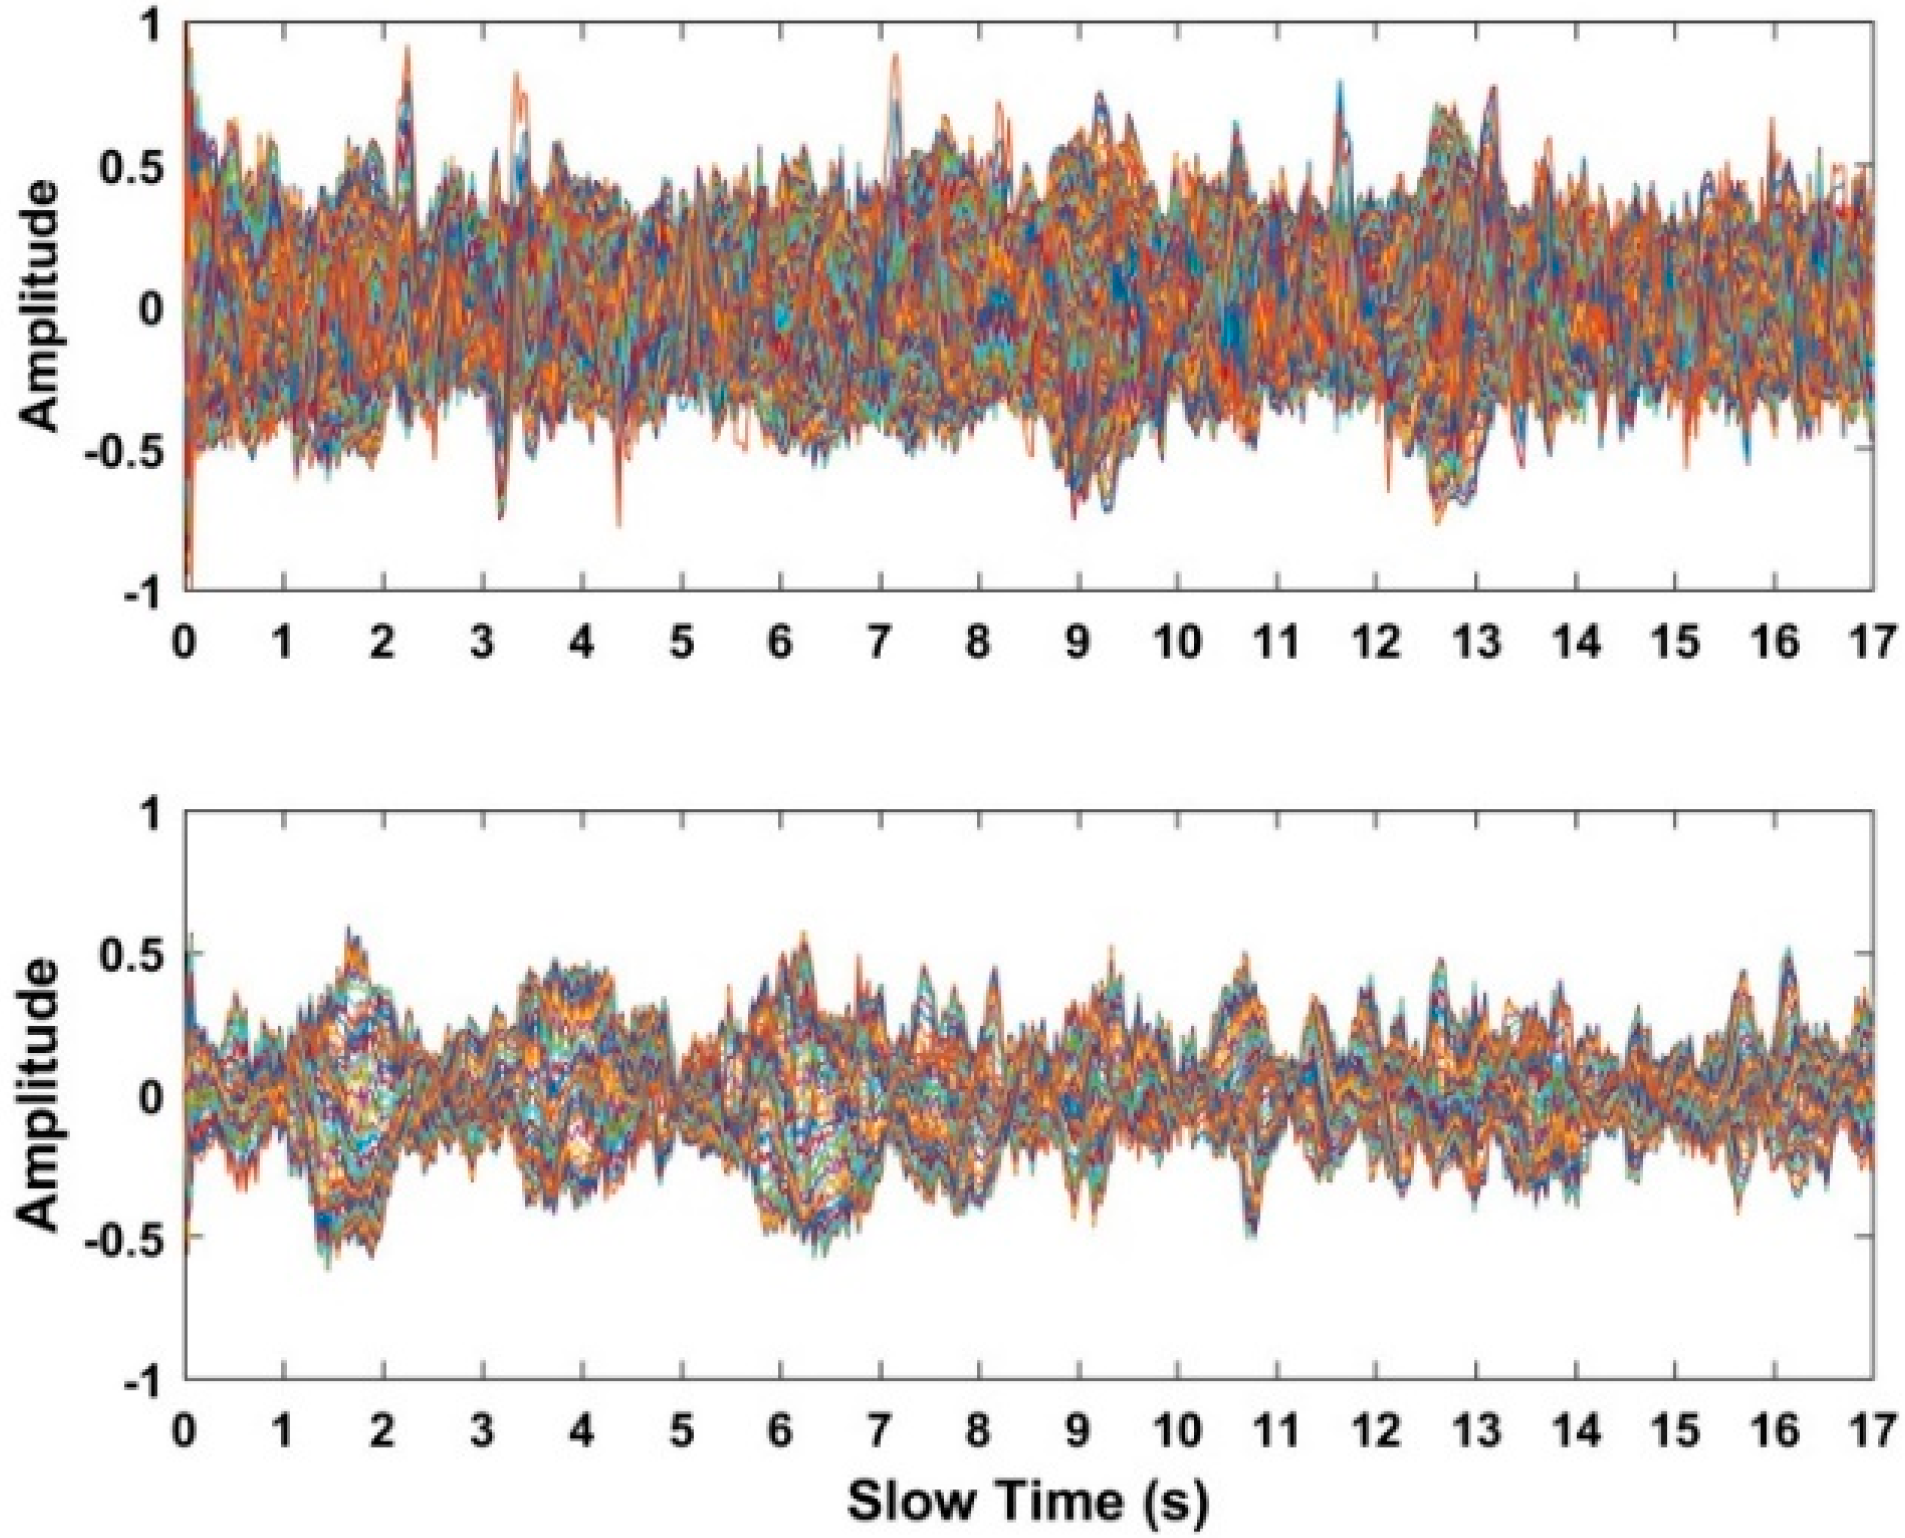
Different measurements take place in the China National Fire Equipment Quality Supervision Center, and the Institute of Electronics at the Chinese Academy of Sciences. The experimental setups for human being detection are shown in Figure 1. The employed UWB radar for data acquisition is installed on a desk, which contains one receiver antenna and one transmitter antenna. The key parameters for the UWB radar are given in Table 1. Up to 512 pulses can be collected within 17.6 s based on the used UWB radar.
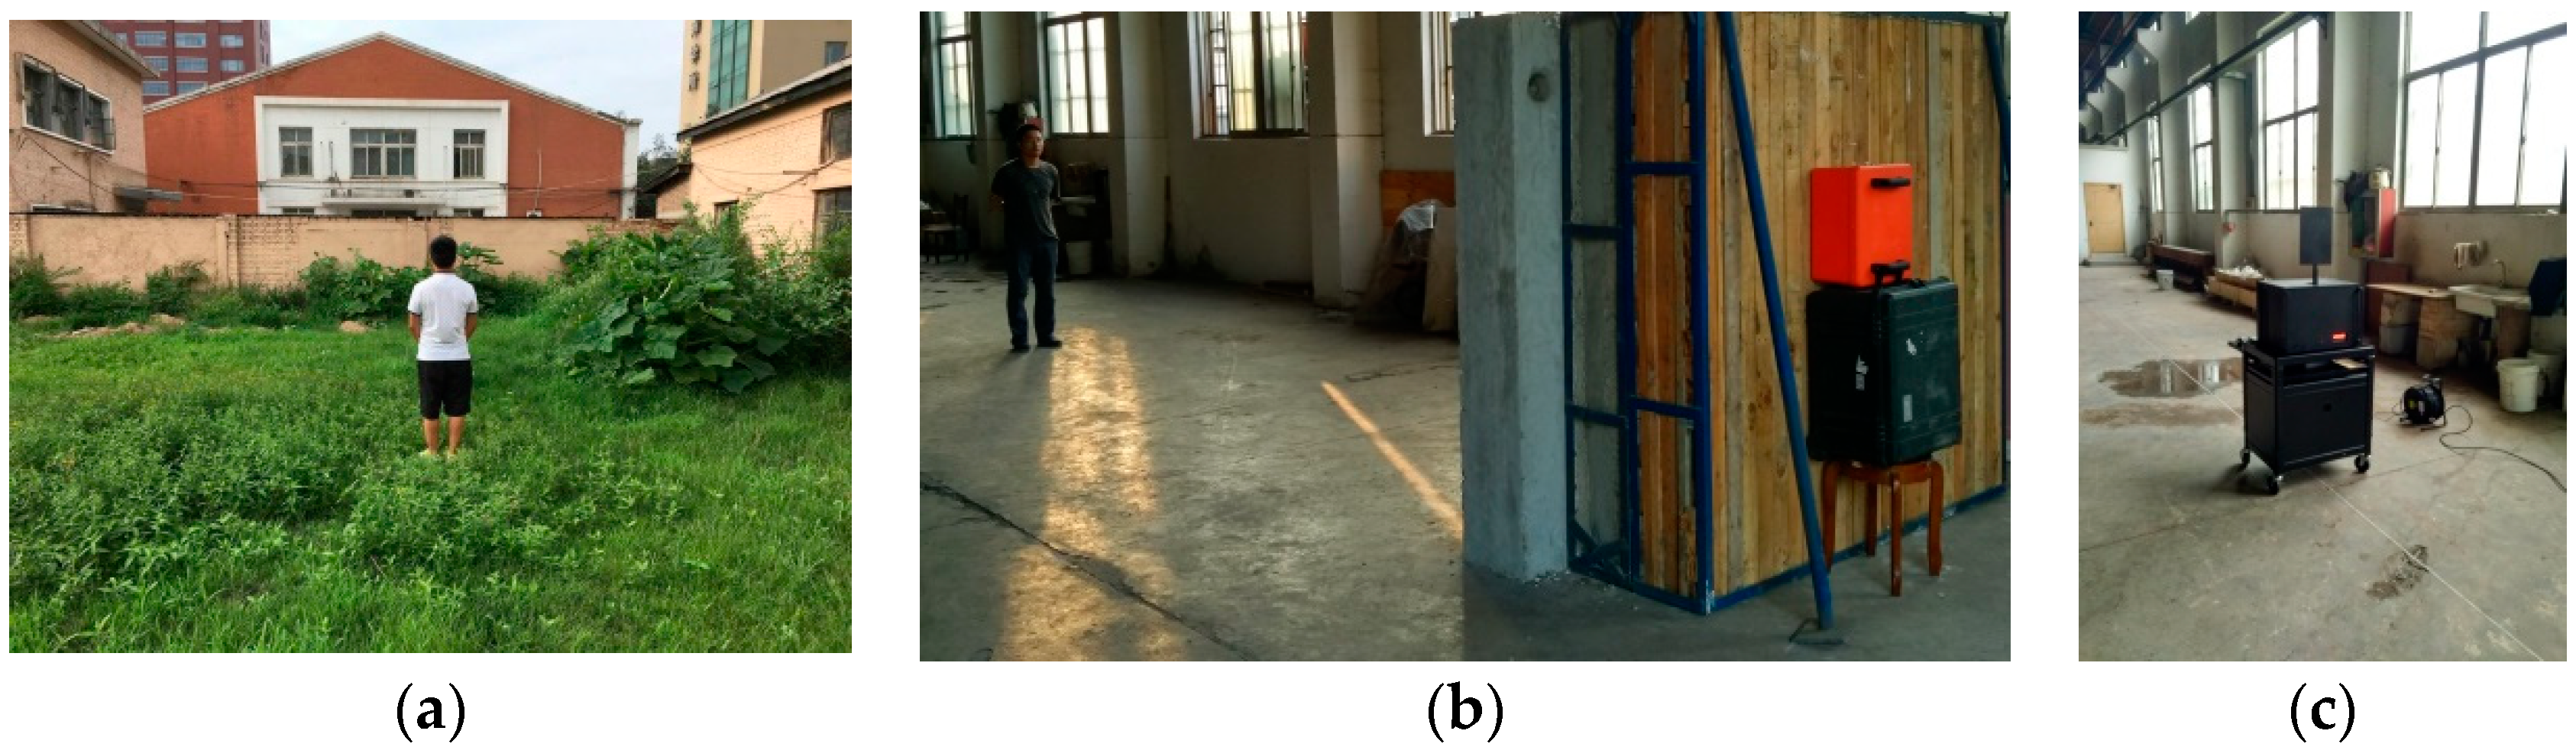
To show the fundamental problem of human being detection, two male volunteers served as human beings, as shown in Figure 2, and the experiments in the research were conducted in different conditions.
The first experiment was conducted as shown in Figure 2; one male volunteer served as the detection object. The volunteer faced the radar directly with 0° azimuth between the volunteer and the UWB radar, as shown in Figure 3. The distance from the radar to the volunteer was 3 m, 6 m, and 9 m, respectively.
As shown in Figure 2b, when the second experiment was conducted, another male volunteer served as the detection object. The volunteer faced the radar straight with 0° azimuth between the volunteer and the UWB radar, as shown in Figure 3. The distance from the radar to volunteer was 4 m, 7 m, 10 m, and 12 m, respectively.
As shown in Figure 2c, the third experiment was also conducted. One actuator was used as the detection object, which can rotate at a uniform speed with 3-mm amplitude and a 0.3333-Hz frequency. The actuator faced the radar straight, with 0° azimuth between the actuator and the UWB radar as shown in Figure 3. The distance from the radar to actuator was 4 m, 7 m, 10 m, and 12 m, respectively.
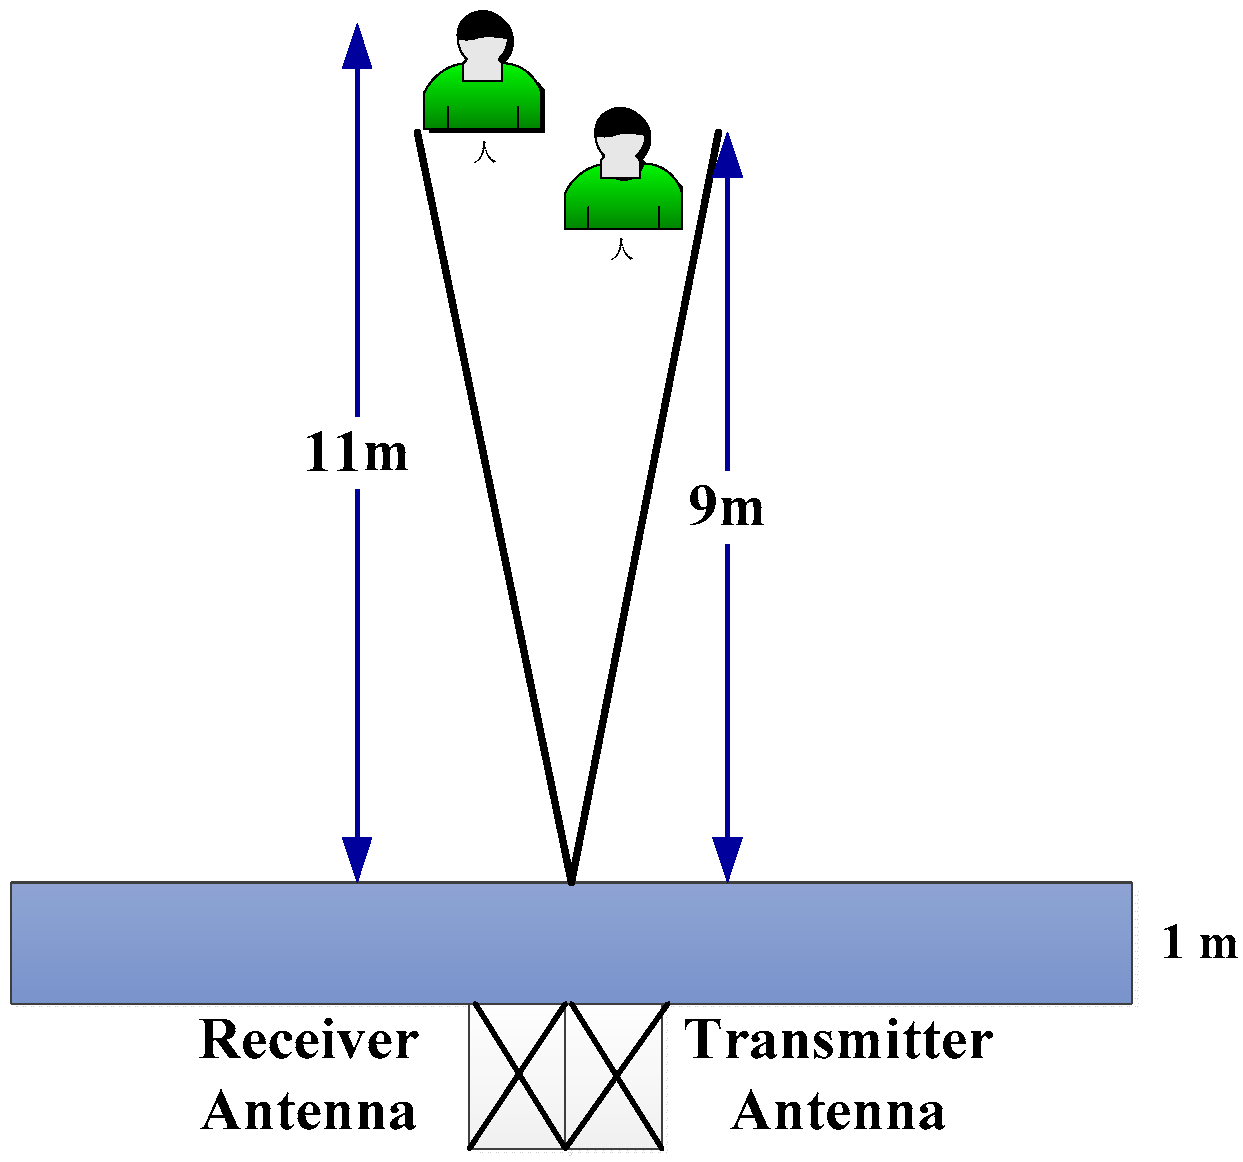
As shown in Figure 3, we conducted the fourth experiment. The volunteer faced the radar straight, with 60° azimuth between the volunteer and the UWB radar. The distance from the radar to the volunteer was 6 m.
Figure 4 shows the conducted experiments in which two volunteers served as the detection subjects. One volunteer is at a distance 10 m away from the radar receiver; another volunteer is 12 m away from the radar receiver. For all of these conducted experiments, the wall between the UWB radar and the detection objects is one meter in thickness.
3. Developed Algorithm
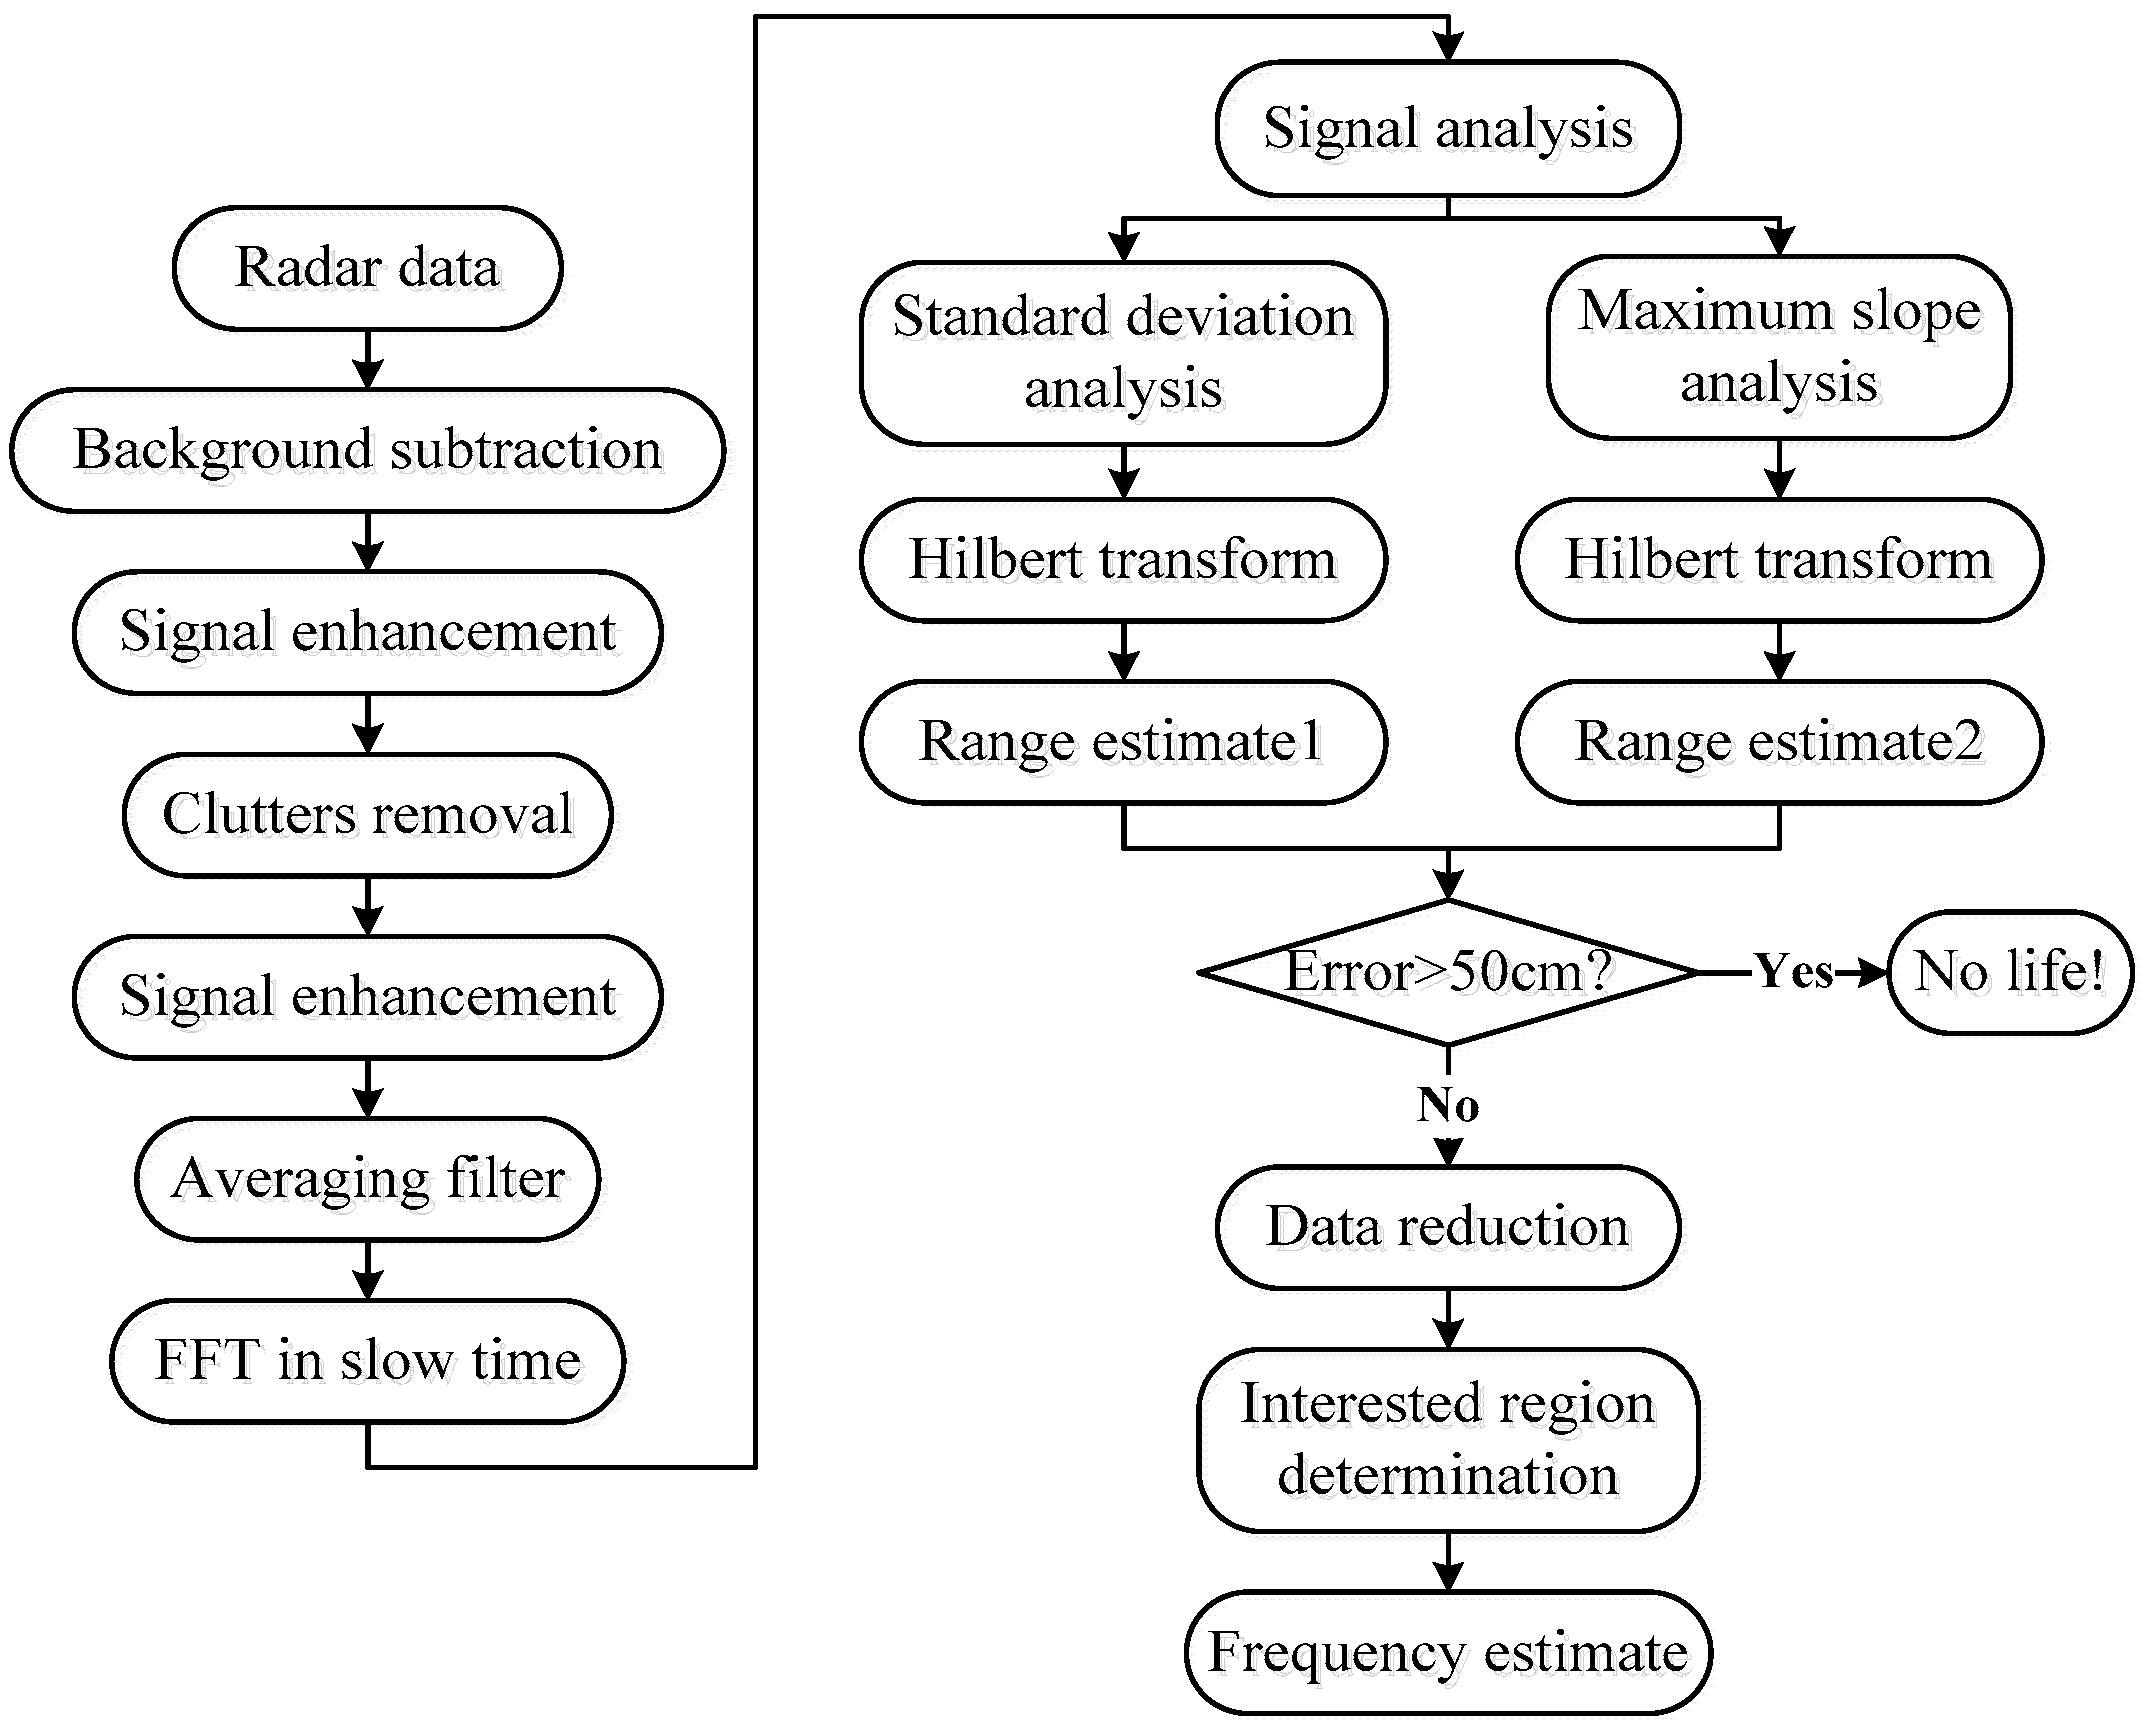
This section discusses the developed algorithm for human being detection using the UWB impulse radar. The details of the developed algorithm are shown in Figure 5.
3.1. Clutters Suppression
To estimate this static clutter, the time-invariant background signal has to be estimated and subtracted from the measured radar data A. The received radar data are collected in digital form, which is an M×N matrix. Several approaches have been proposed for estimating this static clutter. The exponential averaging algorithm is employed for removing the static clutter based on the time-variant weighted coefficient λ, which can be adjusted between 0 and 1. Based on the exponential averaging algorithm, we can acquire the following results [38]:
According to [39], λ = 0.95 has a reasonable balance between background attenuation and micromovement retention.
Meanwhile, one bandpass filter is performed on Equation (1) with the normalized cutoff frequency 0.1037 for the low pass filter and 0.0222 for the high pass filter, which all are from the Butterworth filters. Using the band pass filter, we can obtain the resultant matrix C.
3.2. Signal Enhancement
As an adaptive system, the automatic gain control (AGC) technique has been extensively applied in many electronic devices. Using the fed levels of the averaged output signals, we can adjust the gain values to an appropriate level for a range of input signal levels. One of the typical applications using the AGC algorithm is to improve the strength of weak signals in radar systems. Through adjusting the gain values based on the calculated power of the signals in a given window with the width w, the key idea of the AGC technique is to compare the acquired gain values and a chosen maximum gmax, which is formally given by:
where , , and is the normalized gain value, which is:
where is the minimal gain value acquired from all of the i values for each n, which is:
where is the signal power in a window with the length w, which is:
Using the AGC method, gmax can be predetermined based on the calculated gain values. We can acquire the following results:
3.3. SNR Improvement
To improve SNR of the life signs data, one effective filter with 12 values averaged is presented, which is performed on the columns of Equation (6). We can acquire the following results [40]:
where . is the maximal integer values, which is less than .
3.4. Spectrums Analysis
By performing the autocorrelation function on the mth slow time signal xm(n) in Equation (7), the influences caused by the zero-mean random noise are too weak for human being detection. Especially for the non-periodic noise, the autocorrelation function is prone to zero. As a result, the autocorrelation function is used to improve the weak respiratory signals. Further, to extract the spectrums of human respiratory signals, FFT is performed on the results from the autocorrelation function in slow time direction. We can acquire the resultant matrix, which is distance frequency matrix F.
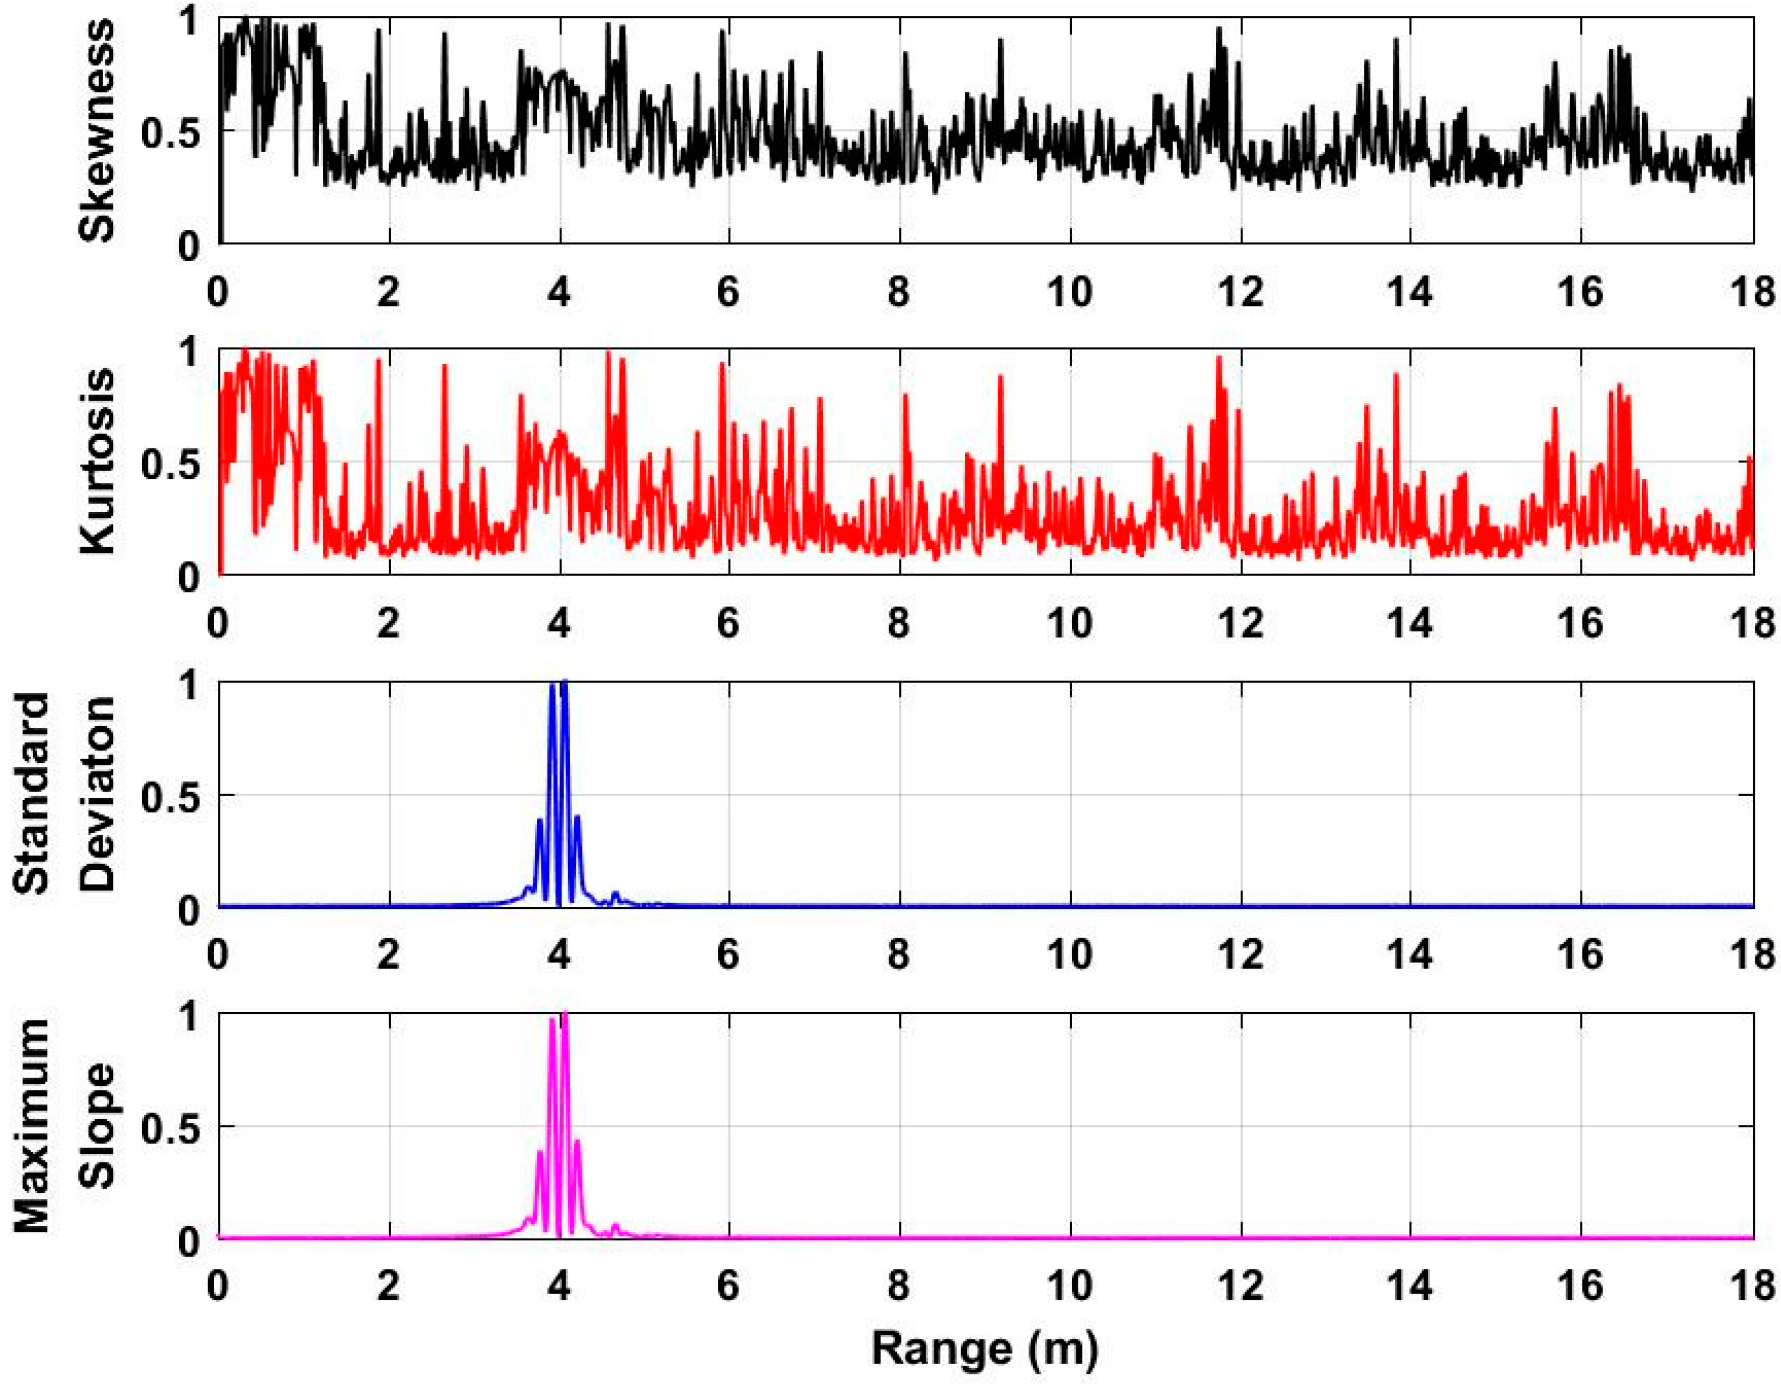
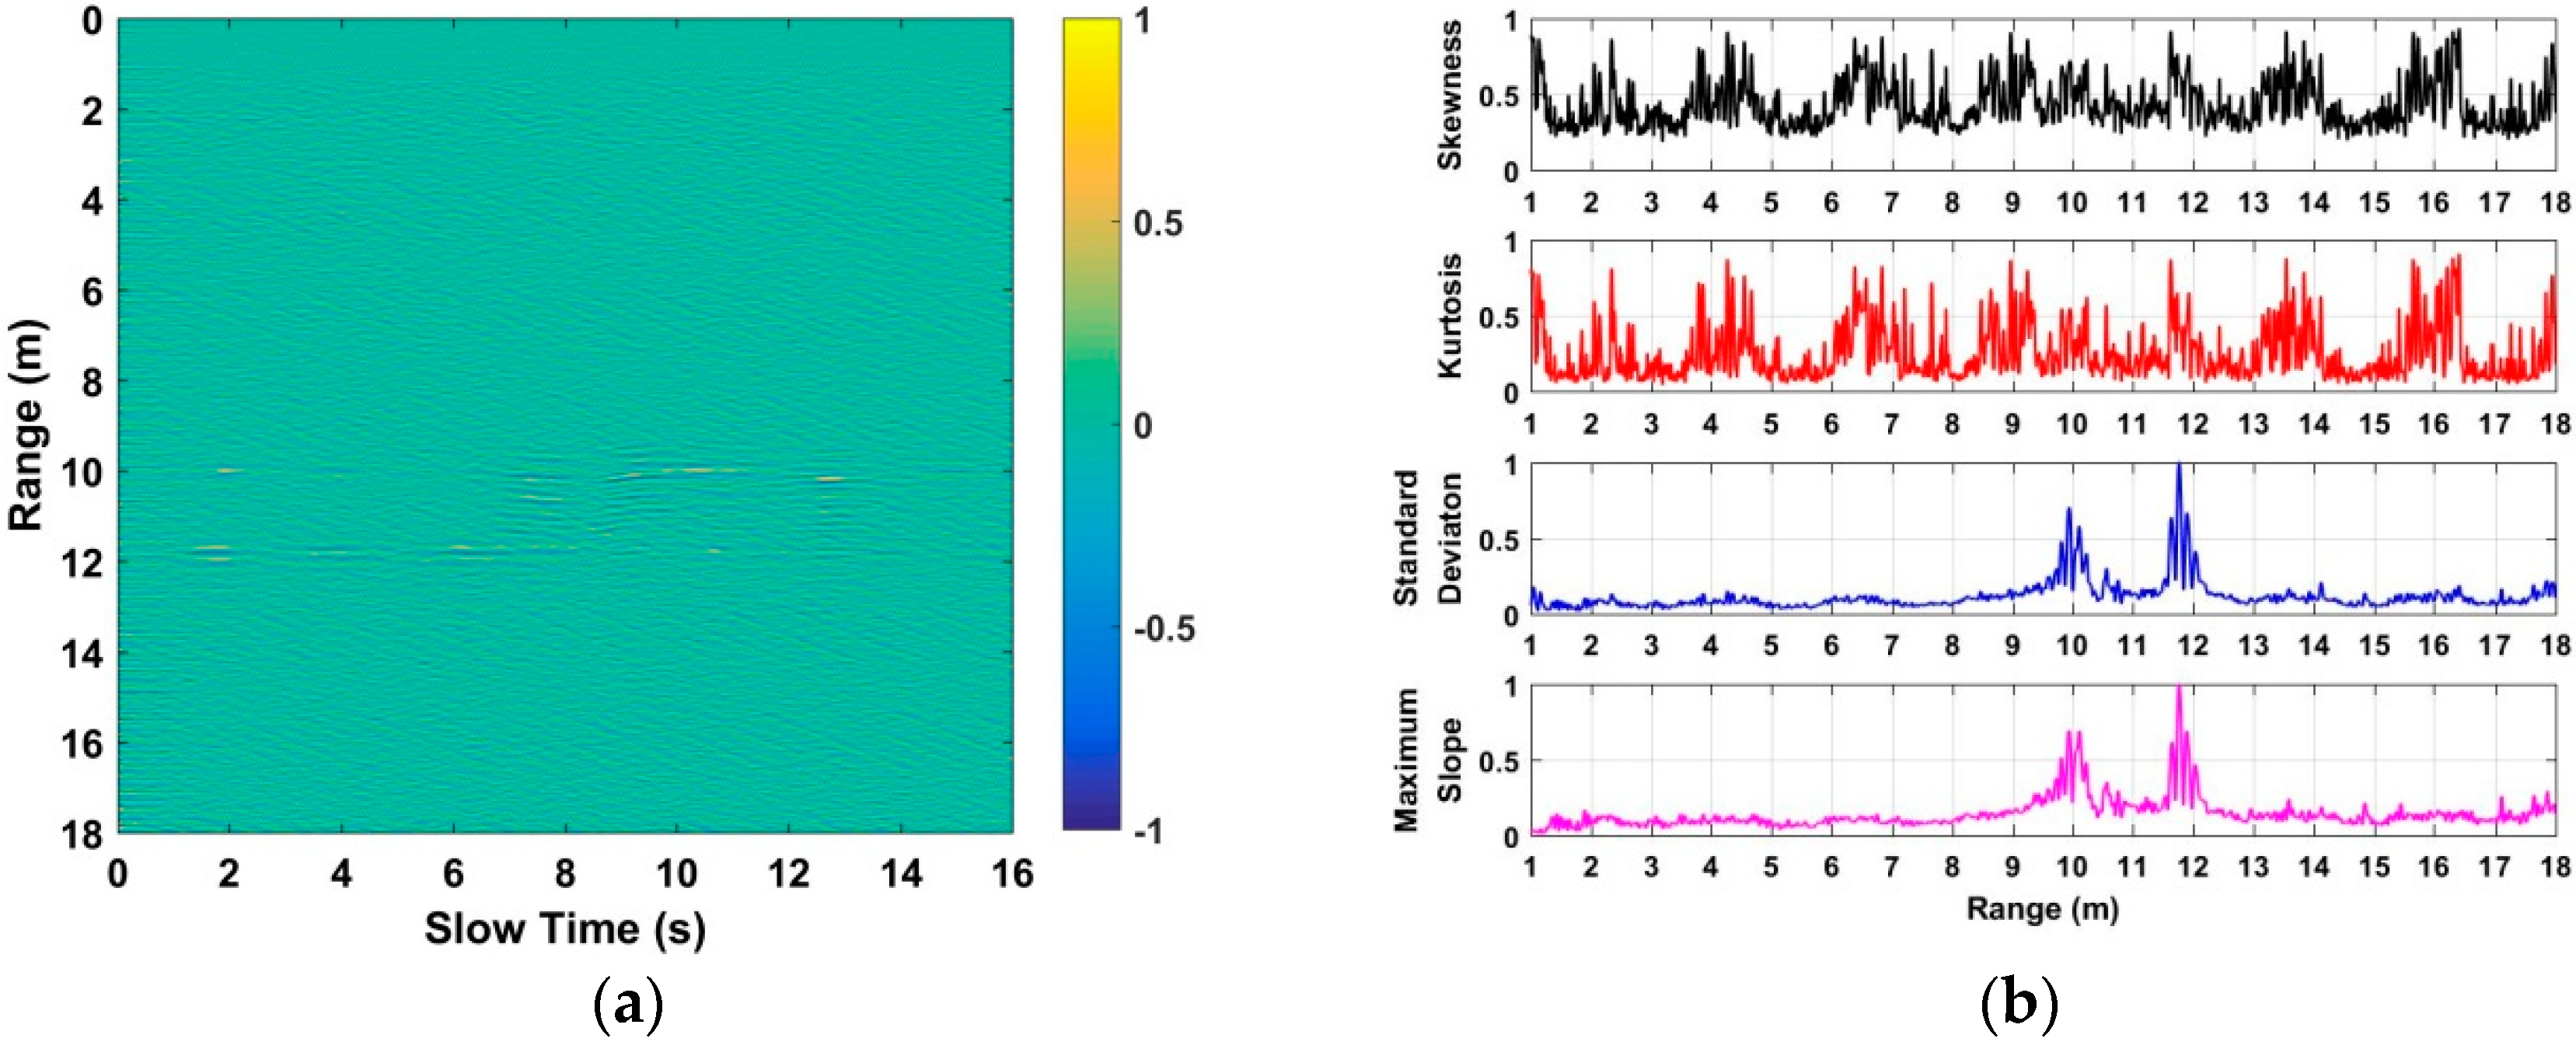
To acquire the distance between human beings and UWB radar, the characteristics including the skewness [41], kurtosis [42], standard deviation [43], and the maximum slope [44] of each slow time signal in F are analyzed and discussed. Based on the acquired data from the second experiment at a distance of 4 m, the analyzed characteristics with normalized values are shown in Figure 6. Based on the analyzed results, we can see that the standard deviation and maximum slope can better be used for distance estimation compared with the skewness and kurtosis. As a result, this paper employs the standard deviation and maximum slope as factors to acquire the distance from the radar to the human being. The distance estimate corresponding to the maximal value of the calculated standard deviation can be acquired, which is considered as τ1. Meanwhile, the distance estimate corresponding to the maximal value of the calculated maximum slope can be acquired, which is considered as τ2. The acquired two distance estimates can be used as thresholds for human being detection, which will be discussed in the following subsection.
3.5. Object Detection
To determine whether there are human beings in the detection environment, the absolute error calculated from the two distance estimates are acquired, which is given by:
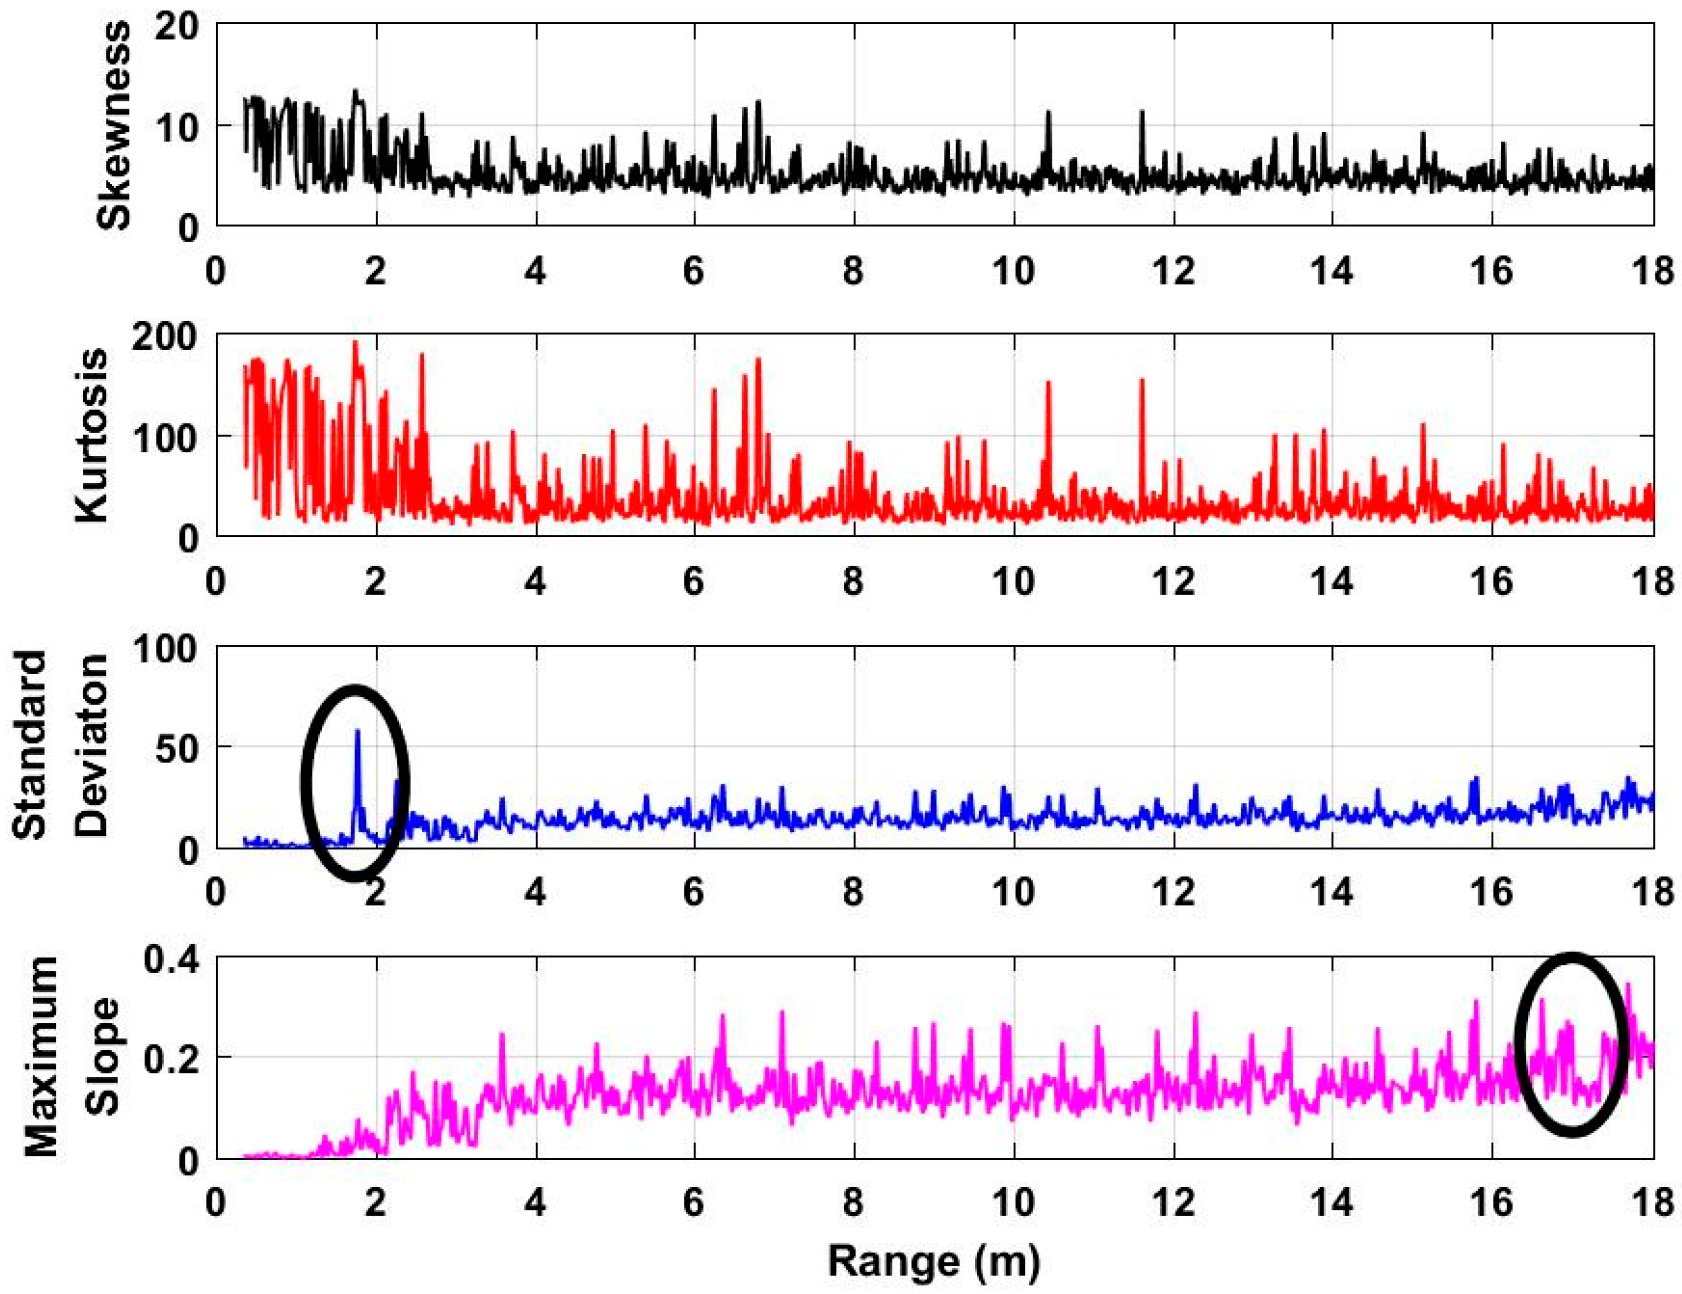
Using Equation (8), we can determine whether there are human beings in the detection environment or not through considering the threshold as a fitted value, such as 50 cm. Based on the fitted threshold, there are no human beings in the detection environment when δ > 50 cm. However, there are human beings in the detection environment when δ ≤ 50 cm. Based on the acquired data when there are no human beings in the environment, the analyzed characteristics are shown in Figure 7. We can see that the error from the two estimated distances is much more than several meters. Further, based on the acquired 72 data sets, the calculated errors are all in the level of meters. As a result, 50 cm can be considered as a perfect threshold for human being detection.
3.6. Interested Region Determination
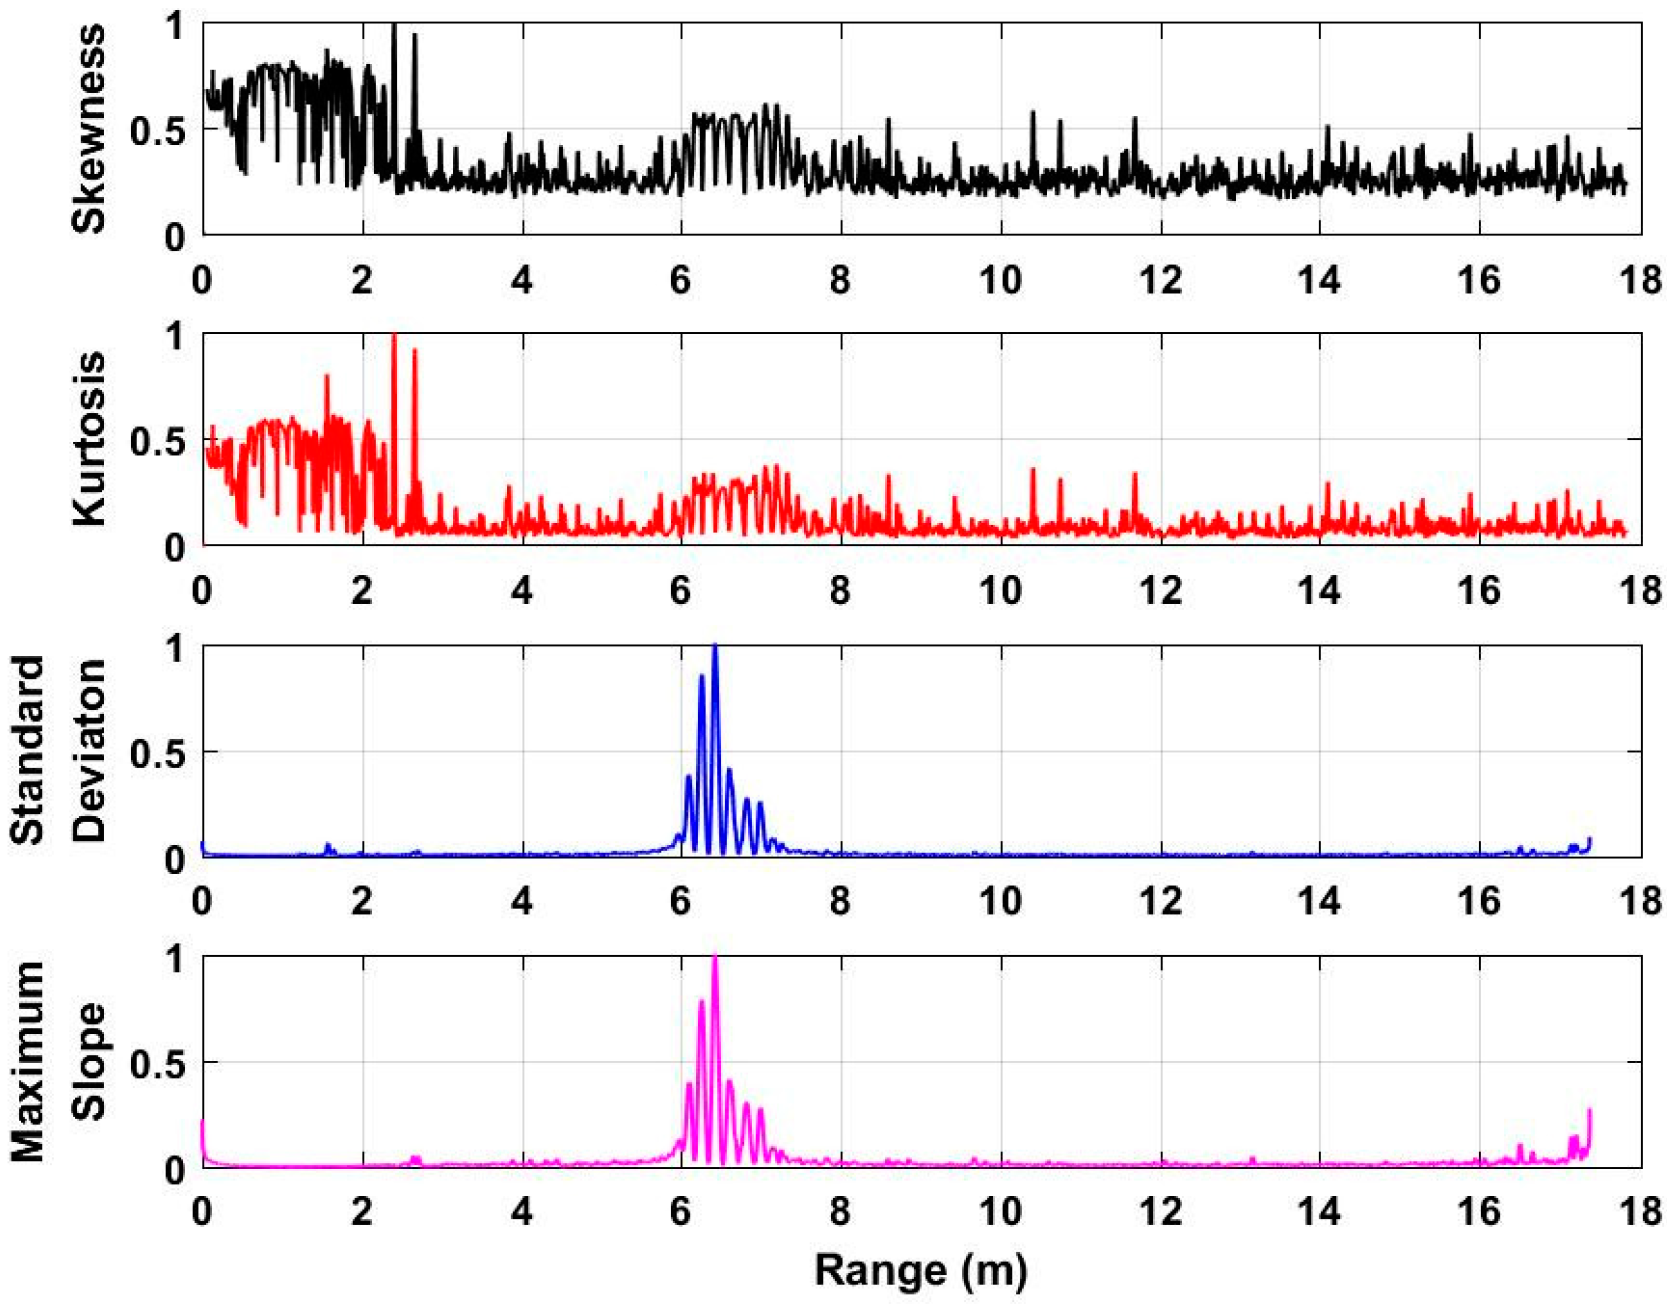
To estimate the frequency of human respiratory signals, the interested region containing the signals of human respiration is determined in this subsection based on the distance estimate τ1. In this subsection, the interested region is defined as the scope [υ − 20, υ + 20], where υ corresponds to the index of the distance estimate τ1 in the distance frequency matrix. The acquired data and the signals in the interested region are shown in Figure 8 based on the data at a distance of 12 m. As shown in Figure 8, human respiratory signals are covered with noise with larger strength, which makes it challenging to acquire the frequency when all of the data are considered. However, we can see the radar pulses modulated by human respiratory movement when only the signals in the interested region are considered. As a result, the signals in the defined interested region can better improve the SNR, which can make the frequency easier to estimate. Most importantly, the interested region can reduce the data size, which can improve the operation efficiency of the radar system.
3.7. Frequency Estimate
Since the frequency of human respiratory signals is confined to a narrow frequency distance, one selected frequency window within 0.1–0.8 Hz is used for removing clutters and harmonics in very high and very low frequencies. Based on the employed frequency window, for each frequency signal ym(n) in F, we can acquire the following results:
where Ψ denotes the added frequency window.
To acquire the frequency of human respiratory signals, the accumulated spectrums are considered, which are given by:
Usually, the maximal value in Equation (10) is defined as the frequency of human respiratory signals.
4. Results and Discussion
This section discusses the developed algorithm for human being detection.
4.1. Clutters Suppression
This subsection analyzes the capability of clutters suppression based on the received data from human beings at a distance of 12 m away from the UWB impulse radar. Figure 9a shows the acquired distance–time (slow time) matrix from the radar receiver, which indicates that human respiratory signals are covered with different noises with larger amplitude. When using the radar data, human respiratory signals are challenging to identify due to the existing noises. The resultant matrix obtained from the used static background suppression algorithm is shown in Figure 9b.
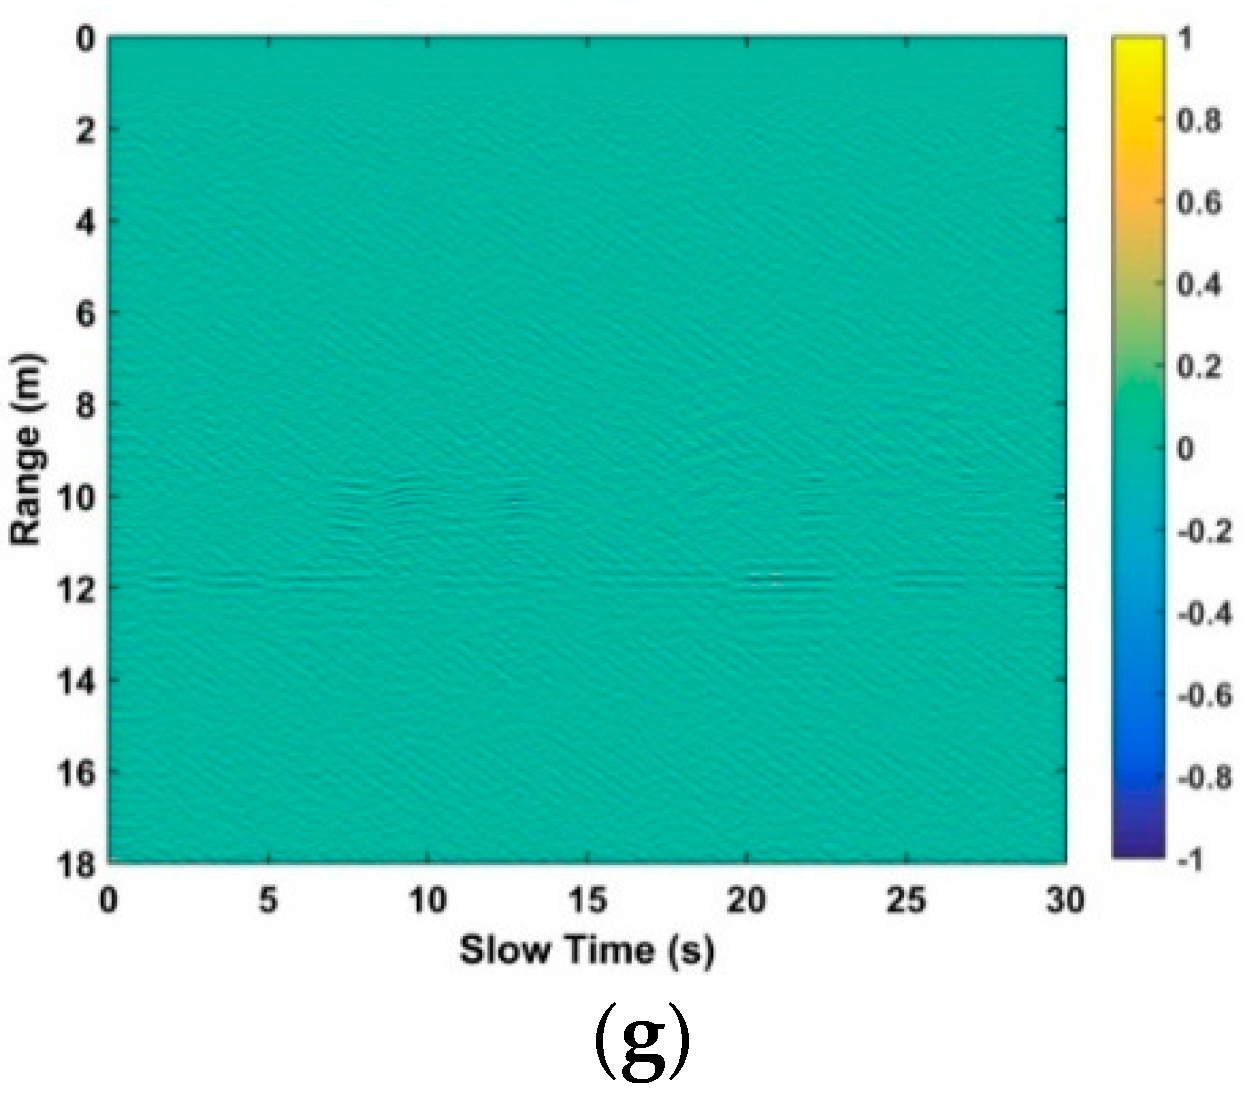
Figure 9c shows the resultant matrix obtained from the used AGC algorithm, which is performed for the first time. We can see that human respiratory signals are improved and the clutters and noises are preliminarily suppressed. As shown in Figure 9d, the resultant matrix is acquired using the employed band pass filter, which indicates that human respiratory signals are further improved. Figure 9e shows the resultant matrix obtained from the used AGC algorithm, which is performed for the second time. The resultant matrix is shown in Figure 9f using the averaging filter performed in the slow time direction. Figure 9g shows the resultant matrix based on the averaging filter performed in the distance direction. Compared with Figure 9a, we can see that the human respiratory signals are improved effectively, which make human beings easier to identify.
4.2. Distance Estimate
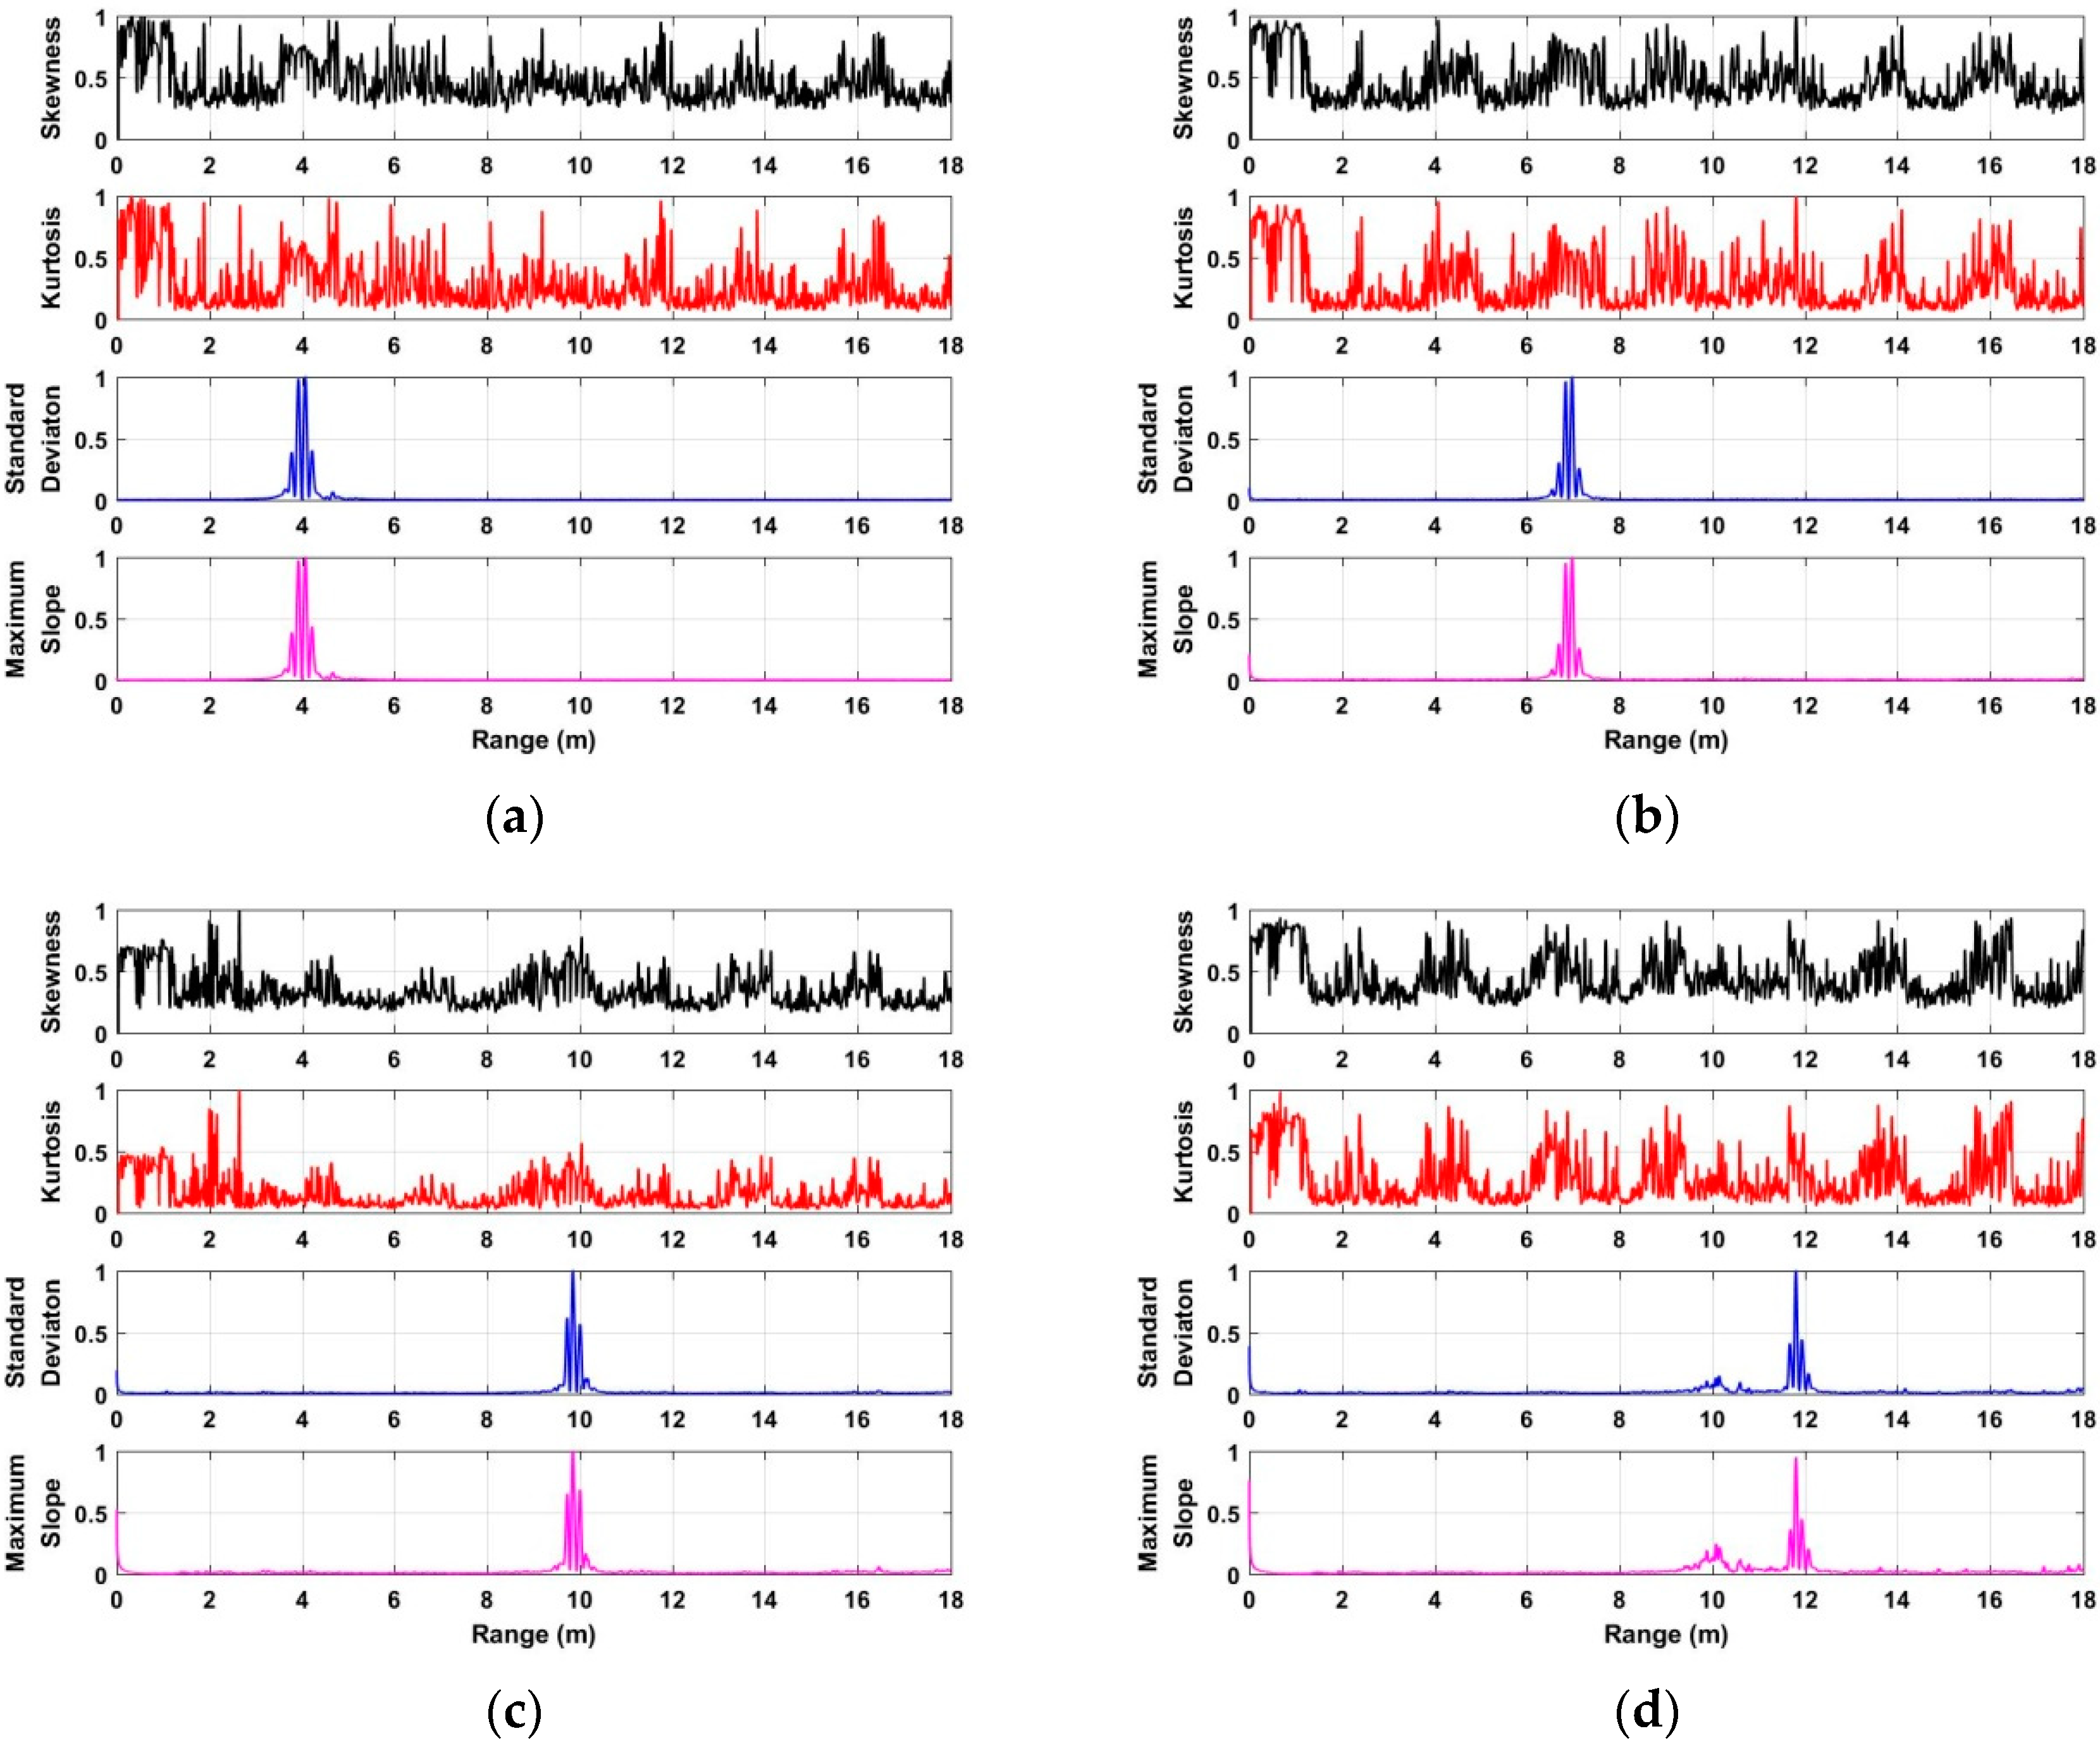
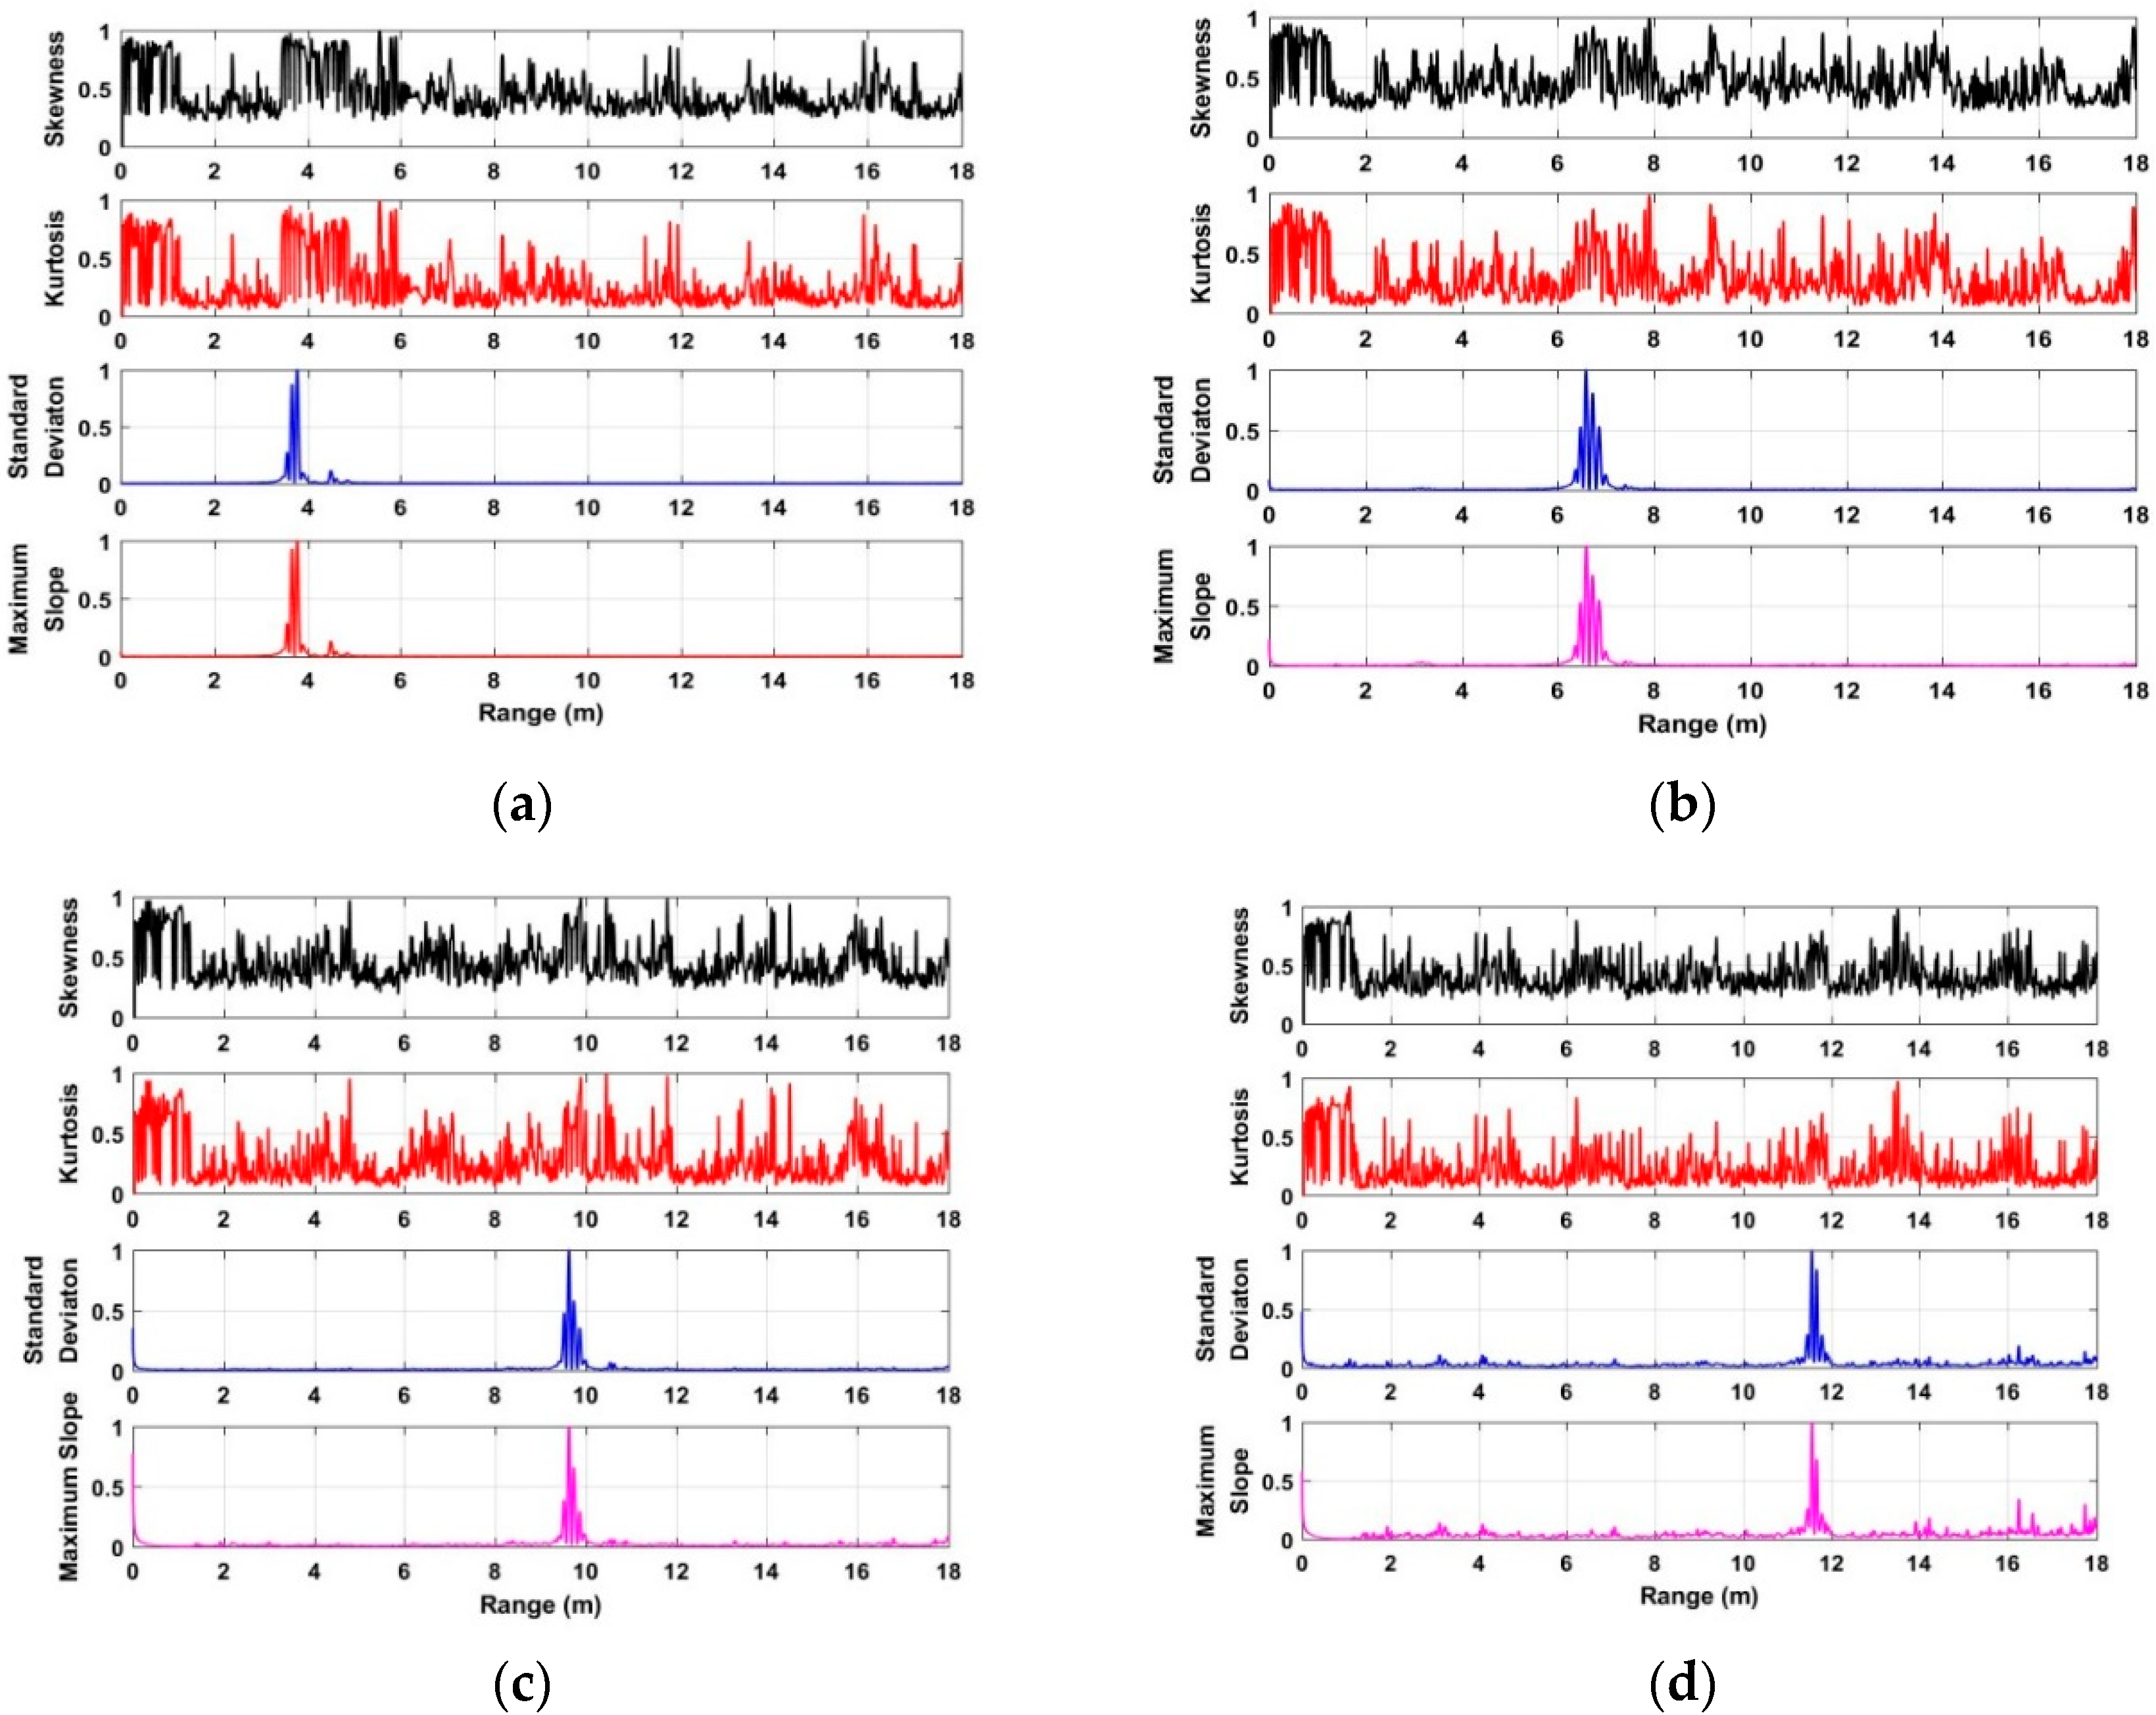
The performances of distance estimate based on the developed algorithm are analyzed and discussed using the data acquired in different environments. Based on the radar data acquired from one human being at distances of 4 m, 7 m, 10 m, and 12 m indoors, the distance estimates are shown in Figure 10. Using the developed algorithm, Figure 11 shows the distance estimates based on the radar data acquired from the used actuator at distances of 4 m, 7 m, 10 m, and 12 m. The distance estimates using the data acquired from one human being at distances of 3 m, 6 m, and 9 m are shown in Figure 12. All of the distance estimates mentioned above were acquired from the data with 0° azimuth between the human being and the UWB radar.
Figure 13 shows the distance estimate acquired from the data at a distance of 6 m away from the radar, and the azimuth is 60° between the human being and UWB impulse radar indoors. Based on the results of distance estimates as shown in Figure 10, Figure 11, Figure 12 and Figure 13 we can see that the distance between the human being and UWB radar can be calculated accurately via analyzing the characteristics of radar data in the conducted experiments, especially in long-distance conditions. Meanwhile, we can see that all of the errors that were calculated from two distance estimates via analyzing the maximum slope and standard deviation of radar data for each given distance are less than 50 cm.
In this subsection, three algorithms are employed as references, including the constant false alarm ratio (CFAR) algorithm [45], advanced method (AM) [46], and the multiple higher order cumulant (MHOC) method [47] to validate the performances of the developed method.
Table 2 shows the errors of the distance estimates based on the four algorithms. We can see that the developed method can provide the highest accuracy compared with the other three methods. All of these results indicate the better performance of the developed algorithm on distance estimates.
4.3. Frequency Estimate
The performances of the frequency estimate of human respiratory signals based on the developed algorithm are analyzed and discussed using the data acquired in different environments.
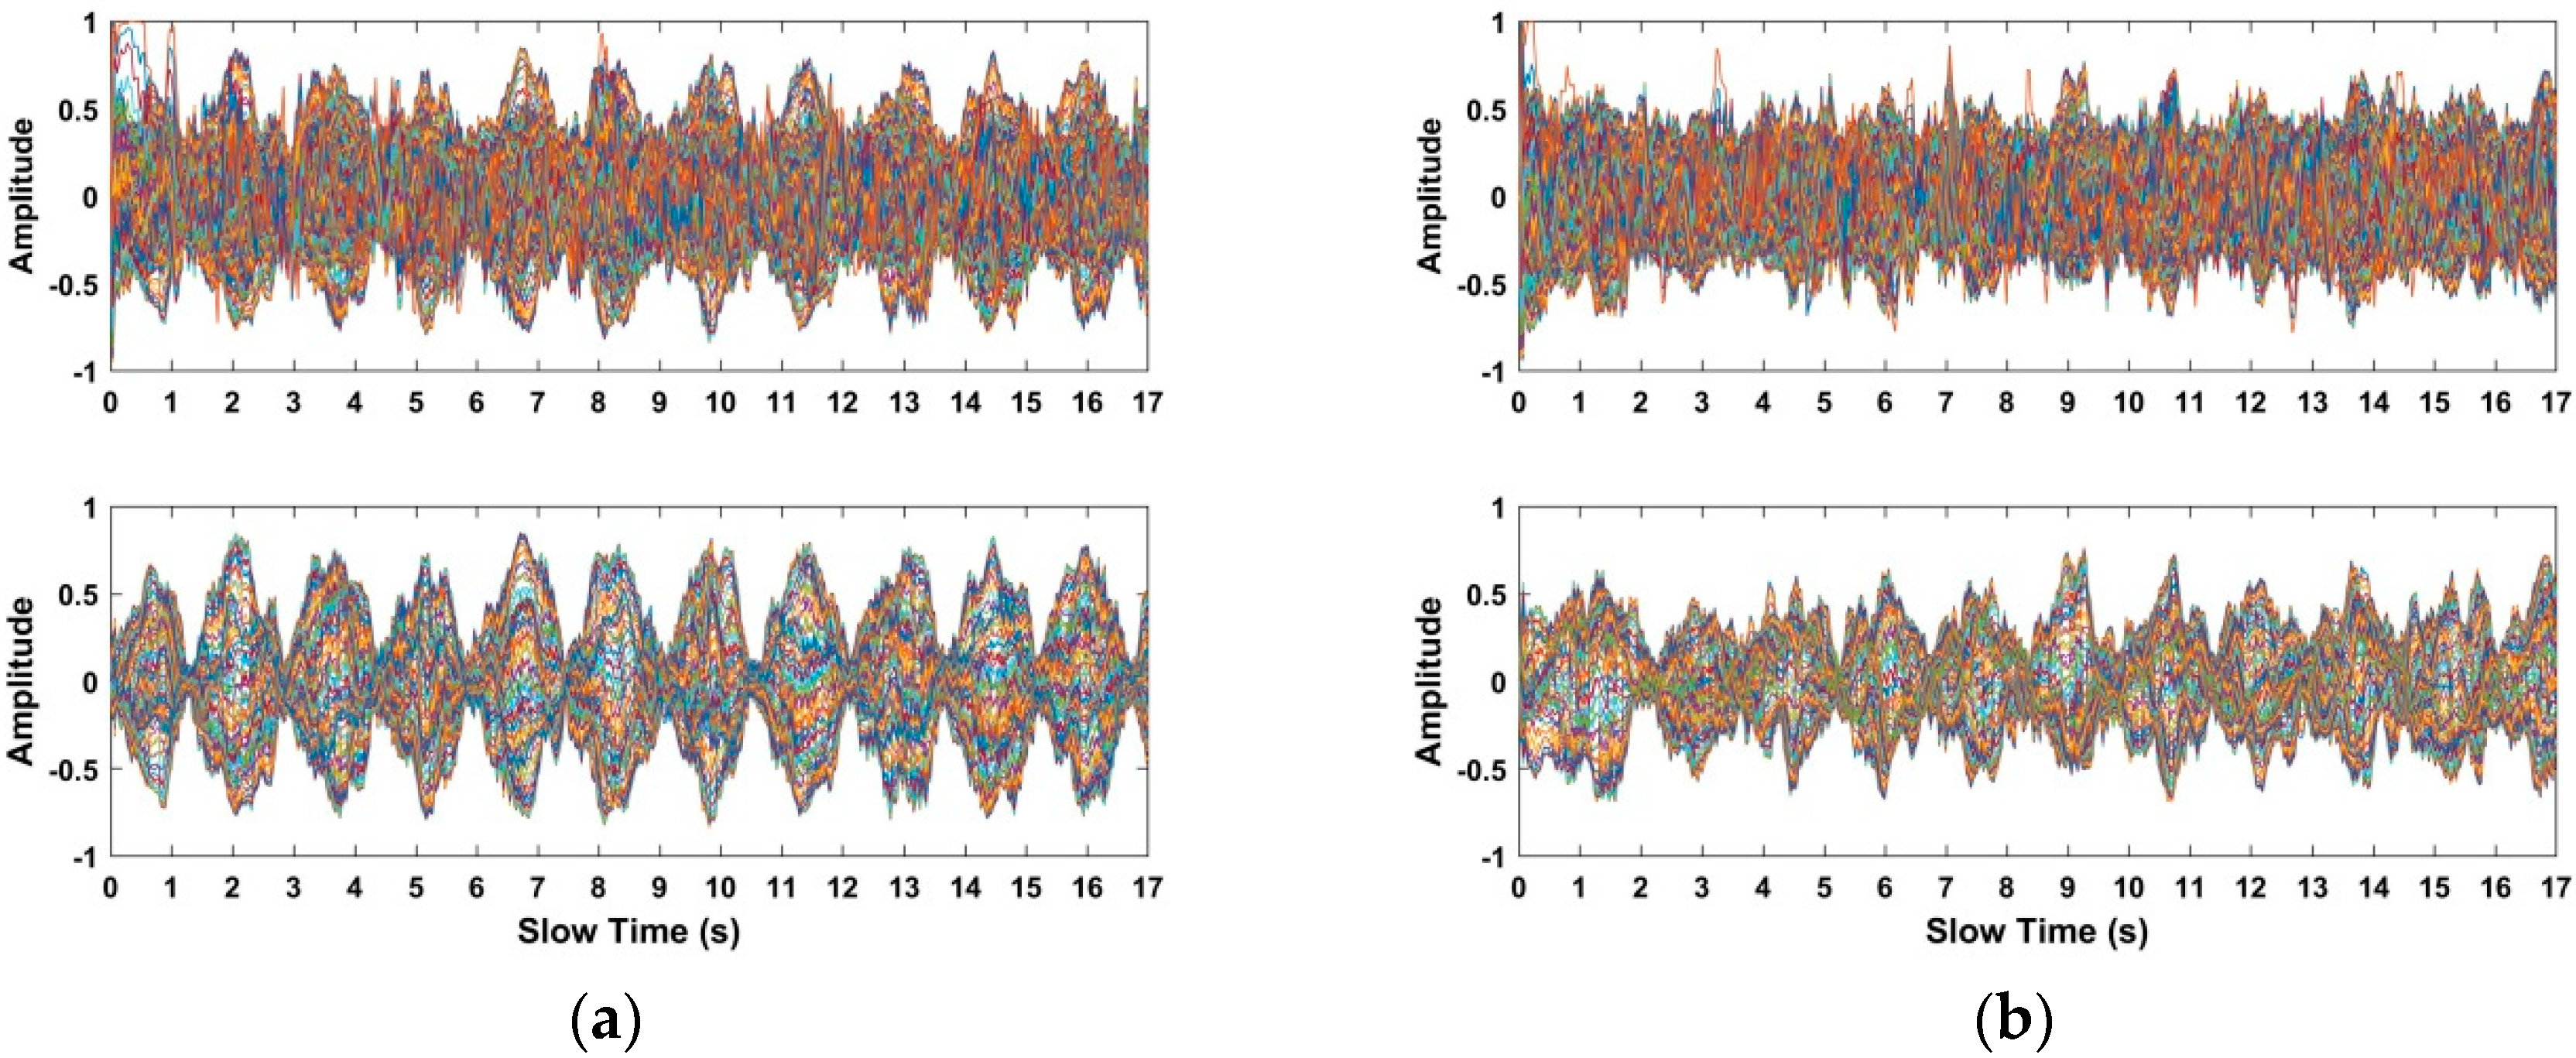
Based on the data acquired from the used actuator at distances of 4 m, 7 m, 10 m, and 12 m indoors, the received data and the selected signals in the interested region are shown in Figure 14. Meanwhile, using the radar data acquired from a human being at distances of 4 m, 7 m, 10 m, and 12 m indoors, the received radar data and the selected signals in the interested region are shown in Figure 15. The up figures show the signals from the received radar data, while the signals in the interested region are shown in the following figures. Compared with the up figures, we can see that the SNR of human respiratory signals is improved and the noise affecting human being detection is suppressed effectively, which can make the human being easier to identify.
To validate the accuracy of the frequency estimate, the data acquired from the used actuator at different distances, including 4 m, 7 m, 10 m, and 12 m indoors, are employed as references. The frequency estimates of the used actuator at different distances based on the selected signals in the interested region are shown in Figure 16. Based on the acquired results, the frequency estimates of the actuator can be calculated accurately. Meanwhile, the corresponding frequency estimates acquired from the four different algorithms are shown in Table 3, which indicate that the proposed algorithm provides the highest accuracy of the frequency estimates compared with the other three methods.
4.4. Detection of Two Human Beings
This subsection validates the capability of two-target detection based on the acquired data. Figure 17 shows the detection results based on the developed method using the data from two human beings in the environment. One human being is at a distance of 10 m, while another is at a distance of 12 m away from the UWB impulse radar. The resultant matrix after removing the clutter is shown in Figure 17a,b shows the distance estimates of the two human beings corresponding to the first two peaks in the calculated standard deviation and maximum slope values.
Further, Figure 18 shows the detection results based on the developed method using the data from two actuators in the environment. One actuator is at a distance of 10 m, while another is at a distance 12 m away from the UWB impulse radar. The resultant matrix after removing the clutter is shown in Figure 18a,b shows the distance estimates of the two actuators corresponding to the first two peaks in the calculated standard deviation and maximum slope values. From the acquired results, the excellent performance of the proposed algorithm is validated evenly for the two targets.
5. Conclusions
This paper proposes a novel algorithm for human being detection using the ultra-wideband (UWB) impulse radar systems. The multiple automatic gain control (AGC) technique is employed to enhance the strength of the respiratory signals of human beings. Two filters with seven values averaged are used for improving the signal-to-noise ratio (SNR) of human respiratory signals. The maximum slope and standard deviation are used for analyzing the characteristics of human respiratory signals. Based on the acquired results, the distance between the radar receiver and human beings can be calculated. Based on the distance estimate, the interested region containing human beings can be determined, which can be used to improve the SNR and the accuracy of the frequency estimate of human respiratory movement. Our future work will mainly focus on how to extract human respiratory signals when they are in motion such as walking and running. Further, we will continue to analyze how to identify human beings from other living animals.
Author Contributions
All authors contributed to writing and editing this manuscript. X.L. conceived and designed the experiments, performed the experiments, and analyzed the data. Y.W., S.W., and T.A.G. reviewed the results and revised the manuscript.
Funding
This work was funded by the Science and Technology on Electronic Test & Measurement Laboratory (9140C120102150C12055 and 6142001010101), the Nature Science Foundation of China (41527901, 61501424 and 61701462), the Ao Shan Science and Technology Innovation Project of Qingdao National Laboratory for Marine Science and Technology (2017ASKJ01), the Beijing Municipal Natural Science Foundation (4172066), and the National Key R&D Program of China (2017YFF0107703).
Conflicts of Interest
The authors declare no conflict of interest.
References
- Chen, K.M.; Devendra, M.; Wang, H.; Chuang, H.R.; Postow, E. An X-banc microwave life-detection system. IEEE Trans. Biomed. Eng. 1986, 33, 697–701. [Google Scholar] [CrossRef] [PubMed]
- Sharafi, A.; Baboli, M.; Ahmadian, A. Respiration-rate estimation of a moving target using impulse-based ultra-wideband radars. Australas. Phys. Eng. Sci. Med. 2012, 35, 31–39. [Google Scholar] [CrossRef] [PubMed]
- Immoreev, I.Y. Short-distance ultra-wideband radars. IEEE Aerosp. Electr. Syst. Mag. 2005, 20, 9–14. [Google Scholar] [CrossRef]
- Fontana, R.J. Recent system applications of short-pulse ultra-wideband (UWB) technology. IEEE Trans. Microw. Theory Tech. 2004, 52, 2087–2104. [Google Scholar] [CrossRef]
- Lv, H.; Zhang, Y.; Wang, J.Q. An adaptive-mssa-based algorithm for detection of trapped victims using uwb radar. IEEE Geosci. Remote Sens. Lett. 2015, 12, 1808–1812. [Google Scholar] [CrossRef]
- Lazaro, A.; Girbau, D.; Villarino, R. Analysis of vital signs monitoring using an IR-UWB radar. Prog. Electromagn. Res. 2010, 100, 265–284. [Google Scholar] [CrossRef]
- Droitcour, A.D.; Boric-Lubecke, O.; Lubecke, V.M.; Lin, J. 0.25/spl mu/m CMOS and BiCMOS single-chip direct-conversion Doppler radars for remote sensing of vital signs. In Proceedings of the 2002 IEEE International Solid-State Circuits Conference (ISSCC), Digest of Technical Papers, San Francisco, CA, USA, 3–7 February 2002. [Google Scholar]
- He, M.; Nian, Y.; Gong, Y. Novel signal processing method for vital sign monitoring using FMCW radar. Biomed. Signal Process. Control 2017, 33, 335–345. [Google Scholar] [CrossRef]
- Sana, F.; Ballal, T.; Al-Naffouri, T.Y.; Hoteit, I. Low-complexity wireless monitoring of respiratory movements using ultra-wideband impulse response estimation. Biomed. Signal Process. Control 2014, 10, 192–200. [Google Scholar] [CrossRef] [Green Version]
- Li, N.; Sawan, M. Neural signal compression using a minimum Euclidean or Manhattan distance cluster-based deterministic compressed sensing matrix. Biomed. Signal Process. Control 2015, 19, 44–55. [Google Scholar] [CrossRef]
- Kranjec, J.; Beguš, S.; Geršak, G.; Drnovšek, J. Non-contact heart rate and heart rate variability measurements: A review. Biomed. Signal Process. Control 2014, 13, 102–112. [Google Scholar] [CrossRef]
- Van, N.; Javaid, A.Q.; Weitnauer, M.A. Harmonic Path (HAPA) algorithm for non-contact vital signs monitoring with IR-UWB radar. In Proceedings of the 2013 IEEE Biomedical Circuits and Systems Conference (BioCAS), Rotterdam, The Netherlands, 31 October–2 November 2013. [Google Scholar]
- Van, N.; Javaid, A.Q.; Weitnauer, M.A. Spectrum-averaged Harmonic Path (SHAPA) algorithm for non-contact vital sign monitoring with ultra-wideband (UWB) radar. In Proceedings of the 2014 36th Annual International Conference of the IEEE Engineering in Medicine and Biology Society, Chicago, IL, USA, 27–31 August 2014. [Google Scholar]
- Khan, F.; Choi, J.W.; Cho, S.H. Design issues in vital sign monitoring through IR UWB radar. In Proceedings of the 18th IEEE International Symposium on Consumer Electronics (ISCE 2014), JeJu, Korea, 22–25 June 2014. [Google Scholar]
- Ascione, M.; Buonanno, A.; D’Urso, M.; Angrisani, L.; Moriello, R.S.L. A new measurement method based on music algorithm for through-the-wall detection of life signs. IEEE Trans. Instrum. Meas. 2013, 62, 13–26. [Google Scholar] [CrossRef]
- Liang, X.; Zhang, H.; Lyu, T.; Xu, L.; Cao, C.; Gulliver, T.A. Ultra-wide band impulse radar for life detection using wavelet packet decomposition. Phys. Commun. 2018, 29, 31–47. [Google Scholar] [CrossRef]
- Lazaro, A.; Girbau, D.; Villarino, R. Techniques for clutter suppression in the presence of body movements during the detection of respiratory activity through UWB radars. Sensors 2014, 14, 2595–2618. [Google Scholar] [CrossRef] [PubMed]
- Yan, J.; Hong, H.; Zhao, H.; Li, Y.S.; Gu, C.; Zhu, X.H. Through-wall multiple targets vital signs tracking based on VMD algorithm. Sensors 2016, 16, 1293. [Google Scholar] [CrossRef] [PubMed]
- Li, W.Z.; Li, Z.; Lv, H.; Lu, G.; Zhang, Y.; Jiang, X.; Li, S.; Wang, J. A new method for non-line-of-sight vital sign monitoring based on developed adaptive line enhancer using low centre frequency UWB radar. Prog. Electromagn. Res. 2013, 133, 535–554. [Google Scholar] [CrossRef]
- Van, N.; Javaid, A.Q.; Weitnauer, M.A. Detection of motion and posture change using an IR-UWB radar. In Proceedings of the 2016 IEEE 38th Annual International Conference of the Engineering in Medicine and Biology Society (EMBC), Orlando, FL, USA, 16–20 August 2016. [Google Scholar]
- Khan, F.; Choi, J.W.; Cho, S.H. Vital sign monitoring of a non-stationary human through IR-UWB radar. In Proceedings of the 2014 4th IEEE International Conference on Network Infrastructure and Digital Content (IC-NIDC), Beijing, China, 19–21 September 2014; pp. 511–514. [Google Scholar]
- Li, J.; Zeng, Z.; Sun, J.; Liu, F. Through-wall detection of human being’s movement by UWB radar. IEEE Geosci. Remote Sens. Lett. 2012, 9, 1079–1083. [Google Scholar] [CrossRef]
- Baboli, M.; Ghorashi, S.A.; Saniei, N.; Ahmadian, A. A new wavelet based algorithm for estimating respiratory motion rate using UWB radar. In Proceedings of the 2009 International Conference on Biomedical and Pharmaceutical Engineering, Singapore, 2–4 December 2009. [Google Scholar]
- Schleicher, B.; Nasr, I.; Trasser, A.; Schumacher, H. IR-UWB radar demonstrator for ultra-fine movement detection and vital-sign monitoring. IEEE Trans. Microw. Theory Tech. 2013, 61, 2076–2085. [Google Scholar] [CrossRef]
- Richards, J.L.; Fullerton, L.W.; Kelly, D.A. System and Method Using Impulse Radio Technology to Track and Monitor People Needing Health Care. U.S. Patent 6466125, 15 October 2002. [Google Scholar]
- Li, C.; Lin, J.; Xiao, Y. Robust overnight monitoring of human vital signs by a non-contact respiration and heartbeat detector. In Proceedings of the 28th Annual International Conference of the IEEE Engineering in Medicine and Biology Society (EMBS’06), New York, NY, USA, 31 August–3 September 2006. [Google Scholar]
- Yilmaz, T.; Foster, R.; Hao, Y. Detecting vital signs with wearable wireless sensors. Sensors 2010, 10, 10837–10862. [Google Scholar] [CrossRef] [PubMed] [Green Version]
- Li, C.; Lin, J. Random body movement cancellation in Doppler radar vital sign detection. IEEE Trans. Microw. Theory Tech. 2008, 56, 3143–3152. [Google Scholar]
- Hu, X.; Jin, T. Short-range vital signs sensing based on EEMD and CWT using IR-UWB radar. Sensors 2016, 16, 2025. [Google Scholar] [CrossRef] [PubMed]
- Venkatesh, S.; Anderson, C.R.; Rivera, N.V.; Buehrer, R.M. Implementation and analysis of respiration-rate estimation using impulse-based UWB. In Proceedings of the MILCOM 2005-IEEE Military Communications Conference, Atlantic, NJ, USA, 17–20 October 2005. [Google Scholar]
- Javaid, A.Q.; Noble, C.M.; Rosenberg, R.; Weitnauer, M.A. Towards sleep apnea screening with an under-the-mattress IR-UWB radar using machine learning. In Proceedings of the 2015 IEEE 14th International Conference on Machine Learning and Applications (ICMLA), Miami, FL, USA, 9–11 December 2015. [Google Scholar]
- Ota, K.; Ota, Y.; Otsu, M.; Kajiwara, A. Elderly-care motion sensor using UWB-IR. In Proceedings of the 2011 IEEE Sensors Applications Symposium (SAS), San Antonio, TX, USA, 22–24 February 2011. [Google Scholar]
- Li, X.; Qiao, D.; Li, Y. Macro-motion detection using ultra-wideband impulse radar. In Proceedings of the 2014 36th Annual International Conference of the IEEE Engineering in Medicine and Biology Society, Chicago, IL, USA, 27–31 August 2014. [Google Scholar]
- Immoreev, I.Y. New practical application of ultra-wideband radars. In Proceedings of the 2007 European Radar Conference, Munich, Germany, 10–12 October 2007; pp. 216–219. [Google Scholar]
- Chia, M.Y.W.; Leong, S.W.; Sim, C.K.; Chan, K.M. Through-wall UWB radar operating within FCC’s mask for sensing heart beat and breathing rate. In Proceedings of the 2005 European Radar Conference, Paris, France, 3–4 October 2005; pp. 267–270. [Google Scholar]
- Yarovoy, A.G.; Ligthart, L.P.; Matuzas, J.; Levitas, B. UWB radar for human being detection. IEEE Aerosp. Electron. Syst. Mag. 2008, 23, 36–40. [Google Scholar] [CrossRef]
- Levitas, B.; Matuzas, J. UWB radar for human being detection behind the wall. In Proceedings of the 2006 International Radar Symposium, Krakow, Poland, 24–26 May 2006; pp. 1–3. [Google Scholar]
- Hu, J.; Zhu, G.; Jin, T.; Zhou, Z. Adaptive through-wall indication of human target with different motions. IEEE Geosci. Remote Sens. Lett. 2013, 11, 911–915. [Google Scholar] [CrossRef]
- Liang, X.; Zhang, H.; Fang, G.Y.; Ye, S.B.; Gulliver, T.A. An improved algorithm for through-wall target detection using ultra-wideband impulse radar. IEEE Access 2017, 5, 22101–22118. [Google Scholar] [CrossRef]
- Liang, X.; Zhang, H.; Ye, S.B.; Fang, G.Y.; Gulliver, T.A. Improved denoising method for through-wall vital sign detection using uwb impulse radar. Digit. Signal Process. 2018, 74, 72–93. [Google Scholar] [CrossRef]
- Liang, X.; Zhang, H.; Lyu, T.; Xiao, H.; Gulliver, T.A. A novel time of arrival estimation algorithm using an energy detector receiver in MMW systems. EURASIP J. Adv. Signal Process. 2017, 83, 1–13. [Google Scholar] [CrossRef]
- Liang, X.; Zhang, H.; Lu, T.; Gulliver, T.A. Energy detector based TOA estimation for MMW systems using machine learning. Telecommun. Syst. 2017, 64, 417–427. [Google Scholar] [CrossRef]
- Liang, X.; Lu, T.; Zhang, H.; Gao, Y.; Fang, G. Through-wall human being detection using uwb impulse radar. EURASIP J. Wirel. Commun. 2018, 46, 1–17. [Google Scholar] [CrossRef]
- Liang, X.; Zhang, H.; Lu, T.; Gulliver, T.A. Extreme learning machine for 60 GHz millimetre wave positioning. IET Commun. 2017, 11, 483–489. [Google Scholar] [CrossRef]
- Xu, Y.; Wu, S.; Chen, C.; Chen, J.; Fang, G. A novel method for automatic detection of trapped victims by ultrawideband radar. IEEE Trans. Geosci. Remote Sens. 2012, 50, 3132–3142. [Google Scholar] [CrossRef]
- Wu, S.; Tan, K.; Xia, Z.; Chen, J.; Meng, S.; Fang, G. Improved human respiration detection method via ultra-wideband radar in through-wall or other similar conditions. IET Radar Sonar Navig. 2016, 10, 468–476. [Google Scholar] [CrossRef]
- Xu, Y.; Dai, S.; Wu, S.; Chen, J.; Fang, G. Vital sign detection method based on multiple higher order cumulant for ultra-wideband radar. IEEE Trans. Geosci. Remote Sens. 2011, 50, 1254–1265. [Google Scholar] [CrossRef]
Figure 1.
The experimental setups for human being detection.

Figure 2.
The conducted experiments in through-wall conditions (a) outdoors; (b) indoors; and (c) on the actuator.
Figure 2.
The conducted experiments in through-wall conditions (a) outdoors; (b) indoors; and (c) on the actuator.

Figure 3.
The conducted azimuth experiments.

Figure 4.
The conducted two-target detection experiments.

Figure 5.
Flowchart of the developed human being detection method.

Figure 6.
The analyzed characteristics based on the acquired data at a distance of 4 m.

Figure 7.
The analyzed characteristics based on the data without human beings in the experiment.

Figure 8.
The acquired data from one human being at a distance of 12 m.

Figure 9.
The resultant matrix from the (a) radar receiver; (b) static background suppression; (c) automatic gain control (AGC); (d) band pass filter; (e) AGC; (f) averaging filter in distance direction; and (g) averaging filter in slow time direction.
Figure 9.
The resultant matrix from the (a) radar receiver; (b) static background suppression; (c) automatic gain control (AGC); (d) band pass filter; (e) AGC; (f) averaging filter in distance direction; and (g) averaging filter in slow time direction.


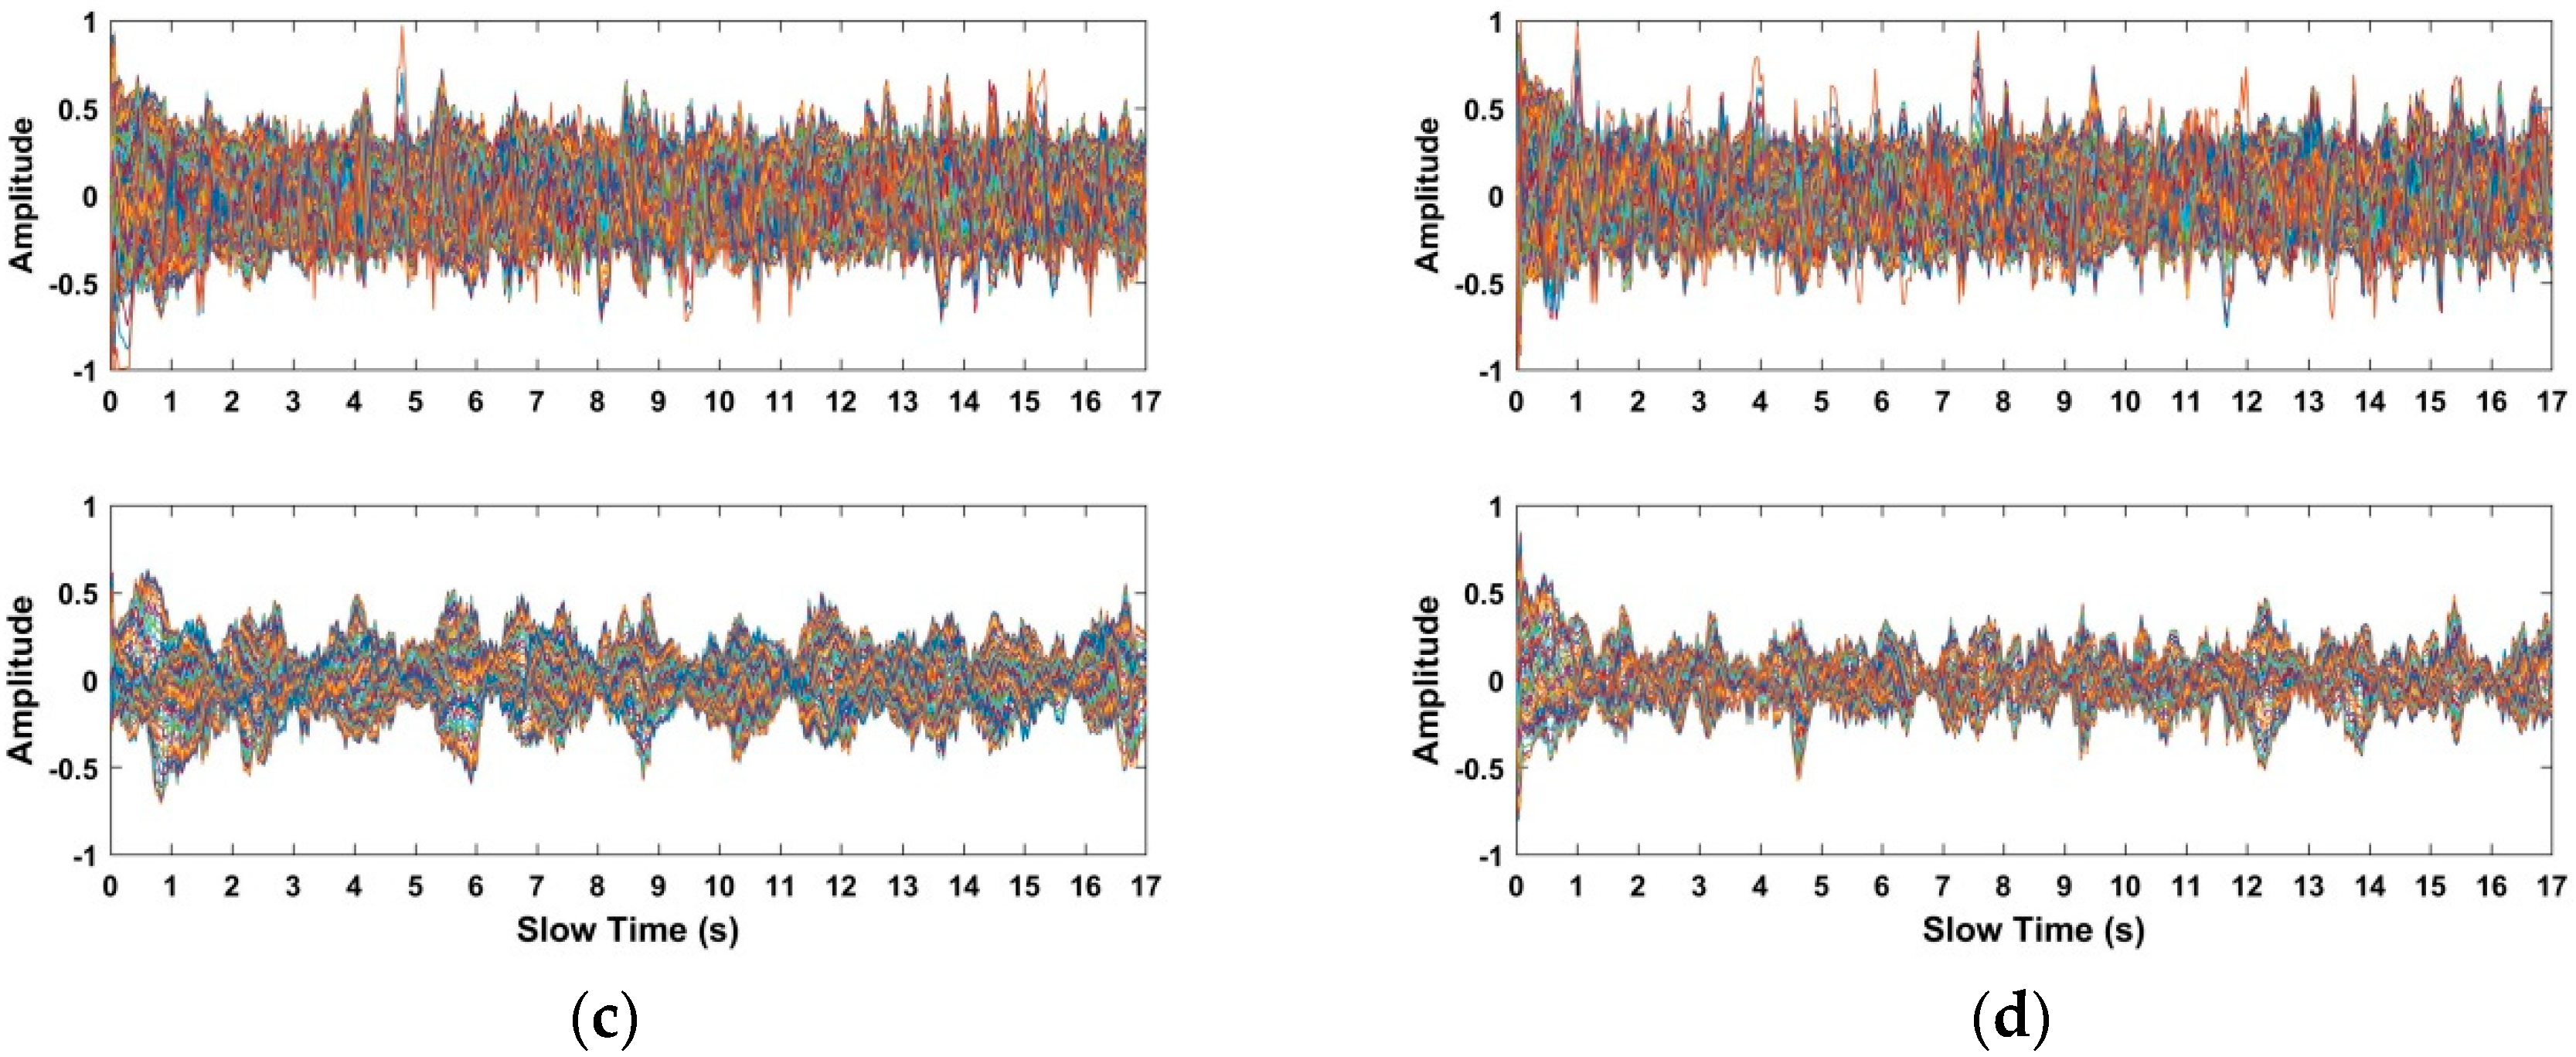
Figure 10.
The distance estimates based on the acquired data from one human being at a distance of (a) 4 m; (b) 7 m; (c) 10 m; and (d) 12 m indoors.
Figure 10.
The distance estimates based on the acquired data from one human being at a distance of (a) 4 m; (b) 7 m; (c) 10 m; and (d) 12 m indoors.

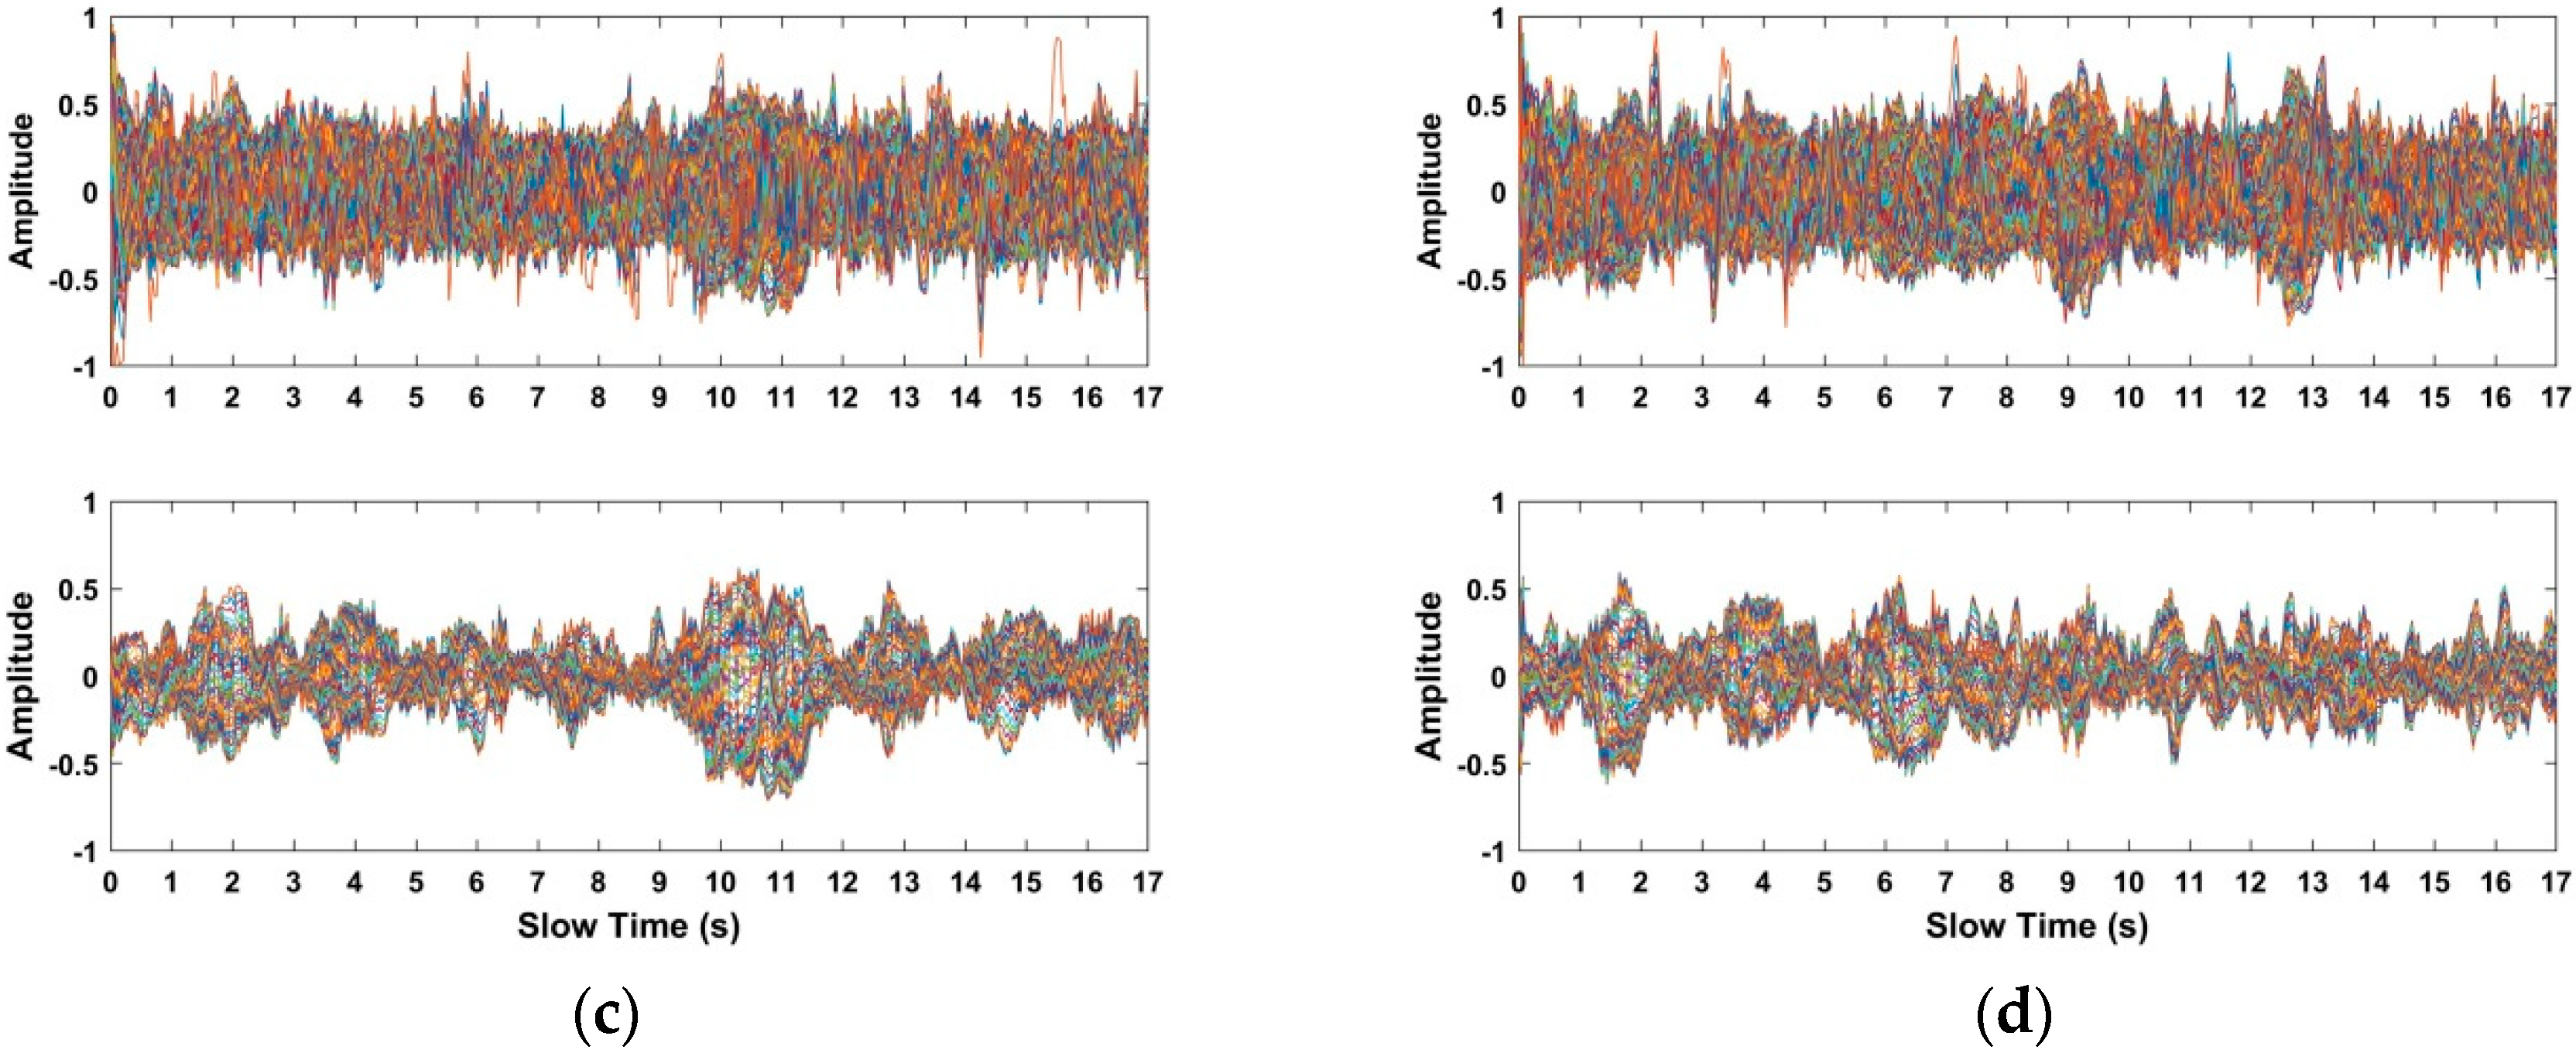
Figure 11.
The distance estimates based on the acquired data from the actuator at distances of (a) 4 m; (b) 7 m; (c) 10 m; and (d) 12 m indoors.
Figure 11.
The distance estimates based on the acquired data from the actuator at distances of (a) 4 m; (b) 7 m; (c) 10 m; and (d) 12 m indoors.

Figure 12.
The distance estimates based on the acquired data from a human being at distances of (a) 3 m; (b) 6 m; and (c) 9 m outdoors.
Figure 12.
The distance estimates based on the acquired data from a human being at distances of (a) 3 m; (b) 6 m; and (c) 9 m outdoors.

Figure 13.
The distance estimates based on the acquired data from one human being at a distance of 6 m indoors with 60° azimuth.
Figure 13.
The distance estimates based on the acquired data from one human being at a distance of 6 m indoors with 60° azimuth.

Figure 14.
The selected signals in the interested region based on the acquired data from the used actuator at distances (a) 4 m; (b) 7 m; (c) 10 m; and (d) 12 m indoors.
Figure 14.
The selected signals in the interested region based on the acquired data from the used actuator at distances (a) 4 m; (b) 7 m; (c) 10 m; and (d) 12 m indoors.


Figure 15.
The selected signals in the interested region based on the acquired data from the actuator at distances of (a) 4 m; (b) 7 m; (c) 10 m; and (d) 12 m indoors.
Figure 15.
The selected signals in the interested region based on the acquired data from the actuator at distances of (a) 4 m; (b) 7 m; (c) 10 m; and (d) 12 m indoors.


Figure 16.
Frequency estimates of the used actuator based on the acquired data at distances of (a) 4 m; (b) 7 m; (c) 10 m; and (d) 12 m indoors.
Figure 16.
Frequency estimates of the used actuator based on the acquired data at distances of (a) 4 m; (b) 7 m; (c) 10 m; and (d) 12 m indoors.

Figure 17.
Results of the detection of two human beings (a) after removing clutter; and (b) distance estimates.
Figure 17.
Results of the detection of two human beings (a) after removing clutter; and (b) distance estimates.

Figure 18.
Results of the detection of two targets (a) after removing clutter; and (b) distance estimates.
Figure 18.
Results of the detection of two targets (a) after removing clutter; and (b) distance estimates.


Table 1.
Parameters for the ultra-wideband (UWB) impulse radar.
| Parameter | Value |
|---|---|
| center frequency | 400 MHz |
| bandwidth of the pulse | 400 MHz |
| transmitted signal amplitude | 50 V |
| pulse repeat frequency | 600 KHz |
| number of averaged values | 30 |
| time window | 124 ns |
| number of samples | 4092 |
| input bandwidth of the analog to digital converter (ADC) | 2.3 GHz |
| ADC sampling rate | 500 MHz |
| ADC sample size | 12 bits |
| receiver dynamic range | 72 dB |
Table 2.
Distance estimation with four different methods. CFAR: constant false alarm ratio, MHOC: multiple higher order cumulant, AM: advanced method.
Table 2.
Distance estimation with four different methods. CFAR: constant false alarm ratio, MHOC: multiple higher order cumulant, AM: advanced method.
| Methods | 4 m | 7 m | 10 m | 12 m | |
|---|---|---|---|---|---|
| CFAR | Error (m) | 0.36 | 3.47 | 7.32 | 8.78 |
| Proposed | Error (m) | 0.15 | 0.17 | 0.21 | 0.24 |
| MHOC | Error (m) | 0.65 | 2.93 | 2.56 | 8.38 |
| AM | Error (m) | 0.34 | 3.46 | 5.62 | 4.25 |
Table 3.
Frequency estimates with the two methods. FFT: Fourier fast transform.
| Method | 4 m | 7 m | 10 m | 12 m | ||||
|---|---|---|---|---|---|---|---|---|
| Hz | Deviation (%) | Hz | Deviation (%) | Hz | Deviation (%) | Hz | Deviation (%) | |
| FFT | 0.116 | 65.2 | 0.126 | 62.00 | 0.137 | 58.66 | 0.112 | 66.22 |
| Proposed | 0.32 | 3.99 | 0.32 | 3.99 | 0.32 | 3.99 | 0.32 | 3.99 |
| MHOC | 0.349 | 4.74 | 0.116 | 65.10 | 0.116 | 65.14 | 0.087 | 73.89 |
| AM | 0.187 | 43.89 | 0.087 | 73.89 | 0.087 | 73.89 | 0.087 | 73.89 |
© 2018 by the authors. Licensee MDPI, Basel, Switzerland. This article is an open access article distributed under the terms and conditions of the Creative Commons Attribution (CC BY) license (http://creativecommons.org/licenses/by/4.0/).
Share and Cite
MDPI and ACS Style
Liang, X.; Wang, Y.; Wu, S.; Gulliver, T.A. Experimental Study of Wireless Monitoring of Human Respiratory Movements Using UWB Impulse Radar Systems. Sensors 2018, 18, 3065. https://doi.org/10.3390/s18093065
AMA Style
Liang X, Wang Y, Wu S, Gulliver TA. Experimental Study of Wireless Monitoring of Human Respiratory Movements Using UWB Impulse Radar Systems. Sensors. 2018; 18(9):3065. https://doi.org/10.3390/s18093065
Chicago/Turabian StyleLiang, Xiaolin, Yuankai Wang, Shiyou Wu, and Thomas Aaron Gulliver. 2018. "Experimental Study of Wireless Monitoring of Human Respiratory Movements Using UWB Impulse Radar Systems" Sensors 18, no. 9: 3065. https://doi.org/10.3390/s18093065
Note that from the first issue of 2016, this journal uses article numbers instead of page numbers. See further details here.