
Explosive Paroxysmal Events at Etna Volcano of Different Magnitude and Intensity Explored through a Multidisciplinary Monitoring System

 ,
,  , , , , , , ,
Abstract
:
1. Introduction
2. Materials and Methods
3. Results
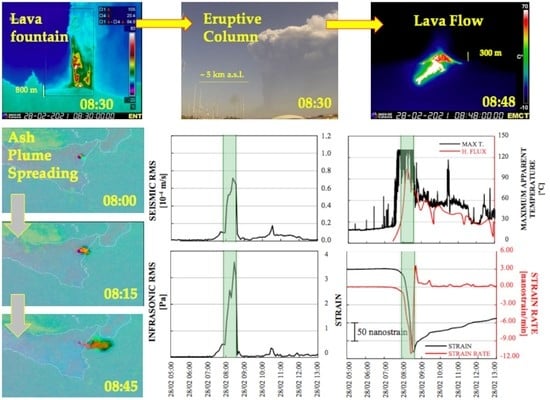
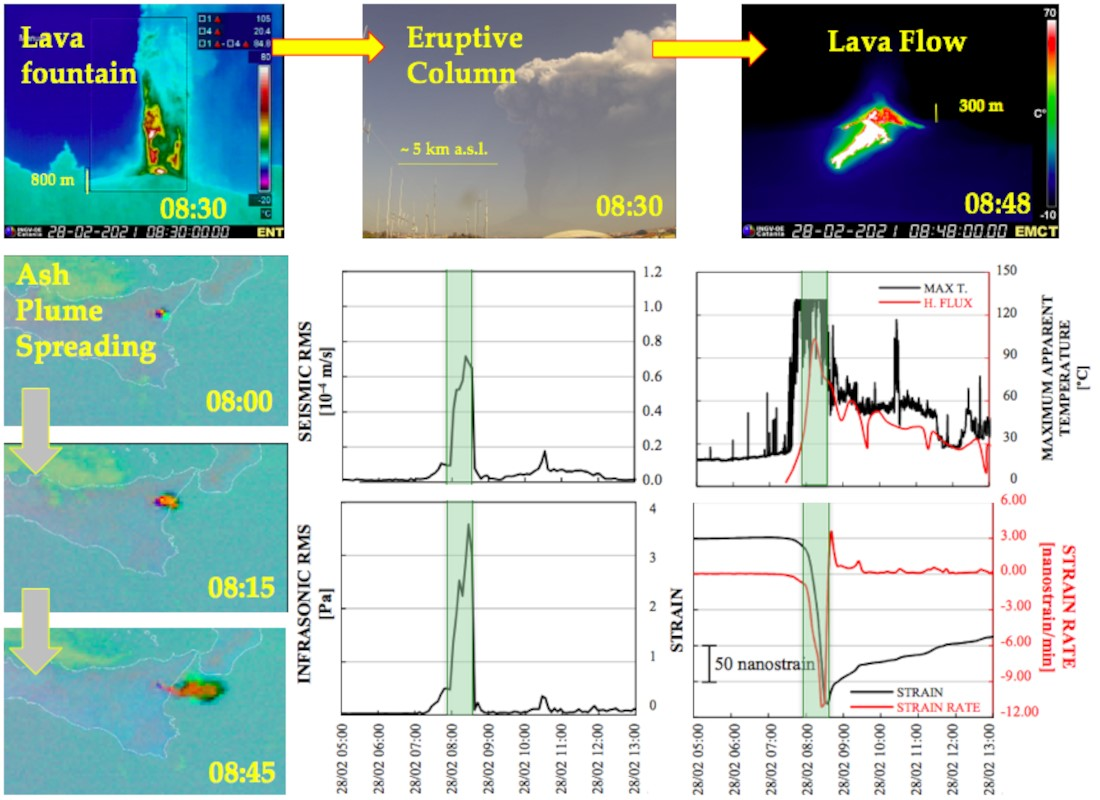
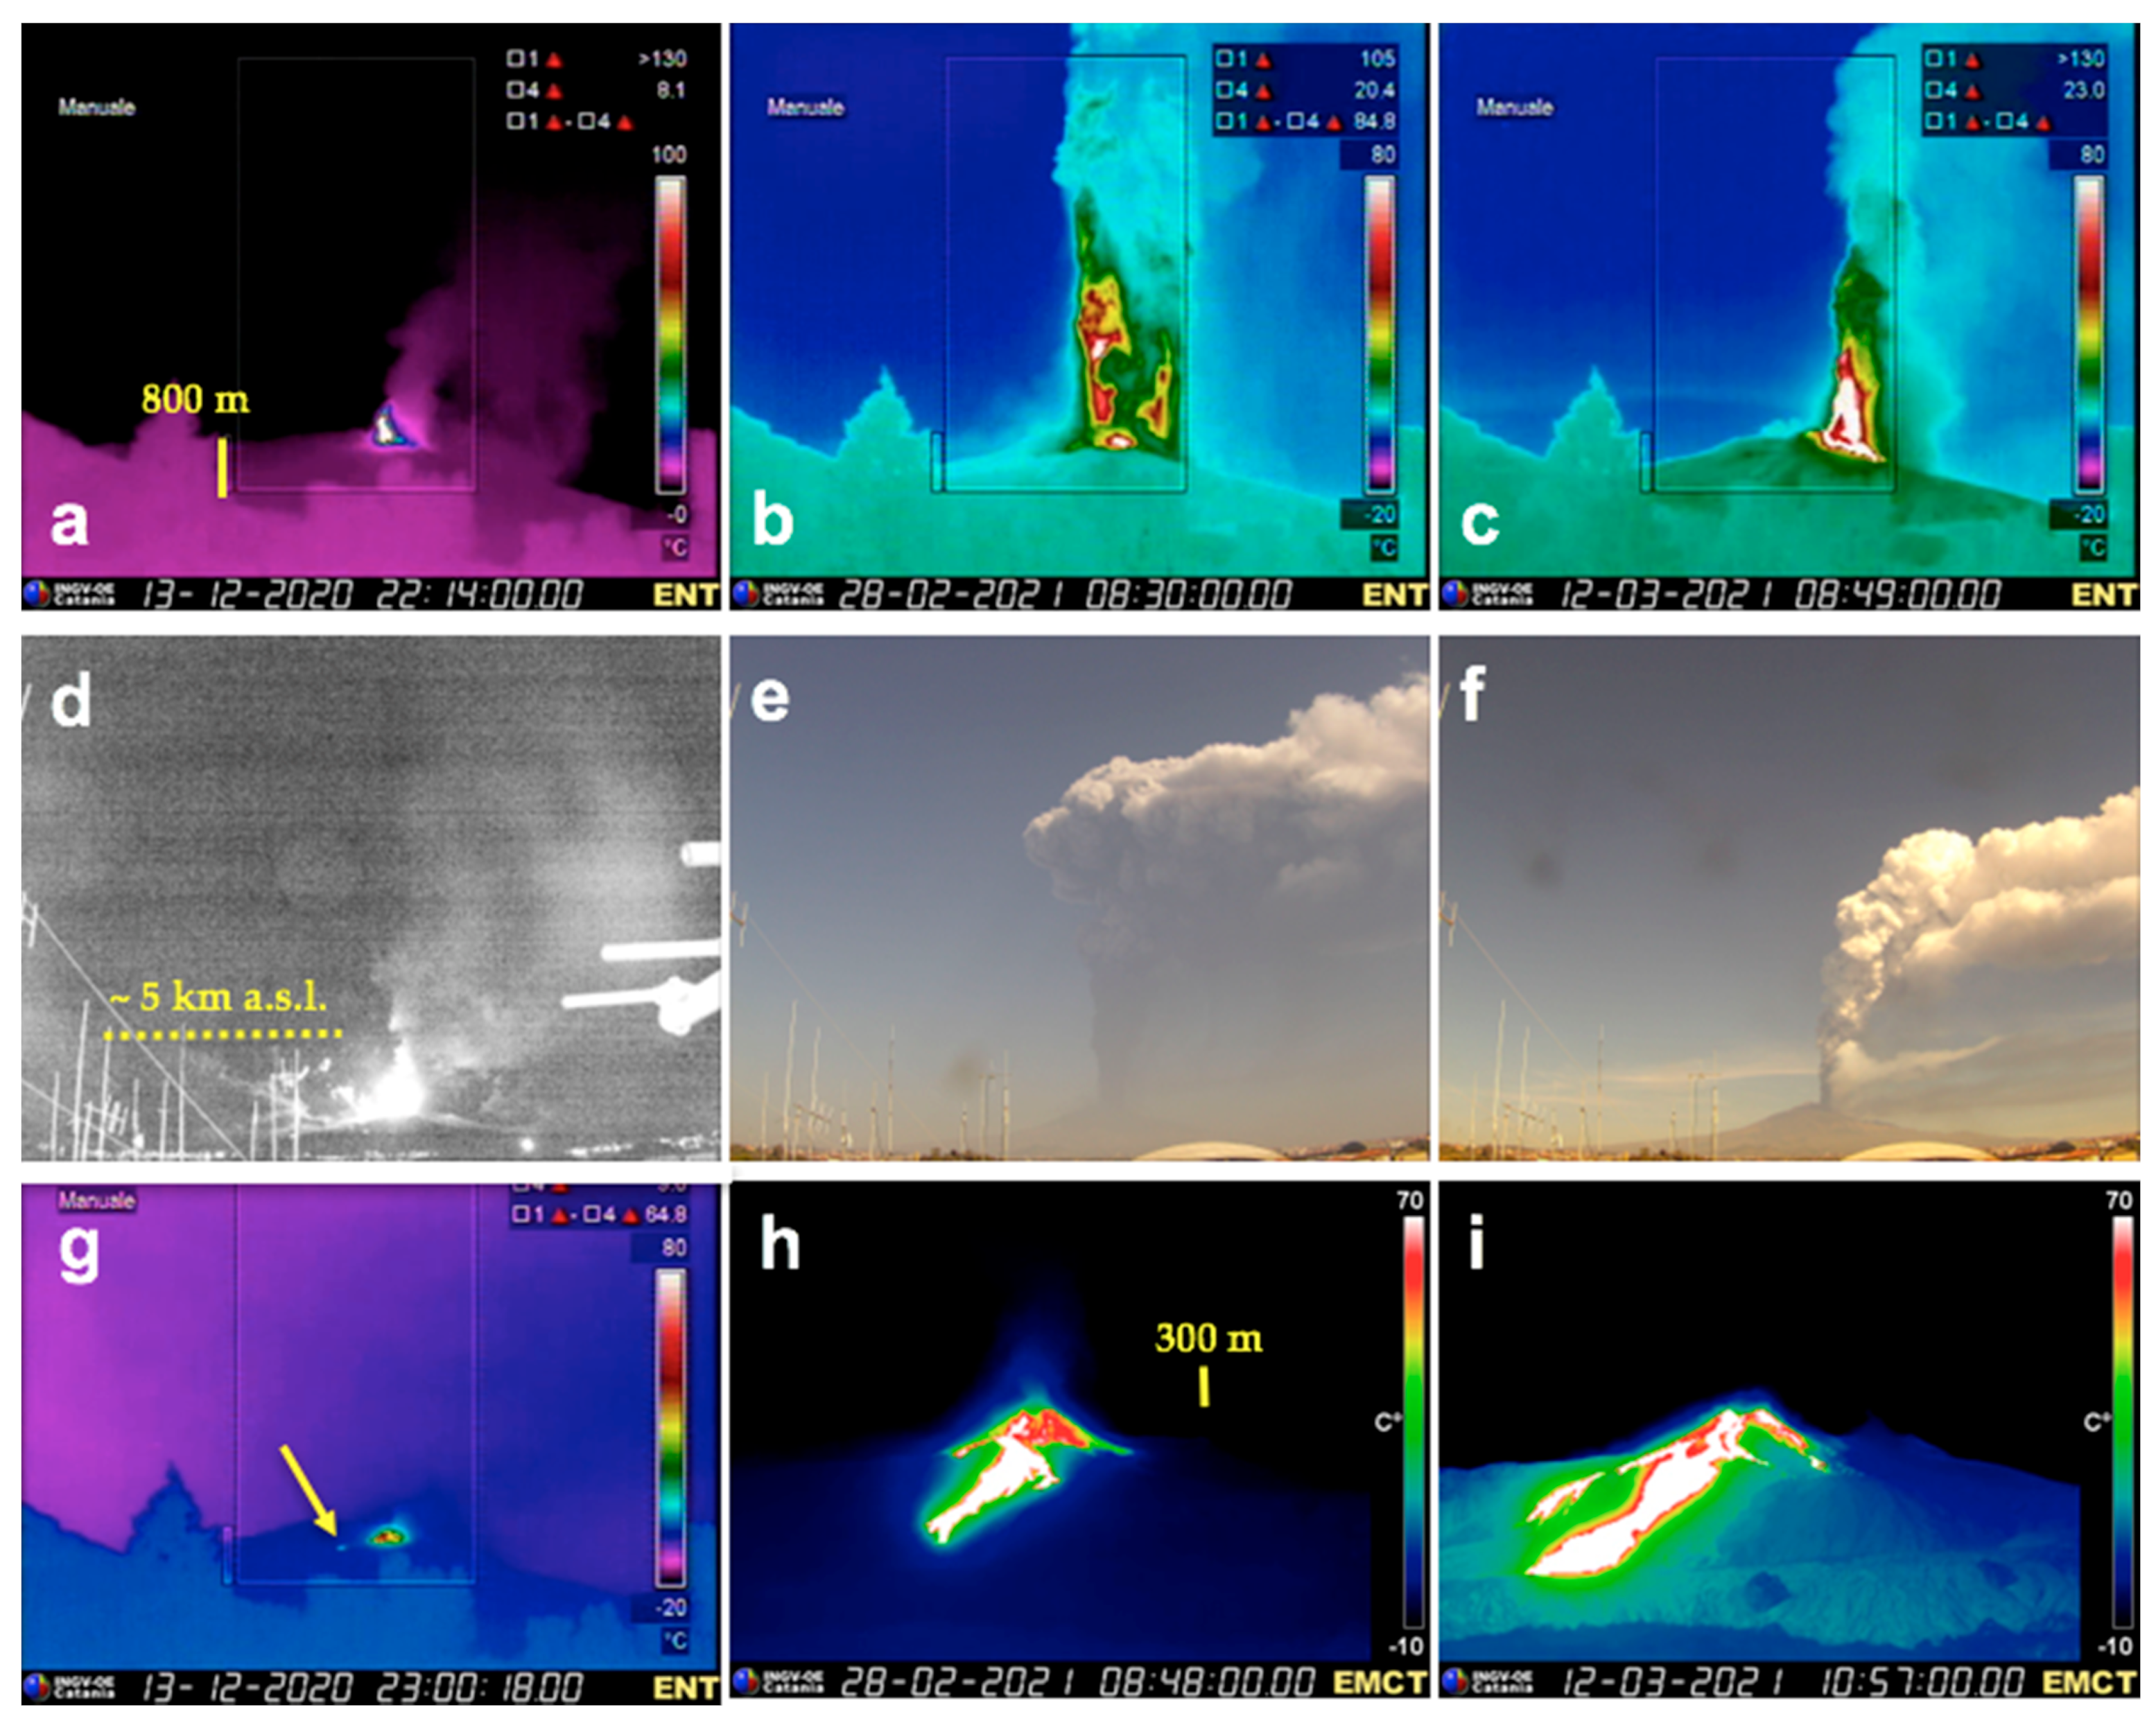
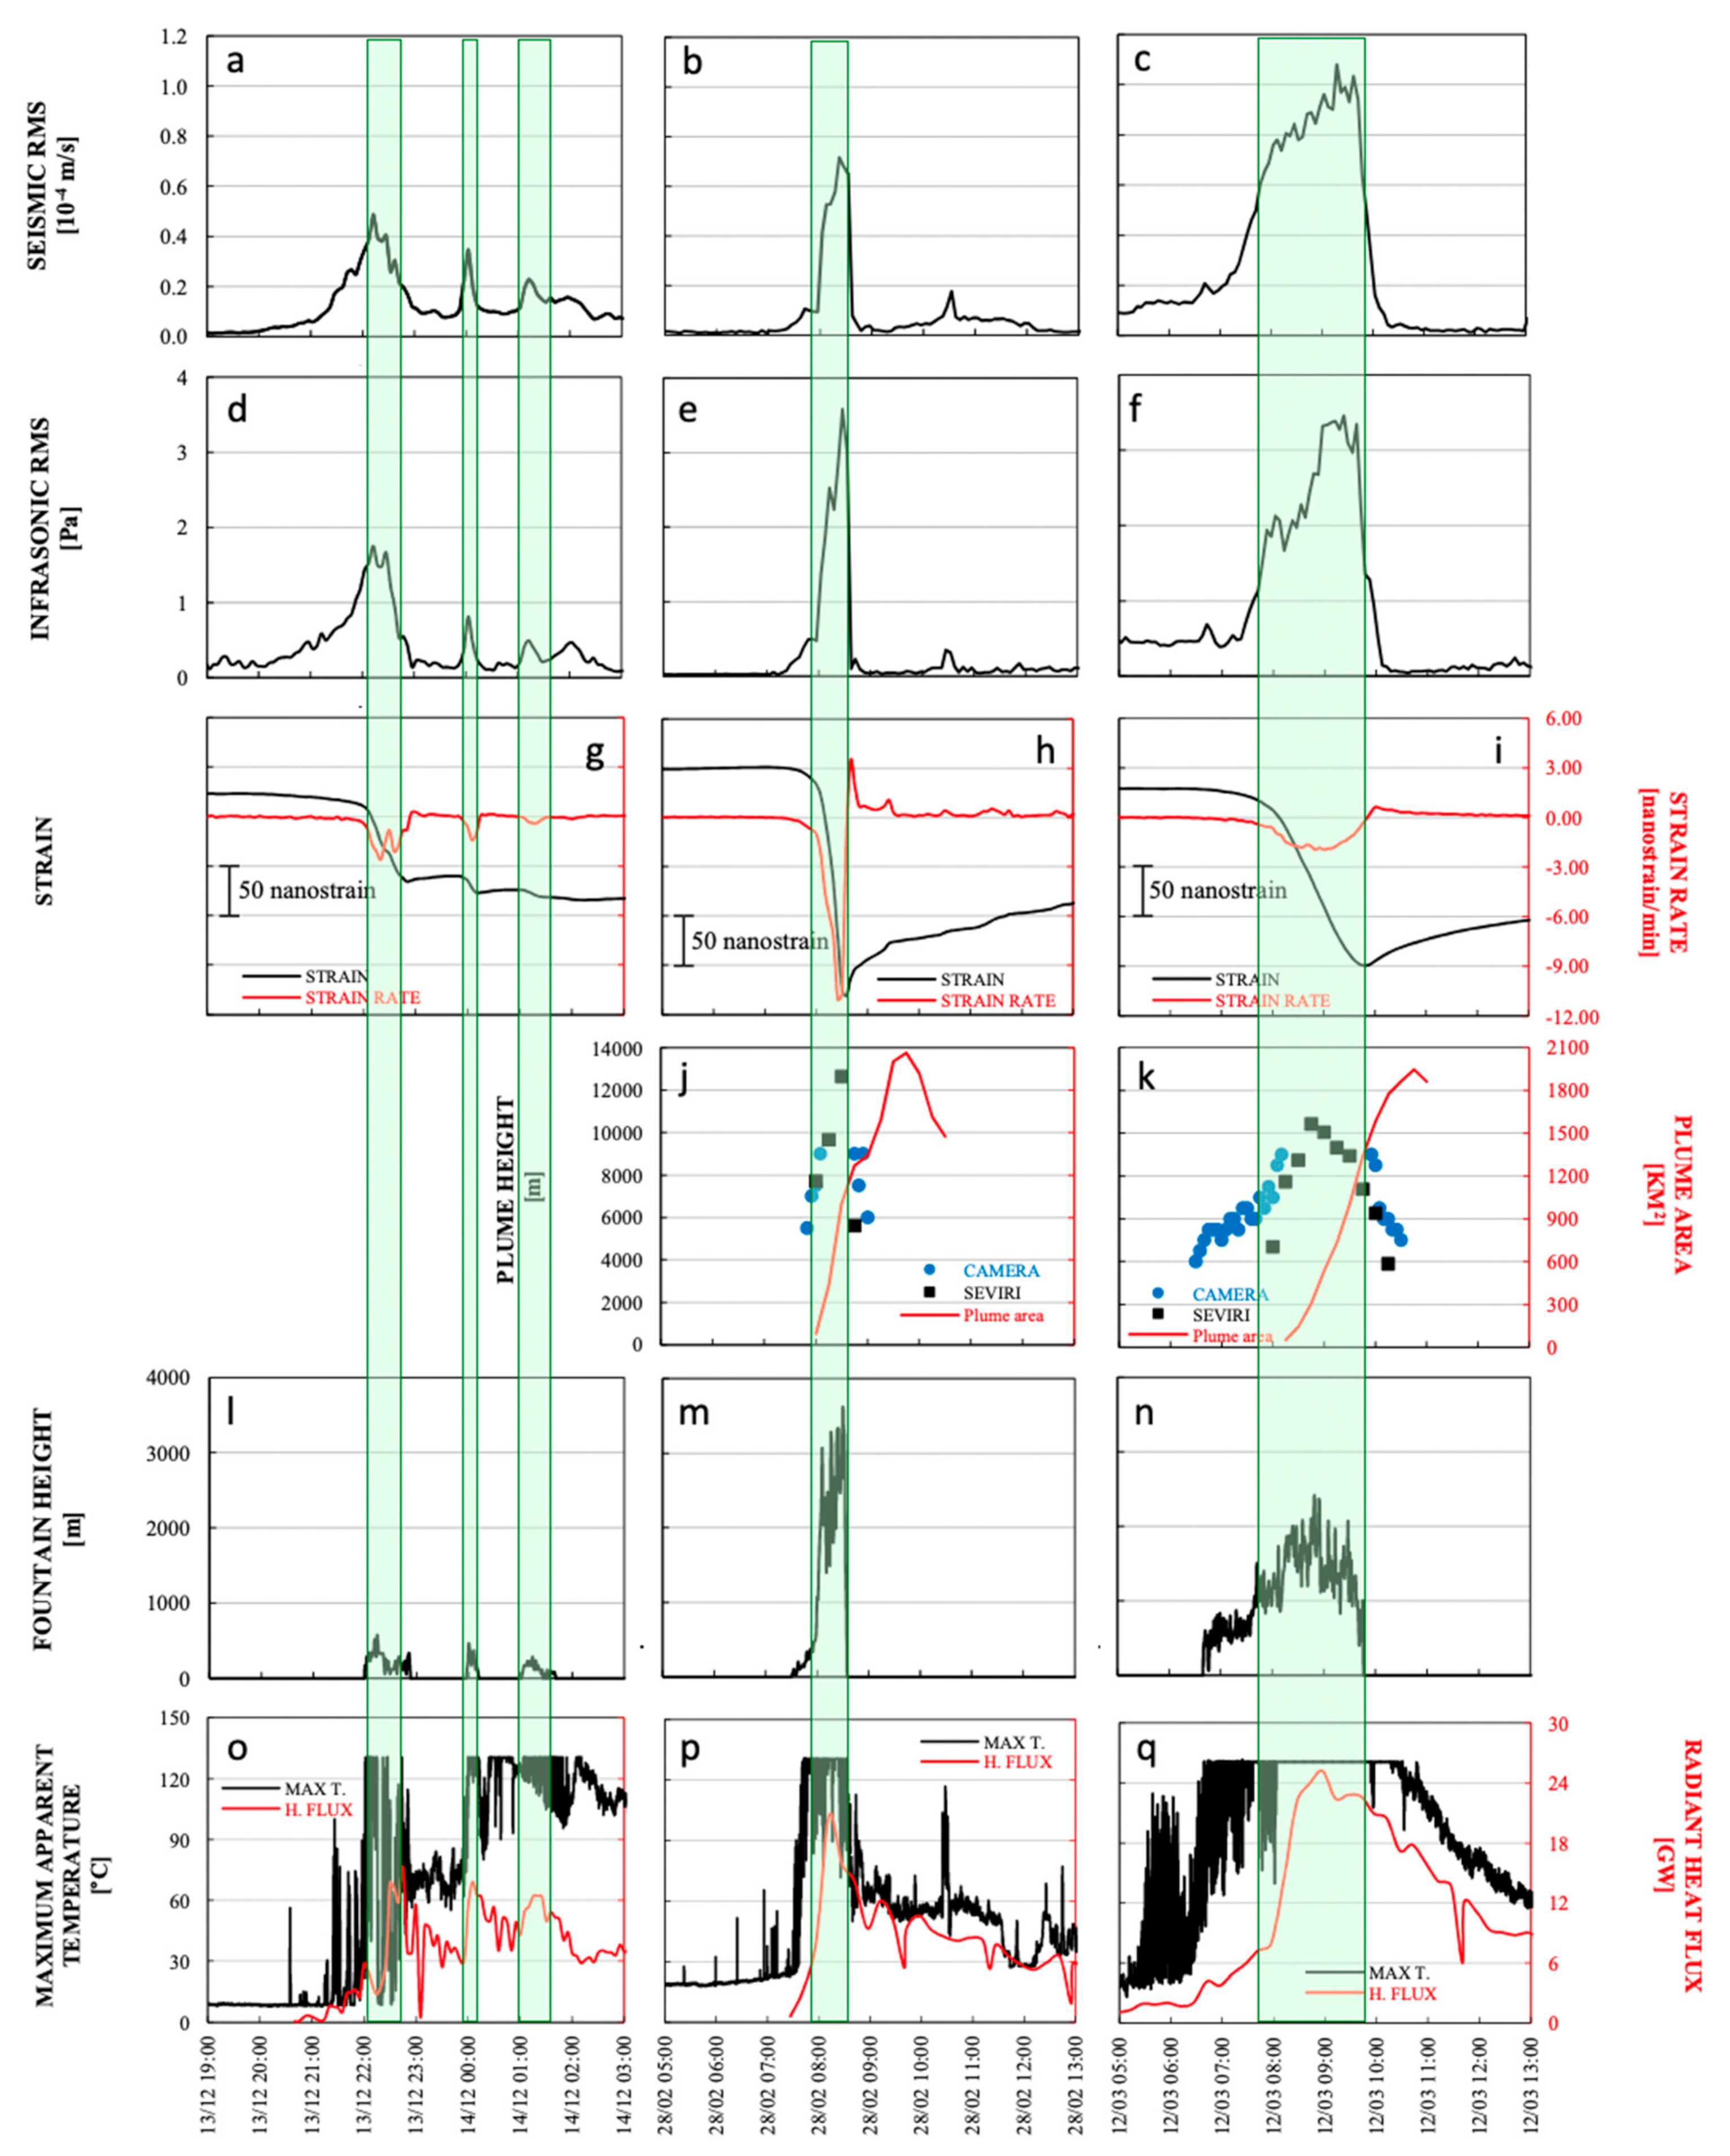
3.1. Volcanology
3.2. Seismicity and Infrasound
3.3. Strain
4. Discussion
5. Conclusions
Author Contributions
Funding
Data Availability Statement
Acknowledgments
Conflicts of Interest
References
- Alparone, S.; Andronico, D.; Sgroi, T.; Ferrari, F.; Lodato, L.; Reitano, D. Alert system to mitigate tephra fallout hazards at Mt. Etna Volcano, Italy. Nat. Hazards 2007, 43, 333–350. [Google Scholar] [CrossRef]
- Calvari, S.; Salerno, G.G.; Spampinato, L.; Gouhier, M.; La Spina, A.; Pecora, E.; Harris, A.J.L.; Labazuy, P.; Biale, E.; Boschi, E. An unloading foam model to constrain Etna’s 11–13 January 2011 lava fountaining episode. J. Geophys. Res. Earth Surf. 2011, 116. [Google Scholar] [CrossRef]
- Calvari, S.; Cannavò, F.; Bonaccorso, A.; Spampinato, L.; Pellegrino, A.G. Paroxysmal Explosions, Lava Fountains and Ash Plumes at Etna Volcano: Eruptive Processes and Hazard Implications. Front. Earth Sci. 2018, 6, 107. [Google Scholar] [CrossRef]
- Calvari, S.; Bonaccorso, A.; Ganci, G. Anatomy of a Paroxysmal Lava Fountain at Etna Volcano: The Case of the 12 March 2021, Episode. Remote Sens. 2021, 13, 3052. [Google Scholar] [CrossRef]
- Andronico, D.; Corsaro, R.A. Lava fountains during the episodic eruption of South–East Crater (Mt. Etna), 2000: Insights into magma-gas dynamics within the shallow volcano plumbing system. Bull. Volcanol. 2011, 73, 1165–1178. [Google Scholar] [CrossRef]
- Viccaro, M.; Garozzo, I.; Cannata, A.; Di Grazia, G.; Gresta, S. Gas burst vs. gas-rich magma recharge: A multidisciplinary study to reveal factors controlling triggering of the recent paroxysmal eruptions at Mt. Etna. J. Volc. Geoth. Res. 2014, 278–279, 1–13. [Google Scholar] [CrossRef]
- Andronico, D.; Cannata, A.; Di Grazia, G.; Ferrari, F. The 1986–2021 paroxysmal episodes at the summit craters of Mt. Etna: Insights into volcano dynamics and hazard. Earth-Sci. Rev. 2021, 220, 103686. [Google Scholar] [CrossRef]
- Calvari, S.; Nunnari, G. Comparison between Automated and Manual Detection of Lava Fountains from Fixed Monitoring Thermal Cameras at Etna Volcano, Italy. Remote Sens. 2022, 14, 2392. [Google Scholar] [CrossRef]
- Scollo, S.; Coltelli, M.; Bonadonna, C.; Del Carlo, P. Tephra hazard assessment at Mt. Etna (Italy). Nat. Hazards Earth Syst. Sci. 2013, 13, 1–13. [Google Scholar] [CrossRef]
- Andronico, D.; Del Carlo, P. PM10 measurements in urban settlements after lava fountain episodes at Mt. Etna, Italy: Pilot test to assess volcanic ash hazard to human health. Nat. Hazards Earth Syst. Sci. 2016, 16, 29–40. Available online: www.nat-hazards-earth-syst-sci.net/16/29/2016/ (accessed on 1 January 2022).
- Horwell, C.J.; Sargent, P.; Andronico, D.; Lo Castro, M.D.; Tomatis, M.; Hillman, S.E.; Michnowicz, S.A.K.; Fubini, B. The iron-catalysed surface reactivity and health-pertinent physical characteristics of explosive volcanic ash from Mt. Etna, Italy. J. Appl. Volcanol. 2017, 6, 12. [Google Scholar] [CrossRef]
- Pavolonis, M.J.; Sieglaff, J.; Cintineo, J. Automated detection of explosive volcanic eruptions using satellite-derived cloud vertical growth rates. Earth Space Sci. 2018, 5, 903–928. [Google Scholar] [CrossRef]
- Paredes-Mariño, J.; Forte, P.; Alois, S.; Chan, K.L.; Cigala, V.; Mueller, S.B.; Poret, M.; Spanu, A.; Tomasšek, I.; Tournigan, P.-Y.; et al. The lifecycle of volcanic ash: Advances and ongoing challenges. Bull. Volcanol. 2022, 84, 51. [Google Scholar] [CrossRef]
- Andronico, D.; Branca, S.; Calvari, S.; Burton, M.R.; Caltabiano, T.; Corsaro, R.A.; Del Carlo, P.; Garfì, G.; Lodato, L.; Miraglia, L.; et al. A multi-disciplinary study of the 2002–03 Etna eruption: Insights for a complex plumbing system. Bull. Volc. 2005, 67, 314–330. [Google Scholar] [CrossRef]
- Branca, S.; Del Carlo, P. Types of eruptions of Etna volcano AD 1670-2003: Implications for short-term eruptive behaviour. Bull. Volcanol. 2005, 67, 732–742. [Google Scholar] [CrossRef]
- Spampinato, L.; Calvari, S.; Oppenheimer, C.; Lodato, L. Shallow magma transport for the 2002–2003 Mt. Etna eruption inferred from thermal infrared surveys. J. Volcanol. Geotherm. Res. 2008, 177, 301–312. [Google Scholar] [CrossRef]
- Bonaccorso, A.; Bonforte, A.; Calvari, S.; Del Negro, C.; Di Grazia, G.; Ganci, G.; Neri, M.; Vicari, A.; Boschi, E. The initial phases of the 2008–2009 Mt. Etna eruption: A multi-disciplinary approach for hazard assessment. J. Geophys. Res. 2011, 116, B03203. [Google Scholar] [CrossRef]
- Bonaccorso, A.; Calvari, S. Major effusive eruptions and recent lava fountains: Balance between erupted and expected magma volumes at Etna volcano. Geophys. Res. Lett. 2013, 40, 6069–6073. [Google Scholar] [CrossRef]
- Wadge, G.; Walker, G.P.L.; Guest, J.E. The output of the Etna volcano. Nature 1975, 255, 385–387. [Google Scholar] [CrossRef]
- Wadge, G.; Guest, J.E. Steady-state magma discharge at Etna 1971–1981. Nature 1981, 294, 548–550. [Google Scholar] [CrossRef]
- Harris, A.J.L.; Steffke, A.; Calvari, S.; Spampinato, L. Thirty years of satellite-derived lava discharge rates at Etna: Implications for steady volumetric output. J. Geophys. Res. 2011, 116, B08204, Erratum in J. Geophys. Res. 2012, 117, B08207. [Google Scholar] [CrossRef]
- Alparone, S.; Andronico, D.; Lodato, L.; Sgroi, T. Relationship between tremor and volcanic activity during the Southeast Crater eruption on Mount Etna in early 2000. J. Geophys. Res. 2003, 108, 2241. [Google Scholar] [CrossRef]
- Cannata, A.; Montalto, P.; Privitera, E.; Russo, G.; Gresta, S. Tracking eruptive phenomena by infrasound: 13 May 2008 eruption at Mt. Etna. Geophys. Res. Lett. 2009, 36, 5. [Google Scholar] [CrossRef]
- Spampinato, L.; Sciotto, M.; Cannata, A.; Cannavò, F.; La Spina, A.; Palano, M.; Salerno, G.G.; Privitera, E.; Caltabiano, T. Multiparametric study of the February–April 2013 paroxysmal phase of Mt. Etna New South-East crater. Geochem. Geophys. Geosyst. 2015, 16, 1932–1949. [Google Scholar] [CrossRef]
- D’Agostino, M.; Di Grazia, G.; Ferrari, F.; Langer, H.; Messina, A.; Reitano, D.; Spampinato, S. Volcano Monitoring and Early Warning on Mt Etna Based on Volcanic Tremor—Methods and Technical Aspects; Nova Science Publishers: New York, NY, USA, 2013; Volume 4, pp. 53–92. [Google Scholar]
- Patanè, D.; Di Grazia, G.; Cannata, A.; Montalto, P.; Boschi, E. Shallow magma pathway geometry at Mt. Etna volcano. Geochem. Geophys. Geosyst. 2008, 9, Q12021. [Google Scholar] [CrossRef]
- Cannavò, F.; Sciotto, M.; Cannata, A.; Di Grazia, G. An integrated geophysical approach to track magma intrusion: The 2018 Christmas eve eruption at Mt. Etna. Geophys. Res. Lett. 2019, 46, 8009–8017. [Google Scholar] [CrossRef]
- Sciotto, M.; Cannata, A.; Prestifilippo, M.; Scollo, S.; Fee, D.; Privitera, E. Unravelling the links between seismo-acoustic signals and eruptive parameters: Etna lava fountain case study. Sci. Rep. 2019, 9, 16417. [Google Scholar] [CrossRef]
- Bonaccorso, A.; Currenti, G.; Linde, A.T.; Sacks, S. New data from borehole strainmeters to infer lava fountain sources (Etna 2011–2012). Geophys. Res. Lett. 2013, 40, 3579–3584. [Google Scholar] [CrossRef]
- Bonaccorso, A.; Linde, A.T.; Currenti, G.; Sacks, S.; Sicali, A. The borehole dilatometer network of Mount Etna: A powerful tool to detect and infer volcano dynamics. J. Geophys. Res. 2016, 121, 4655–4669. [Google Scholar] [CrossRef]
- Bonaccorso, A.; Carleo, L.; Currenti, G.; Sicali, A. Magma Migration at Shallower Levels and Lava Fountains Sequence as Revealed by Borehole Dilatometers on Etna Volcano. Front. Earth Sci. 2021, 9, 740505. [Google Scholar] [CrossRef]
- De Gori, P.; Giampiccolo, E.; Cocina, O.; Branca, S.; Doglioni, C.; Chiarabba, C. How Long Re-pressurized Magma Can Feed Eruptions at Mt. Etna. Commun. Earth Environ. 2021, 2, 216. [Google Scholar] [CrossRef]
- Scollo, S.; Prestifilippo, M.; Spata, G.; D’Agostino, M.; Coltelli, M. Monitoring and forecasting Etna volcanic plumes. Nat. Hazards Earth Syst. Sci. 2009, 9, 1573–1585. [Google Scholar] [CrossRef]
- Scollo, S.; Prestifilippo, M.; Bonadonna, C.; Cioni, R.; Corradini, S.; Degruyter, W.; Rossi, E.; Silvestri, M.; Biale, E.; Carparelli, G.; et al. Near-real-time tephra fallout assessment at Mt. Etna, Italy. Remote Sens. 2019, 11, 2987. [Google Scholar] [CrossRef]
- Ganci, G.; James, M.R.; Calvari, S.; Del Negro, C. Separating the thermal fingerprints of lava flows and simultaneous lava fountaining using ground-based thermal camera and SEVIRI measurements. Geophys. Res. Lett. 2013, 40, 5058–5063. [Google Scholar] [CrossRef]
- Ganci, G.; Harris, A.J.L.; Del Negro, C.; Guéhenneux, Y.; Cappello, A.; Labazuy, P.; Calvari, S.; Gouhier, M. A year of lava fountaining at Etna: Volumes from SEVIRI. Geophys. Res. Lett. 2012, 39, L06305. [Google Scholar] [CrossRef]
- Walker, G.P.L. Explosive volcanic eruptions—A new classification scheme. Geol. Rundsch. 1973, 62, 431–446. [Google Scholar] [CrossRef]
- Harris, A.J.L.; Dehn, J.; Calvari, S. Lava effusion rate definition and measurement: A review. Bull. Volcanol. 2007, 70, 1–22. [Google Scholar] [CrossRef]
- Bonaccorso, A.; Calvari, S. A new approach to investigate an eruptive paroxysmal sequence using camera and strainmeter networks: Lessons from the 3–5 December 2015 activity at Etna volcano. Earth Plan. Sci. Lett. 2017, 475, 231–241. [Google Scholar] [CrossRef]
- Scollo, S.; Prestifilippo, M.; Pecora, E.; Corradini, S.; Merucci, L.; Spata, G.; Coltelli, M. Eruption column height estimation of the 2011–2013 Etna lava fountains. Ann. Geophys. 2014, 57, S0214-61. [Google Scholar]
- Corradini, S.; Montopoli, M.; Guerrieri, L.; Ricci, M.; Scollo, S.; Merucci, L.; Marzano, F.; Pugnaghi, S.; Prestifilippo, M.; Ventress, L.; et al. A Multi-Sensor Approach for Volcanic Ash Cloud Retrieval and Eruption Characterization: The 23 November 2013 Etna Lava Fountain. Remote Sens. 2016, 8, 58. [Google Scholar] [CrossRef]
- Corradini, S.; Guerrieri, L.; Lombardo, V.; Merucci, L.; Musacchio, M.; Prestifilippo, M.; Scollo, S.; Silvestri, M.; Spata, G.; Stelitano, D. Proximal Monitoring of the 2011–2015 Etna Lava Fountains Using MSG-SEVIRI Data. Geosciences 2018, 8, 140. [Google Scholar] [CrossRef]
- Ganci, G.; Vicari, A.; Fortuna, L.; Del Negro, C. The HOTSAT volcano monitoring system based on a combined use of SEVIRI and MODIS multispectral data. Ann. Geophys. 2011, 54, 5. [Google Scholar] [CrossRef]
- Ganci, G.; Bilotta, G.; Cappello, A.; Hérault, A.; Del Negro, C. HOTSAT: A multi-platform system for the satellite thermal monitoring of volcanic activity. Geol. Soc. Lond. Spec. Publ. 2016, 426, 207–221. [Google Scholar] [CrossRef]
- Di Grazia, G.; Falsaperla, S.; Langer, H. Volcanic tremor location during the 2004 Mount Etna lava effusion. Geophys. Res. Lett. 2006, 33, 4. [Google Scholar] [CrossRef]
- Cannata, A.; Di Grazia, G.; Aliotta, M.; Cassisi, C.; Montalto, P.; Patanè, D. Monitoring seismo-volcanic and infrasonic signals at volcanoes: Mt. Etna case study. Pure Appl. Geophys. 2013, 170, 1751–1771. [Google Scholar] [CrossRef]
- Cannata, A.; Montalto, P.; Privitera, E.; Russo, G. Characterization and location of infrasonic sources in active volcanoes: Mount Etna, September–November 2007. J. Geophys. Res. 2009, 114, B8. [Google Scholar] [CrossRef]
- Johnson, J.B.; Aster, R.C.; Ruiz, M.C.; Malone, S.D.; McChesney, P.J.; Lees, J.M.; Kyle, P.R. Interpretation and utility of infrasonic records from erupting volcanoes. J. Volcanol. Geoth. Res. 2003, 121, 15–63. [Google Scholar] [CrossRef]
- Cannata, A.; Sciotto, M.; Spampinato, L.; Spina, L. Insights into explosive activity at closely-spaced eruptive vents using infrasound signals: Example of Mt. Etna 2008 eruption. J. Volcanol. Geoth. Res. 2011, 208, 1–11. [Google Scholar] [CrossRef]
- Currenti, G.; Zuccarello, L.; Bonaccorso, A.; Sicali, A. Borehole Volumetric Strainmeter Calibration From a Nearby Seismic Broadband Array at Etna Volcano. J. Geophys. Res. 2017, 112, 7729–7738. [Google Scholar] [CrossRef]
- Currenti, G.; Bonaccorso, A. Cyclic magma recharge pulses detected by high-precision strainmeter data: The case of 2017 inter-eruptive activity at Etna volcano. Sci. Rep. 2019, 9, 7553. [Google Scholar] [CrossRef]
- Tamura, Y.; Sato, T.; Ooe, M.; Ishiguro, M. A procedure for tidal analysis with a Bayesian information criterion. Geophys. J. Int. 1991, 104, 507–516. [Google Scholar] [CrossRef]
- Ichihara, M. Seismic and infrasonic eruption tremors and their relation to magma discharge rate: A case study for sub-Plinian events in the 2011 eruption of Shinmoe-dake, Japan. J. Geophys. Res. 2016, 121, 7101–7118. [Google Scholar] [CrossRef]
- Barth, A.; Newcombe, M.; Plank, T.; Gonnermann, H.; Hajimirza, S.; Soto, G.J.; Saballos, A.; Hauri, E. Magma decompression rate correlates with explosivity at basaltic volcanoes—Constraints from water diffusion in olivine. J. Volcanol. Geoth. Res. 2019, 387, 106664. [Google Scholar] [CrossRef]
- Mastin, L.G.; Guffanti, M.; Servranckx, R.; Webley, P.; Barsotti, S.; Dean, K.; Durant, A.; Ewert, J.W.; Neri, A.; Rose, W.I.; et al. A multidisciplinary effort to assign realistic source parameters to models of volcanic ash-cloud transport and dispersion during eruptions (Book review). J. Volcanol. Geotherm. Res. 2009, 186, 10–21. [Google Scholar] [CrossRef]
- Andronico, D.; Scollo, S.; Cristaldi, A. Unexpected hazards from tephra fallouts at Mt Etna: The 23 November 2013 lava fountain. J. Volcanol. Geotherm. Res. 2015, 304, 118–125. [Google Scholar] [CrossRef]
- Patanè, D.; Aiuppa, A.; Aloisi, M.; Behncke, B.; Cannata, A.; Coltelli, M.; Salerno, G. Insights into magma and fluid transfer at Mount Etna by a multiparametric approach: A model of the events leading to the 2011 eruptive cycle. J. Geophys. Res. 2013, 118, 3519–3539. [Google Scholar] [CrossRef]


| Label | Type | Position | Rate of Acquisition | Distance from the Craters |
|---|---|---|---|---|
| ENT | Thermal camera | Nicolosi, South flank, 730 m a.s.l. | 1 frame/2 s | 15.0 km |
| EMOT | Thermal camera | La Montagnola, South flank, 2600 m a.s.l. | 1 frame/s | 3.0 km |
| EMCT | Thermal camera | Mt. Cagliato, East flank, 1160 m a.s.l. | 1 frame/2 s | 8.3 km |
| ECV | Visible camera | Catania Nesima, South flank, 35 m a.s.l. | 1 frame/2 s | 26.7 km |
| ECVH | Visible camera | Catania Nesima, South flank, 35 m a.s.l. | 1 frame/min | 26.7 km |
| EBVH | Visible camera | Bronte, NW flank, 970 m a.s.l. | 1 frame/min | 13.5 km |
| Date and Acronym | Starting Time (hh:mm) | Ending Time (hh:mm) | Duration (min.) | Volume of Pyroclastics (1 × 10⁶ m3) | Volume of Lava Flows (1 × 10⁶ m3) | ERp (m3 s−1) | ERl (m3 s−1) | IER (m3 s−1) (hh:mm) | Hf (m) | Hc (km) | Wind Speed (m s−1) |
|---|---|---|---|---|---|---|---|---|---|---|---|
| 13 December 2020 13D20 | 22:00 | 22:48 | 48 | 0.24 | 83.33 | 135 (22:14) | 231 | - | - | ||
| 13–14 December 2020 13–14D20 | 23:58 | 00:11 | 13 | 0.07 | 89.74 | 120 (00:01) | 235 | - | 11.3 13.3 45.5 | ||
| 14 December 2020 14D20 | 01:02 | 01:40 | 38 | 0.13 | 0.79 * | 57.02 | 69.29 * | 85 (01:08–01:18) | 121 | - | |
| 28 February 2021 28F21 | 07:40 | 08:34 | 54 | 0.70 | 1.45 | 216.05 | 377.60 | 338 (08:30) | 1376 | 12.6 | 1.5 13.6 18.8 |
| 12 March 2021 12M21 | 06:40 | 09:45 | 185 | 1.63 | 2.40 | 146.85 | 130.72 | 276 (08:49) | 1149 | 10.5 | 5.5 10.8 12.3 |
| Date and Acronym | Max Seismic Amplitude (10−5 m s−1) | Cumul. Seismic Amplitude (m) | Seismic Slope (10−8 m s−2) | Max infrasonic Amplitude (Pa) | Cumul. Infrasonic Amplitude (Pa s) | Infrasonic Slope (10−4 Pa/s) | Strain Amplitude (Nanostrain) | Strain Slope (Nanostrain min−1) | Max Strain Rate (Nanostrain min−1) | COLUMN Height Rate (m s−1) |
|---|---|---|---|---|---|---|---|---|---|---|
| 13–14 December 2020 13D20 13–14D20 14D20 | 4.88 | 0.37 | 1.09 | 1.75 | 11,709 | 2.59 | 76.1 | −1.4 | −2.6 | - |
| 28 February 2021 28F21 | 7.16 | 0.22 | 3.81 | 3.58 | 7661 | 15.94 | 228.5 | −3.8 | −11.1 | 2.7 |
| 12 March 2021 12M21 | 10.79 | 0.88 | 1.11 | 3.45 | 26,029 | 4.01 | 169.5 | −1.3 | −1.9 | 1.5 |
Publisher’s Note: MDPI stays neutral with regard to jurisdictional claims in published maps and institutional affiliations. |
© 2022 by the authors. Licensee MDPI, Basel, Switzerland. This article is an open access article distributed under the terms and conditions of the Creative Commons Attribution (CC BY) license (https://creativecommons.org/licenses/by/4.0/).
Share and Cite
Calvari, S.; Biale, E.; Bonaccorso, A.; Cannata, A.; Carleo, L.; Currenti, G.; Di Grazia, G.; Ganci, G.; Iozzia, A.; Pecora, E.; et al. Explosive Paroxysmal Events at Etna Volcano of Different Magnitude and Intensity Explored through a Multidisciplinary Monitoring System. Remote Sens. 2022, 14, 4006. https://doi.org/10.3390/rs14164006
Calvari S, Biale E, Bonaccorso A, Cannata A, Carleo L, Currenti G, Di Grazia G, Ganci G, Iozzia A, Pecora E, et al. Explosive Paroxysmal Events at Etna Volcano of Different Magnitude and Intensity Explored through a Multidisciplinary Monitoring System. Remote Sensing. 2022; 14(16):4006. https://doi.org/10.3390/rs14164006
Chicago/Turabian StyleCalvari, Sonia, Emilio Biale, Alessandro Bonaccorso, Andrea Cannata, Luigi Carleo, Gilda Currenti, Giuseppe Di Grazia, Gaetana Ganci, Adriana Iozzia, Emilio Pecora, and et al. 2022. "Explosive Paroxysmal Events at Etna Volcano of Different Magnitude and Intensity Explored through a Multidisciplinary Monitoring System" Remote Sensing 14, no. 16: 4006. https://doi.org/10.3390/rs14164006