
Ship Object Detection of Remote Sensing Image Based on Visual Attention

College of Computer Science and Technology, Harbin Engineering University, Harbin 150001, China
*
Author to whom correspondence should be addressed.
Remote Sens. 2021, 13(16), 3192; https://doi.org/10.3390/rs13163192
Submission received: 8 July 2021
/
Revised: 1 August 2021
/
Accepted: 6 August 2021
/
Published: 12 August 2021
(This article belongs to the Special Issue Target Detection and Information Extraction in Radar Images)
Abstract
:At present, reliable and precise ship detection in high-resolution optical remote sensing images affected by wave clutter, thin clouds, and islands under complex sea conditions is still challenging. At the same time, object detection algorithms in satellite remote sensing images are challenged by color, aspect ratio, complex background, and angle variability. Even the results obtained based on the latest convolutional neural network (CNN) method are not satisfactory. In order to obtain more accurate ship detection results, this paper proposes a remote sensing image ship object detection method based on a brainlike visual attention mechanism. We refer to the robust expression mode of the human brain, design a vector field filter with active rotation capability, and explicitly encode the direction information of the remote sensing object in the neural network. The progressive enhancement learning model guided by the visual attention mechanism is used to dynamically solve the problem, and the object can be discovered and detected through time–space information. To verify the effectiveness of the proposed method, a remote sensing ship object detection data set is established, and the proposed method is compared with other state-of-the-art methods on the established data set. Experiments show that the object detection accuracy of this method and the ability to capture image details have been improved. Compared with other models, the average intersection rate of the joint is 80.12%, which shows a clear advantage. The proposed method is fast enough to meet the needs of ship detection in remote sensing images.
1. Introduction
The technique of automatic ship detection in optical remote sensing images has received considerable attention in the marine field, with the rapid development of space remote sensing technology [1,2,3,4]. In the automatic ship detection technology of optical remote sensing images, methods such as template matching [5], knowledge representation [6], and machine learning [7] are usually used. These methods rely too much on manual specificity and are not universal, and it is difficult to express high-level semantic information with manual feature extraction, resulting in poor detection performance.
At present, encouraged by the great success of convolutional neural networks (CNN) [8,9,10,11,12,13,14,15] and deep-learning-based object detection in natural images [16,17,18,19,20,21], many researchers have proposed utilizing a similar methodology for ship detection [22,23]. Some examples of ship object detection are shown in Figure 1. However, for remote sensing images, first of all, each remote sensing image contains objects of different sizes, and the objects at the same resolution are very different, so it is relatively difficult to accurately find all objects [24,25]. Secondly, visible light remote sensing images are susceptible to factors such as illumination, clouds, etc., which will cause changes in the characteristics of the object itself and affect the detection of the object [26]. In addition, remote sensing images are taken by satellites or airplanes from a high altitude, which will cause the same object in the image to have different rotation angles, resulting in morphological differences, and seriously affecting the detection of the object. Finally, some objects in the remote sensing image may be small and dense, and interference between the objects may be difficult to detect. Therefore, although the existing CNN-based ship detection methods have achieved compelling results, there is still much room for improvement compared with object detection in natural images [27].
In order to solve the above problems, a remote sensing image ship detection method based on active rotating filter and attention mechanism is proposed. Combined with the cognitive rules of the human brain, we designed a set of feature extraction methods that adapt to rotation changes. Further, according to people’s observation environment habits, the attention mechanism is summarized. When humans observe the environment, they will pay different attention to different things in the same picture. They usually focus their attention on certain things and then distract their attention to the surrounding environment and other elements. Inspired by this, the convolutional block attention module (CBAM) [28] is used to optimize the fast region-based convolutional neural network model to achieve high-precision ship object detection tasks. Our contribution is as follows:
- In order to improve the detection effect of remote sensing image ships, the combination of active rotation filter and neural network is used to solve the problem of poor recognition ability of convolutional neural network for multiangle rotating objects, the visual attention mechanism is used to optimize the fast region-based convolutional neural network model, and a new marine remote sensing ship object detection method based on the active rotating filter and attention mechanism is proposed.
- Compared with other remote sensing ship detection methods, experiments verify that our method achieves higher detection accuracy on the remote sensing image ship detection data set. At the same time, ablation experiments confirmed that all parts of our method have a positive effect on the improvement of detection performance.
The rest of this article is organized as follows. Section 2 briefly reviews related work. In Section 3, the proposed method for remote sensing image ship detection is introduced. Section 4 explains the details and environment of the experimental realization, and compares the proposed method with state-of-the-art ship detection methods. The ablation experiment is carried out, and the influence of different networks on the proposed method is discussed in Section 5. Finally, Section 6 gives the conclusion.
2. Related Work
The object detection task includes two subtasks [27,31], one of which is to output the category information of this object, which belongs to the classification task. The second is to output the specific location information of the object, which belongs to the positioning task. The result of the classification task is a category label, which is a number for single classification tasks and a vector for multiple classification tasks. The output of the positioning task is a position, usually represented by a rectangular box, including the coordinates of the upper-left corner or the middle position of the rectangular box and the width and height of the rectangular box. After years of development, there are many effective methods for object detection technology. According to whether deep learning is used or not, it can be roughly divided into two categories: traditional methods and deep learning methods.
Traditional remote sensing image object detection methods can be divided into detection methods based on template matching, detection methods based on knowledge representation, detection methods based on image object analysis, and detection methods based on traditional machine learning [32,33,34]. Although traditional machine learning has achieved relatively good results, the low- and middle-level features extracted by traditional feature extraction methods do not contain high-level semantic information, which makes it difficult to effectively express object features, and the recognition effect can be further improved [35,36,37,38]. Moreover, in the detection process, the location of the object is completely dependent on the initially generated object candidate frame, there is no readjustment of the object candidate frame, and the positioning is inaccurate, resulting in a poor final object detection effect.
At this stage, object detection methods based on deep learning can be divided into two categories: one is a two-stage object detection algorithm based on region generation [20,21,39,40,41,42] and the other is a one-stage object detection algorithm based on regression [16,17,18,19,43,44].
The first type is to first generate a series of candidate frames of samples by a specific method, then classify the samples through a convolutional neural network, and finally refine the position of the bounding box. The representative works mainly include a series of algorithms such as region-based convolutional neural networks (R-CNN) [45], Spatial Pyramid Pooling Net (SPP-net) [46], Fast R-CNN [20], and Faster R-CNN [21].
R-CNN [45] uses selective search to control the scale area to about 2000, then scales the corresponding area frame until it has a uniform size, and sends it to the convolutional neural network for training. The object category is determined by the support vector machine, and the bounding box regression is used to locate the object using the regression machine. R-CNN has the following problem: the selective search method performs repeated convolutions on the same region to extract features. At the same time, the input of the fully connected layer needs to ensure that the size is uniform, and the network input part needs to crop and scale the pictures that do not meet the size, which causes image distortion and affects the detection effect.
In order to solve the problem of scaling in R-CNN, SPP-net [46] no longer crops and scales images. Instead, the spatial pyramid pooling layer is connected after the last convolutional layer of R-CNN, so that any image input to the network generates a fixed-size output. The spatial pyramid pooling layer is the pooling layer after the feature extraction layer. Regardless of the size of the input image, it is assumed that the final feature map scale of a single channel is N × N. It is divided into three subgraphs of 1 × 1, 2 × 2, 4 × 4 using max pooling operation. Therefore, the original arbitrary N × N feature map is represented as a 21-dimensional (16 + 4 + 1) fixed-dimensional vector, and then input to the fully connected layer. In the actual detection task, the spatial pyramid pooling layer can be designed according to the task itself. This solves the problem of different input picture sizes and avoids operations such as cropping and scaling.
Fast R-CNN [20] takes the entire images as input and uses CNN to get the feature map. Then, the selective search algorithm is used to obtain the candidate frames in the original image, and project these candidate frames to the feature map. For each candidate frame of different size on the feature map, Fast R-CNN uses the region of interest (RoI) pooling operation to obtain a fixed-dimensional feature representation. Finally, through two fully connected layers, softmax classification and regression model are used for detection. The difference between Fast R-CNN algorithm and R-CNN is the RoI pooling layer, which is a simplified SPP layer. However, the algorithm still uses a complex and time-consuming selective search method for candidate frame extraction, which results in slower execution speed and greater resource consumption.
None of the above methods solve the inefficient sliding window selection problem of the selective search method, and the selective search method is still used to generate a large number of invalid regions, resulting in a large waste of computing resources. Based on the above problems, the Faster R-CNN [21] method uses Region Proposal Networks (RPN) instead of the selective search method to extract candidate frames. The core idea of RPN is to use convolutional neural networks to directly generate candidate regions, which are essentially sliding windows. Moreover, the Faster R-CNN algorithm uses a four-step alternate training method for RPN and Fast R-CNN training. At the same time, RPN and Fast-R-CNN share the convolutional layer, so that the cost of extracting candidate frames is reduced to zero, which greatly improves the running speed and training speed of the algorithm.
Nie [40] shortened the path between the lower layer and the uppermost layer by adding a bottom-up structure to the FPN structure of Mask R-CNN, allowing the lower layer features to be more effectively used on the top layer. Further, in the bottom-up structure, the use of channel attention to assign weights in each channel allows the feature map to better respond to the features of the target to achieve ship target detection. Bi [41] proposed a visual attention augmented network-based optical remote sensing image ship detection method, which uses a lightweight local candidate scene network to extract local candidate scenes with ships to reduce false alarms in nonship areas and improve remote sensing image detection efficiency. For selected local candidate scenes, a visual-attention-based ship detection method is used to improve the detection performance and positioning accuracy of offshore ships. Zhang [42] used a coarse-to-fine strategy to segment nonaquatic regions from the waters to extract candidate regions that may contain ships, and used the R-CNN method to accurately detect ships in the ROI image to make progress in the detection of small ships and dense ships.
The second type does not need to generate a budget box, directly transforms the problem of object contour positioning into a regression problem, and directly regresses the predicted object. The classic algorithms include SSD, YOLO series, etc. [16,17,18,19,43]. The detection accuracies of the YOLO algorithm series and the SSD algorithm are generally lower than that of the Faster R-CNN algorithm, but the detection speed is much faster than the Faster R-CNN algorithm.
The core idea of YOLO [16] is to solve object detection as a regression problem. By inputting the original image containing the object, the position frame of the object, the category to which it belongs, and the corresponding confidence level can be obtained. The YOLO algorithm is based on the Google-Net image classification model. It is a deep learning algorithm that can predict multiple objects at one time. It achieves true end-to-end object detection. The detection speed is faster, but the accuracy is lower than Faster R-CNN.
YOLOv1 [16] lacks in accuracy and detection speed. A series of methods have been used to optimize the model structure of YOLOv1, resulting in YOLOv2 [17]. First, batch normalization is applied to all convolutional layers. It can improve the convergence speed of the model and reduce overfitting. Secondly, the size of the image accepted by YOLOv1 is 224 × 224. YOLOv2 uses 448 × 448 ImageNet data fine-tuning to adapt the network to high-resolution input, removes the fully connected layer of YOLO, uses anchors to predict the frame, and removes a pooling layer to improve the output resolution of the convolutional layer. The network input size is also modified from 448 × 448 to 416 × 416, so that the feature map has only one center. Although the mAP is slightly reduced, the recall rate is greatly improved. Finally, through multiscale training, the model has high robustness to images of different sizes. Chang [44] proved that YOLOv2 is very suitable for SAR image ship detection, and its detection speed is much faster than fast-R-CNN.
Compared with YOLO and YOLOv2, the detection accuracy of YOLOv3 [18] has been greatly improved. It replaced the softmax loss function of YOLOv2 and changed it to a logistic loss function. YOLOv2 uses 5 anchors, and YOLOv3 uses 9 anchors, to increase the IOU. Secondly, YOLOv3 uses upsampling and fusion, and detection layers to detect on three different sizes of feature maps, and finally combines the three. The detection effect of small objects is significantly improved by performing independent detection on the fusion feature maps of multiple scales.
The SSD [19] algorithm can directly predict the coordinates and category of the object, and there is no process of generating candidate frames. It uses a series of detectors to predict the category and location of the object. It mainly achieves fast and high-precision object detection effects from two aspects. One is to regress the output of the convolutional layer of different sizes, and the other is to detect objects of different shapes by increasing the aspect ratio of the detector.
3. Proposed Method
In this section, we introduce our method. The overall framework of our method is shown in Figure 2. In the original Faster R-CNN framework, the network first zooms to a fixed size for an image of any size, and then sends the image to the network; the feature extraction network contains multiple convolutional layers, pooling layers, and activation functions. The RPN network first undergoes 3 × 3 convolution and generates the positive anchor and the corresponding bounding box regression offset, then calculates the candidate area. The ROI pooling layer uses the candidate area to extract the feature of the candidate area from the feature map and send it to the subsequent fully connected softmax network for classification. Then, an attention model that combines space and channel is introduced to detect remote sensing images. In the case of remote sensing images with different coverage areas, ratios, and different directions of objects in the images, effective ship object detection can be achieved. Details of the proposed algorithm are introduced in Figure 2.
3.1. Directional Response Feature Extraction in Line with Brainlike Cognition
The convolutional neural network in faster RCNN has the disadvantage of poor discrimination of multiangle rotating objects. To solve this problem, we introduced an active rotating filter (ARF) and combined it with the neural network. In the convolution process, the ARFs filter is rotated to generate a feature map with angle channels, and the oriented response network (ORN) is obtained. In the process of multidirection convolution, the angle-invariant feature within the class is actively obtained, and the filter is updated by the error in the backpropagation process to obtain a rotation-invariant network while maintaining the difference between different categories in the classification task.
The feature map M of the active rotating filter F and the N-direction channel can be perpendicular to the N-direction point on the grid. We define ARF as
where the feature map is composed of N directional channels, and the k-th channel is calculated as follows:
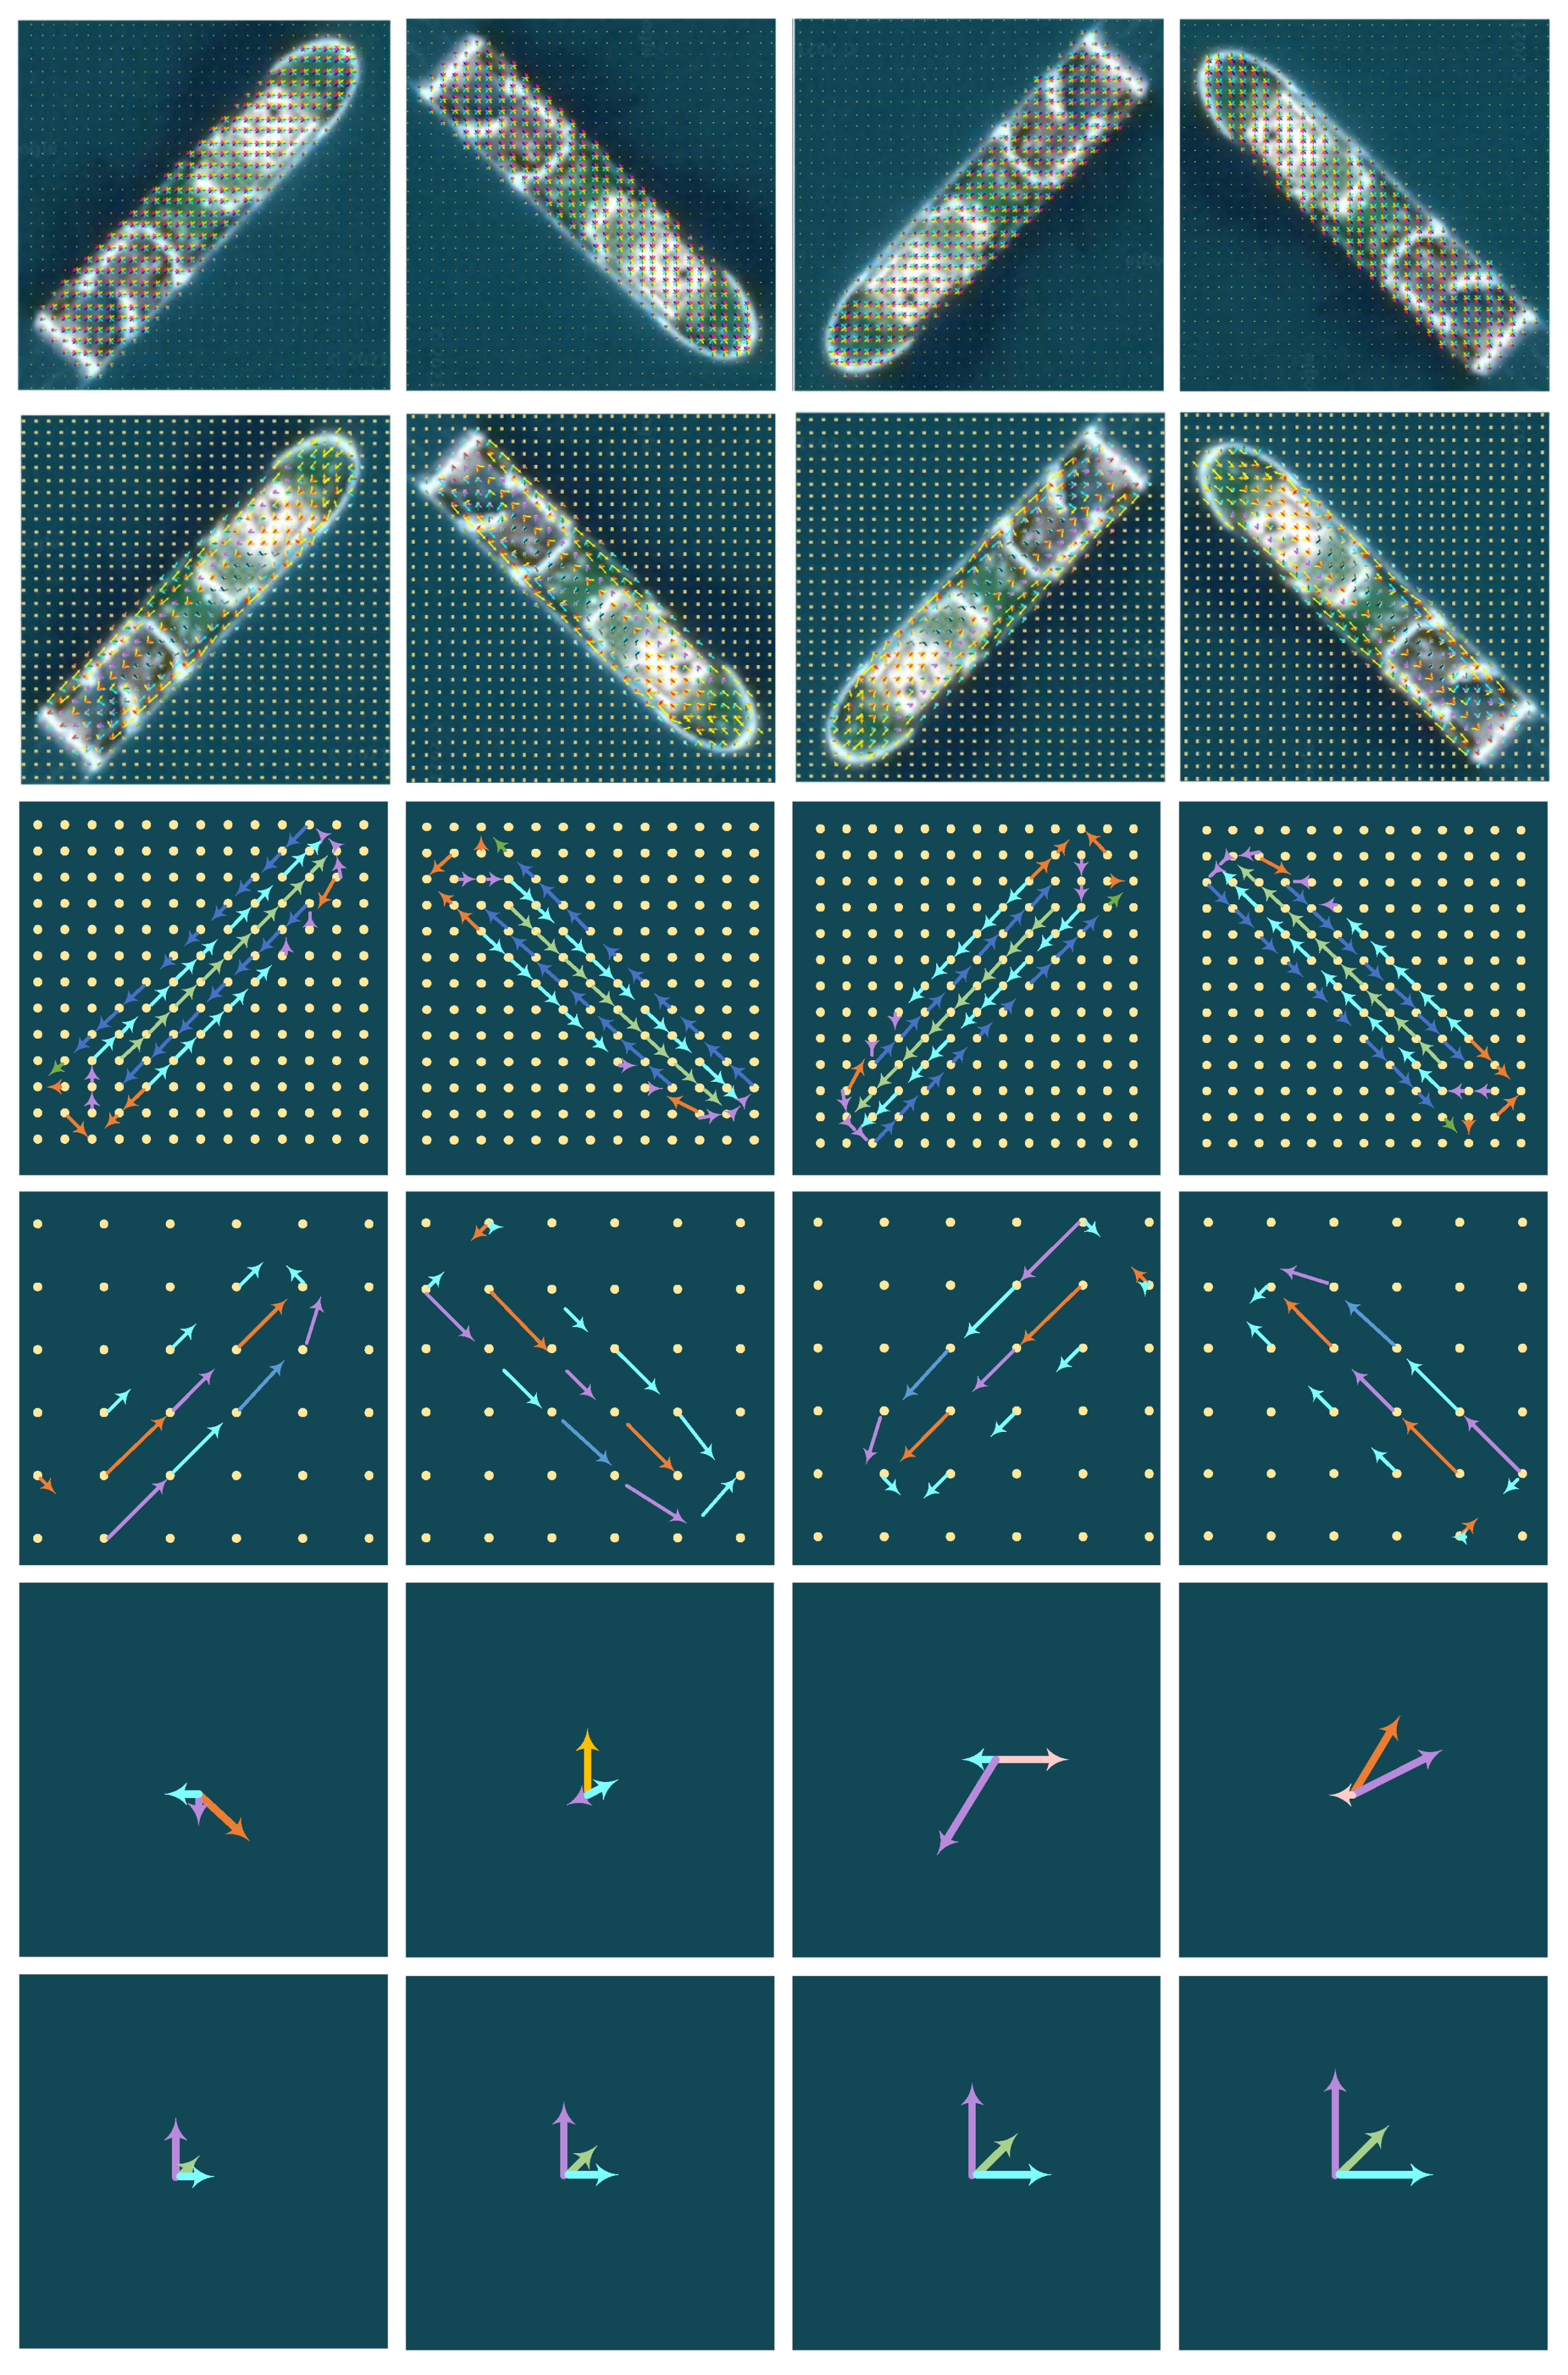
where is the rotated version obtained by rotating F clockwise by degrees, and and represent the n-th direction channel of and M, respectively. In the process of multidirectional convolution, ARF actively acquires the multiangle response of the image until the feature map size of the multidirectional channel is 1, and finally, the position and angle code of the image is obtained. Figure 3 is an example of using the ORN network to train on our data set. Each row represents a layer of the neural network, and each column represents a feature map obtained by an input sample through the network. The rightmost column zooms in on a region in the feature map. It can be seen that the feature map obtained by ARF can obtain the position and angle information of the object. In the second layer, the omnidirectional expansion of the image of the unidirectional channel facilitates the subsequent multiangle convolution. From the ORConv1 layer to the last ORConv4 layer of the network, the values in the feature maps obtained by the numbers under different rotation angles are similar, but the directions are different. The last layer is the ORAlign layer, which uses a method similar to SIFT to align the main directions to achieve rotation invariance.
In the backpropagation process, the vertical angle version of the filter needs to be updated with the total error. The error signal is obtained by summarizing the error of ARF and all its rotating versions:
where L represents the training error and represents the learning rate. Since ARF is composed of an implemented main filter and an unimplemented rotation filter, only the main filter is updated during the backpropagation process. Therefore, the errors generated by samples with similar appearance but different angles can be combined. When there are a large number of structures with similar features and different directions in the training image, the method of updating the main filter using the error at multiple angles has more advantages than traditional CNN, and can learn more “pure” filters.
The angle information of the feature map obtained by ORNs is discrete and does not have rotation invariance. A new layer needs to be added after the convolutional layer, and the rotation-invariant direction encoding information is obtained through ORAlign or ORPooling. To put it simply, the deep convolutional network is used to gradually shrink the size of the feature map to , where N is the number of directional channels. The feature map obtained by the last multidirectional convolutional layer in the network is the high-level feature representation of the pattern, as shown in Figure 4.
The ORAlign method assumes that the i-th feature map in the feature map obtained by the last multidirectional convolution layer is , and its n-th direction channel is . In order to record the N-dimensional tensor of responses in different directions, adopts the method of aligning the main directions of features to achieve rotation robustness. First, calculate the main direction—that is, calculate the direction with the strongest response:
Then, rotate the feature map by degrees. The ORPooling method transfers the feature map of the direction channel with the largest feature response to the next layer of the network through a simple maximum pooling operation. This strategy will reduce the loss of feature arrangement information when the feature dimensions are the same.
3.2. Channelwise and Spatial Attention Mechanisms
In general, the features obtained by different channels contain different semantic information. In order to make full use of this information, we introduce the attention model to detect remote sensing images and add the convolutional block attention module (CABM) to each residual block of the network. The structure is shown in Figure 5. Since CBAM is a lightweight module that can be integrated into the CNN framework, the overhead is negligible, and end-to-end training can be carried out with CNN. The experiment in Section 4 proves that the addition of this module fully improves the detection performance of the network.
When the input M is used as the input feature map, the CBAM proposed in this paper mainly performs the following two operations on it:
where ⊗ represents the dot product of each element, represents the attention extraction in the channel dimension, and represents the attention extraction in the spatial dimension. Figure 6 shows the channel attention module. Figure 7 shows the spatial attention module.
Channel attention module: this part of the work is very similar to SENet, which first compresses the characteristic in the channel dimension to obtain one-dimensional vector. Operation: unlike SENet, the average poolization is considered for the input feature, and the average pool is considered, and the maximum pool is introduced as a supplement. After two pilot functions, two one-dimensional vectors can be obtained.
The specific practices are as follows: M represents the feature of the input feature, and represent the characteristics of the average poolization and maximum pool. and represent two layers of parameters in multilayer perception machines. The calculation in this section can be represented as follows:
Space Note Module: This part of the work is an important contribution to the difference between the papers. In addition to generating a focal model on the channel, there is also a higher response on the spatial level to understand which portions in the feature should have a higher response. First, the input feature is compressed using the average poolization and maximum piligeration, as the compression here is compressed, and the input feature is performed on the channel dimension in the channel dimension. Average and maximum operation. Finally, two two-dimensional features were obtained, and they were spliced by the channel dimension together to obtain a characteristic of one channel number 2, and then the hidden layer containing a single convoluence was convolved to ensure that, finally, the feature is consistent with the characteristic of the input in spatial dimensions.
The characteristics after the average pilotization and the maximum pilotization operation are and . This part is calculated as
where is indicated by the sigmoid activation function, and the convolution layer uses a convolutionary core, empirically.
4. Experiments and Results
In this section, we first introduce a new ocean remote sensing image data set established for experimentation. Then, we apply it to our models and evaluate it on the ship detection task. Finally, to verify the detection performance of our method, we compare our method with some state-of-the-art approaches.
4.1. Ocean Remote Sensing Image Data Set
In order to fully verify the detection performance of the algorithm in this paper under the conditions of multiple scales and different ship orientations, we used network satellite maps to collect nearly 2000 ocean remote sensing images as experimental data sets. The data set contains ocean remote sensing images from different perspectives and locations. The set image sizes range from 300 × 300 to 1500 × 900 (90% of which are larger than 1000 × 600), while the resolutions are between 3 and 0.5 m. There are a certain number of ships on each picture. Figure 8 shows some examples of the data set.
To facilitate training, we use the COCO annotation format to label the data. The data set is randomly divided into three parts: training set, verification set, and test set at a ratio of 6:2:2.
4.2. Implementation Details
The proposed method was tested and evaluated on a computer with an Intel Core i7-10070 3.80 GHz CPU, GeForce GTX 2080 Ti GPU with 11 GB memory, and 16 GB computer memory, implemented using the open-source Pytorch framework [47], and the basic code used was Facebook Research’s Faster R-CNN Benchmark. In our experiments, we use the pretrained ResNet-50 model for initialization. The network is trained with an Adam optimizer employed with a learning rate of 0.001 for the model for 40k minibatches and 0.0001 for the next 40k minibatches. We take the intersection over union (IoU) threshold of 0.5 for proposal classification.
4.3. Metrics
In the field of object detection, the main indicator for judging the detection accuracy of an object detection algorithm is the mean average precision (mAP). The basis of mAP is AP, which is obtained by a combination of precision and recall.
Precision: Positive and negative samples will be generated during object detection, and errors may occur during the detection process. Assuming that at the end of the recognition, some of the objects recognized as correct are correct objects (true positive), but some of them are wrong objects (false positive); the precision is defined as
Recall rate: Define the misidentified object as false negative, and the correctly classified object as true negative; then, the recall rate is defined as
Since the relationship between precision and recall is that one of them increases and the other must decrease, you can draw an image and obtain the AP value through the image, which is the area under the Recall and Precision curves. mAP is to average the value of AP.
Intersection over Union (IoU): IoU is an evaluation index used in object detection and a standard for measuring the accuracy of detecting relative objects in a specific data set.
IoU represents the overlap rate between the generated candidate box and the original title box, which is the ratio of the intersection and union between them. The higher the IoU value, the higher the detection accuracy. The most ideal situation is complete overlap, and the IOU value is 1. IoU calculation formula is as follows:
4.4. Experiments Comparing Different Methods
In order to evaluate the effectiveness of our method, we compare our method with SSD, YOLO, YOLOv2, YOLOv3, the method in Fast R-CNN and Faster R-CNN methods. We use the standard metrics average precision to evaluate our results. We reported the mean of AP obtained in the last 20 periods as the final result and calculated the standard deviation. Experimental results under the same training data are shown in Table 1. Some examples of the detection results by different methods are shown in Figure 9, where we only use the solid red line to mark the successfully detected ships in each image.
From Table 1, we can see that under the same training sample, our method can obtain the highest average accuracy and the smallest standard deviation, with an average accuracy of 80.12% and a standard deviation of 0.24. Compared with Faster R-CNN, the AP obtained by the method in [39] is slightly higher, 2.25% higher than the accuracy of Faster R-CNN, and the performance of YOLO is the worst, with an average accuracy of only 62.15%. In terms of FPS, YOLOv3 reached the highest FPS, and our method also achieved the highest FPS in the two-stage object detection algorithm.
From Figure 9, we can see that although all the methods can successfully detect the ships in the first row, our method can generate a more accurate bounding box and select all ships when the selected area is as small as possible. Nevertheless, in the third row, the other five methods produced poorer detection results;, the detected ships framed a larger area; and, even worse, they failed to detect the black ships moored on the dock. Table 1 shows that our method has the highest accuracy, and it can be seen from the figure that our method is more robust in complex scenarios. In Figure 9, we can see that other methods have produced false detection results on land and on the dock that looks like a ship.
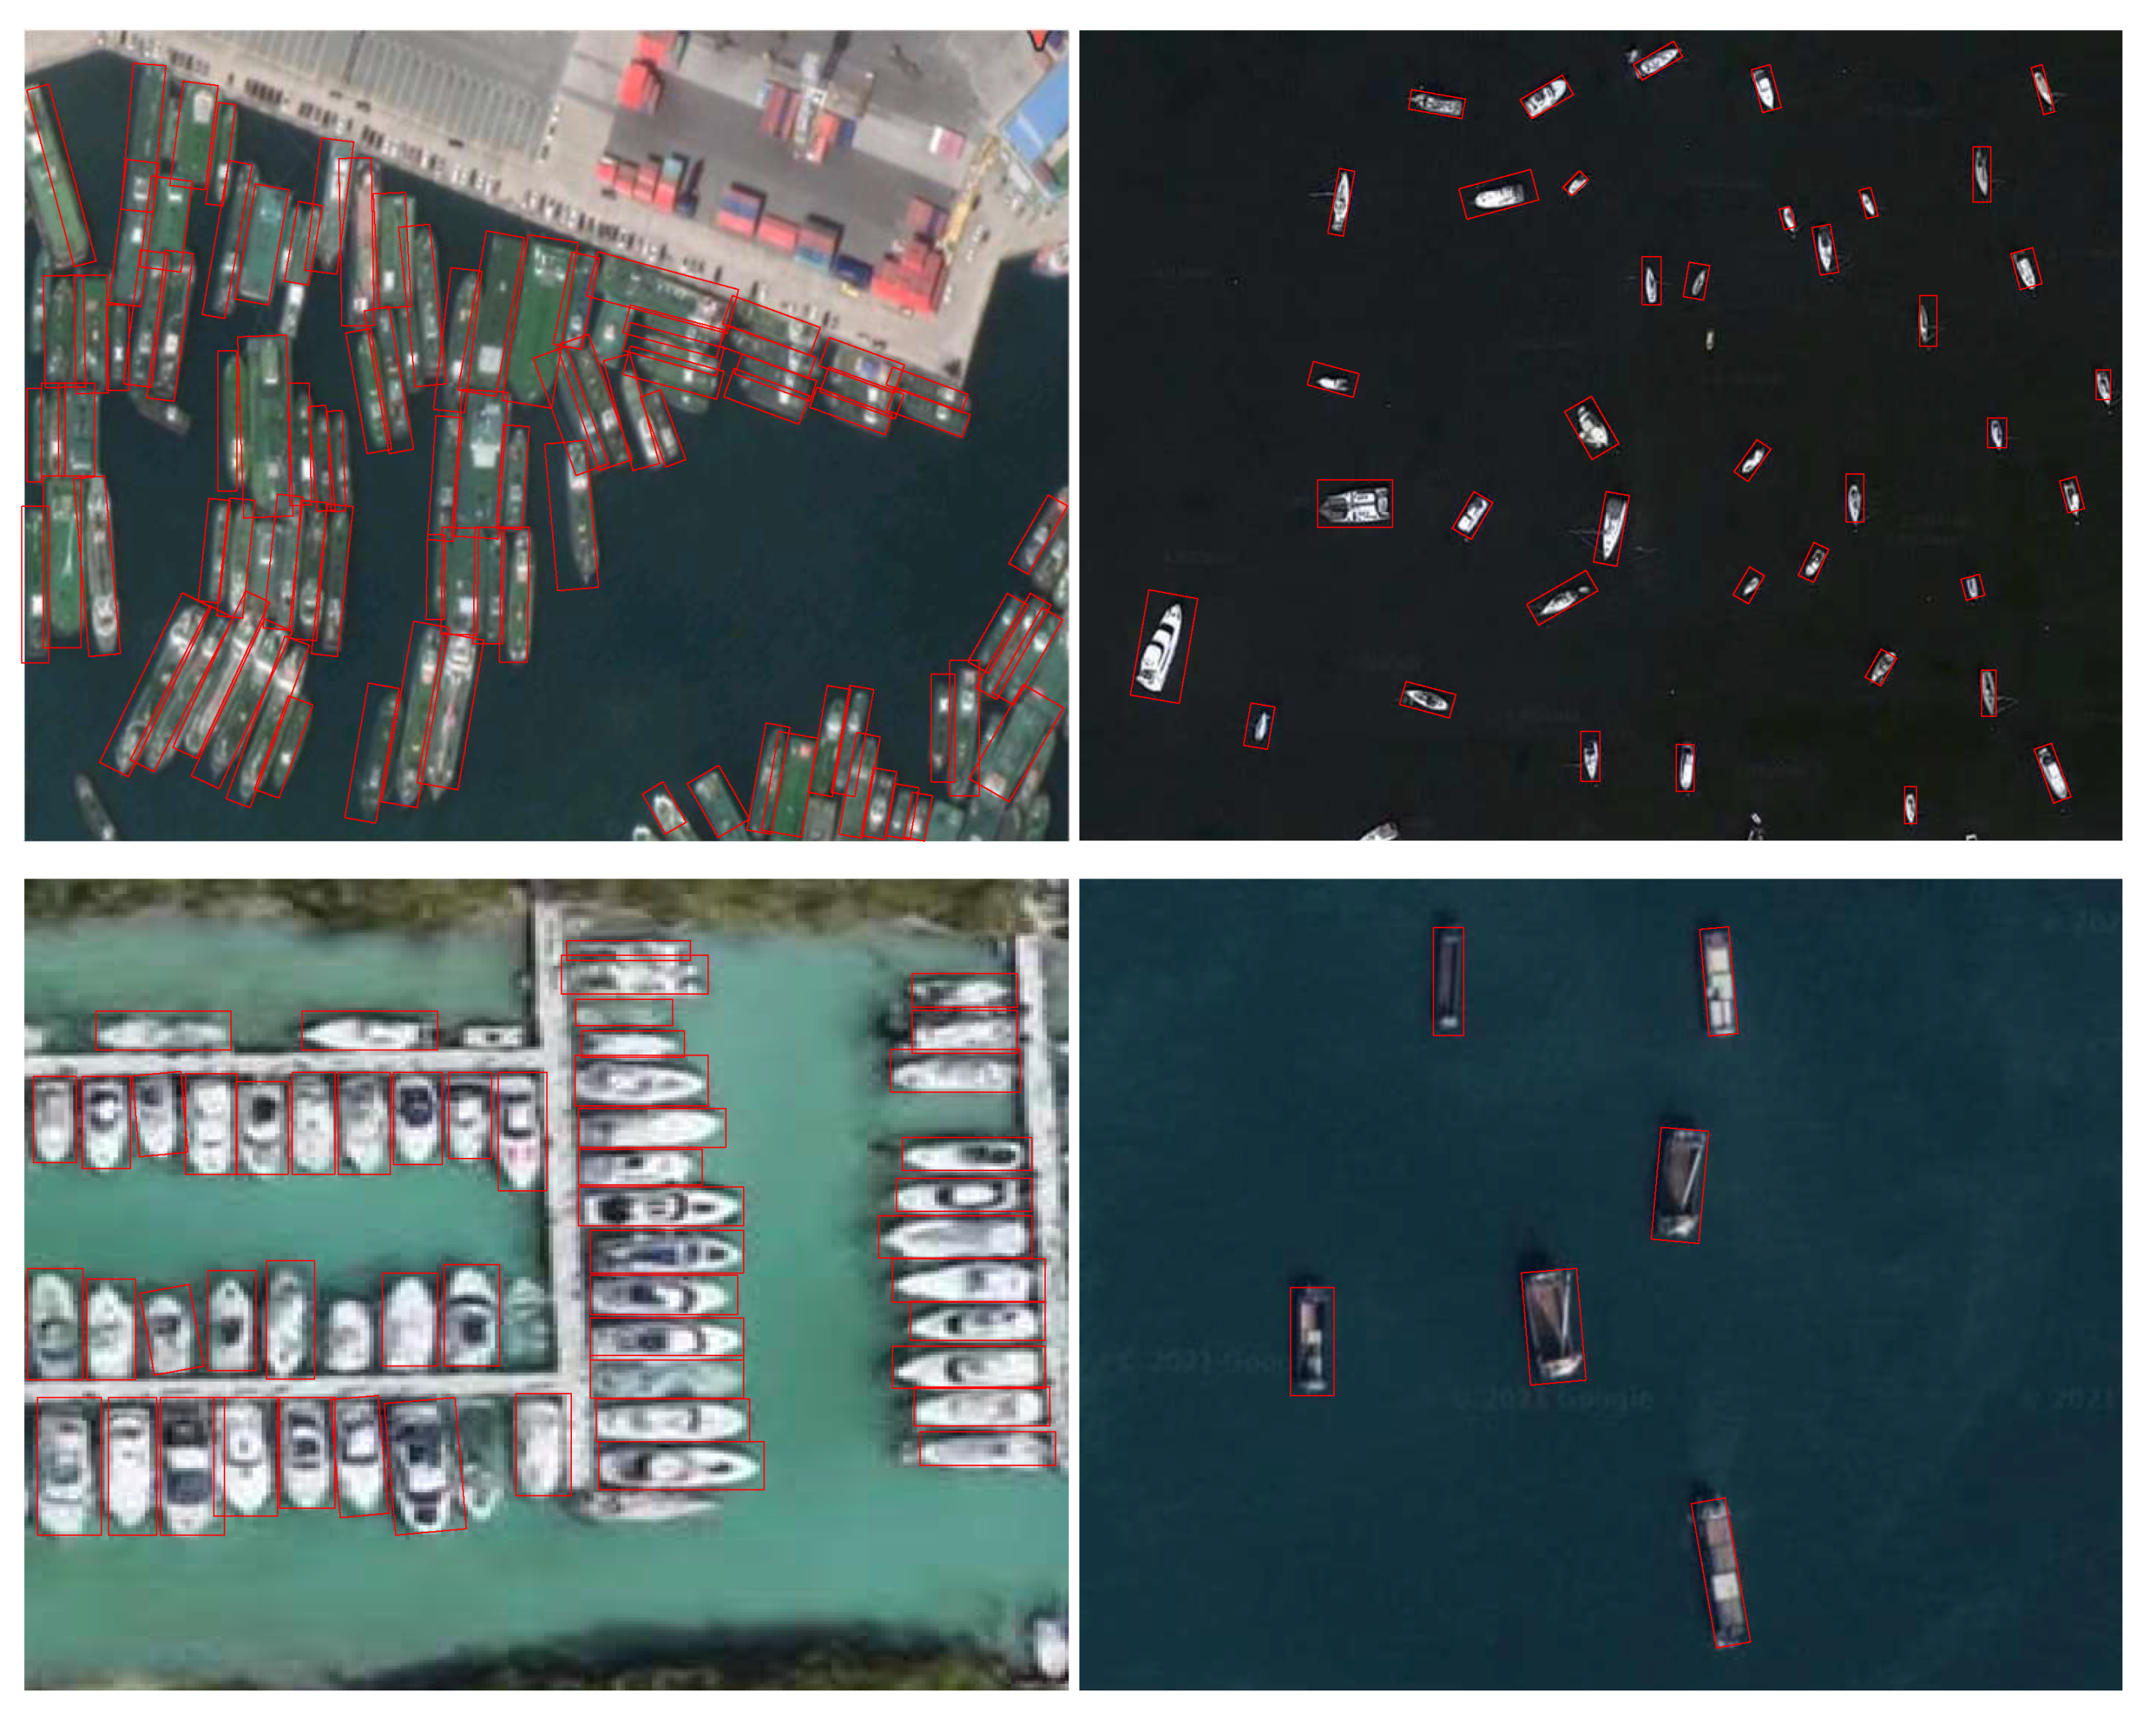
In ship inspection, the more difficult challenge is to detect the densely packed ships docked in the port. In ports with more ships, it is difficult to accurately locate each individual ship in the densely packed ships, especially when they are docked in an oblique direction or size. Figure 10 further shows the detection results of our method when there are many ships in ports and sea areas. It can be seen that our method can accurately detect and select all ship objects regardless of whether it is in a port with dense ships or in a sea area where ships are densely sailing.
5. Discussion
In this section, we first conduct ablation experiments to explore and analyze the influence of each part of the method proposed in this article on the performance of the model. Then, different network structures are used as backbones to verify the robustness of the algorithm in this paper under different network structures.
5.1. Ablation Experiments
In this section, we use ablation experiments to further discuss the influence of each part on the ship’s detection performance in our proposed method by removing or adding components. We used ResNet-50 as the backbone network to extract features and compare them with the Faster R-CNN baseline model. Specifically, we measure the effect of the following:
- Using ResNet-50 as the backbone network for the Faster R-CNN as baseline model;
- Adding active rotating filter feature extraction based on oriented response networks to baseline model;
- Removing active rotating filter feature extraction based on oriented response networks from our method;
- Removing channel attention module from our method;
- Removing spatial attention module from our method.
We conducted ablation experiments on the ocean remote sensing image data set, and strictly kept the parameters used in the experiments consistent. The experimental results are shown in Table 2.
Table 2 shows that each part of the proposed method has a certain impact on the performance of ship object detection. Table 2 shows that the spatial attention structure is beneficial in the suppression of noise and in highlighting object information. With the addition of spatial attention to the Faster R-CNN, ship object detection accuracy improved by 2.19%. Furthermore, by adding spatial attention structure to Faster R-CNN with active rotating filter feature extraction based on oriented response networks, the accuracy has improved by 1.52%. The channel attention can also improve the performance of Faster R-CNN for ship object detection, where its detection accuracy improved by 2.28%, and by adding channel attention to Faster R-CNN with active rotating filter feature extraction based on oriented response networks, where the accuracy improved by 1.74%. The results show that the introduction of ARF can effectively improve the accuracy of object detection. Compared with the baseline method, the detection method of the spatial attention mechanism, the detection method of the channel attention mechanism, and the accuracy of the introduction of ARF is increased by 3.38%, 2.71%, and 2.60%, respectively. We also found that using the spatial attention mechanism and channel attention mechanism alone can significantly improve the accuracy of detection. However, compared with separate space attention or separate channel attention, the accuracy of combining the two is not obvious. We suspect that combining these two attention mechanisms may cause a certain degree of information loss in small and dense objects, so the increased accuracy of combining the two is not significant. We will investigate this further in future work.
5.2. Different Backbones
We further discuss the backbone network selection in this article in this part. Besides the ResNet-50 network used as the backbone in the above experiment, we also experimented with VGG-16, Resnet-101, and DenseNet to assess different impacts of the backbones on the proposed method. The experimental results are recorded in Table 3.
As shown in Table 3, compared with Resnet-50, all the other three backbone networks can obtain similar APs. Resnet-50 got the best AP, 80.12%. Resnet-101 got the second best AP, 80.01%, which is 0.11% lower than the AP obtained by Resnet-50. The APs of DenseNet and VGG-16 are 80.03% and 78.97%, respectively. Generally speaking, the APs of the four backbone networks are not much different. This is attributed to the special characteristics of ship objects in remote sensing images and the addition of the active rotating filter feature extraction based on oriented response networks, channel attention, and spatial attention to reduce the dependence of detection on the backbone network. In addition, the above results indicate that the proposed method is more adaptable and can be executed on a variety of network frameworks.
6. Conclusions
In this paper, we proposed a novel Faster-R-CNN-based method to detect the ships in HR optical remote sensing images via the addition of active rotating filter feature extraction based on oriented response networks, channel attention, and spatial attention. The proposed method first uses a combination of active rotating filters and neural networks. In the active rotating convolution process, the invariance of the angle within the class is actively obtained, and the error update filter is used in the backpropagation process to make the trained network have rotation invariance, thereby generating high-quality rotated proposals. Next, a channelwise and spatial attention mechanism is introduced to our method to enhance the spread of information from the transparency layer to the vertex. Finally, a detailed ablation study was carried out on the proposed technique, compared with some representative detection methods based on CNN, and the detection effect of our method under conscious use of different network structures was discussed. This verifies the superiority of the proposed detection method. The model mean average precision of our proposed method is improved by 5.49% compared with the baseline method. In future work, we will further discuss the influence of the attention mechanism on ship detection. From the two perspectives of object detection model and an object sample, explore the algorithm of related factors that cause the model to fall into the local optimum. Try to establish a new optimized learning model, effectively suppress or enhance the influence of related factors, and achieve a more advanced visual attention mechanism object detection modeling method.
Author Contributions
Data curation, Y.D. and H.L.; Methodology, Y.D. and S.H.; Visualization, F.C.; Writing original draft, Y.D.; Writing review and editing, Y.D. All authors have read and agreed to the published version of the manuscript.
Funding
Our research fund is funded by Natural Science Foundation of Heilongjiang Province No.F2018006, China Postdoctoral Science Foundation No. 2019M661319, Fundamental Research Fund for the Central Universities (3072021CF0609).
Institutional Review Board Statement
The authors declare that the study does not involve humans or animals.
Informed Consent Statement
The authors declare that the study does not involve humans.
Data Availability Statement
The author declares that the experimental data set can be obtained from the corresponding author.
Conflicts of Interest
The authors declare that they have no conflicts of interest to report regarding the present study.
References
- Zhang, R.; Yao, J.; Zhang, K.; Zhang, J. S-Cnn-based ship detection from high-resolution remote sensing images. Int. Arch. Photogramm. Remote Sens. Spatial Inf.-Sci.-ISPRS Arch. 2016, 41, 423–430. [Google Scholar] [CrossRef] [Green Version]
- Zhang, D.; Zhan, J.; Tan, L.; Gao, Y.; Župan, R. Comparison of two deep learning methods for ship target recognition with optical remotely sensed data. Neural Comput. Appl. 2020. [Google Scholar] [CrossRef]
- Feng, Y.; Diao, W.; Sun, X.; Yan, M.; Gao, X. Towards automated ship detection and category recognition from high-resolution aerial images. Remote Sens. 2019, 11, 1901. [Google Scholar] [CrossRef] [Green Version]
- Yang, G.; Li, B.; Ji, S.; Gao, F.; Xu, Q. Ship detection from optical satellite images based on sea surface analysis. IEEE Geosci. Remote Sens. Lett. 2013, 11, 641–645. [Google Scholar] [CrossRef]
- Weber, J.; Lefevre, S. A multivariate hit-or-miss transform for conjoint spatial and spectral template matching. In Proceedings of the International Conference on Image and Signal Processing, Cherbourg, France, 1–3 July 2008; Springer: Berlin/Heidelberg, Germany, 2008; pp. 226–235. [Google Scholar]
- Irvin, R.B.; McKeown, D.M. Methods for exploiting the relationship between buildings and their shadows in aerial imagery. IEEE Trans. Syst. Man Cybern. 1989, 19, 1564–1575. [Google Scholar] [CrossRef] [Green Version]
- Dong, C.; Liu, J.; Xu, F. Ship detection in optical remote sensing images based on saliency and a rotation-invariant descriptor. Remote Sens. 2018, 10, 400. [Google Scholar] [CrossRef] [Green Version]
- LeCun, Y.; Bottou, L.; Bengio, Y.; Haffner, P. Gradient-based learning applied to document recognition. Proc. IEEE 1998, 86, 2278–2324. [Google Scholar] [CrossRef] [Green Version]
- Krizhevsky, A.; Sutskever, I.; Hinton, G.E. Imagenet classification with deep convolutional neural networks. Adv. Neural Inf. Process. Syst. 2012, 25, 1097–1105. [Google Scholar] [CrossRef]
- Simonyan, K.; Zisserman, A. Very deep convolutional networks for large-scale image recognition. arXiv 2014, arXiv:1409.1556. [Google Scholar]
- Szegedy, C.; Liu, W.; Jia, Y.; Sermanet, P.; Reed, S.; Anguelov, D.; Erhan, D.; Vanhoucke, V.; Rabinovich, A. Going deeper with convolutions. In Proceedings of the IEEE Conference on Computer Vision and Pattern Recognition, Boston, MA, USA, 7–12 June 2015; pp. 1–9. [Google Scholar]
- Ioffe, S.; Szegedy, C. Batch normalization: Accelerating deep network training by reducing internal covariate shift. In Proceedings of the International Conference on Machine Learning, Lille, France, 6–11 July 2015; pp. 448–456. [Google Scholar]
- He, K.; Zhang, X.; Ren, S.; Sun, J. Deep residual learning for image recognition. In Proceedings of the IEEE Conference on Computer Vision and Pattern Recognition, Las Vegas, NV, USA, 27–30 June 2016; pp. 770–778. [Google Scholar]
- Huang, G.; Liu, Z.; Van Der Maaten, L.; Weinberger, K.Q. Densely connected convolutional networks. In Proceedings of the IEEE Conference on Computer Vision and Pattern Recognition, Honolulu, HI, USA, 21–26 July 2017; pp. 4700–4708. [Google Scholar]
- Rostami, M.; Kolouri, S.; Eaton, E.; Kim, K. Sar image classification using few-shot cross-domain transfer learning. In Proceedings of the IEEE/CVF Conference on Computer Vision and Pattern Recognition Workshops, Seoul, Korea, 27–28 October 2019. [Google Scholar]
- Redmon, J.; Divvala, S.; Girshick, R.; Farhadi, A. You only look once: Unified, real-time object detection. In Proceedings of the IEEE Conference on Computer Vision and Pattern Recognition, Las Vegas, NV, USA, 27–30 June 2016; pp. 779–788. [Google Scholar]
- Redmon, J.; Farhadi, A. YOLO9000: Better, faster, stronger. In Proceedings of the IEEE Conference on Computer Vision and Pattern Recognition, Honolulu, HI, USA, 21–26 July 2017; pp. 7263–7271. [Google Scholar]
- Redmon, J.; Farhadi, A. Yolov3: An incremental improvement. arXiv 2018, arXiv:1804.02767. [Google Scholar]
- Liu, W.; Anguelov, D.; Erhan, D.; Szegedy, C.; Reed, S.; Fu, C.Y.; Berg, A.C. Ssd: Single shot multibox detector. In Proceedings of the European Conference on Computer Vision, Amsterdam, The Netherlands, 11–14 October 2016; pp. 21–37. [Google Scholar]
- Girshick, R. Fast r-cnn. In Proceedings of the IEEE International Conference on Computer Vision, Santiago, Chile, 7–13 December 2015; pp. 1440–1448. [Google Scholar]
- Ren, S.; He, K.; Girshick, R.; Sun, J. Faster r-cnn: Towards real-time object detection with region proposal networks. arXiv 2015, arXiv:1506.01497. [Google Scholar] [CrossRef] [PubMed] [Green Version]
- Yang, X.; Sun, H.; Fu, K.; Yang, J.; Sun, X.; Yan, M.; Guo, Z. Automatic ship detection in remote sensing images from google earth of complex scenes based on multiscale rotation dense feature pyramid networks. Remote Sens. 2018, 10, 132. [Google Scholar] [CrossRef] [Green Version]
- Chen, Z.; Chen, D.; Zhang, Y.; Cheng, X.; Zhang, M.; Wu, C. Deep learning for autonomous ship-oriented small ship detection. Saf. Sci. 2020, 130, 104812. [Google Scholar] [CrossRef]
- Han, J.; Zhang, D.; Cheng, G.; Guo, L.; Ren, J. Object detection in optical remote sensing images based on weakly supervised learning and high-level feature learning. IEEE Trans. Geosci. Remote Sens. 2014, 53, 3325–3337. [Google Scholar] [CrossRef] [Green Version]
- Tang, J.; Deng, C.; Huang, G.B.; Zhao, B. Compressed-domain ship detection on spaceborne optical image using deep neural network and extreme learning machine. IEEE Trans. Geosci. Remote Sens. 2014, 53, 1174–1185. [Google Scholar] [CrossRef]
- Li, C.; Cong, R.; Hou, J.; Zhang, S.; Qian, Y.; Kwong, S. Nested network with two-stream pyramid for salient object detection in optical remote sensing images. IEEE Trans. Geosci. Remote Sens. 2019, 57, 9156–9166. [Google Scholar] [CrossRef] [Green Version]
- Li, K.; Wan, G.; Cheng, G.; Meng, L.; Han, J. Object detection in optical remote sensing images: A survey and a new benchmark. ISPRS J. Photogramm. Remote Sens. 2020, 159, 296–307. [Google Scholar] [CrossRef]
- Woo, S.; Park, J.; Lee, J.Y.; Kweon, I.S. Cbam: Convolutional block attention module. In Proceedings of the European Conference on Computer Vision (ECCV), Glasgow, UK, 23–28 August 2018; pp. 3–19. [Google Scholar]
- Everingham, M.; Van Gool, L.; Williams, C.K.; Winn, J.; Zisserman, A. The pascal visual object classes (voc) challenge. Int. J. Comput. Vis. 2010, 88, 303–338. [Google Scholar] [CrossRef] [Green Version]
- Everingham, M.; Eslami, S.A.; Van Gool, L.; Williams, C.K.; Winn, J.; Zisserman, A. The pascal visual object classes challenge: A retrospective. Int. J. Comput. Vis. 2015, 111, 98–136. [Google Scholar] [CrossRef]
- Cheng, G.; Han, J. A survey on object detection in optical remote sensing images. ISPRS J. Photogramm. Remote Sens. 2016, 117, 11–28. [Google Scholar] [CrossRef] [Green Version]
- Lin, L.; Yi, S. An inshore ship detection method based on contour matching. Remote Sens. Technol. Appl. 2010, 22, 622–627. [Google Scholar] [CrossRef]
- Zhu, C.; Zhou, H.; Wang, R.; Guo, J. A novel hierarchical method of ship detection from spaceborne optical image based on shape and texture features. IEEE Trans. Geosci. Remote Sens. 2010, 48, 3446–3456. [Google Scholar] [CrossRef]
- Lin, J.; Yang, X.; Xiao, S.; Yu, Y.; Jia, C. A line segment based inshore ship detection method. In Future Control and Automation; Springer: Berlin/Heidelberg, Germany, 2012; pp. 261–269. [Google Scholar] [CrossRef]
- Li, S.; Zhou, Z.; Wang, B.; Wu, F. A Novel Inshore Ship Detection via Ship Head Classification and Body Boundary Determination. IEEE Geosci. Remote Sens. Lett. 2016, 13, 1920–1924. [Google Scholar] [CrossRef]
- Wu, F.; Zhou, Z.; Wang, B.; Ma, J. Inshore Ship Detection Based on Convolutional Neural Network in Optical Satellite Images. IEEE J. Sel. Top. Appl. Earth Obs. Remote Sens. 2018, 11, 4005–4015. [Google Scholar] [CrossRef]
- Wang, X.; Chen, C. Ship Detection for Complex Background SAR Images Based on a Multiscale Variance Weighted Image Entropy Method. IEEE Geosci. Remote Sens. Lett. 2017, 14, 184–187. [Google Scholar] [CrossRef]
- Shao, Z.; Wang, L.; Wang, Z.; Du, W.; Wu, W. Saliency-Aware Convolution Neural Network for Ship Detection in Surveillance Video. IEEE Trans. Circuits Syst. Video Technol. 2020, 30, 781–794. [Google Scholar] [CrossRef]
- Li, L.; Zhou, Z.; Wang, B.; Miao, L.; Zong, H. A Novel CNN-Based Method for Accurate Ship Detection in HR Optical Remote Sensing Images via Rotated Bounding Box. IEEE Trans. Geosci. Remote Sens. 2021, 59, 686–699. [Google Scholar] [CrossRef]
- Nie, X.; Duan, M.; Ding, H.; Hu, B.; Wong, E.K. Attention mask R-CNN for ship detection and segmentation from remote sensing images. IEEE Access 2020, 8, 9325–9334. [Google Scholar] [CrossRef]
- Bi, F.; Hou, J.; Chen, L.; Yang, Z.; Wang, Y. Ship detection for optical remote sensing images based on visual attention enhanced network. Sensors 2019, 19, 2271. [Google Scholar] [CrossRef] [PubMed] [Green Version]
- Zhang, S.; Wu, R.; Xu, K.; Wang, J.; Sun, W. R-CNN-based ship detection from high resolution remote sensing imagery. Remote Sens. 2019, 11, 631. [Google Scholar] [CrossRef] [Green Version]
- Braun, M.; Krebs, S.; Flohr, F.; Gavrila, D.M. Eurocity persons: A novel benchmark for person detection in traffic scenes. IEEE Trans. Pattern Anal. Mach. Intell. 2019, 41, 1844–1861. [Google Scholar] [CrossRef] [PubMed] [Green Version]
- Chang, Y.L.; Anagaw, A.; Chang, L.; Wang, Y.C.; Hsiao, C.Y.; Lee, W.H. Ship detection based on YOLOv2 for SAR imagery. Remote Sens. 2019, 11, 786. [Google Scholar] [CrossRef] [Green Version]
- Girshick, R.; Donahue, J.; Darrell, T.; Malik, J. Region-based convolutional networks for accurate object detection and segmentation. IEEE Trans. Pattern Anal. Mach. Intell. 2015, 38, 142–158. [Google Scholar] [CrossRef]
- He, K.; Zhang, X.; Ren, S.; Sun, J. Spatial pyramid pooling in deep convolutional networks for visual recognition. IEEE Trans. Pattern Anal. Mach. Intell. 2015, 37, 1904–1916. [Google Scholar] [CrossRef] [Green Version]
- Paszke, A.; Gross, S.; Massa, F.; Lerer, A.; Bradbury, J.; Chanan, G.; Killeen, T.; Lin, Z.; Gimelshein, N.; Antiga, L.; et al. Pytorch: An imperative style, high-performance deep learning library. Adv. Neural Inf. Process. Syst. 2019, 32, 8026–8037. [Google Scholar]
Figure 1.
Some examples of ship object detection.

Figure 2.
The overall structure diagram of the Faster R-CNN algorithm.

Figure 3.
Example of ARF feature extraction based on ORN.

Figure 4.
Deep network architecture realized by deep features with brainlike invariance.

Figure 5.
Improved network structure by using attention mechanism. W and H are the width and height of the input data during the training process of the convolutional neural network, C, C1 and C2 are the number of channels in the middle, and F, F’, and F” are the features of the training process, respectively.

Figure 6.
Illustration of Channelwise Attention.

Figure 7.
Illustration of Spatial Attention.

Figure 8.
Some examples of the ocean remote sensing image for the ship object detection data set we used to train and evaluate the detection effect.
Figure 8.
Some examples of the ocean remote sensing image for the ship object detection data set we used to train and evaluate the detection effect.

Figure 9.
Comparison of the ship detection results by different methods. (a) SSD. (b) YOLOv3. (c) Faster R-CNN. (d) Method in [39]. (e) Ours.
Figure 9.
Comparison of the ship detection results by different methods. (a) SSD. (b) YOLOv3. (c) Faster R-CNN. (d) Method in [39]. (e) Ours.

Figure 10.
Some examples of ship detection results obtained by the proposed method.


Table 1.
Mean average precision of the proposed ship object detection method, SSD, YOLO, YOLOv2, YOLOv3, Fast R-CNN, Faster R-CNN, and method in [39] on the ocean remote sensing image data set.
Table 1.
Mean average precision of the proposed ship object detection method, SSD, YOLO, YOLOv2, YOLOv3, Fast R-CNN, Faster R-CNN, and method in [39] on the ocean remote sensing image data set.
| AP | FPS | |
|---|---|---|
| YOLO [16] | 45 | |
| YOLOv2 [17] | 81 | |
| YOLOv3 [18] | 92 | |
| SSD [19] | 46 | |
| Fast R-CNN [20] | 0.5 | |
| Faster R-CNN [21] | 5 | |
| Method in [39] | 7 | |
| ours | 20 |
Table 2.
Detection accuracy in the ablation study of active rotating filter feature extraction based on oriented response networks, channel attention, and spatial attention. ARF, CA, and SA stand for active rotating filter, channel attention, and spatial attention, respectively.
Table 2.
Detection accuracy in the ablation study of active rotating filter feature extraction based on oriented response networks, channel attention, and spatial attention. ARF, CA, and SA stand for active rotating filter, channel attention, and spatial attention, respectively.
| AP | |
|---|---|
| Faster R-CNN baseline | |
| Faster R-CNN SA | |
| Faster R-CNN CA | |
| Faster R-CNN CA–SA | |
| Faster R-CNN SA–CA | |
| Faster R-CNN ARF | |
| Faster R-CNN ARF–SA | |
| Faster R-CNN ARF–CA | |
| Faster R-CNN ARF–SA–CA | |
| Faster R-CNN ARF–CA–SA |
Table 3.
Detection accuracy of different backbones.
| AP | |
|---|---|
| Resnet-50 | |
| Resnet-101 | |
| VGG-16 | |
| DenseNet |
Publisher’s Note: MDPI stays neutral with regard to jurisdictional claims in published maps and institutional affiliations. |
© 2021 by the authors. Licensee MDPI, Basel, Switzerland. This article is an open access article distributed under the terms and conditions of the Creative Commons Attribution (CC BY) license (https://creativecommons.org/licenses/by/4.0/).
Share and Cite
MDPI and ACS Style
Dong, Y.; Chen, F.; Han, S.; Liu, H. Ship Object Detection of Remote Sensing Image Based on Visual Attention. Remote Sens. 2021, 13, 3192. https://doi.org/10.3390/rs13163192
AMA Style
Dong Y, Chen F, Han S, Liu H. Ship Object Detection of Remote Sensing Image Based on Visual Attention. Remote Sensing. 2021; 13(16):3192. https://doi.org/10.3390/rs13163192
Chicago/Turabian StyleDong, Yuxin, Fukun Chen, Shuang Han, and Hao Liu. 2021. "Ship Object Detection of Remote Sensing Image Based on Visual Attention" Remote Sensing 13, no. 16: 3192. https://doi.org/10.3390/rs13163192
Note that from the first issue of 2016, this journal uses article numbers instead of page numbers. See further details here.