
Spatial Analysis of Urbanization Patterns in Four Rapidly Growing South Asian Cities Using Sentinel-2 Data


1
Department of Environmental Management, Rajarata University of Sri Lanka, Mihintale 50300, Sri Lanka
2
Faculty of Life and Environmental Sciences, University of Tsukuba, 1-1-1, Tennodai, Tsukuba, Ibaraki 305-8572, Japan
3
Department of Plant and Environmental Sciences, School of Natural Resources, Copperbelt University, P.O. Box 21692, Kitwe 10101, Zambia
*
Author to whom correspondence should be addressed.
Remote Sens. 2021, 13(8), 1531; https://doi.org/10.3390/rs13081531
Submission received: 26 February 2021
/
Revised: 11 April 2021
/
Accepted: 14 April 2021
/
Published: 15 April 2021
(This article belongs to the Special Issue Urban Developments and Its Impacts on Disasters in Developing Countries)
Abstract
:The rapid and dominant urbanization in Asian cities has fueled concerns regarding the local and global efforts toward urban sustainability. Specifically, South Asian cities have been a topical issue concerning ecological and environmental threats due to their unplanned and haphazard urban development. However, comparative urbanization studies in South Asian cities remain uncommon. Therefore, in this study, we sought to comparatively examine the land use and land cover (LULC) dynamics and to detect the urbanization patterns of four rapidly developing South Asian lowland cities: Mumbai (India), Colombo (Sri Lanka), Karachi (Pakistan), and Dhaka (Bangladesh). Sentinel-2 (10 m) data and various geospatial approaches, including urban–rural gradient and grid-based methods, statistics, and urban landscape metric techniques, were used to facilitate the analysis. The study revealed that Mumbai, Karachi, and Dhaka had larger built-up landscapes compared to Colombo. Mumbai had the highest percentage of green spaces, followed by Colombo. Dhaka and Karachi had relatively small percentages of green spaces. Colombo and Dhaka had more croplands, which consistently increased along the urban–rural gradient compared to Mumbai and Karachi. Karachi showed that the only major land use was built-up, while most of the areas were left as open lands. On the other hand, Colombo’s urban setup was more fragmented than the other three cities. Mumbai and Karachi had larger patches of urban footprints compared to Colombo and Dhaka. Thus, this study provides vital information on the past land utilization priorities in the four cities, and comparatively proffers guidance on certain critical areas of focus for local, regional, and global future sustainable urban planning.
1. Introduction
The United Nations World Urbanization Prospects 2018 defines urbanization as a complex socio-economic process that transforms the built environment, converting formerly rural areas into urban settlements while also shifting the spatial distribution of a population from rural to urban areas [1]. This includes changes in the dominant occupations, lifestyle, culture, and behavior, thus altering the demographic and social structure of urban and rural areas. Significant consequences of urbanization include the number, land area, and population size of urban settlements as well as the number and share of urban residents compared to rural dwellers [1].
The world urban population was 55% in 2018, and this is projected to rise to 68% by 2050. More than 90% of the urban population growth has occurred in Asia and Africa [1]. India and China alone are projected to add approximately 416 million and 255 million, respectively, in 2050 [1]. Thus, the Asian region is expected to be the major contributor to urban population increase by 2050.
Asia’s urban population was estimated to be almost 50% of the world’s population in 2018. Out of the total population in Asia, 15% were reported to be living in megacities (10 million or more), 9% in larger cities (5 million to 10 million), and 21% in medium cities (1 to 5 million) [1]. Thus, the rapid urban population expansion in Asian cities has become a topical issue worldwide. Urban development is closely related to three main aspects: social, economic, and environmental [1].
The rapid urban development associated with the fast population growth will continue to produce pressure, causing massive transformations of land use and land cover (LULC) from the natural state. These rapid changes in the LULC provide several threats, such as increasing poverty levels, high energy consumption, increasing vehicular air population, urban waste problems, flash urban floods, decreasing green spaces [2], and decreasing agricultural lands in urban areas [3]. The rapid urbanization has negatively affected the environmental quality of many urban cities in the Asian region, particularly in the lowland cities [4]. Thus, there is a need to capture the urban development and LULC dynamics in the Asian region to transform the landscape and urban planning.
To capture the LULC dynamics, remote sensing data play a vital role, and in developing countries in particular, spatial data is scarce [5]. Several previous studies in developing countries have opted to use freely available medium resolution remote sensing data to capture the LULC dynamics due to a lack of financial resources to obtain the commercial high-resolution data [5,6]. One of the commonly used medium resolution remote sensing data is Landsat.
Landsat data have contributed significantly to LULC mapping development over the last four decades by providing 30-m resolution, free, continuous global coverage from 1982 [7,8]. Hence, LULC changes research based on Landsat data has been widely recognized over the past few decades [8]. Similar to other developing regions in the world, most of the previous studies related to LULC in South Asian cities have been conducted using Landsat images.
Some examples include Sri Lankan cities, such as Colombo [9], Kandy [10,11,12], Nuwara Eliya [13,14], Kurunegala [15], and Galle [16]; Indian cities, such as Mumbai [17] [18,19], Chandigarh [20], Delhi [21,22], Lucknow [23,24,25], Ranchi [26], Pune [27], and Kolkata [28]; Pakistani cities, such as Islamabad [29], Karachi [30], and Lahore [31]; Bangladeshi cities, such as Chattogram [32] and Dhaka [33,34]; and Nepalese cities, such as Kathmandu [35]. These studies have shown the aptness of using Landsat data to capture the rapid LULC changes in developing cities of South Asia in their respective contexts and in attempts to contribute toward informed decision making and planning.
However, after Sentinel-2A (23 June 2015) and -2B (7 March 2017) were launched by the European Space Agency (ESA), an alternative to freely available remote sensing data was offered through the provision of high spatial resolution, particularly for developing countries [36]. The primary objective of the Sentinel-2 program was to offer high-resolution images for climate change, disaster monitoring, and LULC monitoring [37,38]. The other objective was to add to the existing efforts (e.g., Landsat) by introducing other global satellite programs for continuity in monitoring the changing dynamics of the earth’s surface [39,40].
Sentinel-2 data have high spatial and temporal resolution compared to the Landsat data [40]. The spatial resolution of Sentinel-2 data ranges from 10 to 60 m. The multispectral bands, such as red, green, blue, and near-infrared (NIR), have 10-m spatial resolution, which provides a significant opportunity for detailed exploration of the earth [36]. On the other hand, Sentinel-2 provides high temporal resolution (5–10 days), and the rapid changes of the LULC can be monitored with high effectiveness. The swath width of the Sentinel-2 is 290 km, which provides good coverage of the earth’s surface [41].
Thus, Sentinel-2 has provided a considerable contribution to enhancing LULC monitoring in the world [36]. Since its launch in 2015, Sentinel-2 has been widely recognized and used by many scholars to monitor the LULC changes on the earth’s surface [41,42,43,44,45,46] due to its potential to provide a high accuracy of classification [36]. However, studies utilizing Sentinel-2 data in South Asian regions have remained uncommon to this date.
Most of the previous LULC studies in South Asian cities were conducted using Landsat data [9,15,21,30]. Sentinel-2 data, therefore, offers an opportunity to examine the LULC dynamics in South Asian cities with better accuracy and to contribute to the practical formulation of policies toward sustainable urban development.
On the other hand, examining the patterns of LULC changes using the urban–rural (i.e., city center to rural areas) gradient analysis method has the potential to provide insights into the urban development process of the South Asian cities, as shown in previous studies [47,48,49]. The use of grid-cell-based analysis (e.g., [6,7,50,51]) and spatial landscape metrics (e.g., [9,35,52,53]) has been widely proven as important geospatial approaches that can enhance the understanding of urban development patterns and processes.
Thus, in this study, using Sentinel-2 data, gradient and grid-based analysis, and spatial landscape metrics, with the aid of geospatial tools and techniques, we sought to comparatively examine the LULC dynamics and detect the urbanization patterns of four rapidly developing South Asian lowland cities: Mumbai (India), Colombo (Sri Lanka), Karachi (Pakistan), and Dhaka (Bangladesh).
The four cities were selected to obtain a good representation of South Asian cities on the basis of the following criteria: (i) being the largest and capital city, (ii) being the main commercial center, (iii) having the highest population of the country, and (iv) located as lowland cities for comparative purposes. This study seeks to contribute and enhance the available information on the urbanization patterns in South Asian cities, which is important for a global sustainable urban development approach. The study is also in line with the projected 2030 United Nations Sustainable Development Goals (SDGs), specifically the SDG no. 11 (Sustainable Cities and Communities) [54].
2. Materials and Methods
2.1. Study Area
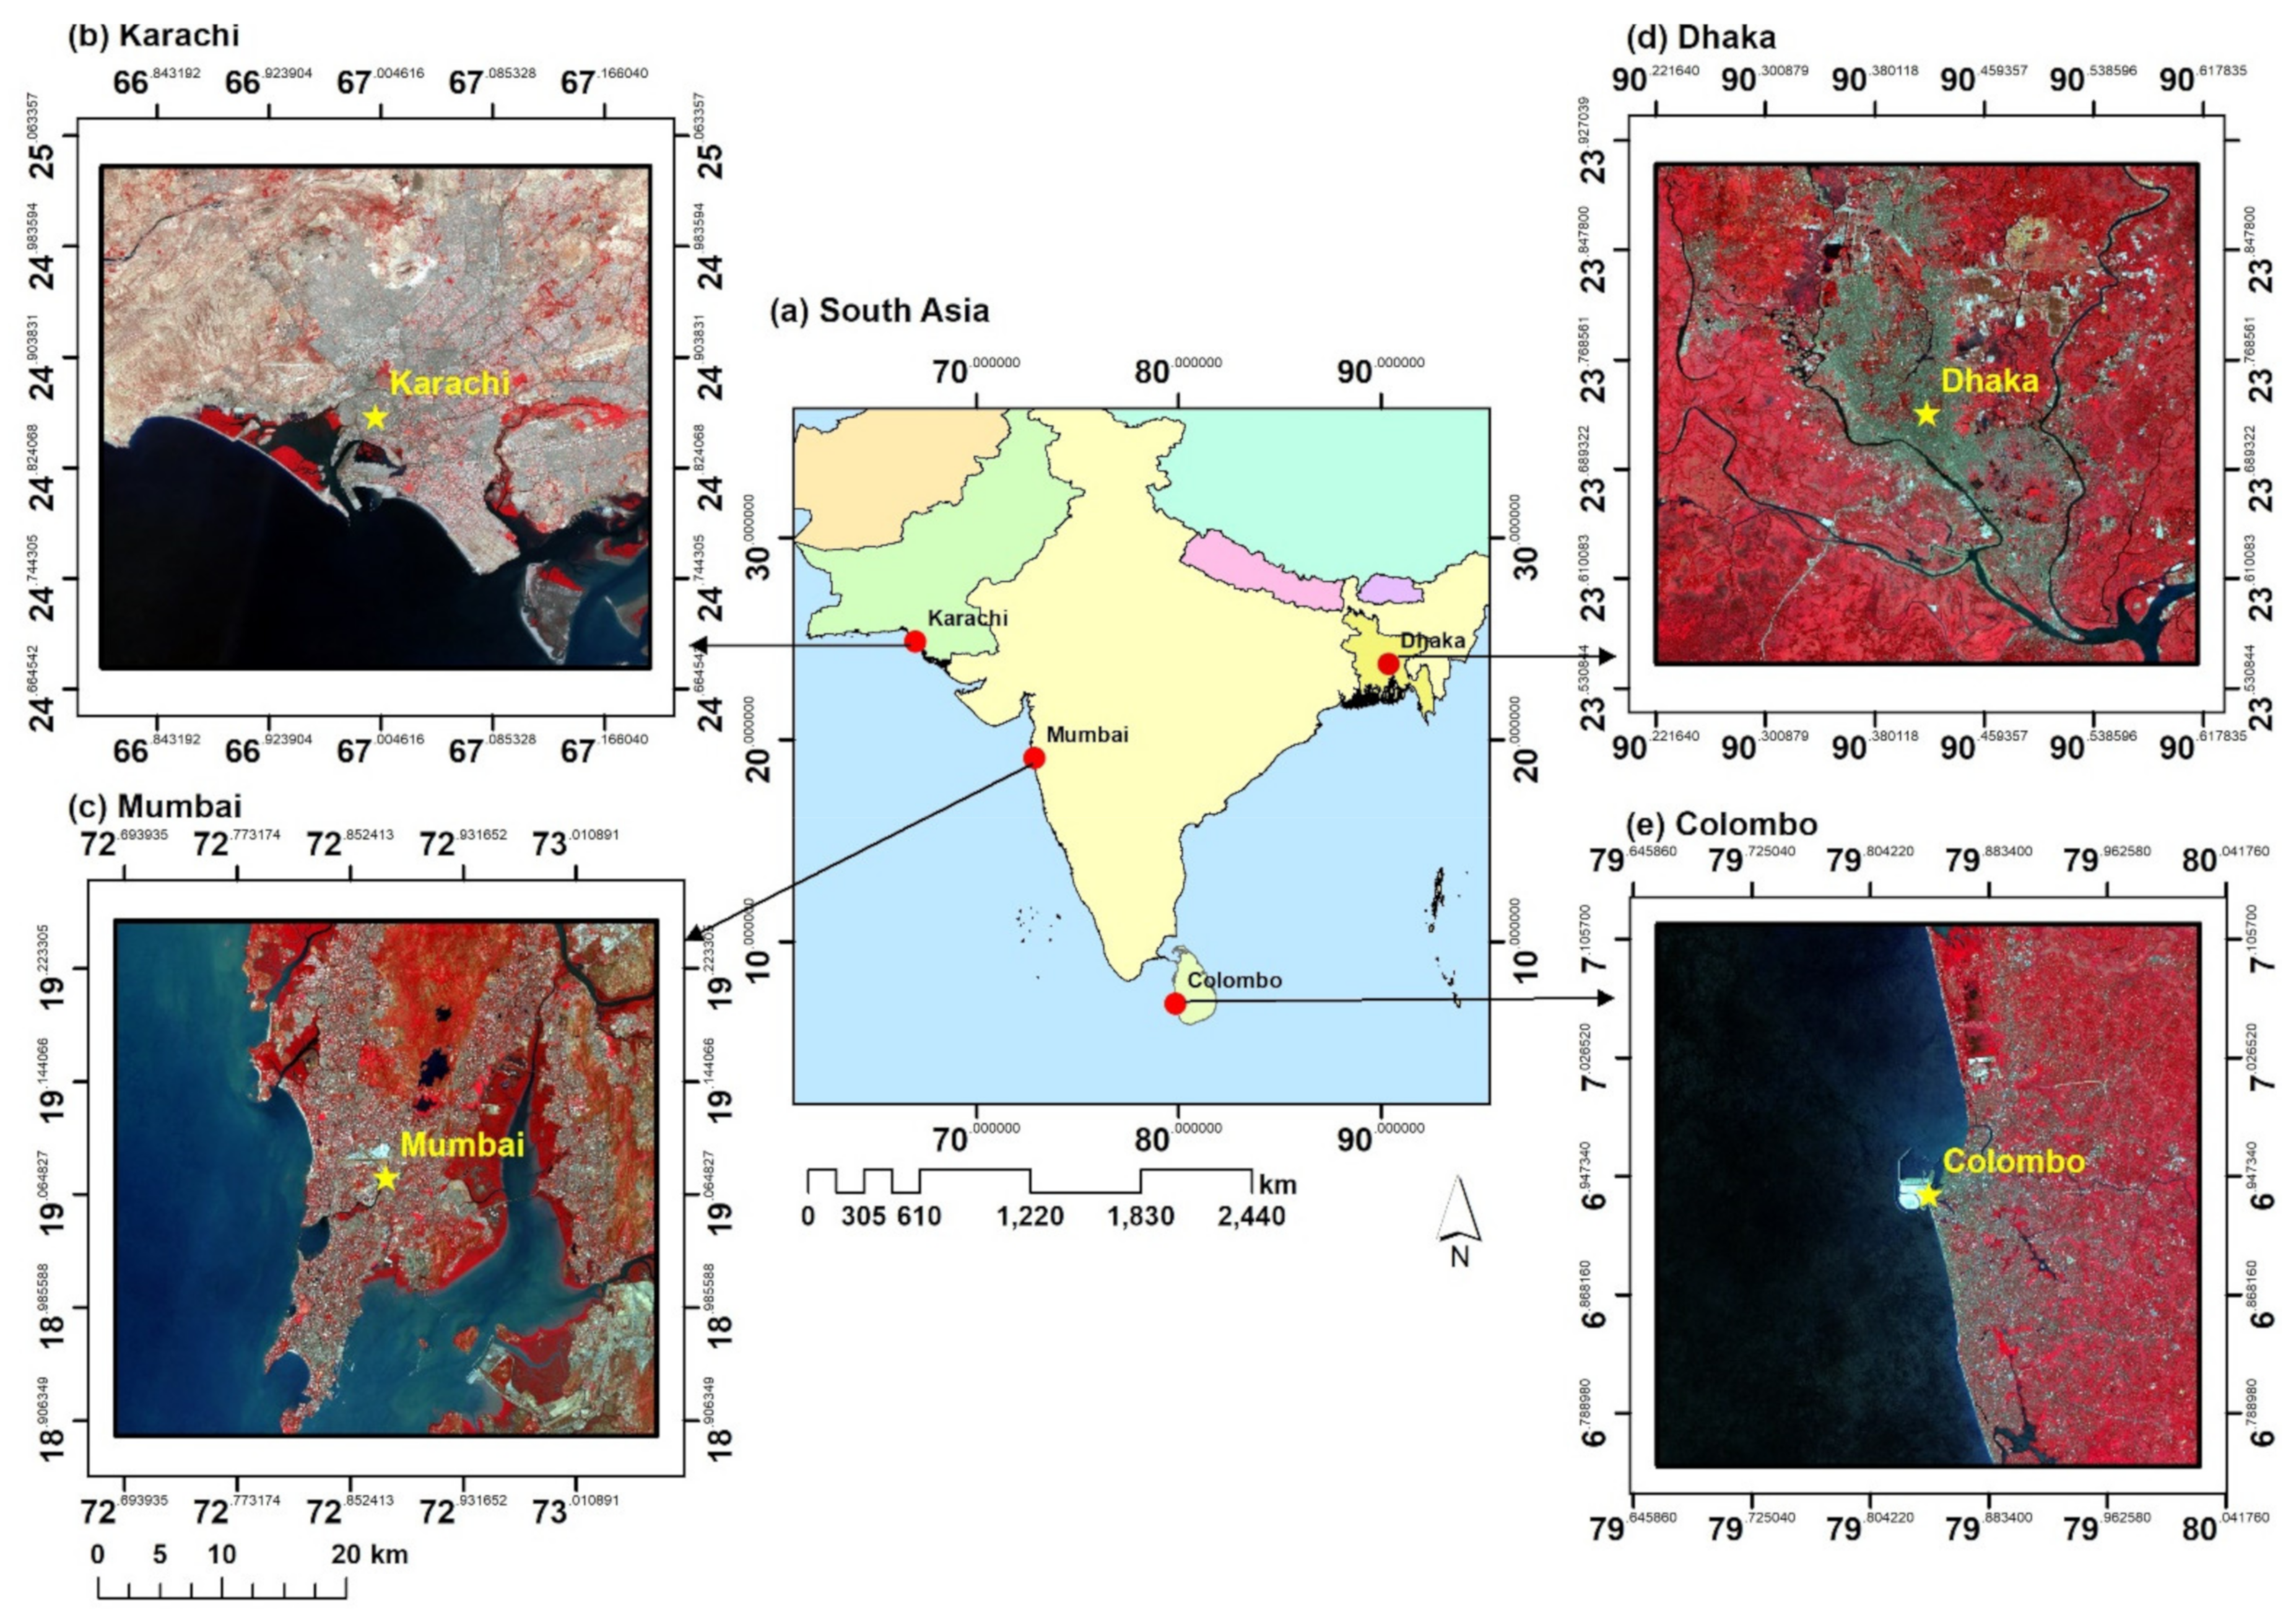
Figure 1 shows the location of the study areas, including 4 south Asian cities: Karachi (Pakistan), Mumbai (India), Dhaka (Bangladesh), and Colombo (Sri Lanka). The 4 cities are located in lowland areas. Mumbai, Colombo, and Karachi are coastal cities, while Dhaka is an inland city. To have a common unit of analysis and for comparison purposes, we used a 40 × 40 km subset with a 20-km radius from each city’s urban center. All 4 cities are located in the tropical climatic zone.
Mumbai is the commercial capital and is often considered the most vibrant city of India [17]. Mumbai is located on the west coast of India and covers approximately 465 km2. It is also considered one of the fastest urbanizing cities in the world. In 2018, Mumbai was recorded as the seventh-largest city by population [55]. Mumbai’s population has been reported to have increased from about 16.1 million to 20.0 million from 2000 to 2018, respectively, with an annual growth rate of 1.2% [55]. Colombo is also the commercial capital and largest city of Sri Lanka by population. Colombo is located west of the Indian Ocean. The Colombo Metropolitan population increased from 3.47 million to 3.70 million from 2001 to 2012, respectively [9].
On the other hand, Karachi is the largest megacity in Pakistan, located on the Arabian Sea coast. In terms of the land area, Karachi spreads over 3530 km2 [56]. This is also Pakistan’s fastest urbanizing city with rapid population growth. Karachi’s population was reported to have increased from an estimated 9.8 million in 2000 to 15.4 million in 2018 [55]. Dhaka is the capital city of Bangladesh, with an area covering about 306.4 km2. This is one of the fastest-growing cities globally and was reported to be the world’s ninth largest city in 2018 [55]. Dhaka’s population was reported to have increased from an estimated 10.2 million in 2000 and 19.6 million in 2018, growing at 3.6% per annum [55].
2.2. Overall Workflow
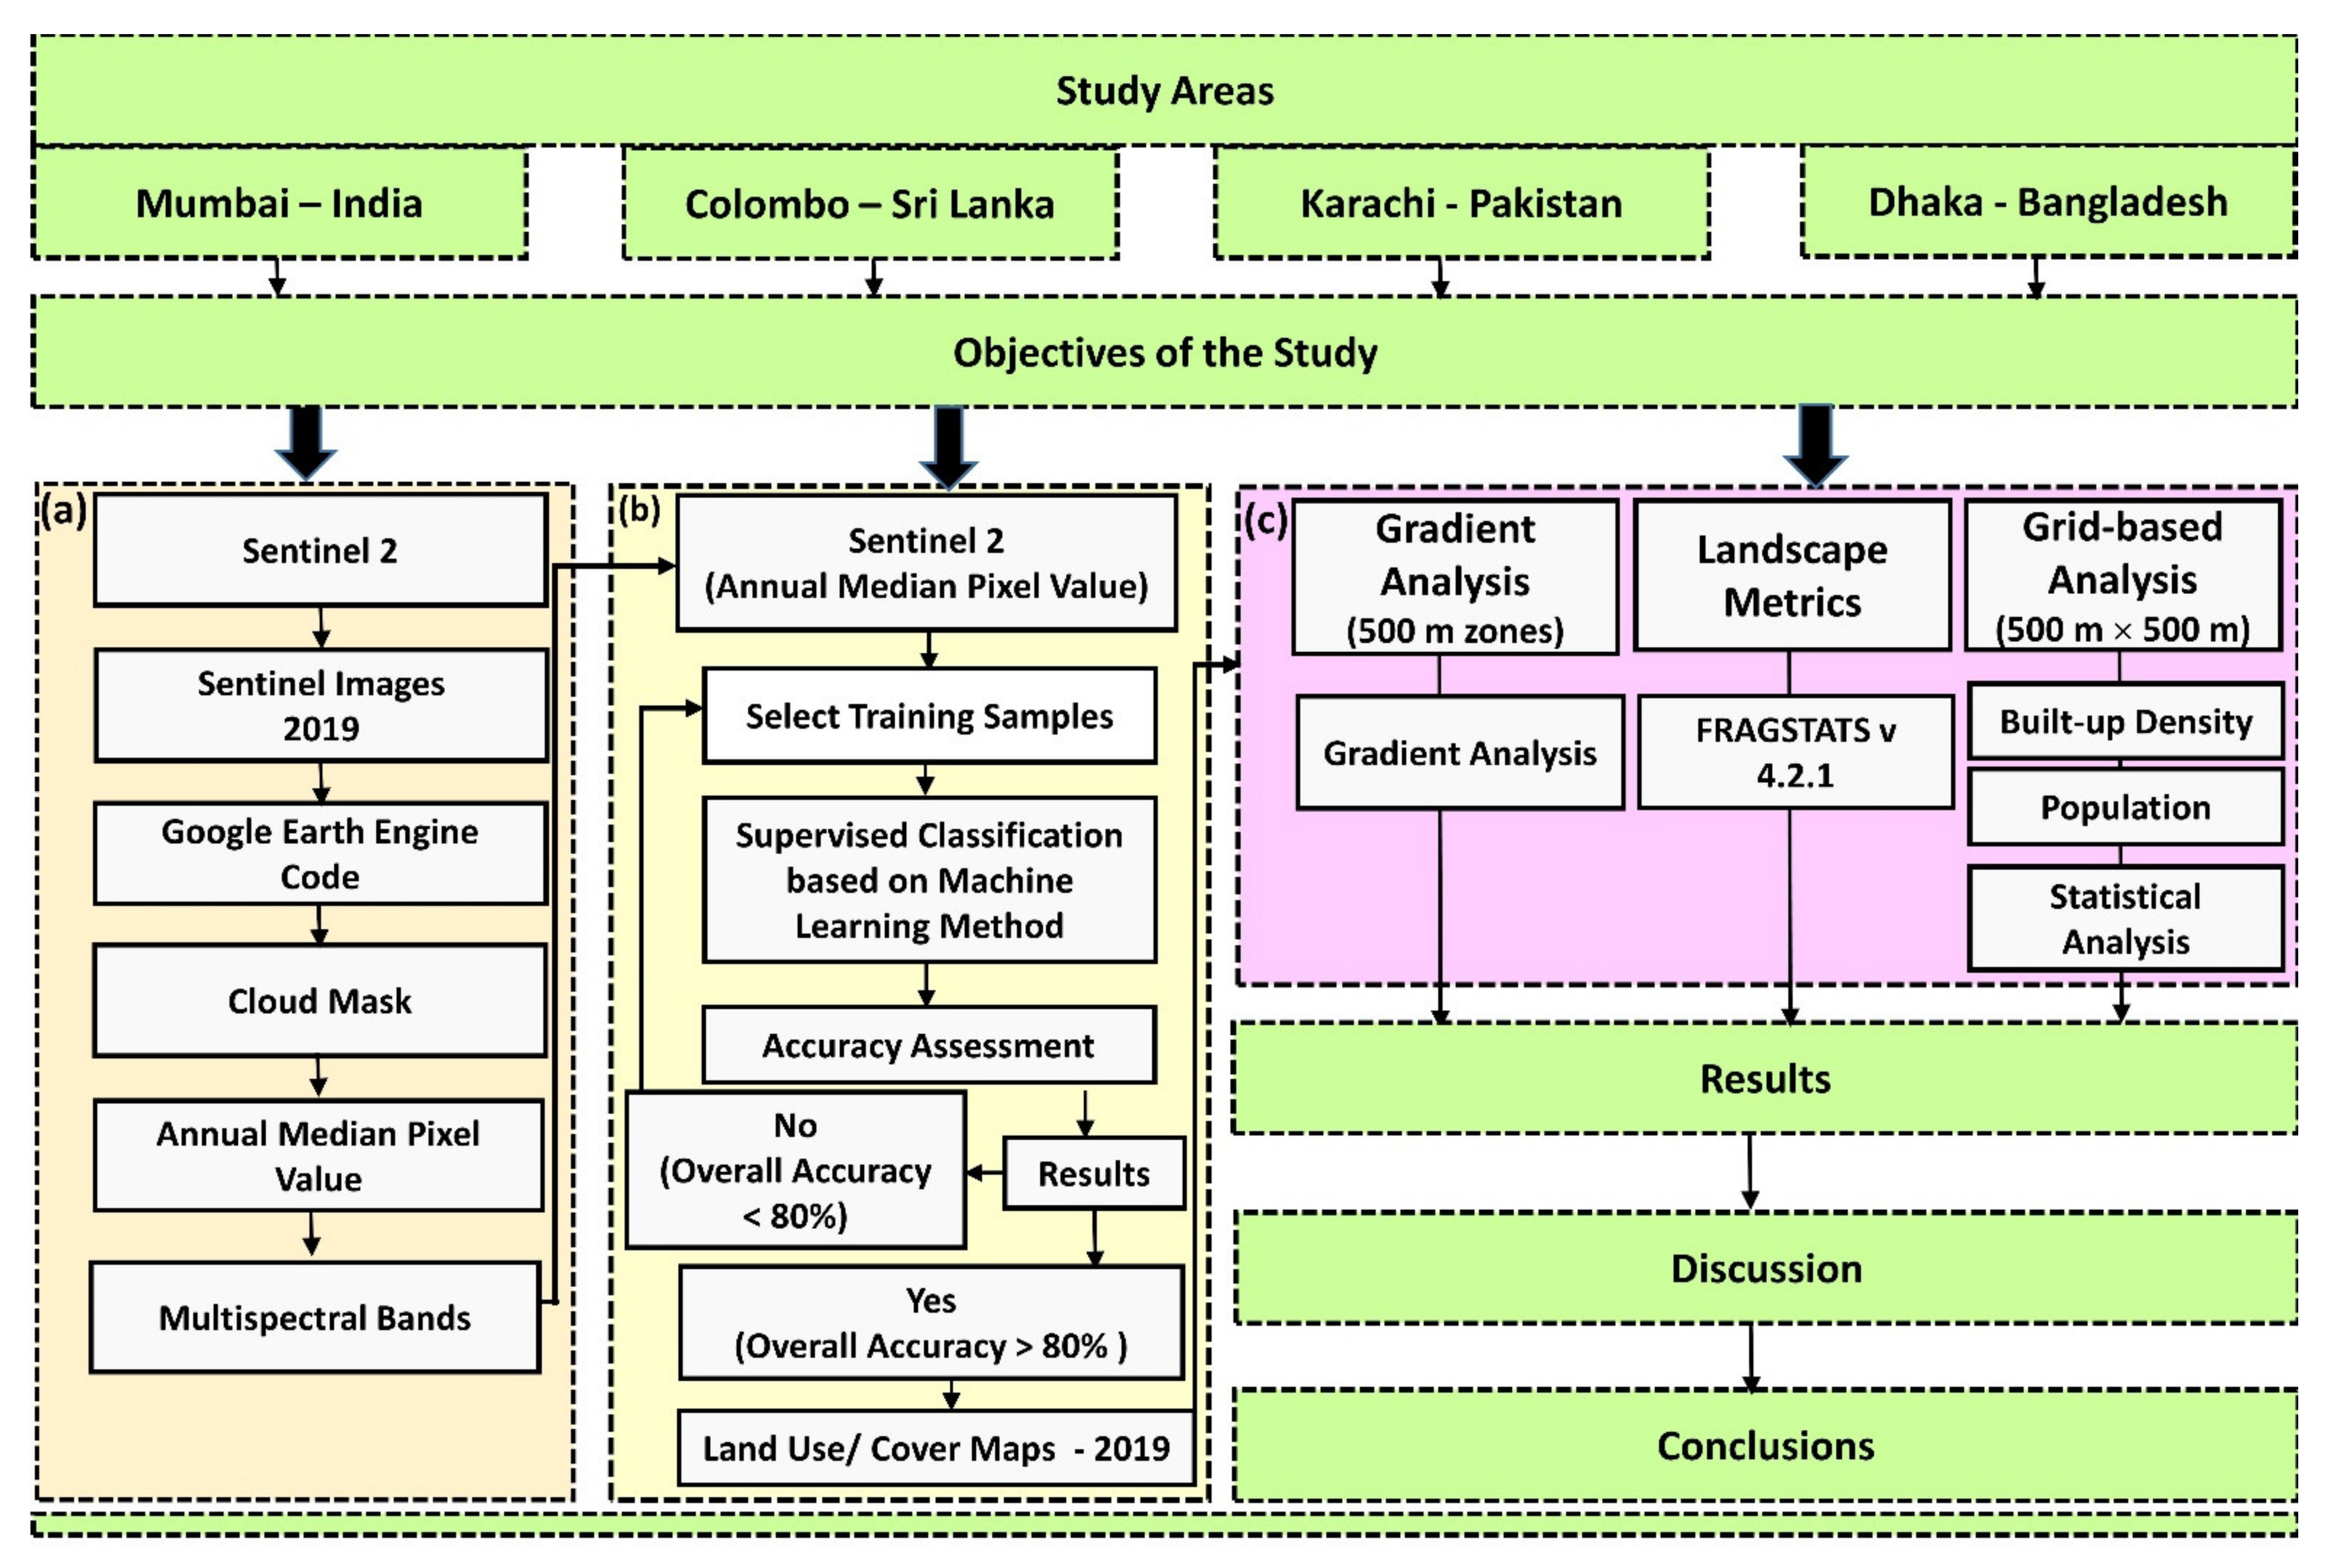
Figure 2 shows the workflow adopted in this study, outlining the methods used as follows: (a) pre-preparation of the Sentinel images using the Google Earth Engine (GEE), (b) LULC classification and accuracy assessments, and (c) further analysis methods.
2.3. Data and Preparations
2.3.1. Satellite Data
In this study, we obtained Sentinel-2 medium resolution (10 m) satellite imagery for classifying the LULC in the 4 cities for the year 2019. Sentinel-2 satellite data were recently (2015) introduced by the European Space Agency (ESA) with a primary objective to provide high-resolution satellite data compared to the other freely available satellite data [36].
Researchers have since cited improved LULC mapping and monitoring as one of the major contributions of the Sentinel-2 data to the scientific world [36,57]. Sentinel 2 provides improved data compared with the other medium-resolution satellite data, such as Landsat, which is primarily temporal and spatial [58]. The freely available medium-resolution satellite images have been used in developing countries due to a lack of financial resources to secure high-resolution remotely sensed images. Sentinel 2 provides a good alternative for high-resolution images [36,59].
Table 1 shows the characteristics of the ESA Sentinel 2A. In this study, we used 4 bands: Band 2 (Blue), Band 3 (Green), Band 4 (Red), and Band 8 (NIR).
Cloud cover is common in Sentinel 2 data, similar to the other remote sensing images [60]. It was challenging to capture images from the same date due to cloud cover in the selected 4 cities. Thus, we used GEE to obtain the annual medium pixels to produce high-quality cloud-free images for the study. GEE has become popular as a cloud computing platform to process earth observation data due to several advantages, including flexibility, efficiency, availability, bulk downloading, ingesting, and processing capabilities [61]. GEE helps to extract cloud- and shadow-free images [62]. There are several past studies worldwide that have been conducted using GEE [43,44,63].
GEE was used to extract the annual medium pixel for 2019 in each of the 4 cities in this study. Multispectral images were extracted using 339 images for Karachi, 175 images for Dhaka, 427 images for Mumbai, and 147 images for Colombo. The GEE was used because of its ability to obtain many cloud-free images with high processing speed. The extracted images were used for LULC classification for 4 cities described in Section 2.4.
2.3.2. Population Data
The study also used population data for each of the 4 cities to assess the four cities’ urbanization patterns. The data were obtained from the census/projection-disaggregated gridded population datasets for each of the 4 cities in 2020 using Built-Settlement Growth Model (BSGM) outputs provided by the University of Southampton [64]. We extracted the total estimated number of people per grid-cell at a resolution of approximately 100 m.
2.4. LULC Classification and Accuracy Assessments
2.4.1. Classification Scheme
We defined and adopted a LULC classification scheme comprising 5 classes: open lands, built-up, croplands, green spaces, and water. Table 2 provides descriptions of the 5 LULC classes.
2.4.2. LULC Classification
This study employed machine learning algorithms to carry out LULC classification. Machine learning approaches have been used for Sentinel data in past studies related to LULC [36]. Our LULC classification approach was conducted as follows. First, we selected the pixel-based supervised classification method due to its compatibility with medium- and high-resolution remote sensing data. Second, we selected 4 machine learning algorithms, including neural networks, k-nearest neighbor, random forest, and support vector machines available in R software [65], in order to conduct pixel-based LULC classification.
We then created training samples for each of the 4 cities, comprising 2700 for Karachi, 5100 for Dhaka, 2250 for Mumbai, and 3450 for Colombo. We then produced LULC maps for the year 2019 using all 4 selected machine learning algorithms for each of the 4 R software cities. The overall accuracy and kappa statistics of the LULC maps produced using each of the 4 machine learning algorithms were then compared for each city. Finally, the LULC maps produced from the neural network algorithm were selected for Mumbai, Karachi, and Dhaka, while the support vector machine algorithm maps were selected for Colombo.
2.4.3. Post-Classification
After selecting the LULC maps for each city, we conducted post-classification refinement of the maps to correct errors from the pixel-based method. This was because the pixel-based classification method had certain limitations, such as the “salt and pepper effect” [66]. We applied approaches, such as overlaying the classified maps with ancillary data (i.e., Google Earth Imagery, topographic maps) and visual interpretation [67], in order to determine misclassified areas. We then applied majority filters (8 by 8) and the hybrid classification method to remove misclassification errors [14]. This method has been used in previous research to enhance classification results [14,68,69].
2.4.4. Accuracy Assessment
The accuracy assessment was conducted to determine the correctness of the LULC maps produced in this study. We used a stratified random sampling method to generate 500 random points in each city and examined them using Google Earth imagery as the ground truth reference. The capture dates for the Google Earth imagery used were close to or simultaneous with the LULC maps (2019). The data obtained from comparisons between the reference and actual points were then used to compute the user’s accuracy, producer’s accuracy, and overall accuracy for each LULC map using a confusion matrix [70,71].
2.5. Gradient Analysis
Previous studies have demonstrated the aptness of gradient analysis to capture the spatial distribution of the LULC dynamics from the city center to rural areas [14,72,73]. This study applied a gradient analysis using concentric rings or zones around the city center suitable for cities with single-core growth patterns [74]. The selected 4 cities in this study are based on the single-core concept.
The sea area for each city was eliminated, as these were too varied across the 4 cities for comparative analysis. We then extracted the LULC information in each city’s buffer zone. Afterward, each buffer zone’s total area was calculated, and the proportion of each LULC class was then computed on the basis of its land area in the buffer zone.
2.6. Spatial Metrics
Spatial metrics have been widely used in a variety of fields of study [3,53,74,75]. The spatial metrics used in this study were selected on the basis of previous studies. As this study is focused on the urbanization of the 4 cities, the spatial metrics analysis was focused on the built-up LULC class. Table 3 shows the 3 landscape-level and 5 class-level metrics selected and used to evaluate the dominance, composition, complexity, fragmentation, and connectivity of the urban areas for each city.
The three-landscape metrics were (i) landscape shape index (LSI), (ii) contagion index (CONTAG), and (iii) Shannon’s diversity index (SHDI), and the 5 class-level metrics (focused on the built-up class only) were (i) percentage of landscape (PLAND), (ii) path density (PD), (iii) mean patch size (Area_MN), (iv) area-weighted mean patch fractal dimension (Frac_AM), and (v) mean Euclidean nearest neighbor distance (ENN_MN). All the above-mentioned metrics were calculated using FRAGSTATS 4.2 software by employing the eight-cell neighbor rule. More details related to the above-mentioned spatial metrics can be found in McGarigal et al. [76].
2.7. Grid-based Analysis
Previous studies have widely used the grid-based method to show the spatial distribution of the selected LULC categories [6]. This study used a 500 × 500 m2 grid-based method to extract the built-up density’s spatial distribution in each city using 5 main steps. First, we created a ‘fishnet’ function in the ArcGIS software. Second, the grid content with portions of the sea was eliminated. Third, we selected and used grids with land areas covering at least 50% of the total grid size for further analysis. Fourth, the built-up areas were extracted for the four cities and overlaid with the selected grids. Finally, the percentage of built-up area was calculated in each grid for the 4 cities.
The population map (100 m) was overlaid with the 500 × 500 m2, and the mean population of each grid was extracted in each city. Lastly, statistical analysis was performed using 2 variables, such as the built-up density and mean population derived from the grid-based analysis.
3. Results
3.1. Accuracy Assessment Results
The accuracy assessment showed that the overall accuracy results were 93%, 86%, 92%, and 89% for Mumbai, Colombo, Karachi, and Dhaka, respectively (Table 4). A detailed error matrix for each of the four cities is provided in Appendix A (Table A1, Table A2, Table A3 and Table A4). The accuracy results showed a relatively acceptable level compared to past studies that also used Sentinel 2 data [36]. The overall accuracy of all four cities was more than the 80% recommended by [77] and was considered acceptable.
3.2. LULC Patterns
Figure 3 shows the classified LULC maps for the four South Asian cities. The results reveal interestingly varied spatial patterns of the urban areas (i.e., the built-up landscape) across the four cities. For Mumbai, the built-up areas were more concentrated around the city center and spreading toward the northern, southern, and eastern directions of the city center. The forest and green spaces for Mumbai occupied a relatively large area compared to the other cities and were predominantly located in the north and east. Mumbai’s open lands were spread throughout the city with very few spaces occupied by cropland.
Colombo’s built-up areas were predominantly located in the southern part of the city along the coastal belt spreading toward the city’s eastern part. The built-up areas were notably located away from the city center, thus exhibiting a mixed LULC class pattern. Forests and green spaces were mainly found in the northern, northeastern, eastern, and southeastern directions of the city. Open lands were relatively tiny in Colombo. The cropland area was also located away from the city center and mostly found in the city’s northeastern part.
In Karachi, the built-up area was predominantly spread toward the northern and eastern parts of the city. Karachi exhibited relatively few spaces occupied by green spaces. Karachi’s open lands were more dominant in the western, northern, and northeastern parts, while croplands were mostly located in the northwestern part. Like Mumbai, Dhaka’s built-up areas were concentrated around the city center area and spread toward the city’s northern and southeastern parts. Open lands in Dhaka were mostly found in the northeastern part adjacent to built-up areas. Compared to the other cities, Dhaka had the largest areas of croplands, which were spread throughout the city.
3.3. LULC Statistics
Table 5 shows the LULC maps’ statistics for each of the four cities in terms of the 40 × 40 km2 study area considered in this study (see Section 2.1). The results show that Mumbai’s built-up area covered 36.1%, while forest and green spaces covered the second largest space (32.0%) of the total study area. Open lands occupied 25.4%, while croplands were only 2.7% of Mumbai’s study area. In Colombo, 37.2% was occupied by built-up areas, while croplands were the second largest and occupied 34.7%. Forests and green spaces occupied 22.4%, and open lands occupied the lowest amount of space (2.8%).
In Karachi, however, open land occupied the largest area (42.0%), while built-up areas were the second largest, covering 37.1% of the total study area. Croplands in Karachi occupied 16.3%, while forest and green spaces occupied the lowest space (3.2%) of the total study area. Unlike the other cities in Dhaka, croplands occupied a large space covering 55.1% of the study area. Built-up areas were the second largest, covering 20.9%, while forests and green spaces covered only 11.7%. Open lands in Dhaka covered only 6.0% of the study area.
3.4. LULC along the Urban–Rural Gradient
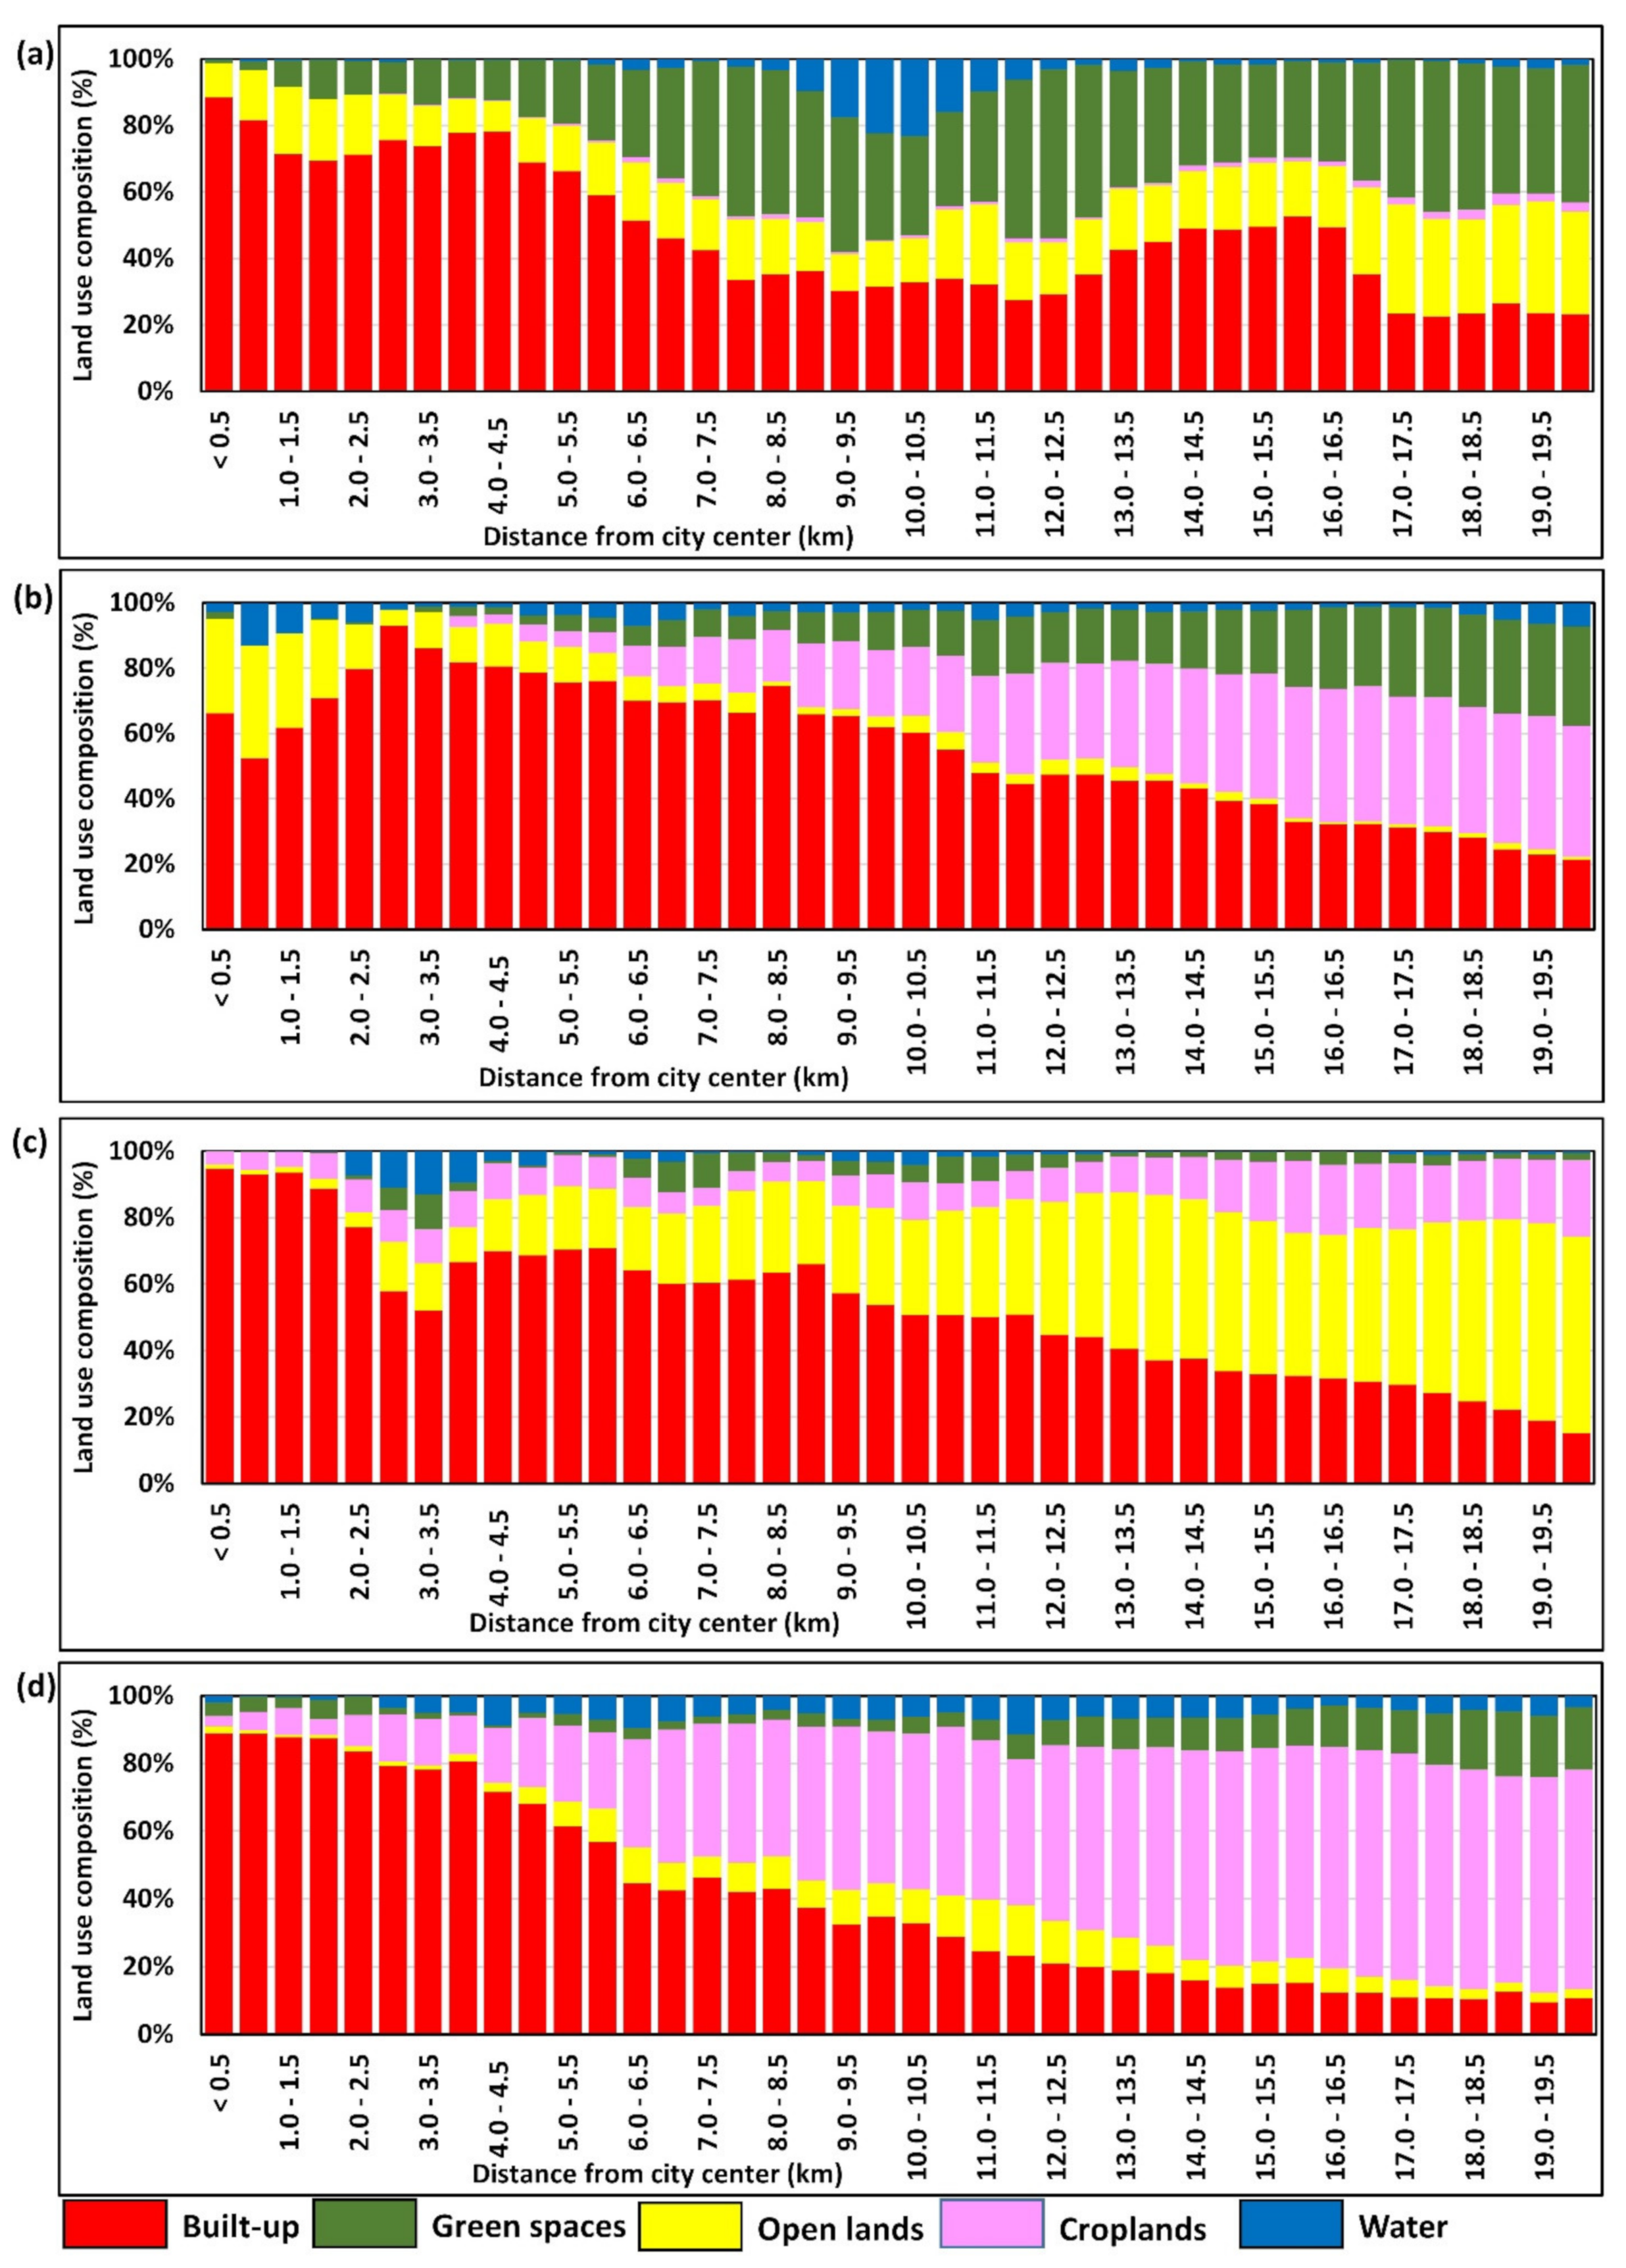
Figure 4 presents the gradient analysis results showing the percentages of the different LULC classes within each of the 500-m multiple ring buffer zones from the city center of the four cities. The results reveal that the built-up areas in Mumbai (Figure 4a) recorded the highest percentages around the city center areas (0 to 7.5 km). The green spaces also recorded considerable proportions in the 5.0 km to 20.0 km zones from the city center. The highest portion of the green spaces was recorded in the 12.0 to 12.5 km zones, with an average percentage of around 50.8% of the total LULC.
On the other hand, in Colombo (Figure 4b), the results show that the highest percentage of the built-up area was recorded around and beyond the 3.0 km zone from the city center. Apart from the built-up areas, the LULC observed around the 0 to 3 km zones were open lands occupying 25% to 35% of the distance. Croplands and green spaces were observed to increase from around the 4.0 km zone gradually. The highest percentage of croplands and green spaces was recorded around 15 to 20 km.
The results revealed that Karachi’s (Figure 4c) built-up areas were denser within a 2 km radius from the city center, with percentages ranging from 93.0% to 94.7% across the zones. The percentage of the built-up areas was observed to decrease gradually from the city center to the outside of the city. Correspondingly, open lands were observed to gradually increase from the 2 km zone to outside the city, with the highest percentages around the 13 to 20 km zones. The proportions of green spaces were very small throughout all zones (<10%).
The results further reveal that Dhaka (Figure 4d) had a somewhat similar pattern to Mumbai and Karachi’s built-up areas. Dhaka also recorded the highest percentages of the built-up areas around the city center zones (0 to 4.5 km). The green spaces were observed to increase minimally (5% to 15%) around 13 to 20 km. The croplands were observed to increase as the built-up area decreased from 6.0 km to 20 km. Although very minimal (<15%), there was a considerable proportion of open lands around 5.5 to 16.5 km.
3.5. Spatial Metrics
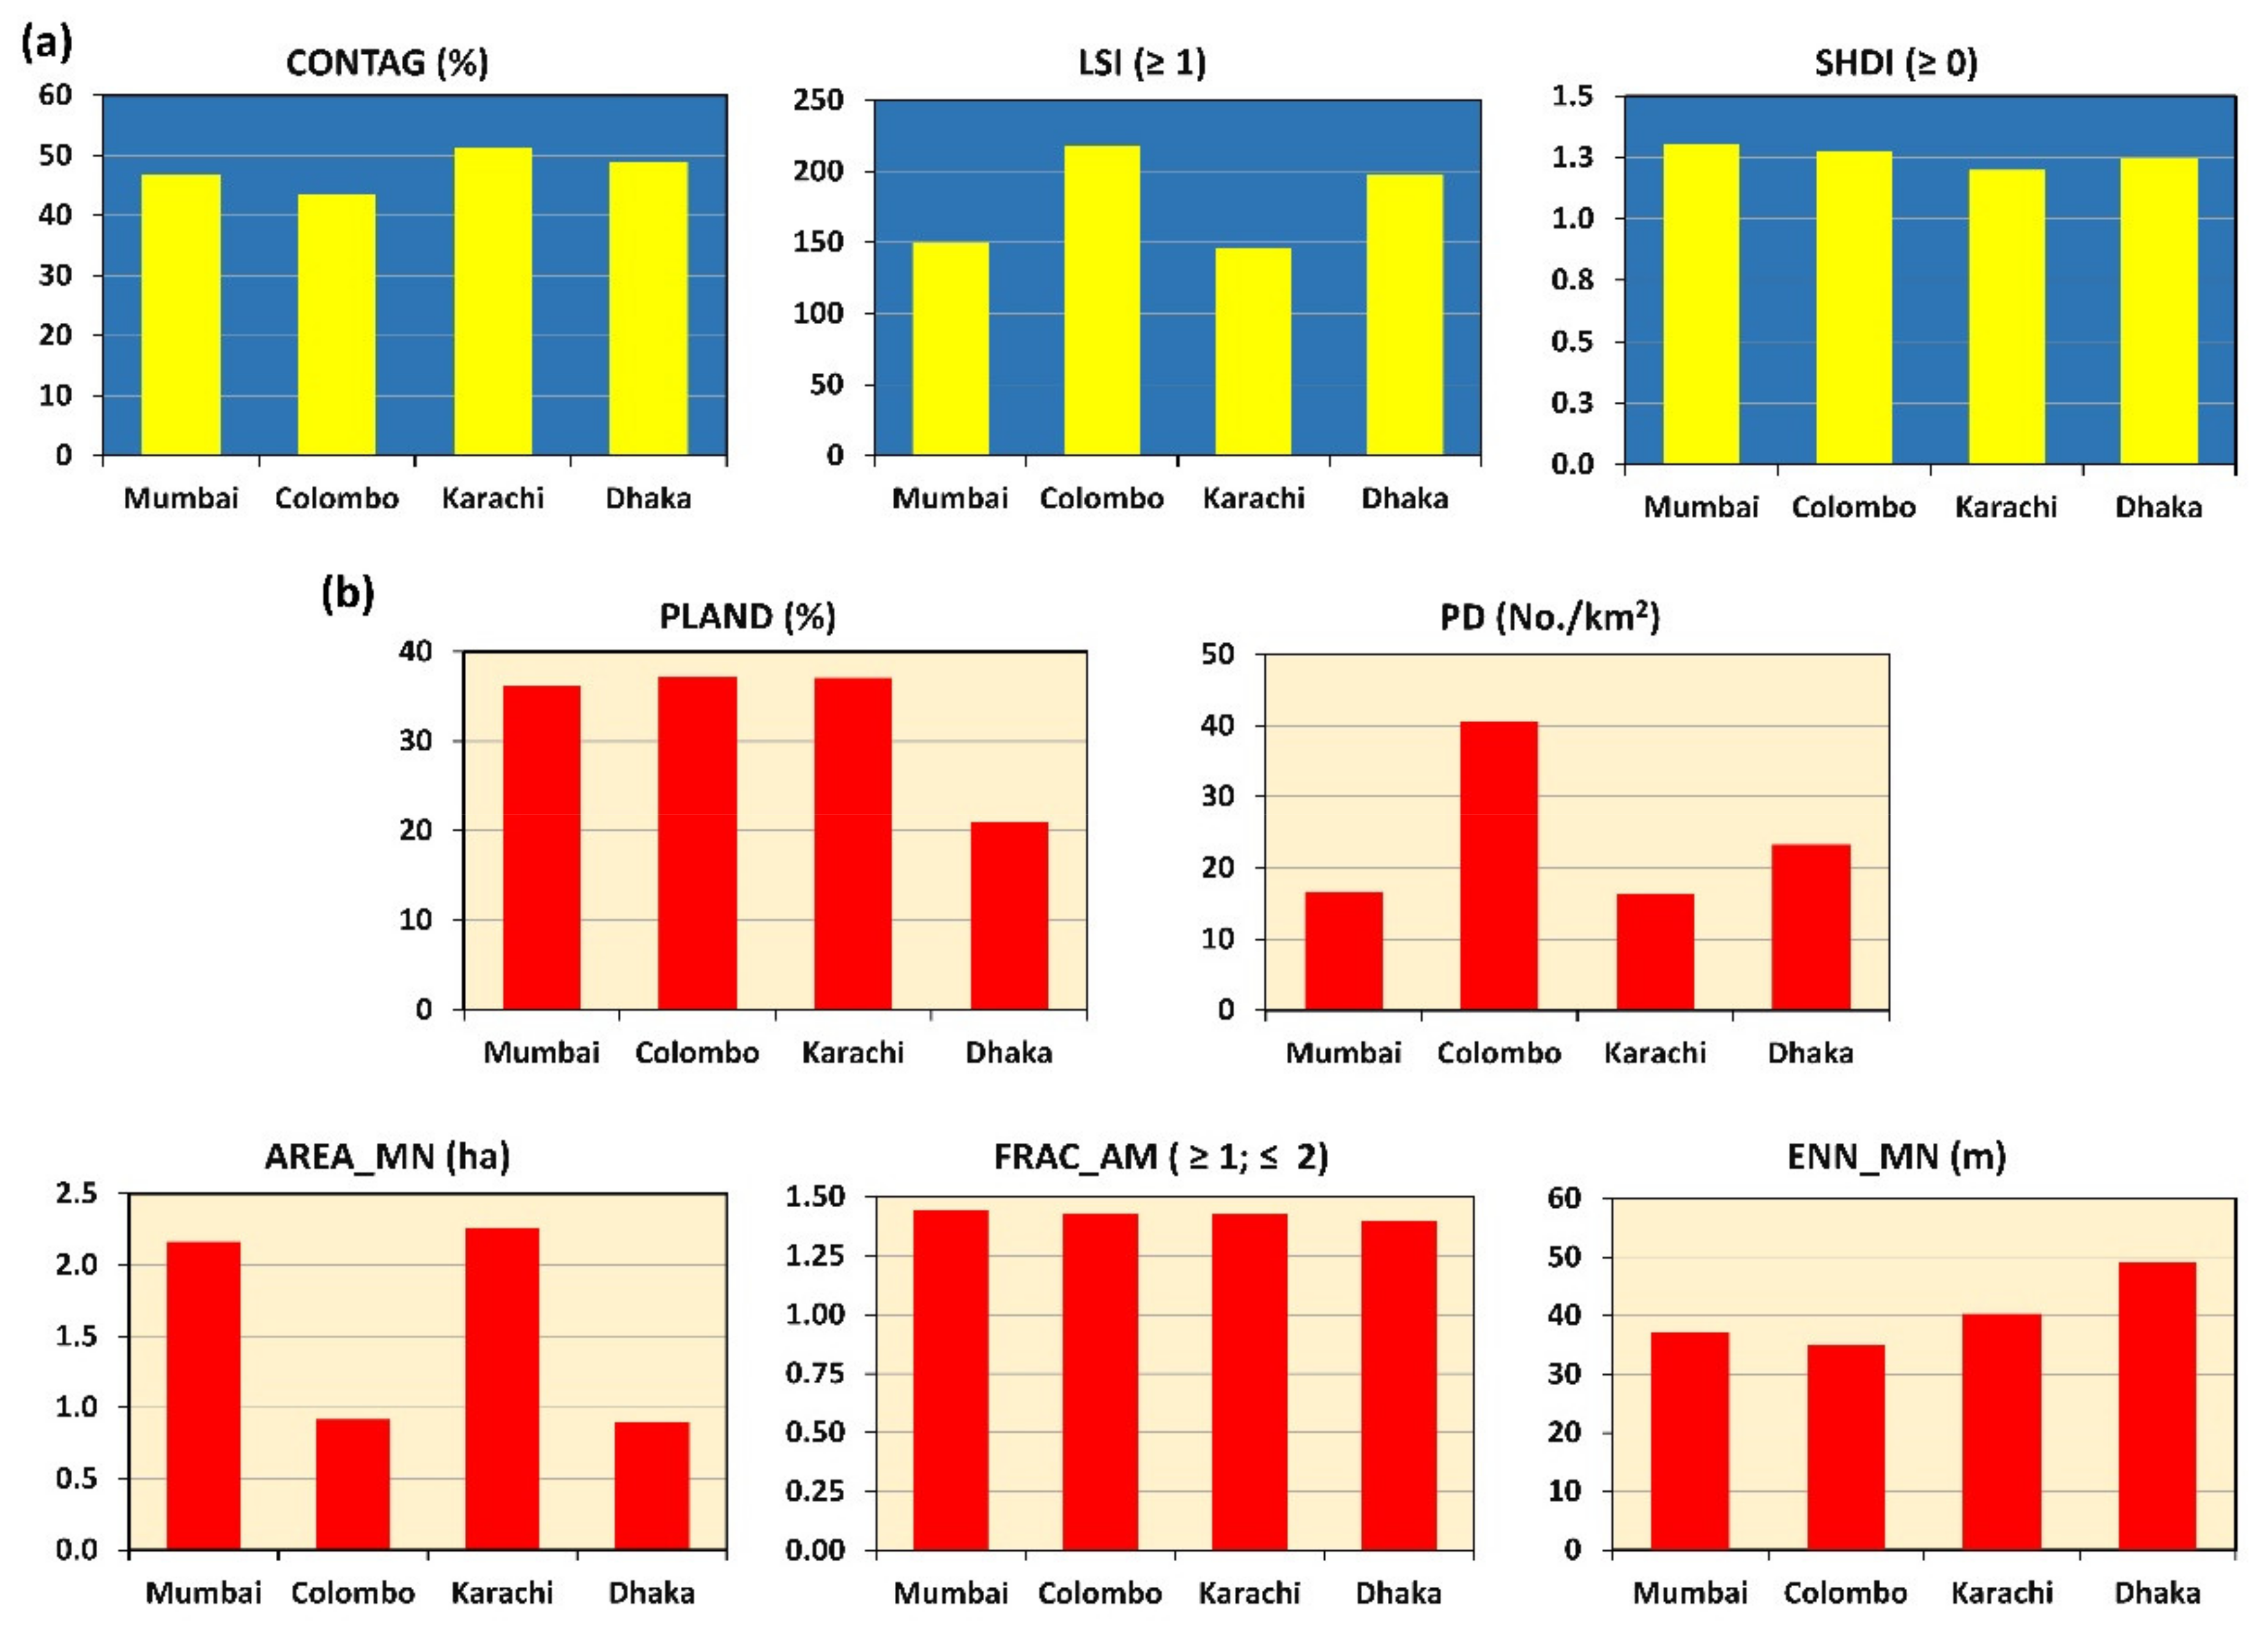
Figure 5a shows the results of the landscape-level metrics analysis. Generally, although the differences were minimal, the results show that Karachi’s urban landscape was slightly more fragmented (i.e., CONTAG) followed by Dhaka, then Mumbai, and finally Colombo. However, the Colombo landscape was more complex (i.e., LSI), followed by Dhaka, with Mumbai and Karachi having almost the same complexity. The diversity (i.e., SHDI) in all four cities was about the same.
Figure 5b shows the results of the class-level metrics analysis for the built-up class. The results show a clear dominance of the urban areas (i.e., PLAND) in all four cities. Similar to the landscape level results, the class level results indicated that Colombo’s urban land was more fragmented (i.e., PD) compared with the other three cities. Consistent with the PD results, the results further indicated that Mumbai and Karachi had bigger patches (i.e., AREA_MN) of urban footprints compared to Colombo and Dhaka. In terms of the complexity (i.e., Frac_MAM and FRAC_AM) of the urban areas, the results indicated minimal differences across the four cities.
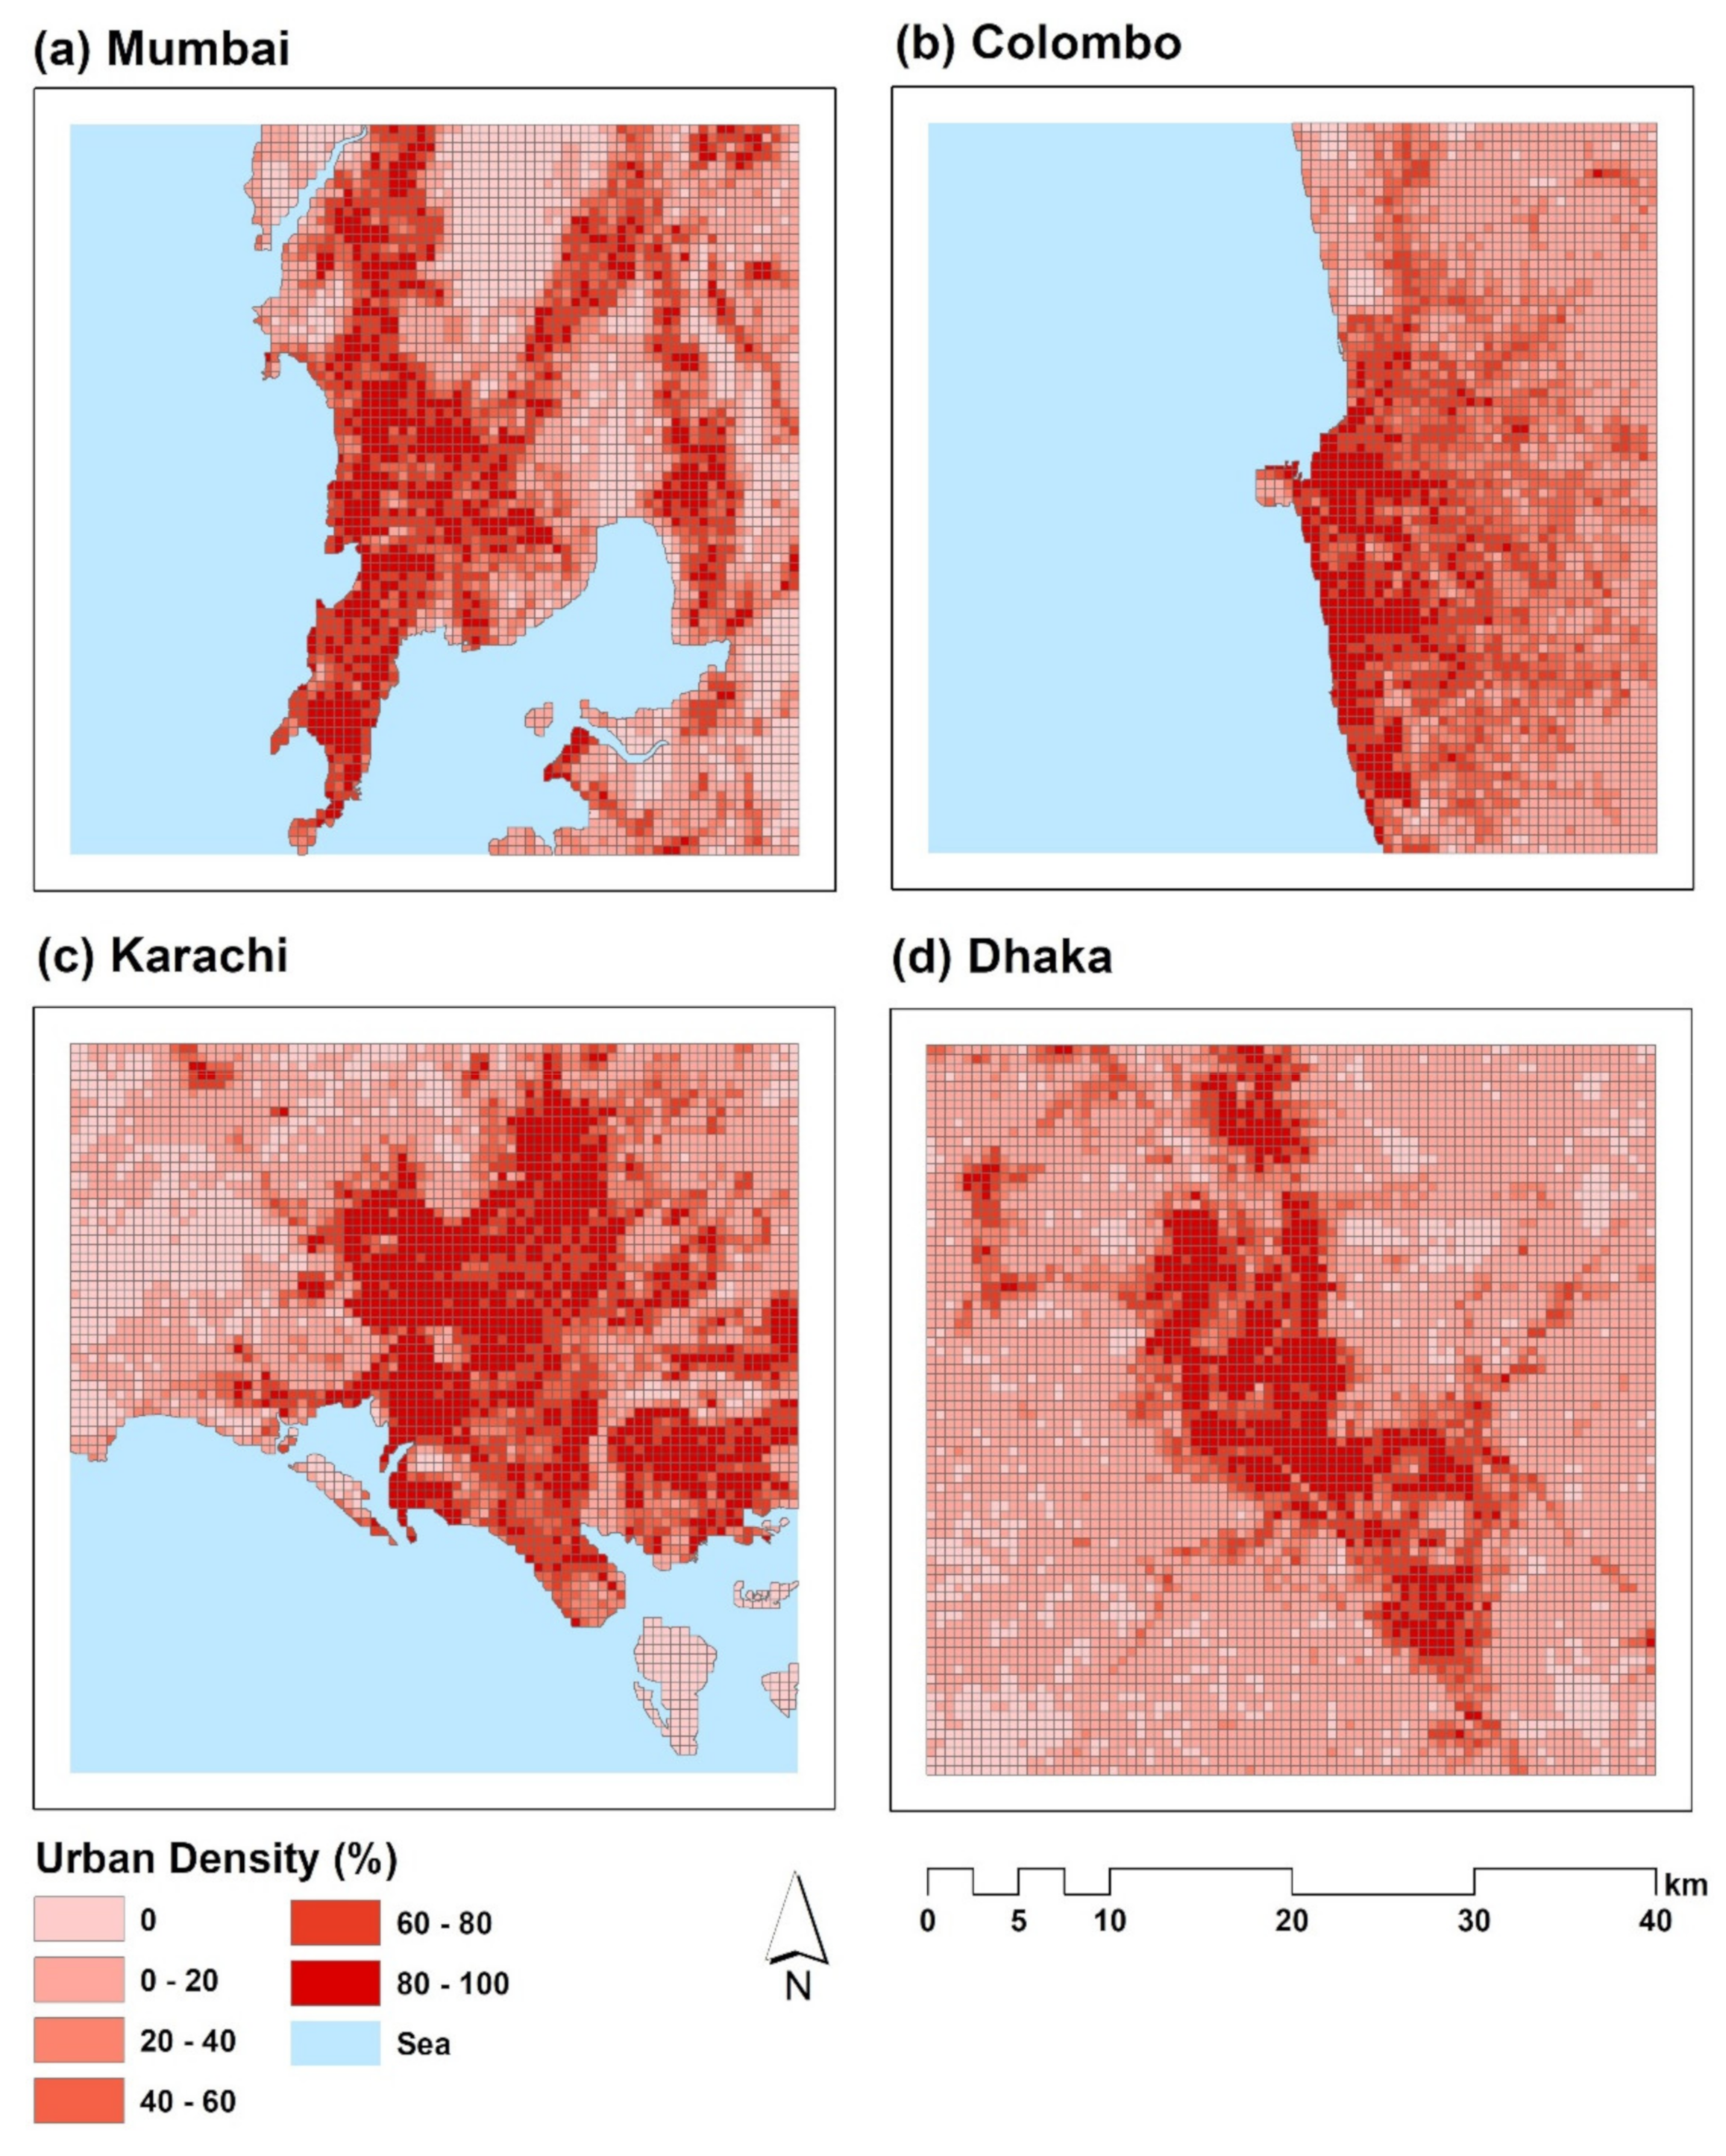
3.6. Grid-based Analysis Results
Figure 6 shows the grid-based analysis results showing the spatial pattern of the built-up density in each of the four cities. In Mumbai, high densities of built-up areas were concentrated around the city center and spread to the north and eastern directions. In Colombo, high built-up densities along the coastal line with built-up areas were observed to spread from the city center toward the southern direction. The low built-up density was located outside the city center areas. In Karachi and Dhaka, high built-up density areas were both around the city center, with low densities observed outside the center.
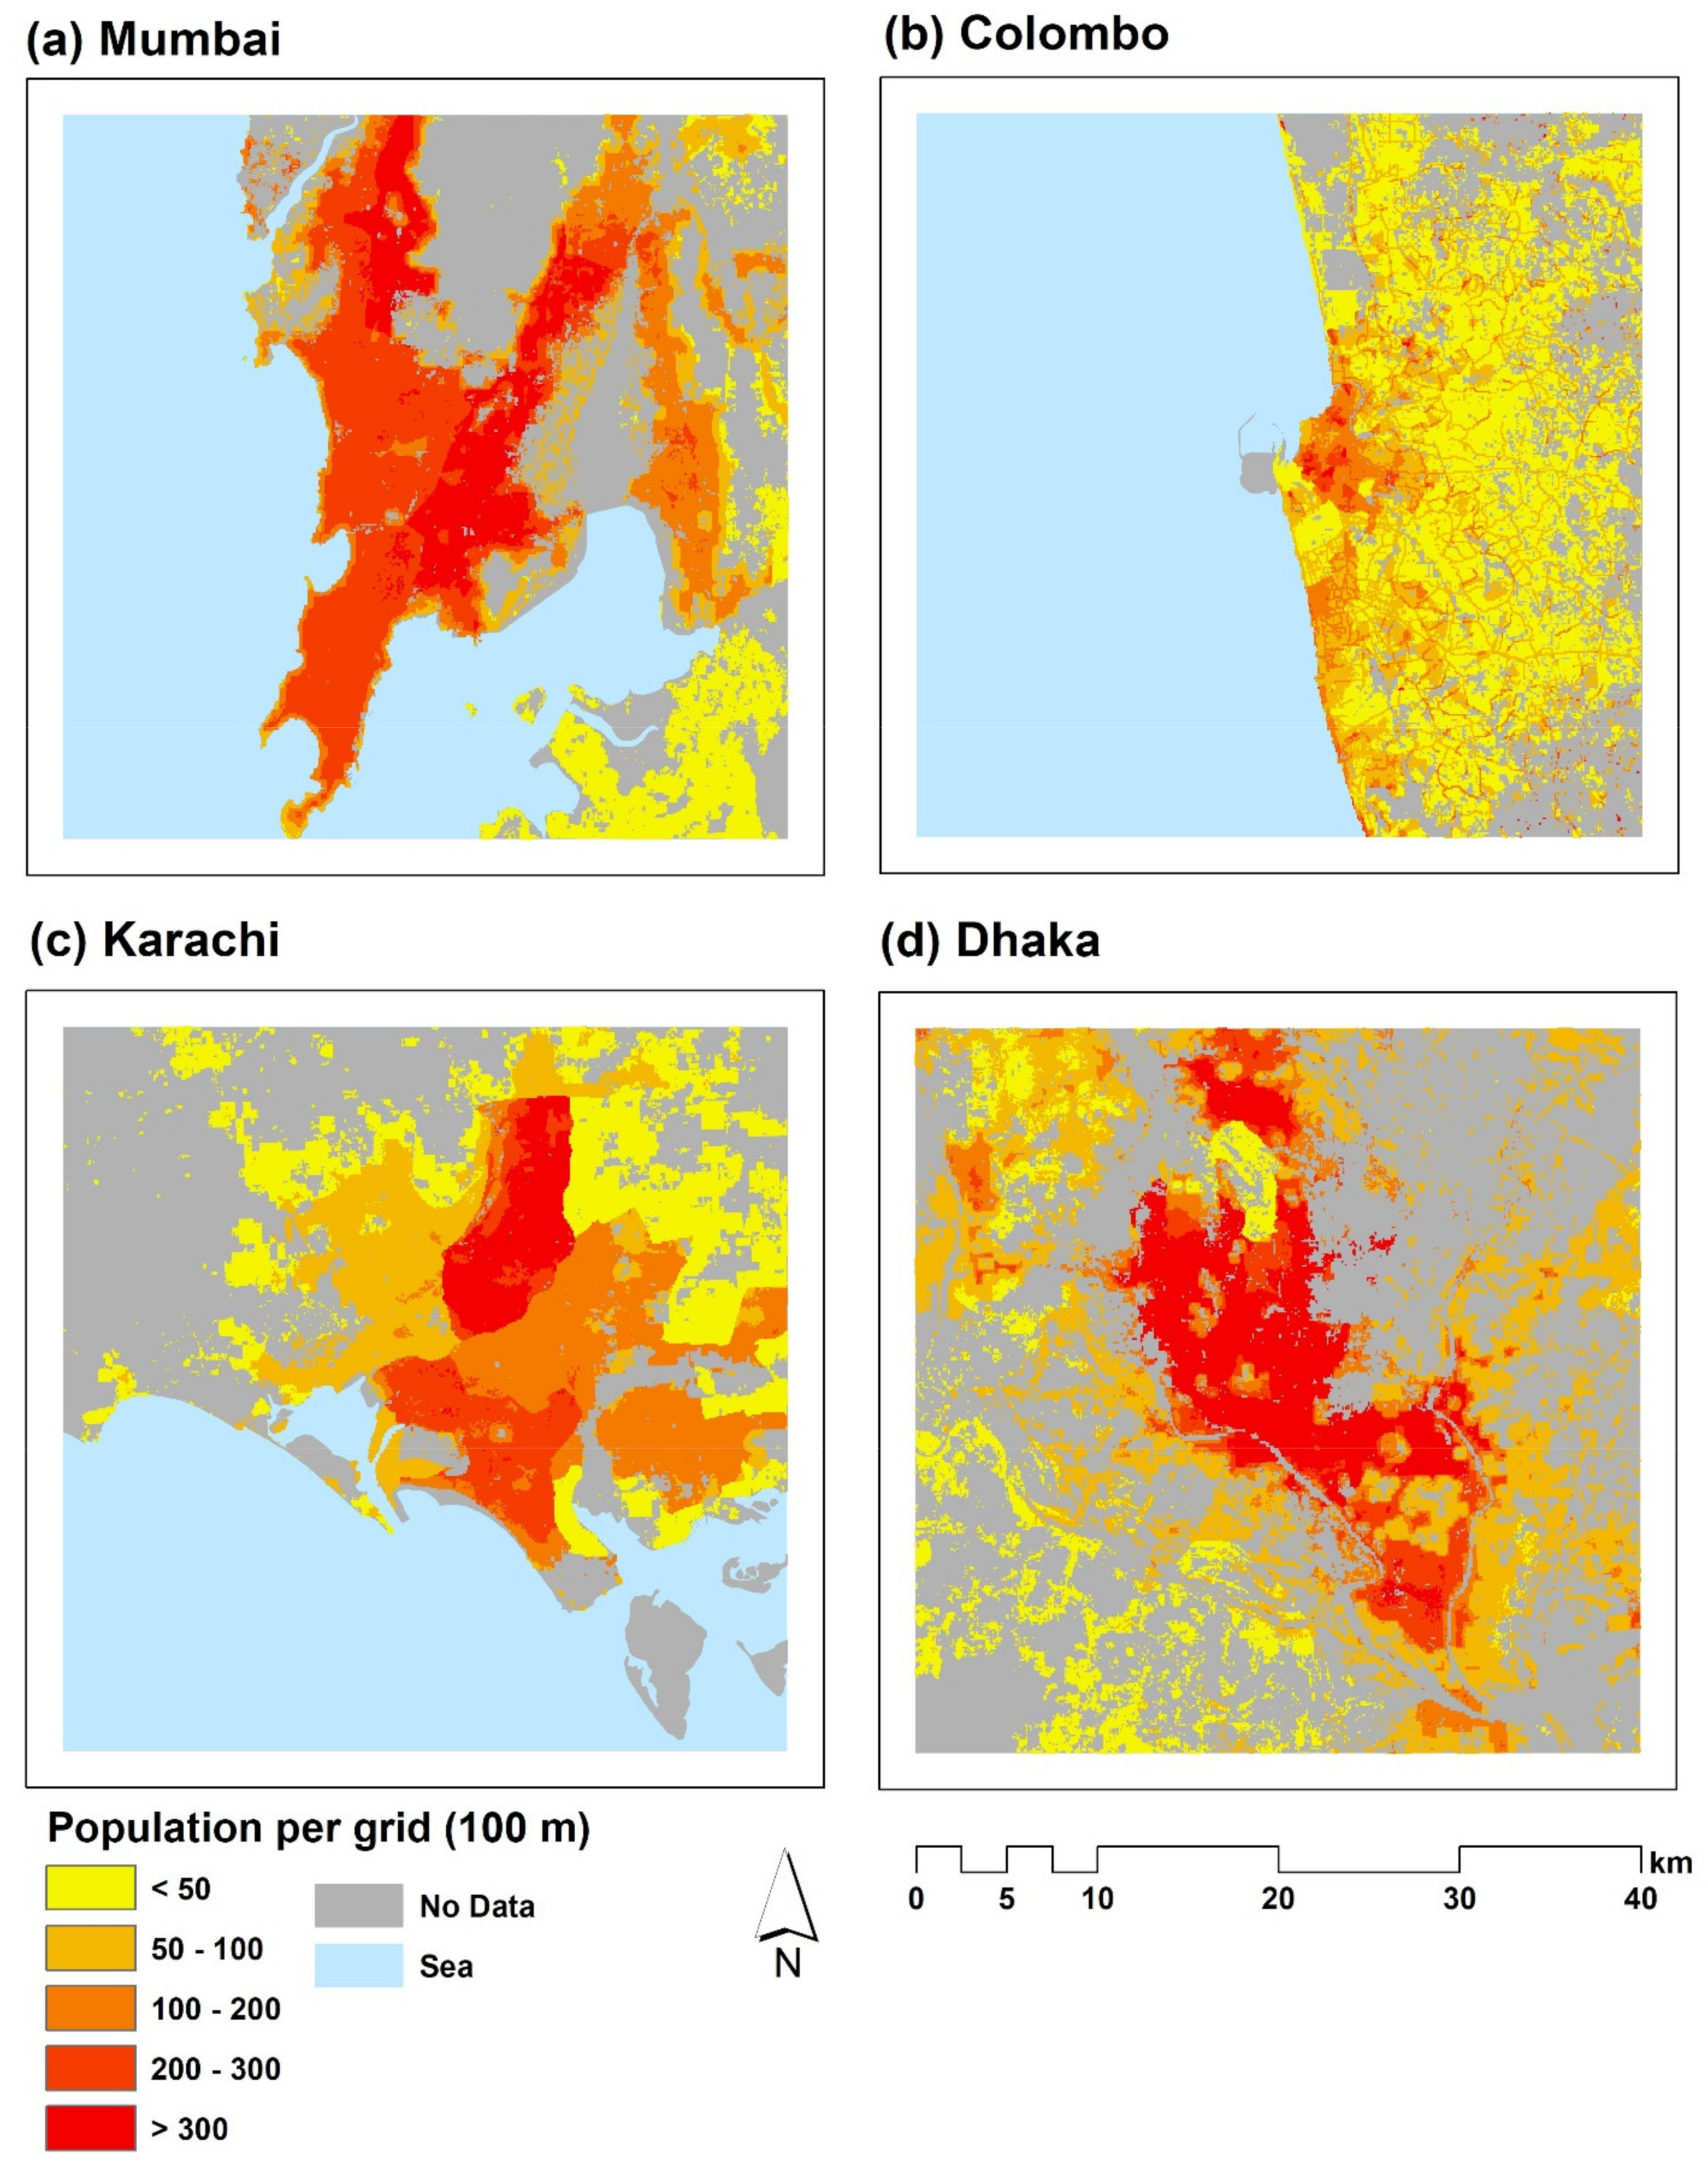
Figure 7 shows the spatial distribution of the projected population in 2020 for each of the four cities. The figure shows the estimated total number of people per grid-cell [64]. The maps show that Mumbai, Karachi, and Dhaka were highly populated cities with high populations per grid-cell. These cities had more population (>300 people per grid-cell) compared to Colombo. Colombo had a relatively very low population per grid cell.
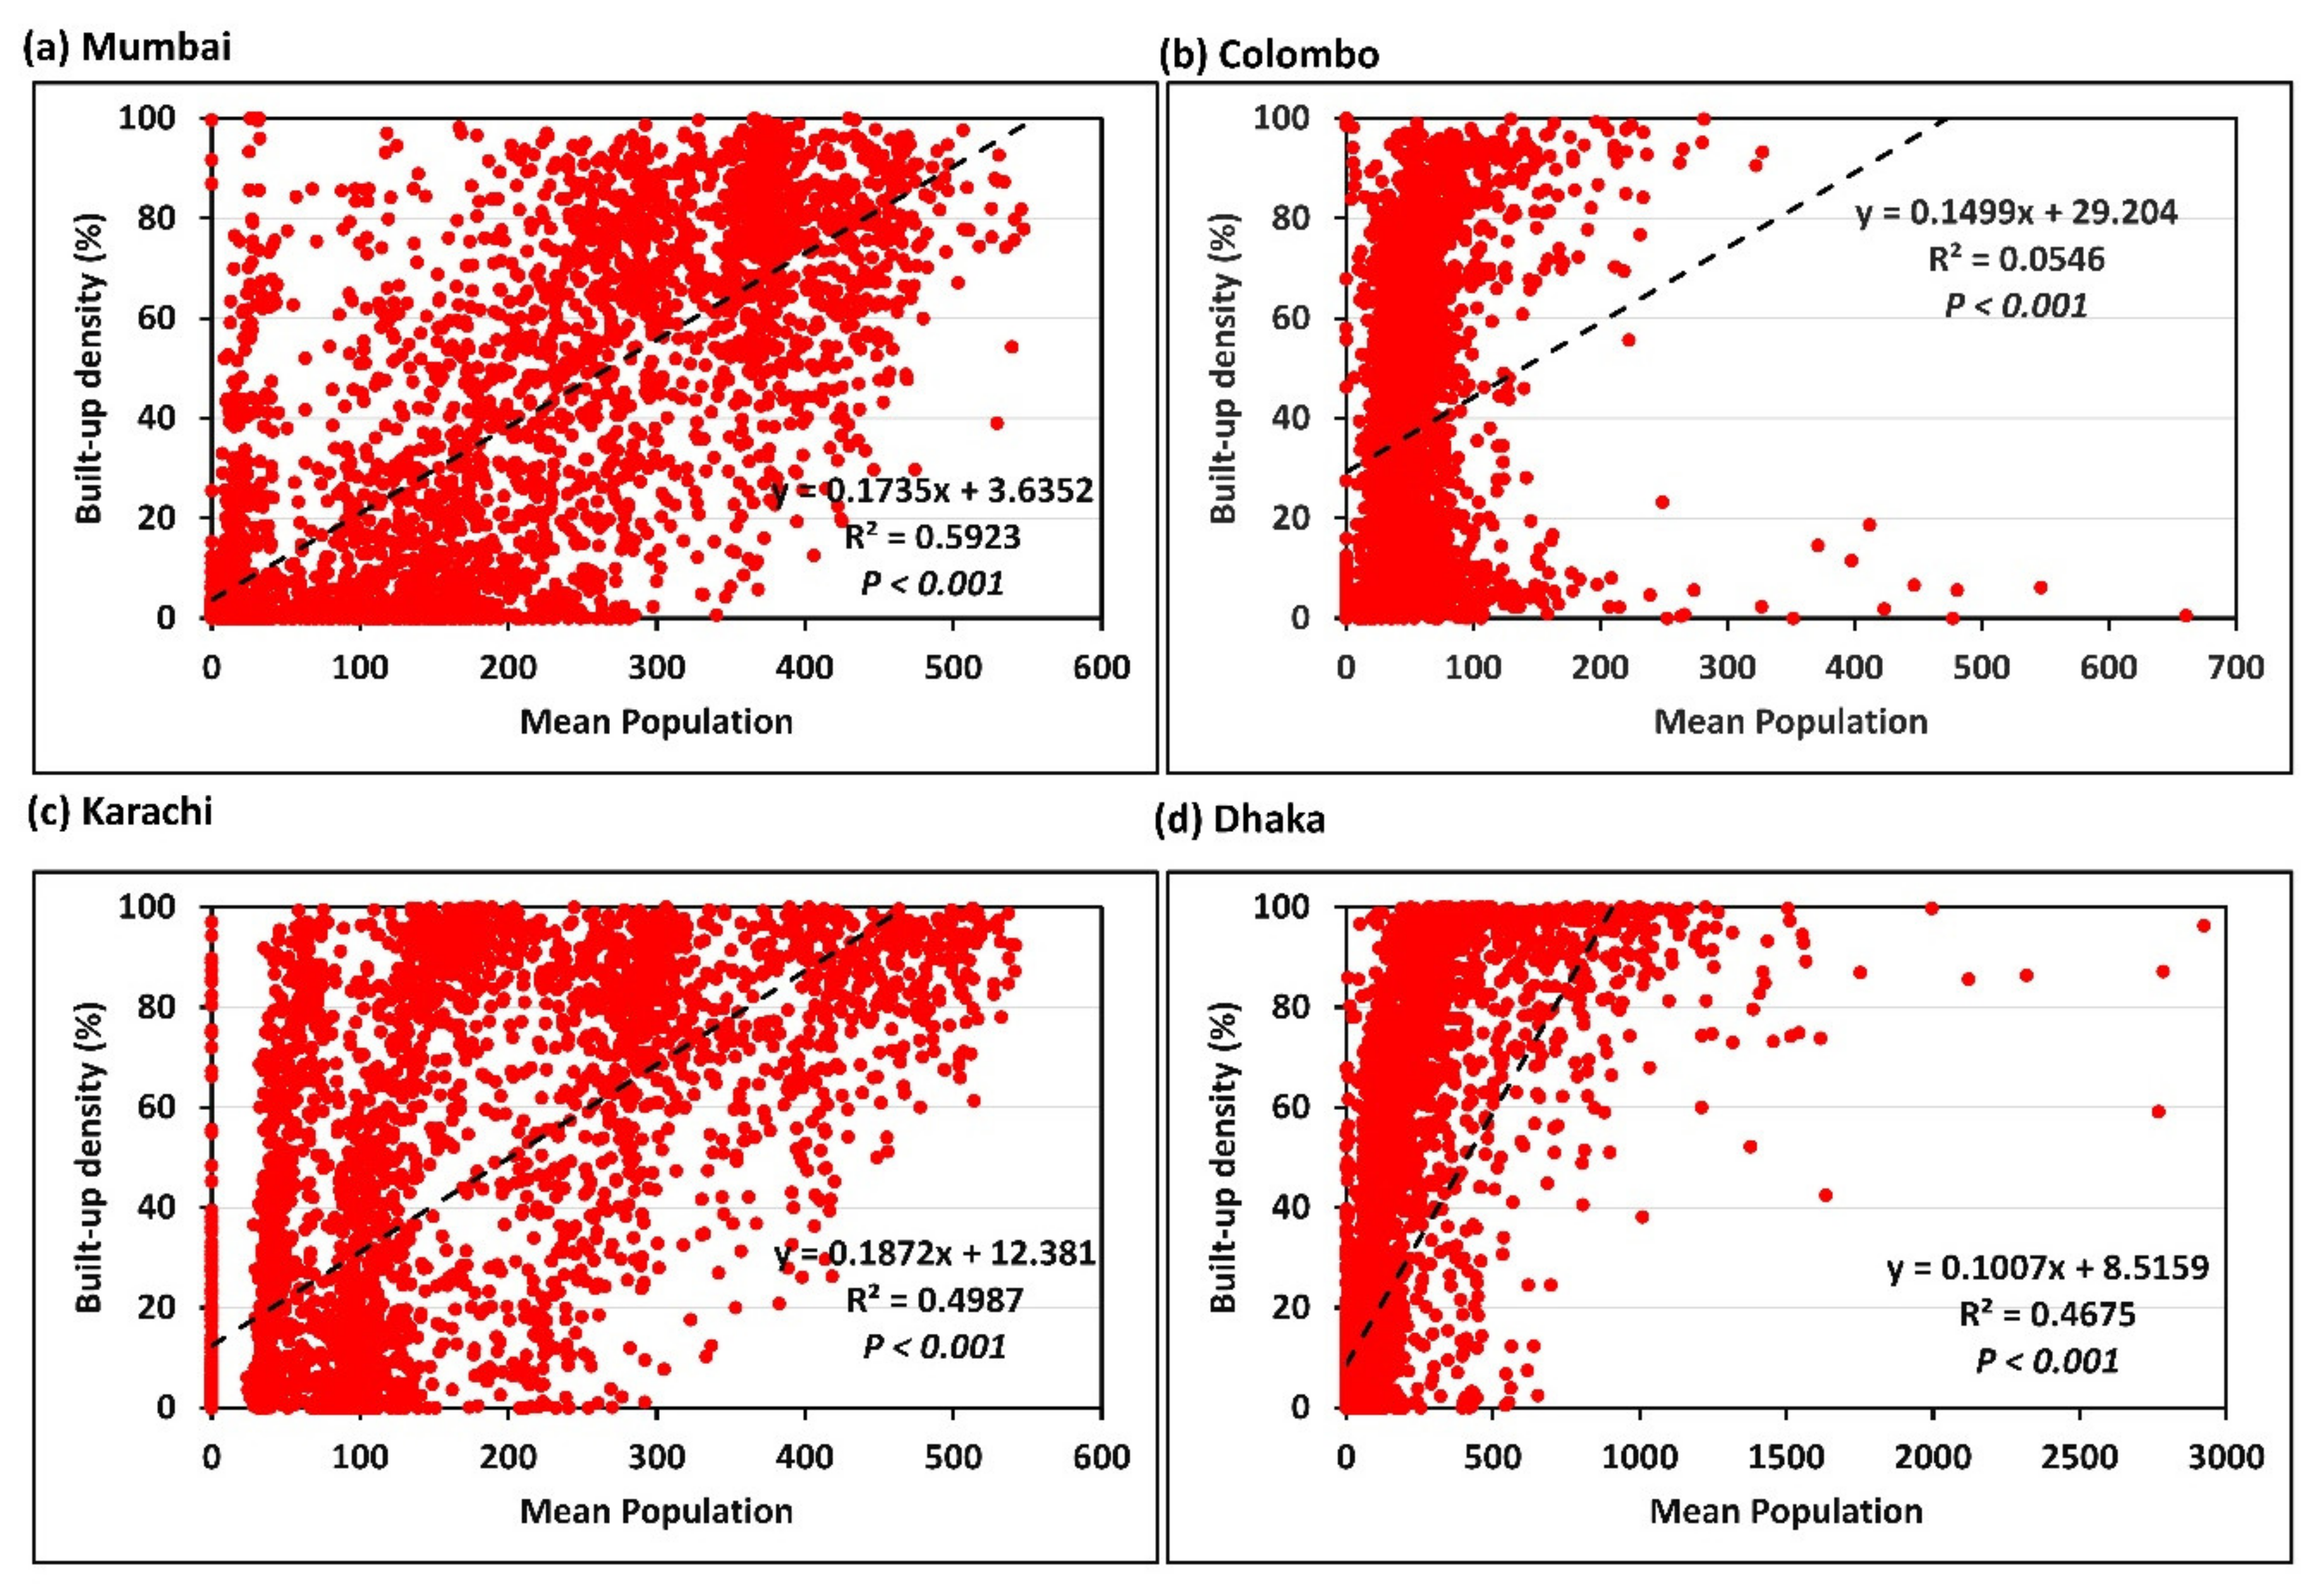
Figure 8 shows scatter plots between the mean population and built-up density in terms of the 500 m grid-cell-based analysis. The results show that the built-up density had a significant positive relationship with the mean population in all four cities. However, Colombo showed a low R2 value compared to the other three cities.
4. Discussion
4.1. Spatial Patterns of LULC
Developing countries are facing significant environmental challenges due to rapid urbanization [78]. Comparative studies aimed at monitoring LULC changes in developing countries can help improve the understanding of the urbanization patterns and their related challenges. Therefore, this study sought to comparatively examine South Asian lowland cities’ urbanization patterns, which remain uncommon. The results showed varying proportions of land utilization across the four cities.
The results reveal that Karachi had more built-up land compared to the other three cities. The built-up land for Karachi covered about 38,433.9 ha, followed by Dhaka (33,483.6 ha), Mumbai (32,688.0 ha), and lastly Colombo (27,200.9 ha). In terms of the percentage of the built-up land from the total land for each study area (i.e., 40 × 40 km2), Colombo (37.2%), Karachi (37.1%), and Mumbai (36.1%) had relatively the same percentage, while Dhaka was comparatively small (20.9%). The percentage of built-up areas in these cities provides vital information for comparing the cities’ urbanization patterns (Table 5).
The spatial patterns of urban land were also relatively varied among the four cities. Karachi’s built-up areas were predominantly spread toward the northern and eastern parts of the city. Dhaka’s built-up areas were concentrated around the city center area and spread towards the city’s northern and southeastern parts. For Mumbai, the built-up areas were also concentrated around the city center but spread toward the city center’s northern, southern, and eastern directions. Conversely, Colombo’s built-up areas were notably located away from the city center but predominantly located in the southern part of the city along the coastal belt spreading toward the city’s eastern part.
We also examined the proportion of urban green spaces in the four cities. The proportion of green spaces has become essential in balancing urban environments, particularly in managing the resulting urban heat islands (UHI) [74,79,80] from expanding in built-up lands. Rapid urban development typically occurs at the expense of green spaces converted into impervious surfaces (buildings, roads, parking lots, and others) [81]. Our results show that the green spaces of the four cities were varied.
The results show that Mumbai had the highest percentage of green spaces (31.9%), followed by Colombo (22.4%). The larger proportion of green spaces in Mumbai could be attributed to the lack of significant changes to the forests and green spaces over recent decades [17] and the Sanjay Gandhi National Pack Mangroves along the coastal belt that have helped to keep green spaces intact. Other studies have shown that rapid urban expansion in Mumbai has caused an increase in the land surface temperature (LST) and resulting in UHI [82,83,84].
The policies of Mumbai to maintain green spaces have directly influenced the observed larger portions of green areas compared to the other three cities. The per capita green space of Mumbai was 9.36 m2 in 2018. This value is higher than other developing Indian cities, such as Kolkata, Bangalore, Hyderabad, Jaipur, and Surat [85]. This value is compatible with the UN recommended standard of 9 m2 [86]. The other three cities, especially Karachi and Dhaka, need to maintain more green spaces in order to enhance urban sustainability.
Conversely, for Colombo, past research has shown rapidly declining green spaces over the last three decades [80] resulting from developmental projects undertaken to enhance the industrial and commercial sectors [79,81]. Evidence of the UHI from the increased LST levels in Colombo has also been provided from past studies [79,81]. Dhaka (11.7%) and Karachi (3.2%) demonstrated relatively small percentages of green spaces. Dhaka’s green spaces have been continuously decreasing due to the rapid urban development [34], which has also resulted in increasing the LST levels and the UHI [87,88].
Karachi, with the lowest percentage, has green spaces located along with the coastal areas. The small percentage of green spaces and large proportions of open and built-up lands has also caused an increase in the LST and the UHI in Karachi city [30]. The spatial distribution of the green spaces can be used as an essential variable to understand each city’s urban development pattern. Thus, each country’s government must pay attention to keep existing green spaces to enhance urban sustainability. Several studies have shown that the size of the green spaces in other fast urbanizing cities is an essential factor in achieving urban sustainability, particularly in mitigating UHI effects [68,74,89,90,91].
4.2. LULC along the Urban–Rural Gradient
The results also show that the LULC patterns along the urban–rural gradient varied across the four cities. The patterns of the built-up densities versus other land uses along the urban–rural gradient of the cities display the past land utilization priorities. Unlike the other three cities, Mumbai showed a considerably good mixture of built-up areas and green spaces.
Although the built-up areas were highly dense within a 7.5-km radius of Mumbai, the green spaces were also observed to increase from within a 1.5-km radius, which consistently increased along the urban–rural gradient. Open lands and croplands occupied very small spaces across the urban–rural gradient. This could indicate that Mumbai’s urban planners have taken croplands, for example, to other places with less urbanization pressure. Open spaces that could potentially be used to plant green spaces are also very minimal.
Conversely, for Colombo and Dhaka, the patterns observed indicate that the biggest land utilization has been built-up and croplands. The built-up lands were generally highly dense within a 5-km radius in both cities, while croplands were observed around the 4-km radius and consistently increased along the urban–rural gradient as the built-up lands decreased. This shows that the land utilization in Colombo and Dhaka has been focused on ensuring that food is provided for the urban dwellers. Unfortunately, urbanization and cropland expansion has occurred at the expense of green spaces, which poses a threat to these cities’ urban environmental sustainability.
These patterns are likely to continue. Subasinghe et al. (2016) [9] predicted the urban expansion of Colombo by 2050 and showed that built-up land would increase in the northern and eastern direction and eventually replacing the croplands. The central area of Colombo has also become denser, and existing natural/opens land, also observed in this study, will be converted to built-up lands due to the rapid developments in the future [9].
Similarly, other studies have shown that the croplands in Dhaka city have decreased from 1990 [88] and will continue. The lowland areas in Dhaka have also become more vulnerable to the conversion as built-up areas due to the rapid development of real-estate agencies engaging in land development activities [88].
In Karachi, on the other hand, the major land uses along the urban–rural gradient are built-up lands, while most of the areas have been left as open lands. Previous studies demonstrated continuously increasing built-up land from 2009 to 2017 in Karachi [29]. Croplands and green spaces are also very minimal. While Karachi indicates that the only major land use that is likely going to increase across the urban–rural gradient is the built-areas, large proportions of open lands could enhance the green spaces and improve the balance in the Karachi urban environment.
Despite the variations in the urbanization patterns, this study revealed that, in all the four lowland cities considered, urbanization will continue increasing at the expense of green spaces and croplands as well as the remaining open land, which poses a threat to urban sustainability. Simultaneously, there is a need to pay strict attention to real estate companies’ activities in all four cities. For example, it has become common to fill lowland areas (paddy and wetland) due to high land values near Dhaka’s city areas [92] and Colombo.
The policy planners need to focus on the city areas’ zoning and on implementing effective laws to avoid illegal landfilling and developments. The comparison of each zone along the urban–rural gradients of each city in this study can help to visualize the present LULC patterns for city planners in the future to introduce proper zone planning that is in line with sustainable utilization of their respective landscapes.
4.3. Urban Landscape Configurations
This study used spatial metrics to evaluate each city’s urban areas’ dominance, composition, complexity, fragmentation, and connectivity. Since this study is focused on the urbanization of the four cities, the spatial metrics analysis was focused on the built-up LULC class. The results show a clear dominance of the urban areas (i.e., PLAND) in all four cities. This is providing evidence of rapidly urbanizing landscapes in all four cities.
The diversity (i.e., SHDI) of the urban landscape in all four cities was more or less the same. This could be attributed to the built-land expansion concentrated on the coastal line leaving much land for fragmented expansion inwards. This is in agreement with the findings of [9]. Colombo had relatively more small and dispersed patches. The Colombo landscape fragmentation resulted from road system development that was undertaken to minimize travel times from suburbs to the city center area [9]. This encouraged people to move to suburban areas, resulting in more land fragmentation.
Karachi had the lowest fragmentation but with more contiguous patches displaying a more aggregated spatial pattern of the built-up areas. On the other hand, Dhaka showed high land fragmentation compared to Karachi and Mumbai. The fragmentation in Dhaka could result from the mixed configurations of the croplands, open lands, and green spaces. Wetland, cultivated lands, and vegetation lands near built-up lands were reported to display high fragmentation [89].
Accordingly, the results indicated that Mumbai and Karachi had bigger patches of urban footprints compared to Colombo and Dhaka. In terms of future urban planning, this indicates that Mumbai and Karachi should consider integrating the remaining green spaces and/or open lands as the built-up areas are filled. Colombo and Dhaka can utilize the spaces around and within the fragmented urban landscapes to integrate more green spaces for sustainable urban development.
4.4. Influence of Population for Urbanization
The development of urban landscapes is directly linked to the population distribution [17]. In this study, the relationship between the built-up density and population was statistically analyzed on the basis of a 500 × 500 m grid in four cities. The results indicate that, in all four cities, the population and built-up density had a significant positive relationship. The R2 values recorded for the four cities were 0.59, 0.49, 0.46, and 0.05 for Mumbai, Karachi, Dhaka, and Colombo, respectively (Figure 8).
Colombo showed a low R2 value due to the low population distribution relative to the other three cities. Mumbai, Dhaka, and Karachi are megacities with very large populations of more than 10 million people. However, Colombo has only millions of people and a relatively lower population compared with the other three cities. The population’s influence on urbanization might be low in Colombo; however, other factors have contributed to Colombo’s urbanization.
Thus, we recommend future research to focus on capturing the driving factors of urbanization in Colombo. Population growth has been one of the main driving forces in all four cities’ rapid development, mainly from rural–urban migration. Rural–urban migration has resulted from several factors, including economic development, educational and employment opportunities, and a better standard of living.
The population of South Asian cities has been increasing rapidly over the past few decades. Mumbai’s population was reported to have increased from about 16.1 million to 20.0 million from 2000 to 2018, respectively, with an annual growth rate of 1.2% [55]. By 2018, Mumbai was recorded as the seventh-largest city by population [55]. Karachi’s population has been reported to have increased from an estimated 9.8 million in 2000 to 15.4 million in 2018 [55], translating into an annual growth rate of 2.43% per annum [30].
Dhaka’s population has been reported to have increased from an estimated 10.2 million in 2000 and 19.6 million in 2018, growing at 3.6% per annum [55]. Dhaka is reported to be the world’s ninth largest city by 2018 [55]. However, Colombo’s population is relatively small. The Colombo metropolitan population has also increased from 3.47 million to 3.70 million from 2001 to 2012, respectively, and is currently estimated at 5.6 million [9].
4.5. Urbanization Related Issues and Future Challenges
Urban environmental changes are becoming hot topics at the local, regional, and global levels due to the environmental damages from rapid urbanization [78]. The capture of urbanization patterns can help to enhance urban sustainability. A sustainable city can be achieved by balancing environmental protection, economic development, and social well-being [93]. The selected four cities play a significant role in their respective countries as they all are economic and commercial centers.
The high population concentration and rapid urban development in these cities have brought several environmental problems in each city. The city areas have become more attractive for urban developments, and more natural lands have continuously become vulnerable to conversion into built-up areas. The following recommendations can be considered for issues related to urbanization and its future challenges in these four cities and beyond.
Decreasing urban green spaces: Past studies have shown that rapid urban development caused a decline in the green spaces in all four cities, namely, Colombo [81], Mumbai [17], Karachi [94], and Dhaka [87]. The green spaces of all four cities are becoming more vulnerable to conversion into built-up lands in the future. Thus, policymakers need to focus on enhancing the green cover, especially in the urban areas close to the city centers. The planners can consider enhancing the green corridors, green roofs, green walls, city areas, and urban landscape to optimize a mixed balance of green spaces and impervious surfaces. Future policymakers can also consider green concepts for these cities’ future development activities and other rapidly developing cities in South Asia.
UHI effects: The UHI effect is also an important topic in future urban planning. UHIs are considered a byproduct of rapid urbanization. Past research showed that all four cities are becoming UHI-vulnerable cities [30,79,84,95]. There are several advanced impacts associated with UHIs, such as increasing energy consumption; ground-level ozone; air pollutants; greenhouse gases; increasing mortality rates; weakening living environments; impaired water quality; compromised human health and comfort; and heat stress for human, animals, and plants [96,97]. Studies have shown that UHI-vulnerable areas grow wider from city centers to rural areas due to rapid urbanization [10]. Thus, city governments and urban planners must pay real attention to reducing UHI effects to achieve urban sustainability in the four cities.
Flood: Flooding in urban areas is another large problem in lowland cities in developing countries, such as the cities in this study regarding floods resulting from high-intensity rainfall patterns. Urban areas have increasingly become vulnerable to flooding, and losses of human lives, animals, and property have been recorded. Flood disasters and their related damages have become severe in all four cities (see for details regarding Mumbai [18,19,98,99], Colombo [100,101,102], Karachi [103], and Dhaka [104]). Rapid urban development has damaged the natural drainage systems creating blocks. At the same time, lowland areas have experienced landfilling.
Future urban planning should minimize flood damage, and more attention should be directed toward developing drainage systems. Policymakers need to prepare flood hazard, vulnerability, and risk maps to reduce the flood damage in each city. Urban policymakers, disaster management agencies, and researchers need to cooperate to enhance flood-related assessments. It is better to introduce effective real-time flood warning systems to enhance the residents’ knowledge to reduce damages.
Energy, utilities, infrastructure, and transportation: Efficient infrastructure and utilities are becoming vital to enhance the city communities’ living conditions [78]. In the past few decades, the four cities’ infrastructure has increased due to rapid urban development. However, this has brought several challenges for future urban planning. Traffic congestion is one of the challenges that must be managed. Evidence of traffic congestion issues has been provided in previous studies for Mumbai [105], Colombo [106], Dhaka [107], and Karachi [108]. Traffic-related challenges have led to the loss of billions of dollars and human working hours during rush hours.
Thus, future urban policy should focus on reducing travel time within the cities, especially around the city center where business operations are located. At the same time, public transport systems need to be enhanced. This will help to reduce the number of private vehicles entering city areas. Simultaneously, real-time traffic monitoring systems can be used as an essential source to provide alternative roads to the drivers. Long-term infrastructure policy must be implemented to maintain sustainability for people living in city areas.
Alternative sources of energy should be considered to minimize the usage of fuel-related energy. Renewable energy provides a cleaner healthy environment and less air pollution and reduces greenhouse gas emissions [78]. All four cities have a greater chance of enhancing solar power systems as an alternative energy source due to their location in a tropical climate area. Firm policies need to be implemented to enhance the use of solar power in urban areas.
Land, air, and water pollution: Urbanization always provides significant advanced impacts on land, air, and water pollution in urban areas due to unplanned urban development. These four cities have relatively more pollution compared to other cities within their respective countries. [109]. Air pollution is mainly due to vehicle operations, energy generation, and industry in the four cities [109]. Land pollution is mainly due to the waste gathered from industry and domestic usage.
Water pollution is mainly due to industrial operations, and there are no proper mechanisms for water treatment before release to the natural water bodies. Therefore, future urban planning must focus on reducing all related pollution in the four cities. Then, policymakers and urban planners need to pay more attention to reducing the urban area pollution to enhance the residents’ quality of life. The policies, laws, and orders need to be firm on implementation to reduce pollution—mainly from industries.
As mentioned above, we listed certain critical sectors to focus on in future urban planning. The central governments, provincial governments, local governments, and city planning authorities need to pay attention to producing policies by considering population projections and LULC scenarios. All related implementation should align with “goal 11: Make cities and human settlements inclusive, safe, resilient, and sustainable” of the sustainable development goals [54].
5. Conclusions
In this study, we sought to comparatively examine the urbanization patterns of the South Asian lowland cities Mumbai, Colombo, Karachi, and Dhaka by using Sentinel-2 images to capture the LULC dynamics. The study revealed that Mumbai, Karachi, and Dhaka had larger built-up or urban landscapes compared with Colombo. The results show that Mumbai had the highest percentage of green spaces, followed by Colombo.
Dhaka and Karachi had relatively small percentages of green spaces. Colombo and Dhaka had more croplands, which consistently increased along the urban–rural gradient compared to Mumbai and Karachi. Karachi shows that the only major land use was built-up areas, while most areas have been left as open lands. On the other hand, Colombo’s urban setup was more fragmented than the other three cities. Mumbai and Karachi had larger patches of urban footprints compared to Colombo and Dhaka.
The Sentinel images played a significant role in capturing the four cities’ urbanization patterns. The analysis methods employed, including grid-based, landscape metrics, and the urban–rural gradient, were also key in providing further insights into the urban development process and thus enhancing the observed urbanization patterns. Identification of the current urbanization pattern of the rapidly developing cities in South Asia will bring essential facts to the proper urban planning for future urban sustainability. We strongly recommend to urban planners and academia to study the remaining South Asian cities using Sentinel images to compare the current urbanization pattern of all cities. For this purpose, we recommend using our methodology in other similar study areas.
We further listed critical areas to focus on in future urban planning. The observed LULC pattern revealed that Mumbai and Karachi should consider integrating the remaining green spaces and/or open lands in their future urban development planning as the built-up areas are filled. Colombo and Dhaka can utilize the spaces around and within the fragmented urban landscapes to integrate green spaces for sustainable urban development.
Keeping stable green spaces in the future will be a challenging task in all cities due to rapid urban development. However, it can be done with proper urban development policies. Thus, the central governments, provincial governments, local governments, and city planning authorities must pay attention to producing policies by considering population projections and LULC scenarios. All related implementations should align with “goal 11: Make cities and human settlements inclusive, safe, resilient, and sustainable” of the sustainable development goals.
Author Contributions
The author to receive correspondence, M.R., proposed the topic and spearheaded the data processing and analysis, as well as the writing of the manuscript; T.M., M.S., and Y.M. helped to edit the manuscript. All authors have read and agreed to the published version of the manuscript.
Funding
This study was partly supported by the JSPS grant 19F19305 (2019-21) and 18H00763 (2018-20).
Institutional Review Board Statement
Not applicable.
Informed Consent Statement
Not applicable.
Data Availability Statement
Not applicable.
Acknowledgments
The authors are grateful to the European Space Agency for providing the Sentinel-2 data sent used in this study, and anonymous reviewers and editors for their helpful comments and suggestions to improve the quality of this paper.
Conflicts of Interest
The authors declare no conflict of interest.
Appendix A

Table A1.
Error matrix for the classified land use/cover map of Mumbai.
| Classified Data | Reference Data | ||||||
|---|---|---|---|---|---|---|---|
| Open Lands | Built-up | Croplands | Green Spaces | Water | Total | User’s Accuracy (%) | |
| Open lands | 121 | 7 | 1 | 1 | 0 | 130 | 93.1 |
| Built-up | 6 | 167 | 0 | 1 | 0 | 174 | 96.0 |
| Croplands | 4 | 0 | 11 | 0 | 0 | 15 | 73.3 |
| Green spaces | 6 | 4 | 2 | 150 | 0 | 162 | 92.6 |
| Water | 0 | 1 | 0 | 0 | 18 | 19 | 94.7 |
| Total | 137 | 179 | 14 | 152 | 18 | 500 | |
| Producer’s Accuracy (%) | 88.3 | 93.3 | 78.6 | 98.7 | 100.0 | ||
Overall Accuracy (%) = 93%.
Table A2.
Error matrix for the classified land use/cover map of Colombo.
| Classified Data | Reference Data | ||||||
|---|---|---|---|---|---|---|---|
| Open Lands | Built-up | Croplands | Green Spaces | Water | Total | User’s Accuracy (%) | |
| Open lands | 12 | 1 | 0 | 2 | 0 | 15 | 80.0 |
| Built-up | 1 | 181 | 1 | 2 | 1 | 186 | 97.3 |
| Croplands | 2 | 25 | 125 | 20 | 1 | 173 | 72.3 |
| Green spaces | 0 | 0 | 11 | 101 | 0 | 112 | 90.2 |
| Water | 0 | 0 | 0 | 1 | 13 | 14 | 92.9 |
| Total | 15 | 207 | 137 | 126 | 15 | 500 | |
| Producer’s Accuracy (%) | 80.0 | 87.4 | 91.2 | 80.2 | 86.7 | ||
Overall Accuracy (%) = 86%.
Table A3.
Error matrix for the classified land use/cover map of Karachi.
| Classified Data | Reference Data | ||||||
|---|---|---|---|---|---|---|---|
| Open Lands | Built-up | Croplands | Green Spaces | Water | Total | User’s Accuracy (%) | |
| Open lands | 205 | 4 | 1 | 0 | 0 | 210 | 97.6 |
| Built-up | 5 | 178 | 0 | 0 | 0 | 183 | 97.3 |
| Croplands | 14 | 11 | 55 | 1 | 0 | 81 | 67.9 |
| Green spaces | 0 | 0 | 1 | 15 | 0 | 16 | 93.8 |
| Water | 1 | 0 | 0 | 0 | 9 | 10 | 90.0 |
| Total | 225 | 193 | 57 | 16 | 9 | 500 | |
| Producer’s Accuracy (%) | 91.1 | 92.2 | 96.5 | 93.8 | 100.0 | ||
Overall Accuracy (%) = 92%.
Table A4.
Error matrix for the classified land use/cover map of Dhaka.
| Classified Data | Reference Data | ||||||
|---|---|---|---|---|---|---|---|
| Open Lands | Built-up | Croplands | Green Spaces | Water | Total | User’s Accuracy (%) | |
| Open lands | 28 | 0 | 1 | 1 | 0 | 30 | 93.3 |
| Built-up | 1 | 100 | 1 | 2 | 1 | 105 | 95.2 |
| Croplands | 6 | 19 | 238 | 9 | 4 | 276 | 86.2 |
| Green spaces | 0 | 0 | 9 | 49 | 0 | 58 | 84.5 |
| Water | 0 | 0 | 0 | 0 | 31 | 31 | 100.0 |
| Total | 35 | 119 | 249 | 61 | 36 | 500 | |
| Producer’s Accuracy (%) | 80.0 | 84.0 | 95.6 | 80.3 | 86.1 | ||
Overall Accuracy (%) = 89%.
References
- United Nations. World Urbanization Prospects 2018; United Nations: New York, NY, USA, 2018. [Google Scholar]
- National Geographic. Urbanization Causes and Impacts. Available online: https://www.nationalgeographic.com/environment/habitats/urban-threats/ (accessed on 12 November 2020).
- Hou, H.; Wang, R.; Murayama, Y. Scenario-based modelling for urban sustainability focusing on changes in cropland under rapid urbanization: A case study of Hangzhou from 1990 to 2035. Sci. Total Environ. 2019, 661, 422–431. [Google Scholar] [CrossRef]
- Alphan, H. Land-use change and urbanization of Adana, Turkey. Land Degrad. Dev. 2003, 14, 575–586. [Google Scholar] [CrossRef]
- Demissie, F.; Yeshitila, K.; Kindu, M.; Schneider, T. Land use/land cover changes and their causes in Libokemkem District of South Gonder, Ethiopia. Remote Sens. Appl. Soc. Environ. 2017, 8, 224–230. [Google Scholar] [CrossRef]
- Hou, H.; Estoque, R.C.; Murayama, Y. Spatiotemporal analysis of urban growth in three African capital cities: A grid-cell-based analysis using remote sensing data. J. Afr. Earth Sci. 2016, 123, 381–391. [Google Scholar] [CrossRef]
- Bagan, H.; Yamagata, Y. Land-cover change analysis in 50 global cities by using a combination of Landsat data and analysis of grid cells. Environ. Res. Lett. 2014, 9, 2000–2010. [Google Scholar] [CrossRef]
- Phiri, D.; Morgenroth, J. Developments in Landsat land cover classification methods: A review. Remote Sens. 2017, 9, 967. [Google Scholar] [CrossRef] [Green Version]
- Subasinghe, S.; Estoque, R.C.; Murayama, Y. Spatiotemporal analysis of urban growth using GIS and remote sensing: A case study of the Colombo Metropolitan Area, Sri Lanka. Int. J. Geo-Inf. 2016, 5, 197. [Google Scholar] [CrossRef] [Green Version]
- Ranagalage, M.; Dissanayake, D.; Murayama, Y.; Zhang, X.; Estoque, R.C.; Perera, E.; Morimoto, T. Quantifying surface urban heat island formation in the World Heritage Tropical Mountain City of Sri Lanka. ISPRS Int. J. Geo-Inf. 2018, 7, 341. [Google Scholar] [CrossRef] [Green Version]
- Dissanayake, D.; Morimoto, T.; Murayama, Y.; Ranagalage, M.; Perera, E. Analysis of life quality in a tropical mountain city using a multi-criteria geospatial technique: A case study of Kandy City, Sri Lanka. Sustainability 2020, 12, 2918. [Google Scholar] [CrossRef] [Green Version]
- Dissanayake, D.; Morimoto, T.; Ranagalage, M.; Murayama, Y. Land-use/land-cover changes and their impact on surface urban heat islands: Case study of Kandy City, Sri Lanka. Climate 2019, 7, 99. [Google Scholar] [CrossRef] [Green Version]
- Ranagalage, M.; Murayama, Y.; Dissanayake, D.; Simwanda, M. The impacts of landscape changes on annual mean land surface temperature in the tropical mountain city of Sri Lanka: A case study of Nuwara Eliya (1996–2017). Sustainability 2019, 11, 5517. [Google Scholar] [CrossRef] [Green Version]
- Ranagalage, M.; Wang, R.; Gunarathna, M.H.J.P.; Dissanayake, D.; Murayama, Y.; Simwanda, M. Spatial forecasting of the landscape in rapidly urbanizing hill stations of South Asia: A case study of Nuwara Eliya, Sri Lanka (1996–2037). Remote Sens. 2019, 11, 1743. [Google Scholar] [CrossRef] [Green Version]
- Ranagalage, M.; Ratnayake, S.S.; Dissanayake, D.; Kumar, L.; Wickremasinghe, H.; Vidanagama, J.; Cho, H.; Udagedara, S.; Jha, K.K.; Simwanda, M.; et al. Spatiotemporal variation of urban heat islands for implementing nature-based solutions: A case study of Kurunegala, Sri Lanka. ISPRS Int. J. Geo-Inf. 2020, 9, 461. [Google Scholar] [CrossRef]
- Dissanayake, D. Land use change and its impacts on land surface temperature in Galle City, Sri Lanka. Climate 2020, 8, 65. [Google Scholar] [CrossRef]
- Moghadam, H.S.; Helbich, M. Spatiotemporal urbanization processes in the megacity of Mumbai, India: A Markov chains-cellular automata urban growth model. Appl. Geogr. 2013, 40, 140–149. [Google Scholar] [CrossRef]
- Kamini, J.; Jayanthi, S.C.; Raghavswamy, V. Spatio-temporal analysis of land use in urban Mumbai-using multi-sensor satellite data and GIS techniques. J. Indian Soc. Remote Sens. 2006, 34, 385–396. [Google Scholar] [CrossRef]
- Zope, P.E.; Eldho, T.I.; Jothiprakash, V. Impacts of urbanization on flooding of a coastal urban catchment: A case study of Mumbai City, India. Nat. Hazards 2015, 75, 887–908. [Google Scholar] [CrossRef]
- Sultana, S.; Satyanarayana, A.N.V. Assessment of urbanisation and urban heat island intensities using landsat imageries during 2000–2018 over a sub-tropical Indian City. Sustain. Cities Soc. 2020, 52, 1–14. [Google Scholar] [CrossRef]
- Naikoo, M.W.; Rihan, M.; Ishtiaque, M. Analyses of land use land cover (LULC) change and built-up expansion in the suburb of a metropolitan city: Spatio-temporal analysis of Delhi NCR using landsat datasets. J. Urban Manag. 2020, 9, 347–359. [Google Scholar] [CrossRef]
- Ramachandra, T.V.; Bharath, A.H.; Sowmyashree, M.V. Monitoring urbanization and its implications in a mega city from space: Spatiotemporal patterns and its indicators. J. Environ. Manag. 2015, 148, 67–81. [Google Scholar] [CrossRef]
- Verma, R.; Kundapura, S. Urban Weighted Green Index—A study of urban green space in relation to Land Surface Temperature for Lucknow city, India. Remote Sens. Appl. Soc. Environ. 2020, 20, 100429. [Google Scholar] [CrossRef]
- Singh, P.; Kikon, N.; Verma, P. Impact of land use change and urbanization on urban heat island in Lucknow city, Central India. A remote sensing based estimate. Sustain. Cities Soc. 2017, 32, 100–114. [Google Scholar] [CrossRef]
- Shukla, A.; Jain, K. Analyzing the impact of changing landscape pattern and dynamics on land surface temperature of Lucknow city, India. Urban For. Urban Green. 2020, 58, 126877. [Google Scholar] [CrossRef]
- Mohanta, K.; Sharma, L.K. Assessing the impacts of urbanization on the thermal environment of Ranchi City (India) using geospatial technology. Remote Sens. Appl. Soc. Environ. 2017, 8, 54–63. [Google Scholar] [CrossRef]
- Gohain, K.J.; Mohammad, P.; Goswami, A. Assessing the impact of land use land cover changes on land surface temperature over Pune city, India. Quat. Int. 2021, 575–576, 259–269. [Google Scholar] [CrossRef]
- Sahana, M.; Hong, H.; Sajjad, H. Analyzing urban spatial patterns and trend of urban growth using urban sprawl matrix: A study on Kolkata urban agglomeration, India. Sci. Total Environ. 2018, 628–629, 1557–1566. [Google Scholar] [CrossRef]
- Butt, A.; Shabbir, R.; Ahmad, S.S.; Aziz, N. Land use change mapping and analysis using Remote Sensing and GIS: A case study of Simly watershed, Islamabad, Pakistan. Egypt. J. Remote Sens. Space Sci. 2015, 18, 251–259. [Google Scholar] [CrossRef] [Green Version]
- Rizvi, S.H.; Fatima, H.; Iqbal, M.J.; Alam, K. The effect of urbanization on the intensification of SUHIs: Analysis by LULC on Karachi. J. Atmos. Solar-Terr. Phys. 2020, 207, 105374. [Google Scholar] [CrossRef]
- Akhtar, M.; Zhao, Y.; Gao, G.; Gulzar, Q. Regional sustainability assessment of ecosystem services value in response to prevailing and future land use/cover changes in Lahore, Pakistan. Reg. Sustain. 2020, 1, 37–47. [Google Scholar] [CrossRef]
- Roy, S.; Pandit, S.; Eva, E.A.; Bagmar, M.S.H.; Papia, M.; Banik, L.; Dube, T.; Rahman, F.; Razi, M.A. Examining the nexus between land surface temperature and urban growth in Chattogram Metropolitan Area of Bangladesh using long term Landsat series data. Urban Clim. 2020, 32, 100593. [Google Scholar] [CrossRef]
- Dewan, A.M.; Yamaguchi, Y. Land use and land cover change in Greater Dhaka, Bangladesh: Using remote sensing to promote sustainable urbanization. Appl. Geogr. 2009, 29, 390–401. [Google Scholar] [CrossRef]
- Dewan, A.M.; Yamaguchi, Y. Using remote sensing and GIS to detect and monitor land use and land cover change in Dhaka Metropolitan of Bangladesh during 1960–2005. Environ. Monit. Assess. 2009, 150, 237–249. [Google Scholar] [CrossRef] [PubMed]
- Thapa, R.B.; Murayama, Y. Examining spatiotemporal urbanization patterns in Kathmandu Valley, Nepal: Remote sensing and spatial metrics approaches. Remote Sens. 2009, 1, 534–556. [Google Scholar] [CrossRef] [Green Version]
- Phiri, D.; Simwanda, M.; Salekin, S.; Nyirenda, V.R.; Murayama, Y.; Ranagalage, M. Sentinel-2 Data for Land Cover/Use Mapping: A Review. Remote Sens. 2020, 12, 2291. [Google Scholar] [CrossRef]
- ESA Sentinel-2-Missions-Sentinel Online. Available online: https://sentinel.esa.int/web/sentinel/missions/sentinel-2 (accessed on 17 November 2020).
- Malenovský, Z.; Rott, H.; Cihlar, J.; Schaepman, M.E.; García-Santos, G.; Fernandes, R.; Berger, M. Sentinels for science: Potential of Sentinel-1, -2, and -3 missions for scientific observations of ocean, cryosphere, and land. Remote Sens. Environ. 2012, 120, 91–101. [Google Scholar] [CrossRef]
- Korhonen, L.; Hadi; Packalen, P.; Rautiainen, M. Comparison of Sentinel-2 and Landsat 8 in the estimation of boreal forest canopy cover and leaf area index. Remote Sens. Environ. 2017, 195, 259–274. [Google Scholar] [CrossRef]
- Immitzer, M.; Vuolo, F.; Atzberger, C. First experience with Sentinel-2 data for crop and tree species classifications in central Europe. Remote Sens. 2016, 8, 166. [Google Scholar] [CrossRef]
- Sánchez-Espinosa, A.; Schröder, C. Land use and land cover mapping in wetlands one step closer to the ground: Sentinel-2 versus landsat 8. J. Environ. Manag. 2019, 247, 484–498. [Google Scholar] [CrossRef] [PubMed]
- Castillo, E.B.; Cayo, E.Y.T.; De Almeida, C.M.; López, R.S.; Briceño, N.B.R.; López, J.O.S.; Gurbillón, M.Á.B.; Oliva, M.; Espinoza-Villar, R. Monitoring wildfires in the northeastern peruvian amazon using landsat-8 and sentinel-2 imagery in the GEE platform. ISPRS Int. J. Geo-Inf. 2020, 9, 564. [Google Scholar] [CrossRef]
- Xu, F.; Li, Z.; Zhang, S.; Huang, N.; Quan, Z.; Zhang, W.; Liu, X.; Jiang, X.; Pan, J.; Prishchepov, A.V. Mapping winter wheat with combinations of temporally aggregated Sentinel-2 and Landsat-8 data in Shandong Province, China. Remote Sens. 2020, 12, 2065. [Google Scholar] [CrossRef]
- Hu, L.; Xu, N.; Liang, J.; Li, Z.; Chen, L.; Zhao, F. Advancing the mapping of mangrove forests at national-scale using Sentinel-1 and Sentinel-2 time-series data with Google Earth Engine: A case study in China. Remote Sens. 2020, 12, 3120. [Google Scholar] [CrossRef]
- Steinhausen, M.J.; Wagner, P.D.; Narasimhan, B.; Waske, B. Combining Sentinel-1 and Sentinel-2 data for improved land use and land cover mapping of monsoon regions. Int. J. Appl. Earth Obs. Geoinf. 2018, 73, 595–604. [Google Scholar] [CrossRef]
- Hunt, M.L.; Blackburn, G.A.; Carrasco, L.; Redhead, J.W.; Rowland, C.S. High resolution wheat yield mapping using Sentinel-2. Remote Sens. Environ. 2019, 233, 111410. [Google Scholar] [CrossRef]
- Foresman, T.W.; Pickett, S.T.A.; Zipperer, W.C. Methods for spatial and temporal land use and land cover assessment for urban ecosystems and application in the greater Baltimore-Chesapeake region. Urban Ecosyst. 1997, 1, 201–216. [Google Scholar] [CrossRef]
- Long, H.; Wu, X.; Wang, W.; Dong, G. Analysis of urban-rural land-use change during 1995-2006 and its policy dimensional driving forces in Chongqing, China. Sensors 2008, 8, 681–699. [Google Scholar] [CrossRef] [PubMed] [Green Version]
- Haase, D.; Nuissl, H. The urban-to-rural gradient of land use change and impervious cover: A long-term trajectory for the city of Leipzig. J. Land Use Sci. 2010, 5, 123–141. [Google Scholar] [CrossRef]
- Maimaitijiang, M.; Ghulama, A.; Sandoval, J.S.O.; Maimaitiyiming, M. Drivers of land cover and land use changes in St. Louis metropolitan area over the past 40 years characterized by remote sensing and census population data. Int. J. Appl. Earth Obs. Geoinf. 2015, 35, 161–174. [Google Scholar] [CrossRef]
- Qian, T.; Bagan, H.; Kinoshita, T.; Yamagata, Y. Spatial-temporal analyses of surface coal mining dominated land degradation in holingol, Inner Mongolia. IEEE J. Sel. Top. Appl. Earth Obs. Remote Sens. 2014, 7, 1675–1687. [Google Scholar] [CrossRef]
- Aguilera, F.; Valenzuela, L.M.; Botequilha-Leitão, A. Landscape metrics in the analysis of urban land use patterns: A case study in a Spanish metropolitan area. Landsc. Urban Plan. 2011, 99, 226–238. [Google Scholar] [CrossRef]
- Fan, C.; Myint, S. A comparison of spatial autocorrelation indices and landscape metrics in measuring urban landscape fragmentation. Landsc. Urban Plan. 2014, 121, 117–128. [Google Scholar] [CrossRef]
- United Nations. Transforming Our World: The 2030 Agenda for Sustainable Development; United Nations: New York, NY, USA, 2015; Volume 16301. [Google Scholar]
- United Nations. The World’s Cities in 2018. In World’s Cities 2018-Data Booklet (ST/ESA/ SER.A/417); United Nations: New York, NY, USA, 2018; pp. 1–34. [Google Scholar]
- About Karachi. Available online: http://www.kmc.gos.pk/Contents.aspx?id=14 (accessed on 4 November 2020).
- Bruzzone, L.; Bovolo, F.; Paris, C.; Solano-Correa, Y.T.; Zanetti, M.; Fernandez-Prieto, D. Analysis of Multitemporal Sentinel-2 Images in the Framework of the ESA Scientific Exploitation of Operational Missions. In 2017 9th International Workshop on the Analysis of Multitemporal Remote Sensing Images (MultiTemp), Bruges, Belgium, 7-29 June 2017; IEEE: Piscataway, NJ, USA, 2017; pp. 2–5. [Google Scholar] [CrossRef]
- Novelli, A.; Aguilar, M.A.; Nemmaoui, A.; Aguilar, F.J.; Tarantino, E. Performance evaluation of object based greenhouse detection from Sentinel-2 MSI and Landsat 8 OLI data: A case study from Almería (Spain). Int. J. Appl. Earth Obs. Geoinf. 2016, 52, 403–411. [Google Scholar] [CrossRef] [Green Version]
- Turner, W.; Rondinini, C.; Pettorelli, N.; Mora, B.; Leidner, A.K.; Szantoi, Z.; Buchanan, G.; Dech, S.; Dwyer, J.; Herold, M.; et al. Free and open-access satellite data are key to biodiversity conservation. Biol. Conserv. 2015, 182, 173–176. [Google Scholar] [CrossRef] [Green Version]
- Zhu, Z.; Wang, S.; Woodcock, C.E. Improvement and expansion of the Fmask algorithm: Cloud, cloud shadow, and snow detection for Landsats 4-7, 8, and Sentinel 2 images. Remote Sens. Environ. 2015, 159, 269–277. [Google Scholar] [CrossRef]
- Chaves, M.E.D.; Picoli, M.C.A.; Sanches, I.D. Recent applications of Landsat 8/OLI and Sentinel-2/MSI for land use and land cover mapping: A systematic review. Remote Sens. 2020, 12, 3062. [Google Scholar] [CrossRef]
- Ranagalage, M.; Gunarathna, M.H.J.P.; Surasinghe, T.D.; Dissanayake, D.; Simwanda, M.; Murayama, Y.; Morimoto, T.; Phiri, D.; Nyirenda, V.R.; Premakantha, K.T.; et al. Multi-decadal forest-cover dynamics in the tropical realm: Past trends and policy insights for forest conservation in dry zone of Sri Lanka. Forests 2020, 11, 836. [Google Scholar] [CrossRef]
- Page, B.P.; Olmanson, L.G.; Mishra, D.R. A harmonized image processing workflow using Sentinel-2/MSI and Landsat-8/OLI for mapping water clarity in optically variable lake systems. Remote Sens. Environ. 2019, 231, 111284. [Google Scholar] [CrossRef]
- Bondarenko, M.; Kerr, D.; Sorichetta, A.; Tatem, A.J. Census/Projection-Disaggregated Gridded Population Datasets for 189 Countries in 2020 Using Built-Settlement Growth Model (BSGM) Outputs; University of Southampton: Southampton, UK, 2020. [Google Scholar]
- R Development Core Team; R Foundation for Statistical Computing. R: A Language and Environment for Statistical Computing. Available online: https://www.r-project.org/ (accessed on 7 November 2019).
- Blaschke, T.; Lang, S.; Lorup, E.; Strobl, J.; Zeil, P. Object-oriented image processing in an integrated GIS/remote sensing environment and perspectives for environmental applications. Environmental information for planning, politics and the public. Environ. Inf. Plan. Polit. Public 2000, 2, 555–570. [Google Scholar]
- Simwanda, M.; Murayama, Y. Integrating geospatial techniques for urban land use classification in the developing sub-Saharan African City of Lusaka, Zambia. ISPRS Int. J. Geo-Inf. 2017, 6, 102. [Google Scholar] [CrossRef] [Green Version]
- Priyankara, P.; Ranagalage, M.; Dissanayake, D.; Morimoto, T.; Murayama, Y. Spatial process of surface urban heat island in rapidly growing Seoul Metropolitan area for sustainable urban planning using Landsat Data. Climate 2019, 7, 110. [Google Scholar] [CrossRef] [Green Version]
- Estoque, R.C.; Murayama, Y. Monitoring surface urban heat island formation in a tropical mountain city using Landsat data (1987–2015). ISPRS J. Photogramm. Remote Sens. 2017, 133, 18–29. [Google Scholar] [CrossRef]
- Pal, S.; Ziaul, S. Detection of land use and land cover change and land surface temperature in English Bazar urban centre. Egypt. J. Remote Sens. Space Sci. 2017, 20, 125–145. [Google Scholar] [CrossRef] [Green Version]
- Rousta, I.; Sarif, M.O.; Gupta, R.D.; Olafsson, H.; Ranagalage, M.; Murayama, Y.; Zhang, H.; Mushore, T.D. Spatiotemporal analysis of land use/land cover and its effects on surface urban heat island using Landsat Data: A case study of Metropolitan City Tehran (1988–2018). Sustainability 2018, 10, 4433. [Google Scholar] [CrossRef] [Green Version]
- Modica, G.; Vizzari, M.; Pollino, M.; Fichera, C.R.; Zoccali, P.; Di Fazio, S. Spatio-temporal analysis of the urban-rural gradient structure: An application in a Mediterranean mountainous landscape (Serra San Bruno, Italy). Earth Syst. Dyn. 2012, 3, 263–279. [Google Scholar] [CrossRef] [Green Version]
- Luck, M.; Wu, J. A gradient analysis of urban landscape pattern: A case study from the Phoenix metropolitan region, Arizona, USA. Landsc. Ecol. 2002, 17, 327–339. [Google Scholar] [CrossRef]
- Simwanda, M.; Ranagalage, M.; Estoque, R.C.; Murayama, Y. Spatial analysis of surface urban heat islands in four rapidly growing African Cities. Remote Sens. 2019, 11, 1645. [Google Scholar] [CrossRef] [Green Version]
- Estoque, R.C.; Murayama, Y.; Myint, S.W. Effects of landscape composition and pattern on land surface temperature: An urban heat island study in the megacities of Southeast Asia. Sci. Total Environ. 2017, 577, 349–359. [Google Scholar] [CrossRef]
- Mcgarigal, K. FRAGSTATS v4.2: Spatial Pattern Analysis Program for Categorical and Continuous Maps. Computer Produced by the Authors. 2015, pp. 1–182. Available online: https://www.umass.edu/landeco/research/fragstats/downloads/fragstats_downloads.html/ (accessed on 23 January 2021).
- Anderson, J.R. A Land Use and Land Cover Classification System for Use with Remote Sensor Data; Geological Survey Professional Paper, USGS: Reston, VA, USA, 1976. [Google Scholar]
- Ameen, R.F.M.; Mourshed, M. Urban environmental challenges in developing countries—A stakeholder perspective. Habitat Int. 2017, 64, 1–10. [Google Scholar] [CrossRef]
- Ranagalage, M.; Estoque, R.C.; Zhang, X.; Murayama, Y. Spatial changes of urban heat island formation in the Colombo District, Sri Lanka: Implications for sustainability planning. Sustainability 2018, 10, 1367. [Google Scholar] [CrossRef] [Green Version]
- Fonseka, H.P.U.; Zhang, H.; Sun, Y.; Su, H.; Lin, H.; Lin, Y. Urbanization and its impacts on land surface temperature in Colombo Metropolitan Area, Sri Lanka, from 1988 to 2016. Remote Sens. 2019, 11, 926. [Google Scholar] [CrossRef] [Green Version]
- Ranagalage, M.; Estoque, R.C.; Murayama, Y. An urban heat island study of the Colombo Metropolitan area, Sri Lanka, Based on Landsat Data (1997–2017). ISPRS Int. J. Geo-Inf. 2017, 6, 189. [Google Scholar] [CrossRef] [Green Version]
- Dwivedi, A.; Khire, M.V. Application of split-window algorithm to study Urban Heat Island effect in Mumbai through land surface temperature approach. Sustain. Cities Soc. 2018, 41, 865–877. [Google Scholar] [CrossRef]
- Lee, K.; Kim, Y.; Sung, H.C.; Jang, R.; Ryu, J.; Jeon, S.W. Trend analysis of urban heat island intensity according to urban area change in Asian mega cities. Sustainability 2020, 12, 112. [Google Scholar] [CrossRef] [Green Version]
- Grover, A.; Singh, R.B. Analysis of urban heat island (Uhi) in relation to normalized difference vegetation index (ndvi): A comparative study of Delhi and Mumbai. Environments 2015, 2, 125–138. [Google Scholar] [CrossRef] [Green Version]
- Ramaiah, M.; Avtar, R. Urban green spaces and their need in cities of rapidly urbanizing India: A review. Urban Sci. 2019, 3, 94. [Google Scholar] [CrossRef] [Green Version]
- Imam, A.U.K.; Banerjee, U.K. Urbanisation and greening of Indian cities: Problems, practices, and policies. Ambio 2016, 45, 442–457. [Google Scholar] [CrossRef] [Green Version]
- Mia, B.; Bhattacharya, R.; Woobaidullah, A.S.M. Correlation and monitoring of land surface temperature, urban heat island with land use-land cover of Dhaka City using satellite imageries. Int. J. Res. Geogr. 2017, 3, 10–20. [Google Scholar] [CrossRef]
- Tashnim, J.; Anwar, A. Reasons and remides of heat island phenomena for Dhaka City: A review. In Proceedings of the 3rd International Conference on Civil Engineering for Sustainable Development, Khulna, Bangladesh, 2–14 February 2016; pp. 228–234. [Google Scholar]
- Chang, C.R.; Li, M.H.; Chang, S.D. A preliminary study on the local cool-island intensity of Taipei city parks. Landsc. Urban Plan. 2007, 80, 386–395. [Google Scholar] [CrossRef]
- Zhang, X.; Zhong, T.; Feng, X.; Wang, K. Estimation of the relationship between vegetation patches and urban land surface temperature with remote sensing. Int. J. Remote Sens. 2009, 30, 2105–2118. [Google Scholar] [CrossRef]
- Zhang, X.; Estoque, R.C.; Murayama, Y.; Ranagalage, M. Capturing urban heat island formation in a subtropical city of China based on Landsat images: Implications for sustainable urban development. Environ. Monit. Assess. 2021, 193, 1–13. [Google Scholar] [CrossRef]
- Dewan, A.M.; Yamaguchi, Y.; Rahman, M.Z. Dynamics of land use/cover changes and the analysis of landscape fragmentation in Dhaka Metropolitan, Bangladesh. GeoJournal 2012, 77, 315–330. [Google Scholar] [CrossRef]
- Wu, J. Urban sustainability: An inevitable goal of landscape research. Landsc. Ecol. 2010, 25, 1–4. [Google Scholar] [CrossRef] [Green Version]
- Arshad, A.; Ashraf, M.; Sundari, R.S.; Qamar, H.; Wajid, M.; Hasan, M.U. Vulnerability assessment of urban expansion and modelling green spaces to build heat waves risk resiliency in Karachi. Int. J. Disaster Risk Reduct. 2020, 46, 101468. [Google Scholar] [CrossRef]
- Rahman, M.; Avtar, R.; Yunus, A.P.; Dou, J.; Misra, P.; Takeuchi, W.; Sahu, N.; Kumar, P.; Johnson, B.A. Monitoring Effect of Spatial Growth on Land Surface Temperature in Dhaka. Remote Sens. 2020, 12, 1191. [Google Scholar] [CrossRef] [Green Version]
- US Environmental Protection Agency (EPA). Reducing Urban Heat Islands: Compendium of Strategies Urban Heat Island Basics; EPA: Washington, DC, USA, 2008. [Google Scholar]
- Rizwan, A.M.; Dennis, L.Y.C.; Liu, C. A review on the generation, determination and mitigation of Urban Heat Island. J. Environ. Sci. 2008, 20, 120–128. [Google Scholar] [CrossRef]
- Zope, P.E.; Eldho, T.I.; Jothiprakash, V. Impacts of land use-land cover change and urbanization on flooding: A case study of Oshiwara River Basin in Mumbai, India. Catena 2016, 145, 142–154. [Google Scholar] [CrossRef]
- Ramesh, V.; Iqbal, S.S. Urban flood susceptibility zonation mapping using evidential belief function, frequency ratio and fuzzy gamma operator models in GIS: A case study of Greater Mumbai, Maharashtra, India. Geocarto Int. 2020, 1–26. [Google Scholar] [CrossRef]
- Hewawasam, V.; Matsui, K. Equitable resilience in flood prone urban areas in Sri Lanka: A case study in Colombo Divisional Secretariat Division. Glob. Environ. Chang. 2020, 62, 102091. [Google Scholar] [CrossRef]
- Karunarathne, A.Y.; Lee, G. Developing a multi-facet social vulnerability measure for flood disasters at the micro-level assessment. Int. J. Disaster Risk Reduct. 2020, 49, 101679. [Google Scholar] [CrossRef]
- Moufar, M.; Perera, E. Floods and Countermeasures Impact Assessment for the Metro Colombo Canal System, Sri Lanka. Hydrology 2018, 5, 11. [Google Scholar] [CrossRef] [Green Version]
- Zafar, S.; Zaidi, A. Impact of urbanization on basin hydrology: A case study of the Malir Basin, Karachi, Pakistan. Reg. Environ. Chang. 2019, 19, 1815–1827. [Google Scholar] [CrossRef]
- Fatemi, M.N.; Okyere, S.A.; Diko, S.K.; Kita, M.; Shimoda, M.; Matsubara, S. Physical vulnerability and local responses to flood damage in peri-urban areas of Dhaka, Bangladesh. Sustainability 2020, 12, 3957. [Google Scholar] [CrossRef]
- Khaddar, S.; Perumal, V.; Gupta, S. Understanding effect of traffic and driver related characteristics on seat belt usage in Mumbai city using random parameter logit approach and time series analysis. Int. J. Inj. Contr. Saf. Promot. 2020, 27, 458–464. [Google Scholar] [CrossRef]
- Thilakshan, T.; Rajapaksha, G.; Bandara, S. An Approach to Identify Bottlenecks in Road Networks Using Travel Time Variations: A Case Study in the City of Colombo and Suburbs. In 2020 Moratuwa Engineering Research Conference (MERCon); IEEE: Moratuwa, Sri Lanka, 2020; pp. 372–377. [Google Scholar] [CrossRef]
- Hoque, M.M.M.; Islam, M.A.; Kabir, M.H. Traffic induced noise level in different places at the Dhaka capital city of Bangladesh. Bangladesh J. Environ. Sci. 2020, 38, 41–46. [Google Scholar]
- Aamir, M.; Masroor, S.; Ali, Z.A.; Ting, B.T. Sustainable framework for smart transportation system: A case study of Karachi. Wirel. Pers. Commun. 2019, 106, 27–40. [Google Scholar] [CrossRef]
- Dutt, A.K.; Noble, A.G. Challenges to Asian Urbanization in the 21st Century: An Introduction; Springer: Dordrecht, The Netherlands, 2004; ISBN 1402025319. [Google Scholar]
Figure 1.
Location of the study area: (a) map of South Asia; Sentinel-2 image displayed in a false-color composite (bands 8, 4, and 3): (b) Karachi, (c) Mumbai, (d) Dhaka, and (e) Colombo with the city center.
Figure 1.
Location of the study area: (a) map of South Asia; Sentinel-2 image displayed in a false-color composite (bands 8, 4, and 3): (b) Karachi, (c) Mumbai, (d) Dhaka, and (e) Colombo with the city center.

Figure 2.
The workflow of the study: (a) preparation of data; (b) land use and land cover (LULC) classification; (c) gradient analysis, landscape metrics, and grid-based analysis.
Figure 2.
The workflow of the study: (a) preparation of data; (b) land use and land cover (LULC) classification; (c) gradient analysis, landscape metrics, and grid-based analysis.

Figure 3.
Land use and land cover in 2019: (a) Mumbai, (b) Colombo, (c) Karachi, and (d) Dhaka.

Figure 4.
The spatial pattern of land use and land cover along urban rural gradient in 2019: (a) Mumbai, (b) Colombo, (c) Karachi, and (d) Dhaka.
Figure 4.
The spatial pattern of land use and land cover along urban rural gradient in 2019: (a) Mumbai, (b) Colombo, (c) Karachi, and (d) Dhaka.

Figure 5.
The landscape connectivity and fragmentation analysis results. (a) Landscape-level metrics for all four cities, and (b) class-level metrics for all four cities for the built-up class. CONTAG—contagion; LSI—landscape shape index; SHDI—Shannon’s diversity index; PLAND—the percentage of the landscape; PD—patch density; Area_MN—mean patch size; Frac_AM— area-weighted mean patch fractal dimension, and ENN_MN—mean Euclidean nearest neighbor distance.

Figure 6.
Urban density (%) in terms of the 500 × 500 m2 grid size: (a) Mumbai, (b) Colombo, (c) Karachi, and (d) Dhaka.
Figure 6.
Urban density (%) in terms of the 500 × 500 m2 grid size: (a) Mumbai, (b) Colombo, (c) Karachi, and (d) Dhaka.

Figure 7.
The projected population per 100-m grid: (a) Mumbai, (b) Colombo, (c) Karachi, and (d) Dhaka in 2020. [64].
Figure 7.
The projected population per 100-m grid: (a) Mumbai, (b) Colombo, (c) Karachi, and (d) Dhaka in 2020. [64].

Figure 8.
Statistical relationships between the built-up density and mean population in 500m grid: (a) Mumbai, (b) Colombo, (c) Karachi, and (d) Dhaka.
Figure 8.
Statistical relationships between the built-up density and mean population in 500m grid: (a) Mumbai, (b) Colombo, (c) Karachi, and (d) Dhaka.

Table 1.
Characteristics of European Space Agency (ESA) Sentinel 2A and -B bands [36].
Table 1.
Characteristics of European Space Agency (ESA) Sentinel 2A and -B bands [36].
| Spatial Resolution (m) | Bands | Central Wavelength (nm) | Bandwidth (nm) |
|---|---|---|---|
| 10 | Band 2—Blue | 492.4 | 66 |
| Band 3—Green | 559.8 | 36 | |
| Band 4—Red | 664.6 | 31 | |
| Band 8—NIR | 832.8 | 106 | |
| 20 | Band 6—Red edge | 740.5 | 15 |
| Band 7—Red edge | 782.8 | 20 | |
| Band 8A—Narrow NIR | 864.7 | 21 | |
| Band 11—SWIR | 1613.7 | 91 | |
| Band 12—SWIR | 2202.4 | 175 | |
| 60 | Band 1—Coastal aerosol | 442.7 | 21 |
| Band 9—Water vapor | 945.1 | 20 | |
| Band 10—SWIR–Cirrus | 1373.5 | 31 |
Table 2.
Description of land-use/land-cover (LULC) classes.
| LULC | Description |
|---|---|
| Open land | Bareland, bare soil, exposed soils, landfill sites, active excavation, open lands, and other all land not accounted for in the below four categories |
| Built-up | Residential, commercial, industrial, mixed urban and other urban, transportation, road, and other construction sites |
| Cropland | Agricultural area, paddy land, vegetable land, and mixed lands |
| Green spaces | Forest, marshlands, mangrove, and grassland |
| Water | All water bodies |
Table 3.
Description of the landscape and class level metrics (McGarigal et al. [76]).
Table 3.
Description of the landscape and class level metrics (McGarigal et al. [76]).
| Metric | Description | Unit | Range | Measure |
|---|---|---|---|---|
| Landscape-Level Metrics | ||||
| Contagion (CONTAG) | The overall probability that a cell of a patch type is adjacent to cells of the same type. | Percent | 0 < CONTAG ≤ 100 | Fragmentation/aggregation |
| Landscape shape index (LSI) | Patch perimeter divided by the minimum perimeter possible for a maximally compact patch of the corresponding patch area. | None | LSI ≥ 1 | Shape and complexity |
| Shannon’s diversity index (SHDI) | The minus sum, across all patch types, of the proportional abundance of each patch type multiplied by the logarithm of that proportion. | None | SHDI ≥ 0 | Diversity |
| Class-Level Metrics | ||||
| Percentage of landscape (PLAND) | The sum of the built-up class divided by the total landscape area, multiplied by 100. | Percent | 0<PLAND≤100 | Dominance/abundance |
| Path density (PD) | Number of built-up patches divided by the total landscape area. | Numbers per 100 hectares | PD ≥ 1, no limit | Fragmentation |
| Mean patch size (Area_MN) | The average size of the built-up patches. | Hectares | AREA_MN ≥ 0, no limit. | Composition |
| Area-weighted mean patch fractal dimension (Frac_AM) | Area weighted mean value of the fractal dimension values of all built-up patches. Note: the fractal dimension of a patch equals 2 times the logarithm of the patch perimeter (m) divided by the logarithm of the patch area (m2); the perimeter is adjusted to correct for the raster bias in the perimeter. | None | 1≤ FRAC_AM≤ 2 | Shape and complexity |
| Mean Euclidean nearest neighbor distance (ENN_MN) | The distance (m) mean value over all built-up patches to the nearest neighboring patch is based on the shortest edge-to-edge distance from the cell center to the cell center. | Meters | ENN_MN > 0, no limit | Complexity |
Table 4.
Accuracy assessments of the LULC types.
| Accuracy | LULC Category | Mumbai | Colombo | Karachi | Dhaka |
|---|---|---|---|---|---|
| User’s accuracy (%) | Open land | 93.1 | 80.0 | 97.6 | 93.3 |
| Built-up | 96.0 | 97.3 | 97.3 | 95.2 | |
| Croplands | 73.3 | 72.3 | 67.9 | 86.2 | |
| Green spaces | 92.6 | 90.2 | 93.8 | 84.5 | |
| Water | 94.7 | 92.9 | 90.0 | 100.0 | |
| Producer’s accuracy (%) | Open land | 88.3 | 80.0 | 91.1 | 80.0 |
| Built-up | 93.3 | 87.4 | 92.2 | 84.0 | |
| Croplands | 78.6 | 91.2 | 96.5 | 95.6 | |
| Green spaces | 98.7 | 80.2 | 93.8 | 80.3 | |
| Water | 100.0 | 86.7 | 100.0 | 86.1 | |
| Overall Accuracy (%) | 93.0 | 86.0 | 92.0 | 89.0 |
Table 5.
Details of the land use and land cover changes in Mumbai, Colombo, Karachi, and Dhaka in 2019.
Table 5.
Details of the land use and land cover changes in Mumbai, Colombo, Karachi, and Dhaka in 2019.
| LULC | Area (ha) | LULC Composition (%) | ||||||
|---|---|---|---|---|---|---|---|---|
| Mumbai | Colombo | Karachi | Dhaka | Mumbai | Colombo | Karachi | Dhaka | |
| Open land | 22,978.8 | 2,067.7 | 43,474.1 | 9,674.2 | 25.4 | 2.8 | 42.0 | 6.0 |
| Built-up | 32,688.0 | 27,200.9 | 38,433.9 | 33,483.6 | 36.1 | 37.2 | 37.1 | 21.0 |
| Croplands | 2,457.1 | 25,309.8 | 16,861.2 | 88,186.3 | 2.7 | 34.7 | 16.3 | 55.1 |
| Green spaces | 28,900.6 | 16,360.3 | 3,354.3 | 18,671.1 | 32.0 | 22.4 | 3.2 | 11.7 |
| Water | 3,471.2 | 2,102.4 | 1,469.9 | 9,984.8 | 3.8 | 2.9 | 1.4 | 6.2 |
| Total | 90,495.9 | 73,041.1 | 103,593.5 | 160,000.0 | 100.0 | 100.0 | 100.0 | 100.0 |
Publisher’s Note: MDPI stays neutral with regard to jurisdictional claims in published maps and institutional affiliations. |
© 2021 by the authors. Licensee MDPI, Basel, Switzerland. This article is an open access article distributed under the terms and conditions of the Creative Commons Attribution (CC BY) license (https://creativecommons.org/licenses/by/4.0/).
Share and Cite
MDPI and ACS Style
Ranagalage, M.; Morimoto, T.; Simwanda, M.; Murayama, Y. Spatial Analysis of Urbanization Patterns in Four Rapidly Growing South Asian Cities Using Sentinel-2 Data. Remote Sens. 2021, 13, 1531. https://doi.org/10.3390/rs13081531
AMA Style
Ranagalage M, Morimoto T, Simwanda M, Murayama Y. Spatial Analysis of Urbanization Patterns in Four Rapidly Growing South Asian Cities Using Sentinel-2 Data. Remote Sensing. 2021; 13(8):1531. https://doi.org/10.3390/rs13081531
Chicago/Turabian StyleRanagalage, Manjula, Takehiro Morimoto, Matamyo Simwanda, and Yuji Murayama. 2021. "Spatial Analysis of Urbanization Patterns in Four Rapidly Growing South Asian Cities Using Sentinel-2 Data" Remote Sensing 13, no. 8: 1531. https://doi.org/10.3390/rs13081531
Note that from the first issue of 2016, this journal uses article numbers instead of page numbers. See further details here.