Automatic Tree Crown Extraction from UAS Multispectral Imagery for the Detection of Bark Beetle Disturbance in Mixed Forests


Faculty of Science, Department of Physical Geography and Geoecology, Charles University, Albertov 6, 128 43 Prague, Czech Republic
*
Author to whom correspondence should be addressed.
Remote Sens. 2020, 12(24), 4081; https://doi.org/10.3390/rs12244081
Submission received: 1 November 2020
/
Revised: 30 November 2020
/
Accepted: 11 December 2020
/
Published: 13 December 2020
(This article belongs to the Special Issue Remote Sensing of Natural Forest Disturbances)
Abstract
:Multispectral imaging using unmanned aerial systems (UAS) enables rapid and accurate detection of pest insect infestations, which are an increasing threat to midlatitude natural forests. Pest detection at the level of an individual tree is of particular importance in mixed forests, where it enables a sensible forest management approach. In this study, we propose a method for individual tree crown delineation (ITCD) followed by feature extraction to detect a bark beetle disturbance in a mixed urban forest using a photogrammetric point cloud (PPC) and a multispectral orthomosaic. An excess green index (ExG) threshold mask was applied before the ITCD to separate targeted coniferous trees from deciduous trees and backgrounds. The individual crowns of conifer trees were automatically delineated as (i) a full tree crown using marker-controlled watershed segmentation (MCWS), Dalponte2016 (DAL), and Li 2012 (LI) region growing algorithms or (ii) a buffer (BUFFER) around a treetop from the masked PPC. We statistically compared selected spectral and elevation features extracted from automatically delineated crowns (ADCs) of each method to reference tree crowns (RTC) to distinguish between the forest disturbance classes and two tree species. Moreover, the effect of PPC density on the ITCD accuracy and feature extraction was investigated. The ExG threshold mask application resulted in the excellent separability of targeted conifer trees and the increasing shape similarity of ADCs compared to RTC. The results revealed a strong effect of PPC density on treetop detection and ITCD. If the PPC density is sufficient (>10 points/m2), the ADCs produced by DAL, MCWS, and LI methods are comparable, and the extracted feature statistics of ADCs insignificantly differ from RTC. The BUFFER method is less suitable for detecting a bark beetle disturbance in the mixed forest because of the simplicity of crown delineation. It caused significant differences in extracted feature statistics compared to RTC. Therefore, the point density was found to be more significant than the algorithm used. We conclude that automatic ITCD methods may constitute a substitute for the time-consuming manual tree crown delineation in tree-based bark beetle disturbance detection and sanitation of individual infested trees using the suggested methodology and high-density (>20 points/m2, 10 points/m2 minimum) PPC.
1. Introduction
Insect disturbances are natural processes in forest ecosystems to maintain healthy and heterogeneous forests [1]. However, forest ecosystems can experience increased magnitude and frequency insect disturbances due to interaction from increasing temperatures and drought [2,3]. One of the most significant threats to the temperate forests of Central Europe are climate-change driven bark beetle Ips typographus L. (hereafter bark beetle) outbreaks [4]. Prolonged periods of warmth, longer vegetation seasons, and drought combined with an increased frequency of windstorms allow for the establishment of additional generations of the Ips typographus and a population overgrowth [4,5]. Moreover, urban forests may be affected more seriously because an urban environment produces additional stressors [6]. The stressors include changes in forest soil properties, tree species diversity, higher temperatures, and carbon dioxide content [7,8]. The stressed trees are then optimal material for a bark beetle feeding. Therefore, pest insect infestation is a serious threat to urban forests that can affect forest health and economic losses [9]. On the other hand, urban forests are under active forest management, which allows rapid individual tree sanitation. Therefore, it is necessary to use an appropriate method for the detection of individual infested trees.
A terrestrial survey of symptoms on the trunk and foliage discoloration or defoliation is traditionally used for bark beetle disturbance detection and assessment on a single tree level [10,11]. The infested tree goes through three-needle discoloration [5,12,13]. These stages are commonly known as green, red, and grey attacks. In the green attack stage, the infested trees have not shown distinct symptoms visible to the human eye, and therefore, infestation is not easy to detect at this stage at leaf and canopy levels [5,14]. However, the green attack can be better seen by remote sensing in the shortwave and thermal infrared spectra because of the changes in water content [15]. A field survey is also relatively time-consuming and costly, making this approach suitable only for a plot scale. Therefore, forest management has widely used conventional multi- or hyperspectral remote sensing to detect bark beetle infestation’s spectral symptoms.
Medium resolution satellites, especially Landsat data employing subpixel analysis, are more frequently used in the of study bark beetle disturbances compared to coarser resolution sensors, i.e., MODIS or AVHRR, indicating that spatial resolution is crucial feature for mapping such infestations [16]. However, the spatial resolution (>10 m) of these satellites is not suitable for the detection of bark beetle infestation at the individual tree level because the pixel size is more extensive than the mapping unit (a single tree crown). This decametric spectral resolution is more appropriate for mapping larger infestations at an epidemic population scale using an area-based (pixel-based) approach only, because of the pixel size [17]. High-resolution imagery (spaceborne or airborne) with a metric resolution (1–9 m) is very suitable for mapping spatially dispersed infestations of small groups of trees [17]. However, the area-based approach is still applied in recent studies using metric imagery to detect the bark beetle damage [11,18,19]. Nevertheless, for targeted individual tree sanitation of infested trees, it is essential to use imagery with a submeter (<1 m) spatial resolution and a tree-based approach based on automatic individual tree crown delineation (ITCD) from a submetric imagery to substitute the traditional terrestrial survey [6,17,20,21]. These prerequisites have been met only by airborne remote sensing.
Three main methods (Valley following, Region growing, and Watershed segmentation) have been developed for an automatic ITCD from aerial imagery [22]. These methods worked only with image brightness values. The algorithms searched for regions surrounded by local minima (shaded gaps between tree crowns), spectral similarity to the seed pixels, or local minima within inverted grayscale imagery [23,24,25]. However, automatic ITCD is difficult to perform with no vertical canopy structure [16,22].
Modern remote sensing technologies are now available for providing information about vertical canopy structure, enabling the tree-based approach. Airborne laser scanning (ALS) or stereophotogrammetry is now a standard operational tool for forest inventory and producing 3D canopy models [26,27]. The most used strategy for ITCD from airborne laser scanning is currently searching for local maxima (LM) for treetops detection followed by more common watershed segmentation or a more advanced region growing algorithm for crown delineation [28]. These methods are applicable either to photogrammetrically derived point clouds (PPCs) or from light detection and ranging (LiDAR) [22]. Despite this, the area-based approach is still more frequently used for bark beetle disturbance detection [6,29]. Only two recent studies that are focused on the pest insect disturbance detection, Nasi et al. [6] and Windrim et al. [30], have applied an essential individual treetop detection using image brightness or a canopy height model (CHM) from RGB data.
A disadvantage of airborne sensing is the high operational costs, weather conditions, and extensive mission planning. This is problematic for bark beetle disturbance management and, in general, for all pest insect infestations in the small-scale urban forest because these applications require an elevated level of spatial detail, frequent, intra-annual monitoring, and rapid processing. Nevertheless, recent developments in remote sensing and robotics have enabled the production of unmanned aircraft systems (UAS) featuring miniature multi- or hyperspectral sensors. In addition to ultra-high spatial resolution, the main advantages of employing UAS for insect disturbance detection are low operational costs (≤2000 Euro), the ability to undertake repeated image acquisition, when pest insects start to attack the trees, or when the damage is most likely visible and high operability under varying weather conditions, e.g., drizzling and moderate wind. Moreover, thanks to modern photogrammetric techniques based on Structure from Motion (SfM), it is possible to produce more cost-effective 3D photogrammetric canopy PPC and orthomosaics from UAS data as an alternative to airborne LiDAR to perform ITCD [31,32]. This enables processing precision, which cannot be achieved using LiDAR. Widespread practice involves applying an automatic ITCD from CHM derived from RGB or UAS LiDAR data [33]. Local maxima are used for raster-based treetop detection, while for tree crown delineation, watershed segmentation is commonly used [34].
The current state of the art in the UAS literature is to apply a tree-based approach for deriving individual tree parameters, such as tree height [35,36] or crown diameter [37], using an automatic ITCD from CHM. Studies focused on bark beetle driven disturbance detection have used the pixel-based approach [38]. Only two studies, Näsi et al. [39] and Klouček et al. [40], have been applied to a basic ITCD based on an automatic treetop identification combined with a buffer zone around the treetops for a bark beetle damage classification in the mature even-aged spruce forest. Both studies used the CHM derived photometrically. All of these studies implemented only spectral based features (original spectral bands and vegetation indices) to classification, which is sufficient to detect infested trees within a monoculture. Nonetheless, this is problematic in a highly diverse mixed forest when spectral response of different species is similar. For example, Sothe et al. [41] implemented UAS PPC-derived elevation tree metrics to tree species classification of tropical forests resulting in an overall accuracy increase of 15% compared to classification-based only on spectral features.
Despite this, studies combining spectral and elevation features for bark beetle damage detection are rare [42]. Little research has examined the segmentation of tree crowns directly from a PPC, especially in terms of multispectral analysis, because the accuracy of the LM method is linked intricately to point density, and multispectral cameras have been characterized by lower resolution [43]. Moreover, minimal investigations have performed ITCD within an uneven-aged, mixed forest [44]. Canopies of a distinct size may cause problems to set the correct spatial resolution when using CHM for ITCD, because smaller crowns may disappear in a coarser raster [22]. Therefore, it would be beneficial to use an original dense PPC to perform ITCD in a mixed forest.
This study focuses on the detection of individual spruce trees infested with bark beetles. We investigated whether it is possible to substitute laborious and commonly used manual ITCD with automatic ITCD without increasing extracted feature uncertainty of disturbance classes due to inaccurate ITCD. This aspect has not been thoroughly investigated in the scientific literature. The objectives of this study are (1) to examine and compare current methods for an individual tree crown spectral and elevation feature extractions from UAS multispectral data to clearly distinguish between the forest disturbance classes, (2) to statistically compare extracted features among reference crowns and automatically delineated tree crowns and (3) to discuss the uncertainties of the automatic crown delineations based on a used method and the extracted feature statistics for the bark beetle disturbance at individual tree level.
The methodology of this study was designed to address the abovementioned limitations. We use a multispectral PPC with a high point density to ensure accurate treetop identifications and ITCD in an uneven-aged mixed forest. The CHMs were derived from the high point density PPCs to guarantee a sufficient spatial resolution for ITCD. Moreover, we hypothesized that individual tree-based extraction of spectral and elevation features from a multispectral PPC and orthomosaic would improve the detection of individual bark beetle infested trees in a heterogeneous urban mixed forest. Hence, the suggested methodology for detecting bark beetle infestation in the urban forest aims to introduce a more efficient approach to forest health monitoring and damage reduction.
2. Materials and Methods
2.1. Study Area
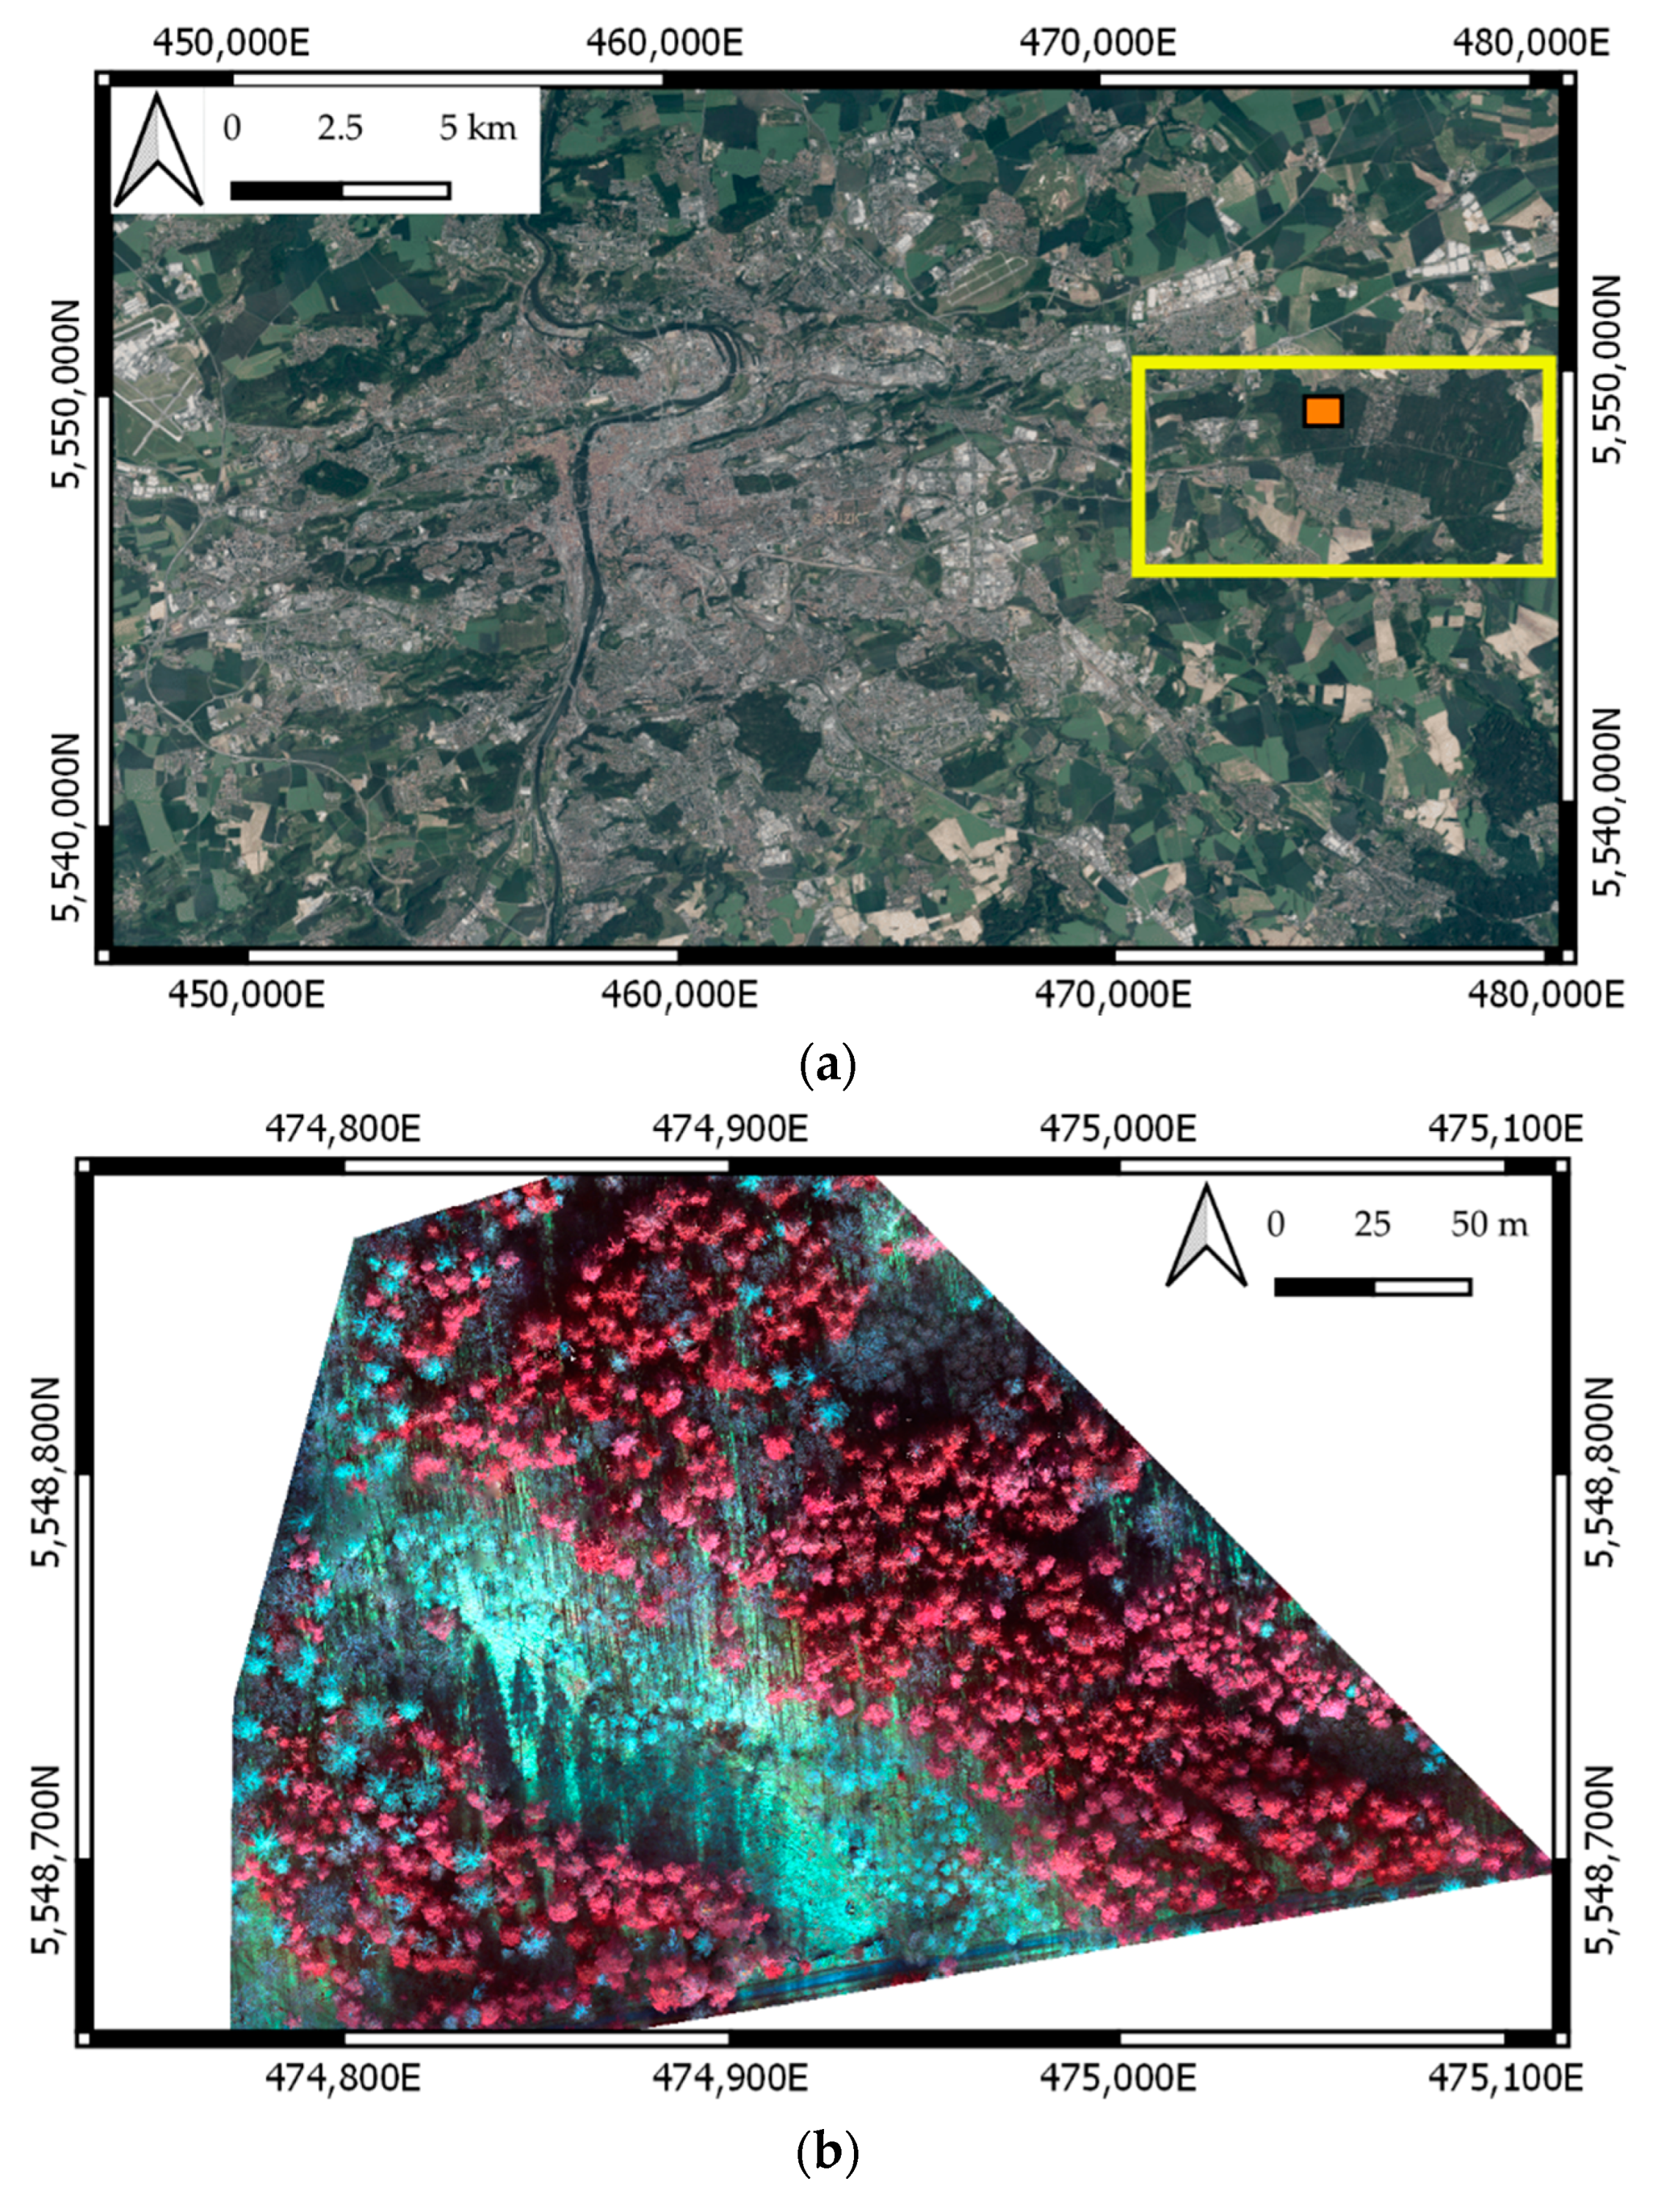
Klánovice Forest represents the largest suburban forest complex in the Prague metropolitan area (Figure 1). Until the mid -19th century, the area was a vast, deep, and unmanaged forest without a regular settlement. Human activities started after 1845, following the construction of a railway and new residential complex of Klánovice. Since 1982, the almost whole forest complex has been protected as a natural reserve with several valuable parts, featuring a higher protection status under Natura 2000. Currently, the Klánovice forest has an extent of 1030 ha and features a mixed structure of broadleaved and coniferous tree species, dominated by 33% oak, 31% pine, 11% birch, and 6% Norway spruce [45].
Since 2015, the forest complex has experienced repeated disturbance by insect infestation and windstorms. The forest health status was deteriorated by a five-year-long period of droughts and summer heatwaves, leading to rapid bark beetle infestation and forest disturbance. In October 2017, the region was hit by the windstorm Herwart and in February 2000, the windstorm Sabine [46].
Compared to the midlatitude montane regions, which experiencing severe bark beetle disturbance, the Klánovice forest’s infestation was more intense. For example, in Šumava Mts., severely hit by the insect disturbance, two generations of bark beetles are typically recorded per year [47]. The forests in the Prague metropolitan region with a warmer climate resulting from the lowland position and vicinity of urban heat island, experience four insect generations in a year [48].
However, the rapid progress of disturbance led to a limited hybrid structure of tree species with only limited homogeneous areas. The second aspect that prevented extensive forest damage was selective forest management, aimed at rapid detection and cutting the individual infested trees. However, since 2017, the forest disturbance resulted in several glades being subsequently replanted. Hence, the ability to identify the disturbance and detect early stages of disturbance, allowing for a selective response, is vital for managing mixed forests with limitations set by the protected area’s status.
2.2. UAS Data Acquisition
The UAS imaging campaign was performed on 24 February 2020, using DJI Matrice 210 RTK featuring a multispectral camera MicaSense RedEdge-M. A flight altitude was 100 m above ground level resulting in a ground sample distance (GSD) of 6.8 cm. The flight covered 5.5 ha of the urban forest. The high values of frontlap (90%) and sidelap (80%) were set to secure the adequate number of initial points needed for dense PPC extraction in forest scenes during photogrammetric processing. The point cloud density, driven by the parameters of flight height, focal length, and spatial resolution and the frontlap and sidelap values in our study were calculated in Agisoft Metashape. The weather conditions were mostly sunny, and the flight was conducted around noon (solar angle = 30.37°; sun azimuth = 179.82°) to minimize shadows. Twenty white ground control points were sprayed on the ground to get accurate image orientations. The WGS 84/UTM zone 33N coordinates of GCPs were measured by geodetic global navigation satellite system (GNSS) receiver Topcon. A real-time kinematic (RTK) GNSS method was used with the position accuracy of 1–2 cm employing a virtual reference station. We used this method to calculate precise image orientations and for orthorectification, because we needed precise positioning of individual trees on the orthomosaic to join the disturbance class from the ground truth points. If the position of the trees is not precise in the dense forest, the true disturbance class would be altered among neighboring trees. The flight was conducted deliberately just before vegetation season to distinguish spruce trees and conifers from broadleaves and use ground truth data for targeted tree sanitation of the most damaged trees before pioneer bark beetles started to swarm [49].
Five discrete identical cameras equip the MicaSense RedEdge-M camera with a fixed focal length of 5.4 mm, global shutter sensors with a resolution of 1280 × 980 pixels, and different bandpass filters. The set of bandpass filters is shown in Table 1. The camera is bundled with a downwelling light sensor (DLS), which records the current ambient light in the same wavelengths as the camera and stores it in the image metadata. This metainformation automatically corrects the raw imagery for light changes during the photogrammetric processing flight. Additionally, we took photos of the MicaSense calibration panel under the open sky to perform a calibration to reflectance factors. The calibration was performed using the recommended procedure in the Agisoft Metashape [50].
2.3. Ground Truth Data
A field inventory was conducted at five randomly selected stands at the beginning of March 2020, where the spruce trees were newly attacked in the summer or autumn of 2019. The stands’ coordinates were measured by GNSS receiver Topcon using an RTK method. Coordinates of visible individual trees were measured around the stands by total station due to multipath the of GNSS signal under the canopy. Regarding the study’s focus, the field inventory was primarily focused on mature spruces mapping and the health assessment. Nevertheless, pines were also mapped to compare their spectral and elevation features with spruce disturbance classes to suggest the best features for distinguishing these two species. A total of 122 mature spruce trees (Picea abies) and 23 pines (Pinus sylvestris) were mapped. All reference tree crowns (RTC) were manually digitized into a polygon shapefile using QGIS 3.10.2. The reference polygons served for the evaluation of automatic ITCD and treetops detection. The descriptive statistics of the reference tree crowns are given in Table 2.
The health status of spruce trees was assessed relative to each other based on crown discoloration and defoliation. These symptoms are typically used for indicating the infestation status of Ips typographus [6]. Moreover, resin ducts were observed as a symptom of a fresh attack of pioneer beetles [51]. Spruce trees were classified into three classes (Table 3). The spruce tree classes and the type of pine trees are referred to as disturbance classes hereafter.
2.4. Photogrammetric Processing
Photogrammetric processing was performed using Agisoft Metashape Professional 1.6.2., which implements recent photogrammetric techniques of structure from motion and semiglobal matching [52]. Moreover, Metashape sensor database contains the Red-Edge M camera model, including distortion parameters and vignetting [53]. Metashape also automatically extracts the information about DLS from image metadata so no additional corrections are necessary.
The multispectral images were aligned using high accuracy settings and generic preselection. Band 5 was set as a master channel for processing. After initial image alignment, the GCP were displayed in images, and image orientations were calculated and transformed into WGS 84/UTM zone 33N using GCPs. The original MicaSense reflectance panel and an empirical line method implemented in the software were used for radiometric calibration. The dense point cloud was generated using ultra-high settings and aggressive depth filtering. Ground points were automatically classified in Metashape. Based on the PPC, the digital surface model (DSM) was computed and used to derive the multispectral orthomosaic (10 cm/pixel). The resulting ultra-high-quality PPC and multispectral orthomosaic were further used for analysis. All vegetation indices (VIs) maps used in this study (Section 2.5.1 and Section 2.5.4) were calculated using a raster calculator in Metashape to keep the consistency with the orthomosaic.
2.5. Individual Tree Crown Delineation Workflow
We have proposed and tested an innovative workflow for the detection of individual tree crowns, enabling further classification of the forest health status. The workflow is wrapped around current ITCD methods that were primarily designed to ALS point cloud to the UAS-based photogrammetric PPC [54]. It is based on masking target tree species in the ITCD process, which was necessary for automizing the process.
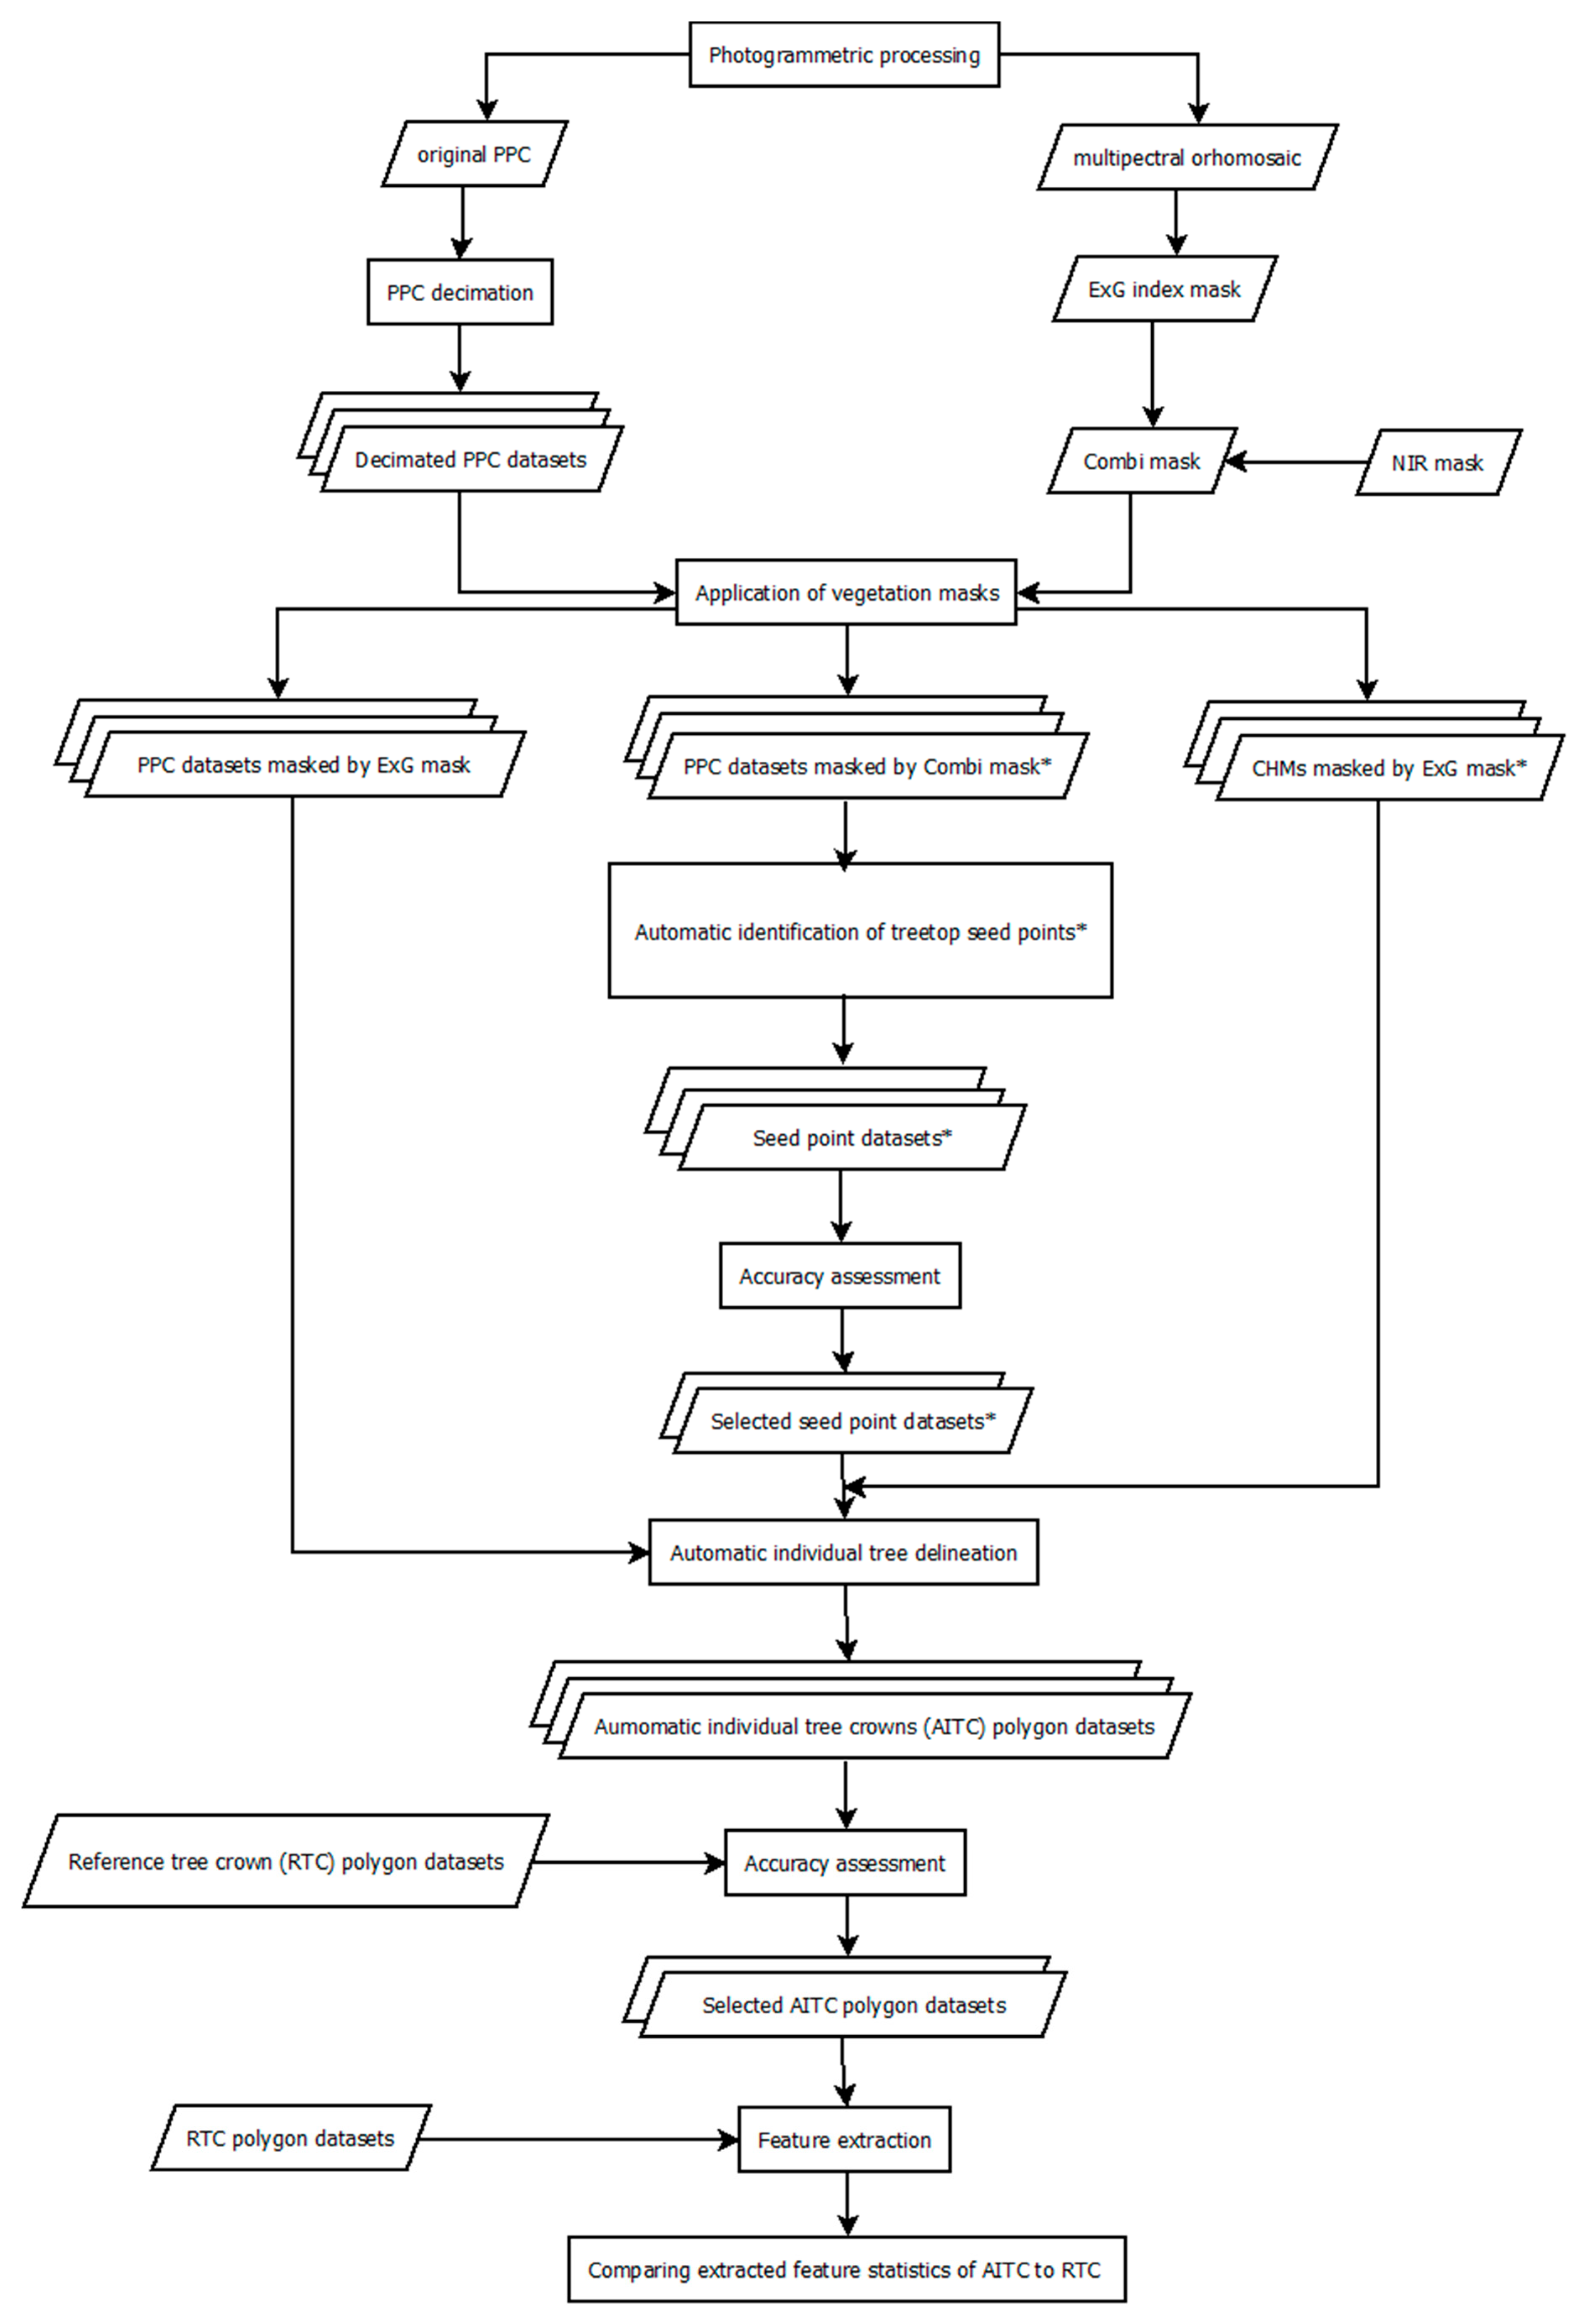
The suggested workflow included several steps. Firstly, we prepared green vegetation masks (Section 2.5.1) to separate the conifers from the ground, shadows, and broadleaves (i.e., the background). Then, we tested three current automatic ITCD methods and simple buffer zones around the detected treetops (Section 2.5.2). We investigated the effect of PPC density, and the ITCD method performing a standard accuracy assessment of segmentation comparing automatically delineated tree crowns to manually digitized reference tree crowns (Section 2.5.3). The selected tree crown segmentation datasets of each method were used for feature extraction (Section 2.5.4). The testing methodology suggested in this subsection was designed to investigate the separability of disturbance classes within the reference dataset and test the treatments (automatically delineated tree crowns) versus control (reference tree crowns) equality of selected features’ distributions. The testing results were then used to make conclusions about the usability of automatic ITCD for the detection of bark beetle disturbance using the individual-tree-based approach. The flowchart of the data processing workflow is presented in Figure 2.
2.5.1. Vegetation Masks
To separate the conifers from the ground, shadows, and broadleaves (i.e., =the background), we applied the excess green index (ExG) index threshold mask [55]. The ExG index map was computed from the multispectral orthomosaic (Equation (1)). The original ExG map was resampled to raster with a 30 cm spatial resolution to eliminate isolated pixels.
where R is the red band, G is the green band, and B is the blue band of the camera
The threshold for conifer trees was set according to histogram analysis of the resampled ExG map. An automatic unsupervised k-means classification of the ExG map into two classes (conifers and the background) was performed to detect a threshold value [56]. The final ExG threshold (ExG = 0.20) value was selected after a visual interpretation of the classified image. All pixels under the threshold value (ExG < 0.20) were set to NA within the mask. The final ExG mask was smoothed by a 3X3 modal filter (including NAs) to eliminate isolated pixels. The ExG mask was applied to the PPC before ITCD. In addition to the ExG mask, we applied a near infrared (NIR) shadow mask to remove shadowed gaps between treetops for the treetop’s detection routine.
The NIR shadow mask has been traditionally used to reduce false positive treetops formed by small local maxima of lower shadowed branches of large crowns) [22]. In this step, we used the NIR band (Band 5) of the original orthomosaic. The processing workflow was like ExG mask creation. The NIR map was resampled to a spatial resolution of 30 cm. An automatic unsupervised k-means classification of NIR map into five classes was performed to detect a shadows’ potential threshold value. The final NIR threshold (DN = 2670) value was selected after a visual interpretation of the classified image. Shadows formed a separate class. All pixels above the threshold value (DN > 2670) were set to NA within the mask. These two masks were combined for treetops detection (hereafter referred to as a combi mask). The combi mask was finally smoothed by a 3X3 modal filter (including NAs) to eliminate isolated pixels. The resulting mask was formed only by pixels of illuminated coniferous crowns.
2.5.2. Automatic Tree Crown Delineation
We tested three automatic ITCD methods to the UAS-based photogrammetric PPC (Table 4). We selected the Dalponte2016 region growing algorithm [57], marker-controlled watershed segmentation [58], and Li2012 [59] methods for comparison because they have been highly rated in previous comparative studies of Xiao et al. [60] and Hastings et al. [61]. These methods can be divided into two groups. Dalponte2016 (DAL) and marker-controlled watershed segmentation (MCWS) are CHM-based algorithms that rely on antecedent seed map of treetops. Li2012 (LI) is a 3D region growing algorithm applied directly to a PPC using a built-in function for treetops detection. These methods are available in the R package lidR [54] within lastrees function for the direct ITCD from the PPC. In the case of DAL and MCWS, this function automatically segments the PPC according to CHM-based segmentation results.
Treetop seed points used in DAL and MCWS were created using a local maximum filter (lmf) algorithm with variable circular window size [62]. The algorithm is implemented in the lidR package. The variable window size is calculated as a user-defined function of the local height extracted from the PPC. The function takes a height of a given point or pixel and returns the desired window size centered on that point or pixel. The lmf algorithm is highly dependent on crown size [63]. For this reason, we designed two functions (hereafter referred as f1 and f2) to return the moving window diameter equal to the minimum (f1 ≅ 2.75 m) or median diameter (f2 ≅ 4.01 m) of the reference crowns using the median reference tree height (25.14 m) extracted from the CHM. Because bark beetle prefers the mature spruce trees that provide a plentiful source of phloem [64], we set the height threshold to ignore all points under the 14 m local maxima search.
We tested the lmf algorithm with two variable moving windows first on the masked (combi mask) PPC with the original point density. However, we discovered that treetops were formed by multiple identical but well-located seed points due to extreme point density. This resulted in many false-positive treetop detections. Moreover, in the context of work by Eysn et al. [65], which stated that the accurate treetops detection is of equal or greater importance than the choice of segmentation method, we decided to decimate the original PPC and investigate the effect of the point density to the treetop seed points detection and subsequent ITCD. Therefore, the original PPC without applied mask was decimated using the lasfilterdecimate function from the lidR package. This function applied a decimating algorithm that created a grid with a given resolution and filtered the PPC by selecting the highest point within each cell. The overview of decimated datasets is shown in Table 5.
These datasets were masked by combi mask for treetop seed points detection. The lmf algorithm was applied to the datasets in two versions using either f1 or f2 functions.
CHMs needed for DAL, and MCWS segmentation methods were calculated for every decimated PPC with no mask using a pitfree algorithm [66]. The spatial resolutions of CHMs were set to be equal to the decimation grid. The ExG mask then masked the CHMs before automatic tree segmentation within lastrees function. In the case of the LI method, the ExG mask was applied directly to the PPC, because there was no seed points map and CHM were required.
All three delineation methods were applied to the selected decimated PPCs. Parameters of the automatic delineation algorithms were set by tuning of default parameters using the trial-and-error method (Appendix A). Individual polygons of the tree crowns were generated by tree_hulls function. This function created 2D concave hulls around delineated tree crowns of the segmented PPC.
2.5.3. Accuracy Assessment
After running the automatic treetops detection routine within all datasets, we compared the resulting treetops with the reference crowns in terms of true positive (TP), false-negative (FN, omission error), and false positive (FP, commission error) treetops. If more than one point fell within the crown, only one TP point was counted. The rest was assessed as FP. To evaluate the effect of point density to the accuracy of treetops detection, we calculated recall (r), precision (p), and F-score (F) statistics, according to Li et al. [59].
For further automatic ITCD using DAL and MCWS methods, we employed only the more accurate treetop seed points dataset from the f1 or f2 alternatives of the given decimated PPC. These statistics were not calculated for ITCD using the LI method because the treetop detection is not a primary task for ITCD. Therefore, only the accuracy of the final automatic individual tree polygons was assessed.
The accuracy of delineation methods and the effect of PPC decimation to the ITCD were assessed by comparing the generated automatic individual tree crown (AITC) polygons to the reference tree crowns (RTC). A detection accuracy score (DA) was calculated for each delineation method and decimated PPC:
where nTP is the number of correctly segmented (true positive) AITC, and N is the number of RTC [67]. AITC polygon was considered correctly segmented if ≥ 50% of the area of both AITC and RTC intersect [68,69]. Moreover, the incorrectly segmented AITC were classified to one of three categories. In total, each AITC polygon was assigned to one of four categories [61]:
- Oversegmentation: The intersection area of given AITC and RTC is ≥50% of AITC but <50% of the area of RTC. This indicates that AITC is smaller than RTC.
- True positive: The intersection area of given AITC and RTC is ≥50% of the area, both for AITC and RTC.
- Undersegmentation: The intersection area of given AITC and RTC is <50% of AITC, but ≥50% of the area of RTC. It indicates that AITC is larger than RTC.
- False-positive: The intersection area of given AITC and RTC is <50% of the area, both for AITC and RTC.
When multiple AITC polygons fell within one RTC, only one AITC polygon that had the highest intersection area was used for the accuracy assessment.
Moreover, the quality rate (QR) index was applied to consider the geometrical similarity [70]:
where ri is the reference RTC and si is the best corresponding AITC. If the intersection area between a reference polygon ri and its candidate si equals the union area, the AITC segment coincides entirely [71]. The QR ranges from [0, 1]. The lower value indicates the better geometrical similarity of the AITC segment to the reference crown. Furthermore, we tested the QR’s obtained accuracy values with a Kruskal–Wallis test followed by nonparametric post hoc comparisons after Siegel and Castellan [72] to detect significant accuracy variances among selected delineation methods and decimated datasets. The statistical testing was performed in R [73].
2.5.4. Feature Extraction
In addition, to the standard geometrical accuracy assessment of segmentation methods described in the Section 2.5.3, the extracted spectral and elevation features using AITC segments of DAL, MCWS, and LI were statistically compared to the extracted statistics of RTC (treatments versus control). The feature extraction was performed only for the most accurate las02 and the most inaccurate las1. Moreover, we added for comparison a simple buffer (BUFFER) method designed by authors that created buffer zones around the respective treetops. To consider the effect of different tree sizes, we applied circular buffers covering 3.14 m2 (1 m perimeter) or 12.56 m2 (2 m perimeter) for small and large trees, respectively. The buffer’s size was set according to the descriptive statistics for the height threshold of 27 m used in LI to distinguish between small and large trees. For all selected features, we applied a Kruskal–Wallis test followed by treatment (DAL, MCWS, LI, and BUFFER) versus control (RTC) multiple comparisons test of extracted statistics to investigate the effect of different segmentation methods and PPC decimation to the purity of crown delineation and the presence of mixels [72].
According to previous studies, spectral features were represented by selected VIs, which have been shown to be sensitive to changes in the spectral response of the infested trees in the earlier stages (Table 6). We extracted mean values of spectral features per tree (AITC polygon) for the statistical analysis due to the applied individual tree-based approach. Moreover, we investigated the correlations between the indices and the number of pixels forming the crown. We found no significant correlations. Therefore, the simple mean was used regardless of the crown size. The spectral features were extracted from the index maps calculated from the original orthomosaic.
Four elevation metrics (Table 7) were extracted to explore the additive value of 3D information for tree species recognition because preliminary results showed a similar spectral response of infested spruce trees and pines. Therefore, the differences between pines and spruces, regardless of the disturbance class, were investigated.
We selected the metrics from Sothe et al. [41] which reflect the different crown shapes of spruce trees and pines. Pines have larger and flat spreading crowns compared to pyramidal spruce crowns. As in the case of spectral features, the mean elevation metrics were calculated per tree polygon. The elevation metrics were calculated within tree_hulls function (DAL, MCWS, and LI) or extracted from appropriate CHM (RTC and BUFFER). The crown area was calculated from the polygon’s geometry for RTC and BUFFER.
Before treatment versus control multiple comparisons, we tested the difference in the spectral features among the disturbance classes within the RTC to investigate the ability of selected features to detect the infested trees in the mixed forest. We used a Kruskal–Wallis test with the following nonparametric post hoc comparison after Siegel and Castellan [72]. To test the differences in elevation metrics between two tree species, we applied a Mann–Whitney U test, with the p-value estimated by normal approximation with continuity correction. Statistical testing was performed in R.
3. Results
3.1. Vegetation Masks
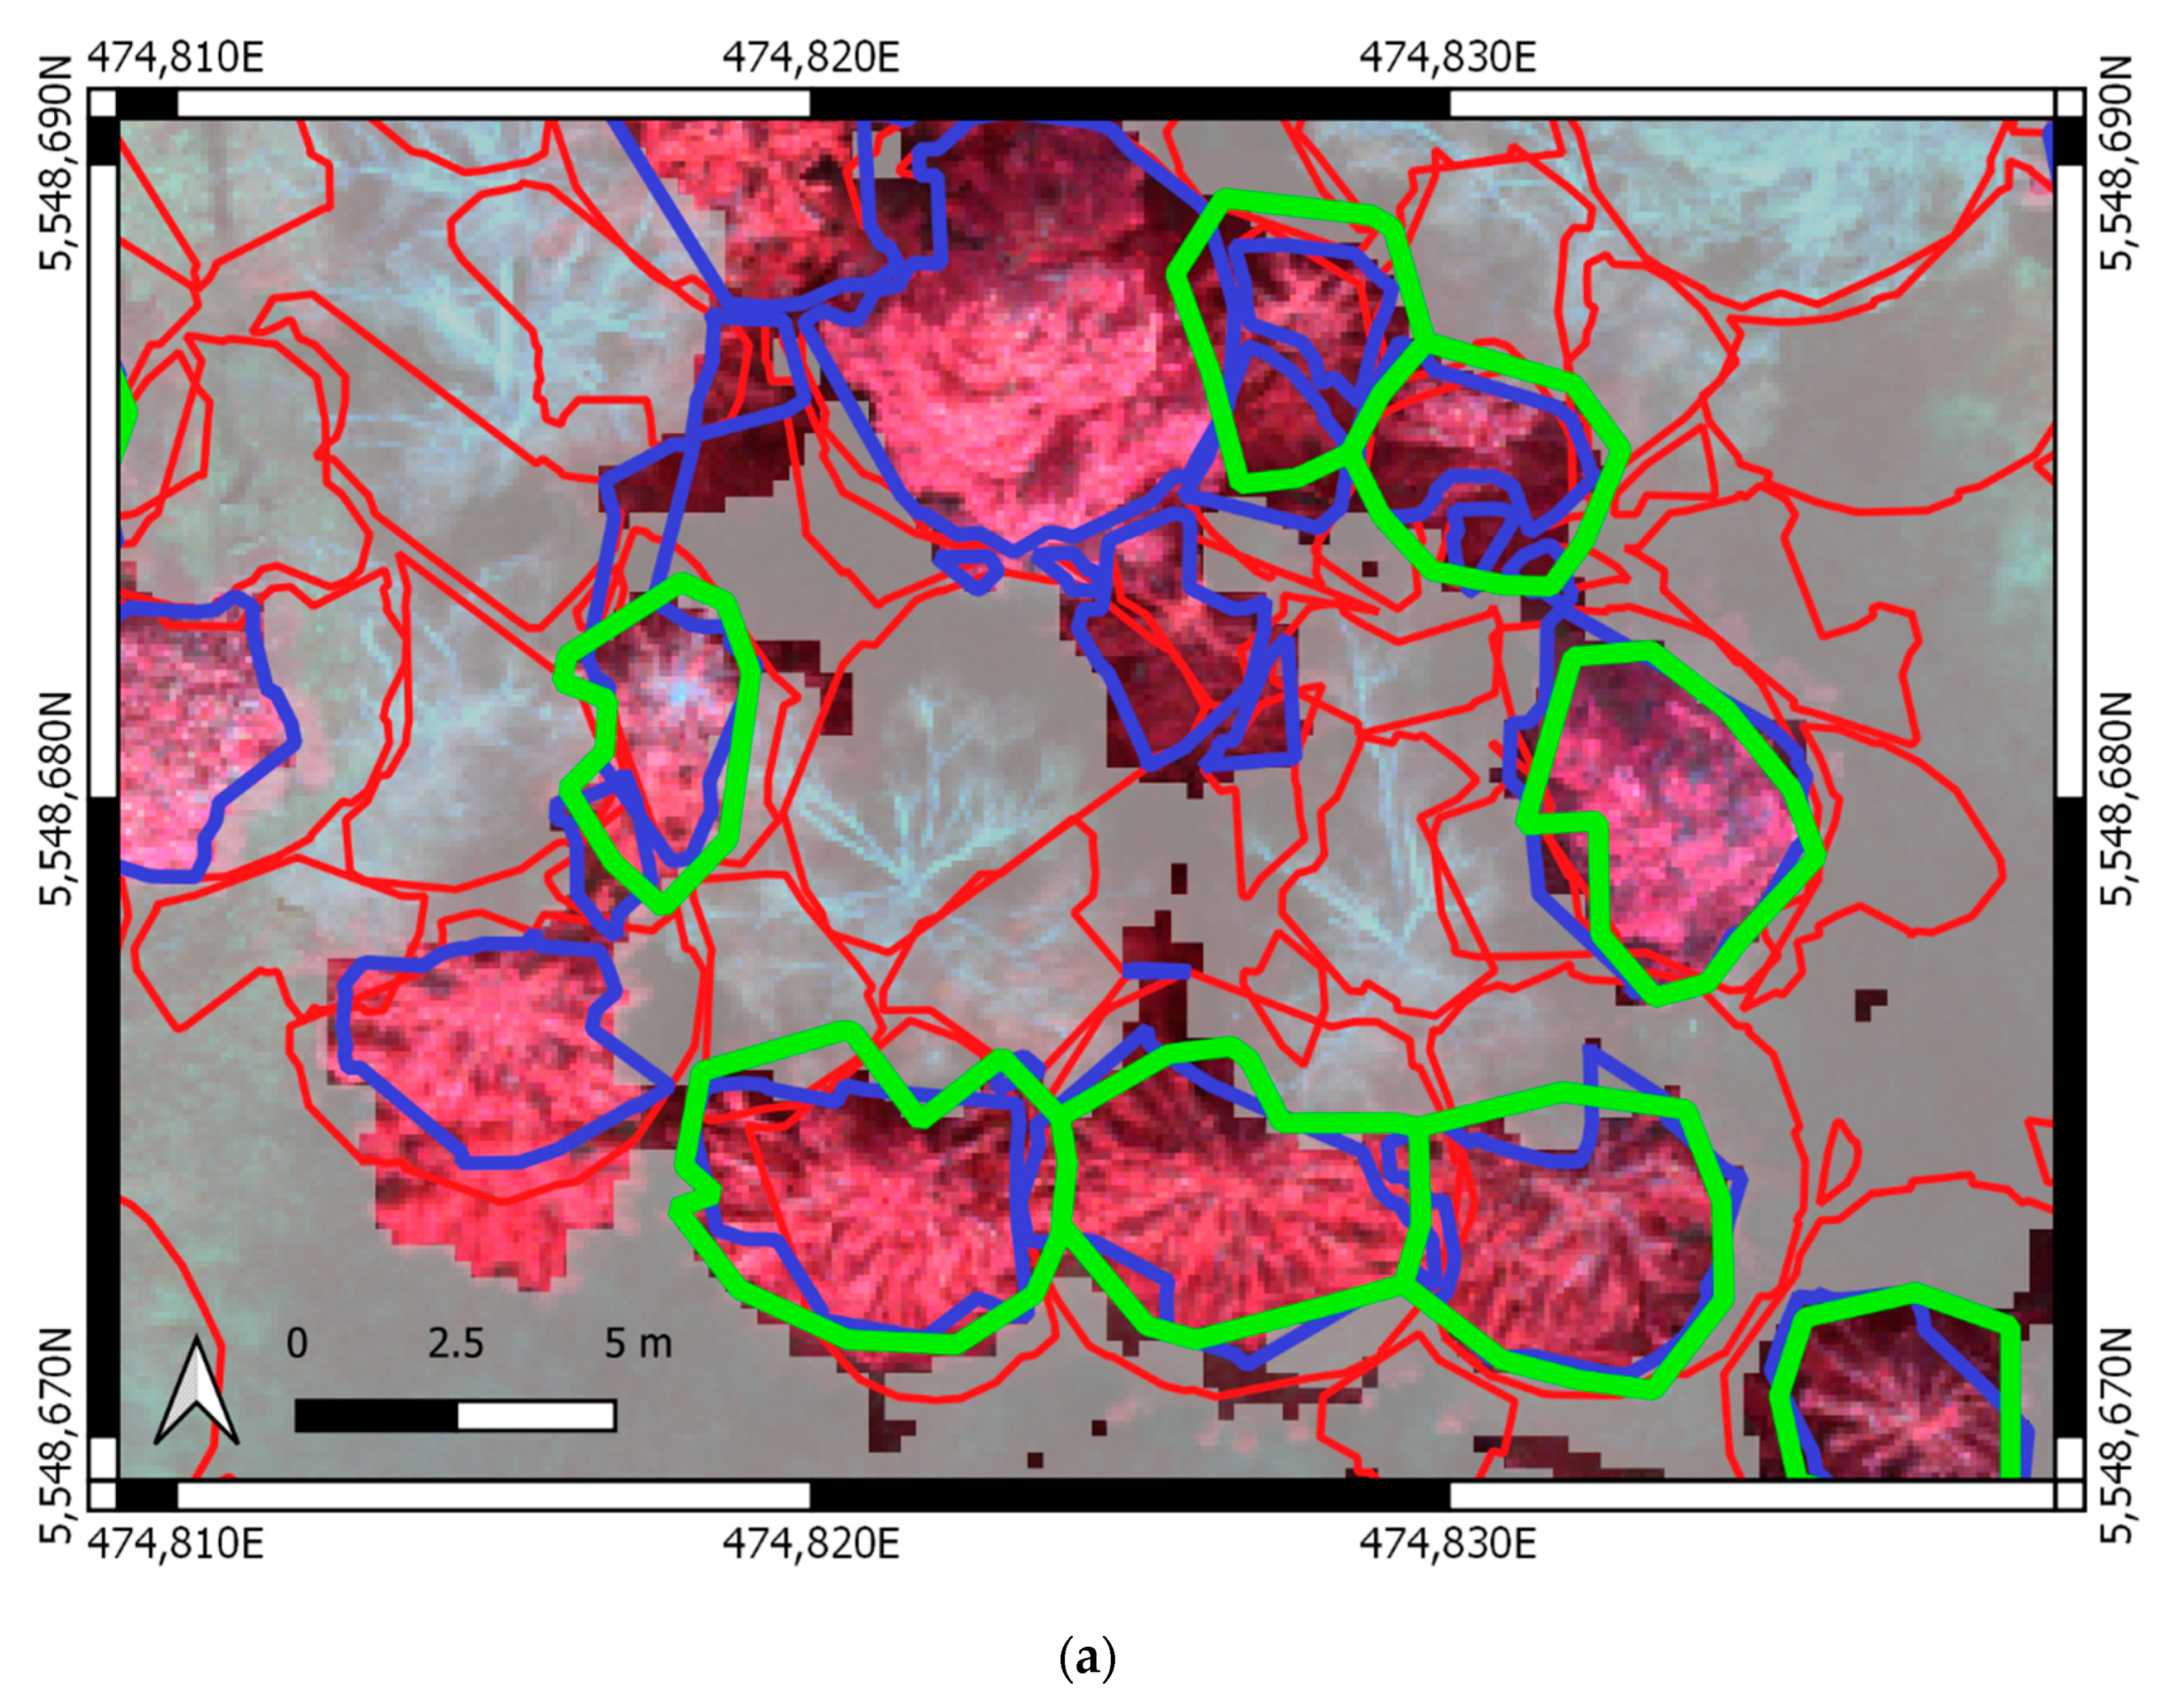
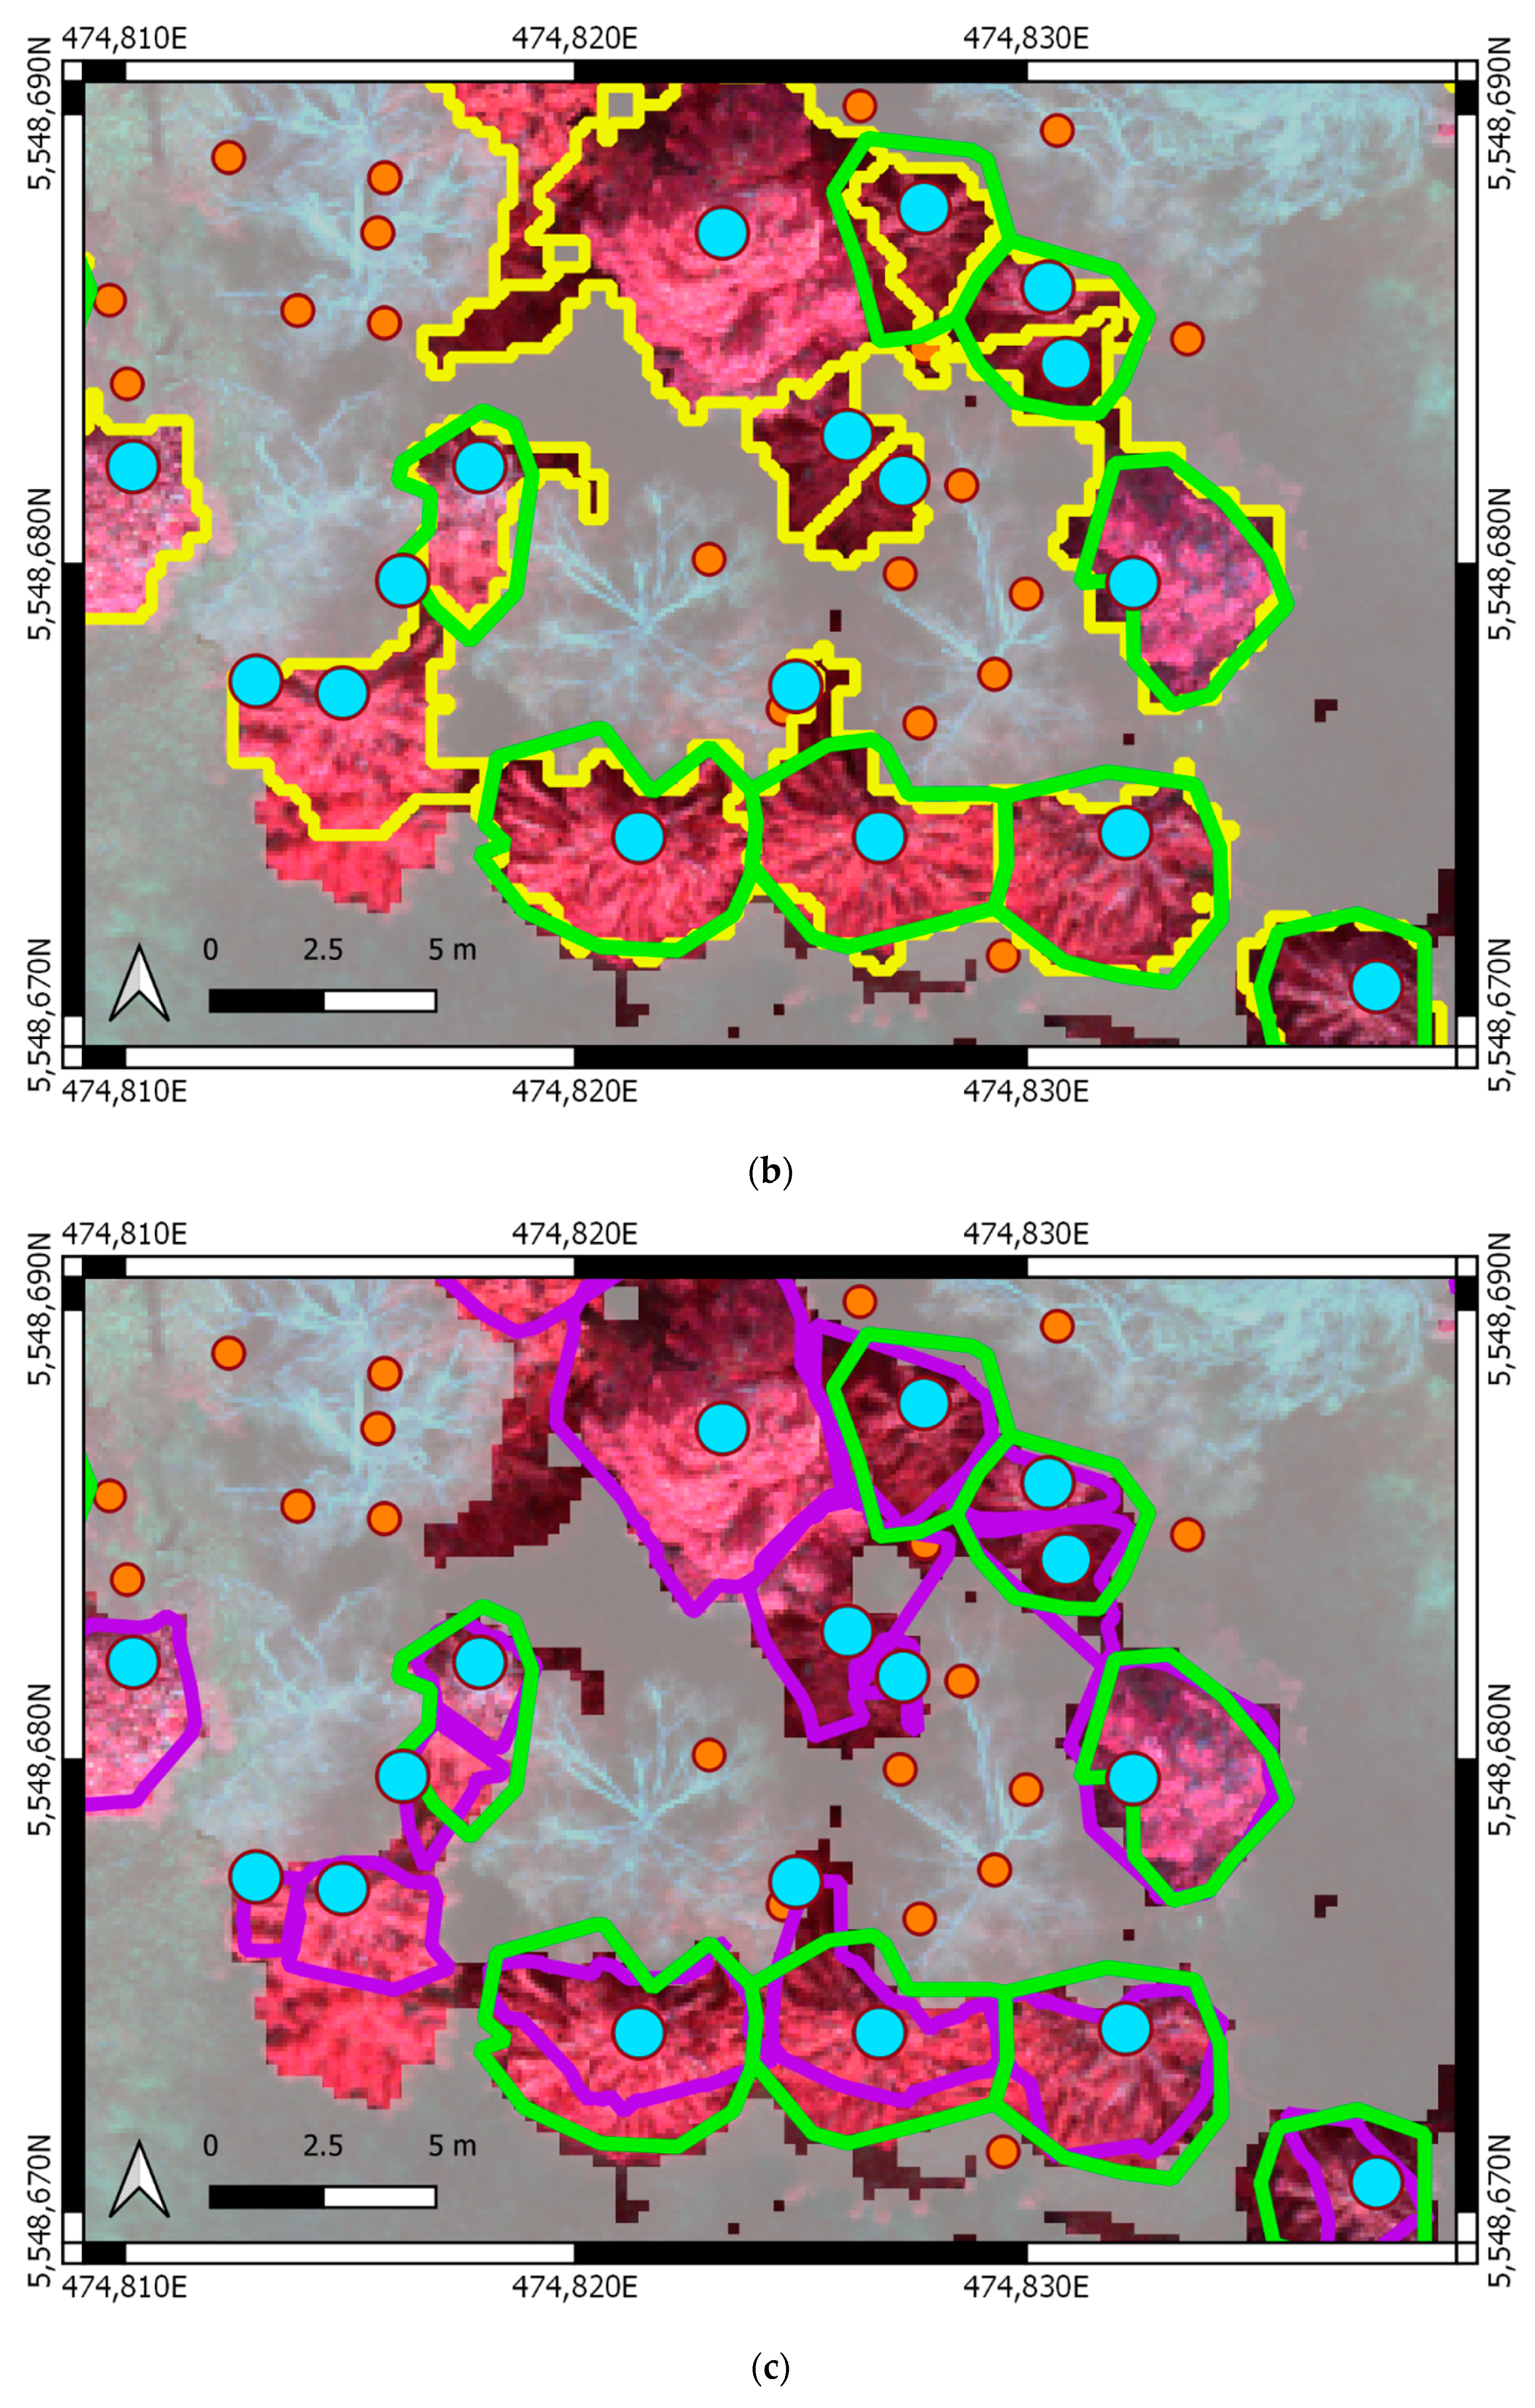
The effect of vegetation mask application before the LI segmentation technique to the PPC is illustrated in Figure 3. The mask’s application resulted in a perfect reduction in deciduous tree crown segments and the better delineation of the disturbed trees.
The effect of vegetation mask applications before the MCWS and DAL treetop’s detection to the PPC is illustrated in Figure 3b,c. When no mask was applied, it resulted in many false-positive treetop identifications because all trees of distinct species (larches and deciduous trees) were included in the lmf searching algorithm. Moreover, the larger the decimation grid that was applied, the more false-positive treetops were detected regardless of the variable size window function. The reason for this was that deciduous trees and larches had been shed due to the time of imaging. This resulted in multiple false-positive treetop detections in the crowns because the larger decimation grid formed the false local maxima from their main branches. These local maxima were more likely to be detected within the less dense PPC by the lmf algorithm.
Nevertheless, these false-positive treetops were strongly reduced by applied masks to the PPC. The ExG threshold mask separated the conifers from the ground, grass, deciduous trees, and partial shadows. The main proportion of the points was removed using the ExG mask. The additional NIR mask completely reduced the shadowed pixels. All the reduced points represented false positive multiple treetops of deciduous trees and larches.
3.2. Automatic Treetops Detection Accuracy
The resulting accuracies of treetop detections are presented in Table 8. The lowest accuracy was obtained using the original PPC with the extreme point density of 701 points/m2 regardless of the applied variable window size function. The accuracy was decreased due to many FN treetop identifications formed by multiple seed points. Therefore, the PPC with original point density was not use for further analysis. However, the detection accuracy was enormously improved using the decimated PPCs.
These results have shown that the density of the PPC affects the accuracy of treetops detection. The larger decimation grid was applied, the more FP and the fewer FN treetops were detected regardless of the variable size window function. These trends were caused by keeping the highest point in each decimation cell and the principle of the implemented lmf algorithm. The larger crown’s FP treetops were formed because the more extensive decimation grid selected more than one highest point within the crown. These more isolated points were more likely to have been selected as the false local maxima because there were no higher points in the search radius of the lmf algorithm after the combi mask application.
The moving window size function also affected the accuracy of treetops detection. The application of larger moving windows (function f2) resulted in fewer FP but more FN detections than function f1, because the reference crown area data are positively skewed. Therefore, the smaller trees were not detected by the variable moving window fitted to median crown size. These two features had a common effect on the treetop detection accuracy. The larger decimation grid increased FP detections, while the larger moving window increased FN detections.
The three most accurate datasets had a dense cloud with a point density from 10 to 85 points/m2 and a search window size function corresponding to the minimum diameter of the reference tree crowns. However, the accuracy between these three dense PPCs showed only minor variance. The more dense or sparse PPC affects the accuracy of treetop detections negatively. Therefore, the density from 10 points/m2 to 85 points/m2 can be considered sufficient for treetop detections using the lmf algorithm.
3.3. Automatic Individual Tree Crown Delineation Accuracy
The resulting accuracies of automatic ITCD methods are presented in Table 9. The accuracy of all methods showed a minor variance between methods within one PPC, confirmed by subsequent statistical testing. Statistical tests revealed insignificant differences among delineation methods in the densest PPCs las01 and las02. In the case of more decimated PPCs, the accuracies varied significantly. The results of statistical testing were expressed by accuracy ranking within each dataset in Table 9. Tied ranks expressed insignificant differences. Higher overall accuracy was obtained by applying traditional MCWS, followed by the LI method regardless of the PPC density. The accuracy of the DAL method was slightly lower compared to MCWS and, sometimes, LI.
Moreover, the statistical testing revealed insignificant differences in each method’s accuracy among decimated datasets, except for the las1 datasets with the point density 1 point/m2, because the low point density reduced detailed crown shapes in a dense forest. It resulted in significantly less accurate oversegmentation (DAL and LI) or undersegmentation (MCWS) of the automatically delineated crowns.
The oversegmentation or undersegmentation is caused by the low point density and the type of the algorithm. In the case of DAL and LI oversegmentation, the region-growing algorithm selected only a few topmost points around the treetop that met the height conditions. The MCWS algorithm also included points of the neighboring crowns because the height gradient magnitudes between the crowns were reduced due to the low point density. That resulted in undersegmentation. The same effect of starting oversegmentation was also detectable in another sparse las05 PPC (4 points/m2) using DAL and LI methods, but the accuracy decrease was not significant within this dataset.
It appears that the main effect of automatic ITCD accuracy is the density of the PPC because the significant decrease in accuracy was obtained using the most decimated PPC (1 point/m2). A point density greater than 10 points/m2 can be considered sufficient with the margin of our results. If the point density is sufficient, the selection of the segmentation method is a minor issue. Every recent ITCD method based on point cloud or CHM segmentation can be used. However, the MCWS was the most accurate method, even in the case of too little point density.
Because statistical tests revealed significantly lower accuracy of all delineation methods using the most decimated las1 dataset compared with other datasets, we decided to compare extracted feature statistics of the reference dataset only with extracted statistics of las02 and las1.
3.4. Feature Extraction
The statistical testing revealed significant differences among disturbance classes within the reference dataset (Table 10). Therefore, the distinguishing of disturbance classes and bark beetle disturbance detection is possible. Multiple comparisons using spectral features exposed problematic distinguishing between pines and seriously infested trees (sbbd) using NDVI and ENDVI indices, consistent with the preliminary results. However, these two classes were well separated, employing the NDRE index. Another problematic distinction was revealed between noninfested trees (sh) and the trees under the green attack using NDRE, but significant differences between classes were detected applying NDVI and ENDVI indices. This makes the NDRE index less suitable for detection of infested spruce trees.
The excellent separability of pines was reached using elevation features and the Mann–Whitney U test. That is consistent with the study’s hypotheses documenting the supporting role of elevation features for tree species separation. However, the crown area’s application could be limiting for tree species separation if the crown area of these species were equal. This makes the feature less applicable. On the other hand, the quartile features are universally applicable because the different crown shapes of these tree species are more likely to remain stable regardless of crown size.
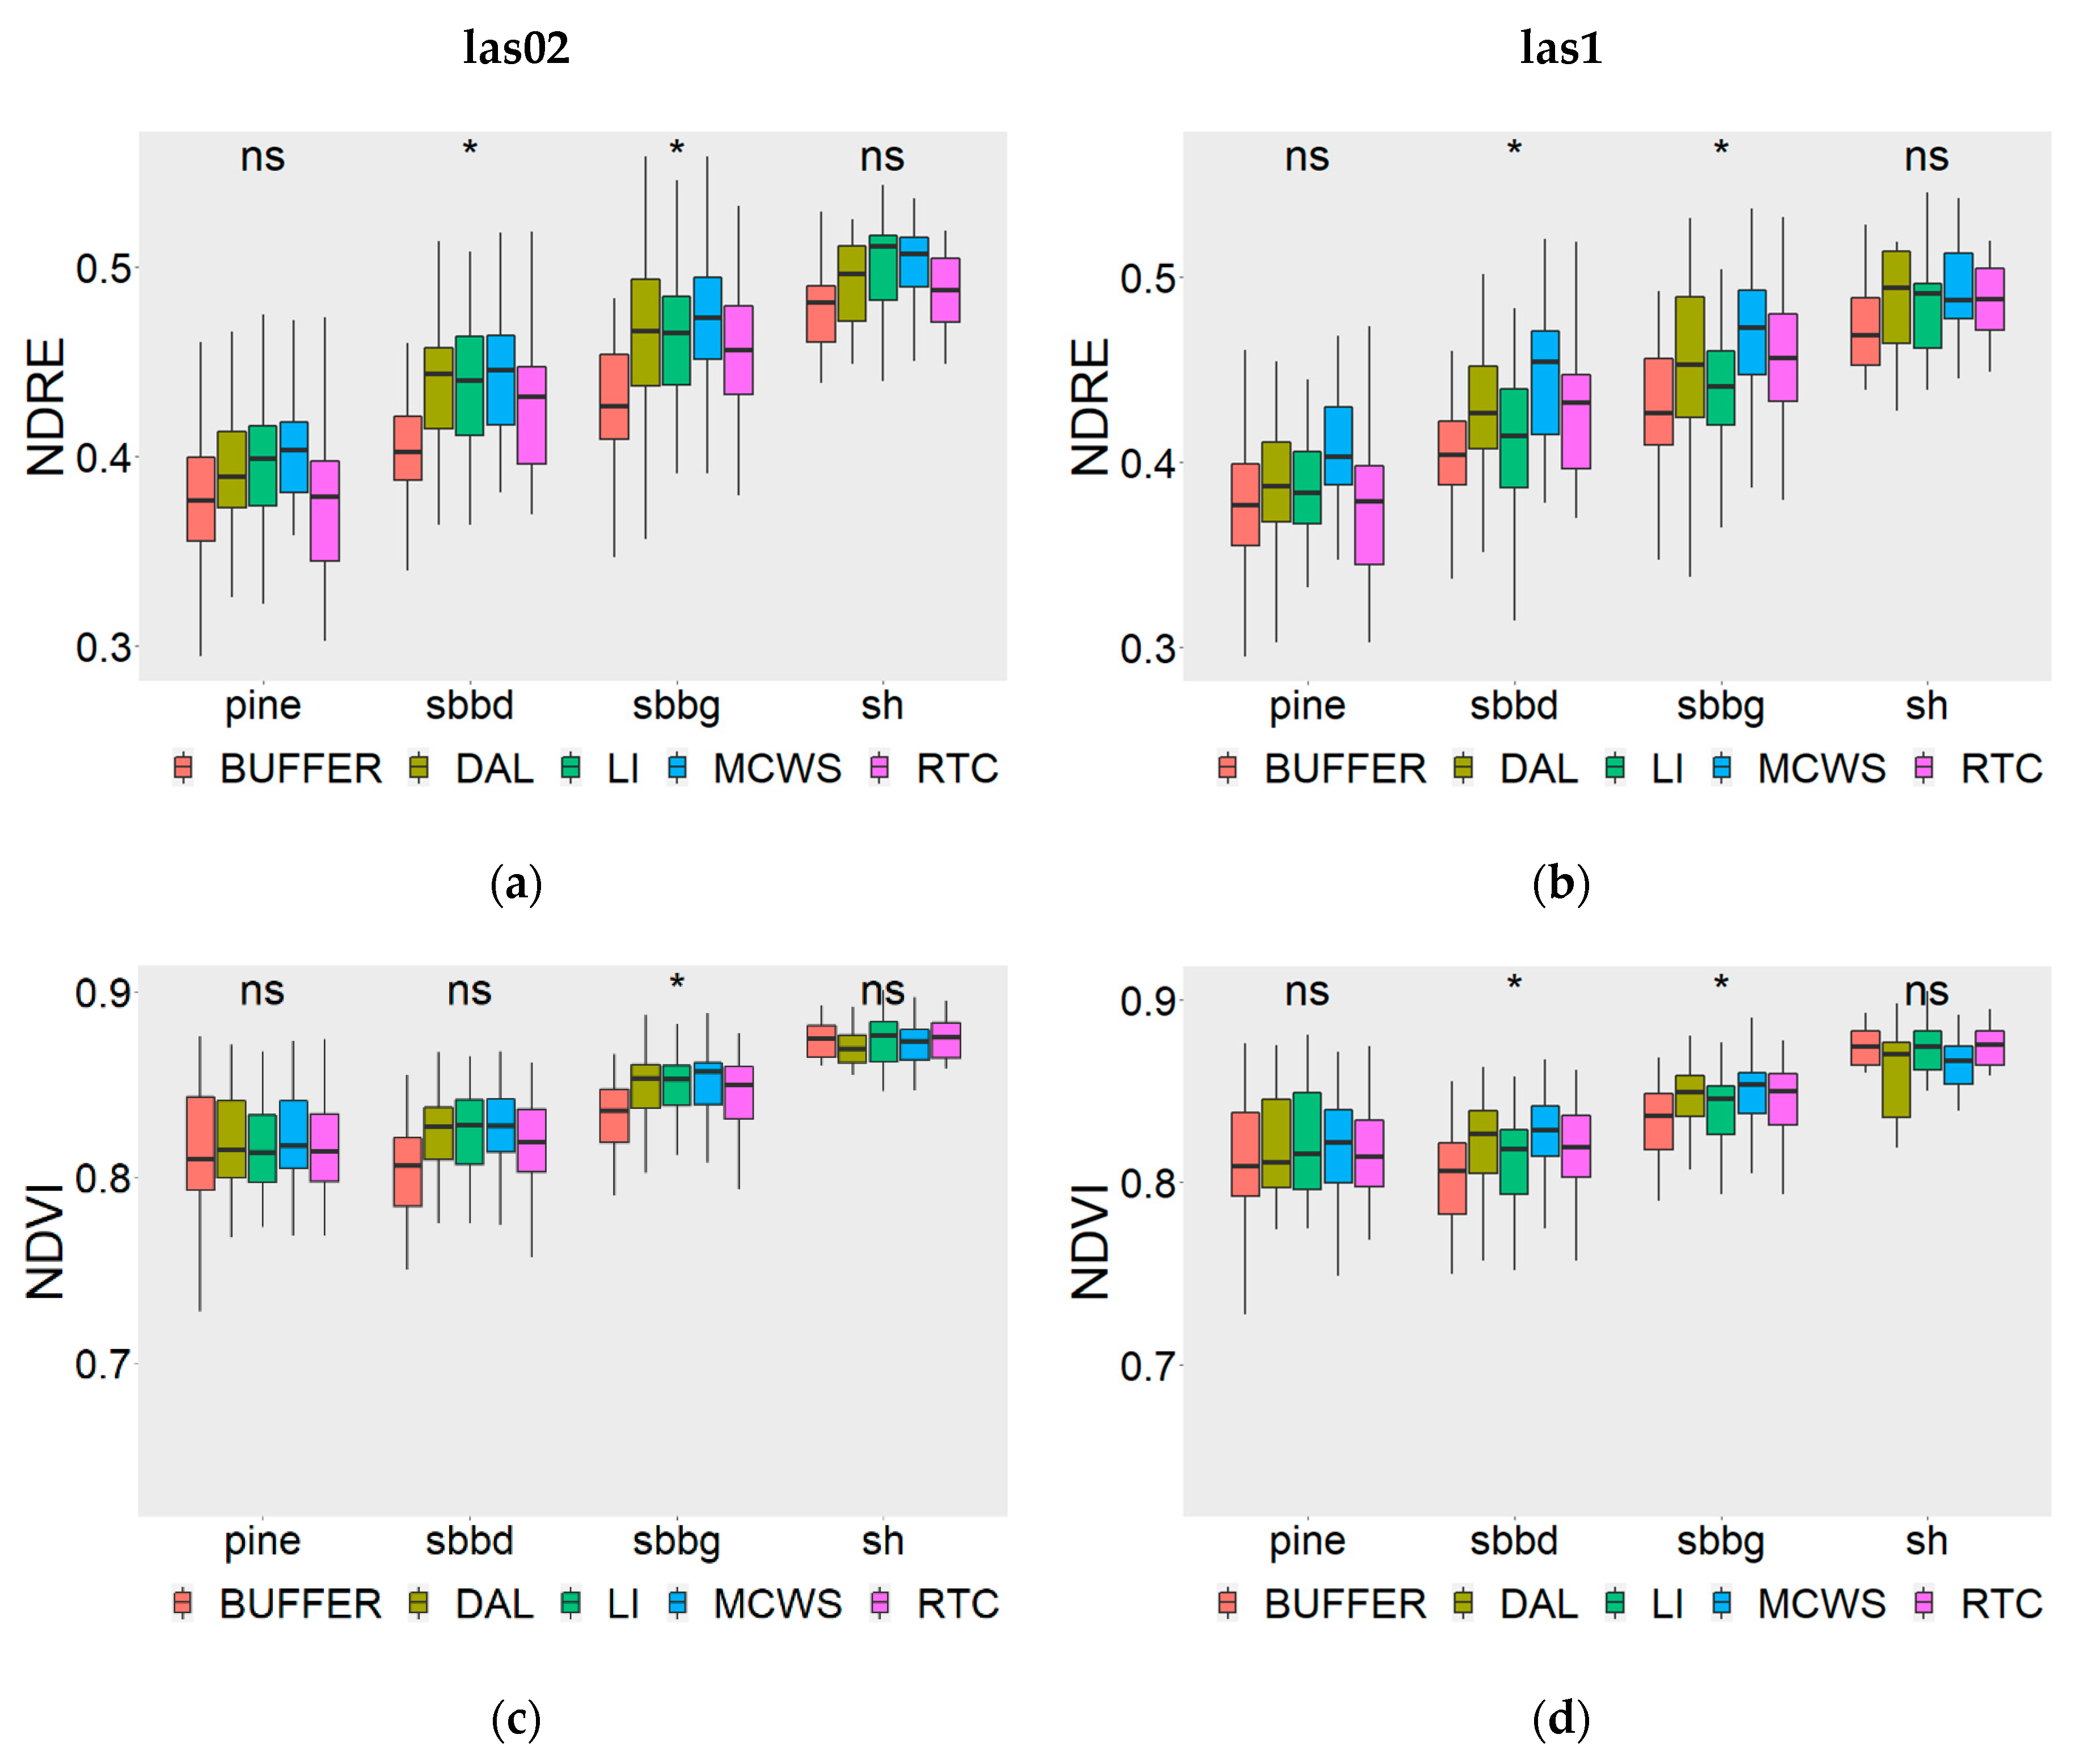
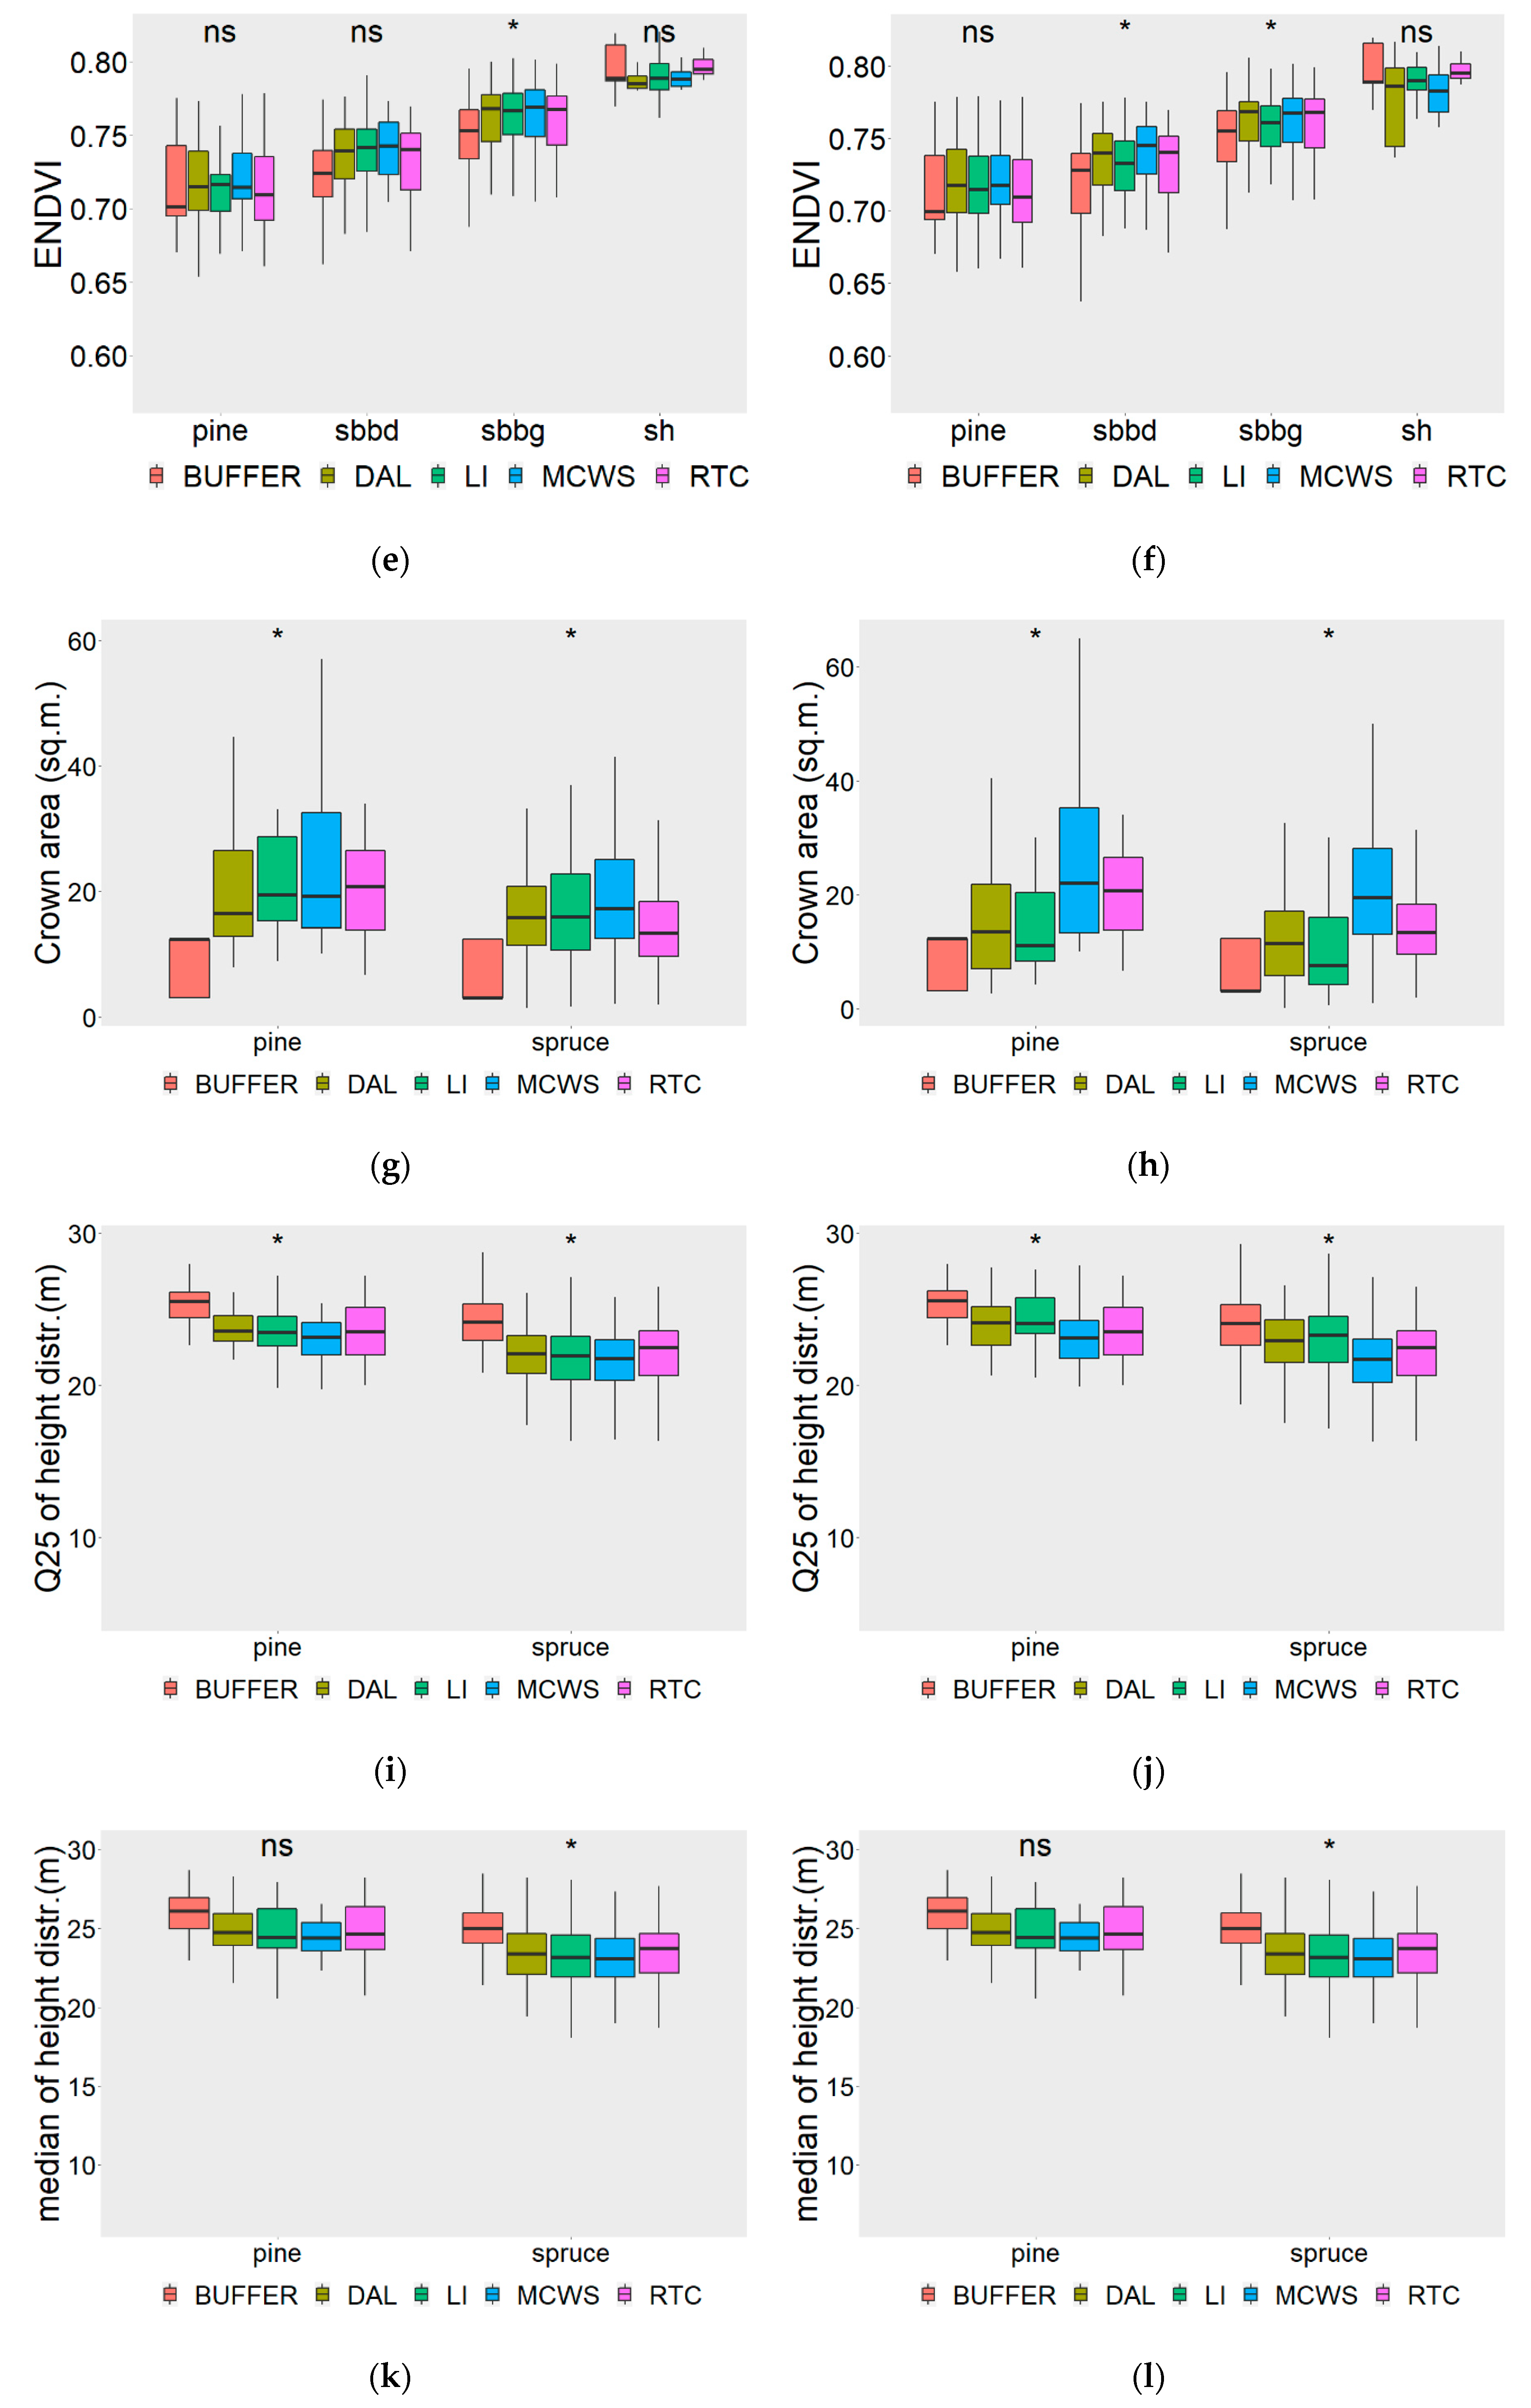
The Kruskal–Wallis test revealed some significant differences among extracted feature statistics of RTC and automatically delineated crowns of las02 and las1 within disturbance classes (Figure 4). The statistical testing results were similar, although the delineated crowns of las1 showed a higher variance of extracted statistics within the group and also between groups. These variations are visible mainly for spectral features that are key to separate disturbance classes of spruce trees (Figure 4b,d,f). They are caused by less accurate ITCD of las1 and they increase the uncertainty of disturbance classes separation.
Figure 4 also illustrates the result presented in Table 10. If the RTC classes’ boxplots highly overlap (NDVI and ENDVI boxplots of pine-sbbd NDRE boxplots of sbbg and sh), there is no significant difference. Moreover, the NDRE and crown area features are less resistant to inaccurate ITCD than NDVI, ENDVI and quartile elevation features resulting in higher variance. This lack of robustness may potentially limit these features for bark beetle disturbance detection. These findings are consistent with the results of statistical testing presented in Table 10. All disturbance classes were separable using at least one of the selected spectral or elevation features. However, no VI was able to distinguish between all disturbance classes by itself. The NDVI and ENDVI indices were able to separate all stages of bark beetle attack which makes them more appropriate for bark beetle disturbance detection. However, these indices are not able to separate pines from spruces. Nevertheless, the application of elevation features alone is barely relevant for bark beetle infestation detection. Therefore, we recommend the mixture of spectral and elevation features. This set of features can serve as a starting point for similar studies.
The significant differences among delineation methods were revealed only within sbbd and sbbg class of spectral features. The significant variances among delineation methods were obtained within each tree species class of all elevation features. These significant differences were further investigated using post-hoc treatment (BUFFER, DAL, LI, MCWS) versus control (RTC) multiple comparisons tests of each dataset for spectral (Table 11) and elevation (Table 12) features.
The results showed that extracted features from AITC polygons of the BUFFER method significantly differed from RTC in both PPCs because the polygon buffers covered only the crowns’ parts. BUFFER’s extracted spectral feature statistics differed significantly from RTC within sbbd and sbbg classes (Figure 4 and Table 11).
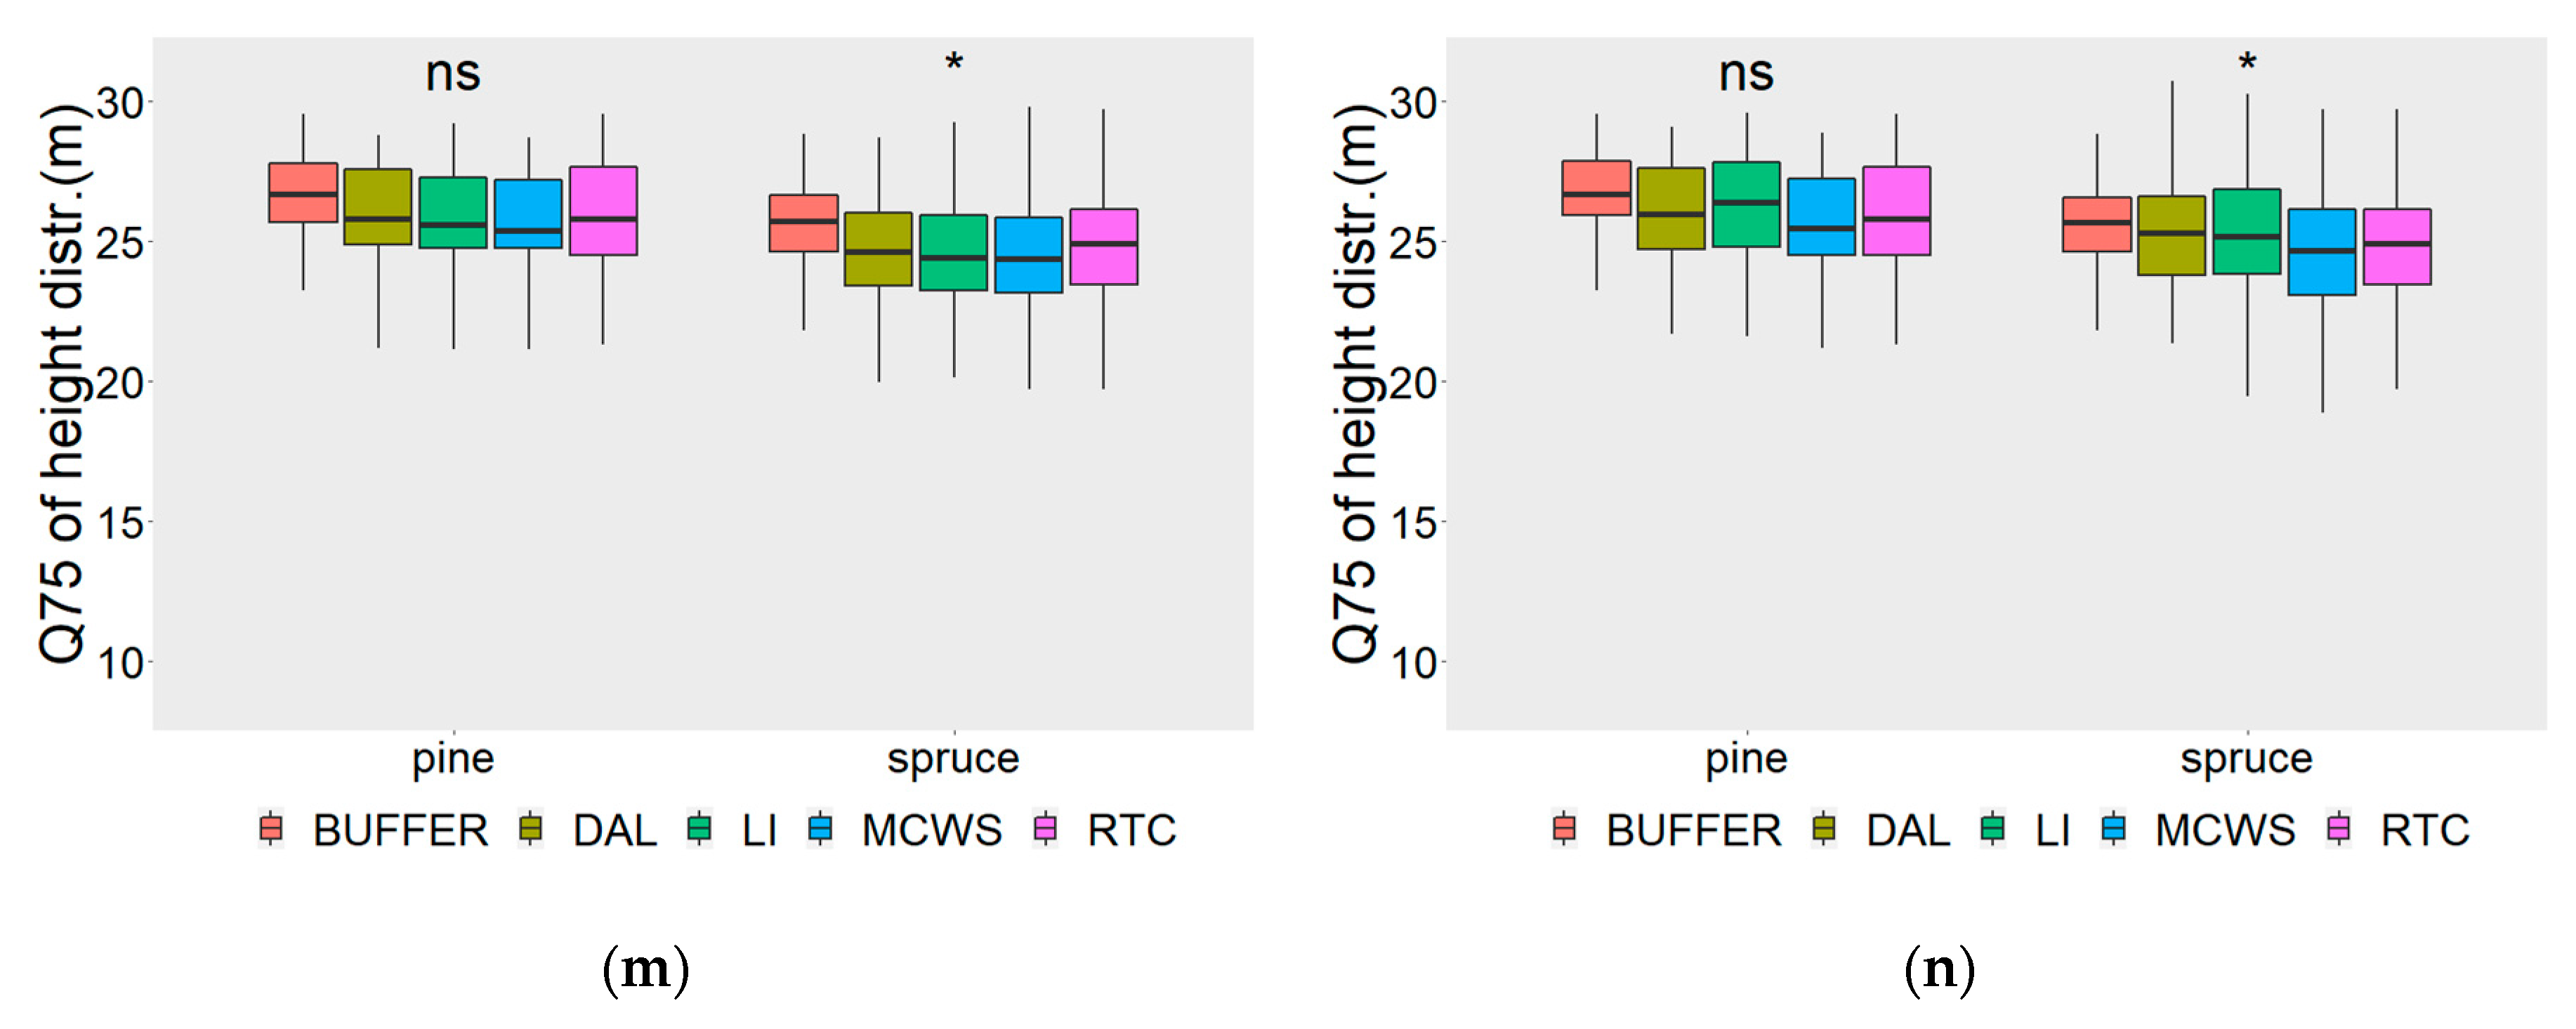
The limited extent of buffer polygons was more significant for elevation features than spectral features, especially in more massive crowns. It resulted in a much lower crown area compared to RTC and other delineation methods (Figure 4g–h). Moreover, the BUFFER method’s application resulted in higher quartile values of the tree heights because the buffer covered the topmost part of the trees. This, in fact, was more evident in the case of zq25 and median quartiles of spruce trees because no lower parts of tree crowns were present (Figure 4i–n, Table 12), increasing the quartile values.
In contrast, the automatic delineation methods based on PPC segmentation (DAL, MCWS, and LI) were more accurate than the BUFFER method. This resulted in almost no significant differences between the extracted spectral features of RTC and AITC polygons within disturbance classes, regardless of PPC density. The results revealed only the significant differences among RTC and LI NDRE values of more decimated las1 inside the sbbg class.
Due to the lower ITCD accuracy of the las1 dataset, there were significant differences among crown areas causally related to delineation’s geometrical accuracy. The MCWS method tended to slightly undersegment the crowns. The undersegmentation was more evident in las1 (Table 9), but it was also significant using las02. The undersegmentation resulted in significantly different (larger) crown areas compared to RTC (Table 12). In contrast, DAL and especially LI tended to oversegment the crowns in the case of strongly decimated las1 PPCs (see Table 9). This led to significant differences in these methods’ elevation features in the case of las1 because the AITC was oversegmented (smaller) compared to RTC (Figure 4h and Table 12). However, there were almost no significant differences in extracted elevation statistics among RTC and AITC of las02 regardless of the applied delineation method.
To fully understand the effect of PPC decimation on feature extraction and consequent differences between las02 and las1 within treatment versus control tests (Table 11 and Table 12, highlighted in yellow), we additionally performed a Kruskal–Wallis test between treatments (RTC, las02, and las02) of each method within each class for all features. The results were entirely in line with the changes presented in Table 11 and Table 12. The changes in treatments versus control test results of las02 and las1 within the same disturbance class and feature were caused by significant differences between the tested statistics of las02 and las1. Therefore, the lower PPC density negatively and significantly affected the feature extraction in these cases. Moreover, it could be concluded that the method most sensitive to the decimation of the PPC is the LI method, because the ITCD was performed directly using a decimated PPC instead of CHM.
Based on the experimental results of this subsection, several conclusions were made. The selected spectral and elevation features are suitable for bark beetle disturbance detection documented by excellent disturbance class separability of RTC. The BUFFER method is less suitable for detecting bark beetle disturbance in the mixed forest using the individual tree-based approach because of the simplicity of crown delineation around treetop. The buffers’ application led to significant differences in extracted feature statistics compared to RTC using the Kruskal–Wallis test and post hoc treatment versus control multiple comparisons tests. Therefore, these significant dissimilarities reduce the separability of disturbance classes, especially tree species, using the BUFFER method. The other methods (DAL, MCWS, and LI), which delineated the full crown based on PPC or subsequently derived CHM, led to insignificant differences of extracted feature statistics compared to RTC. However, these methods are affected by PPC density. The more decimated PPC las1 revealed significant differences in extracted feature statistics (especially elevation features) compared to RTC due to significantly lower crown delineation accuracy caused by low point density. If the PPC is sparse (less than 4 points/m2), it results in undersegmentation (MCWS) or oversegmentation (DAL and LI) of delineated crows, which negatively affect the feature extraction. The PPC-based delineation method (LI) is more sensitive to the cloud’s point density than CHM-based methods. Therefore, we assume that the most accurate and the most robust to point density is the watershed segmentation for detecting bark beetle infestation using the individual tree-based approach. Moreover, the spectral features are more robust to the ITCD variability of applied methods and the lower PPC density because the significant differences between RTC and delineated crowns were less frequent than for elevation features. It is an advantage for bark beetle infestation detection.
4. Discussion
4.1. The Effect of Vegetation Mask
The excellent separability of targeted conifer trees from the background was obtained using simple spectral threshold masks. Traditionally, thresholding has been used for shadow detection [77,78], but it can be used for any classification problem when a clear separation is observed in bimodal distribution [79]. The idea of applying vegetation masks before the ITCD was inspired by previous studies using vegetation threshold masks for classification problems. The ExG index threshold mask was successfully applied to separate green crops from bare soil using object-based image analysis in Torres-Sanchéz et al. [55]. Otsu et al. [80] conducted per pixel classification of tree crown defoliation using nested histogram thresholding. The authors suggested to include a CHM model to automatically delineate individual tree crowns and classify only the pixels forming the crowns. This nested histogram threshold classification was improved by Cardil et al. [56], who classified pine processionary moth defoliation per pixel in automatically segmented crowns. Compared to above mentioned forestry studies that applied thresholding for per-pixel classification after ITCD or with no ITCD, we applied vegetation threshold mask to PPC before the ITCD. Therefore, only the targeted conifer tree crowns were delineated for bark beetle disturbance detection in the mixed urban forest using the individual tree-based approach. This saves computation time because only the targeted trees are delineated. Moreover, the vegetation mask application significantly increased the similarity of AITC compared to RTC, which is documented in Figure 3. Therefore, we suggest applying a proper vegetation mask to PPCs before the ITCD. To our knowledge, this approach is novel, and it has benefits for specific tree species disturbance detection because of the findings mentioned earlier.
The suitability of combined vegetation threshold masks to separate targeted conifer trees was confirmed in this study. We took advantage of imaging time when conifers were the only green vegetation on the orthomosaic to apply a “green” threshold mask using the ExG index that has accentuated the green vegetation in the remotely sensed images [81,82]. Moreover, the application of a mask before the ITCD reduced the imaging time’s adverse side effects. The imaging time allowed the distinction between evergreen conifers and deciduous trees, and deciduous tree crowns resulted in multiple false-positive treetops detection in their crowns. Therefore, the separation of conifers could be problematic using this approach if the imaging is conducted when deciduous trees are not shed. In this case, the nested histogram threshold method [80] or unsupervised classification [83,84] could be tested for a conifer tree or directly spruce tree PPC masking.
4.2. The Effect of Point Density to ITCD Accuracy
The results revealed the strong effect of PPC density on treetops detection and ITCD. According to our experimental results, overly dense original photogrammetric PPC (701 points/m2) resulted in many FP treetops using local maxima filtering. These FP treetops could cause subsequent oversegmentation, but they were reduced by applying the combi mask. We discovered that multiple seed points formed these FN treetops. Due to the extreme point density of the original photogrammetric PPC, the treetop was formed by multiple points of equal height overlapping each other selected by the local maxima filter. In contrast, the ITCD delineation accuracy of the most decimated PPC las1 (1 point/m2) was significantly lower compared to las03, las02, and las01 (10–85 points/m2). Although the significantly lower ITCD accuracy of las 05 (4 points/m2) was not confirmed, the result showed starting undersegmentation of DAL and LI methods. Therefore, it seems optimal to reduce the point density of photogrammetric PPCs to high-density ALS data because too dense or too sparse PPCs negatively affect the treetop identifications and ITCD accuracy.
These findings are novel because very little research has investigated the effect of photogrammetric PPC density on ITCD up to date, even though this effect is examined in studies using ALS and the performance of ITCD is primarily limited by the availability of high-density LiDAR data [85]. Nevertheless, our findings are consistent with the previous studies focusing on the ALS PPC density affecting ITCD accuracy. Reitberger et al. [86] and Yao et al. [87] concluded that a point density higher than 10 points/m2 did not significantly lead to the ITCD accuracy improvement. Kandare et al. [88] discovered that the PPC density from 6 to 50 points/m2 did not improve the ITCD accuracy, but lower values (<6 points/m2) were significantly less accurate using the same delineation method. However, Wallace et al. [43] examined that the increase in point density from 5 to 50 points/m2 led to a significant improvement in the omission error rate. Moreover, the recent study of Guerra-Hernándéz et al. [89] comparing the UAS-derived PPC (48.85 or 96.63 points/m2) to ALS (44.33 points/m2) concluded that they are comparable at the plot level.
The ITCD accuracy is likely to vary depending on the tree species composition in the forest. Therefore, it is hard to find the strict minimum point density for ITCD [43]. Nevertheless, the ITCD accuracy achieved in this study is superior compared to two recent comparative studies focused on ITCD in a mixed forest. Hastings et al. [61] reached the best DA accuracy score of 0.69 for conifer trees in a mixed temperate forest using the airborne LiDAR data with a density of 26.98 points/m2. Gu et al. [44] obtained an average QR accuracy from 0.70 to 0.87 for CHM-based ITCD derived from UAS images using MCWS in a dense mixed forest during vegetation season which decreased the accuracy.
This paper showed that the point density was found to be more significant than the algorithm used. If the point density was high, the accuracy of the methods was comparable, resulting in the tied ranks (see Table 9). This finding is consistent with Wallace et al. [43], who showed that the increase of point density from 5 to 50 points/m2 was more significant than the algorithm used for ITCD. However, this is contrary to previous findings of Kaartinen et al. [90] and Reitberger et al. [86]. This is because these studies compared only relatively sparse PPCs using 2–5points/m2 per tree. Therefore, they are comparable only to las05 and las01 used in this study, which reveals significant accuracy differences among ITCD methods.
Concerning our experimental results and previous findings, we suggest decimating the photogrammetric PPC to the point spacing of high-dense LiDAR PPC (~20–60 points/m2, 10 points/m2 minimum) for ITCD of conifer trees in a mixed urban forest. An additional argument for decimation is that state-of-the-art algorithms are designed for airborne or UAS LiDAR data with a density of around 50 points/m2 [91]. However, modern photogrammetric software allows users to control the PPC density during the processing. Therefore, further research may be directed to comparing differently dense PPCs exported from photogrammetric software to ultra-dense PPC decimation for ITCD.
4.3. The Effect Segmentation Methods to ITCD Accuracy and Feature Extraction
The results showed that the BUFFER method’s application led to significantly different extracted feature statistics than RTC because the polygon buffers covered only the crowns’ topmost parts, which also resulted in low ITCD accuracy. The BUFFER method was not superior in feature extraction compared to methods delineating the full crown (DAL, MCWS, and LI). This finding contrasts with the preliminary assumption that automatic ITCD methods would lead to significant differences in extracted feature statistics due to the presence of mixels. This assumption was not confirmed because ITCD techniques could delineate the crowns more precisely than we expected. The results showed the superior performance of automated ITCD methods. Moreover, the ITCD methods applied to the same PPC are comparable, revealing only minor variation in feature extraction which are consistent with Hastings et al. [61] This resulted in almost no significant differences among extracted feature statistics of these methods and RTC. Therefore, they could substitute the time-consuming manual tree crown delineation for detecting bark beetle disturbance using an individual tree-based approach.
Concerning our experimental results, the superior ITCD accuracy was obtained using the CHM-based MCWS method when the method was applied to more decimated PPCs (las05 and las1). In the study of Hastings et al. [61] using ALS, the LI PPC segmentation method marginally outperformed the CHM-based delineation methods using a high-density PPC. Even if this seems to be in contrast with our results, it is not. We investigated that the LI method is the most sensitive to the decimation of the PPC, because the ITCD was performed directly using a decimated PPC instead of CHM. Therefore, we documented the same effect in an opposite way in this study. The LI method performs well only when applied to a high-density PPC. This finding is consistent with Wallace et al. [43]. They found that the most significant improvement of tree crown delineation after increasing the point density from 5 to 50 points/m2 was for algorithms using PPC directly for ITCD (including LI). The other reason for this inconsistency (except for the point density) is that the photogrammetric PPC does not penetrate the crowns compared to LiDAR, and we have not assessed the understory vegetation. According to Aubry-Kientz et al. [92], PPC-based methods outperform CHM-based methods in detecting and delineating understory and suppressed crowns, but there is less of an advantage for delineation of canopy trees. Therefore, it was investigated that the point density affects the feature extraction more significantly than the algorithm used in this study (see Table 11 and Table 12).
4.4. Application of Tree-Based Approach to the Detection of Forest Disturbance
A pixel-based approach is problematic at submetric imagery because the pixel size is much smaller than the mapping unit [21]. Branches and branches’ shadows cause spectral variation within the tree crown, the spatial context of individual tree crowns, and the distinction between the crown area and the background disappears [22]. These issues can limit an image interpretation using a pixel-based approach for the detection of bark beetle driven forest disturbance, especially in a mixed forest because other conifer tree species (e.g., pines) may show a similar spectral response to infested trees. Our study detected the spectral similarity among disturbance classes of pines and sbbd using common NDVI and ENDVI indices and sbbg and sh using NDRE index. One way to overcome this issue is to test more vegetation indices to distinguish between disturbance classes [93,94,95]. Another option is state-of-the-art object-based segmentation to detect forest disturbance [80,96,97]. A more advanced approach also adds CHM to segmentation, e.g., [98]. However, this approach still does not include precise ITCD. Tree crowns are usually formed from more segments because generated segments are delineated using spectral, spatial contextual information [99], but no information about individual trees (e.g., treetop seed points) is included. Therefore, the most advanced approach entirely substituting traditional forest survey of bark beetle disturbance is an individual tree-based approach.
The ITCD using the BUFFER method can be considered as a fundamental individual tree-based approach. Our experimental results revealed significant differences in the extracted feature statistics among BUFFER crowns and RTC due to the limited and simplified crown delineation. The median index values extracted from buffers were equal to or lower than the values of reference crowns because the buffers covered only the topmost part of the tree crowns, where the index values of infested classes (sbbd and sbbg) were lower due to discoloration caused by bark beetle infestation. This is an advantage for bark beetle infestation detection, but here we considered the statistically significant differences of extracted feature statistics between RTCs and automatically delineated crowns. Nevertheless, we additionally performed a statistical test (see Appendix B) to investigate the disturbance class separability using extracted spectral feature statistics from the BUFFER crows within las02. The results showed that infested trees are not separable from pines based only on spectral features. However, they are separable from each other. This finding is consistent with Klouček et al. [40], who successfully applied ITCD using buffers to detect the bark-beetle disturbance in a spruce tree monoculture. Therefore, the BUFFER method is sufficient for bark-beetle detection in monocultures. However, it is not appropriate for bark beetle disturbance detection in a mixed forest to the limited and simplified crown delineation.
For the separation of other tree species showing similar spectral responses, it is beneficial to employ a full crown delineation using a photogrammetric PPC and a combination of spectral and elevation features. These findings are consistent with a previous study of Kampen et al. [42], who first implemented elevation metrics extracted from a CHM to the object-based classification of spruce tree vitality status. However, the ITCD was performed manually in this study, which would be time-consuming for practical usage. Nevertheless, based on our findings, we conclude that automatic ITCD methods can constitute a substitute for the time-consuming manual tree crown delineation for individual tree-based image analysis using the methodology suggested in this study.
5. Conclusions
This study aimed to compare current ITCD methods for individual tree crown feature extractions from UAS multispectral data to distinguish between the forest disturbance classes in a mixed urban forest. The extracted spectral and elevation feature statistics from automatically delineated tree crowns were compared to feature statistics of RTC. Moreover, the effect of vegetation mask and PPC density on the ITCD accuracy was investigated.
The BUFFER method is less suitable for detecting a bark beetle disturbance in a mixed forest using the individual tree-based approach because of the simplicity of crown delineation around a treetop. This caused significant differences in extracted feature statistics compared to RTC. In contrast, the extracted feature statistics of automatically delineated crowns produced by DAL, MCWS, and LI segmentation methods insignificantly differed from RTC. The delineation accuracy of these methods and subsequent feature extraction is affected more by PPC density than the method used. The ITCD methods applied to the same PPC are comparable, revealing only minor accuracy variation in feature extraction. A PPC density less than 4 points/m2 resulted in undersegmentation (MCWS) or oversegmentation (DAL and LI) of delineated crows, which negatively affected the feature extraction. The PPC-based delineation method (LI) is more sensitive to the cloud’s point density than CHM-based methods.
Based on our findings, we conclude that automatic ITCD methods may constitute a substitute for the time-consuming manual tree crown delineation method for individual tree-based bark beetle disturbance detection using the suggested methodology and high-density (>20 points/m2, 10 points/m2 minimum) photogrammetric PPC.
Author Contributions
Conceptualization, R.M. and J.L.; methodology, R.M.; software, R.M.; validation, R.M. and J.L.; formal analysis, R.M.; investigation, R.M., J.L. and T.L.; resources, R.M. and J.L.; data curation, R.M.; writing—original draft preparation, R.M., J.L. and T.L.; writing—review and editing, R.M., J.L. and T.L.; visualization, R.M.; supervision, J.L.; project administration, J.L. and R.M.; funding acquisition, J.L. and R.M. All authors have read and agreed to the published version of the manuscript.
Funding
This research was supported by the COST Action CA16219, project “Harmonization of UAS techniques for agricultural and natural ecosystems monitoring”, by the Prague Environment grant, project MHMP 54/12/013649 “Monitoring of bark beetle spread in Prague forests”, by the Charles University, project GA UK No. 824217 “Analysis of disturbance and regeneration of forest vegetation using UAV multispectral photogrammetry” and by the Czech Science Foundation project 19-05011S.
Conflicts of Interest
The authors declare no conflict of interest. The funders had no role in the design of the study; in the collection, analyses, or interpretation of data; in the writing of the manuscript, or in the decision to publish the results.
Appendix A
Parameters of automatic delineation algorithms in the structure of R command finally used in the study:
- lastrees(pointcloud, dalponte2016(chm, seed_point_dataset, th_tree = 10, th_seed = 0.65, th_cr = 0.75, max_cr = 14))
- lastrees(pointcloud, mcwatershed(chm, seed_point_dataset, th_tree = 10))
- lastrees(pointcloud, li2012(dt1 = 1.5, dt2 = 4, R = 0, Zu = 27, hmin = 10, speed_up = 3.5))
Appendix B

Table A1.
Investigation of the disturbance class separability using extracted spectral feature statistics from BUFFER crows within las02. The table shows a post-hoc multiple comparison test after Kruskal–Wallis test.
Table A1.
Investigation of the disturbance class separability using extracted spectral feature statistics from BUFFER crows within las02. The table shows a post-hoc multiple comparison test after Kruskal–Wallis test.
| Multiple Comparisons | NDRE | NDVI | ENDVI |
|---|---|---|---|
| pine-sbbd | F | F | F |
| pine-sbbg | T | F | T |
| pine-sh | T | T | T |
| sbbd-sbbg | T | T | T |
| sbbd-sh | T | T | T |
| sbbg-sh | F | T | T |
References
- Raffa, K.F.; Aukema, B.; Bentz, B.J.; Carroll, A.; Erbilgin, N.; Herms, D.A.; Hicke, J.A.; Hofstetter, R.W.; Katovich, S.; Lindgren, B.S.; et al. A Literal Use of “Forest Health” Safeguards against Misuse and Misapplication. J. For. 2009, 107, 276–277. [Google Scholar] [CrossRef]
- Millar, C.I.; Stephenson, N.L. Temperate forest health in an era of emerging megadisturbance. Science 2015, 349, 823–826. [Google Scholar] [CrossRef] [PubMed]
- Seidl, R.; Thom, D.; Kautz, M.; Martin-Benito, D.; Peltoniemi, M.; Vacchiano, G.; Wild, J.; Ascoli, D.; Petr, M.; Honkaniemi, J.; et al. Forest disturbances under climate change. Nat. Clim. Chang. 2017, 7, 395–402. [Google Scholar] [CrossRef] [PubMed] [Green Version]
- Lindner, M.; Maroschek, M.; Netherer, S.; Kremer, A.; Barbati, A.; Garcia-Gonzalo, J.; Seidl, R.; Delzon, S.; Corona, P.; Kolström, M.; et al. Climate change impacts, adaptive capacity, and vulnerability of European forest ecosystems. For. Ecol. Manag. 2010, 259, 698–709. [Google Scholar] [CrossRef]
- Wermelinger, B. Ecology and management of the spruce bark beetle Ips typographus—A review of recent research. For. Ecol. Manag. 2004, 202, 67–82. [Google Scholar] [CrossRef]
- Näsi, R.; Honkavaara, E.; Blomqvist, M.; Lyytikäinen-Saarenmaa, P.; Hakala, T.; Viljanen, N.; Kantola, T.; Holopainen, M. Remote sensing of bark beetle damage in urban forests at individual tree level using a novel hyperspectral camera from UAV and aircraft. Urban For. Urban Green. 2018, 30, 72–83. [Google Scholar] [CrossRef]
- Alvey, A.A. Promoting and preserving biodiversity in the urban forest. Urban For. Urban Green. 2006, 5, 195–201. [Google Scholar] [CrossRef]
- Tubby, K.V.; Webber, J.F. Pests and diseases threatening urban trees under a changing climate. Forestry 2010, 83, 451–459. [Google Scholar] [CrossRef] [Green Version]
- Aukema, J.E.; Leung, B.; Kovacs, K.; Chivers, C.; Britton, K.O.; Englin, J.; Frankel, S.J.; Haight, R.G.; Holmes, T.P.; Liebhold, A.M.; et al. Economic impacts of Non-Native forest insects in the continental United States. PLoS ONE 2011, 6, e24587. [Google Scholar] [CrossRef]
- Göthlin, E.; Schroeder, L.M.; Lindelöw, A. Attacks by Ips typographus and Pityogenes chalcographus on Windthrown Spruces (Picea abies) During the Two Years Following a Storm Felling. Scand. J. For. Res. 2000, 15, 542–549. [Google Scholar] [CrossRef]
- Lausch, A.; Heurich, M.; Gordalla, D.; Dobner, H.J.; Gwillym-Margianto, S.; Salbach, C. Forecasting potential bark beetle outbreaks based on spruce forest vitality using hyperspectral remote-sensing techniques at different scales. For. Ecol. Manag. 2013, 308, 76–89. [Google Scholar] [CrossRef]
- Coulson, R.N.; Amman, G.D.; Dahlsten, D.L.; DeMars Jr, C.J.; Stephen, F.M. Forest-Bark Beetle Interactions: Bark Beetle Population Dynamics. Integrated Pest Management in Pine-Bark Beetle Ecosystems; John Wiley & Sons: New York, NY, USA, 1985. [Google Scholar]
- Sprintsin, M. Combining land surface temperature and shortwave infrared reflectance for early detection of mountain pine beetle infestations in western Canada. J. Appl. Remote Sens. 2011, 5, 053566. [Google Scholar] [CrossRef]
- Niemann, K.O.; Visintini, F. Assessment of Potential for Remote Sensing Detection of Bark Beetle-Infested Areas during Green Attack; Natural Resources Canada, Canadian Forest Service, Pacific Forestry Centre: Victoria, BC, Canada, 2005. [Google Scholar]
- Cheng, T.; Rivard, B.; Sánchez-Azofeifa, G.A.; Feng, J.; Calvo-Polanco, M. Continuous wavelet analysis for the detection of green attack damage due to mountain pine beetle infestation. Remote Sens. Environ. 2010, 114, 899–910. [Google Scholar] [CrossRef]
- Senf, C.; Seidl, R.; Hostert, P. Remote sensing of forest insect disturbances: Current state and future directions. Int. J. Appl. Earth Obs. Geoinf. 2017, 60, 49–60. [Google Scholar] [CrossRef] [PubMed] [Green Version]
- Hall, R.J.; Castilla, G.; White, J.C.; Cooke, B.J.; Skakun, R.S. Remote sensing of forest pest damage: A review and lessons learned from a Canadian perspective. Can. Entomol. 2016, 148, S296–S356. [Google Scholar] [CrossRef]
- Fassnacht, F.E.; Latifi, H.; Ghosh, A.; Joshi, P.K.; Koch, B. Assessing the potential of hyperspectral imagery to map bark beetle-induced tree mortality. Remote Sens. Environ. 2014, 140, 533–548. [Google Scholar] [CrossRef]
- Foster, A.C.; Walter, J.A.; Shugart, H.H.; Sibold, J.; Negron, J. Spectral evidence of early-stage spruce beetle infestation in Engelmann spruce. For. Ecol. Manag. 2017, 384, 347–357. [Google Scholar] [CrossRef] [Green Version]
- Bater, C.W.; Wulder, M.A.; White, J.C.; Coops, N.C. Integration of LIDAR and Digital Aerial Imagery for Detailed Estimates of Lodgepole Pine (Pinus contorta) Volume Killed by Mountain Pine Beetle (Dendroctonus ponderosae). J. For. 2010, 108, 111–119. [Google Scholar]
- Wulder, M.A.; White, J.C.; Ortlepp, S.M.; Mora, B.; Coggins, S.; Coops, N.C.; Heath, J. Digital high spatial resolution aerial imagery to support forest health monitoring: The mountain pine beetle context. J. Appl. Remote Sens. 2012, 6, 062527. [Google Scholar] [CrossRef] [Green Version]
- Ke, Y.; Quackenbush, L.J. A review of methods for automatic individual tree-crown detection and delineation from passive remote sensing. Int. J. Remote Sens. 2011, 32, 4725–4747. [Google Scholar] [CrossRef]
- Gougeon, F.A. Comparison of possible multispectral classification schemes for tree crowns individually delineatedon high spatial resolution meis images. Can. J. Remote Sens. 1995, 21, 1–9. [Google Scholar] [CrossRef]
- Culvenor, D.S. TIDA: An algorithm for the delineation of tree crowns in high spatial resolution remotely sensed imagery. Comput. Geosci. 2002, 28, 33–44. [Google Scholar] [CrossRef]
- Wang, L.; Gong, P.; Biging, G.S. Individual Tree-Crown Delineation and Treetop Detection in High-Spatial-Resolution Aerial Imagery. Photogramm. Eng. Remote Sens. 2004, 70, 351–357. [Google Scholar] [CrossRef] [Green Version]
- Næsset, E. Airborne laser scanning as a method in operational forest inventory: Status of accuracy assessments accomplished in Scandinavia. Scand. J. For. Res. 2007, 22, 433–442. [Google Scholar] [CrossRef]
- White, J.C.; Coops, N.C.; Wulder, M.A.; Vastaranta, M.; Hilker, T.; Tompalski, P. Remote Sensing Technologies for Enhancing Forest Inventories: A Review. Can. J. Remote Sens. 2016, 42, 619–641. [Google Scholar] [CrossRef] [Green Version]
- Koch, B.; Heyder, U.; Welnacker, H. Detection of individual tree crowns in airborne lidar data. Photogramm. Eng. Remote Sens. 2006, 72, 357–363. [Google Scholar] [CrossRef] [Green Version]
- Meddens, A.J.H.; Hicke, J.A.; Vierling, L.A. Evaluating the potential of multispectral imagery to map multiple stages of tree mortality. Remote Sens. Environ. 2011, 115, 1632–1642. [Google Scholar] [CrossRef]
- Windrim, L.; Carnegie, A.J.; Webster, M.; Bryson, M. Tree Detection and Health Monitoring in Multispectral Aerial Imagery and Photogrammetric Pointclouds Using Machine Learning. IEEE J. Sel. Top. Appl. Earth Obs. Remote Sens. 2020, 13, 2554–2572. [Google Scholar] [CrossRef]
- Lisein, J.; Pierrot-Deseilligny, M.; Bonnet, S.; Lejeune, P. A photogrammetric workflow for the creation of a forest canopy height model from small unmanned aerial system imagery. Forests 2013, 4, 922–944. [Google Scholar] [CrossRef] [Green Version]
- Puliti, S.; Ørka, H.O.; Gobakken, T.; Næsset, E. Inventory of small forest areas using an unmanned aerial system. Remote Sens. 2015, 7, 9632–9654. [Google Scholar] [CrossRef] [Green Version]
- Fernández-álvarez, M.; Armesto, J.; Picos, J. LiDAR-based wildfire prevention in WUI: The automatic detection, measurement and evaluation of forest fuels. Forests 2019, 10, 148. [Google Scholar] [CrossRef] [Green Version]
- Guimarães, N.; Pádua, L.; Marques, P.; Silva, N.; Peres, E.; Sousa, J.J. Forestry Remote Sensing from Unmanned Aerial Vehicles: A Review Focusing on the Data, Processing and Potentialities. Remote Sens. 2020, 12, 1046. [Google Scholar] [CrossRef] [Green Version]
- Wallace, L.; Lucieer, A.; Malenovský, Z.; Turner, D.; Vopěnka, P. Assessment of Forest Structure Using Two UAV Techniques: A Comparison of Airborne Laser Scanning and Structure from Motion (SfM) Point Clouds. Forests 2016, 7, 62. [Google Scholar] [CrossRef] [Green Version]
- Guerra-Hernández, J.; González-Ferreiro, E.; Monleón, V.J.; Faias, S.P.; Tomé, M.; Díaz-Varela, R.A. Use of multi-temporal UAV-derived imagery for estimating individual tree growth in Pinus pinea stands. Forests 2017, 8, 300. [Google Scholar] [CrossRef]
- Panagiotidis, D.; Abdollahnejad, A.; Surový, P.; Chiteculo, V. Determining tree height and crown diameter from high-resolution UAV imagery. Int. J. Remote Sens. 2017, 38, 2392–2410. [Google Scholar] [CrossRef]
- Hussain, M.; Chen, D.; Cheng, A.; Wei, H.; Stanley, D. Change detection from remotely sensed images: From pixel-based to object-based approaches. ISPRS J. Photogramm. Remote Sens. 2013, 80, 91–106. [Google Scholar] [CrossRef]
- Näsi, R.; Honkavaara, E.; Lyytikäinen-Saarenmaa, P.; Blomqvist, M.; Litkey, P.; Hakala, T.; Viljanen, N.; Kantola, T.; Tanhuanpää, T.; Holopainen, M. Using UAV-based photogrammetry and hyperspectral imaging for mapping bark beetle damage at tree-level. Remote Sens. 2015, 7, 15467–15493. [Google Scholar] [CrossRef] [Green Version]
- Klouček, T.; Komárek, J.; Surový, P.; Hrach, K.; Janata, P.; Vašíček, B. The Use of UAV Mounted Sensors for Precise Detection of Bark Beetle Infestation. Remote Sens. 2019, 11, 1561. [Google Scholar] [CrossRef] [Green Version]
- Sothe, C.; Dalponte, M.; de Almeida, C.M.; Schimalski, M.B.; Lima, C.L.; Liesenberg, V.; Miyoshi, G.T.; Tommaselli, A.M.G. Tree species classification in a highly diverse subtropical forest integrating UAV-based photogrammetric point cloud and hyperspectral data. Remote Sens. 2019, 11, 1338. [Google Scholar] [CrossRef] [Green Version]
- Kampen, M.; Vienna, L.S.; Immitzer, M.; Vienna, L.S. UAV-Based Multispectral Data for Tree Species Classification and Tree Vitality Analysis. In Proceedings of the Dreiländertagung OVG—DGPF—SGPF, Wien, Austria, 28 August 2018–22 February 2019; pp. 623–639. [Google Scholar]
- Wallace, L.; Lucieer, A.; Watson, C.S. Evaluating tree detection and segmentation routines on very high resolution UAV LiDAR ata. IEEE Trans. Geosci. Remote Sens. 2014, 52, 7619–7628. [Google Scholar] [CrossRef]
- Gu, J.; Grybas, H.; Congalton, R.G. A Comparison of Forest Tree Crown Delineation from Unmanned Aerial Imagery Using Canopy Height Models vs. Spectral Lightness. Forests 2020, 11, 605. [Google Scholar] [CrossRef]
- MHMP. Klanovice Forest. In Prague Environment Yearbook Online; MHMP: Prague, Czech Republic; Available online: http://www.praha-priroda.cz/lesy/klanovicky-les/ (accessed on 15 September 2020).
- Hujslova, J.; Simandl, P. Windstorm Herwart in Czechia. Meteorol. Bull. 2018, 71, 61–63. [Google Scholar]
- Berec, L.; Doležal, P.; Hais, M. Population dynamics of Ips typographus in the Bohemian Forest (Czech Republic): Validation of the phenology model PHENIPS and impacts of climate change. For. Ecol. Manag. 2013, 292, 1–9. [Google Scholar] [CrossRef]
- Hlásny, T.; Krokene, P.; Liebhold, A.; Montagné-Huck, C.; Müller, J.; Qin, H.; Raffa, K.; Schelhaas, M.; Seidl, R.; Svoboda, M.; et al. Living with Bark Beetles: Impacts, Outlook and Management Options; European Forest Institute: Joensuu, Finland, 2019. [Google Scholar]
- Toffin, E.; Gabriel, E.; Louis, M.; Deneubourg, J.L.; Grégoire, J.C. Colonization of weakened trees by mass-attacking bark beetles: No penalty for pioneers, scattered initial distributions and final regular patterns. R. Soc. Open Sci. 2018, 5, 170454. [Google Scholar] [CrossRef] [PubMed] [Green Version]
- Agisoft LLC. MicaSense RedEdge MX Processing Workflow (including Reflectance Calibration) in Agisoft Metashape Professional. Available online: https://agisoft.freshdesk.com/support/solutions/articles/31000148780-micasense-rededge-mx-processing-workflow-including-reflectance-calibration-in-agisoft-metashape-pro (accessed on 5 September 2020).
- Christiansen, E.; Franceshi, V.R.; Nagy, N.E.; Krekling, T.; Berryman, A.A.; Krokene, P.; Solheim, H. Traumatic Resin Duct Formation in Norway Spruce (Picea abies (L.) Karst.) after Wounding or Infection with a Bark Beetle-Associated Blue-Stain Fungus, Ceratocystis Polonica Siem; Colloq. l’INRA: Paris, France, 1999. [Google Scholar]
- Verhoeven, G. Taking computer vision aloft - archaeological three-dimensional reconstructions from aerial photographs with photoscan. Archaeol. Prospect. 2011, 18, 67–73. [Google Scholar] [CrossRef]
- Agisoft LLC. Agisoft Metashape. Available online: https://www.agisoft.com (accessed on 23 September 2020).
- Roussel, J.R.; Auty, D.; Coops, N.C.; Tompalski, P.; Goodbody, T.R.H.; Meador, A.S.; Bourdon, J.F.; de Boissieu, F.; Achim, A. lidR: An R package for analysis of Airborne Laser Scanning (ALS) data. Remote Sens. Environ. 2020, 251, 112061. [Google Scholar] [CrossRef]
- Torres-Sánchez, J.; López-Granados, F.; Peña, J.M. An automatic object-based method for optimal thresholding in UAV images: Application for vegetation detection in herbaceous crops. Comput. Electron. Agric. 2015, 114, 43–52. [Google Scholar] [CrossRef]
- Cardil, A.; Otsu, K.; Pla, M.; Silva, C.A.; Brotons, L. Quantifying pine processionary moth defoliation in a pine-oak mixed forest using unmanned aerial systems and multispectral imagery. PLoS ONE 2019, 14, e0213027. [Google Scholar] [CrossRef]
- Dalponte, M.; Coomes, D.A. Tree-centric mapping of forest carbon density from airborne laser scanning and hyperspectral data. Methods Ecol. Evol. 2016, 7, 1236–1245. [Google Scholar] [CrossRef] [Green Version]
- Meyer, F.; Beucher, S. Morphological segmentation. J. Vis. Commun. Image Represent. 1990, 1, 21–46. [Google Scholar] [CrossRef]
- Li, W.; Guo, Q.; Jakubowski, M.K.; Kelly, M. A New Method for Segmenting Individual Trees from the Lidar Point Cloud. Photogramm. Eng. Remote Sens. 2012, 78, 75–84. [Google Scholar] [CrossRef] [Green Version]
- Xiao, W.; Zaforemska, A.; Smigaj, M.; Wang, Y.; Gaulton, R. Mean shift segmentation assessment for individual forest tree delineation from airborne lidar data. Remote Sens. 2019, 11, 1263. [Google Scholar] [CrossRef] [Green Version]
- Hastings, J.H.; Ollinger, S.V.; Ouimette, A.P.; Sanders-DeMott, R.; Palace, M.W.; Ducey, M.J.; Sullivan, F.B.; Basler, D.; Orwig, D.A. Tree species traits determine the success of LiDAR-based crown mapping in a mixed temperate forest. Remote Sens. 2020, 12, 309. [Google Scholar] [CrossRef] [Green Version]
- Popescu, S.C.; Wynne, R.H. Seeing the Trees in the Forest. Photogramm. Eng. Remote Sens. 2004, 70, 589–604. [Google Scholar] [CrossRef] [Green Version]
- Wulder, M.; Niemann, K.O.; Goodenough, D.G. Local maximum filtering for the extraction of tree locations and basal area from high spatial resolution imagery. Remote Sens. Environ. 2000, 73, 103–114. [Google Scholar] [CrossRef]
- Hais, M.; Wild, J.; Berec, L.; Brůna, J.; Kennedy, R.; Braaten, J.; Brož, Z. Landsat Imagery Spectral Trajectories—Important Variables for Spatially Predicting the Risks of Bark Beetle Disturbance. Remote Sens. 2016, 8, 687. [Google Scholar] [CrossRef] [Green Version]
- Eysn, L.; Hollaus, M.; Lindberg, E.; Berger, F.; Monnet, J.M.; Dalponte, M.; Kobal, M.; Pellegrini, M.; Lingua, E.; Mongus, D.; et al. A benchmark of lidar-based single tree detection methods using heterogeneous forest data from the Alpine Space. Forests 2015, 6, 1721–1747. [Google Scholar] [CrossRef] [Green Version]
- Khosravipour, A.; Skidmore, A.K.; Isenburg, M.; Wang, T.; Hussin, Y.A. Generating pit-free canopy height models from airborne lidar. Photogramm. Eng. Remote Sen. 2014, 80, 863–872. [Google Scholar] [CrossRef]
- Yin, D.; Wang, L. How to assess the accuracy of the individual tree-based forest inventory derived from remotely sensed data: A review. Int. J. Remote Sens. 2016, 37, 4521–4553. [Google Scholar] [CrossRef]
- Leckie, D.G.; Jay, C.; Gougeon, F.A.; Sturrock, R.N.; Paradine, D. Detection and assessment of trees with Phellinus weirii (laminated root rot) using high resolution multi-spectral imagery. Int. J. Remote Sens. 2004, 25, 793–818. [Google Scholar] [CrossRef]
- Lamar, W.R.; McGraw, J.B.; Warner, T.A. Multitemporal censusing of a population of eastern hemlock (Tsuga canadensis L.) from remotely sensed imagery using an automated segmentation and reconciliation procedure. Remote Sens. Environ. 2005, 94, 133–143. [Google Scholar] [CrossRef]
- Weidner, U. Contribution to the assessment of segmentation quality for remote sensing applications. Int. Arch. Photogramm. Remote Sens. Spat. Inf. Sci. 2008, 37, 479–484. [Google Scholar]
- Chen, Y.; Ming, D.; Zhao, L.; Lv, B.; Zhou, K.; Qing, Y. Review on high spatial resolution remote sensing image segmentation evaluation. Photogramm. Eng. Remote Sen. 2018, 84, 629–646. [Google Scholar] [CrossRef]
- Siegel, S.; Castellan, N.J.J. Non-Parametric Statistics for the Behavioural Sciences; McGraw-Hill: New York, NY, USA, 1988. [Google Scholar]
- R core team. R: A Language and Environment for Statistical Computing. Available online: https://www.r-project.org/ (accessed on 21 September 2020).
- Tucker, C.J. Red and photographic infrared linear combinations for monitoring vegetation. Remote Sens. Environ. 1979, 8, 127–150. [Google Scholar] [CrossRef] [Green Version]
- Barnes, E.M.; Clarke, T.R.; Richards, S.E.; Colaizzi, P.D.; Haberland, J.; Kostrzewski, M.; Waller, P.; Choi, C.; Riley, E.; Thompson, T.; et al. Coincident detection of crop water stress, nitrogen status and canopy density using ground based multispectral data. In Proceedings of the Fifth International Conference on Precision Agriculture, Bloomington, MN, USA, 16–19 July 2000. [Google Scholar]
- Strong, C.J.; Burnside, N.G.; Llewellyn, D. The potential of small-Unmanned Aircraft Systems for the rapid detection of threatened unimproved grassland communities using an Enhanced Normalized Difference Vegetation Index. PLoS ONE 2017, 12, e0186193. [Google Scholar] [CrossRef] [Green Version]
- Chen, Y.; Wen, D.; Jing, L.; Shi, P. Shadow information recovery in urban areas from very high resolution satellite imagery. Int. J. Remote Sens. 2007, 28, 3249–3254. [Google Scholar] [CrossRef]
- Adeline, K.R.M.; Chen, M.; Briottet, X.; Pang, S.K.; Paparoditis, N. Shadow detection in very high spatial resolution aerial images: A comparative study. ISPRS J. Photogramm. Remote Sens. 2013, 80, 21–38. [Google Scholar] [CrossRef]
- Aasen, H.; Honkavaara, E.; Lucieer, A.; Zarco-Tejada, P.J. Quantitative remote sensing at ultra-high resolution with UAV spectroscopy: A review of sensor technology, measurement procedures, and data correctionworkflows. Remote Sens. 2018, 10, 1091. [Google Scholar] [CrossRef] [Green Version]
- Otsu, K.; Pla, M.; Duane, A.; Cardil, A.; Brotons, L. Estimating the Threshold of Detection on Tree Crown Defoliation Using Vegetation Indices from UAS Multispectral Imagery. Drones 2019, 3, 80. [Google Scholar] [CrossRef] [Green Version]
- Peña, J.M.; Torres-Sánchez, J.; de Castro, A.I.; Kelly, M.; López-Granados, F. Weed Mapping in Early-Season Maize Fields Using Object-Based Analysis of Unmanned Aerial Vehicle (UAV) Images. PLoS ONE 2013, 8, e77151. [Google Scholar] [CrossRef] [Green Version]
- Torres-Sánchez, J.; Peña, J.M.; de Castro, A.I.; López-Granados, F. Multi-temporal mapping of the vegetation fraction in early-season wheat fields using images from UAV. Comput. Electron. Agric. 2014, 103, 104–113. [Google Scholar] [CrossRef]
- Schäfer, E.; Heiskanen, J.; Heikinheimo, V.; Pellikka, P. Mapping tree species diversity of a tropical montane forest by unsupervised clustering of airborne imaging spectroscopy data. Ecol. Indic. 2016, 64, 49–58. [Google Scholar] [CrossRef]
- Franklin, S.E. Pixel- and object-based multispectral classification of forest tree species from small unmanned aerial vehicles. J. Unmanned Veh. Syst. 2018, 6, 195–211. [Google Scholar] [CrossRef] [Green Version]
- Lindberg, E.; Holmgren, J. Individual Tree Crown Methods for 3D Data from Remote Sensing. Curr. For. Rep. 2017, 3, 19–31. [Google Scholar] [CrossRef] [Green Version]
- Reitberger, J.; Schnörr, C.; Krzystek, P.; Stilla, U. 3D segmentation of single trees exploiting full waveform LIDAR data. ISPRS J. Photogramm. Remote Sens. 2009, 64, 561–574. [Google Scholar] [CrossRef]
- Yao, W.; Krull, J.; Krzystek, P.; Heurich, M. Sensitivity analysis of 3D individual tree detection from LiDAR point clouds of temperate forests. Forests 2014, 5, 1122–1142. [Google Scholar] [CrossRef] [Green Version]
- Kandare, K.; Ørka, H.O.; Chan, J.C.W.; Dalponte, M. Effects of forest structure and airborne laser scanning point cloud density on 3D delineation of individual tree crowns. Eur. J. Remote Sens. 2016, 49, 337–359. [Google Scholar] [CrossRef] [Green Version]
- Guerra-Hernández, J.; Cosenza, D.N.; Rodriguez, L.C.E.; Silva, M.; Tomé, M.; Díaz-Varela, R.A.; González-Ferreiro, E. Comparison of ALS- and UAV(SfM)-derived high-density point clouds for individual tree detection in Eucalyptus plantations. Int. J. Remote Sens. 2018, 39, 5211–5235. [Google Scholar] [CrossRef]
- Kaartinen, H.; Hyyppä, J.; Yu, X.; Vastaranta, M.; Hyyppä, H.; Kukko, A.; Holopainen, M.; Heipke, C.; Hirschmugl, M.; Morsdorf, F.; et al. An International Comparison of Individual Tree Detection and Extraction Using Airborne Laser Scanning. Remote Sens. 2012, 4, 950–974. [Google Scholar] [CrossRef] [Green Version]
- Yan, W.; Guan, H.; Cao, L.; Yu, Y.; Li, C.; Lu, J.Y. A self-adaptive mean shift tree-segmentation method using UAV LiDAR data. Remote Sens. 2020, 12, 515. [Google Scholar] [CrossRef] [Green Version]
- Aubry-Kientz, M.; Dutrieux, R.; Ferraz, A.; Saatchi, S.; Hamraz, H.; Williams, J.; Coomes, D.; Piboule, A.; Vincent, G. A comparative assessment of the performance of individual tree crowns delineation algorithms from ALS data in tropical forests. Remote Sens. 2019, 11, 1086. [Google Scholar] [CrossRef] [Green Version]
- Adamczyk, J.; Osberger, A. Red-edge vegetation indices for detecting and assessing disturbances in Norway spruce dominated mountain forests. Int. J. Appl. Earth Obs. Geoinf. 2015, 37, 90–99. [Google Scholar] [CrossRef]
- Minařík, R.; Langhammer, J. Use of a multispectral uav photogrammetry for detection and tracking of forest disturbance dynamics. ISPRS—Int. Arch. Photogramm. Remote Sens. Spat. Inf. Sci. 2016, XLI-B8, 711–718. [Google Scholar] [CrossRef]
- Abdullah, H.; Darvishzadeh, R.; Skidmore, A.K.; Groen, T.A.; Heurich, M. European spruce bark beetle (Ips typographus, L.) green attack affects foliar reflectance and biochemical properties. Int. J. Appl. Earth Obs. Geoinf. 2018, 64, 199–209. [Google Scholar] [CrossRef] [Green Version]
- Lehmann, J.; Nieberding, F.; Prinz, T.; Knoth, C. Analysis of Unmanned Aerial System-Based CIR Images in Forestry—A New Perspective to Monitor Pest Infestation Levels. Forests 2015, 6, 594–612. [Google Scholar] [CrossRef] [Green Version]
- Brovkina, O.; Cienciala, E.; Surový, P.; Janata, P. Unmanned aerial vehicles (UAV) for assessment of qualitative classification of Norway spruce in temperate forest stands. Geo-Spat. Inf. Sci. 2018, 21, 12–20. [Google Scholar] [CrossRef] [Green Version]
- Hentz, A.M.K.; Strager, M.P. Cicada damage detection based on UAV spectral and 3D data. Silvilaser 2017, 10, 95–96. [Google Scholar]
- Blaschke, T. Object based image analysis for remote sensing. ISPRS J. Photogramm. Remote Sens. 2010, 65, 2–16. [Google Scholar] [CrossRef] [Green Version]
Figure 1.
Study area. (a) Location of Klánovice forest (yellow rectangle) and study area (orange rectangle) in Prague metropolitan area, (b) Study area on a multispectral image. The coordinate reference system is WGS 84/UTM zone 33N.
Figure 1.
Study area. (a) Location of Klánovice forest (yellow rectangle) and study area (orange rectangle) in Prague metropolitan area, (b) Study area on a multispectral image. The coordinate reference system is WGS 84/UTM zone 33N.

Figure 2.
The processing workflow suggested in this study. Steps marked with * are optional regarding to used ITCD method. These steps are necessary for Dalponte2016 and Marker controlled watershed segmentation methods in this study.
Figure 2.
The processing workflow suggested in this study. Steps marked with * are optional regarding to used ITCD method. These steps are necessary for Dalponte2016 and Marker controlled watershed segmentation methods in this study.

Figure 3.
The results of vegetation masks application before the ITCD in the detail: (a) The LI segmentation method applied to point cloud directly. Segmented crowns using the ExG mask are highlighted in blue. Segmented crowns using no mask are highlighted in red. Reference crowns are highlighted in green; (b) The MCWS segmentation method using seed points. The seed points are segmented in light blue. The identified treetops from PPC with no mask are highlighted in orange. Segmented crowns are highlighted in yellow. Reference crowns are highlighted in green; (c) The DAL segmentation method using seed points. The seed used points masked by combi mask in light blue. The identified treetops from PPC with no mask are highlighted in orange. Segmented crowns are highlighted in purple. Reference crowns are highlighted in green.


Figure 4.
The distribution of extracted individual tree crown features and significant differences among RTC and automatically delineated crowns within disturbance classes of the las02 dataset (left column) and las1 dataset (right column): (a) NDRE boxplots of las02; (b) NDRE boxplots of las1; (c) NDVI boxplots of las02; (d) NDVI boxplots of las1; (e) ENDVI boxplots of las02; (f) ENDVI boxplots of las1; (g) Crown area boxplots of las02; (h) Crown area boxplots of las1; (i) Q25 of height distribution boxplots of las02; (j) Q25 of height distribution boxplots of las1; (k) median of height distribution boxplots of las02; (l) median of height distribution boxplots of las1; (m) Q75 of height distribution boxplots of las02; (n) Q75 of height distribution boxplots of las1. * marks the significant differences (the significance level α = 0.05) among applied delineation methods within each feature’s class.


Table 1.
Spectral resolution of the MicaSense RedEdge-M camera used in the study.
| Band Number | Band Name | Center Wavelength (nm) | Bandwidth FWHM * (nm) |
|---|---|---|---|
| 1 | Blue | 475 | 20 |
| 2 | Green | 560 | 20 |
| 3 | Red | 668 | 10 |
| 4 | Red edge | 717 | 10 |
| 5 | Near infrared (NIR) | 840 | 40 |
* FWHM: full width at half maximum.
Table 2.
Descriptive statistics of reference tree crowns.
| Statistics | Crown Area (sq. m) |
|---|---|
| Mean | 15.79 |
| St. dev. | 7.80 |
| Minimum | 1.90 * |
| Maximum | 50.15 |
| Q1 | 9.95 |
| Median | 13.84 |
| Q3 | 19.90 |
| IQR | 9.95 |
* The second smallest crown area was 4.61 m2.
Table 3.
The classification of mature spruce trees based on the field investigation. N/A indicates that resin ducts were not used to classify the tree into sbbd class.
Table 3.
The classification of mature spruce trees based on the field investigation. N/A indicates that resin ducts were not used to classify the tree into sbbd class.
| Code | Tree Status | Canopy | Resin Ducts | N. of Trees | False Color Image * |
|---|---|---|---|---|---|
| sh | Live and not infested | needles green | absent | 12 |  |
| sbbg | green attack | needles green or light green | present | 69 |  |
| sbbd | damaged tree (“yellow attack”) | needles light green or yellow, light green needles dropped; bark flaked away by woodpeckers | N/A | 41 |  |
* Band combination 5–3–1.
Table 4.
Four automatic ITCD methods investigated in this study.
| Crow Delineation Method | Application to | Priority Seed Points | Reference |
|---|---|---|---|
| Dalponte2016 (DAL) | CHM | Y | [57] |
| Marker-control. watershed (MCWS) | CHM | Y | [58] |
| Li 2012 (LI) | Point cloud | N | [59] |
CHM: Canopy height model.
Table 5.
Overview of the UAS PPC datasets and their parameters used for the creation of treetop seed points dataset, CHM rasterization and ITCD. The original PPC was used only for preliminary treetop seed points creation.
Table 5.
Overview of the UAS PPC datasets and their parameters used for the creation of treetop seed points dataset, CHM rasterization and ITCD. The original PPC was used only for preliminary treetop seed points creation.
| Dataset | Decim. Grid (m) | lmf Function |
|---|---|---|
| las | N/A | f1/f2 |
| las01 | 0.1 | f1/f2 |
| las02 | 0.2 | f1/f2 |
| las03 | 0.3 | f1/f2 |
| las05 | 0.5 | f1/f2 |
| las1 | 1 | f1/f2 |
Table 6.
Vegetation indices used in this study. The band names correspond with Table 1.
Table 6.
Vegetation indices used in this study. The band names correspond with Table 1.
| Vegetation Index | Equation | Ref. |
|---|---|---|
| Normalized Difference Vegetation Index (NDVI) | [74] | |
| Normalized Difference Red-Edge index (NDRE) | [75] | |
| Enhanced Normalized Difference Vegetation Index (ENDVI) | [76] |
Table 7.
Elevation features extracted from the high-density photogrammetric PPC or CHM used in this study.
Table 7.
Elevation features extracted from the high-density photogrammetric PPC or CHM used in this study.
| Feature | Description |
|---|---|
| crownarea | crown area of each delineated tree in sq. m |
| zq25 | 25th percentile of height distribution within each delineated tree |
| median | 50th percentile of height distribution within each delineated tree |
| zq75 | 75th percentile of height distribution within each delineated tree |
Table 8.
The accuracy of treetop detections using a local maxima filter algorithm applied to tested PPCs with the different point density. The number of reference treetops is 145.
Table 8.
The accuracy of treetop detections using a local maxima filter algorithm applied to tested PPCs with the different point density. The number of reference treetops is 145.
| Dataset | Mask | Point Density (points/m2) | Auto Treetops | TP | FP | FN | r | p | F-Score |
|---|---|---|---|---|---|---|---|---|---|
| lasmtopsf1 | combi | 701 | 263 | 137 | 126 | 8 | 0.94 | 0.52 | 0.67 |
| lasmtopsf2 | combi | 701 | 226 | 129 | 126 | 25 | 0.83 | 0.49 | 0.61 |
| las01mtopsf1 † | combi | 85 | 142 | 137 | 5 | 8 | 0.94 | 0.96 | 0.95 * |
| las01mtopsf2 | combi | 85 | 121 | 120 | 1 | 25 | 0.83 | 0.99 | 0.90 |
| las02mtopsf1 † | combi | 22 | 143 | 138 | 5 | 7 | 0.95 | 0.97 | 0.96 * |
| las02mtopsf2 | combi | 22 | 123 | 122 | 1 | 23 | 0.84 | 0.99 | 0.91 |
| las03mtopsf1 † | combi | 10 | 148 | 140 | 8 | 5 | 0.97 | 0.95 | 0.96 * |
| las03mtopsf2 | combi | 10 | 124 | 123 | 1 | 22 | 0.85 | 0.99 | 0.91 |
| las05mtopsf1 † | combi | 4 | 156 | 140 | 16 | 5 | 0.90 | 0.90 | 0.93 |
| las05mtopsf2 | combi | 4 | 125 | 124 | 1 | 21 | 0.86 | 0.99 | 0.92 |
| las1mtopsf1 | combi | 1 | 200 | 143 | 57 | 2 | 0.99 | 0.72 | 0.83 |
| las1mtopsf2 † | combi | 1 | 133 | 129 | 4 | 16 | 0.89 | 0.97 | 0.93 |
* The three most accurate seed points datasets. † The seed points datasets used for further ITCD.
Table 9.
The accuracy of automatic ITCD applied to tested PPCs with the different point density.
| Dataset | Mask | Method | Seed Points | OS | TP | US | FP | DA | QR | Rank |
|---|---|---|---|---|---|---|---|---|---|---|
| las01 | ExG | MCWS | las01mtopsf1 | 5 | 119 | 18 | 1 | 0.82 | 0.40 | 1–3 |
| LI | N/A | 10 | 117 | 13 | 4 | 0.81 | 0.42 | 1–3 | ||
| DAL | las01mtopsf1 | 9 | 110 | 19 | 4 | 0.76 | 0.43 | 1–3 | ||
| las02 † | ExG | MCWS | las02mtopsf1 | 6 | 120 | 16 | 2 | 0.83 | 0.40 | 1–3 |
| LI | N/A | 9 | 117 | 14 | 4 | 0.81 | 0.42 | 1–3 | ||
| DAL | las02mtopsf1 | 12 | 114 | 16 | 2 | 0.79 | 0.43 | 1–3 | ||
| BUFFER | las02mtopsf1 | 100 | 37 | 2 | 0 | 0.27 | 0.65 | 4 | ||
| las03 | ExG | MCWS | las03mtopsf1 | 5 | 117 | 18 | 2 | 0.81 | 0.40 | 1–2 |
| LI | N/A | 11 | 117 | 11 | 5 | 0.81 | 0.43 | 1–2 | ||
| DAL | las03mtopsf1 | 12 | 111 | 15 | 4 | 0.77 | 0.44 | 3 | ||
| las05 | ExG | MCWS | las05mtopsf1 | 7 | 119 | 17 | 0 | 0.82 | 0.40 | 1 |
| LI | N/A | 20 | 109 | 7 | 8 | 0.75 | 0.45 | 2–3 | ||
| DAL | las05mtopsf1 | 23 | 106 | 11 | 2 | 0.73 | 0.47 | 2–3 | ||
| las1 *,† | ExG | MCWS | las1mtopsf2 | 2 | 100 | 39 | 3 | 0.69 | 0.47 | 1 |
| LI | N/A | 67 | 65 | 3 | 7 | 0.45 | 0.57 | 2 | ||
| DAL | las1mtopsf2 | 57 | 53 | 15 | 14 | 0.37 | 0.62 | 3 | ||
| BUFFER | las1mtopsf02 | 94 | 34 | 2 | 4 | 0.23 | 0.65 | 4 |
OS: oversegmentation; TP: true positive; US: undersegmentation; FP: False positive; DA: detection accuracy score; QR: quality rate index. * The dataset with a significant decrease in segmentation accuracy of each applied method. † The selected datasets used for feature extraction and comparison. The BUFFER method was applied only to the selected las02 and las1 dataset for feature extraction comparison with the other automatic delineation methods.
Table 10.
The multiple comparisons test between information (disturbance) classes within the reference dataset (RTC). True (T) or False (F) marks statistically significant/insignificant differences between pairs.
Table 10.
The multiple comparisons test between information (disturbance) classes within the reference dataset (RTC). True (T) or False (F) marks statistically significant/insignificant differences between pairs.
| Feature | Multiple Comparisons * | Ref. Crowns |
|---|---|---|
| NDRE | pine-sbbd | T |
| pine-sbbg | T | |
| pine-sh | T | |
| sbbd-sbbg | T | |
| sbbd-sh | T | |
| sbbg-sh | F | |
| NDVI | pine-sbbd | F |
| pine-sbbg | T | |
| pine-sh | T | |
| sbbd-sbbg | T | |
| sbbd-sh | T | |
| sbbg-sh | T | |
| ENDVI | pine-sbbd | F |
| pine-sbbg | T | |
| pine-sh | T | |
| sbbd-sbbg | T | |
| sbbd-sh | T | |
| sbbg-sh | T | |
| crown area | pine-spruce | T |
| zq25 | pine-spruce | T |
| median | pine-spruce | T |
| zq75 | pine-spruce | T |
| Number of FALSE | 3+0 |
* We used Mann–Whitney U test to test the elevation features differences of two tree species.
Table 11.
The treatment versus control multiple comparison test after the Kruskal–Wallis test of spectral features. True (T) or False (F) marks statistically significant/insignificant differences between pairs. Significant differences among las02 and las1 within treatment versus control tests caused by significantly lower segmentation accuracy of las1 are highlighted in yellow.
| Class | Multiple Comparisons | NDRE | NDVI | ENDVI | |||
|---|---|---|---|---|---|---|---|
| las02 | las1 | las02 | las1 | las02 | las1 | ||
| sbbd | RTC-DAL | F | F | F | F | F | F |
| RTC-MCWS | F | F | F | F | F | F | |
| RTC-LI | F | F | F | F | F | F | |
| RTC-BUFFER | T | T | F | F | F | F | |
| sbbg | RTC-DAL | F | F | F | F | F | F |
| RTC-MCWS | F | F | F | F | F | F | |
| RTC-LI | F | T | F | F | F | F | |
| RTC-BUFFER | T | T | T | T | T | T | |
Table 12.
The treatment versus control multiple comparison test after the Kruskal–Wallis test of elevation features. True (T) or False (F) marks statistically significant/insignificant differences between pairs. Significant differences among las02 and las1 within treatment versus control tests caused by significantly lower segmentation accuracy of las1 are highlighted in yellow.
| Class | Multiple Comparisons | Crown Area | zq25 | Median | zq75 | ||||
|---|---|---|---|---|---|---|---|---|---|
| las02 | las1 | las02 | las1 | las02 | las1 | las02 | las1 | ||
| pine | RTC-DAL | F | F | F | F | F | F | F | F |
| RTC-MCWS | F | F | F | F | F | F | F | F | |
| RTC-LI | F | F | F | F | F | F | F | F | |
| RTC-BUFFER | T | T | T | T | F | F | F | F | |
| spruce | RTC-DAL | F | T | F | F | F | F | F | F |
| RTC-MCWS | T | T | F | F | F | F | F | F | |
| RTC-LI | F | T | F | T | F | T | F | F | |
| RTC-BUFFER | T | T | T | T | T | T | T | T | |
Publisher’s Note: MDPI stays neutral with regard to jurisdictional claims in published maps and institutional affiliations. |
© 2020 by the authors. Licensee MDPI, Basel, Switzerland. This article is an open access article distributed under the terms and conditions of the Creative Commons Attribution (CC BY) license (http://creativecommons.org/licenses/by/4.0/).
Share and Cite
MDPI and ACS Style
Minařík, R.; Langhammer, J.; Lendzioch, T. Automatic Tree Crown Extraction from UAS Multispectral Imagery for the Detection of Bark Beetle Disturbance in Mixed Forests. Remote Sens. 2020, 12, 4081. https://doi.org/10.3390/rs12244081
AMA Style
Minařík R, Langhammer J, Lendzioch T. Automatic Tree Crown Extraction from UAS Multispectral Imagery for the Detection of Bark Beetle Disturbance in Mixed Forests. Remote Sensing. 2020; 12(24):4081. https://doi.org/10.3390/rs12244081
Chicago/Turabian StyleMinařík, Robert, Jakub Langhammer, and Theodora Lendzioch. 2020. "Automatic Tree Crown Extraction from UAS Multispectral Imagery for the Detection of Bark Beetle Disturbance in Mixed Forests" Remote Sensing 12, no. 24: 4081. https://doi.org/10.3390/rs12244081
Note that from the first issue of 2016, this journal uses article numbers instead of page numbers. See further details here.