Article

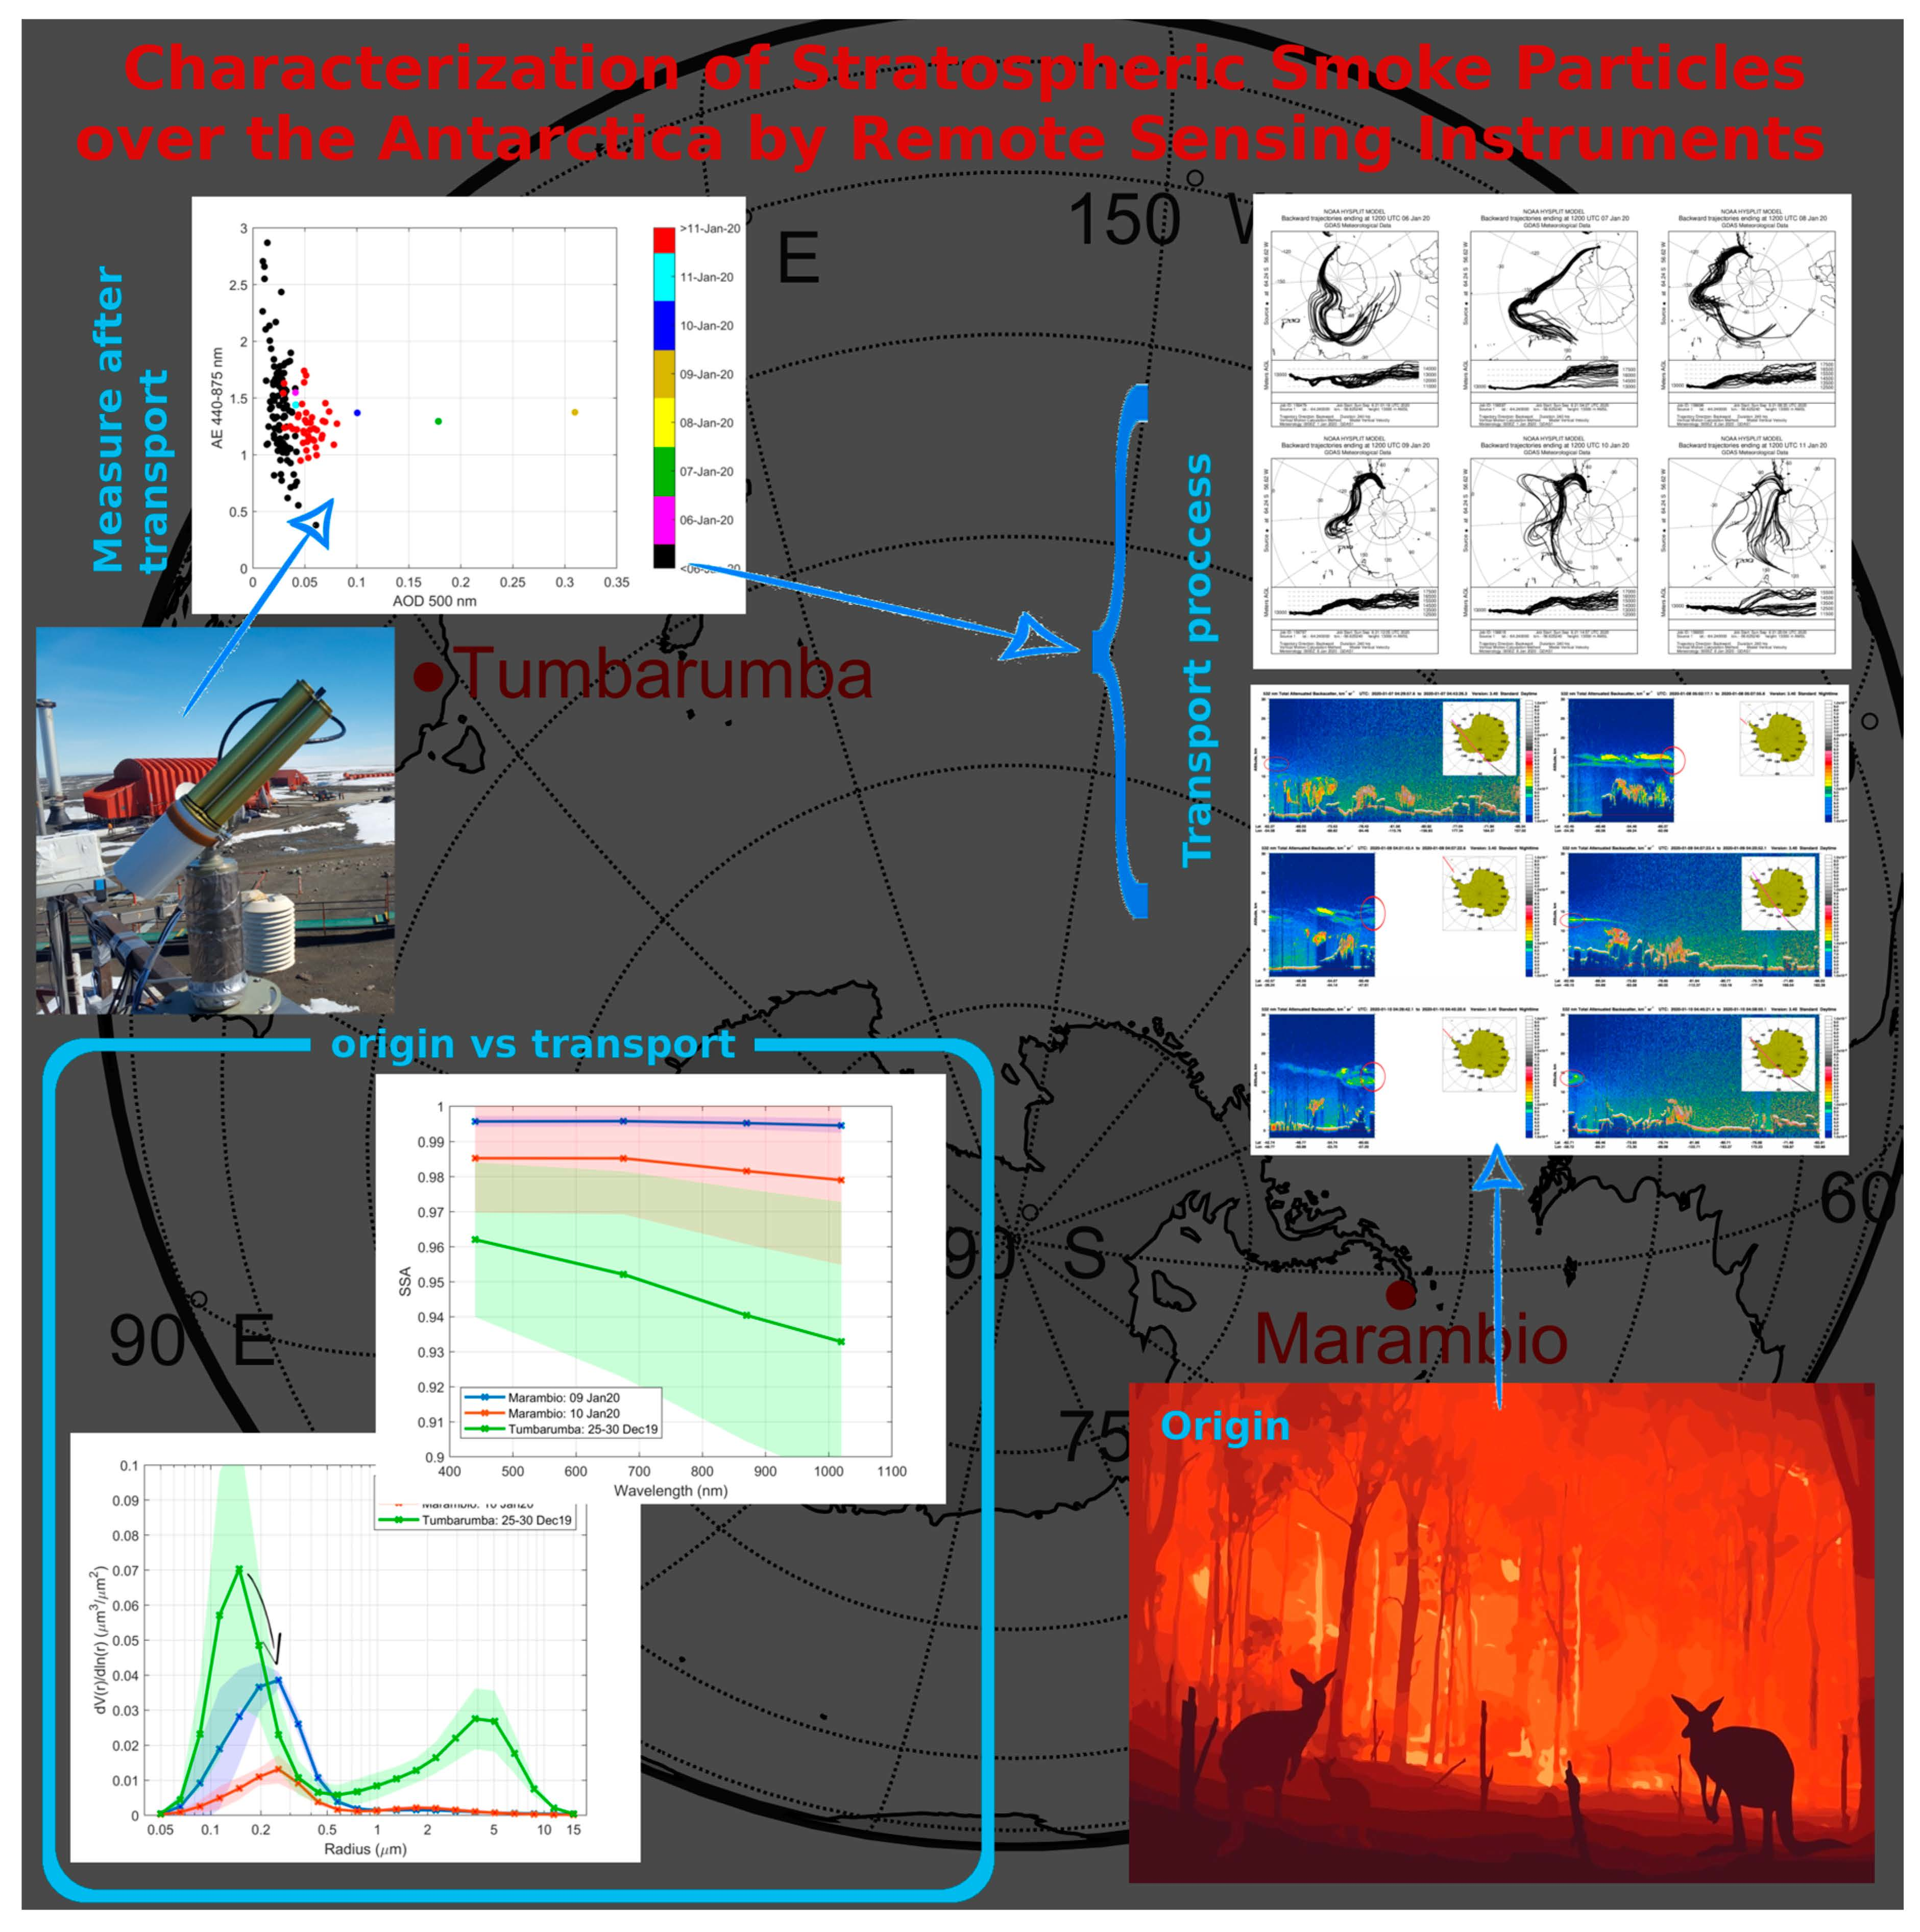
Characterization of Stratospheric Smoke Particles over the Antarctica by Remote Sensing Instruments

1
Group of Atmospheric Optics, University of Valladolid (GOA-UVa), 47011 Valladolid, Spain
2
Finnish Meteorological Institute, FI-00101 Helsinki, Finland
3
National Meteorological Service, C1425GBE Buenos Aires, Argentina
4
Commonwealth Scientific and Industrial Research Organisation (CSIRO) Mineral Resources, 6151 Kensington, Australia
5
CEILAP-UNIDEF (CITEDEF-CONICET), Villa Martelli, B1603ALO Buenos Aires, Argentina
*
Author to whom correspondence should be addressed.
Remote Sens. 2020, 12(22), 3769; https://doi.org/10.3390/rs12223769
Submission received: 24 September 2020 / Revised: 5 November 2020 / Accepted: 6 November 2020 / Published: 17 November 2020

Abstract

:
Australian smoke from the extraordinary biomass burning in December 2019 was observed over Marambio, Antarctica from the 7th to the 10th January, 2020. The smoke plume was transported thousands of kilometers over the Pacific Ocean, and reached the Antarctic Peninsula at a hight of 13 km, as determined by satellite lidar observations. The proposed origin and trajectory of the aerosol are supported by back-trajectory model analyses. Ground-based Sun–Sky–Moon photometer belonging to the Aerosol Robotic Network (AERONET) measured aerosol optical depth (500 nm wavelength) above 0.3, which is unprecedented for the site. Inversion of sky radiances provide the optical and microphysical properties of the smoke over Marambio. The AERONET data near the fire origin in Tumbarumba, Australia, was used to investigate the changes in the measured aerosol properties after transport and ageing. The analysis shows an increase in the fine mode particle radius and a reduction in absorption (increase in the single scattering albedo). The available long-term AOD data series at Marambio suggests that smoke particles could have remained over Antarctica for several weeks after the analyzed event.

Graphical Abstract

1. Introduction

Antarctica is an isolated and pristine continent. Studies about Antarctic aerosols started in the 1960s, both with remote sensing and in situ techniques [1,2]. Those first measurements indicated the presence of sulfate, sea salt and crustal aerosols. Despite the very low concentrations, the presence of extraneous particles proves that aerosol transport takes place on a global scale [3]. Coarse sea salt particles dominate the aerosol mass over Antarctica, especially in coastal areas. The main sources of secondary aerosol (fine mode) over Antarctica are the marine sulphur and organic aerosol precursors [4]. A significant fraction of fine mode of Antarctic aerosol might originate from a source not yet identified [5]. The absorption is a key parameter to determine the aerosol radiative effect [6]. Significant black carbon concentrations were measured in Antarctica, with the main sources suggested to be biomass burning aerosols transported from South-America, Africa and Australia [7,8].
In the Antarctic Peninsula, severe environmental changes in the past decades are likely linked to natural variability (changes in atmospheric circulation, local sea-ice loss), although other processes with anthropogenic origin like the ozone depletion may have played a role too. As a result, some of the largest increases in near-surface air temperature in the Southern Hemisphere in the 20th century were registered in the Antarctic Peninsula [9]. Long-term observations are needed to establish whether and how these changes can affect the aerosol amount and properties in the region [8].
Long range transported aerosol from biomass burning affects polar regions, especially the Arctic [10,11,12,13,14,15], but also Antarctica [7,16,17]. The occurrence of bushfires is likely to increase due to climate change [18,19] and thus the occurrence of aerosol events caused by long-range transported smoke over polar regions. The aerosol optical properties of the transported aerosol, and thus its radiative effects, are largely uncertain. Ageing processes during transport affect the size, shape and absorption properties of the smoke particles [20,21,22]. Other important aerosol effects are the deposition on snow and ice, and the interaction with clouds [3,8].
In January 2020, bushfires in Australia burned over 20,000 ha (2 × 10 8 m 2 ) of land and injected large amounts of smoke into the atmosphere [23]. The MetService at New Zealand reported a huge smoke plume that was transported 2000 km across the Tasman Sea and reached the lower South Island, which reduced visibility and produced red skies. Satellite imagery revealed the plume extension, and the World Meteorological Organization reported the transport of the smoke across the Pacific Ocean to South America, and that smoke had ’probably’ reached Antarctica (https://public.wmo.int/en/media/news/australia-suffers-devastating-fires-after-hottest-driest-year-record). In the spring of 2019, the Australian Bureau of Meteorology reported the highest fire weather danger that was measured by the Forest Fire Danger Index across the whole Australia [24]. A detailed and qualitative satellite analysis about bushfires in Australia from September 2019 to January 2020 can be found at https://worldview.earthdata.nasa.gov/?tr=australia_fires_2019_2020 and https://asdc.larc.nasa.gov/news/new-storymap-studying-the-2019-2020-australian-bushfires-using-nasa-data.
Recent studies have thoroughly described this smoke event [25,26]. The smoke generated Pyro-cumulonimbus (pyroCb) clouds that caused unprecedented stratospheric perturbations, similar to those caused by moderate volcanic eruptions [25]. In particular, it was observed the generation of potential vorticity and anticyclonic circulations caused by absorptive aerosol heating [26]. The paths and extension of several stratospheric smoke plumes are described in detail. The main plume generated a self-maintained anticyclonic vortex measuring 1000 km in diameter, that ascended during three months until it reached 35 km height; it lofted a confined bubble of carbonaceous aerosols and water vapour that travelled westbound round-the-world over 66,000 km, until the beginning of April 2020 [25]. Both works explicitly indicate that a smoke patch was transported over Antarctica and remained there for several weeks. The smoke over Antarctica generated a weaker vortex but was subject to strong aerosol heating due to the permanent daylight and rose up to 27 km [25,26]. Another recent study based on LIDAR observations at Punta Arenas, Chile, confirms the transport of the smoke at stratospheric levels over South America, and provides optical properties such as optical depth, lidar ratio and depolarization ratio [27].
Ground based remote sensing instruments like the AErosol RObotic NETwork (AERONET) photometers [28] are globally deployed in order to assess aerosol properties. The Group of Atmospheric Optics at the University of Valladolid (GOA-UVa), in collaboration with the Finnish Meteorological Institute and the National Weather Service in Argentina, installed in 2018 an AERONET Sun/sky/Moon photometer at Marambio station, located in the Antarctic Peninsula. This instrument detected an extraordinary and unprecedented aerosol event over Marambio on 7th–10th January 2020, with record values of aerosol optical depth (AOD), and optical properties that indicate the presence of aged smoke aerosol particles. The aim of this paper is to assess the origin of this aerosol event and characterize the optical and microphysical properties of the aerosols.

2. Sites and Instrumentation

2.1. Measurement Stations

Marambio is an Argentinian Antarctic station located in the ice-free Seymour–Marambio island, at the north-east tip of the Antarctic Peninsula (64.240 S, 56.625 W and 200 m a.s.l., see Figure 1). Marambio is characterized by a permafrost ecosystem. The Antarctic region has no permanent human habitation but Marambio station operates all-year round and acts as a logistic center for the scientific projects and also for other Argentinian Antarctic stations. There are around 40–70 inhabitants in Marambio even in austral winter [8]. The temperature at Marambio varies between +10 C in summer and −30 C during winter. However the wind speed can reach 100 km/h decreasing the apparent temperature to −60 C. The strong winds can blow snow and dust (in winter or summer) into the air. The prevailing wind directions are southwest and northwest [8].
In January 2018, the GOA-UVa installed a Sun/sky/Moon photometer CE318-T (Cimel Electronique S.A.S.) and an OMEA 3C all-sky camera (Alcor System) in Marambio station. This instrumentation is installed on the rooftop of the Scientific Laboratory, which is located in the middle of the station, between the the airfield and station buildings. This laboratory belongs to the Argentinian National Meteorological Service (Servicio Meteorológico Nacional) and is shared with the Argentinian National Direction of the Antarctic (Dirección Nacional del Antártico). The laboratory’s rooftop is also equipped with instrumentation focused on atmospheric studies by different techniques, e.g., a Precision Filter Radiometer (PFR), a Vaisala Ceilometer, Brewer spectroradiometer, MAX-DOAS, to cite some. In addition, several aerosol in-situ instruments, which belong to the Finnish Meteorological Institute (FMI), installed since January 2013, are located in a container 300 m away from the main site [8].
In order to identify the bushfire aerosol properties near its source, we used an AERONET station located in the vicinity of the bushfires in Australia. The Tumbarumba AERONET site (35.708 S, 147.950 E and 776 m a.s.l.), located at the south-east of Australia (see Figure 1), is equipped also with a Sun/sky/Moon photometer CE318-T photometer since July 2019. The Sun photometer is located on top of a rounded hill in cleared land used for grazing of cattle. Native eucalypt woodland is located to the west and south east. The area suffered a large bush fire in December 2019–January 2020, known as the Dunns Road Bushfire. Native forest and grazing paddocks burnt within 10 km of the site. A flux tower, with CSIRO instrumentation located 20 km to the north east in the Bago State Forest was damaged when the ground infrastructure was burnt. At this site, persistent high values of aerosol optical depth were detected for several weeks (data are available in the AERONET website).

2.2. Instruments and Data

The Cimel CE318-T is designed to measure at filter-selected wavelengths the direct Sun and Moon irradiance, and the diffuse sky radiance. These measurements are useful to retrieve different aerosol properties [29,30,31]. The Cimel radiometer is the reference instrument of AERONET. See [28,32] for details about the instrument, data processing and calibration. The generated data are public and can be freely downloaded from the AERONET website (https://aeronet.gsfc.nasa.gov). The GOA-UVa is responsible of an AERONET calibration center located in Valladolid, Spain, in cooperation with NASA, the University of Lille and the Spanish Meteorological Agency. The CÆLIS software tool was developed for the management of this calibration center and instrument monitoring [33,34,35]. This tool allowed for quick detection of the event as well as assisted in the routine monitoring of the CE318-T instrument performance at Marambio. This operational aspect is crucial in polar regions.
In this paper we have used the AERONET version 3 level 1.5 (cloud-screened) aerosol products of: AOD at 340, 380, 440, 500, 675, 870, 1020 and 1640 nm [32], which is derived from Sun/Moon direct irradiance measurements; aerosol particle size distribution and single scattering albedo (SSA) at 440, 675, 870 and 1020 nm, both retrieved by the AERONET operational inversion code using as input the multi-wavelength AOD and sky radiance measurements taken at almucantar and hybrid geometry [31,36]; and the AOD fine mode fraction at 500 nm, which was calculated by the spectral deconvolution algorithm (SDA) [37]. A set of quality criteria was applied to ensure the reliability of the inversion data, i.e., solar zenith angle >50 (for almucantar scans), minimum number of symmetrical angles and retrieval error between 5% and 8% depending on AOD [38]. The Ångström exponent (AE), which represents the AOD spectral variation and contains information about the aerosol size predominance, has been calculated by a least square fit of the AERONET AOD values in the spectral range from 440 to 870 nm. Concerning the inversion products, the fine and coarse modes are separated at the inflection point within the radius interval 0.439–0.992 μ m. The size distribution parameters (median and effective radius, volume concentration) are provided for each mode.
In order to identify the height of the aerosol layers, vertical profiles of total attenuated backscatter at 532 nm have been obtained from CALIOP (Cloud-Aerosol Lidar with Orthogonal Polarization) for the Antarctica overpass of the CALIPSO (Cloud-Aerosol Lidar and Infrared Pathfinder Satellite Observations) satellite [39]. These data belong to the CALIPSO Lidar Level 1 V4.10 product (CAL_LID_L1-Standard-V4-10 (https://www-calipso.larc.nasa.gov/products/lidar/browse_images/std_v4_index.php)).
The Aerosol Index -PyroCumuloNimbus- (AI-PCN) product [40], from the Ozone Mapping Profiler Suite (OMPS) instrument on board the joint NASA/NOAA Suomi National Polar-orbiting Partnership (NPP) satellite [41], has been used to track the spread of high aerosol concentrations in the atmosphere. This satellite product is based on the detection of absorbing particles in the ultraviolet region. The aerosol index is derived from normalized radiances using 2 wavelength pairs at 340 and 378.5 nm. This product is linked to both the thickness and the height of the aerosol layer located in the atmosphere.
In addition, airmass back-trajectories at Marambio have been obtained from the National Oceanic and Atmospheric Administration (NOAA) Air Resources Laboratory’s (ARL) Hybrid Single-Particle Lagrangian Integrated Trajectory (HYSPLIT) model [42]. HYSPLIT has been run with the trajectory ensemble option; this option starts multiple trajectories from the starting location. Each member of the trajectory ensemble is calculated by offsetting the meteorological data by a fixed grid factor, resulting in 27 members for all-possible offsets in X,Y, and Z (https://www.ready.noaa.gov/hypub-bin/trajtype.pl).

3. Smoke Event Detection over Marambio

On 7th January, 2020 the aerosol optical depth at Marambio raised from values below 0.05 to higher than 0.2 (at 500 nm), as can be observed in Figure 2a. The AOD on 8th Janaury is not available due to cloudiness, but the AOD on the 9th was even higher, about 0.3 at 500 nm. The AOD decreased on 10th January to AOD values below 0.05 at 500 nm at the end of the day. The AE values from 7th to 10th January were about 1.3, i.e., it was lower than the AE observed before and after the event (about 1.6). However the fine mode AOD shown in Figure 2b considerably increased during the mentioned event, indicating fine particle predominance, especially on 9th January, whereas the coarse mode AOD was constant and stable for all the shown days. Figure 2b shows that the fine mode fraction of the AOD (500 nm) was larger than 90% from 7th to 10th January and nearly 100% on 9th January. The fine mode fraction is still above 85% on the 6th and 11st January, but below 85% on 5th and 12nd January. These results indicate the presence of a fine particle event over Marambio from 7th to 10th January.
The height of the aerosol layer over Marambio could provide additional information about its origin. Figure 3 shows the vertical attenuated backscatter profiles at 532 nm for selected CALIOP/CALIPSO overpasses close to Marambio during the analysed event. A weak layer around 13 km asl was detected over Marambio at the beginning of 7th January 2020. A stronger layer can be seen over Marambio on the 8–10th January 2020 at the same height. Another layer around 15 km asl is frequently visible on those days. All these observed high altitude layers over Marambio presented lower total attenuated backscatter at 1064 nm compared to 532 nm (not shown), and an attenuated color ratio (backscatter at 1064 nm/backscatter at 532 nm) in general about 0.4–0.6. The depolarization ratio at 532 nm CALIOP product was mostly between 0.0 and 0.2 for the marked layers. They were generally classified as ‘stratospheric aerosol’ by the CALIOP vertical feature mask product (Version 4.20). The aerosol subtype CALIOP product (Version 4.20) identifies these layers mostly as ‘elevated smoke’.
In order to detect the origin of the analyzed aerosol event, ensemble HYSPLIT trajectories running for 240 h backwards and ending at 13 km asl over Marambio (the observed height of the aerosol layer) have been computed. These backtrajectories are shown in Figure 4 for the days from 6th to 11th January, at 12:00 UTC. The air masses at 13 km altitude over Marambio came mainly from the middle of South Pacific ocean area (origin at about 15 km asl) for the aerosol event days (7th–10th January 2020), with some of the ensemble computations originating in Southeastern Australia. This supports our hypothesis that the detected aerosol could be smoke that originated in the bushfires of Australia austral summer 2020. Similar layer structure and heights were found by [27] over Punta Arenas, Chile, where the smoke plume was detected by means of a ground-based lidar, and HYSPLIT backtrajectories indicate that it originated in the Australian bushfires. The backtrajectories on 6th and 11th January have a different origin than they show during the event, crossing the Southern Ocean and Antarctic Peninsula areas.
The AI-PCN from OMPS/NPP satellite is shown in Figure 5 for several days between 28 December 2019 and 11th January 2020 over the South Pacific Ocean. This product, as well as True Color corrected reflectance for all days from 10th December 2019 to 13th January 2020 and corresponding animations, can be found as Supplementary Material to this paper. The AI-PCN in Figure 5 shows aerosol load appearing over southeastern Australia on 28th (and 29th, not shown) December, 2019, as a consequence of massive bushfires. CALIOP/CALIPSO data on 31st December (not shown) reveal that this aerosol was injected up into the stratosphere to 13–15 km height [26], similar to the case reported by [43] for wildfire-driven thunderstorms (pyro-cumulonimbus). From 30th December 2019 to 1st January 2020 the aerosol plume was transported eastwards, crossing over New Zealand (see Figure 5) at around 15 km asl as indicated by CALIOP (not shown). The following days the plume was transported over the Pacific Ocean. A detailed description of this smoke plume as well as subsequent plumes is provided by [25,26]. Some smoke patches escaped from the vortex and moved eastwards. For instance, two plumes travelled to the south and the center of South-America on 5th January 2020. The first one reached southern Argentina and Chile on 6th January, and approached to Marambio on 7th January. The aerosol plume stayed over Marambio area from 8th to 10th January and moved towards Northeast on 11th January. For details, see Aerosol Index animation provided as Supplementary Material to this paper, as well as the supplementary information to ([26], S2 animation). This aerosol transport from Australia to Marambio was additionally confirmed by the MODIS (Moderate Resolution Imaging Spectroradiometer) AOD data and NAAPS (Navy Aerosol Analysis and Prediction System) model (see Supplementary Material), providing further evidence that the aerosol plume detected over Marambio originated in the bushfires in Australia, and was transported more than 10,000 km over the Pacific Ocean.

4. Aerosol Properties

The scatter plot between Ångström exponent and aerosol optical depth can be used to classify the aerosol (e.g., [44,45]). In this plot, the horizontal axis indicates the daily AOD whereas the vertical axis indicates the AE, related to the size predominance (larger size for lower AE). The AERONET data collected at Marambio until now, are depicted in Figure 6. They include summer campaigns in 2008 and 2009 performed by CEILAP-UNIDEF (National Scientific and Technical Research Council, Argentina) and routine measurements since January 2018. These data indicate very low AOD with average of 0.038 at 500 nm, and relatively high and variable AE (440–870 nm) in the range 1.0 to 2.5, with overall mean of 1.38 (median 1.33). This can be considered the background aerosol at the site. Only occasionally (11% of the days) the AE is below 1.0, indicating in these cases the predominance of coarser (possibly marine) particles. Similar AOD values are reported by [46] for the GAW-PFR observations at Marambio in 2011–2013.
The three investigated days (7th, 9th and 10th January 2020) have the highest AOD daily means of the entire data set. Until this episode, AOD had not exceeded 0.1 (at 500 nm wavelength), clearly showing that this event was extraordinary at the site. Moreover, the AOD daily mean values of AOD after the event (until April 2020), marked in red color in Figure 6, are consistently above the background values, suggesting that some residual aerosol could be present in the atmospheric column for some weeks after the 7–10th January event. The analysis by [26] also indicates that smoke could be present at Antarctic latitudes until mid-February. The AE, in the range 1.3 to 1.4 (also observed in Figure 2a), shows intermediate values which would indicate a certain contribution of coarse mode particles. However the fine/coarse mode separation of the AOD indicated that the coarse mode had a minor contribution to the AOD. The analysis of the particle size distribution is necessary to tackle this apparent contradiction.
The favorable sky conditions during the event on 9th and 10th January (clouds are very frequent in this region), allowed sky radiance scans (almucantar and hybrid geometries) which could be inverted to retrieve the optical and microphysical properties of the aerosol. Given that the AOD during the event was much larger than the background values (0.3 on 9th January vs. 0.025 on the 5th), we can assume that the inverted properties mainly correspond to those of the elevated smoke layer. We calculated the daily mean aerosol size distribution on the 9th and the 10th January, based on 6 and 9 inversions respectively. The result is shown in Figure 7, together with the average aerosol size distribution measured near the smoke plume origin, at the Tumbarumba site in Australia. The latter corresponds to the mean of the daily averages in the period 25–30th December 2019, during which high AOD was persistently measured due to active fires.
The size distribution at Tumbarumba was bimodal, with predominant fine mode. The average fine mode fraction was 0.64 in particle volume. However the coarse mode played a minor role in terms of AOD, with fine mode fraction of the AOD (500 nm) above 0.94, as derived from the spectral deconvolution algorithm data. This minor role of the coarse mode was also noted in other studies about biomass burning [47,48]. The lack of optically significant coarse mode is typical of biomass burning aerosols of several source regions [49]. The mean AOD (500 nm) derived here for the fresh biomass burning aerosol at Tumbarumba was 0.56, indicating a significant aerosol load, that peaked on 1–3 January, with AOD (500 nm) above 5.0.
Two main features arise from the comparison of the mean size distributions over Marambio and Tumbarumba. First, the coarse mode nearly disappeared in the lofted layer over Antarctica, suggesting that the large particles were most effectively scavenged during the long-range transport. Similar results have been observed in other aerosol events (e.g., [50]). Second, the fine mode modal radius was larger at Marambio (0.22 μ m), than it was at Tumbarumba (0.16 μ m). These are average values for the mentioned periods (see Figure 7). An increase in the fine mode radius is typical for aged smoke, due to coagulation and condensation processes [21,49,51]. This increase in the fine mode modal radius is likely the reason for the above-mentioned reduction in the AE to 1.34 at Marambio while the averaged daily AE at Tumbarumba was 1.82 for the 25–30 December period. Radiative transfer simulations have been done using as input the AERONET averages of fine and coarse aerosol concentrations (at both sites), varying the fine mode modal radius; the obtained results (not shown) support the hypothesis that, for the observed aerosol fine and coarse concentrations, the AE decreases as the fine mode radius increases, in agreement with the measured data.
Differences on the aerosol optical properties obtained at Marambio and Tumbarumba have also been observed, possibly associated to ageing. The aerosol SSA and its wavelength dependence can be linked with the aerosol type [52,53]. At Tumbarumba, the SSA was about 0.96–0.97 at 440 nm and decreased in the longer wavelengths (0.93 at 1020 nm), see Figure 8. These values are typical in biomass burning aerosols, e.g., in other fires reported in Australia [54] and the Amazonian forest [52]. The SSA was much higher at Marambio, above 0.99 at all investigated wavelengths on 9th January, and a bit lower on 10th, and exhibiting very small spectral dependence on both days. The condensation and/or formation of secondary organic aerosol can result in enhanced values of SSA [55]. The loss of coarse aerosols and the increase in relative humidity can be other possible factors that favor the increase of the SSA during transport [50].
The analysis of intensive optical properties can be used to discriminate aerosol types [53]. The approach consists of combining a size-related property (i.e., Ångström exponent, fine mode fraction of the AOD) with a parameter representing the absorptive properties (i.e., single scattering albedo or absorption Ångström exponent). Figure 9a shows the absorption Ångström exponent (AAE) as function of the fine mode fraction of the AOD (500 nm) for Tumbarumba and Marambio, as provided by the AERONET inversion products. No significant change is observed in the AAE for both sites (1.21 at Tumbarumba, 1.19 at Marambio). They are within the expected range for biomass burning aerosols [53]. The highest FMF is found for the central day of the event at Marambio (10th January), where the data show very low scatter. Figure 9b shows the AAE as a function of the AE of extinction. In this plot the separation of the data from both sites is clearer, given the decrease of the AE of the transported aerosol (1.34 at Marambio, 1.82 at Tumbarumba). In view of the aerosol key aerosol types described in [53], the observed properties of the smoke over Marambio (intermediate values of the AE; very high FMF; and very high SSA), do not clearly match any of the described categories. The fact that the smoke particles are found in the stratosphere and have experienced a long atmospheric transport, with associated ageing processes, can be the reason behind these distinct properties.

5. Conclusions

An extraordinary aerosol event with AOD at 500 nm above 0.3 was detected at Marambio station in the Antarctic Peninsula, by means of an AERONET Cimel CE318-T photometer. CALIPSO backscatter profiles, Suomi NPP aerosol index and back trajectory analysis, were analyzed to confirm the origin of the measured aerosol layer in the Australian fires that occurred about 10 days earlier, and injected large amounts of smoke particles up to the stratosphere. The particles were transported over the ocean and reached the Antarctic Peninsula at about 13 km height.
The fine mode particles largely dominated the aerosol size distribution, with the fine mode fraction of the AOD ranging from 0.94 to 0.99. The AOD levels during the event (7–10 January 2020) constitute the highest columnar values recorded in Marambio. The AOD data measured until April 2020 suggest that part of the smoke remained over Antarctica for several weeks after the analysed event.
The optical and microphysical aerosol properties of the fresh smoke aerosol were measured at the Australian AERONET site Tumbarumba. The comparison with Marambio data showed that the coarse mode particles were lost during the long-range transport, and that ageing processes increased the plume average aerosol particle size. In our case study, the fine mode modal radius increased from 0.16 to 0.22 μ m. This increase in the fine mode radius could be the main responsible for the lower AE values at Marambio (∼1.3) than at Tumbarumba (∼1.8). The particles also became less absorbing, with single scattering albedo (440 nm) increasing from 0.96 to 0.99 (from 0.93 to 0.99 at 1020 nm). Conversely, the absorption Ångström exponent did not change significantly (from 1.21 to 1.19).
The photometers used in AERONET have proven their capability to provide aerosol monitoring in Antarctica, including direct Sun irradiance measurements for AOD and well as sky radiance scans during daytime. Direct Moon irradiances are monitored since austral winter 2020 and will help to improve the year-round aerosol property monitoring. Longer data sets and the joint analysis of all the co-located aerosol measurements are still needed to provide consistent aerosol climatology in the region, investigate possible trends and identify the frequency and intensity of future events of long-range transported aerosols.

Supplementary Materials

The following are available at https://www.mdpi.com/2072-4292/12/22/3769/s1, Video S1: NAAPSsmoke, Video S2: MODIS_AOD, Video S3: EarthViewTrueColor, Video S4: AerosolIndexVideo, Video S5: AerosolIndexTrueColorVideo.

Author Contributions

R.G., R.R. and C.T. designed and developed the main concepts and ideas behind this work and wrote the paper with input from all authors. D.M., E.A. and E.R. aided in the analysis of previous result. R.G., R.R., C.T., J.C.A.-S., J.F., R.D. and I.C.L. aided in the installation of the instrumentation. V.E.C., A.C. and Á.M.d.F. aided in interpreting the results and worked on the manuscript. All authors were involved in helpful discussions and contributed to the manuscript. All authors have read and agreed to the published version of the manuscript.

Funding

This research received no external funding. Innovation and Universities (RTI2018-097864-B-I00), Academy of Finland (project number 264390), Finnish Academy of Sciences Excellence (project number 307331) and from the European Union’s Horizon 2020 (grant agreement number 654109).

Acknowledgments

The authors thank the Spanish Ministry of Science, Innovation and Universities for the support through the ePOLAAR project (RTI2018-097864-B-I00). The work was also supported by the Academy of Finland project Atmospheric Composition and Processes relevant to climate change in ANTarctica (ACPANT) [project number 264390]; the Centre on Excellence in Atmospheric Science funded by the Finnish Academy of Sciences Excellence [project number 307331]. We also received funding from the European Union’s Horizon 2020 research and innovation programme [grant agreement number 654109]. The NOAA Air Resources Laboratory (ARL) is acknowledged for the provision of the HYSPLIT transport and dispersion model and READY website (https://www.ready.noaa.gov) used in this publication. NASA AERONET program and PI’s are acknowledged for their effort in establishing and maintaining Tumbarumba and Marambio sites. The authors also thank NASA CALIPSO team for the data products used in this publication. These data were obtained from the NASA Langley Research Center Atmospheric Science Data Center. We are grateful for the logistic support received from the Finnish Antarctic Research Program (FINNARP) and from the Argentinean Air Force, which were highly valuable for the project. We warmly thank the technical personnel at Marambio for their support in logistics and measurements at the station.

Conflicts of Interest

The authors declare no conflict of interest.

References

  1. Voskresenskii, A.I. Condensation nuclei in the Mirny region (in Russian). Tr. Soy. Antarkt. Eksped. 1968, 38, 194–198. [Google Scholar]
  2. Kuhn, M. Global pollution in antarctic air documented by solar radiation depletion. AJUS 1972, 7, 35–37. [Google Scholar]
  3. Shaw, G.E. Antarctic aerosols: A review. Rev. Geophys. 1988, 26, 89–112. [Google Scholar] [CrossRef]
  4. Asmi, E.; Frey, A.; Virkkula, A.; Ehn, M.; Manninen, H.E.; Timonen, H.; Tolonen-Kivimäki, O.; Aurela, M.; Hillamo, R.; Kulmala, M. Hygroscopicity and chemical composition of Antarctic sub-micrometre aerosol particles and observations of new particle formation. Atmos. Chem. Phys. 2010, 10, 4253–4271. [Google Scholar] [CrossRef] [Green Version]
  5. Giordano, M.R.; Kalnajs, L.E.; Avery, A.; Goetz, J.D.; Davis, S.M.; DeCarlo, P.F. A missing source of aerosols in Antarctica—beyond long-range transport, phytoplankton, and photochemistry. Atmos. Chem. Phys. 2017, 17, 1–20. [Google Scholar] [CrossRef] [Green Version]
  6. Myhre, G. Consistency Between Satellite-Derived and Modeled Estimates of the Direct Aerosol Effect. Science 2009, 325, 187–190. [Google Scholar] [CrossRef]
  7. Fiebig, M.; Lunder, C.R.; Stohl, A. Tracing biomass burning aerosol from South America to Troll Research Station, Antarctica. Geophys. Res. Lett. 2009, 36. [Google Scholar] [CrossRef] [Green Version]
  8. Asmi, E.; Neitola, K.; Teinilä, K.; Rodriguez, E.; Virkkula, A.; Backman, J.; Bloss, M.; Jokela, J.; Lihavainen, H.; de Leeuw, G.; et al. Primary sources control the variability of aerosol optical properties in the Antarctic Peninsula. Tellus B Chem. Phys. Meteorol. 2018, 70. [Google Scholar] [CrossRef] [Green Version]
  9. Turner, J.; Lu, H.; White, I.; King, J.C.; Phillips, T.; Hosking, J.S.; Bracegirdle, T.J.; Marshall, G.J.; Mulvaney, R.; Deb, P. Absence of 21st century warming on Antarctic Peninsula consistent with natural variability. Nature 2016, 535, 411–415. [Google Scholar] [CrossRef] [Green Version]
  10. Tomasi, C.; Vitale, V.; Lupi, A.; Di Carmine, C.; Campanelli, M.; Herber, A.; Treffeisen, R.; Stone, R.S.; Andrews, E.; Sharma, S.; et al. Aerosols in polar regions: A historical overview based on optical depth and in situ observations. J. Geophys. Res. Atmos. 2007, 112. [Google Scholar] [CrossRef]
  11. Saha, A.; O’Neill, N.T.; Eloranta, E.; Stone, R.S.; Eck, T.F.; Zidane, S.; Daou, D.; Lupu, A.; Lesins, G.; Shiobara, M.; et al. Pan-Arctic sunphotometry during the ARCTAS-A campaign of April 2008. Geophys. Res. Lett. 2010, 37. [Google Scholar] [CrossRef]
  12. Ritter, C.; Burgos, M.A.; Böckmann, C.; Mateos, D.; Lisok, J.; Markowicz, K.; Moroni, B.; Cappelletti, D.; Udisti, R.; Maturilli, M.; et al. Microphysical properties and radiative impact of an intense biomass burning aerosol event measured over Ny-Ålesund, Spitsbergen in July 2015. Tellus B Chem. Phys. Meteorol. 2018, 70. [Google Scholar] [CrossRef]
  13. Ranjbar, K.; O’Neill, N.; Lutsch, E.; McCullough, E.; Aboel Fetouh, Y.; Xian, P.; Strong, K.; Fioletov, V.; Lesins, G.; Abboud, I. Extreme smoke event over the high Arctic. Atmos. Environ. 2019, 218, 117002. [Google Scholar] [CrossRef]
  14. Graß l, S.; Ritter, C. Properties of Arctic Aerosol Based on Sun Photometer Long-Term Measurements in Ny-Ålesund, Svalbard. Remote Sens. 2019, 11, 1362. [Google Scholar] [CrossRef] [Green Version]
  15. Zielinski, T.; Bolzacchini, E.; Cataldi, M.; Ferrero, L.; Graßl, S.; Hansen, G.; Mateos, D.; Mazzola, M.; Neuber, R.; Pakszys, P.; et al. Study of Chemical and Optical Properties of Biomass Burning Aerosols during Long-Range Transport Events toward the Arctic in Summer 2017. Atmosphere 2020, 11, 84. [Google Scholar] [CrossRef] [Green Version]
  16. Stohl, A.; Sodemann, H. Characteristics of atmospheric transport into the Antarctic troposphere. J. Geophys. Res. Atmos. 2010, 115. [Google Scholar] [CrossRef]
  17. Weller, R.; Minikin, A.; Petzold, A.; Wagenbach, D.; König-Langlo, G. Characterization of long-term and seasonal variations of black carbon (BC) concentrations at Neumayer, Antarctica. Atmos. Chem. Phys. 2013, 13, 1579–1590. [Google Scholar] [CrossRef] [Green Version]
  18. Intergovernmental Panel on Climate Change. Climate Change 2014: Synthesis Report. Contribution of Working Groups I, II and III to the Fifth Assessment Report of the Intergovernmental Panel on Climate Change); Technical Report; IPCC: Geneva, Switzerland, 2014.
  19. Dowdy, A.J.; Ye, H.; Pepler, A.; Thatcher, M.; Osbrough, S.L.; Evans, J.P.; Di Virgilio, G.; McCarthy, N. Future changes in extreme weather and pyroconvection risk factors for Australian wildfires. Sci. Rep. 2019, 10, 10073. [Google Scholar] [CrossRef]
  20. Eck, T.F.; Holben, B.N.; Reid, J.S.; O’Neill, N.T.; Schafer, J.S.; Dubovik, O.; Smirnov, A.; Yamasoe, M.A.; Artaxo, P. High aerosol optical depth biomass burning events: A comparison of optical properties for different source regions. Geophys. Res. Lett. 2003, 30. [Google Scholar] [CrossRef] [Green Version]
  21. Reid, J.S.; Koppmann, R.; Eck, T.F.; Eleuterio, D.P. A review of biomass burning emissions part II: Intensive physical properties of biomass burning particles. Atmos. Chem. Phys. 2005, 5, 799–825. [Google Scholar] [CrossRef] [Green Version]
  22. Baars, H.; Ansmann, A.; Ohneiser, K.; Haarig, M.; Engelmann, R.; Althausen, D.; Hanssen, I.; Gausa, M.; Pietruczuk, A.; Szkop, A.; et al. The unprecedented 2017–2018 stratospheric smoke event: Decay phase and aerosol properties observed with the EARLINET. Atmos. Chem. Phys. 2019, 19, 15183–15198. [Google Scholar] [CrossRef] [Green Version]
  23. Boer, M.; Resco de Dios, V.; Bradstock, R. Unprecedented burn area of Australian mega forest fires. Nat. Clim. Chang. 2020, 9, 171–172. [Google Scholar] [CrossRef]
  24. Bureau of Meteorology. Special Climate Statement 72—Dangerous Bushfire Weather in Spring 2019; Technical Report; Australian Bureau of Meteorology: Melbourne, Australia, 2019.
  25. Khaykin, S.; Legras, B.; Bucci, S.; Sellitto, P.; Isaksen, L.; Tencé, F.; Bekki, S.; Bourassa, A.; Rieger, L.; Zawada, D.; et al. The 2019/20 Australian wildfires generated a persistent smoke-charged vortex rising up to 35 km altitude. Commun. Earth Environ. 2020, 1. [Google Scholar] [CrossRef]
  26. Kablick, G.P., III; Allen, D.R.; Fromm, M.D.; Nedoluha, G.E. Australian PyroCb Smoke Generates Synoptic-Scale Stratospheric Anticyclones. Geophys. Res. Lett. 2020, 47, e2020GL088101. [Google Scholar] [CrossRef]
  27. Ohneiser, K.; Ansmann, A.; Baars, H.; Seifert, P.; Barja, B.; Jimenez, C.; Radenz, M.; Teisseire, A.; Floutsi, A.; Haarig, M.; et al. Smoke of extreme Australian bushfires observed in the stratosphere over Punta Arenas, Chile, in January 2020: Optical thickness, lidar ratios, and depolarization ratios at 355 and 532 nm. Atmos. Chem. Phys. 2020, 20, 8003–8015. [Google Scholar] [CrossRef]
  28. Holben, B.N.; Eck, T.F.; Slutsker, I.; Tanré, D.; Buis, J.P.; Setzer, A.; Vermote, E.; Reagan, J.A.; Kaufman, Y.J.; Nakajima, T.; et al. AERONET—A federated instrument network and data archive for aerosol characterization. Remote Sens. Environ. 1998, 66, 1–16. [Google Scholar] [CrossRef]
  29. Shaw, G.E. Sun photometry. Bull. Am. Meteorol. Soc. 1983, 64, 4–10. [Google Scholar] [CrossRef] [Green Version]
  30. Barreto, A.; Cuevas, E.; Granados-Muñoz, M.J.; Alados-Arboledas, L.; Romero, P.M.; Gröbner, J.; Kouremeti, N.; Almansa, A.F.; Stone, T.; Toledano, C.; et al. The new sun-sky-lunar Cimel CE318-T multiband photometer—A comprehensive performance evaluation. Atmos. Meas. Tech. 2016, 9, 631–654. [Google Scholar] [CrossRef] [Green Version]
  31. Dubovik, O.; King, M. A Flexible Inversion Algorithm for Retrieval of Aerosol Optical Properties from Sun and Sky Radiance Measurements. J. Geophys. Res. 2000, 105, 20673–20696. [Google Scholar] [CrossRef] [Green Version]
  32. Giles, D.M.; Sinyuk, A.; Sorokin, M.G.; Schafer, J.S.; Smirnov, A.; Slutsker, I.; Eck, T.F.; Holben, B.N.; Lewis, J.R.; Campbell, J.R.; et al. Advancements in the Aerosol Robotic Network (AERONET) Version 3 database—Automated near-real-time quality control algorithm with improved cloud screening for Sun photometer aerosol optical depth (AOD) measurements. Atmos. Meas. Tech. 2019, 12, 169–209. [Google Scholar] [CrossRef] [Green Version]
  33. Fuertes, D.; Toledano, C.; González, R.; Berjón, A.; Torres, B.; Cachorro, V.E.; de Frutos, A.M. CÆLIS: Software for assimilation, management and processing data of an atmospheric measurement network. Geosci. Instrum. Methods Data Syst. 2018, 7, 67–81. [Google Scholar] [CrossRef]
  34. González, R.; Toledano, C.; Román, R.; Fuertes, D.; Berjón, A.; Mateos, D.; Guirado-Fuentes, C.; Velasco-Merino, C.; Antuña Sánchez, J.C.; Calle, A.; et al. Daytime and nighttime aerosol optical depth implementation in CÆLIS. Geosci. Instrum. Methods Data Syst. 2020, 9, 417–433. [Google Scholar] [CrossRef]
  35. Román, R.; González, R.; Toledano, C.; Barreto, A.; Pérez-Ramírez, D.; Benavent-Oltra, J.A.; Olmo, F.J.; Cachorro, V.E.; Alados-Arboledas, L.; de Frutos, A.M. Correction of a lunar irradiance model for aerosol optical depth retrieval and comparison with star photometer. Atmos. Meas. Tech. 2020, 2020, 1–29. [Google Scholar] [CrossRef]
  36. Sinyuk, A.; Holben, B.N.; Eck, T.F.; Giles, D.M.; Slutsker, I.; Korkin, S.; Schafer, J.S.; Smirnov, A.; Sorokin, M.; Lyapustin, A. The AERONET Version 3 aerosol retrieval algorithm, associated uncertainties and comparisons to Version 2. Atmos. Meas. Tech. 2020, 13, 3375–3411. [Google Scholar] [CrossRef]
  37. O’Neill, N.T.; Eck, T.F.; Smirnov, A.; Holben, B.N.; Thulasiraman, S. Spectral discrimination of coarse and fine mode optical depth. J. Geophys. Res. 2003, 108, 4559. [Google Scholar] [CrossRef]
  38. Toledano, C.; Torres, B.; Velasco-Merino, C.; Althausen, D.; Groß, S.; Wiegner, M.; Weinzierl, B.; Gasteiger, J.; Ansmann, A.; González, R.; et al. Sun photometer retrievals of Saharan dust properties over Barbados during SALTRACE. Atmos. Chem. Phys. 2019, 19, 14571–14583. [Google Scholar] [CrossRef] [Green Version]
  39. Winker, D.M.; Vaughan, M.A.; Omar, A.; Hu, Y.; Powell, K.A.; Liu, Z.; Hunt, W.H.; Young, S.A. Overview of the CALIPSO Mission and CALIOP Data Processing Algorithms. J. Atmos. Ocean. Technol. 2009, 26, 2310–2323. [Google Scholar] [CrossRef]
  40. Torres, O. OMPS-NPP L2NM Aerosol Index Swath Orbital V2; Goddard Earth Sciences Data and Information Services Center (GES DISC): Greenbelt, MD, USA, 2019. Available online: https://disc.gsfc.nasa.gov/datasets/OMPS_NPP_NMMIEAI_L2_2/summary (accessed on 8 September 2020).
  41. Flynn, L.; Long, C.; Wu, X.; Evans, R.; Beck, C.T.; Petropavlovskikh, I.; McConville, G.; Yu, W.; Zhang, Z.; Niu, J.; et al. Performance of the Ozone Mapping and Profiler Suite (OMPS) products. J. Geophys. Res. Atmos. 2014, 119, 6181–6195. [Google Scholar] [CrossRef]
  42. Stein, A.F.; Draxler, R.R.; Rolph, G.D.; Stunder, B.J.B.; Cohen, M.D.; Ngan, F. NOAA’s HYSPLIT Atmospheric Transport and Dispersion Modeling System. Bull. Am. Meteorol. Soc. 2016, 96, 2059–2077. [Google Scholar] [CrossRef]
  43. Peterson, D.A.; Campbell, J.R.; Hyer, E.J.; Fromm, M.D.; Kablick, G.P.; Cossuth, J.H.; DeLand, M.T. Wildfire-driven thunderstorms cause a volcano-like stratospheric injection of smoke. NPJ Clim. Atmos. Sci. 2018, 1, 1–8. [Google Scholar] [CrossRef] [Green Version]
  44. Holben, B.; Tanre, D.; Smirnov, A.; Eck, T.; Slutsker, I.; Abuhassan, N.; Newcomb, W.; Schafer, J.; Chatenet, B.; Lavenue, F.; et al. An emerging ground-based aerosol climatology: Aerosol Optical Depth from AERONET. J. Geophys. Res. 2001, 106, 12067–12097. [Google Scholar] [CrossRef]
  45. Toledano, C.; Cachorro, V.E.; Berjon, A.; de Frutos, A.M.; Sorribas, M.; de la Morena, B.A.; Goloub, P. Aerosol optical depth and Angstrom exponent climatology at El Arenosillo AERONET site (Huelva, Spain). Q. J. R. Meteorol. Soc. 2007, 133, 795–807. [Google Scholar] [CrossRef]
  46. Tomasi, C.; Kokhanovsky, A.A.; Lupi, A.; Ritter, C.; Smirnov, A.; O’Neill, N.T.; Stone, R.S.; Holben, B.N.; Nyeki, S.; Wehrli, C.; et al. Aerosol remote sensing in polar regions. Earth-Sci. Rev. 2015, 140, 108–157. [Google Scholar] [CrossRef] [Green Version]
  47. Schafer, J.S.; Eck, T.F.; Holben, B.N.; Artaxo, P.; Duarte, A.F. Characterization of the optical properties of atmospheric aerosols in Amazônia from long-term AERONET monitoring (1993–1995 and 1999–2006). J. Geophys. Res. Atmos. 2008, 113. [Google Scholar] [CrossRef] [Green Version]
  48. Eck, T.F.; Holben, B.N.; Ward, D.E.; Dubovik, O.; Reid, J.S.; Smirnov, A.; Mukelabai, M.M.; Hsu, N.C.; O’Neill, N.T.; Slutsker, I. Characterization of the optical properties of biomass burning aerosols in Zambia during the 1997 ZIBBEE field campaign. J. Geophys. Res. Atmos. 2001, 106, 3425–3448. [Google Scholar] [CrossRef]
  49. Eck, T.F.; Holben, B.N.; Reid, J.S.; Sinyuk, A.; Hyer, E.J.; O’Neill, N.T.; Shaw, G.E.; Vande Castle, J.R.; Chapin, F.S.; Dubovik, O.; et al. Optical properties of boreal region biomass burning aerosols in central Alaska and seasonal variation of aerosol optical depth at an Arctic coastal site. J. Geophys. Res. Atmos. 2009, 114. [Google Scholar] [CrossRef] [Green Version]
  50. Lund Myhre, C.; Toledano, C.; Myhre, G.; Stebel, K.; Yttri, K.E.; Aaltonen, V.; Johnsrud, M.; Frioud, M.; Cachorro, V.; de Frutos, A.; et al. Regional aerosol optical properties and radiative impact of the extreme smoke event in the European Arctic in spring 2006. Atmos. Chem. Phys. 2007, 7, 5899–5915. [Google Scholar] [CrossRef] [Green Version]
  51. Ditas, J.; Ma, N.; Zhang, Y.; Assmann, D.; Neumaier, M.; Riede, H.; Karu, E.; Williams, J.; Scharffe, D.; Wang, Q.; et al. Strong impact of wildfires on the abundance and aging of black carbon in the lowermost stratosphere. Proc. Natl. Acad. Sci. USA 2018, 115, 11595–11603. [Google Scholar] [CrossRef] [Green Version]
  52. Dubovik, O.; Holben, B.; Eck, T.; Smirnov, A.; Kaufman, Y.; King, M.D.; Tanre, D.; Slutsker, I. Variability of Absorption and Optical Properties of Key Aerosol Types Observed in Worldwide Locations. J. Atmos. Sci. 2002, 59, 590–608. [Google Scholar] [CrossRef]
  53. Giles, D.M.; Holben, B.N.; Eck, T.F.; Sinyuk, A.; Smirnov, A.; Slutsker, I.; Dickerson, R.R.; Thompson, A.M.; Schafer, J.S. An analysis of AERONET aerosol absorption properties and classifications representative of aerosol source regions. J. Geophys. Res. Atmos. 2012, 117. [Google Scholar] [CrossRef] [Green Version]
  54. Mitchell, R.M.; O’Brien, D.M.; Campbell, S.K. Characteristics and radiative impact of the aerosol generated by the Canberra firestorm of January 2003. J. Geophys. Res. Atmos. 2006, 111. [Google Scholar] [CrossRef] [Green Version]
  55. Abel, S.J.; Haywood, J.M.; Highwood, E.J.; Li, J.; Buseck, P.R. Evolution of biomass burning aerosol properties from an agricultural fire in southern Africa. Geophys. Res. Lett. 2003, 30. [Google Scholar] [CrossRef] [Green Version]
Figure 1. Location of the Marambio station (Antarctica) and Tumbarumba AERONET station (Australia).
Remotesensing 12 03769 g001
Figure 2. (a) Aerosol optical depth (AOD) for different wavelengths and Ångström exponent (AE) at Marambio on 5–12th January 2020. (b) Fine and coarse mode aerosol optical depth at 500 nm and the fine mode fraction at Marambio on 5–12th January 2020.
Remotesensing 12 03769 g002
Figure 3. Vertical profiles of total attenuated backscatter at 532 nm from CALIOP/CALIPSO overpasses. The profiles are shown for six different overpasses from 7th to 10th January 2020. The highest aerosol layers close to Marambio location are marked with a red circle.
Remotesensing 12 03769 g003
Figure 4. Ensemble HYSPLIT 10-days back-trajectories computed from Marambio at 13 km asl from 6th to 11st January 2020.
Remotesensing 12 03769 g004
Figure 5. Aerosol Index PyroCumuloNimbus (AI-PCN) maps over Pacific ocean for 10 different days during the smoke transport from Australia to Marambio station. These maps have been extracted from NASA’s Earth Observing System Data and Information System (EOSDIS) worldview tool (https://worldview.earthdata.nasa.gov).
Remotesensing 12 03769 g005
Figure 6. Daily mean of Ångström exponent (AE) vs. aerosol optical depth (AOD) at 500 nm at Marambio (until April 2020). Colorbar indicates the date of each data point highlighting the analyzed days of the event.
Remotesensing 12 03769 g006
Figure 7. Volume particle size distribution over Marambio, Antarctica, on 9th and 10th January 2020 (daily averages), as well as the mean of the daily averaged size distribution over Tumbarumba, Australia, for the period 25–30 December 2019. Color shaded areas represent ±1 standard deviation.
Remotesensing 12 03769 g007
Figure 8. Single scattering albedo (SSA) as a function of wavelength over Marambio, Antarctica, on 9th and 10th January 2020 (daily averages), as well as the mean of the daily averaged SSA over Tumbarumba, Australia, for the period 25–30 December 2019. Color shaded areas represent ±1 standard deviation.
Remotesensing 12 03769 g008
Figure 9. Absorption Ångström exponent (AAE) as a function of: (a) Fine Mode Fraction of the AOD (500 nm); and (b) Extinction Ångström exponent (AE) derived in the range 440–0870 nm. Data points are inversion data (almucantar and hybrid sky scans) for Marambio, Antarctica, on 9th and 10th January 2020, and Tumbarumba, Australia, for the period 25–30 December 2019.
Remotesensing 12 03769 g009
Publisher’s Note: MDPI stays neutral with regard to jurisdictional claims in published maps and institutional affiliations.

