Automated Geometric Quality Inspection of Prefabricated Housing Units Using BIM and LiDAR


1
Sino-Australia Joint Research Center in BIM and Smart Construction, Shenzhen University, Shenzhen 518060, China
2
Department of Building, School of Design and Environment, National University of Singapore, Singapore 117566, Singapore
*
Author to whom correspondence should be addressed.
Remote Sens. 2020, 12(15), 2492; https://doi.org/10.3390/rs12152492
Submission received: 13 July 2020
/
Revised: 30 July 2020
/
Accepted: 31 July 2020
/
Published: 3 August 2020
(This article belongs to the Section Engineering Remote Sensing)
Abstract
:Traditional quality inspection of prefabricated components is labor intensive, time-consuming, and error prone. This study developed an automated geometric quality inspection technique for prefabricated housing units using building information modeling (BIM) and light detection and ranging (LiDAR). The proposed technique collects the 3D laser scanned data of the prefabricated unit using a LiDAR which contains accurate as-built surface geometries of the prefabricated unit. On the other hand, the BIM model of the prefabricated unit contains the as-designed geometries of the unit. The scanned data and BIM model are then automatically processed to inspect the geometric quality of individual elements of the prefabricated units including both structural and mechanical elements, as well as electrical and plumbing (MEP) elements. To validate the proposed technique, experiments were conducted on two prefabricated bathroom units (PBUs). The inspection results showed that the proposed technique can provide accurate quality inspection results with 0.7 mm and 0.9 mm accuracy for structural and MEP elements, respectively. In addition, the experiments also showed that the proposed technique greatly improves the inspection efficiency regarding time and labor.
1. Introduction
Prefabricated construction [1,2], which denotes the approach of manufacturing construction components in an off-site factory, then transporting manufactured components or semi-components to the construction site, and finally installing all components sequentially to formulate buildings [3,4], is becoming increasingly popular in the building and construction industry over the past decades. Prefabricated construction, considered as an innovative and cleaner construction approach, can significantly improve construction productivity [5,6], reduce construction time [7], and minimize construction wastes [8]. Therefore, prefabricated construction has been highly recognized by the global construction industry and increasingly popular among the architecture, engineering, and construction (AEC) industry in different countries and regions. For example, the first adoption of a prefabricated construction project in the US can be dated back to the middle of the 1800s [9]. According to a survey conducted in the year 2014, 10,334 single family panelized/pre-cut home and 10,560 single family modular homes started in 2014 were geographically concentrated in the East North Central, South, and Mid-Atlantic regions of the US [10]. In Hong Kong, the Hong Kong Housing Authority adopted prefabrication construction in the mid-1980s [11]. In Catalonia of Spain, the construction of school centers started to use prefabrication to assemble more than 200 public educational edifices since 2002 [12]. In order to promote the greater uptake of prefabrication, the UK off-site construction sector established a campaigning organization, known as Buildoffsite [13]. In Australia, prefabricated construction practices take up 3% of the construction work undertaken and over 54 corporations constitute the off-site manufacturing (OSM) industry in Australia, working in non-volumetric and volumetric pre-assembly and modular buildings [14]. Singapore has also been promoting prefabrication actively. For example, the Building and Construction Authority (BCA) of Singapore has stipulated that the adoption of prefabrication methods was one of the land sale conditions for some selected land parcels sold [15]. Subsequently, in 2015, BCA further stipulated that for the developments of these selected land parcels, the minimum level of use of prefabricated prefinished volumetric construction should be 65% of the total constructed floor area [16].
The assembly of prefabricated components is the main activity during the construction stage. The geometric quality of prefabricated components impacts on the productivity of installation the most, because unexpected construction delays and system failure can occur if the geometric qualities of prefabricated components are poor [17]. Thus, management of the geometric variability is a major challenge for prefabrication construction [18]. For example, construction delays and additional costs for repair or replacement are required if there are serious dimensional defects or volumetric defects on prefabricated units at the manufacturing stage of an off-site construction project [19]. Another study on two modular prefabricated high-rise buildings shows that the geometric inflexibility of prefabricated units once on site was a major design limitation using prefabrication approaches [20]. Therefore, geometric quality inspection of prefabricated components in factory plays an important role in prefabrication construction.
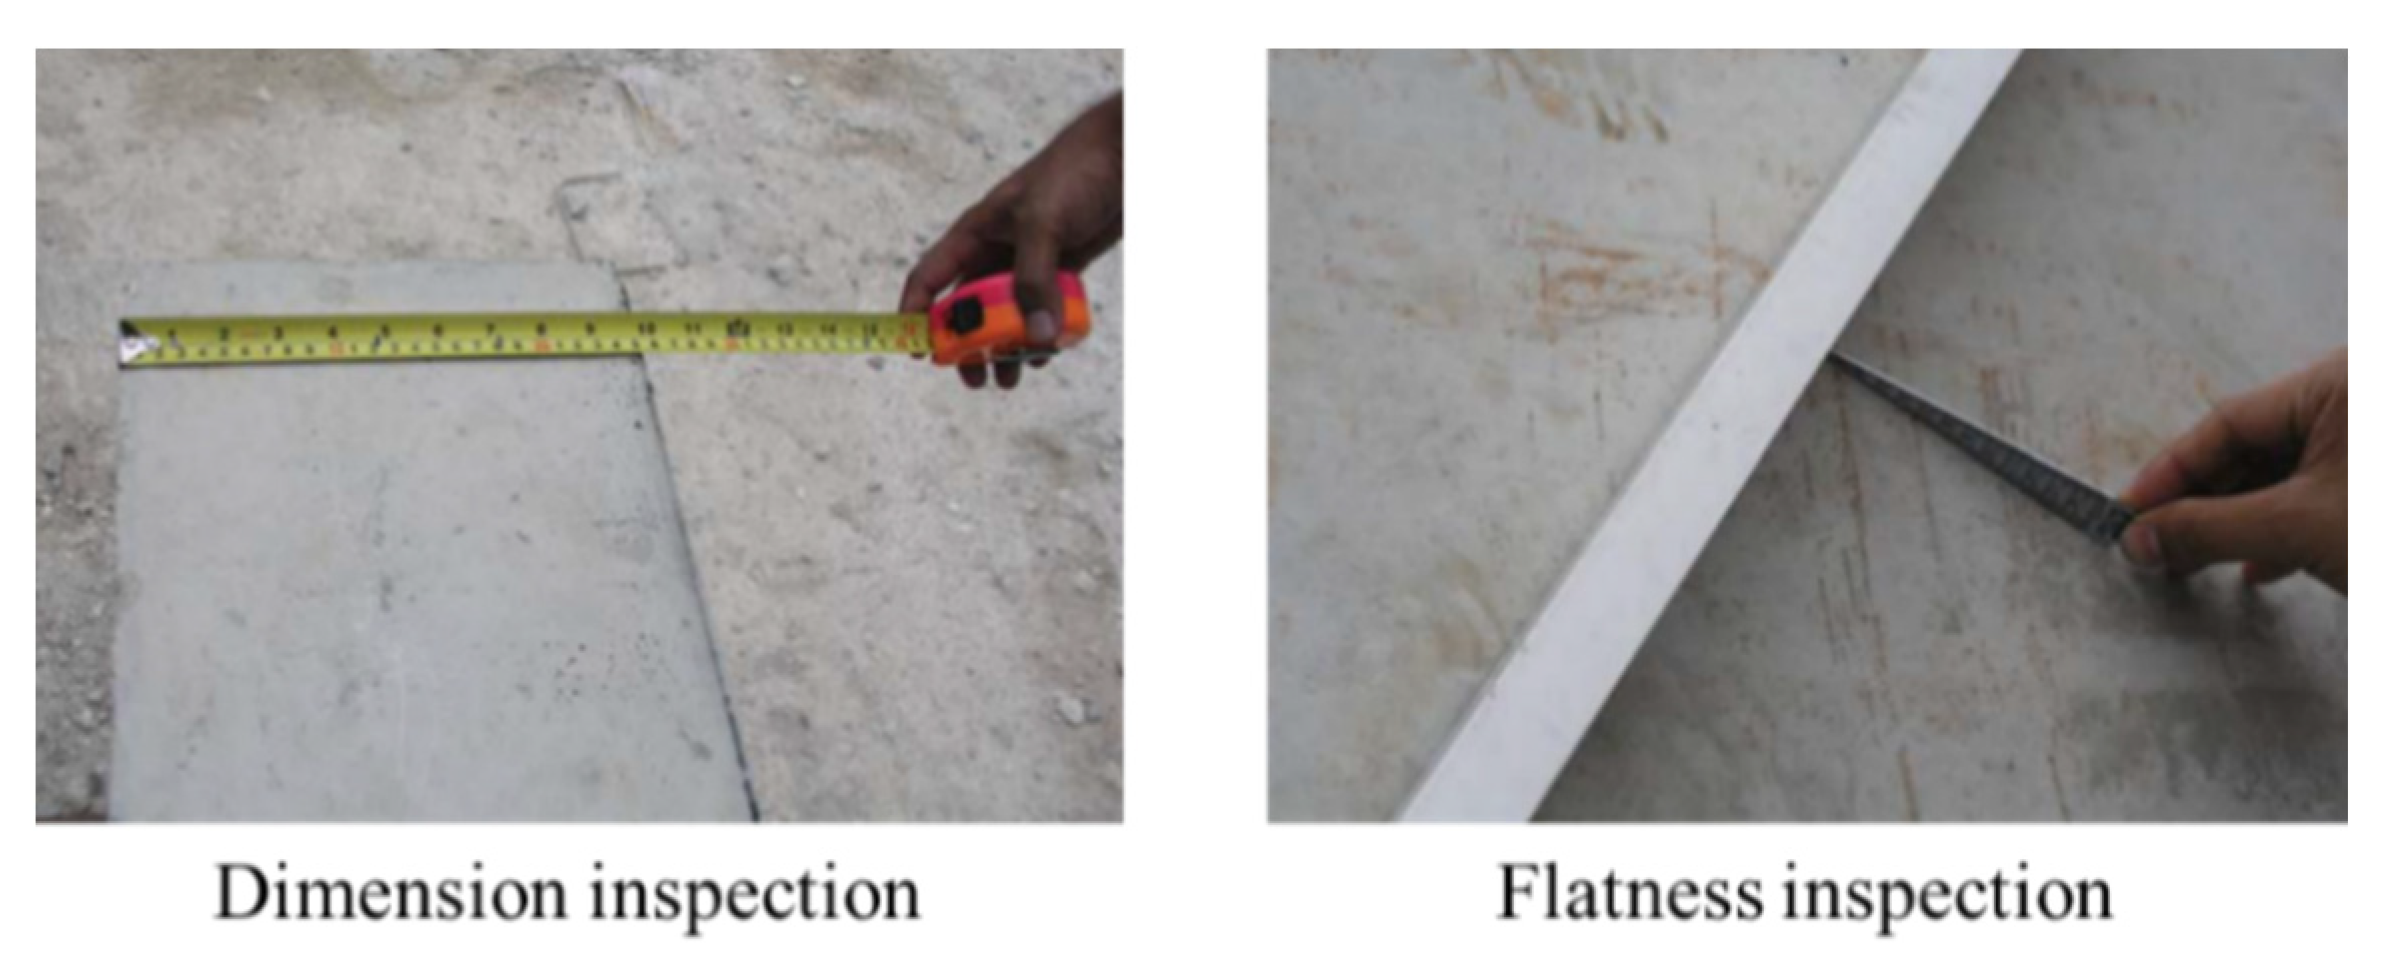
In order to guarantee the geometric quality of prefabricated components, traditional inspections are usually conducted manually as shown in Figure 1. For example, measurement tapes are used to inspect the dimensions of different prefabricated components, and a straight edge and a slip gauge are used for flatness inspection of concrete surfaces. However, manual inspection is usually labor intensive, time-consuming, and error prone, especially when the number of prefabricated components becomes large. For instance, approximately 40 min was required to manually inspect the positions of 88 rebars on a 12 m long reinforced precast concrete panel, leading to increased labor cost [21]. Therefore, an automated geometric quality inspection technique for prefabricated components is needed to improve the efficiency and accuracy of geometric quality inspection.
In the past decade, building information modeling (BIM) and light detection and ranging (LiDAR) have been widely applied to address various issues in the AEC industry. A BIM model, which contains rich geometric and semantic information of buildings and civil infrastructures, is commonly used for data storage, visualization, and management of building elements throughout the project lifecycle. A LiDAR, which is also known as 3D laser scanning, can obtain 3D point cloud data of objects with a high speed and high accuracy using laser-based measurement techniques. The LiDAR has been popularly adopted for various applications including surface defect detection [22], dimension estimation [23], construction progress monitoring [24], and as-built BIM reconstruction [25,26]. Despite the previous studies, there is still a lack of research on geometric quality inspection of prefabricated components using BIM and LiDAR.
This study aimed to develop an automated geometric quality inspection technique for specific types of prefabricated components, namely, prefabricated housing units, using BIM and LiDAR. The laser scanned data of prefabricated housing units are acquired, and the as-built geometries of the structural and mechanical and electrical and plumbing (MEP) elements of the prefabricated housing units are automatically extracted using the developed algorithms. By comparing the as-built geometries with the as-designed ones in BIM, the geometric quality is assessed based on certain tolerance values. Furthermore, the geometric quality inspection results are stored in the BIM model for further use. The rest of this paper is organized as follows. Section 2 introduces the research background with regard to prefabricated housing in Singapore, BIM and LiDAR technologies, and the related works on quality inspection of prefabricated elements using LiDAR. Then, the checklist for the geometric quality inspection of prefabricated housing units is identified and explained in Section 3, which defines the inspection scope of this study. Section 4 illustrates the developed automated geometric quality inspection technique, followed by experimental validation in Section 5. Last, Section 6 summarizes and concludes this study and suggests future works.
2. Research Background
2.1. Prefabricated Housing in Singapore
As a country with limited labor supply and natural resources, Singapore pays much attention to productivity in its different industries, especially in the local AEC industry that is labor intensive [27]. Recently, the BCA of Singapore has been seeking potential alternatives to improve construction productivity [28] which resulted in the adoption of the concept Design for Manufacturing and Assembly (DfMA) that fundamentally changes the traditional design and construction processes [29]. As a new construction approach in the AEC industry, DfMA requires more off-site activities, while the manpower and time needed for onsite construction is reduced which brings substantial improvement in construction productivity. The DfMA technique supports various types of prefabricated housing units, and the two most popular technologies include the prefabricated prefinished volumetric construction (PPVC) and prefabricated bathroom unit (PBU).
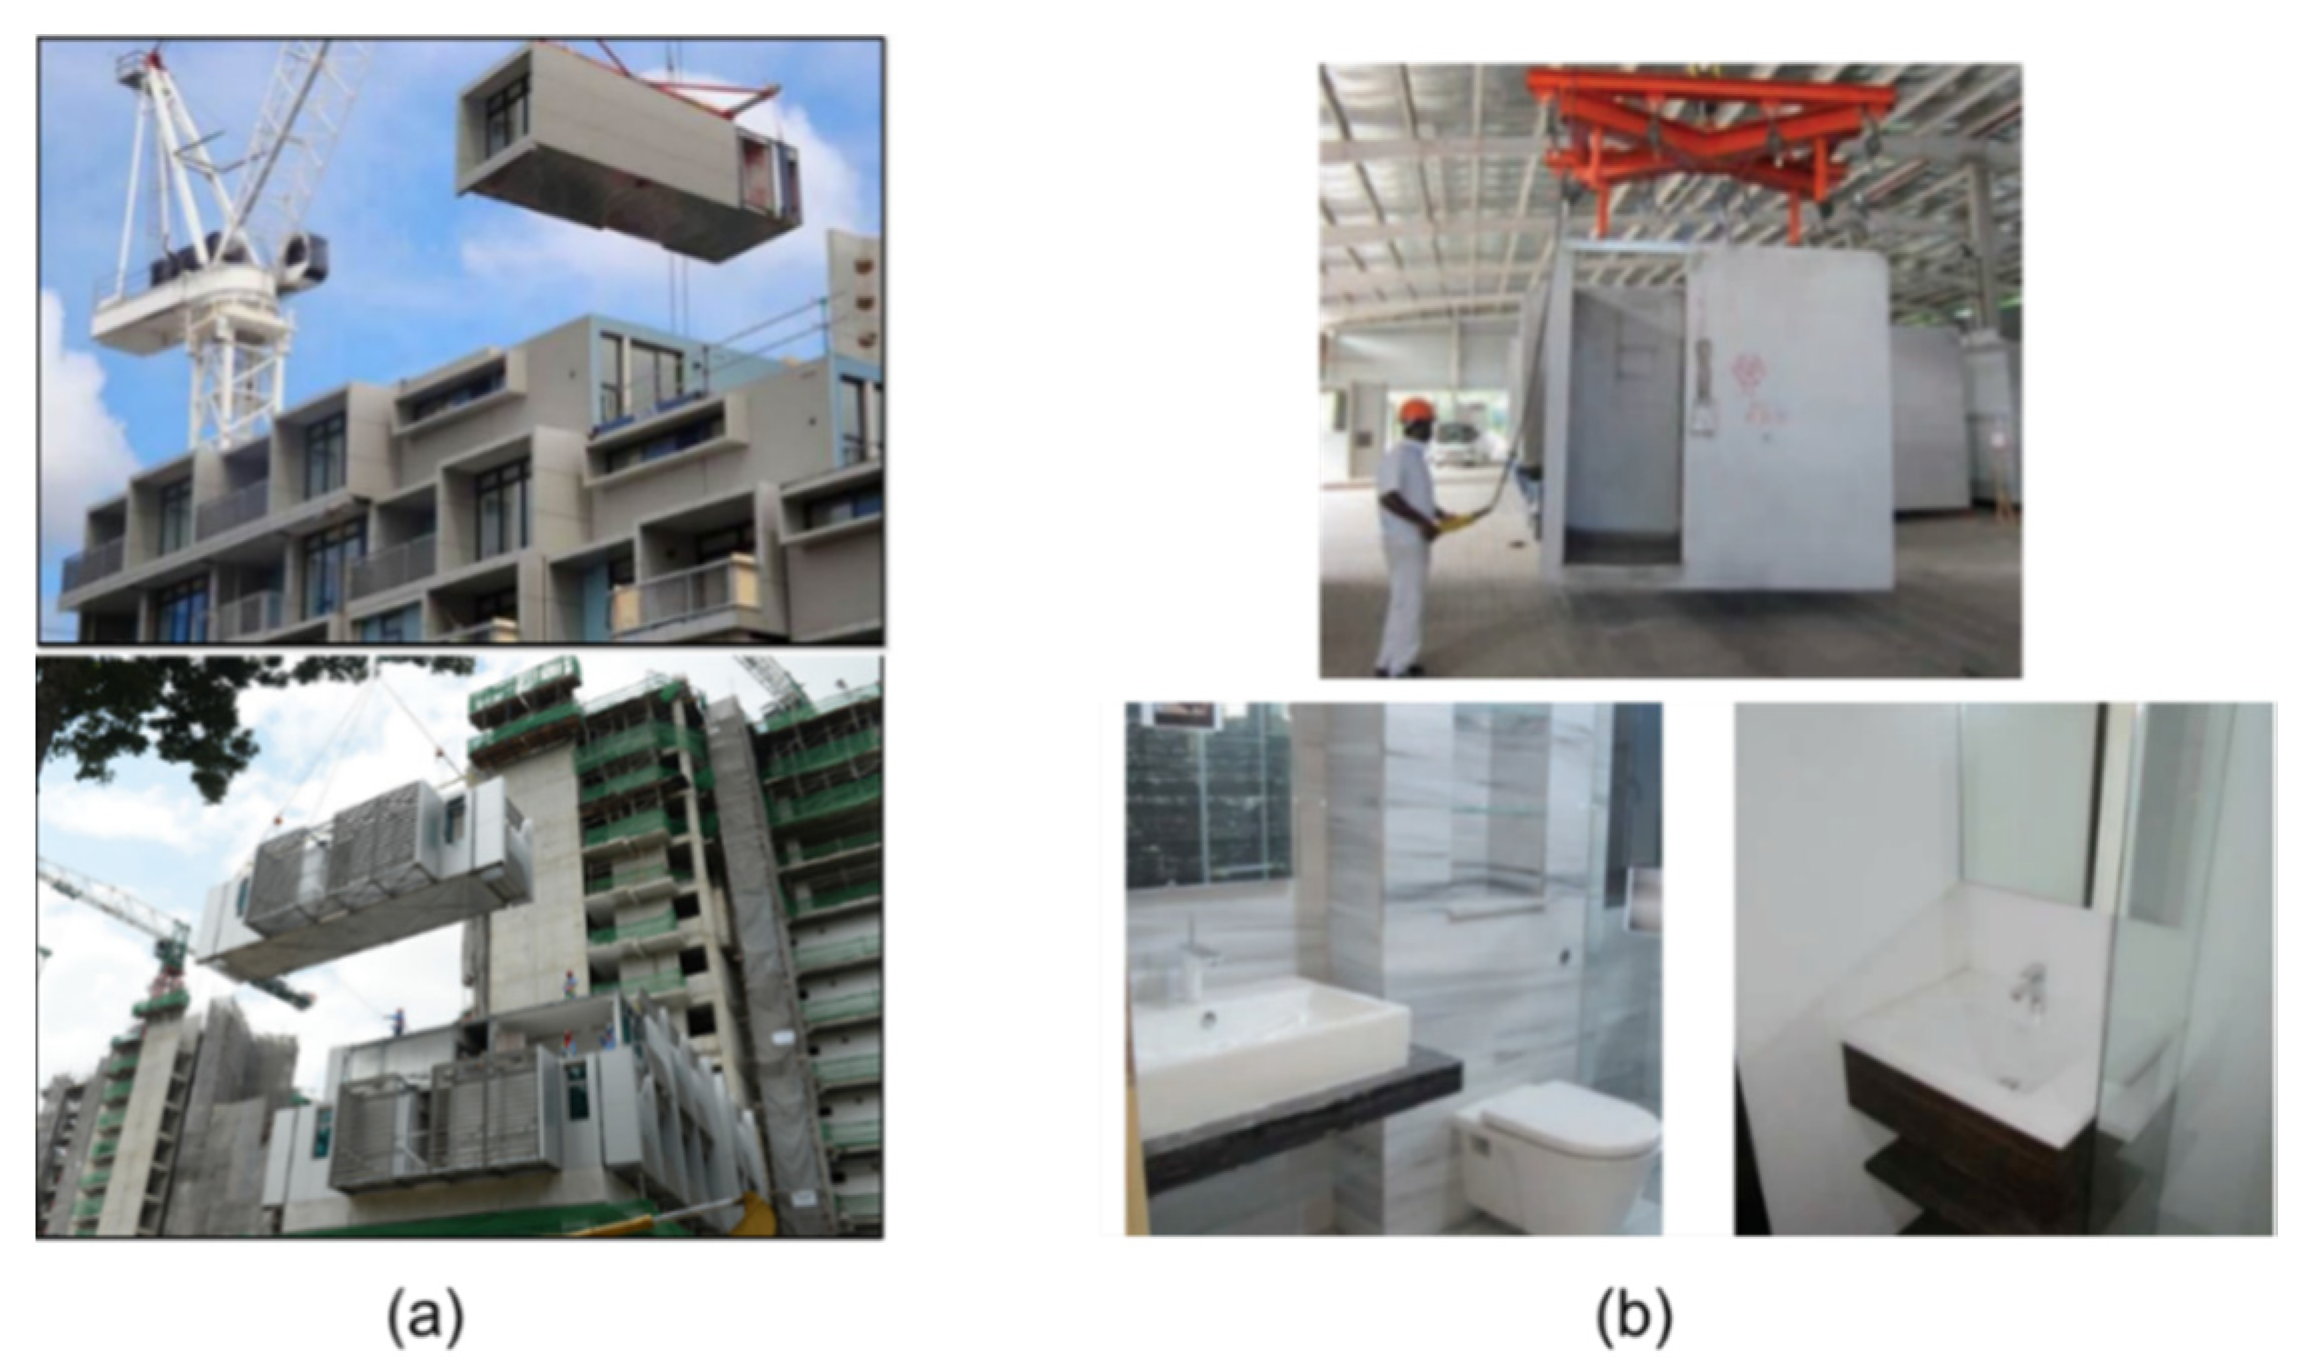
The PPVC refers to a construction method in which volumetric modules with finishes completed for walls, floors, and ceilings are manufactured in off-site factories and then assembled onsite as shown in Figure 2a. The PPVC is one of the most significant technologies that support the DfMA concept to speedup the construction process. Regarding manpower and time savings, PPVC can possibly improve construction productivity by up to 40%, depending on the nature of the projects. In addition, increased off-site works in a factory environment make onsite construction more environmentally friendly due to the reduced dust and noise pollution and also safer for workers. Due to the advantages, PPVC turns out to be selectively mandatory for construction projects that are developed on land released by the government [15]. Furthermore, BCA has published an acceptance framework to certify PPVC suppliers and manufacturers to guarantee different PPVC systems used are reliable and durable [15]. Another local authority in Singapore, the Housing and Development Board (HDB), also shows a strong interest in PPVC and is adopting PPVC for public housing.
A PBU refers to a bathroom unit preassembled off-site complete with finishes, sanitary wares, concealed pipes, conduits, ceiling, bathroom cabinets, shower screen, and fittings before installing in position as shown in Figure 2b. The bathroom is usually one of the smallest rooms in a dwelling unit. However, it is also one of the most labor-intensive elements to be constructed because it involves lots of building trades such as waterproofing, finishes, accessories, plumbing, sanitary, and electrical works. By shifting most of the fabrication work and wet trades off-site to the controlled environment of a factory, PBUs can yield both time and manpower savings by about 60%. Furthermore, there is a better control of both materials and the prefabrication process, resulting in higher quality finishes and lesser wastage [30].
2.2. BIM and LiDAR Technologies
The BIM model, which is able to store geometric and semantic information of building elements, has been widely utilized through the life cycle of building projects for the past decade, including the planning, design, construction, operation and maintenance (O&M), and demolition stages. For the planning stage, the information provided by BIM can assist engineers to make effective decisions [31]. In the design stage, BIM is utilized in various perspectives, including assessing embodied energy associated with building material [32], eliminating the extra cost of design changes [33], calculating green rating of buildings [34], and also identifying clashes during mechanical, electronica, and plumbing (MEP) design [35]. In the construction stage, BIM applications include construction site layout planning [36], safety management based on visualization [37] and rules [38], equipment deployment [39], and dynamic project financing monitoring [40]. As for the O&M stage, BIM has been commonly used in facility management [41], emergency response [42], and indoor environmental quality monitoring [43]. In the demolition stage, BIM is mainly utilized to estimate the material quantities to be deconstructed [44] and minimize the demolition waste [45].
The LiDAR technology can be used to efficiently and accurately capture the 3D surface geometries of the target objects using the collected 3D laser scanned data [46]. The laser scanned data obtained from LiDAR contain a set of 3D points with position information (XYZ coordinates), color values (RGB colors), and possibly other attributes (e.g., intensity value). Compared to conventional measurement approaches, which are usually conducted manually or using other electronic devices, LiDAR technology has a much higher measurement rate and better accuracy. Therefore, LiDAR has been leveraged to improve the productivity of several industries, such as geography [47], agriculture [48], manufacturing [49], and construction [50,51]. To use LiDAR for certain applications, the following steps are usually needed including data acquisition, data cleansing, data registration, data segmentation, and object recognition. As for data acquisition, LiDAR measures the distance to the target object by emitting laser beams and receiving the reflected signals from the target. The collected laser scanned data usually contain noise data due to the technical limitations of the devices. Therefore, different methods and algorithms were proposed to remove noise data including mixed pixels [52] and other noise [53]. Data registration aims to combine scanned data from multiple scan locations into the same reference system, which often includes a coarse registration [54] and a fine registration [55]. After data registration, the registered laser scanned data can be clustered with similar features into homogeneous regions [56], which is known as data segmentation. For many applications, the final goal of using LiDAR is to generate semantically rich 3D models from the laser scanned data through object recognition, in which the laser scanned data are labeled into different classes [26].
2.3. Quality Inspection of Prefabricated Elements with LiDAR
Previous studies have adopted LiDAR for the quality inspection of prefabricated construction elements. These studies can be divided into two categories: dimensional quality inspection and surface quality inspection. For dimensional quality inspection, Kim et al. [57] developed a new algorithm to automatically extract the edges and corners of precast concrete elements from the laser scanned data in order to estimate the dimensional quality of these elements. Later, Kim et al. [58] validated the developed algorithm on full-scale precast concrete elements in an off-site manufacturing factory, showing promising efficiency and accuracy of the technique. Furthermore, Wang et al. [23] developed an algorithm to inspect the side surfaces of precast concrete elements with irregular geometries and complex features, such as shear keys and flat ducts, from laser scanned data. In another study, Wang et al. [21] proposed to use colored laser scanned data to check the positions of reinforcement bars on reinforced precast concrete elements and onsite validation showed that the proposed technique was accurate and efficient. Some other researchers are focused on the inspection of discrepancies and alignment of prefabricated components. Safa et al. [59] introduced an automated process for the quality management of prefabricated pipe spools based on 3D point cloud data collected from photogrammetry and laser scanning. Based on 3D point cloud data and robotic kinematics theories, Nahangi et al. [60] developed a method to quantity and analyze the local discrepancy in the assemblies of construction components. Rausch et al. [61] developed a dimensional variation analysis (DVA) approach based on kinematics theory to analyze the dimensional variability in construction assemblies from point cloud data and BIM. Furthermore, the quality inspection of welded metal components has also drawn attention from researchers. For example, Rodríguez-Martín et al. [62] leveraged point cloud data to measure the angle of each welded plaque and the misalignment for the welded union.
For surface geometry inspection, Kim et al. [63] proposed a technique that could simultaneously localize and quantify the spalling defects on precast concrete surfaces from laser scanned data. In addition, Wang et al. [64] checked the surface geometry of precast concrete elements regarding surface flatness and distortion based on laser scanned data. The proposed techniques were implemented and validated on both small-scale 3D printed specimens and full-scale precast concrete slabs. Some other research efforts are reported on surface quality of floor slabs. For example, Bosché and Guenet [65] proposed a floor surface measurement method based on laser scanned data and BIM, which could measure floor flatness with the Straightedge and F-Numbers methods. Li et al. [66] applied 3D laser scanning for the flatness assessment of both construction surface and component surface and presented a comprehensive color-coded deviation map for concrete surface flatness visualization.
In general, there are limited previous studies on the quality inspection of precast and prefabricated elements, compared to in situ constructions. Among the limited studies, most of them are focused on the geometric quality inspection of a single precast or prefabricated element. Few studies are conducted for the geometric quality inspection of an entire prefabricated housing unit, such as a PPVC or PBU, which contains multiple construction elements from different disciplines. In this study, the developed technique is able to inspect the geometric quality of prefabricated housing units that contain multiple elements and to inspect the geometric quality of both structural and MEP elements.
3. Checklist for Geometric Quality Inspection of Prefabricated Housing Units
In order to carry out the geometric quality inspection of prefabricated housing units, the inspection checklist and tolerance for each item in the checklist should be identified. Therefore, according to the Construction Quality Assessment System (CONQUAS) stipulated by BCA, the geometric quality inspection checklist and the corresponding tolerance of prefabricated housing units are summarized in Table 1. The checklist includes two main categories of elements in prefabricated housing units: structural elements and MEP elements as illustrated in Section 3.1 and Section 3.2, respectively.
3.1. Structural Elements
For each structural element, such as a wall panel, the checklist items include dimension, opening dimension, opening position, straightness, squareness, twist, and flatness. The first three items are focused on dimensional quality, while the latter four items are focused on surface quality.
3.1.1. Dimension
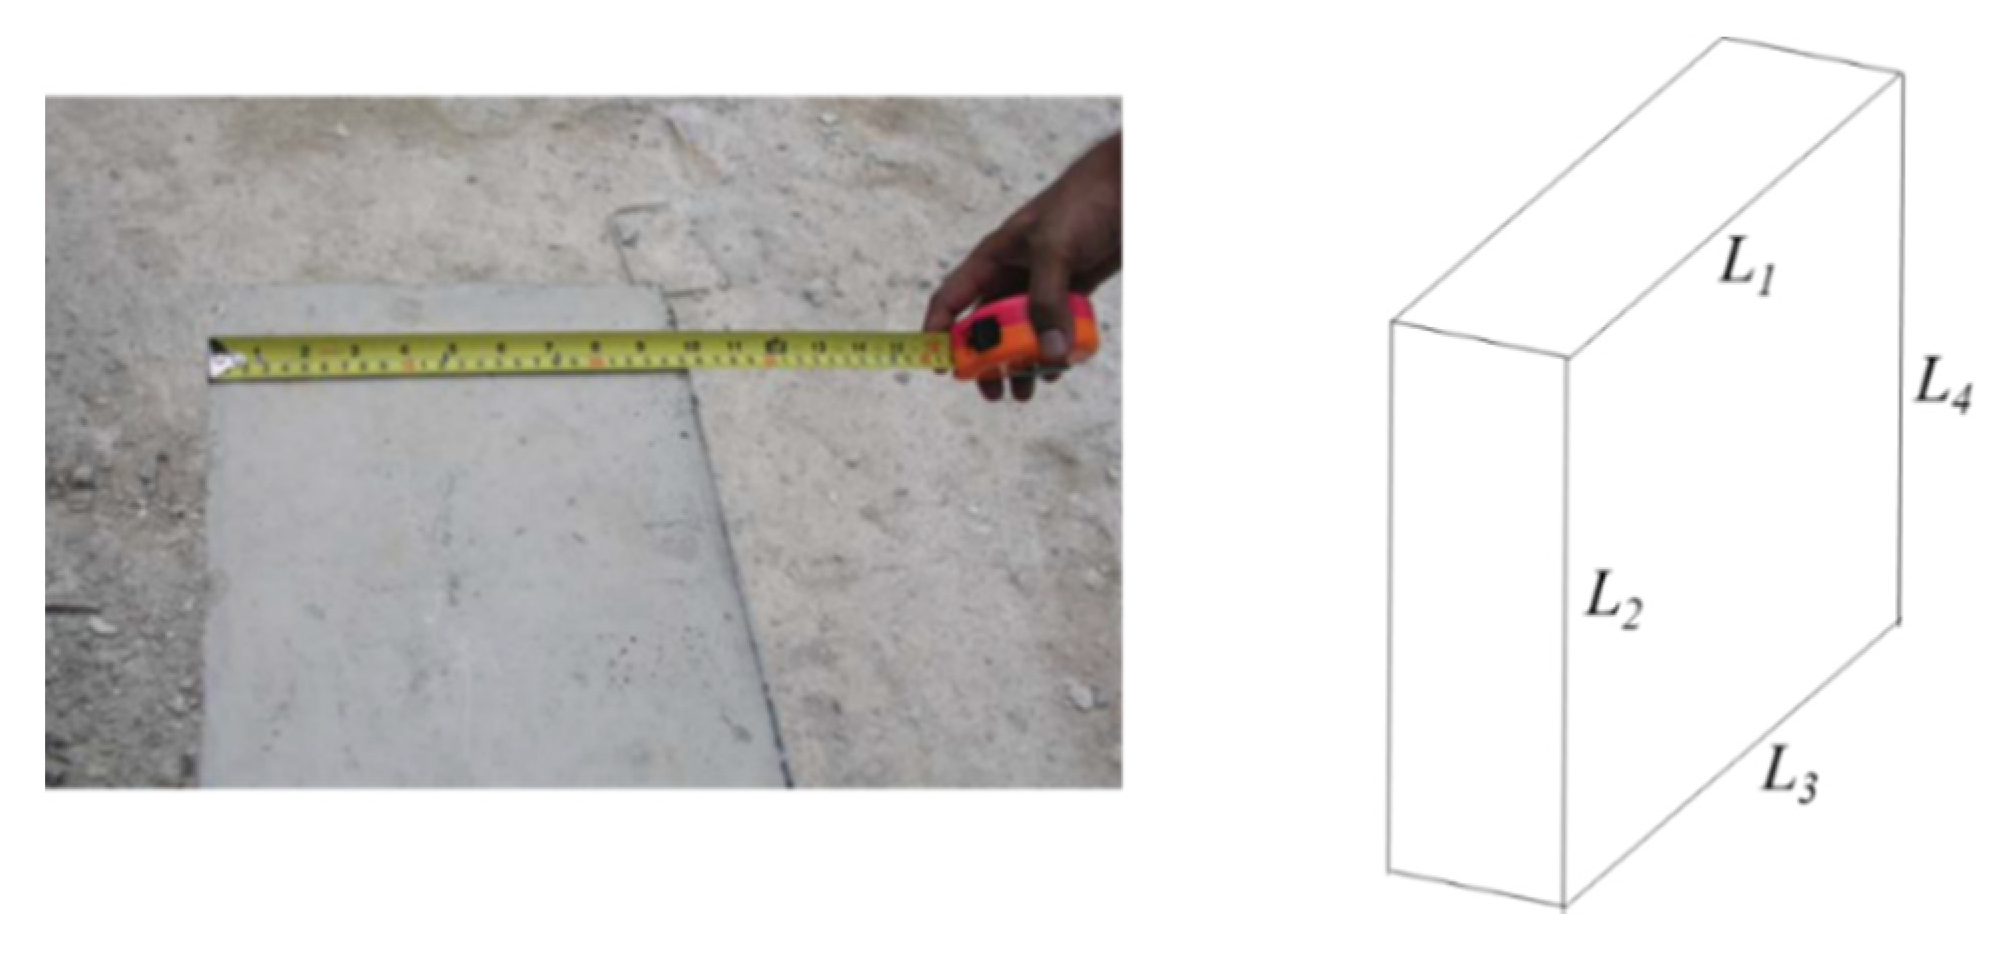
Dimension inspection is the most common and important item for the geometric quality inspection of structural elements. Measurement tapes are usually used to conduct dimension inspection as shown in Figure 3. It is common that the actual dimensions of prefabricated structural elements are slightly different from the as-designed dimensions. However, the dimension variation should be within an acceptable tolerance.
For the structural element shown in Figure 3, the dimensions are measured as the lengths of all the four edges such as L1 to L4. The tolerance value depends on the length of edges. If the edge length L is no more than 3 m, the tolerance value is ±6 mm; if the edge length L is between 3 m and 4.5 m, the tolerance value is ±9 mm; if the edge length L is between 4.5 m and 6 m, the tolerance value is ±12 mm. For an edge length L longer than 6 m, the tolerance value increases by ±6 mm for every subsequent 6 m.
3.1.2. Opening Dimension
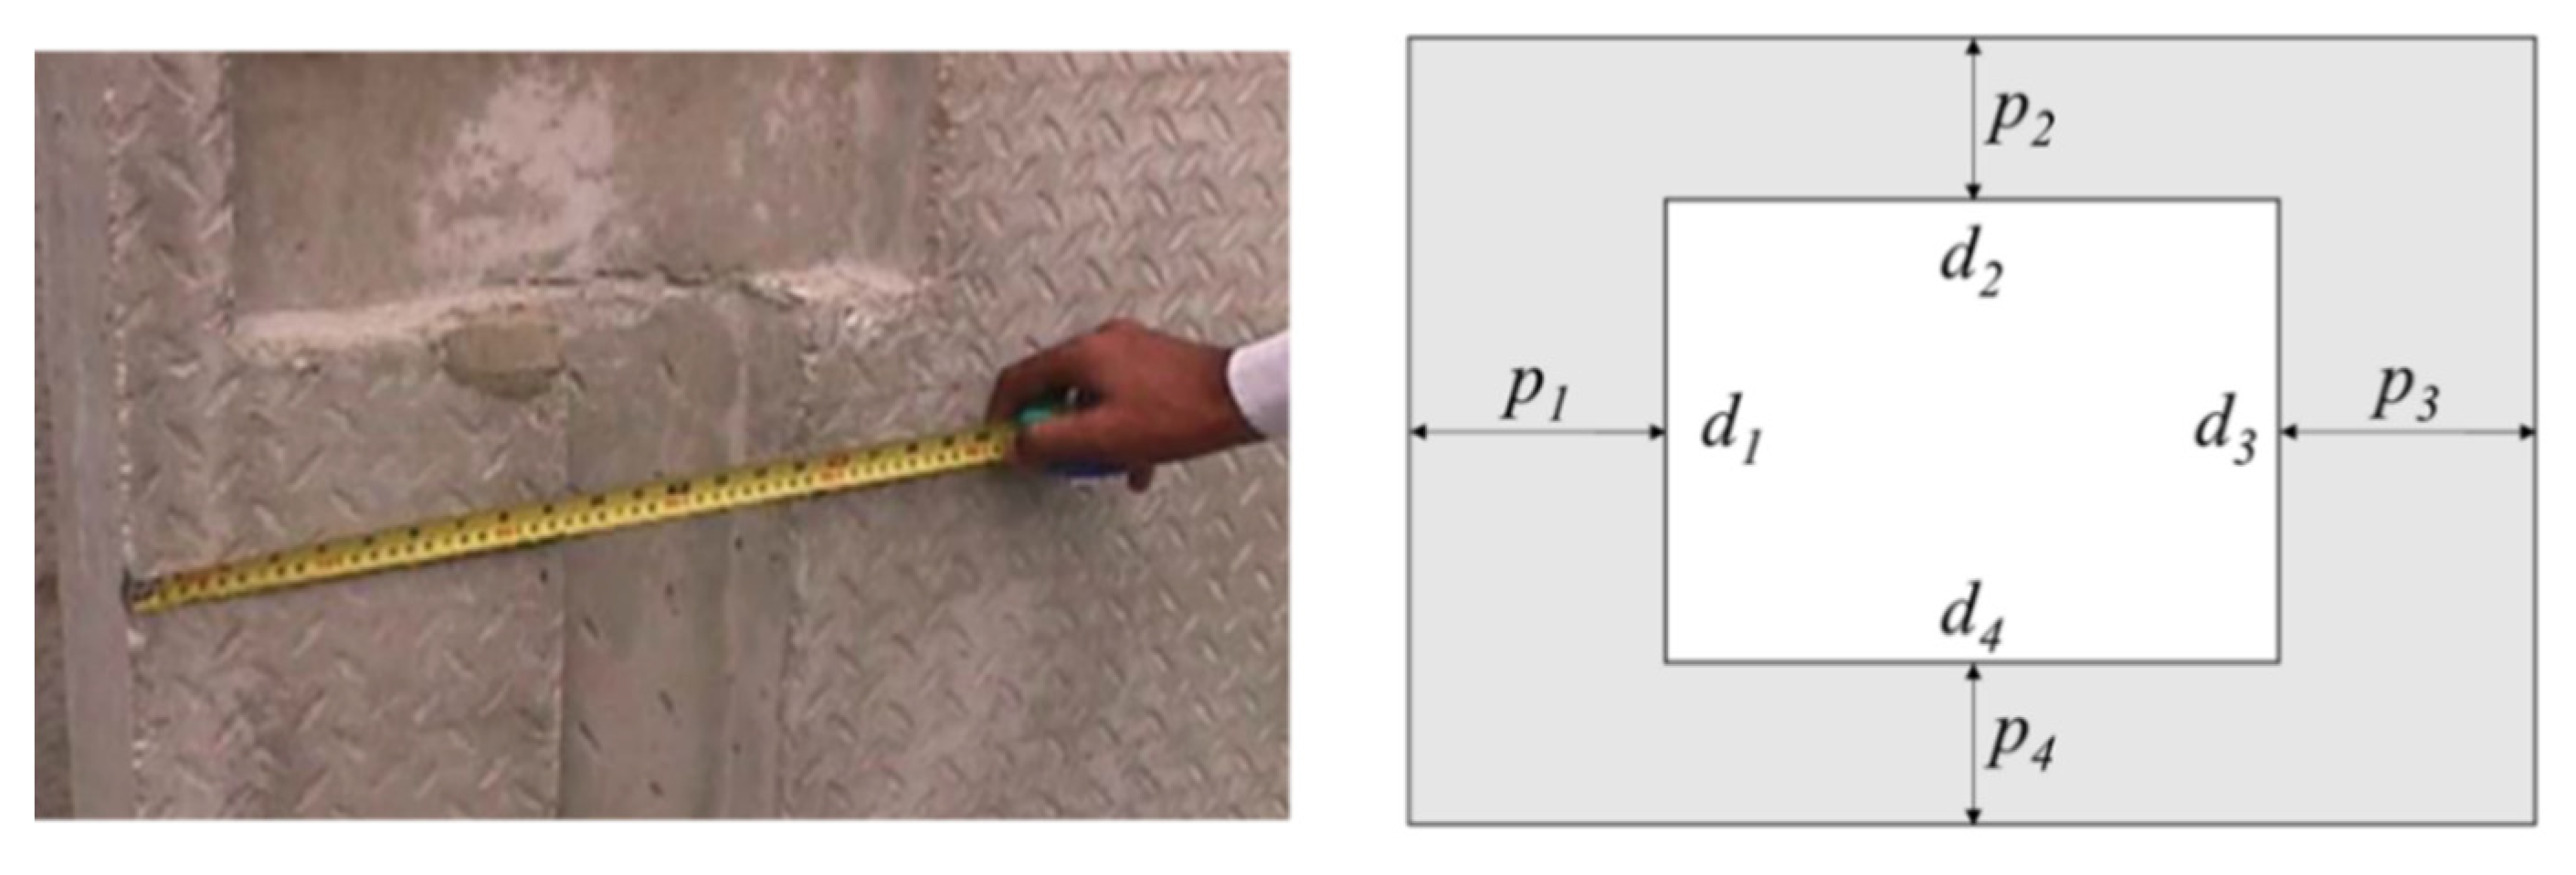
Openings are often needed on prefabricated structural elements to enable the insertion of MEP services. To ensure proper installation and connection of MEP services, the dimensions of openings must conform to the designed blueprint. The dimensions of an opening are measured as the lengths of all the opening edges (e.g., d1 to d4 in Figure 4), traditionally by a measurement tape. The tolerance value for opening dimension is ±10 mm according to the regulation.
3.1.3. Opening Position
The positions of an opening are also important for proper installation and connection of MEP services. As shown in Figure 4, the positions of an opening are measured as the distances from edges of the opening to the edges of the structural element such as p1 to p4. The tolerance value for opening positions is ±25 mm according to the regulation.
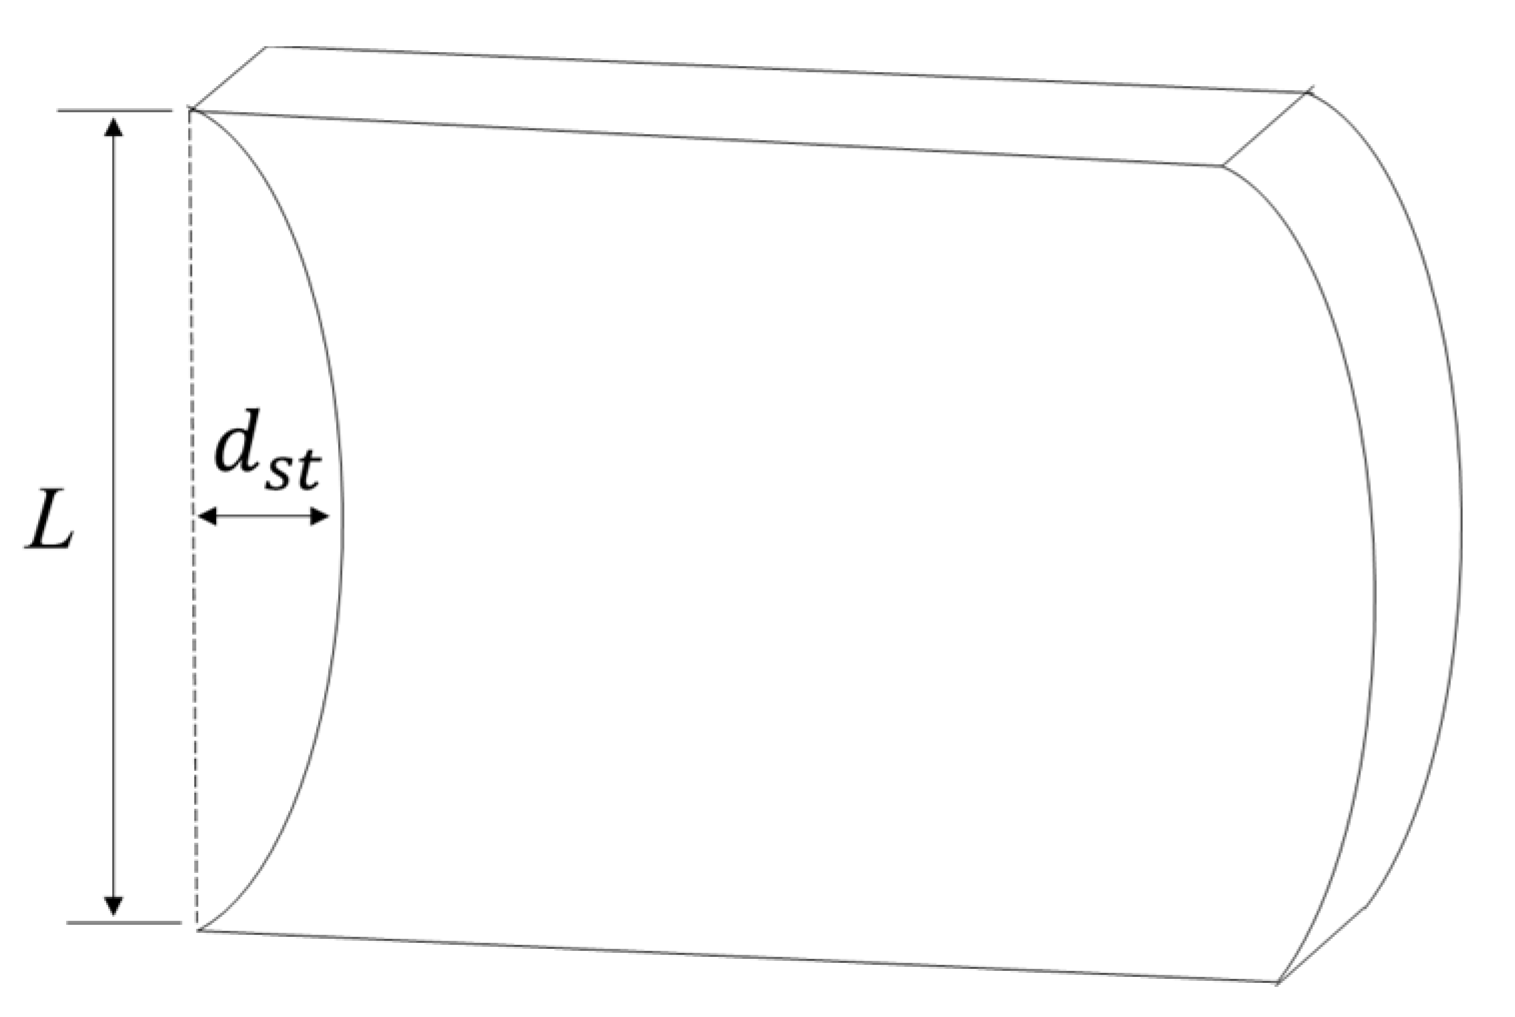
3.1.4. Straightness
As a measure of surface quality, straightness is used to ensure that the prefabricated structural element follows the axis or intended line. Specifically, straightness is measured as the maximum deviation, , from an edge to the line containing the two ends of the edge as shown in Figure 5. The straightness can be measured along all four edges of a structural element. The tolerance of straightness depends on the length L of the element edge where the straightness is measured. If the length L is no more than 3 m, the tolerance value is 6 mm; if the length L is between 3 m and 4.5 m, the tolerance value is 9 mm; if the length L is between 4.5 m and 6 m, the tolerance value is 12 mm. For a length L longer than 6 m, the tolerance value increases by 6 mm for every subsequent 6 m.
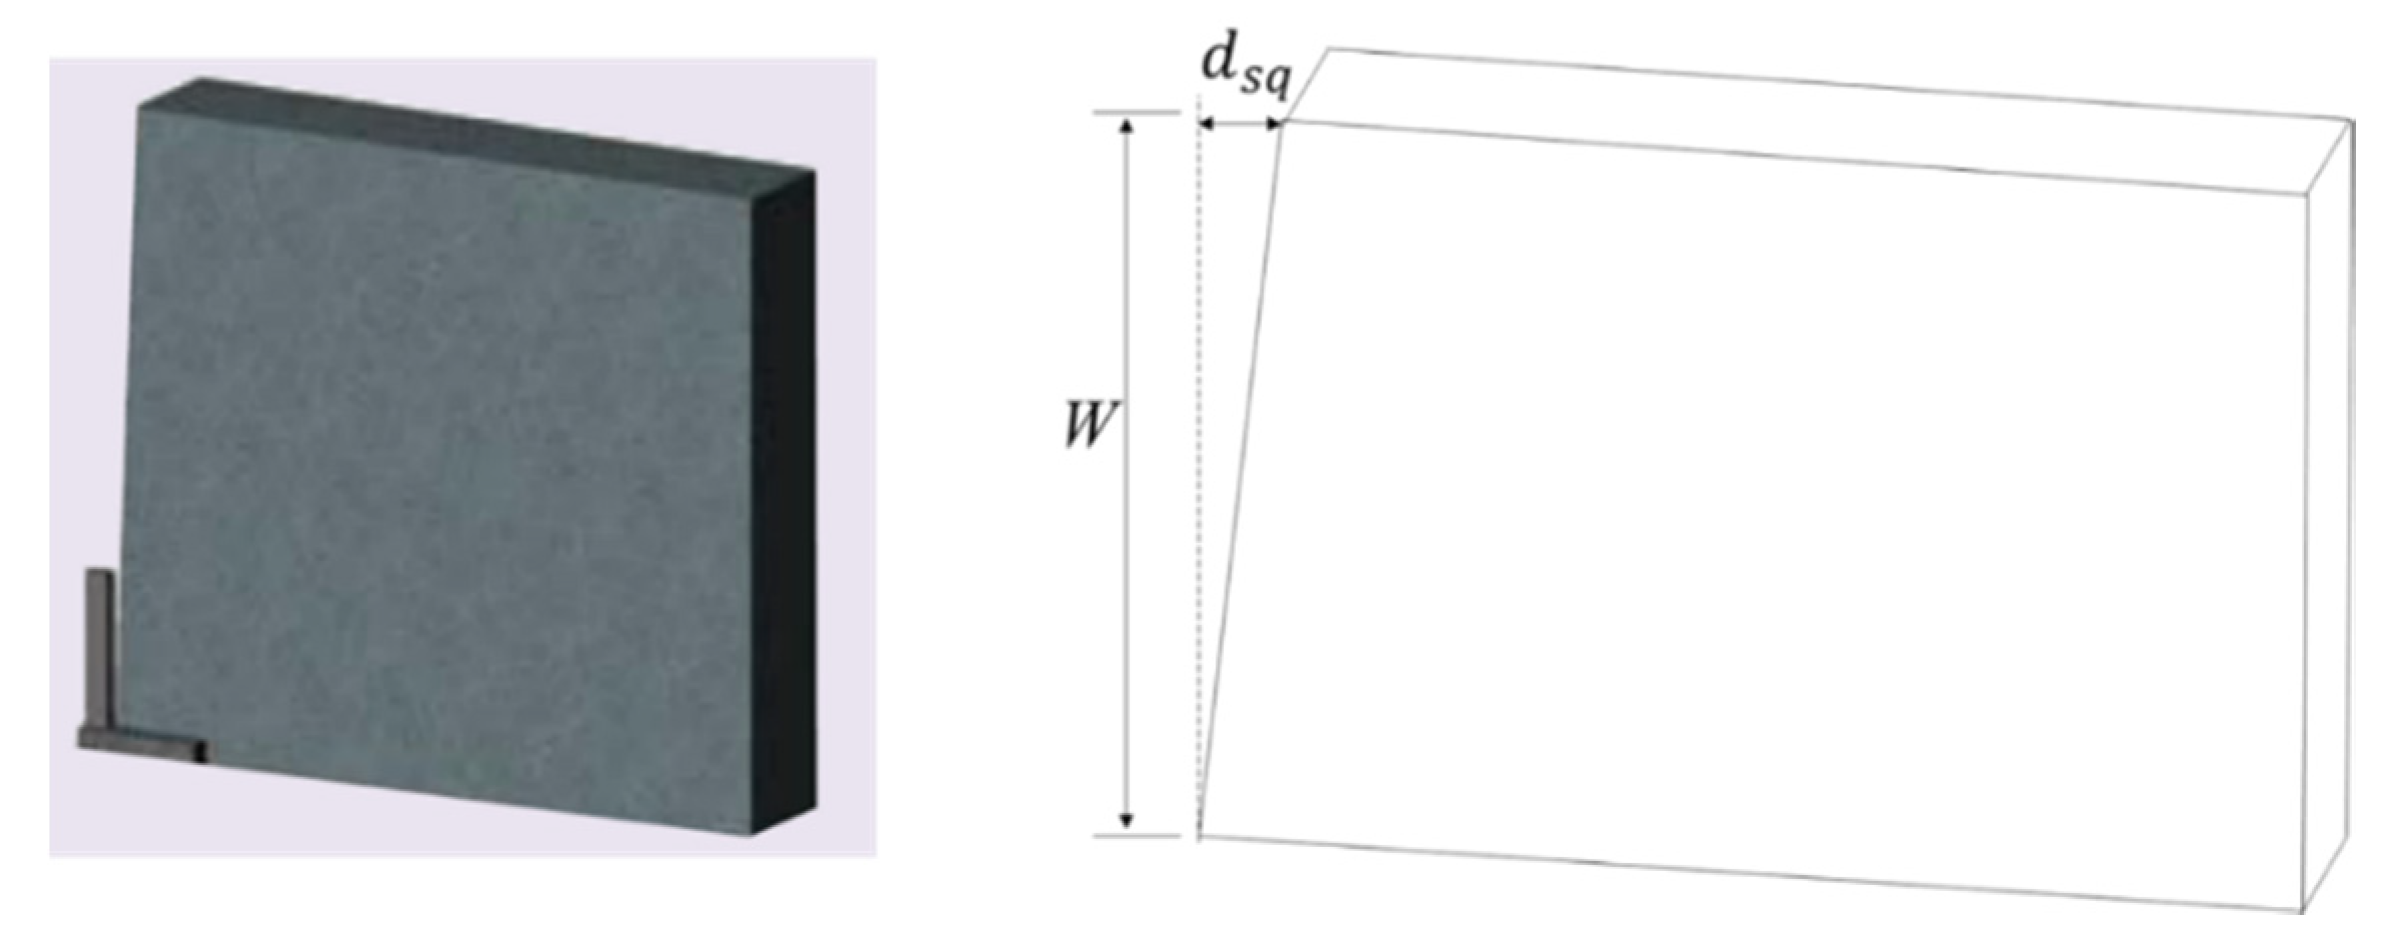
3.1.5. Squareness
Squareness of a structural element surface is another important inspection item in the inspection checklist which is usually manually conducted using a try square at a corner as shown in Figure 6. When considering the squareness of a corner, the longer of two adjacent sides being checked is usually taken as the baseline. Then, the squareness is measured as the deviation between the shorter side and the assumptive line that is perpendicular to the longer side as shown in Figure 6. The squareness can be measured at all the four corners of a structural element. The tolerance of the deviation depends on the width W of the element (i.e., the length of the shorter side). If the width W is no more than 1.2 m, the tolerance value is 6 mm; if the width W is between 1.2 m and 1.8 m, the tolerance value is 9 mm; if the width W is larger than 1.8 m, the tolerance value is 12 mm.
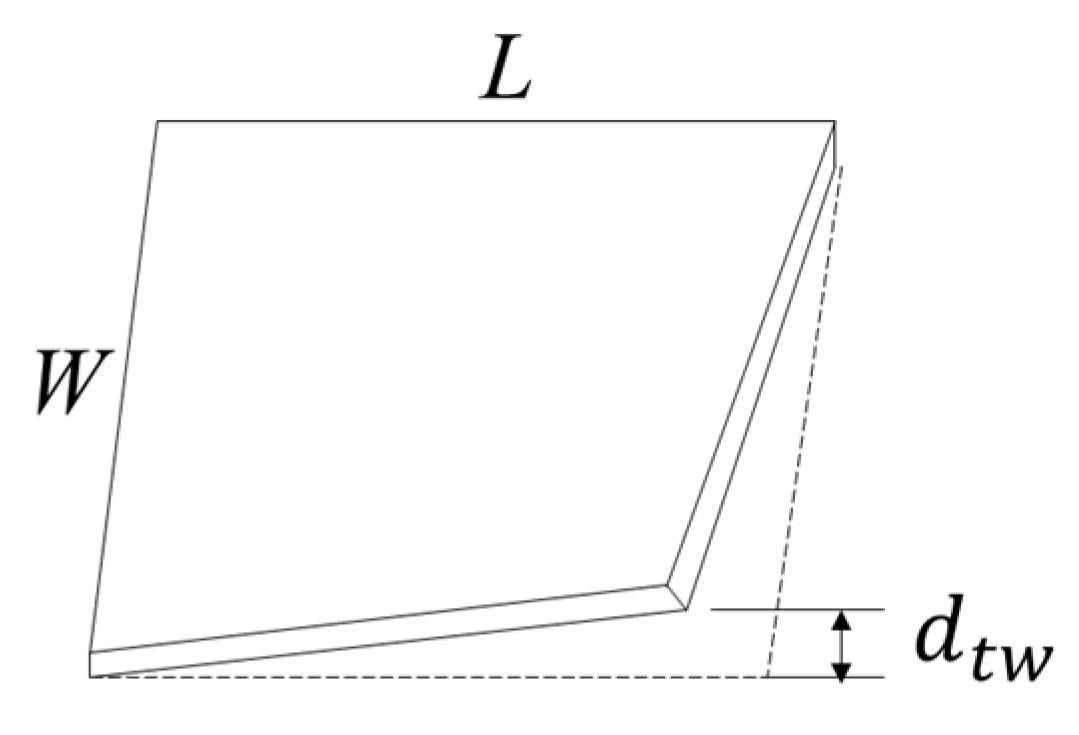
3.1.6. Twist
Twist of a structural element surface is measured as the deviation of any corner from the plane containing the other three corners as shown in Figure 7. Therefore, twist can be measured at all the four corners of a structural element. The tolerance value of the deviation depends on the width W and length L of the structural element. If the width W is no more than 600 mm and the length L is no more than 6 m, the tolerance value is 6 mm; otherwise, the tolerance value is 12 mm.
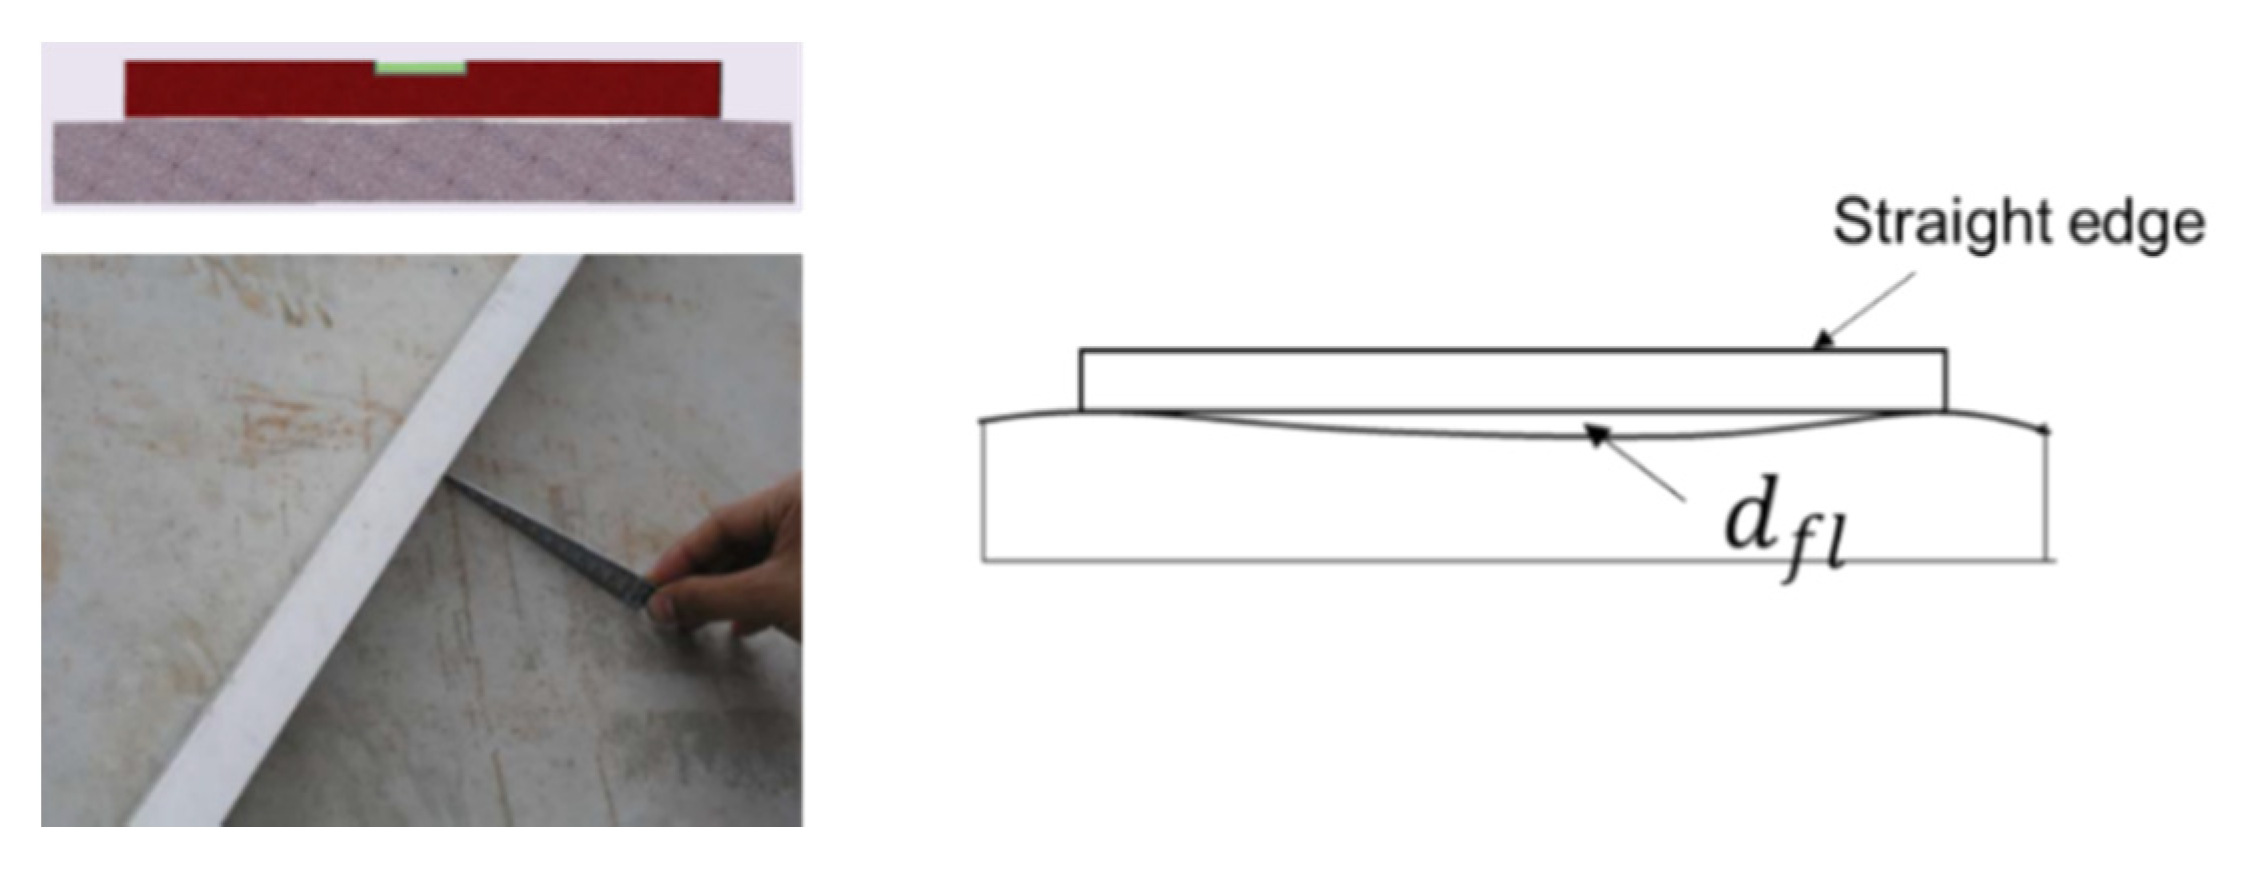
3.1.7. Flatness
Flatness is also an important inspection item in the inspection checklist which is usually manually conducted using a straight edge and a slip gauge as shown in Figure 8. To measure the flatness of a surface, a 1.5 m straight edge is randomly placed on the surface, and the maximum gap between the surface and the straight edge is measured by a slip gauge. According to the regulation, the tolerance value for the gap is 6 mm for 1.5 m straight edge.
3.2. MEP Elements
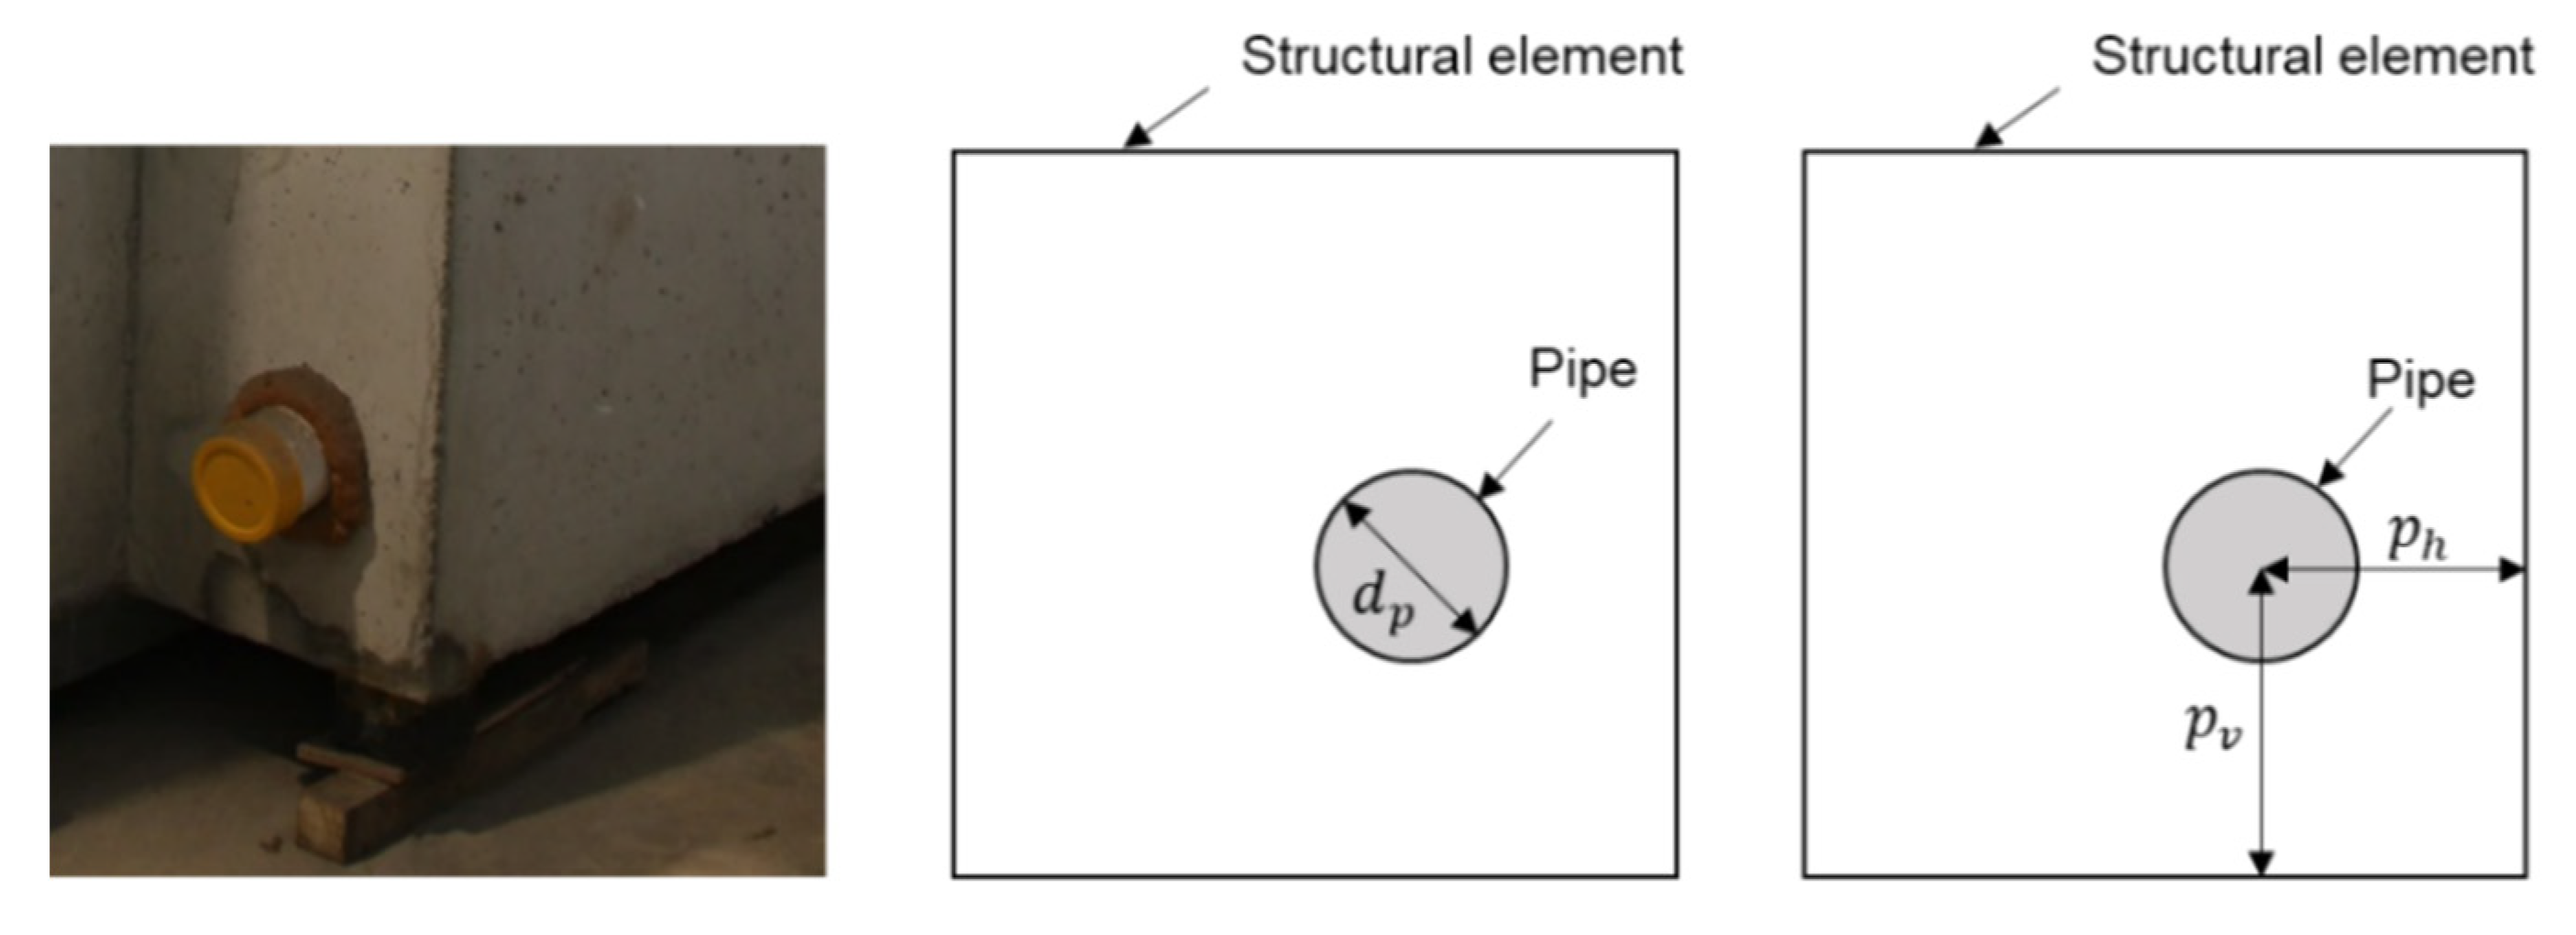
The MEP elements include pipes and ducts to host MEP services. The dimensions and locations of these MEP elements must conform to the as-designed ones to ensure the quality of the assembled constructions. This study is mainly focused on a specific type of MEP elements, namely, cylindrical pipes.
As shown in Figure 9, the dimension of a pipe is measured as its diameter , and the position of a pipe is measured as the distances ( and ) from its center to its adjacent edges of the structural element. The guidelines stipulated by BCA do not specify the tolerance value for pipe dimension and position. Based on the experiences of MEP engineers and fabricators, it is suggested that the tolerance for pipe dimension and position is 6 mm to ensure proper installation and connections of pipes within structural elements.
4. Proposed Geometric Quality Inspection Technique
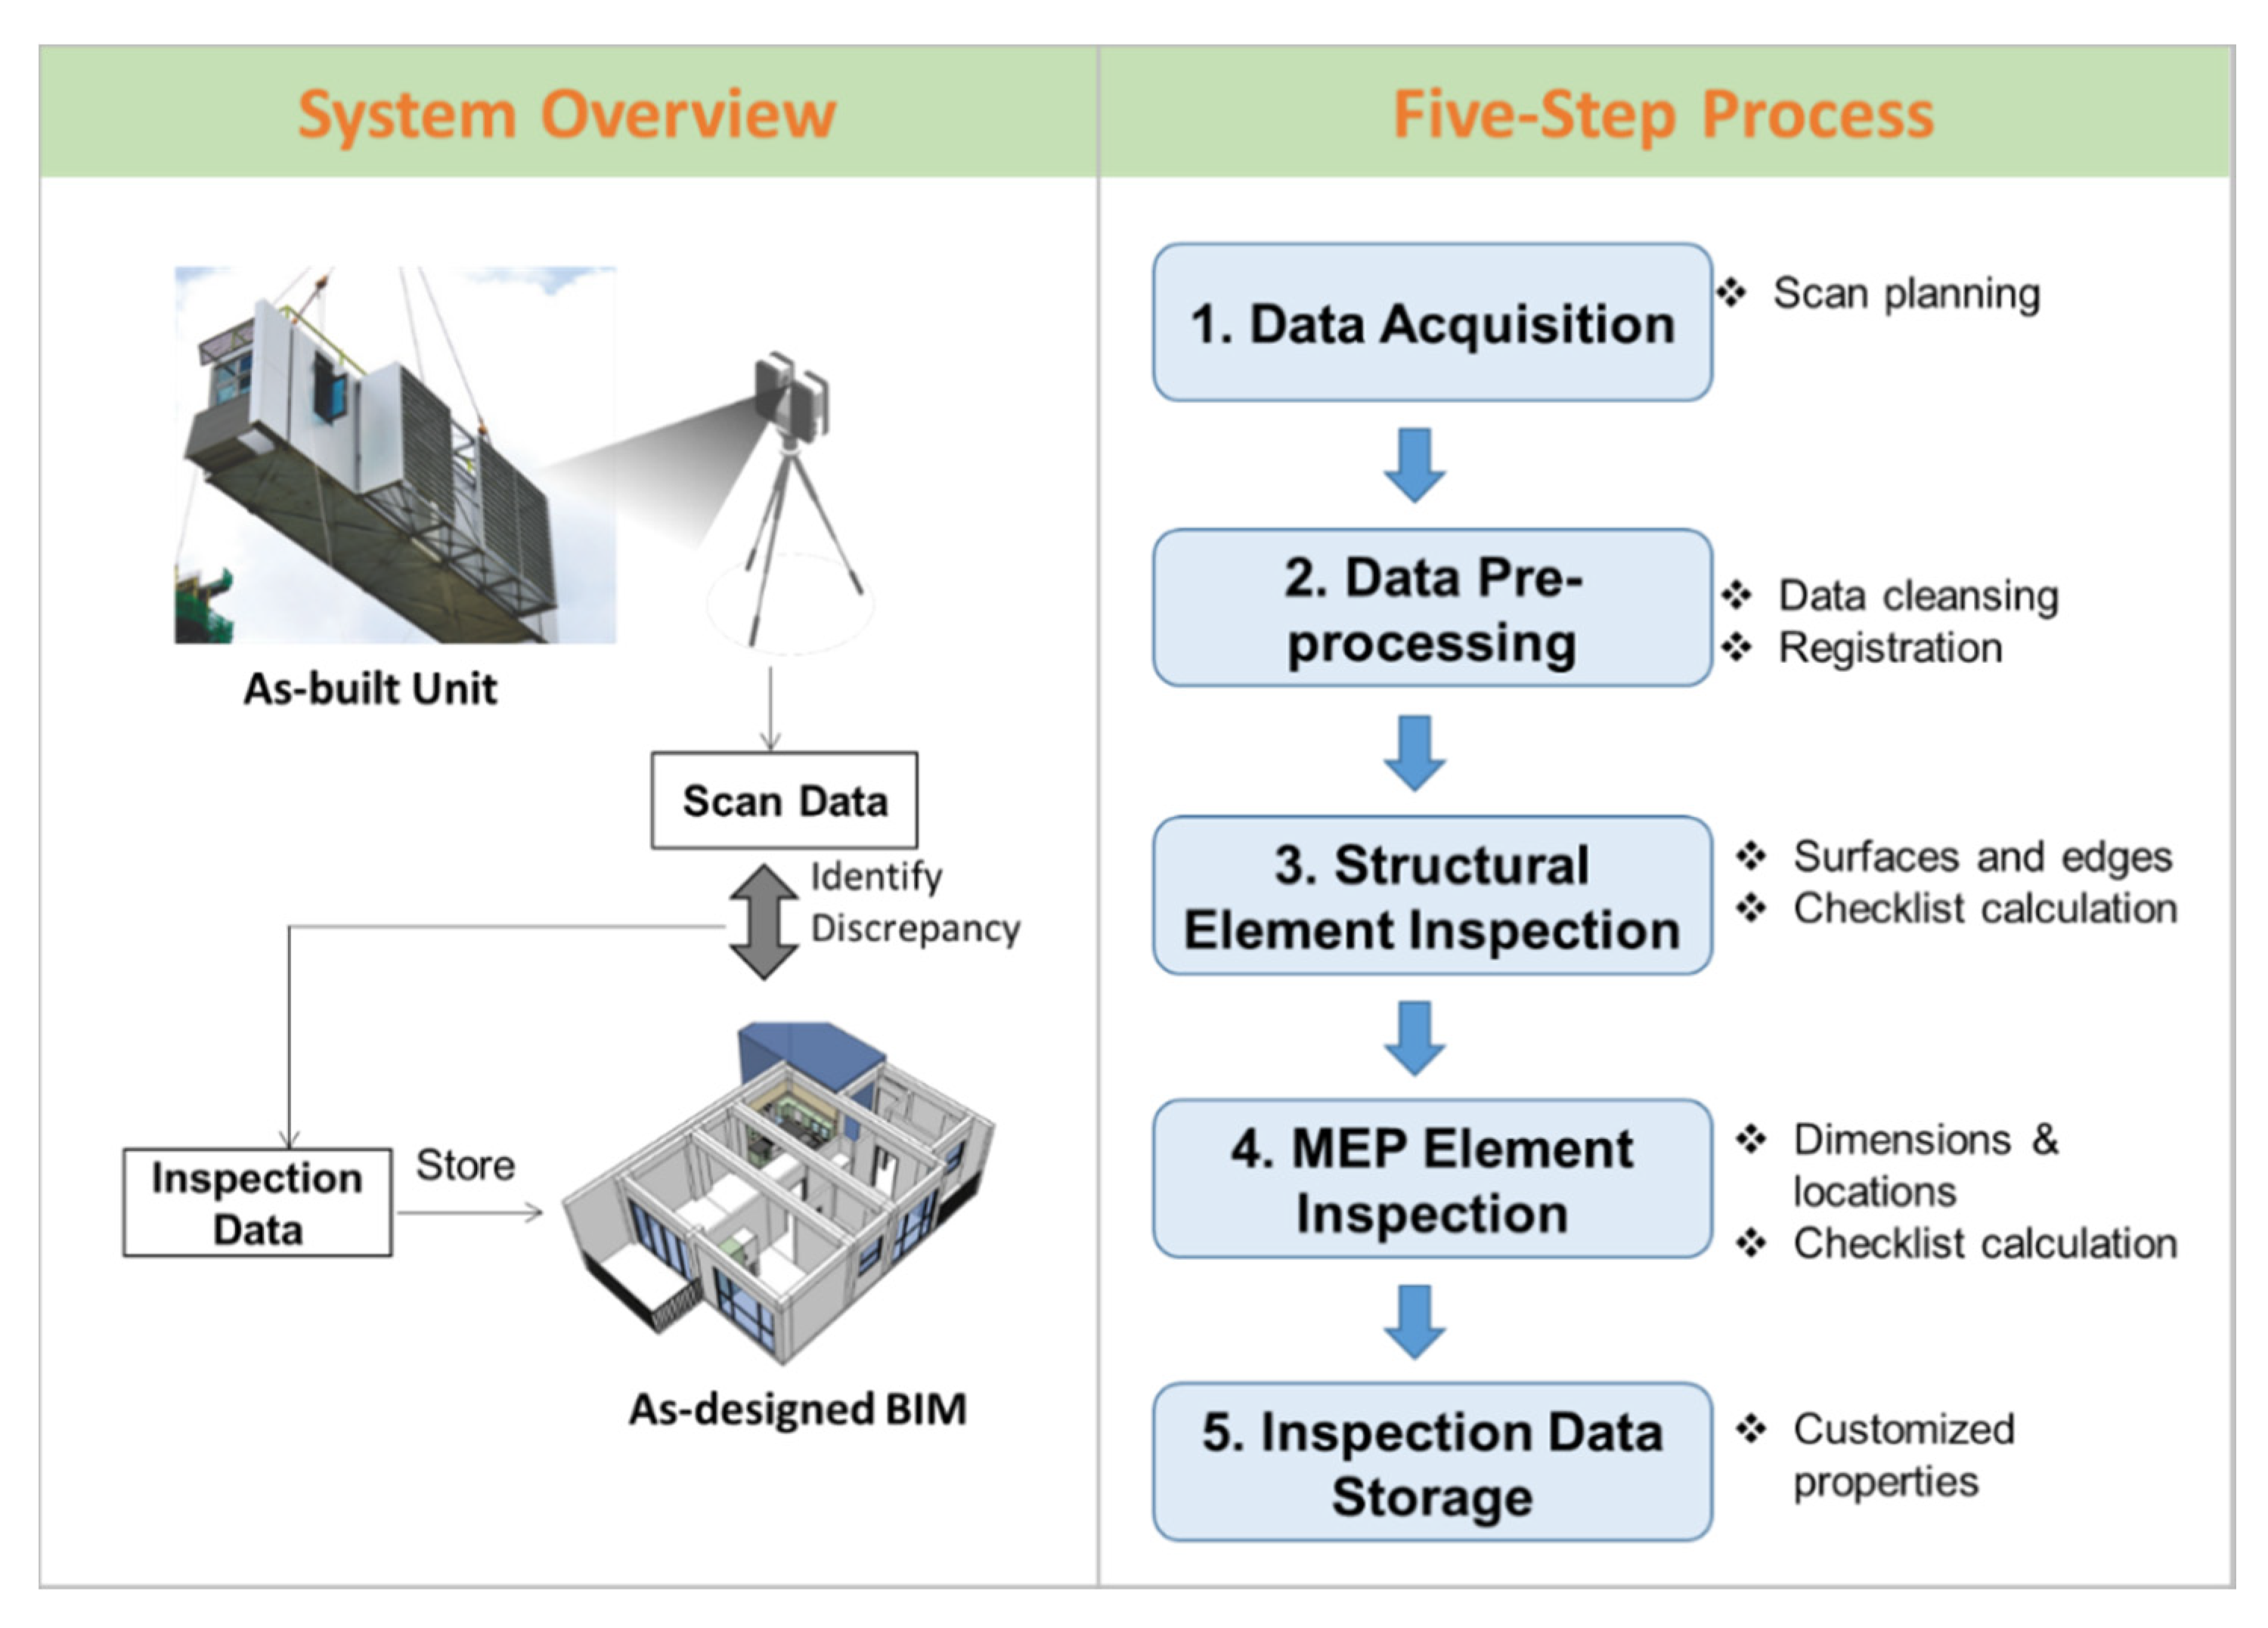
The overview and detailed five-step process of the proposed geometric quality inspection technique are shown in Figure 10. First, the proposed technique uses a LiDAR to obtain the laser scanned data of the as-built prefabricated units. Scan planning is needed before data acquisition to make sure the acquired data fulfil the needs of geometric quality inspection. Second, data pre-processing is conducted to remove noise data from raw laser scanned data and then register the scanned data with the as-designed BIM. Next, the structural elements of the prefabricated units are inspected after identifying the as-built surfaces and edges and comparing to the as-designed ones. Fourth, the MEP elements of the prefabricated units are inspected based on the as-built dimensions and locations of the MEP elements. Fifth, inspection data obtained from the previous steps are stored in BIM using customized BIM element properties. The details of the five steps are illustrated in Section 4.1, Section 4.2, Section 4.3, Section 4.4 and Section 4.5, respectively.
4.1. Data Acquisition
Data acquisition aims to acquire the laser scanned data of the prefabricated unit to be inspected. It is essential to carefully determine the scanning parameters so that the acquired data fulfil the needs of quality inspection while the scanning time is minimized. As a result, before the acquisition of laser scanned data of the prefabricated housing unit, scan planning is performed in the following two steps.
4.1.1. Determination of required scanned data quality
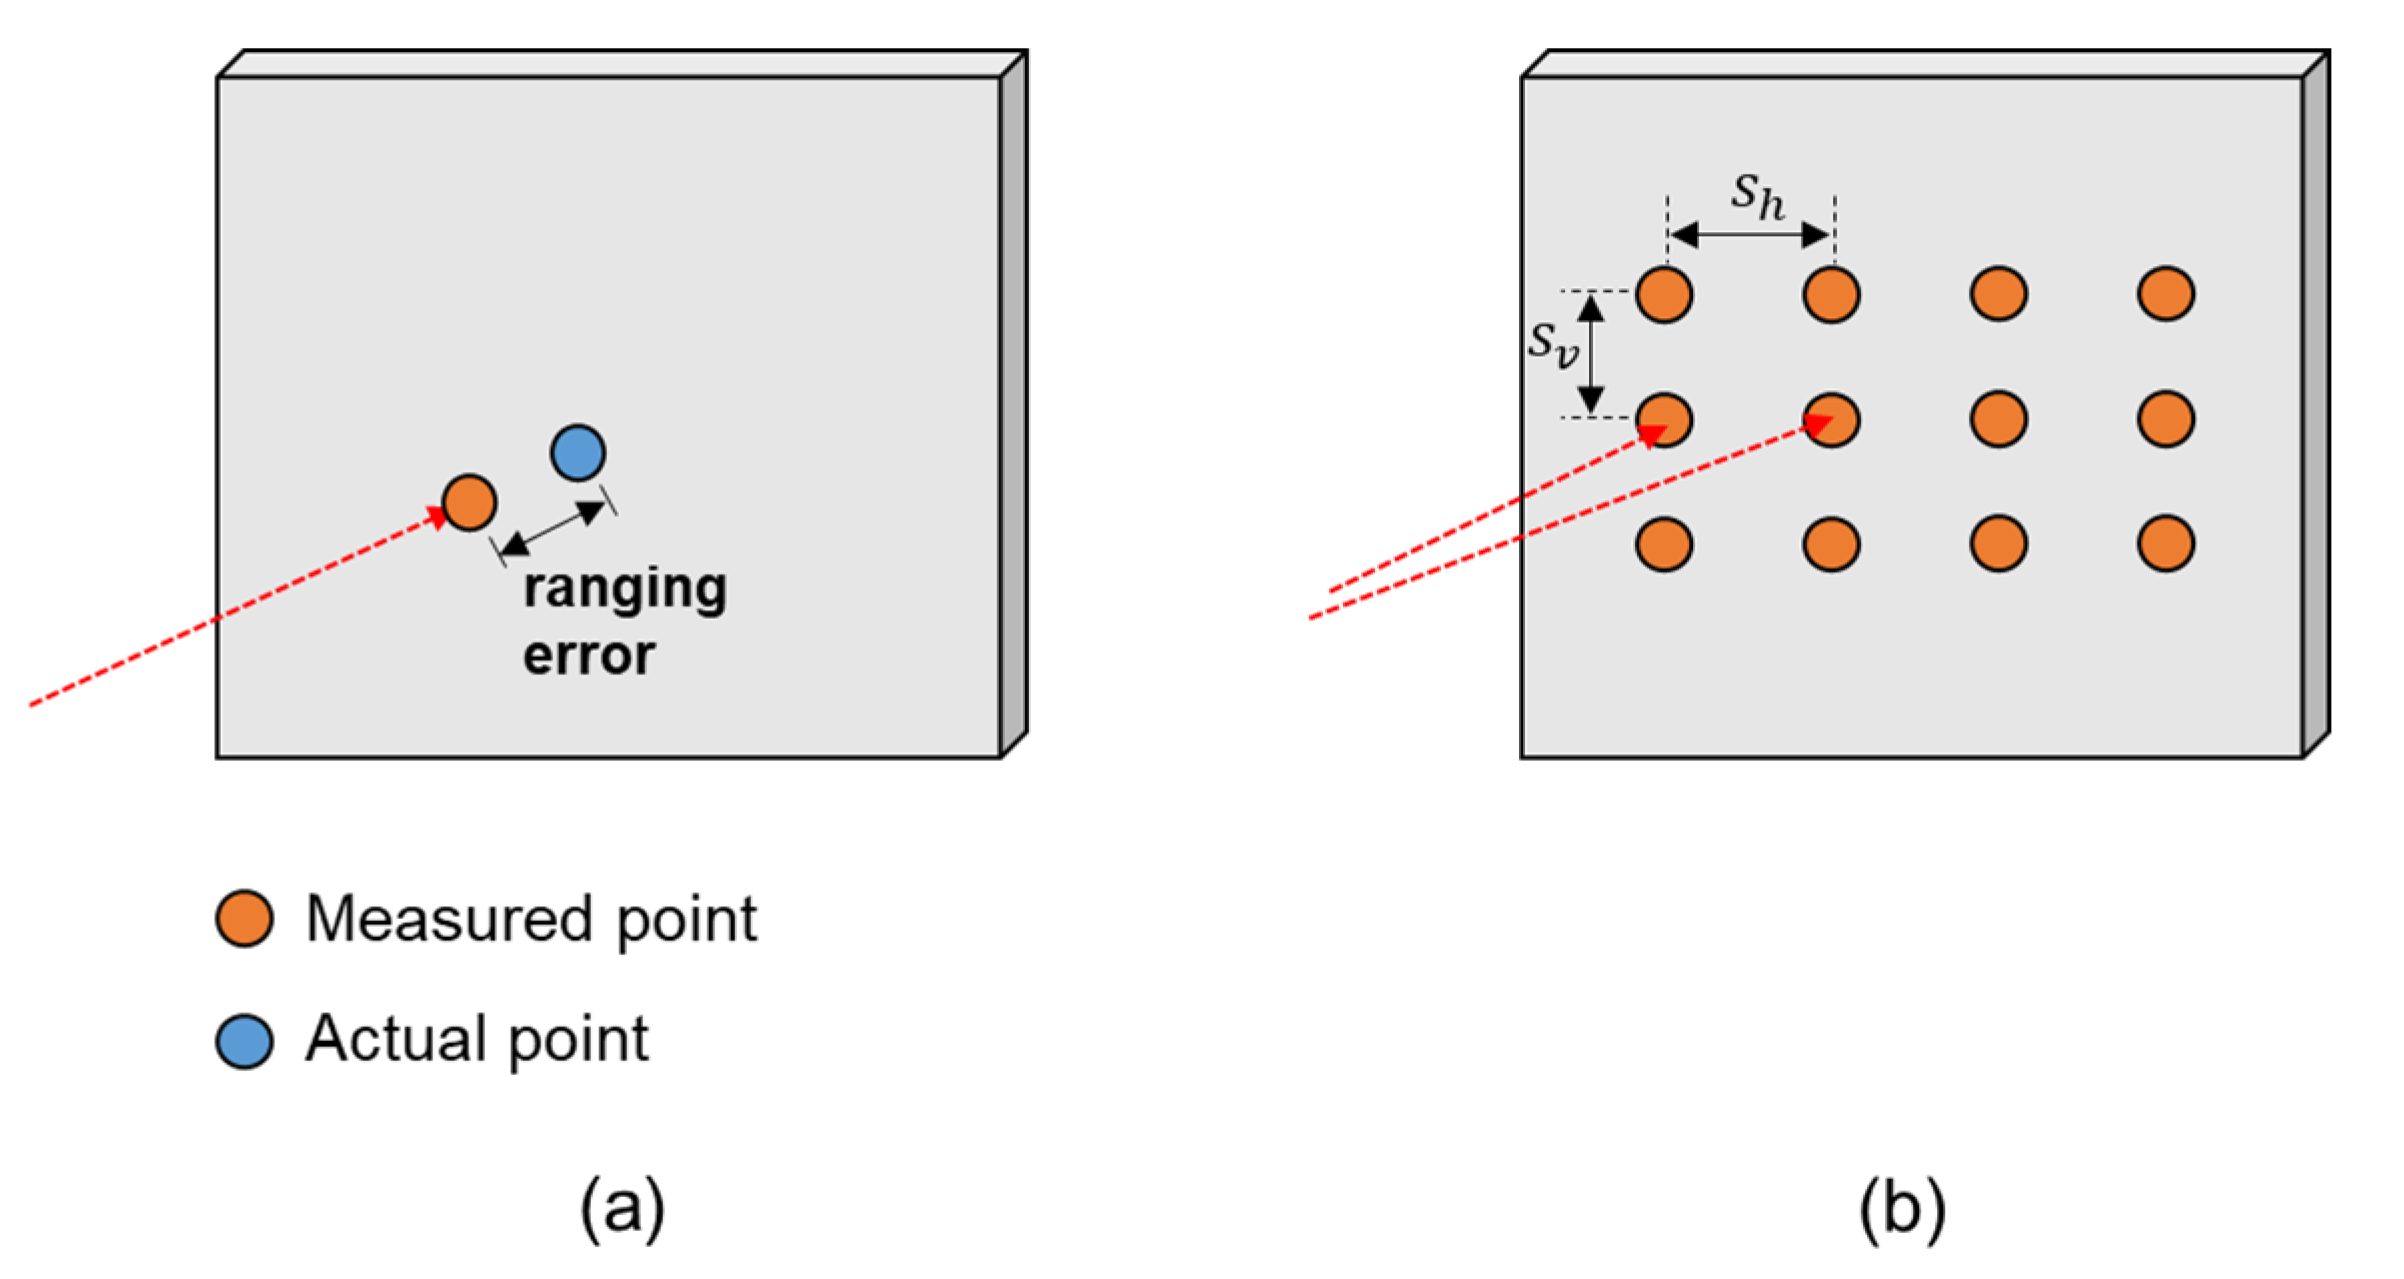
To ensure reliable quality inspection results, the scanned data must have enough quality with regard to accuracy and spatial resolution. As shown in Figure 11, the accuracy of scanned data is measured as the ranging error of individual scan point between the measured and actual points. Spatial resolution of scanned data is measured as the distance between two adjacent scan points, and the spatial resolutions ( and ) in horizontal and vertical directions can be different for a terrestrial LiDAR. Assuming that a scan point is measured with a root mean square error (RMSE) of 5 mm, the resulted object location measurement can have 5 mm error. Similarly, when the spatial resolution of scanned data is 5 mm, the resulted object dimension measurement will have an average error of 5 mm because object edges cannot be accurately estimated. Therefore, the required scanned data accuracy and spatial resolution depend on the allowable object location and dimension estimation error.
When the location and dimension estimation error obtained from scanned data is and the actual geometric discrepancy is , the measured discrepancy will be between and . For example, when the actual discrepancy is 7 mm and the estimation error is 3 mm, the measured discrepancy falls between 4 mm to 10 mm. In this case, although the actual discrepancy exceeds the tolerance value (e.g., 6 mm), it might be measured as a value smaller than the tolerance. A smaller estimation error always brings more reliable inspection results, but meanwhile requires a higher accuracy and spatial resolution of scanned data, which lead to a longer scanning time. Hence, a trade-off must be made between the reliability of inspection results and the time spent for scanned data acquisition. As discussed in Section 3, the checklist items for prefabricated housing inspection have tolerance values between 6 mm and 25 mm. After interviewing site engineers from prefabricators and contractors, it is suggested that the acquired scanned data should have an accuracy of ±2 mm and spatial resolution of 2 mm in both directions.
4.1.2. Determination of scanning parameters
After determining the required scanned data quality, proper scanning parameters are determined to make sure the acquire scanned data achieve the required quality. The scanning parameters mainly include the scanning device, scanning angular resolution, and scanning location.
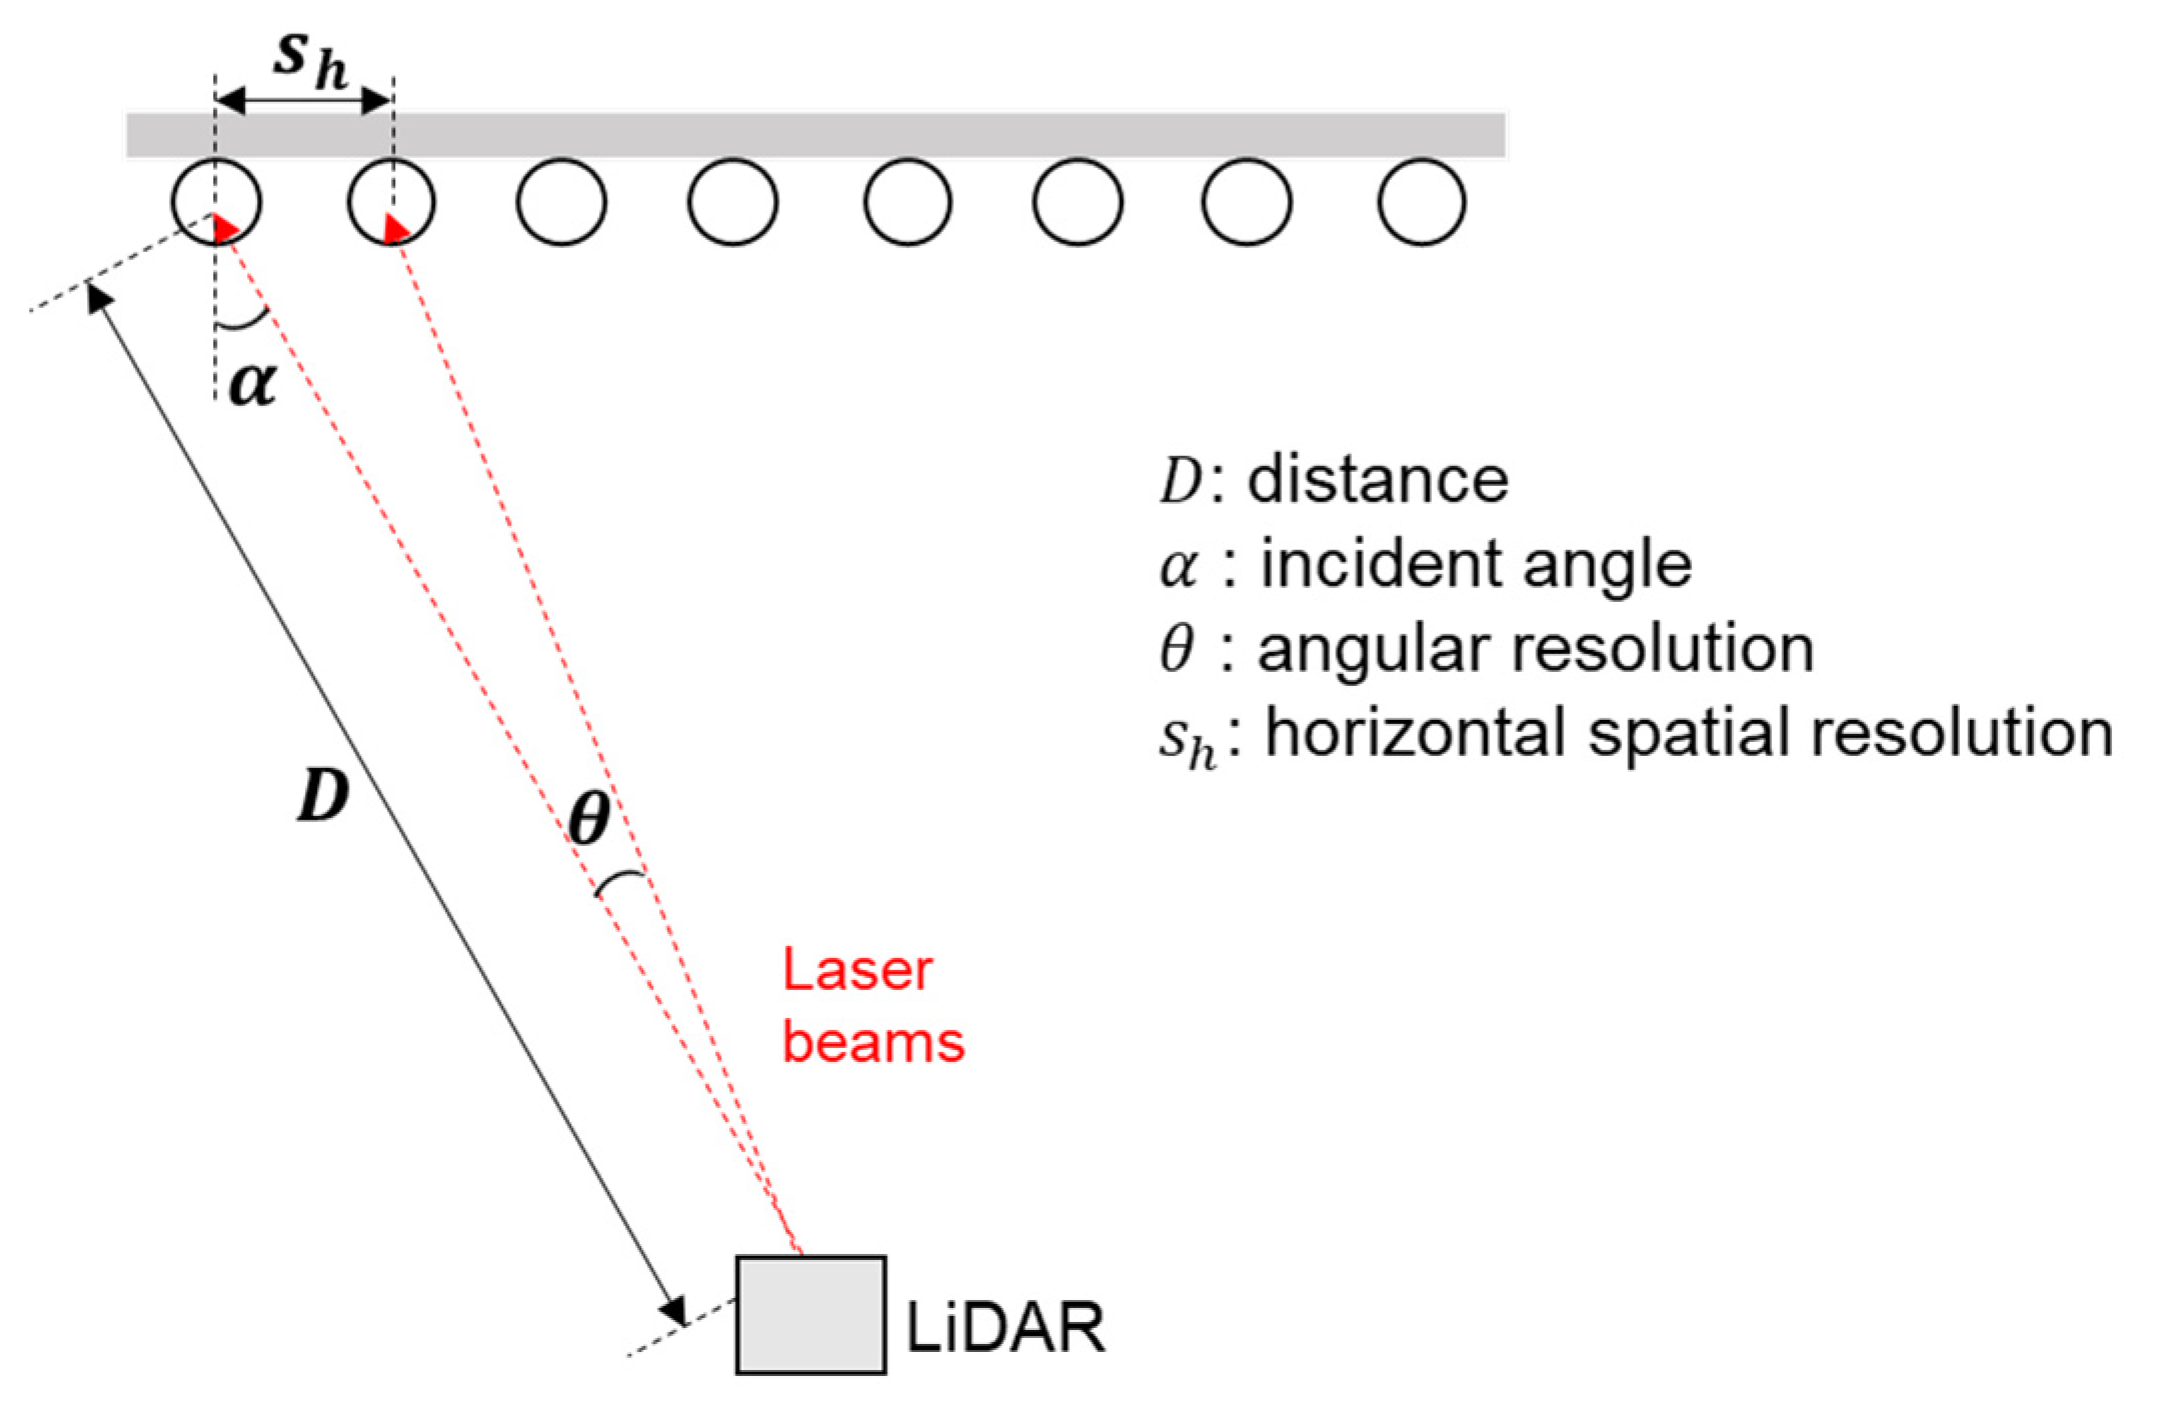
The scanned data accuracy is determined by the scanning device and scanning location. Different LiDAR systems have different ranging accuracy depending on the working principle and hardware performance. For a specific LiDAR, the ranging accuracy also differs when the scanning locations are different. As shown in Figure 12, each scanning location can be described using the distance from the LiDAR to the target and the incident angle of the laser beam with respect to the target normal. When the distance and incident angle increase, a less amount of reflected laser beam from the target will be received by the LiDAR, thereby resulting in a lower ranging accuracy. Therefore, to guarantee a high scanned data accuracy, short distance and small incident angle are desired.
On the other hand, the spatial resolution of scanned data is determined by the scanning angular resolution and scanning location. As shown in Figure 12, a typical terrestrial LiDAR emits laser beams with an angle increment of which is known as angular resolution. As becomes larger, the spatial resolution increases. In addition, the spatial resolution is also affected by the scanning location including distance and incident angle . As shown in Figure 12, the horizontal spatial resolution of the scanned data can be estimated as:
Note that the horizontal spatial resolution is calculated using the horizontal incident angle . The vertical spatial resolution needs to be calculated with the corresponding vertical incident angle.
After determining the scanning parameters, the laser scanned data are obtained. If scanned data are collected at multiple stations, all the scans will be registered based on the sphere targets using the scanner’s data processing software (e.g., the FARO Scene).
4.2. Data Pre-Processing
4.2.1. Data Cleansing
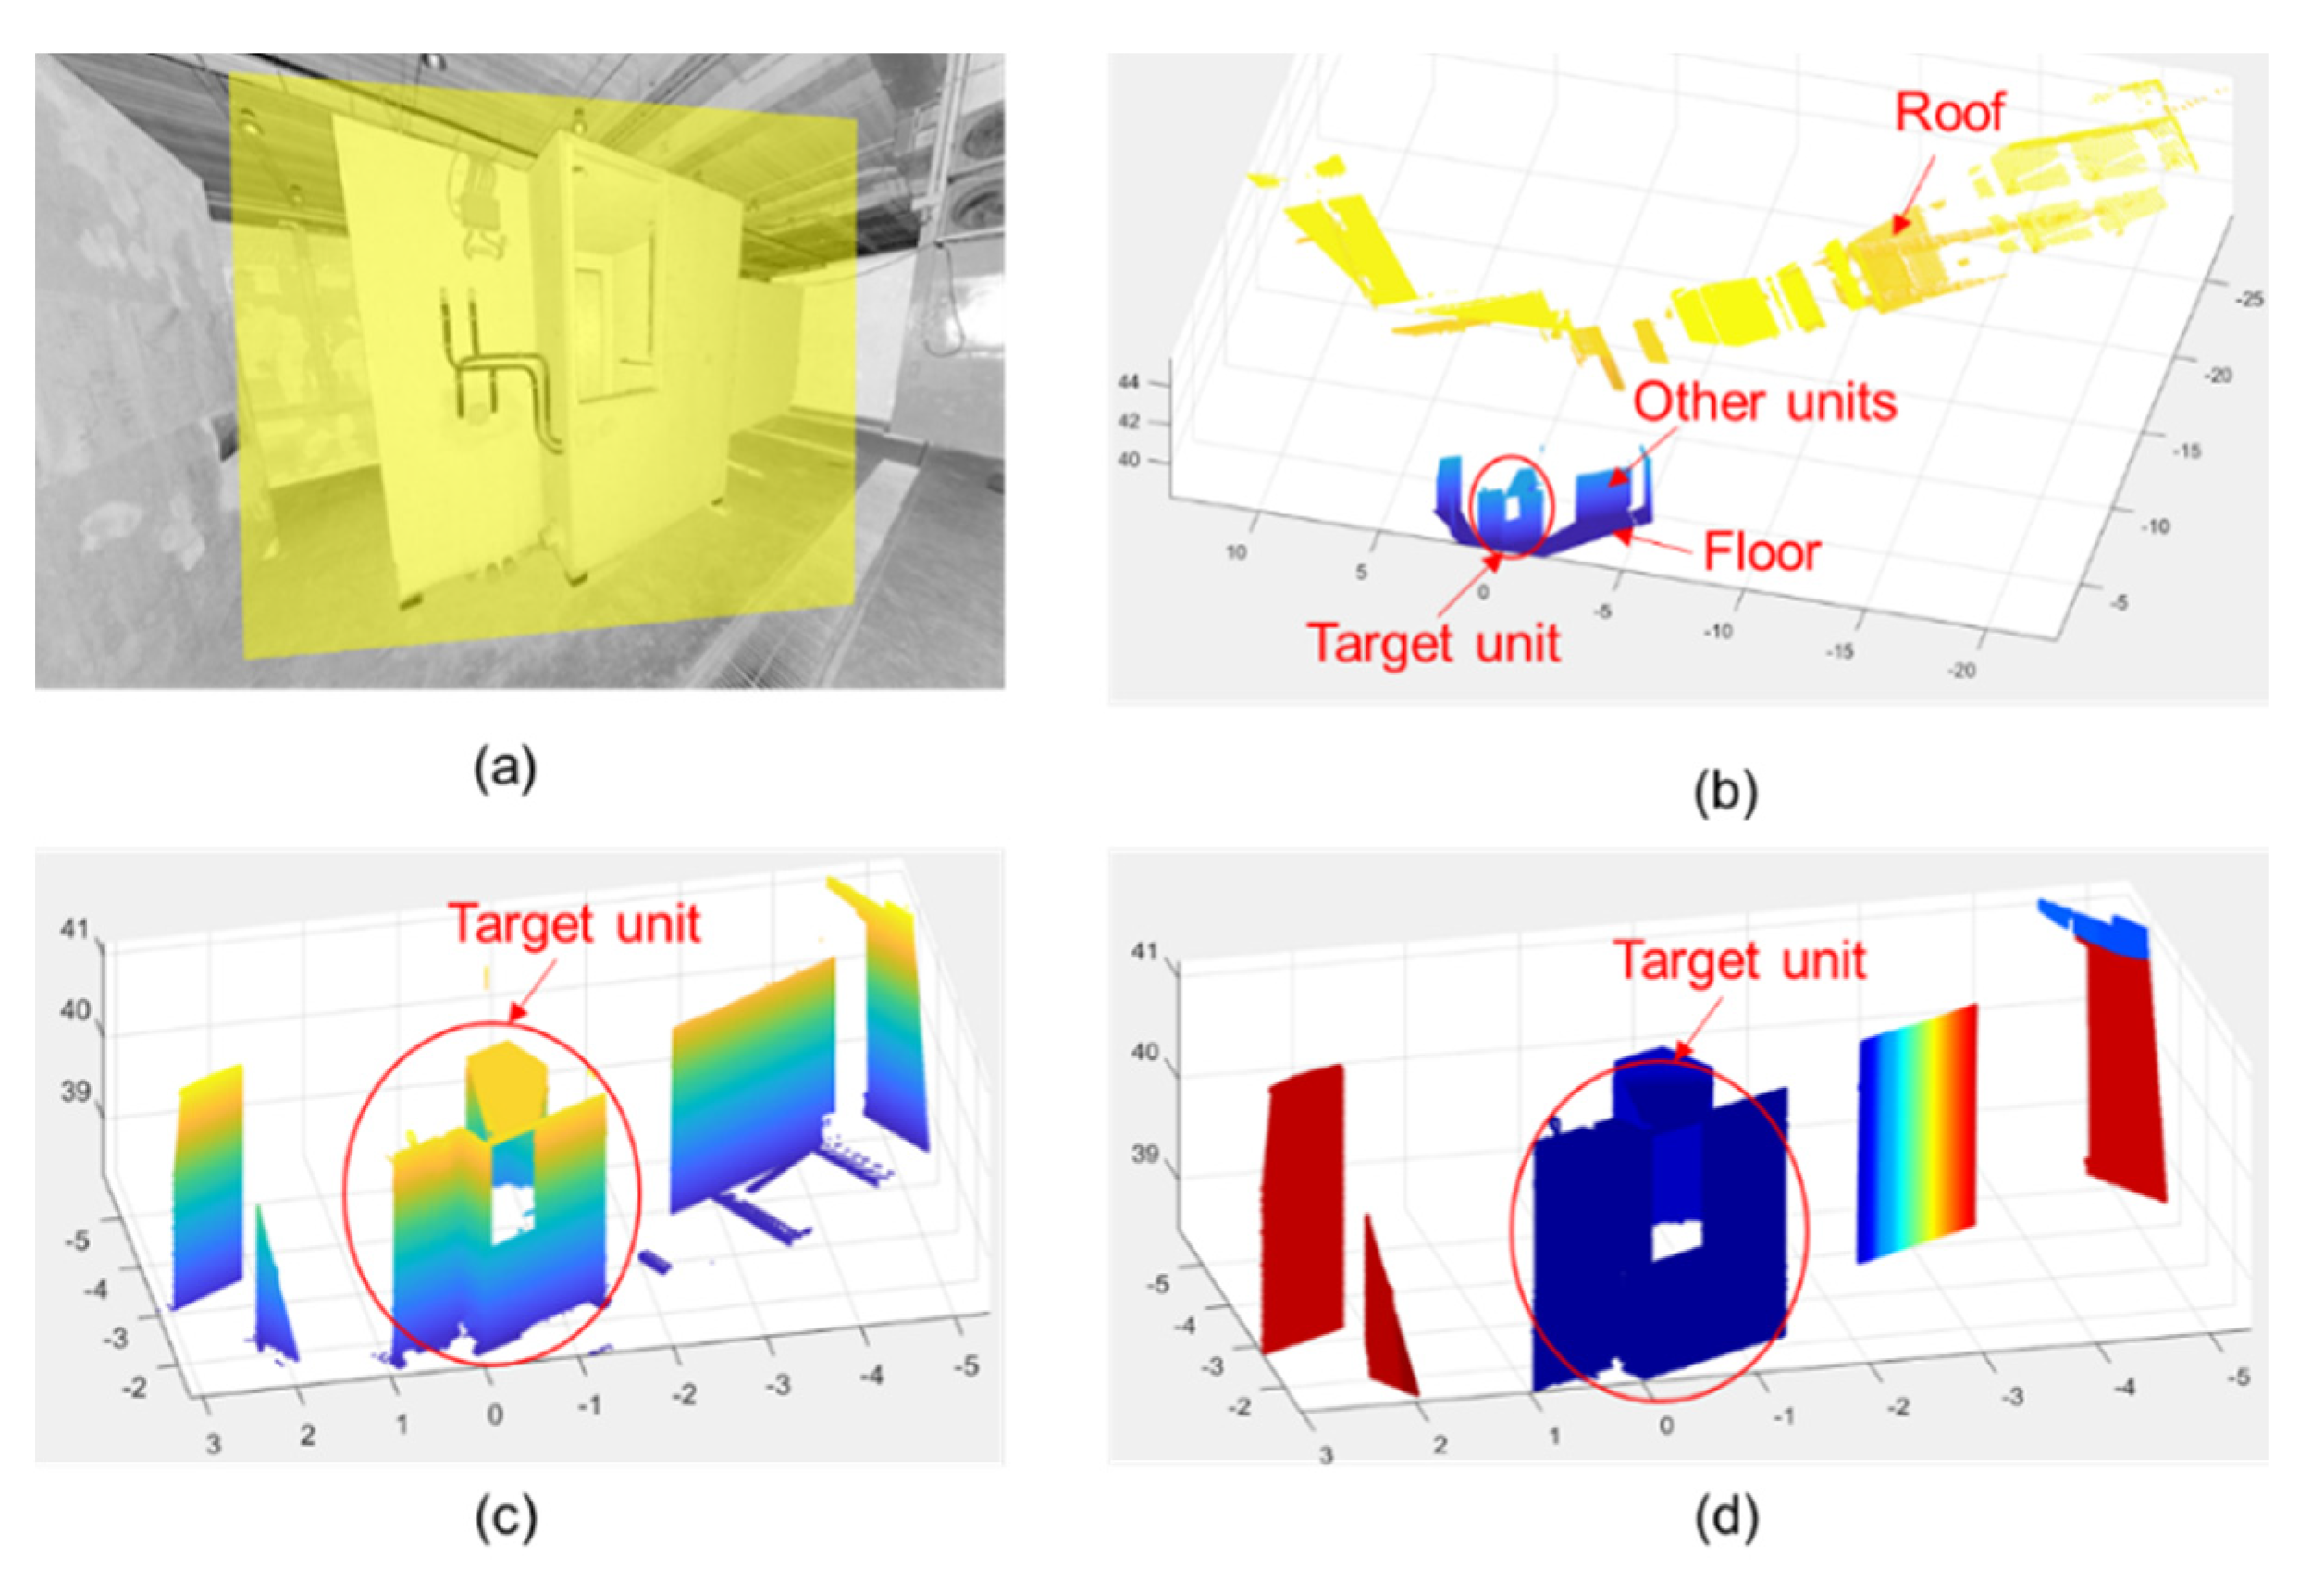
Raw scanned data obtained from a LiDAR always contain a type of noise data, known as mixed pixels. The mixed pixels are firstly removed using the scanner’s data processing software. The laser scanned data may also contain unwanted data from objects other than the target. For example, although only scanned data near the target object (a prefabricated unit) are selected as shown in Figure 13a, the selected data still contain unwanted data from the roof, floor, and other objects (Figure 13b). Hence, it is necessary to remove these useless data before further processing.
Because the floor and roof are planar objects, the random sampling consensus (RANSAC) [67] algorithm is adopted to find the two planes. The RANSAC algorithm repeatedly makes random sampling from the dataset and computes a plane based on sampling points. For each estimated plane, the number of inliers (i.e., points that are close enough to the plane) is calculated and the plane with the most inliers is selected eventually. By setting the normal vector of the plane to be vertical (i.e., normal vector [0, 0, 1]), two planes representing the floor and roof are recognized and then removed from the scanned data. The remaining scanned data represent the target prefabricated unit and other nearby units as shown in Figure 13c.
To differentiate the target prefabricated unit and other units, the region growing algorithm is adopted to segment the scanned data into multiple clusters. The region growing algorithm initiates a cluster from a seed point, and then iteratively examines the neighboring points of the seed point or newly added points. If the distance to the neighboring point is less than a threshold value, this neighboring point is added into the cluster. In this way, the cluster continuously grows until no more neighboring within a certain distance can be found. Here, the threshold value should be set to be larger than the required spatial resolution (2 mm) of the scanned data. As the scanned data representing the target unit have a spatial resolution of 2 mm, all the data for the target unit will be extracted as one cluster. On the other hand, because scan points from two different units are not connected, different prefabricated units become different clusters. As shown in Figure 13d, the scanned data are segmented into multiple clusters shown in different colors, and the cluster with the most scanned points is the target prefabricated unit.
4.2.2. Scan-BIM Registration
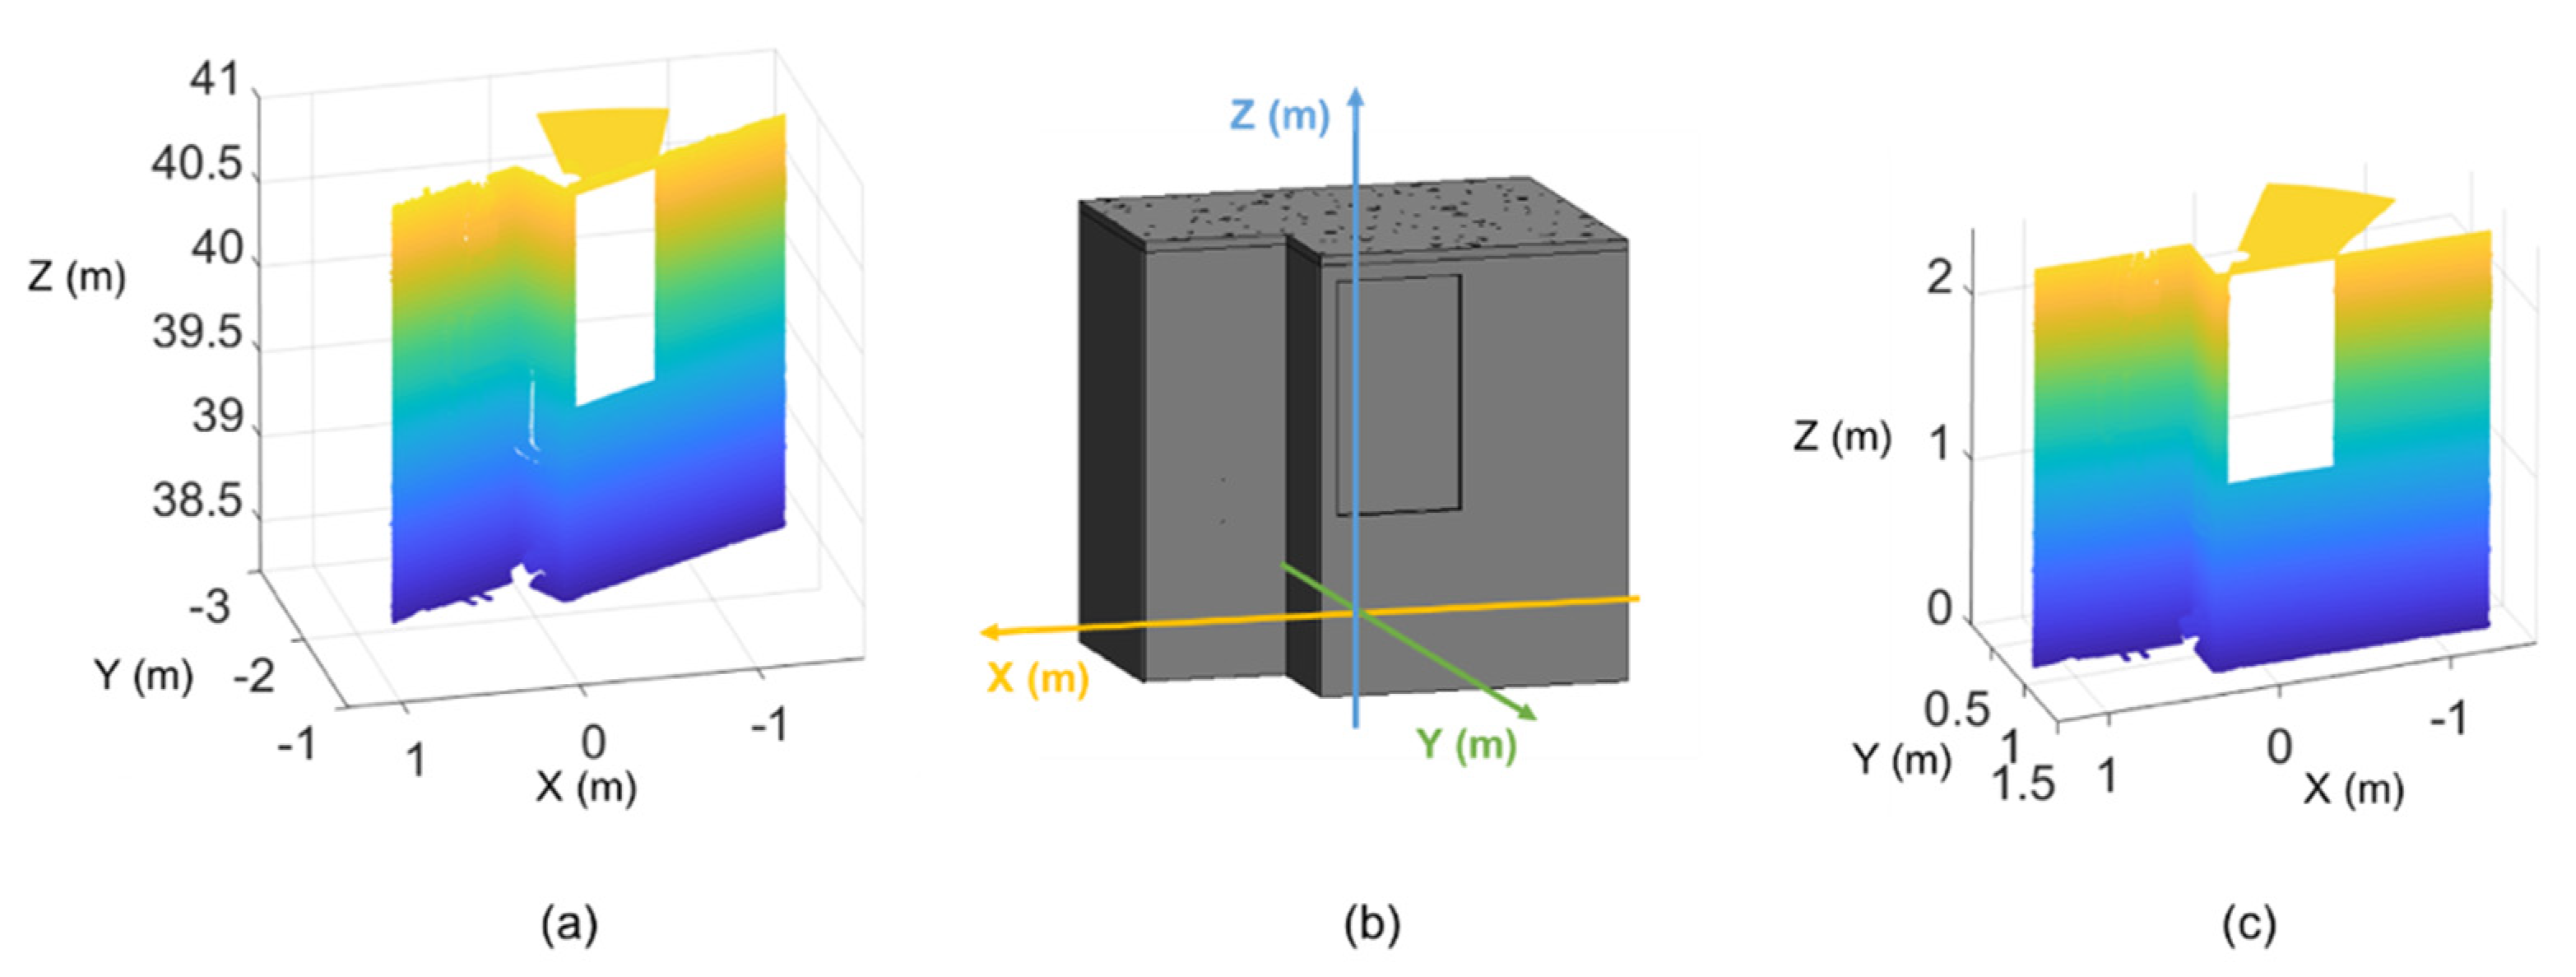
Once the scanned data representing the target unit are extracted in the data cleansing process, the scanned data are transformed to align with the as-designed BIM model of this unit. Originally, the scanned data are located in the LiDAR’s coordinate system (Figure 14a), which may be far away from the location of the as-designed BIM in a user-defined coordinate system (Figure 14b). The process of aligning scanned data with BIM is known as scan-BIM registration. Aligned scanned data will make it much easier to recognize building elements (e.g., wall panels, openings, MEP elements) from scanned data because the location of each element can be inferred from the BIM model.
The scan-BIM registration is conducted based on common planes between scan and BIM. As planes are the mostly common shapes for a prefabricated unit, planar surfaces are detected from scanned data using the RANSAC algorithm. Here, only planar surfaces with relatively large areas are extracted because these surfaces can be accurately estimated with large amount of points. These large-area surfaces are mainly from wall panels of a prefabricated unit. On the other hand, exterior surfaces of wall panels are also extracted from the as-designed BIM. Denote the set of planar surfaces from scanned data as and the set of planar surfaces from BIM as . Note that the number of planes in can be smaller than the number of planes in because only a part of the prefabricated unit is scanned.
Next, the correspondence between two sets of planar surfaces needs to be extracted. For each planar surface, the normal direction and center of mass are extracted. For a surface in , the normal direction is obtained as the normal of the least squares fitted plane of all scan points on the surface, and the center of mass is obtained as the averaged location of all scan points on the surface. For a surface in , the surface is transformed to a simulated scanned dataset by taking uniform sampling on the surface, and the normal direction and center of mass are obtained with the same method as above. Then, the likelihood of correspondence between each surface in and each surface in is examined. Assuming that in set and in set represent the same surface, the coordinate transformation matrix for the scanned data is calculated such that and share the same normal direction and center of mass. After transformation of the scanned data, the shortest distance from each scan point to the as-designed BIM is calculated, and the root mean square of the shortest distance for all scan points is obtained and denoted as . After examining all the possible correspondences, the one with the smallest value is taken as the correct correspondence and the scanned data are transformed based on this correspondence to be aligned with the as-designed BIM. As shown in Figure 14c, the scanned data after coordinate transformation are aligned with the as-designed BIM in the user-defined coordinate system.
4.3. Structural Element Inspection
4.3.1. Extraction of As-Built Surfaces and Edges
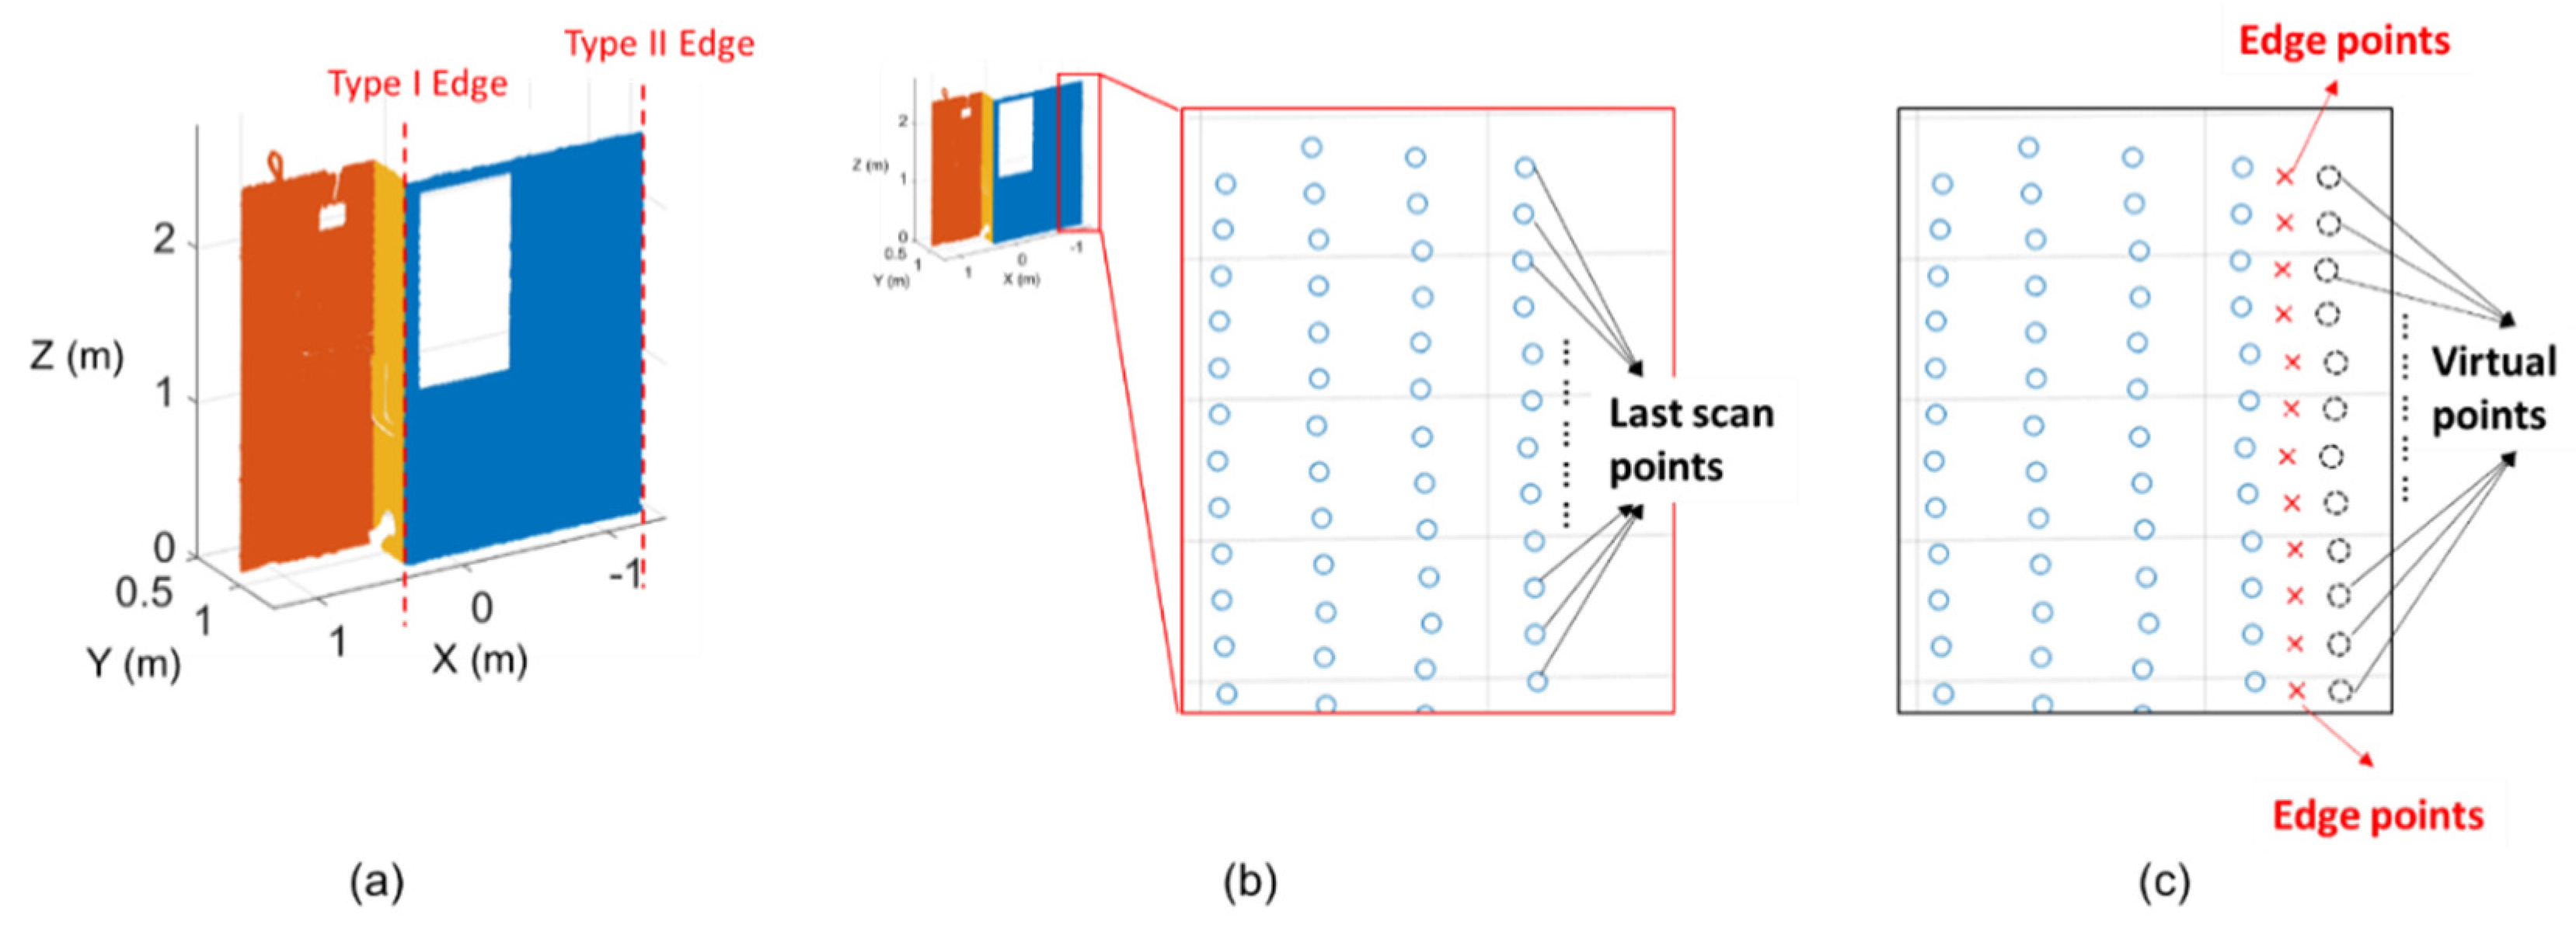
As discussed in Section 3, the inspection checklist of structural elements includes the dimensions of structural elements, dimensions and locations of openings, and surface quality including straightness, squareness, twist, and flatness. To inspect all the abovementioned items, the as-built surfaces and edges of structural elements need to be extracted from scanned data. For each as-built surface, its approximate location is known based on the location of the corresponding as-designed surface in BIM. Therefore, scan points close to the as-designed surface are extracted and a planar surface is extracted from these scan points using the RANSAC algorithm. For example, three planar surfaces are extracted from scanned data as shown in different colors in Figure 15a.
Each surface usually has four outer edges at four sides and might have additional edges if an opening exists on the surface. Each edge can be viewed as the intersection of two surfaces. If the two surfaces defining an edge are both scanned, this edge (known as type I edge) can be extracted as the intersection line of the two planar surfaces. However, if only one surface is scanned, this edge (known as type II edge) cannot be extracted as the intersection line and should be extracted using the following method. For each type II edge, scan points along the edge are extracted based on the location of the respective as-designed edge, as shown in Figure 15b. Then, the last scan point in each row or each column is identified for edge estimation. Usually, for a vertical edge, the last scan point in each row is identified, and for a horizontal edge, the last scan point in each column is identified. However, the actual edge is not exactly falling on the last scan points. Instead, the actual edge should fall between the last scan points and the points next to them, which are actually outside this surface. As shown in Figure 15c, one virtual point (shown as dashed points) is manually created in each row next to the last scan point by assuming that the spacing between two points is constant. It can be inferred that this virtual point must be outside the surface. Hence, the actual edge must be between the last scan point and this virtual point. Then, the middle points between each pair of last scan point and virtual point are obtained as edge points (red crossing in Figure 15c), and this edge is represented by these edge points to facilitate the calculation of inspection checklist. Due to the characteristics of type II edges, the estimation accuracies of these edges are affected by scanning parameters such as the scanning resolution, laser spot size, and laser beam divergence. A higher scanning resolution, smaller laser spot size, and smaller laser beam divergence usually result in more accurate edge estimations.
4.3.2. Checklist Calculation
In the extraction of as-built surfaces and edges, each surface is represented as scan points falling on it (denoted as surface points) and each edge is represented as a set of edge points. In this step, all the items in the inspection checklist are calculated based on these surface points and edge points.
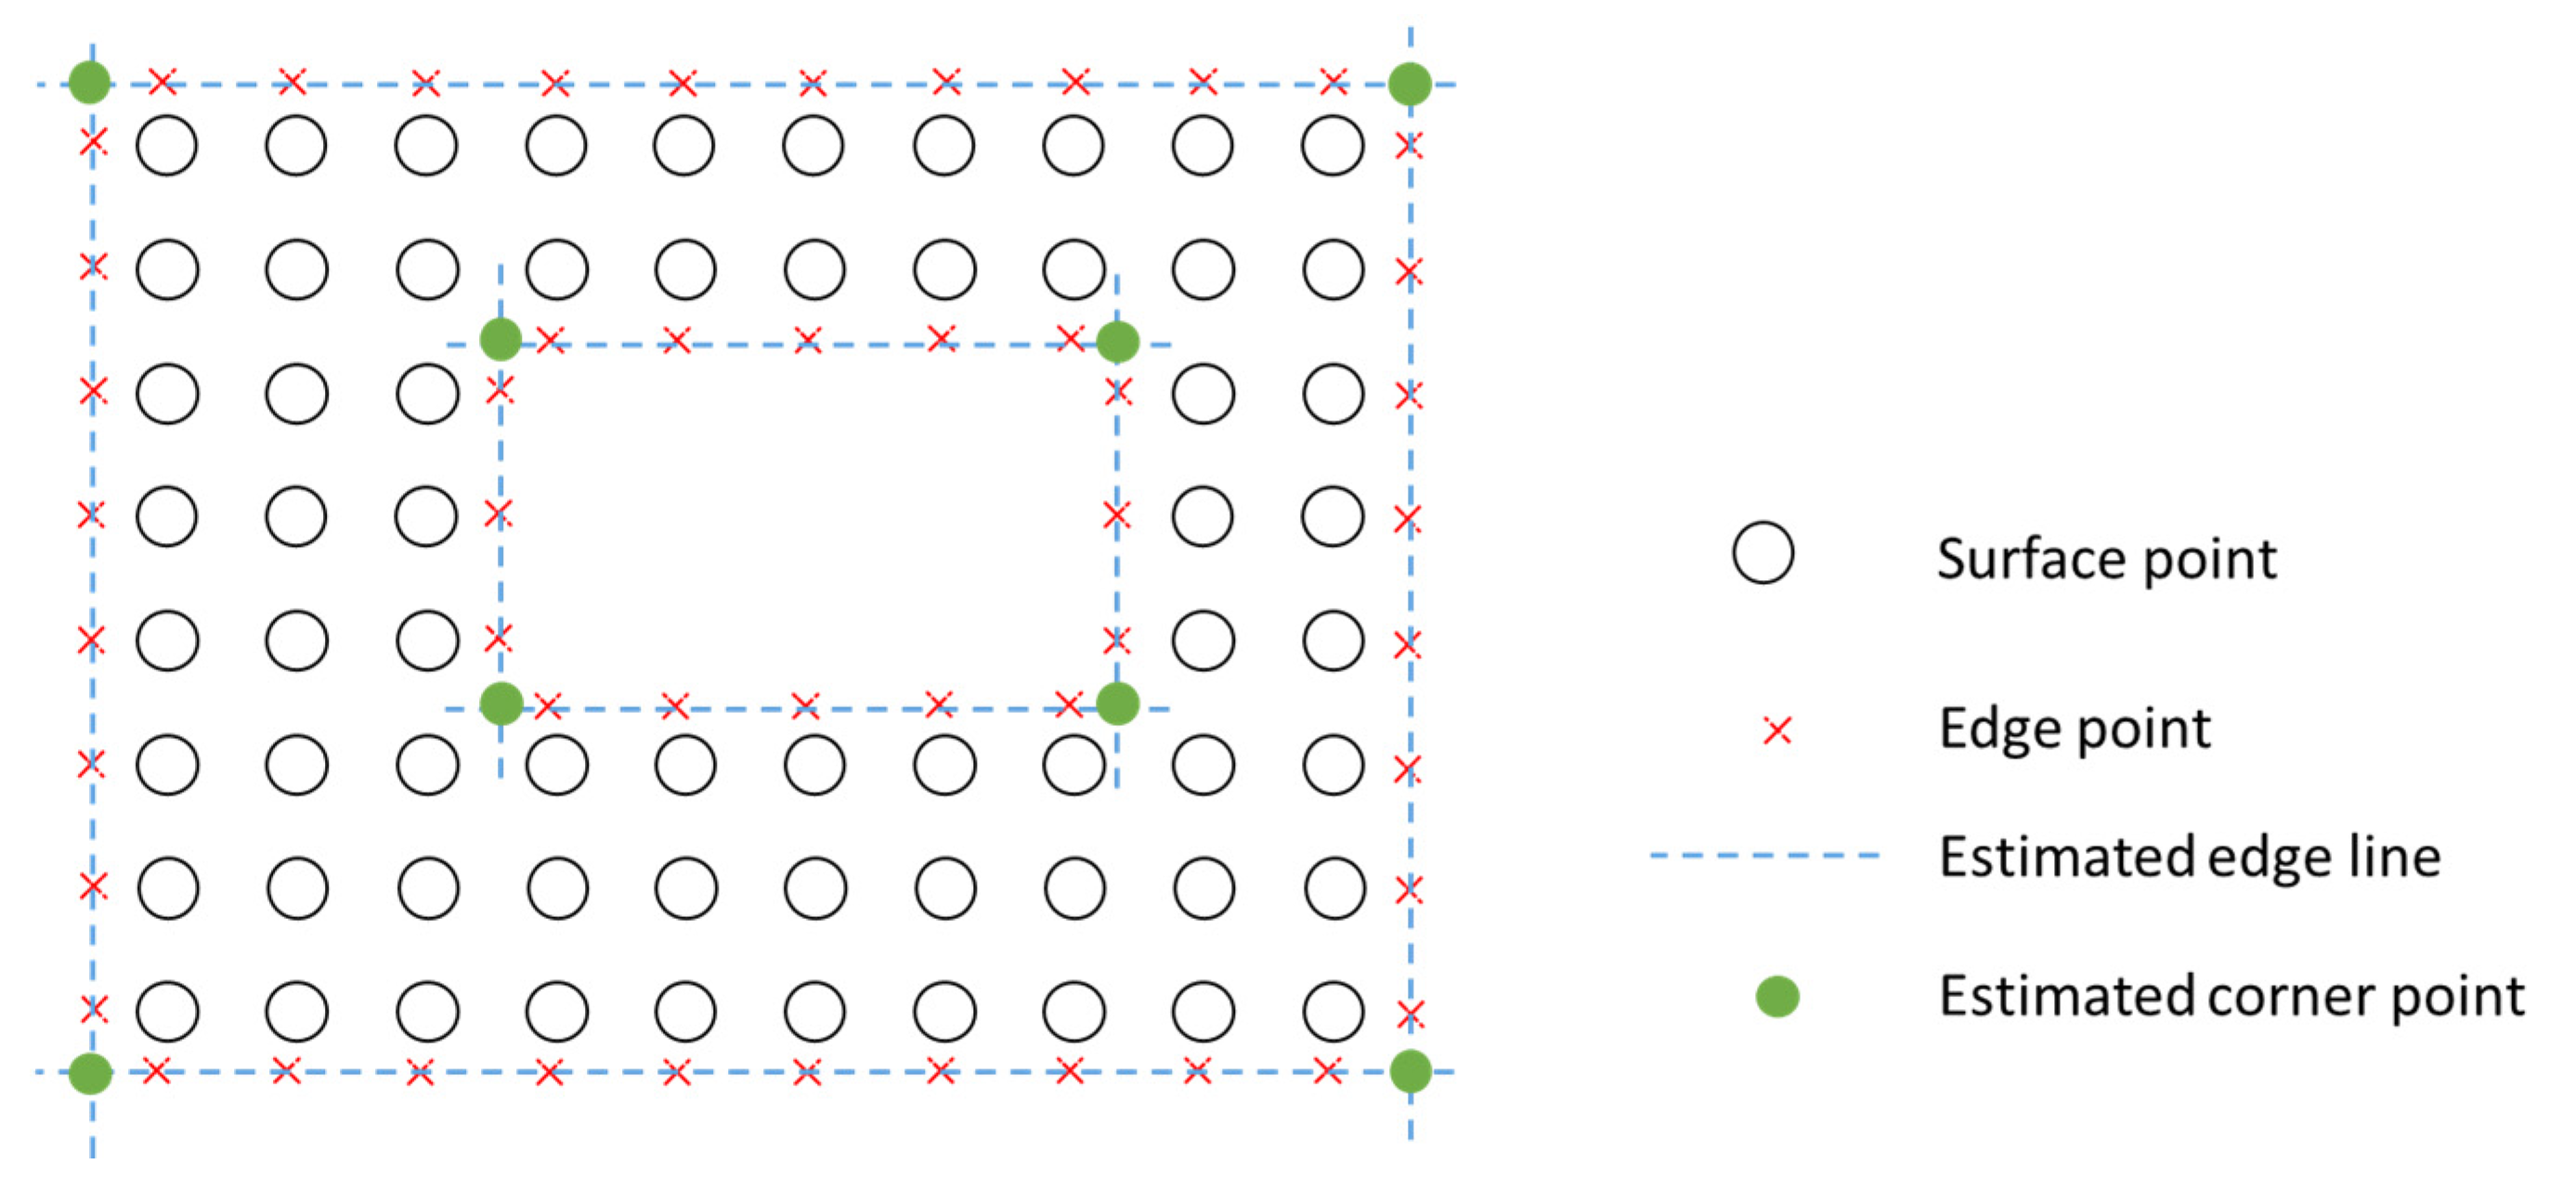
For the dimensions of elements and the dimensions and locations of openings, the surface points are projected onto the least squares fitted plane of all surface points as shown in Figure 16. Then, each edge line is estimated as the least squares fitted line of the respective edge points, shown as dashed lines in Figure 16. Next, the corner points of each element and each opening are extracted as the intersection points of edge lines, shown as filled solid points in Figure 16. Then, the dimensions of elements or openings are calculated as the distances between corner points, and the locations of openings are calculated as the perpendicular distances from corner points of openings to the edge lines of the element.
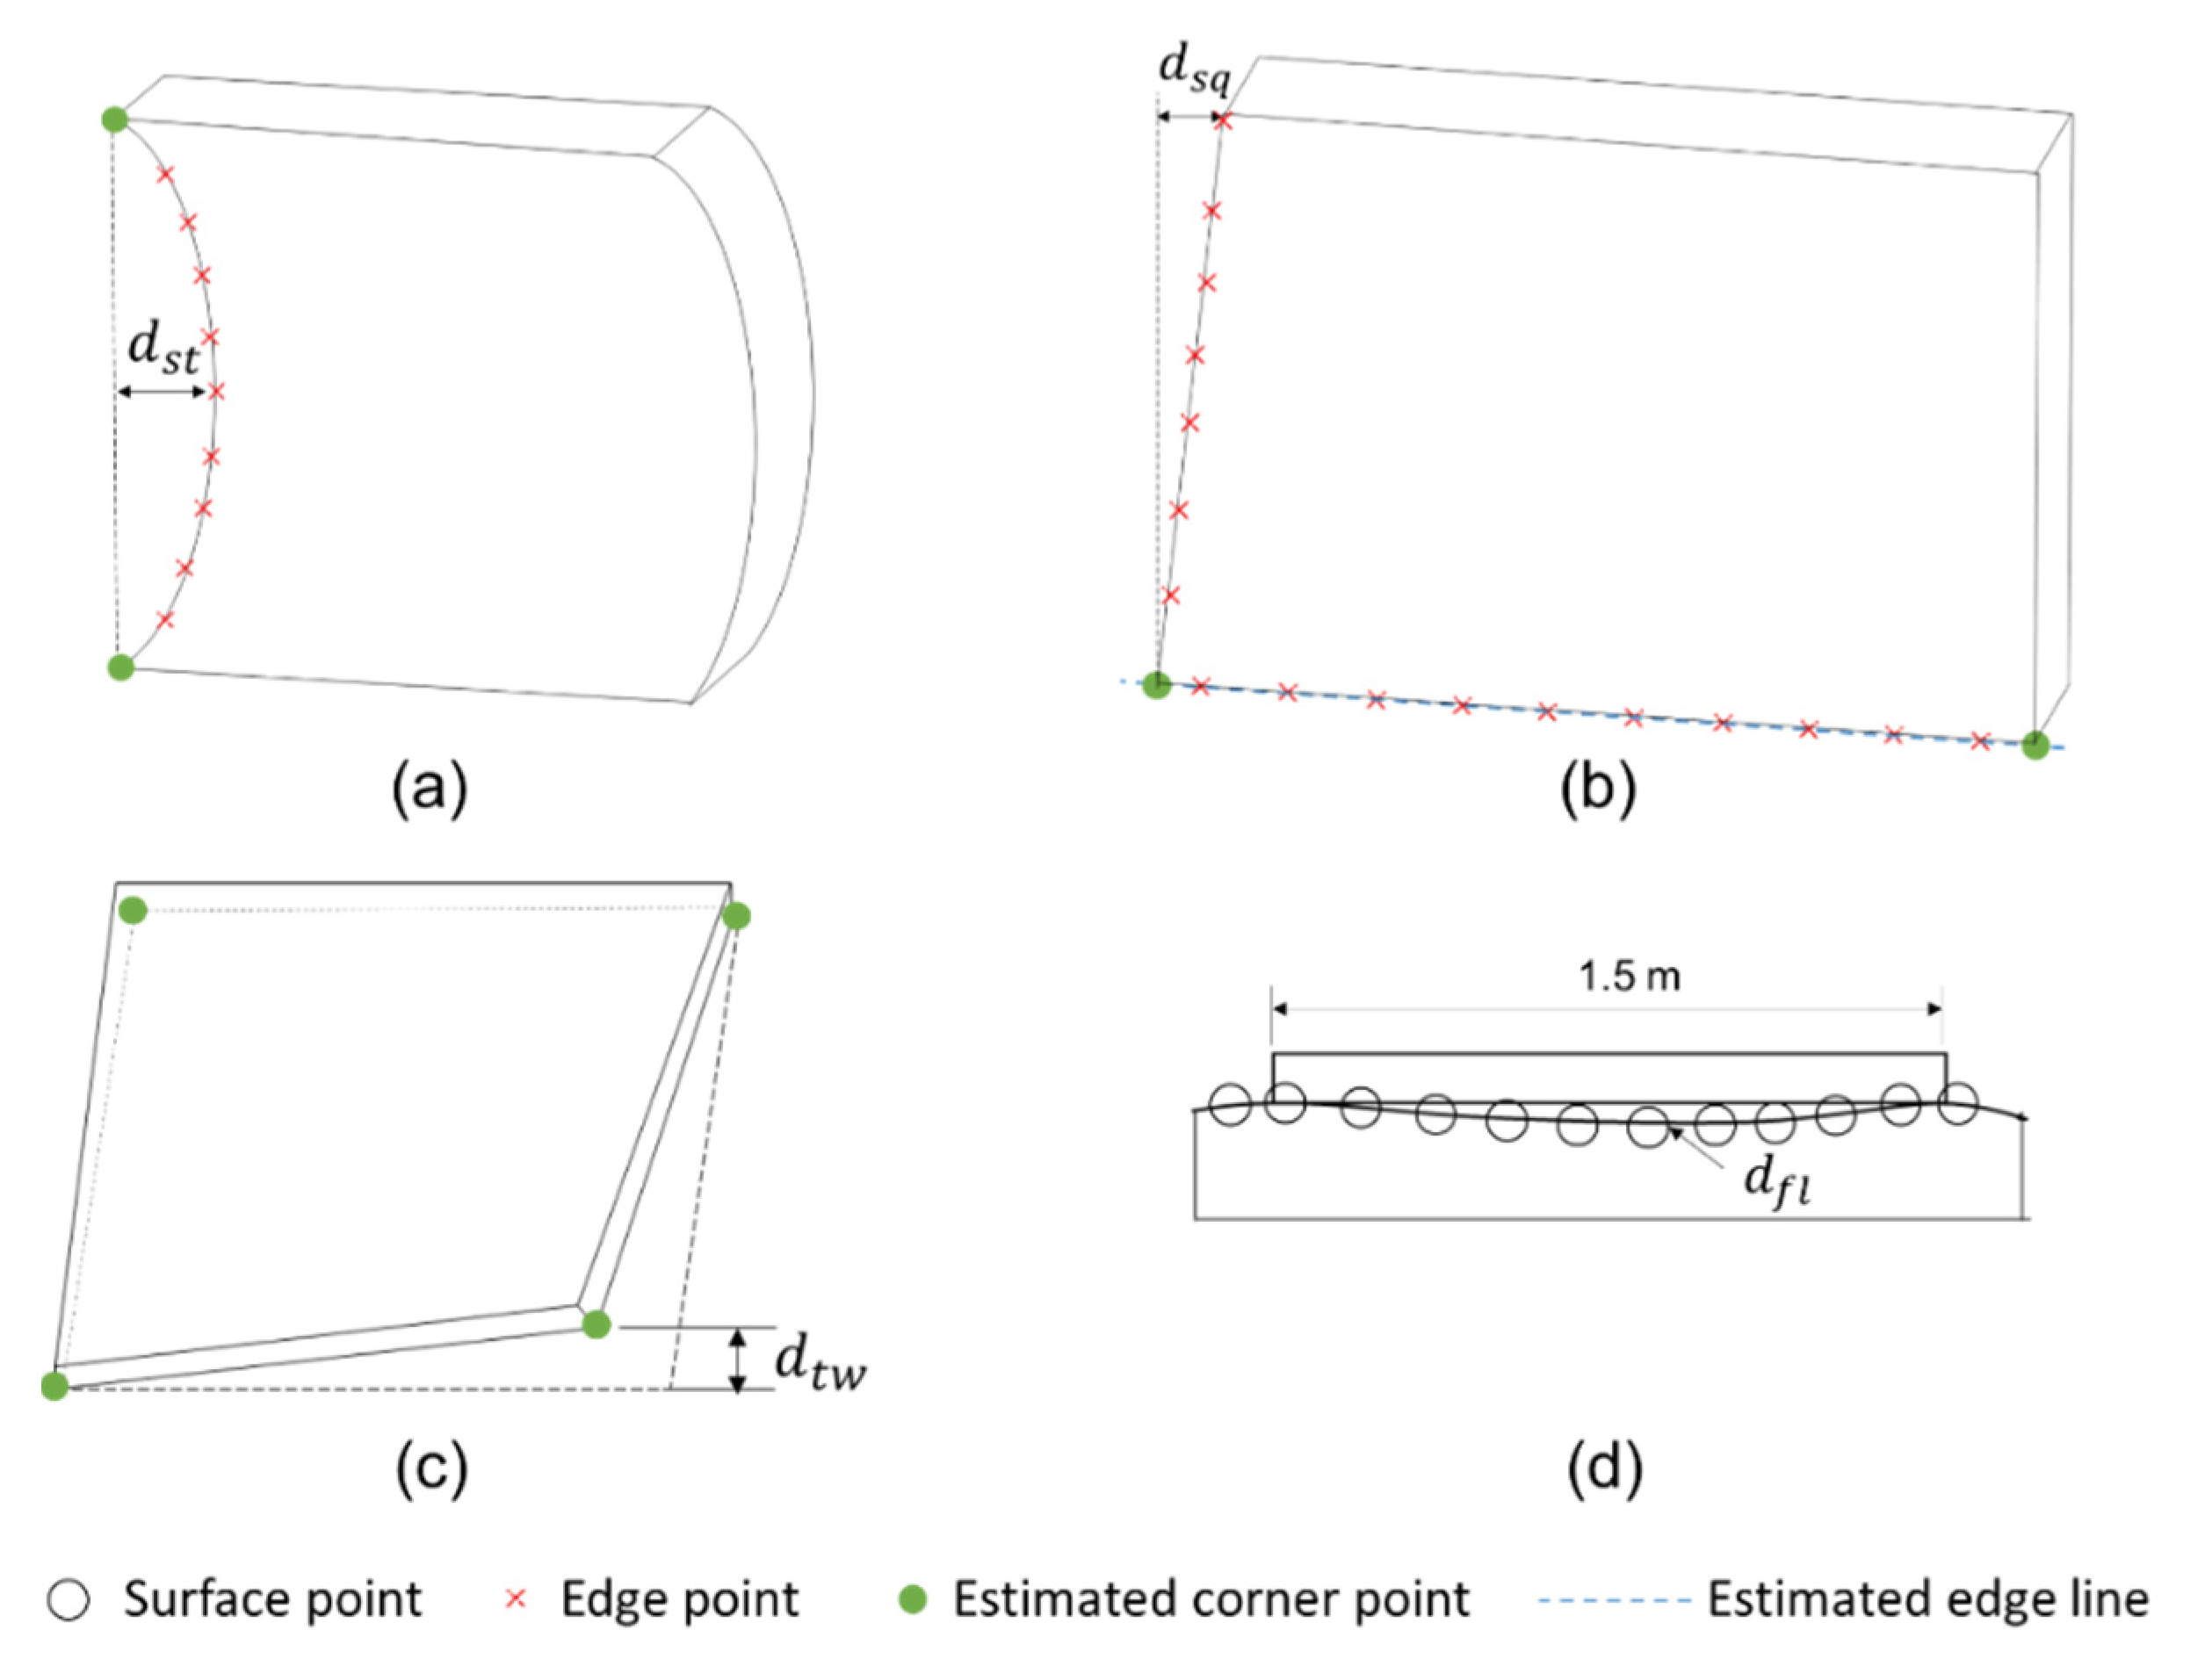
Furthermore, surface qualities including straightness, squareness, twist, and flatness are also calculated based on surface points and edge points. For straightness, the distances from all the edge points along an edge to the line connecting the two corner points are calculated as shown in Figure 17a. Then, the maximum distance is obtained as and compared to the tolerance value. For squareness, taking the estimated edge line of the longer side as the base line, the maximum deviation of the shorter side is calculated based on the edge points along the shorter side as shown in Figure 17b. For twist, the deviation from each estimated corner point to the plane containing the other three corner points is calculated as shown in Figure 17c. Last, for flatness, a virtual 1.5 m straight edge is placed on the inspected surface to measure the deviation as shown in Figure 17d. The deviation is measured as the maximum gap between the virtual straight edge and the surface points under this straight edge. The straight edge is repeatedly placed at random locations for many times to provide an overall evaluation of surface flatness.
4.4. MEP Element Inspection
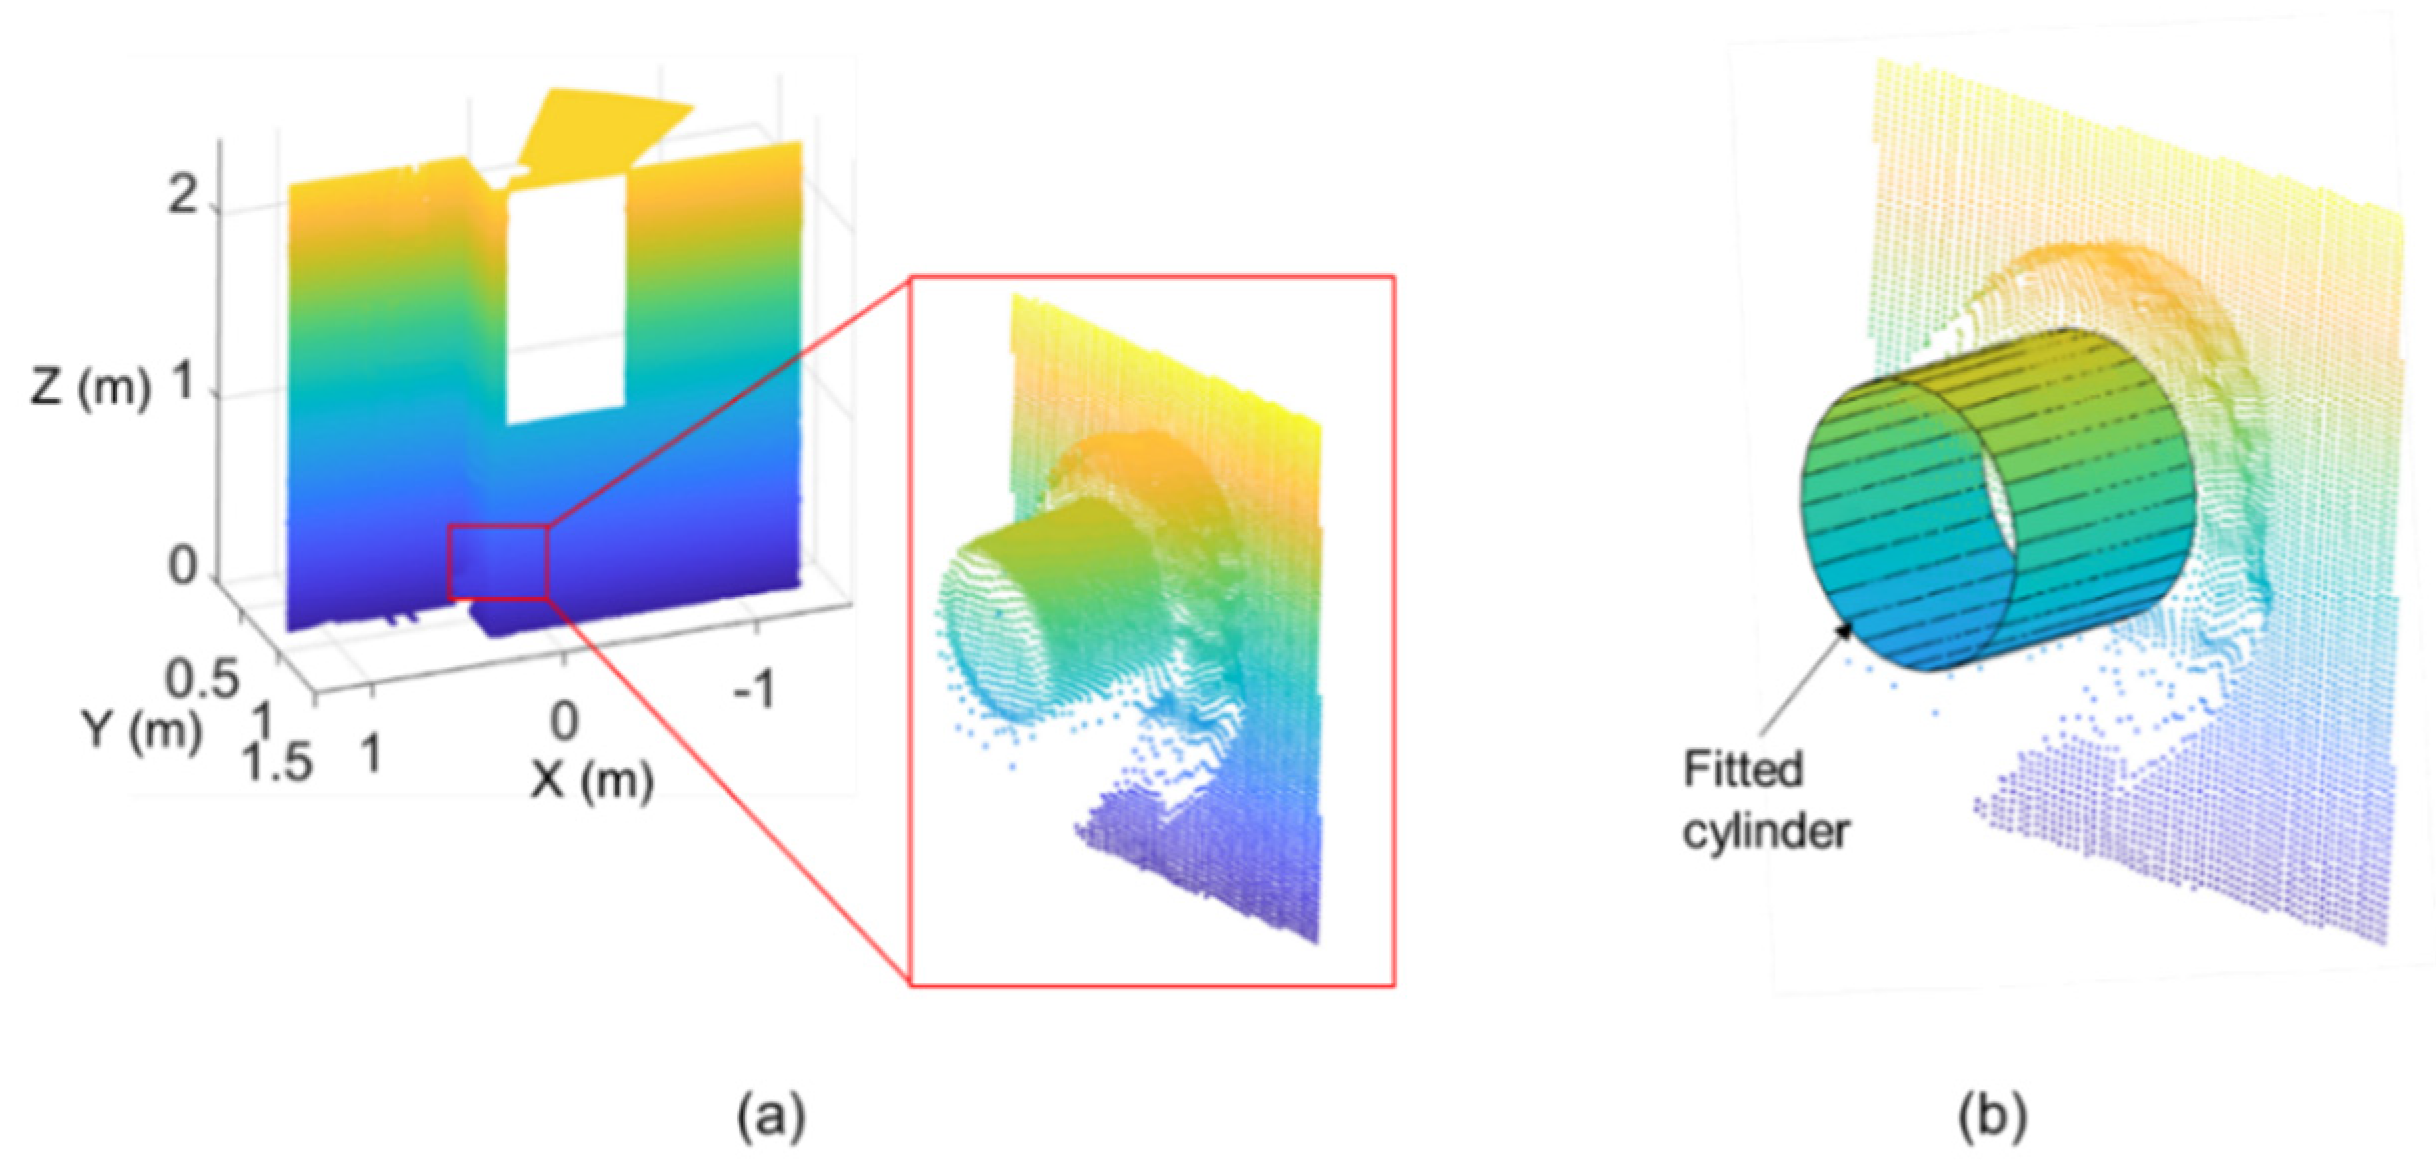
For each cylinder pipe, the scanned data for the pipe were extracted based on the position of the corresponding as-designed BIM element as shown in Figure 18a. Then, the scanned data were fitted to a cylinder using the M-estimator Sample Consensus (MSAC) algorithm [68] as shown in Figure 18b. The MSAC algorithm finds the best fitting cylinder by repeatedly selecting random sample points from the original dataset and fitting the sample points to a cylinder. Once a cylinder is fitted to the scanned data, the diameter of the fitted cylinder represents the as-built dimensions of the pipe. On the other hand, the as-built position of the pipe is calculated as the distances from the axis of the cylinder to the edge lines of the structural element.
4.5. Inspection Data Storage
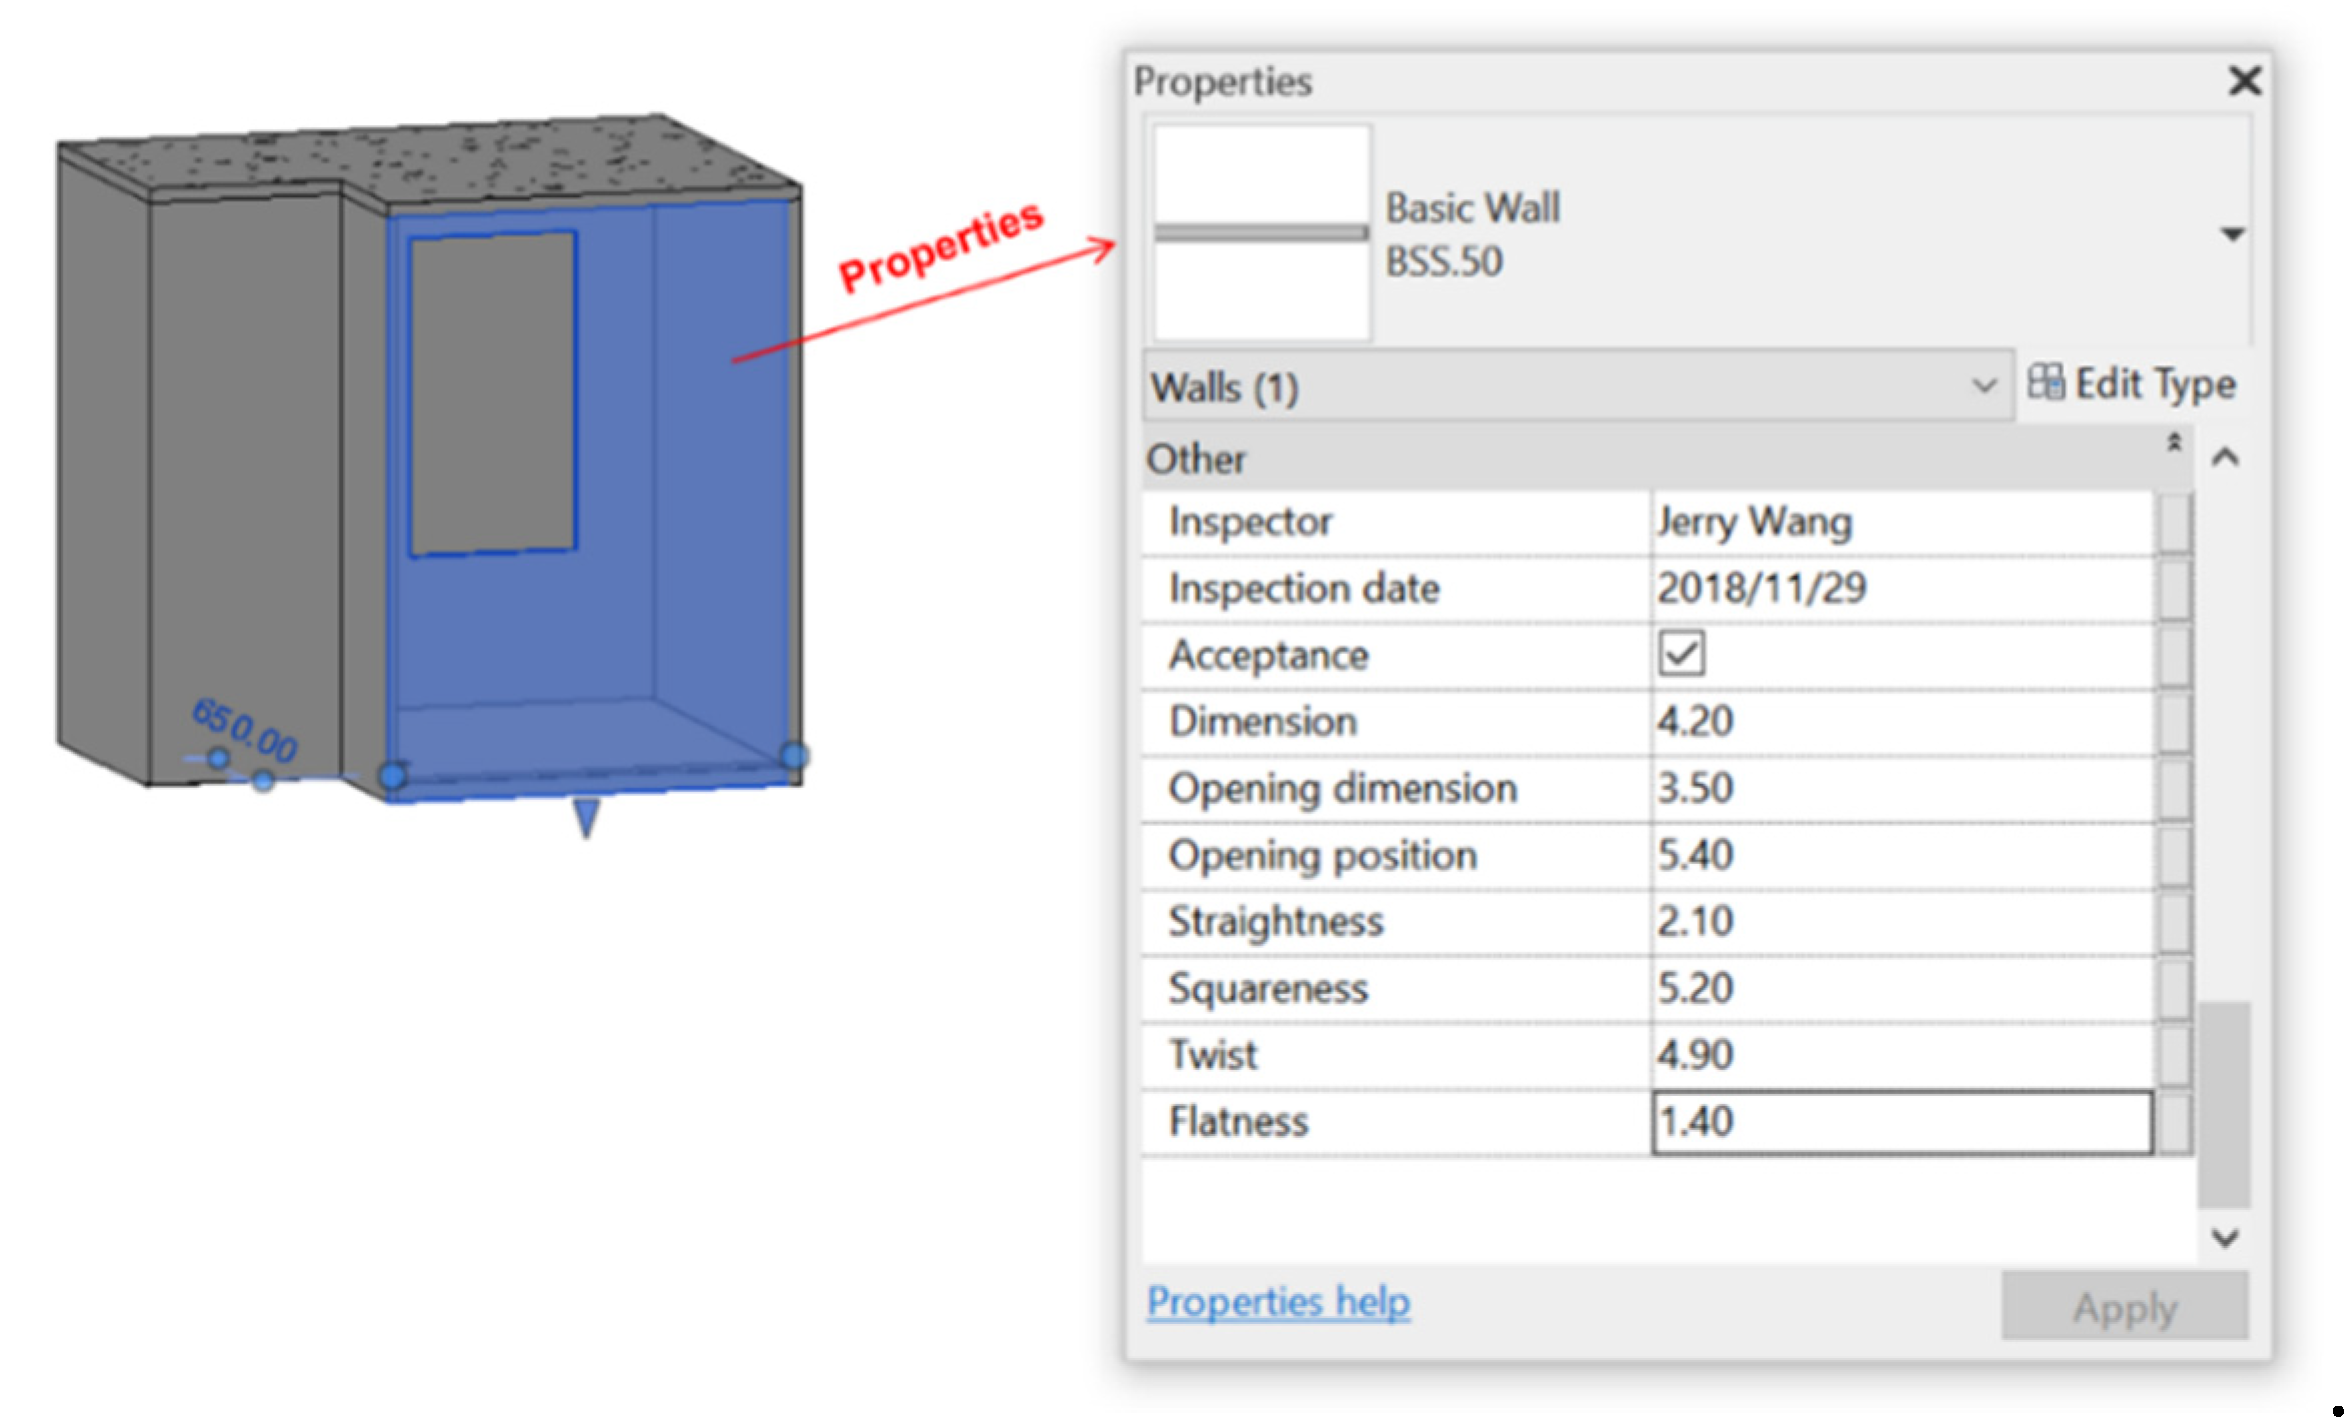
In order to store inspection-related information in BIM, customized properties were created for each element as summarized in Table 2. The properties were divided into three categories including general, structural, and MEP. The first category (i.e., general properties) were applied to all elements, while the latter two categories were applied to only structural and MEP elements, respectively. General properties include the inspector and inspection date information, as well as the decision that whether the element is accepted or not. Structural properties included the checklist items for structural elements including the dimension, opening dimension, opening position, straightness, squareness, twist, and flatness. In addition, MEP properties included the checklist items for MEP elements including the dimension and position. All the abovementioned properties were added in the BIM platform. Once the quality inspection based on laser scanned data was completed, the property values were filled and stored in BIM via a BIM platform plug-in. For example, the properties and their respective values of a structural element are shown in Figure 19.
5. Validation Experiments
5.1. Experimental Process
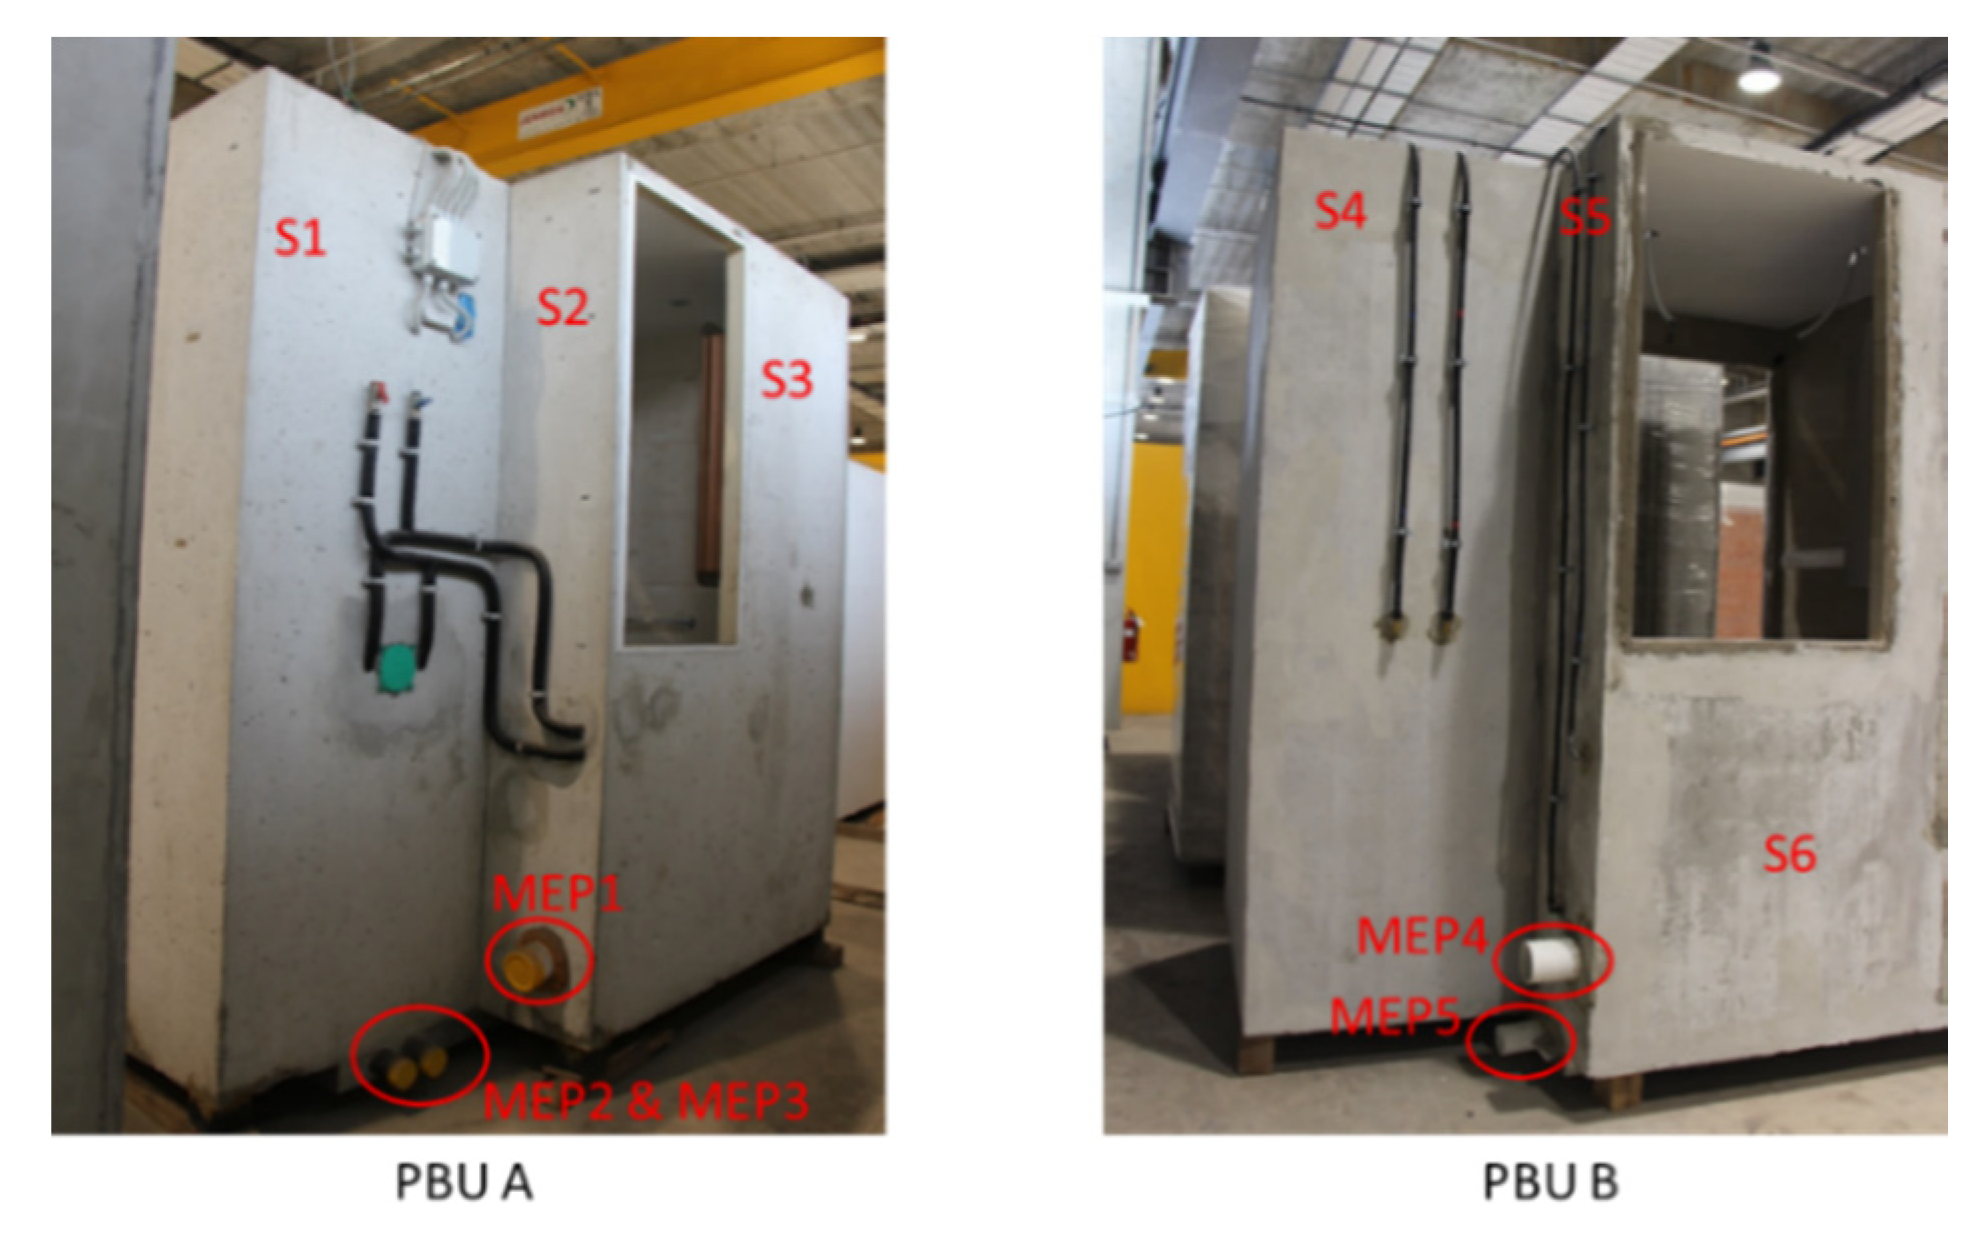
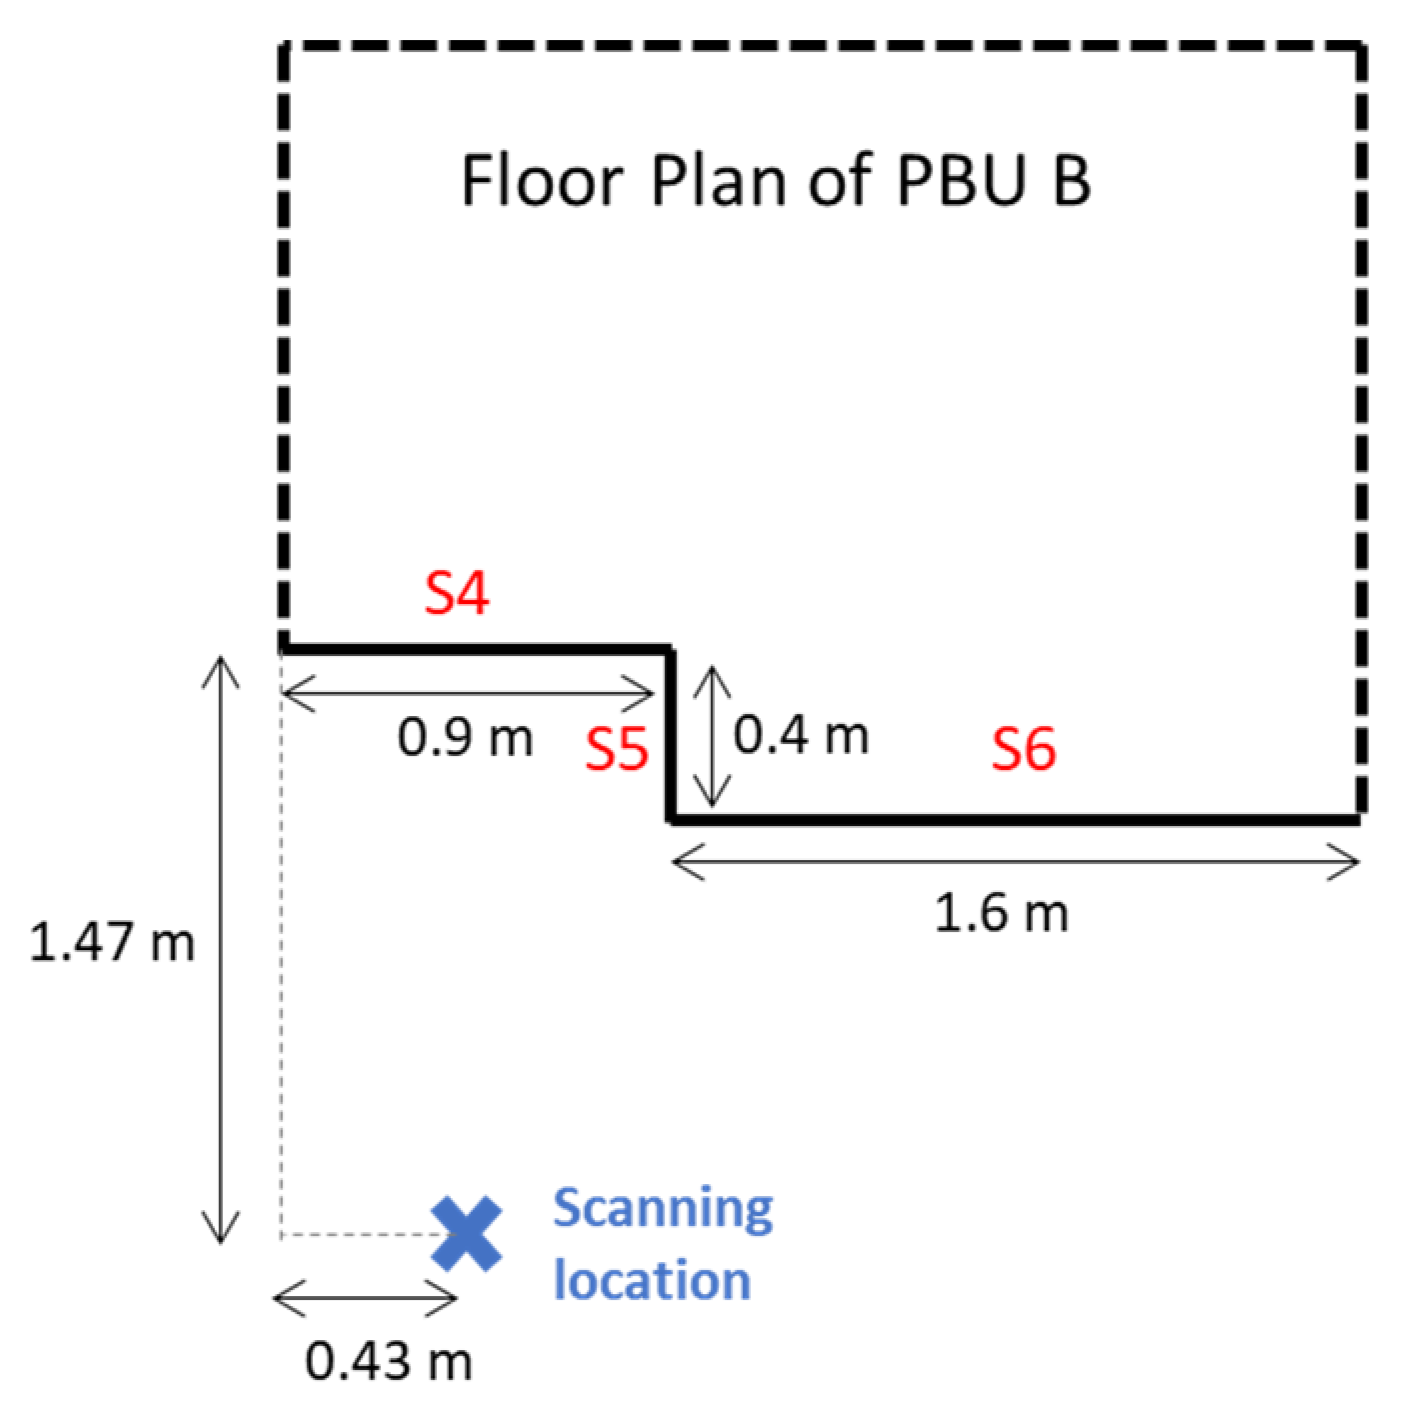
This study conducted experimental validation on two PBUs manufactured in a Singapore prefabrication factory as shown in Figure 20. The overall size of each PBU was approximately 2.5 m (length) × 1.8 m (width) × 2.4 m (height). The PBUs were manufactured using precast concrete for walls and floors. In addition, each PBU had a few cylindrical MEP elements (pipes) made of PVC. For PBU A, the quality inspection scope was the three structural wall panels (shown as S1 to S3) and the three MEP elements on them (shown as MEP1 to 3). Similarly, for PBU B, the scope was the three structural wall panels (shown as S4 to S6) and the two MEP elements on them (shown as MEP4 to 5). Among the structural wall panels, S3 and S6 had an opening on each of them. As the experimental process was similar for both PBUs, this section presents the experimental process of PBU B only.
A FARO Focus S70 terrestrial laser scanner was used to collect scanned data. This scanner had a measurement range from 0.6 m to 70 m, and a ranging RMSE of ±1 mm at 25 m [69]. Therefore, this scanner could fulfill the ±2 mm accuracy requirement for PBU inspection. Next, the scanner locations and angular resolutions were determined to achieve a spatial resolution of 2 mm in both directions. The angular resolution could only be selected from a series of options including 0.009°, 0.018°, 0.036°, 0.045°, 0.072°, 0.09°, 0.144°, 0.18°, and 0.288°. Before selecting an angular resolution, the optimal scanning locations were selected. As the PBU had a relatively small size, one single scan may be able to cover all the three surfaces with enough spatial resolution. Therefore, the scanning scheme with only one scan was verified with simulations as follows. The height of scanner was set to 1.2 m which was equal to a half the height of the PBU. Regarding the scanning location, the X–Y plane was divided by grids along the x and y-axes with a grid interval of 0.01 m. Then, each grid point was considered as a candidate scanning location and the coarsest spatial resolution s_c (i.e., the maximum spatial resolution s value) over all the three surfaces of the PBU resulted from this candidate scanning location was calculated. Then, among all the candidate scanning locations, the one providing the smallest s_c value was selected as the optimal scanning location. For PBU B, the optimal scanning location was shown in Figure 21, which could provide an s_c value of 5.07θ. To achieve the required spatial resolution of 2 mm, the angular resolution θ was set to 0.018°, which would result in scanned data with at least 1.6 mm spatial resolution over all the three surfaces (S4 to S6) of PBU B.
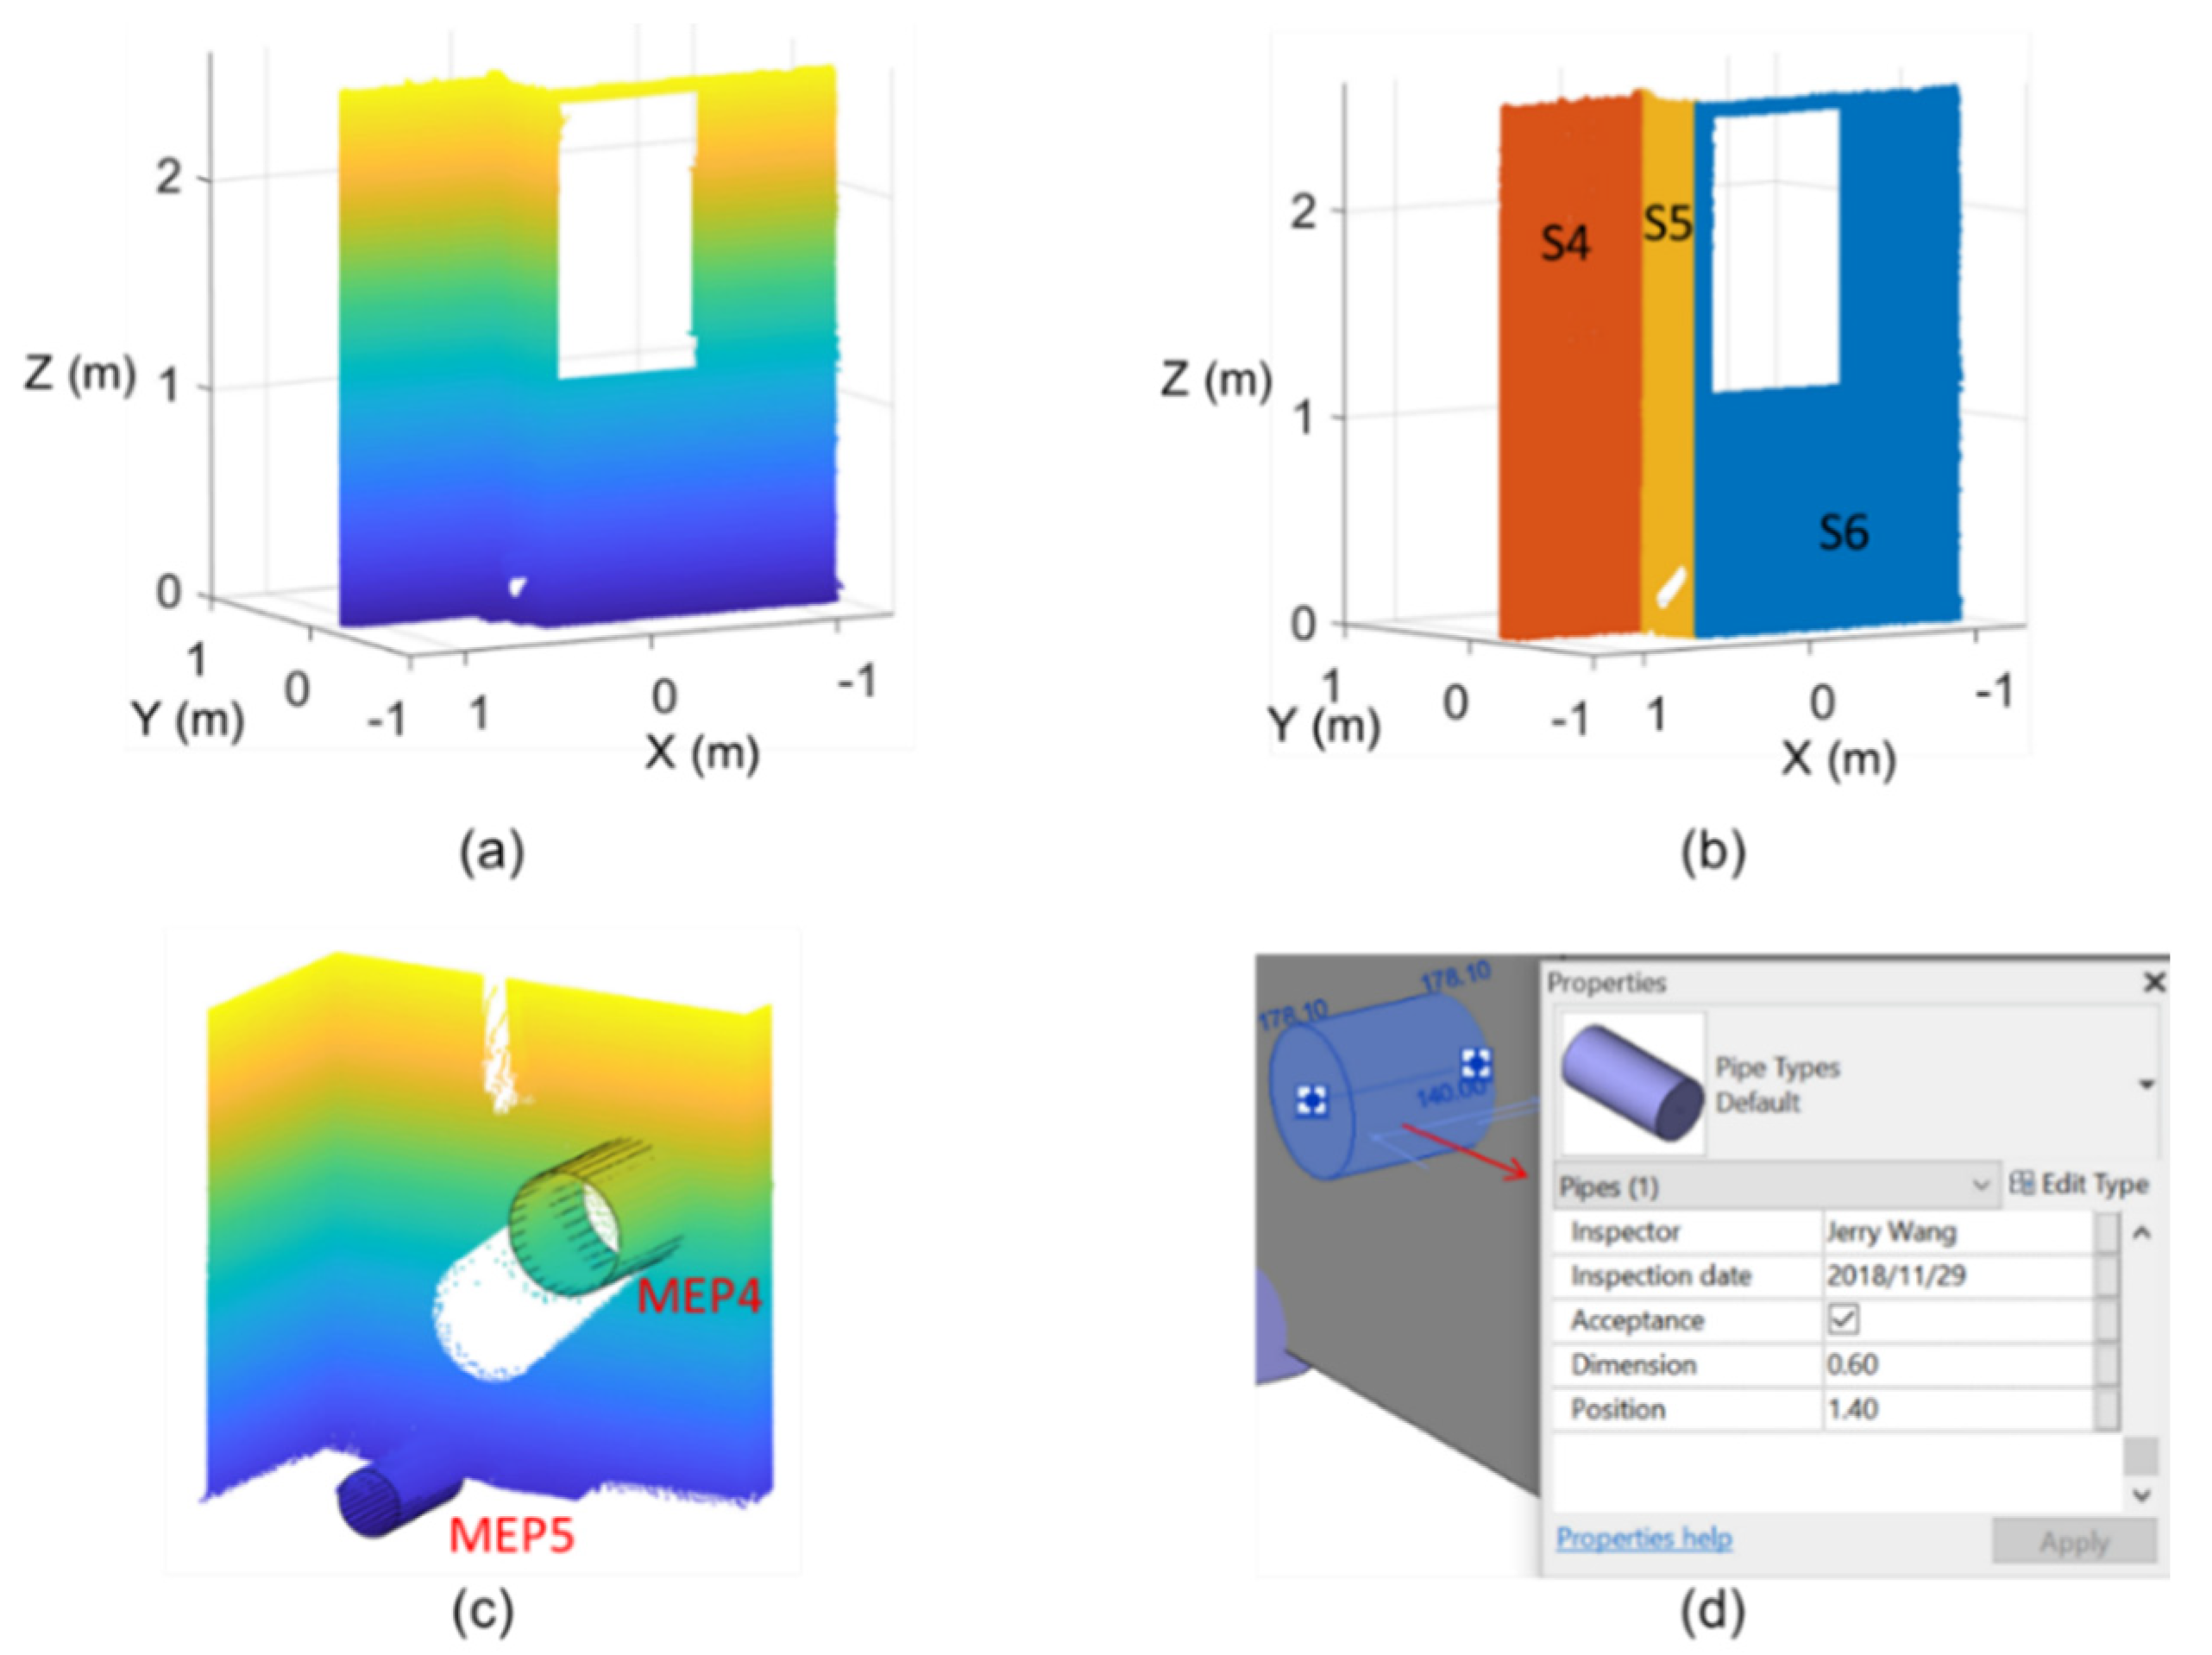
After data acquisition at the optimal scanning location, the scanned data were processed through data pre-processing, structural element inspection, and MEP element inspection. The entire process was programmed in MATLAB and executed on a computer with Intel Core i5-7200U CPU and 8 GB RAM. Figure 22 shows the data processing procedures of PBU B. First, the noise data were removed from the raw scanned data and the scanned data for PBU B were aligned with the BIM model after a coordinate transformation as shown in Figure 22a. Next, the three planar surfaces (S4 to S6) of PBU B were extracted as shown in Figure 22b, and each structural element was inspected based on the checklist and the surfaces and edges extracted from scanned data. Furthermore, the two MEP elements (MEP4 and MEP5) on PBU B were successfully recognized by cylinder fitting, as shown in Figure 22c, and the MEP quality was inspected based on the checklist and the dimensions and positions of the fitted cylinders. Furthermore, the obtained quality inspection information was stored in the BIM model of the PBU. Figure 22d shows an example in which the quality inspection information of MEP4 was stored in the BIM model.
5.2. Inspection Accuracy and Efficiency
To examine the accuracy of the proposed technique, the checklist items obtained from the developed technique were compared to the ground truths which were obtained from manual measurement using traditional inspection methods. All the lengths were measured using a measurement tape with the smallest division of 1 mm. All the lengths were repeatedly measured five times, and the average values were taken to reduce the random measurement error.
Table 3 shows the inspection discrepancies for all the structural elements (S1 to S6) regarding all the checklist items (i.e., dimension, opening dimension, opening position, straightness, squareness, twist, and flatness). It is worth noting that the values shown in Table 3 are the average of the absolute values of the discrepancies for each checklist item. For example, for the dimension of a structural element, the inspection discrepancies for its four edge lengths were calculated, producing four inspection discrepancies. Then, the average of the absolute values of the four inspection discrepancies was calculated and is shown in Table 3. The calculation process is similar for other checklist items. According to Table 3, the inspection discrepancies for structural elements ranged from 0.2 mm to 1.6 mm, and the overall averaged inspection discrepancy was 0.7 mm. In general, the average discrepancy of 0.7 mm indicates that the developed technique is accurate enough to provide reliable geometric quality inspection results for structural elements.
It was also observed that S2 and S5 had relatively small inspection discrepancies among all the structural elements. This is partially because S2 and S5 had relatively smaller sizes than other structural elements. In addition, S2 and S5 intersected with other structural elements. Thus, the vertical edges of S2 and S5 were type I edges (illustrated in Figure 15) which were more accurately estimated compared to type II edges.
Table 4 shows the inspection discrepancies for all the MEP elements (MEP1 to MEP5) regarding all the checklist items (dimension and position). For the MEP position, each pipe had four position values that were measured to different edges of the structural element. Therefore, the inspection discrepancies of all the four position values were calculated, and the average of the absolute values of the four discrepancies was calculated and is shown in Table 4. According to Table 4, the inspection discrepancies for MEP elements ranged from 0.1 mm to 2.3 mm, and the overall averaged inspection discrepancy was 0.9 mm. In general, the average discrepancy of 0.9 mm shows that the developed technique can provide accurate geometric quality inspection results for MEP elements.
Nevertheless, it was also observed that MEP2 and MEP3 had much larger inspection discrepancies than other MEP elements. This is possibly because MEP2 and MEP3 had smaller sizes and, thus, the number of scan points on these two elements was smaller. Fewer scan points resulted in less accurate estimations of element dimension and position. It is even worse for MEP3, which was partially occluded by MEP2. Therefore, MEP3 had even fewer scan points than MEP2 due to the occlusions, resulting in the largest inspection discrepancies of 2.3 mm.
In addition, the efficiency of the developed technique was compared to the traditional inspection methods. Using the developed technique, it took 8 min to collect scanned data and 4 min to run the developed data processing algorithm to obtain all the checklist items for each PBU. In the whole process, only one worker was needed to operate the LiDAR and run the algorithm. On the other hand, using the traditional inspection methods, it took around 30 min to complete the inspection for one PBU, and two workers were needed to conduct the inspection because many measurements could not be accomplished by only one worker. Therefore, it is concluded that the efficiency of geometric quality inspection can be greatly improved using the developed technique. The needed inspection time was reduced from 30 min to 12 min for each PBU, and the needed labor was reduced from two workers to one worker only.
6. Conclusions
This study developed an automated geometric quality inspection technique for a specific type of prefabricated components, namely, prefabricated housing units, using BIM and LiDAR. The proposed technique is implemented in five steps. First, the proposed technique uses a LiDAR to obtain the laser scanned data of the as-built prefabricated units. Scan planning is implemented before data acquisition to make sure the acquired data fulfil the needs of geometric quality inspection. Second, data pre-processing is conducted to remove noise data from raw laser scanned data and then register the scanned data with the as-designed BIM. Next, the structural elements of the prefabricated units are inspected after identifying the as-built surfaces and edges and comparing to the as-designed ones. The inspection checklist of a structural element includes the dimension of the element, dimension and position of openings, straightness, squareness, twist, and flatness. Fourth, the MEP elements of the prefabricated units are inspected based on the as-built dimensions and locations of the MEP elements. The inspection checklist of an MEP element includes the dimension and position of the element. Fifth, inspection data obtained from the previous steps are stored in BIM using customized BIM element properties.
To validate the proposed technique, this study conducted experimental validation on two PBUs manufactured in a Singapore prefabrication factory. The PBUs were manufactured using precast concrete for walls and floors. In addition, each PBU had a few cylindrical MEP elements (pipes) made of plastic. The proposed technique was implemented on the two PBUs for geometric quality inspection. To examine the accuracy of the proposed technique, the checklist items obtained from the developed technique were compared to the ground truths, which were obtained from manual measurement using traditional inspection methods. For structural elements, it was found that the inspection discrepancies between the proposed technique and ground-truths ranged from 0.2 mm to 1.6 mm, and the overall averaged inspection discrepancy was 0.7 mm. For MEP elements, the inspection discrepancies ranged from 0.1 mm to 2.3 mm, and the overall averaged inspection discrepancy was 0.9 mm. Overall, the averaged inspection discrepancies of 0.7 mm and 0.9 mm indicated that the proposed technique can provide accurate geometric quality inspection results for both structural and MEP elements. Although the manual measurements also had certain errors and affected the calculation of inspection discrepancies, it is certain that the proposed technique had sufficient accuracy considering that the tolerance values of construction elements were at least ±6 mm. In addition, experimental results also showed that the proposed technique can greatly improve the inspection efficiency. For each PBU, the needed inspection time was reduced from 30 min to 12 min, and the needed labor was reduced from two workers to one worker only. The proposed technique can potentially be adopted by prefabricators, contractors, or developers to check the quality of prefabricated products before shipping to the construction sites. The proposed technique can provide users with a range of benefits such as high accuracy, better efficiency, and lower manpower cost.
Although the experimental results are promising, this study still has a few limitations. First, for each PBU inspected in the validation experiments, only a part of the PBU was scanned. It will be more complicated to scan the entire PBU because multiple scanning locations are required, and scan planning becomes much more complicated. In addition, it is also difficult to scan the top and bottom of prefabricated units. Future research is needed to investigate the inspection of the entire PBU with multiple scanning locations. Second, only PBUs were used in the validation experiments, and no other types of prefabricated housing units were tested. It will be more difficult to inspect PPVC units because they have larger sizes and a larger number of elements. In addition, cylindrical pipes were the only type of MEP elements tested in the validation experiments. More types of MEP elements should be inspected in the future research.
Author Contributions
Conceptualization, Y.T. and Q.W.; Methodology, Y.T. and Q.W.; Validation, Y.T., S.L., and Q.W.; Visualization, S.L.; Writing—original draft, Y.T. and Q.W.; Writing—review and editing, S.L. All authors have read and agreed to the published version of the manuscript.
Funding
This research received no external funding.
Conflicts of Interest
The authors declare no conflict of interest.
References
- Goodier, C.; Gibb, A. Future opportunities for offsite in the UK. Constr. Manag. Econ. 2007, 25, 585–595. [Google Scholar] [CrossRef] [Green Version]
- Pan, W.; Gibb, A.G.; Dainty, A.R. Strategies for integrating the use of off-site production technologies in house building. J. Constr. Eng. Manag. 2012, 138, 1331–1340. [Google Scholar] [CrossRef] [Green Version]
- Tam, V.W.; Tam, C.M.; Zeng, S.; Ng, W.C. Towards adoption of prefabrication in construction. Build. Environ. 2007, 42, 3642–3654. [Google Scholar] [CrossRef] [Green Version]
- Li, Z.; Shen, G.Q.; Xue, X. Critical review of the research on the management of prefabricated construction. Habitat Int. 2014, 43, 240–249. [Google Scholar] [CrossRef] [Green Version]
- Li, C.Z.; Hong, J.; Xue, F.; Shen, G.Q.; Xu, X.; Luo, L. SWOT analysis and Internet of Things-enabled platform for prefabrication housing production in Hong Kong. Habitat Int. 2016, 57, 74–87. [Google Scholar] [CrossRef]
- Mao, C.; Xie, F.; Hou, L.; Wu, P.; Wang, J.; Wang, X. Cost analysis for sustainable off-site construction based on a multiple-case study in China. Habitat Int. 2016, 57, 215–222. [Google Scholar] [CrossRef]
- Arashpour, M.; Wakefield, R.; Blismas, N.; Minas, J. Optimization of process integration and multi-skilled resource utilization in off-site construction. Autom. Constr. 2015, 50, 72–80. [Google Scholar] [CrossRef]
- Arashpour, M.; Wakefield, R.; Abbasi, B.; Lee, E.W.M.; Minas, J. Off-site construction optimization: Sequencing multiple job classes with time constraints. Autom. Constr. 2016, 71, 262–270. [Google Scholar] [CrossRef]
- O’Brien, M.; Wakefield, R.; Beliveau, Y. Industrializing the Residental Construction Site; The Center for Housing Research at Virginia Tech Blacksburg: Blacksburg, VA, USA, 2000. [Google Scholar]
- Zhao, N. System-Built Single Family Homes in 2014: Special Study for Housing Economics; National Association of Home Builders: Washington, DC, USA, 2015. [Google Scholar]
- Chiang, Y.-H.; Hon-Wan Chan, E.; Ka-Leung Lok, L. Prefabrication and barriers to entry—a case study of public housing and institutional buildings in Hong Kong. Habitat Int. 2006, 30, 482–499. [Google Scholar] [CrossRef]
- Pons, O.; Wadel, G. Environmental impacts of prefabricated school buildings in Catalonia. Habitat Int. 2011, 35, 553–563. [Google Scholar] [CrossRef]
- Taylor, M.D. A definition and valuation of the UK offsite construction sector. Constr. Manag. Econ. 2010, 28, 885–896. [Google Scholar] [CrossRef]
- Mostafa, S.; Chileshe, N. Application of discrete-event simulation to investigate effects of client order behaviour on off-site manufacturing performance in Australia. Archit. Eng. Des. Manag. 2018, 14, 139–157. [Google Scholar] [CrossRef]
- BCA. Prefabricated Prefinished Volumetric Construction; BCA: Singapore, 2017. [Google Scholar]
- BCA. Prefabricated Prefinished Volumetric Construction; BCA: Singapore, 2015. [Google Scholar]
- Kim, M.-K.; Wang, Q.; Li, H. Non-contact sensing based geometric quality assessment of buildings and civil structures: A review. Autom. Constr. 2019, 100, 163–179. [Google Scholar] [CrossRef]
- Shahtaheri, Y.; Rausch, C.; West, J.; Haas, C.; Nahangi, M. Managing risk in modular construction using dimensional and geometric tolerance strategies. Autom. Constr. 2017, 83, 303–315. [Google Scholar] [CrossRef]
- Josephson, P.E.; Hammarlund, Y. The causes and costs of defects in construction: A study of seven building projects. Autom. Constr. 1999, 8, 681–687. [Google Scholar] [CrossRef]
- Jaillon, L.; Poon, C.S. Life cycle design and prefabrication in buildings: A review and case studies in Hong Kong. Autom. Constr. 2014, 39, 195–202. [Google Scholar] [CrossRef]
- Wang, Q.; Cheng, J.C.; Sohn, H. Automated estimation of reinforced precast concrete rebar positions using colored laser scan data. Comput. Aided Civ. Infrastruct. Eng. 2017, 32, 787–802. [Google Scholar] [CrossRef]
- Tang, P.; Huber, D.; Akinci, B. Characterization of Laser Scanners and Algorithms for Detecting Flatness Defects on Concrete Surfaces. J. Comput. Civ. Eng. 2011, 25, 31–42. [Google Scholar] [CrossRef]
- Wang, Q.; Kim, M.-K.; Cheng, J.C.P.; Sohn, H. Automated quality assessment of precast concrete elements with geometry irregularities using terrestrial laser scanning. Autom. Constr. 2016, 68, 170–182. [Google Scholar] [CrossRef]
- Kim, C.; Son, H.; Kim, C. Automated construction progress measurement using a 4D building information model and 3D data. Autom. Constr. 2013, 31, 75–82. [Google Scholar] [CrossRef]
- Wang, Q.; Sohn, H.; Cheng, J. Automatic as-built BIM creation of precast concrete bridge deck panels using laser scan data. J. Comput. Civ. Eng. 2018, 32, 04018011. [Google Scholar] [CrossRef]
- Tang, P.; Huber, D.; Akinci, B.; Lipman, R.; Lytle, A. Automatic reconstruction of as-built building information models from laser-scanned point clouds: A review of related techniques. Autom. Constr. 2010, 19, 829–843. [Google Scholar] [CrossRef]
- Shang, G.; Low, S.P. Lean Construction Management: The Toyota Way; Springer: Berlin/Heidelberg, Germany, 2014. [Google Scholar]
- Pang, E.F.; Lim, L.Y. Labor, Productivity and Singapore’s Development Model. Singap. Econ. Rev. 2015, 60. [Google Scholar] [CrossRef]
- BCA. Design for Manufacturing and Assembly (DfMA), in Prefabricated Prefinished Volumetric Construction; Building and Construction Authority: Singapore, 2016. [Google Scholar]
- BCA. Good Industry Practices–Prefabricated Bathroom Unit (PBU); BCA: Singapore, 2014. [Google Scholar]
- Ham, N.-H.; Min, K.-M.; Kim, J.-H.; Lee, Y.-S.; Kim, J.-J. A study on application of bim (building information modeling) to pre-design in construction project. In Proceedings of the ICCIT’08. Third International Conference, Convergence and Hybrid Information Technology, Washington, DC, USA, 11–13 November 2008. [Google Scholar]
- Shadram, F.; Johansson, T.D.; Lu, W.; Schade, J.; Olofsson, T. An integrated BIM-based framework for minimizing embodied energy during building design. Energy Build. 2016, 128, 592–604. [Google Scholar] [CrossRef]
- Wong, K.-d.; Fan, Q. Building information modelling (BIM) for sustainable building design. Facilities 2013, 31, 138–157. [Google Scholar] [CrossRef]
- Ilhan, B.; Yaman, H. Green building assessment tool (GBAT) for integrated BIM-based design decisions. Autom. Constr. 2016, 70, 26–37. [Google Scholar] [CrossRef]
- Leite, F.; Akinci, B.; Garrett, J. Identification of data items needed for automatic clash detection in MEP design coordination. In Proceedings of the 2009 Construction Research Congress, Seattle, DC, USA, 5–7 April 2009. [Google Scholar]
- Kumar, S.S.; Cheng, J.C.P. A BIM-based automated site layout planning framework for congested construction sites. Autom. Constr. 2015, 59, 24–37. [Google Scholar] [CrossRef]
- Zhou, Y.; Ding, L.Y.; Chen, L.J. Application of 4D visualization technology for safety management in metro construction. Autom. Constr. 2013, 34, 25–36. [Google Scholar] [CrossRef]
- Zhang, S.; Sulankivi, K.; Kiviniemi, M.; Romo, I.; Eastman, C.M.; Teizer, J. BIM-based fall hazard identification and prevention in construction safety planning. Saf. Sci. 2015, 72, 31–45. [Google Scholar] [CrossRef]
- Wang, J.; Zhang, X.; Shou, W.; Wang, X.; Xu, B.; Kim, M.J.; Wu, P. A BIM-based approach for automated tower crane layout planning. Autom. Constr. 2015, 59, 168–178. [Google Scholar] [CrossRef]
- Lu, Q.; Won, J.; Cheng, J.C.P. A financial decision making framework for construction projects based on 5D Building Information Modeling (BIM). Int. J. Proj. Manag. 2016, 34, 3–21. [Google Scholar] [CrossRef]
- McArthur, J.J. A Building Information Management (BIM) Framework and Supporting Case Study for Existing Building Operations, Maintenance and Sustainability. Procedia Eng. 2015, 118, 1104–1111. [Google Scholar] [CrossRef] [Green Version]
- Li, N.; Becerik-Gerber, B.; Krishnamachari, B.; Soibelman, L. A BIM centered indoor localization algorithm to support building fire emergency response operations. Autom. Constr. 2014, 42, 78–89. [Google Scholar] [CrossRef]
- Marzouk, M.; Abdelaty, A. BIM-based framework for managing performance of subway stations. Autom. Constr. 2014, 41, 70–77. [Google Scholar] [CrossRef]
- Cheng, J.C.P.; Ma, L.Y.H. A BIM-based system for demolition and renovation waste estimation and planning. Waste Manag. 2013, 33, 1539–1551. [Google Scholar] [CrossRef]
- Won, J.; Cheng, J.C.P.; Lee, G. Quantification of construction waste prevented by BIM-based design validation: Case studies in South Korea. Waste Manag. 2016, 49, 170–180. [Google Scholar] [CrossRef] [PubMed]
- Wang, Q.; Tan, Y.; Mei, Z. Computational Methods of Acquisition and Processing of 3D Point Cloud Data for Construction Applications. Arch. Comput. Methods Eng. 2019, 27, 479–499. [Google Scholar] [CrossRef]
- Liu, X. Airborne LiDAR for DEM generation: Some critical issues. Prog. Phys. Geogr. Earth Environ. 2008, 32, 31–49. [Google Scholar]
- Hollaus, M.; Wagner, W.; Maier, B.; Schadauer, K. Airborne Laser Scanning of Forest Stem Volume in a Mountainous Environment. Sensors 2007, 7, 1559–1577. [Google Scholar] [CrossRef] [Green Version]
- Son, S.; Park, H.; Lee, K.H. Automated laser scanning system for reverse engineering and inspection. Int. J. Mach. Tools Manuf. 2002, 42, 889–897. [Google Scholar] [CrossRef]
- Olsen Michael, J.; Kuester, F.; Chang Barbara, J.; Hutchinson Tara, C. Terrestrial Laser Scanning-Based Structural Damage Assessment. J. Comput. Civ. Eng. 2010, 24, 264–272. [Google Scholar] [CrossRef]
- Zhang, C.; Arditi, D. Automated progress control using laser scanning technology. Autom. Constr. 2013, 36, 108–116. [Google Scholar] [CrossRef]
- Hebert, M.; Krotkov, E. 3D measurements from imaging laser radars: How good are they? Image Vis. Comput. 1992, 10, 170–178. [Google Scholar] [CrossRef] [Green Version]
- Gong, J.; Caldas, C.H. Data processing for real-time construction site spatial modeling. Autom. Constr. 2008, 17, 526–535. [Google Scholar] [CrossRef]
- Aiger, D.; Mitra, N.J.; Cohen-Or, D. 4-points congruent sets for robust pairwise surface registration. ACM Trans. Graph. 2008. [Google Scholar] [CrossRef] [Green Version]
- Besl, P.J.; McKay, N.D. Method for registration of 3-D shapes. In Sensor Fusion IV: Control Paradigms and Data Structures; International Society for Optics and Photonics: Bellingham, WA, USA, 1992. [Google Scholar]
- Nguyen, A.; Le, B. 3D point cloud segmentation: A survey. In Proceedings of the 2013 6th IEEE Conference on Robotics, Automation and Mechatronics (RAM), Manila, Philippines, 12–15 November 2013. [Google Scholar]
- Kim, M.-K.; Sohn, H.; Chang, C.-C. Automated dimensional quality assessment of precast concrete panels using terrestrial laser scanning. Autom. Constr. 2014, 45, 163–177. [Google Scholar] [CrossRef]
- Kim, M.-K.; Wang, Q.; Park, J.-W.; Cheng, J.C.; Sohn, H.; Chang, C.-C. Automated dimensional quality assurance of full-scale precast concrete elements using laser scanning and BIM. Autom. Constr. 2016, 72, 102–114. [Google Scholar] [CrossRef]
- Safa, M.; Shahi, A.; Nahangi, M.; Haas, C.; Noori, H. Automating measurement process to improve quality management for piping fabrication. Structures 2015, 3, 71–80. [Google Scholar] [CrossRef]
- Nahangi, M.; Yeung, J.; Haas, C.T.; Walbridge, S.; West, J. Automated assembly discrepancy feedback using 3D imaging and forward kinematics. Autom. Constr. 2015, 56, 36–46. [Google Scholar] [CrossRef]
- Rausch, C.; Nahangi, M.; Haas, C.; West, J. Kinematics chain based dimensional variation analysis of construction assemblies using building information models and 3D point clouds. Autom. Constr. 2017, 75, 33–44. [Google Scholar] [CrossRef]
- Rodríguez-Martín, M.; Rodríguez-Gonzálvez, P.; Lagüela, S.; González-Aguilera, D. Macro-photogrammetry as a tool for the accurate measurement of three-dimensional misalignment in welding. Autom. Constr. 2016, 71, 189–197. [Google Scholar] [CrossRef]
- Kim, M.-K.; Sohn, H.; Chang, C.-C. Localization and quantification of concrete spalling defects using terrestrial laser scanning. J. Comput. Civ. Eng. 2014, 29, 04014086. [Google Scholar] [CrossRef] [Green Version]
- Wang, Q.; Kim, M.-K.; Sohn, H.; Cheng, J.C. Surface flatness and distortion inspection of precast concrete elements using laser scanning technology. Smart Struct. Syst. 2016, 18, 601–623. [Google Scholar] [CrossRef] [Green Version]
- Bosché, F.; Guenet, E. Automating surface flatness control using terrestrial laser scanning and building information models. Autom. Constr. 2014, 44, 212–226. [Google Scholar] [CrossRef]
- Li, D.; Liu, J.; Feng, L.; Zhou, Y.; Liu, P.; Chen, Y.F. Terrestrial laser scanning assisted flatness quality assessment for two different types of concrete surfaces. Measurement 2020, 154, 107436. [Google Scholar] [CrossRef]
- Fischler, M.A.; Bolles, R.C. Random sample consensus: A paradigm for model fitting with applications to image analysis and automated cartography. Commun. ACM 1981, 24, 381–395. [Google Scholar] [CrossRef]
- Torr, P.H.; Zisserman, A. MLESAC: A new robust estimator with application to estimating image geometry. Comput. Vis. Image Underst. 2000, 78, 138–156. [Google Scholar] [CrossRef] [Green Version]
- FARO. FARO® Laser Scanner Focus. Available online: https://www.faro.com/en-sg/products/construction-bim/faro-laser-scanner-focus/ (accessed on 10 June 2020).
Figure 1.
Manual geometric quality inspection of prefabricated components.

Figure 2.
Prefabricated housing units in Singapore: (a) prefabricated prefinished volumetric construction (PPVC) and (b) prefabricated bathroom unit (PBU).
Figure 2.
Prefabricated housing units in Singapore: (a) prefabricated prefinished volumetric construction (PPVC) and (b) prefabricated bathroom unit (PBU).

Figure 3.
Measurement of dimensions (e.g., L1 to L4) of a structural element.

Figure 4.
Measurement of the dimensions (d1 to d4) and positions (p1 to p4) of an opening on a structural element.
Figure 4.
Measurement of the dimensions (d1 to d4) and positions (p1 to p4) of an opening on a structural element.

Figure 5.
Measurement of straightness of a structural element.

Figure 6.
Measurement of squareness of a structural element.

Figure 7.
Measurement of twist of a prefabricated element.

Figure 8.
Measurement of flatness of a prefabricated element.

Figure 9.
Measurement of the dimension () and position ( and ) of a cylindrical pipe.

Figure 10.
The overview and detailed five-step process of the developed geometric quality inspection technique.
Figure 10.
The overview and detailed five-step process of the developed geometric quality inspection technique.

Figure 11.
Scanned data quality with regard to (a) ranging error and (b) spatial resolution.

Figure 12.
Relationships between scanning parameters and scanned data quality.

Figure 13.
Data cleansing: (a) selection of scanned data surrounding the target unit, (b) 3D view of the selected scanned data, (c) scanned data after removing the roof and floor, and (d) extraction of the target unit using region growing.
Figure 13.
Data cleansing: (a) selection of scanned data surrounding the target unit, (b) 3D view of the selected scanned data, (c) scanned data after removing the roof and floor, and (d) extraction of the target unit using region growing.

Figure 14.
Scan-BIM registration: (a) scanned data in LiDAR’s coordinate system, (b) as-designed BIM in user-defined coordinate system, and (c) scanned data after registration.
Figure 14.
Scan-BIM registration: (a) scanned data in LiDAR’s coordinate system, (b) as-designed BIM in user-defined coordinate system, and (c) scanned data after registration.

Figure 15.
Extraction of as-built surfaces and edges: (a) extraction of surfaces, (b) extraction of last scan points in each row/column for an edge, and (c) estimation of an edge as a set of edge points.
Figure 15.
Extraction of as-built surfaces and edges: (a) extraction of surfaces, (b) extraction of last scan points in each row/column for an edge, and (c) estimation of an edge as a set of edge points.

Figure 16.
Extraction of estimated edge lines and corner points from surface points and edge points for the inspection of dimensions and locations of structural elements and openings.
Figure 16.
Extraction of estimated edge lines and corner points from surface points and edge points for the inspection of dimensions and locations of structural elements and openings.

Figure 17.
Surface quality inspection for structural elements: (a) straightness inspection, (b) squareness inspection, (c) twist inspection, and (d) flatness inspection.
Figure 17.
Surface quality inspection for structural elements: (a) straightness inspection, (b) squareness inspection, (c) twist inspection, and (d) flatness inspection.

Figure 18.
Extraction of pipes: (a) scanned data near the element and (b) cylinder fitting.

Figure 19.
Example of inspection-related properties and their values of a structural element.

Figure 20.
Two PBUs for validation experiments.

Figure 21.
Optimal scanning location for PBU B obtained from simulations.

Figure 22.
Experimental process for validation experiments: (a) scanned data for PBU B after data pre-processing, (b) extraction of three planar surfaces S4 to S6 for structural element inspection, (c) recognition of MEP4 and MEP5 (as shown in Figure 20) for MEP element inspection, and (d) storage of inspection information of MEP4 in BIM model.


Table 1.
Geometric quality inspection checklist and tolerance of prefabricated housing units.
| Category | Checklist Items | Tolerance |
|---|---|---|
| Structural Elements | Dimension | Depending on the edge length L: L ≤ 3 m: ±6 mm 3 m < L ≤ 4.5 m: ±9 mm 4.5 m < L ≤ 6 m: ±12 mm Additional allowable tolerance for every subsequent 6 m: ±6 mm |
| Opening dimension | +10 mm | |
| Opening position | ±25 mm | |
| Straightness | Depending on the edge length L: L ≤ 3 m: 6 mm 3 m < L ≤ 4.5 m: 9 mm 4.5 m < L ≤ 6 m: 12 mm Additional allowable tolerance for every subsequent 6 m: 6 mm | |
| Squareness | Depending on the width W of the element: W ≤ 1.2 m: 6 mm 1.2 m < W ≤ 1.8 m: 9 mm W > 1.8 m: 12 mm | |
| Twist | Depending on the width W and length L of the element: W ≤ 600 mm and L ≤ 6 m: 6 mm All other cases: 12 mm | |
| Flatness | 6 mm per 1.5 m | |
| MEP Elements | Dimension | 6 mm (for pipes) |
| Position | 6 mm (for pipes) |
Table 2.
Customized properties for inspection-related information.
| Category | Property Name | Property Type | Property Value |
|---|---|---|---|
| General | Inspector | Text | Inspector in charge of the inspection |
| Inspection date | Text | Date of the inspection | |
| Acceptance | Boolean | Whether the element is accepted (YES or NO) | |
| Structural | Dimension | Length | Maximum dimension discrepancy of all edges of an element |
| Opening dimension | Length | Maximum dimension discrepancy of all edges of an opening | |
| Opening position | Length | Maximum position discrepancy of all edges of an opening | |
| Straightness | Length | Maximum straightness deviation of all edges of an element | |
| Squareness | Length | Maximum squareness deviation of all corners of an element | |
| Twist | Length | Maximum twist deviation of all corners of an element | |
| Flatness | Length | Maximum straight edge deviation | |
| MEP | Dimension | Length | Dimension discrepancy of an element |
| Position | Length | Maximum position discrepancy of an element |
Table 3.
Inspection discrepancies between the developed technique and ground truths for the checklist items for structural elements.
Table 3.
Inspection discrepancies between the developed technique and ground truths for the checklist items for structural elements.
| Structural Element | Inspection Discrepancies (mm) | ||||||
|---|---|---|---|---|---|---|---|
| Dimension | Opening Dimension | Opening Position | Straightness | Squareness | Twist | Flatness | |
| S1 | 1.5 | N/A | N/A | 0.6 | 0.4 | 0.7 | 0.4 |
| S2 | 0.6 | N/A | N/A | 0.3 | 0.2 | 0.4 | 0.2 |
| S3 | 1.3 | 1.2 | 1.5 | 0.8 | 0.6 | 0.8 | 0.2 |
| S4 | 1.2 | N/A | N/A | 0.4 | 0.9 | 0.6 | 0.5 |
| S5 | 0.5 | N/A | N/A | 0.2 | 0.4 | 0.2 | 0.3 |
| S6 | 1.6 | 1.4 | 1.0 | 0.6 | 0.6 | 0.7 | 0.3 |
Table 4.
Inspection discrepancies between the developed technique and ground truths for the checklist items for MEP elements.
Table 4.
Inspection discrepancies between the developed technique and ground truths for the checklist items for MEP elements.
| MEP Element | Inspection Discrepancies (mm) | |
|---|---|---|
| Dimension | Position | |
| MEP1 | 0.2 | 0.6 |
| MEP2 | 1.1 | 1.5 |
| MEP3 | 1.8 | 2.3 |
| MEP4 | 0.2 | 0.7 |
| MEP5 | 0.1 | 0.6 |
© 2020 by the authors. Licensee MDPI, Basel, Switzerland. This article is an open access article distributed under the terms and conditions of the Creative Commons Attribution (CC BY) license (http://creativecommons.org/licenses/by/4.0/).
Share and Cite
MDPI and ACS Style
Tan, Y.; Li, S.; Wang, Q. Automated Geometric Quality Inspection of Prefabricated Housing Units Using BIM and LiDAR. Remote Sens. 2020, 12, 2492. https://doi.org/10.3390/rs12152492
AMA Style
Tan Y, Li S, Wang Q. Automated Geometric Quality Inspection of Prefabricated Housing Units Using BIM and LiDAR. Remote Sensing. 2020; 12(15):2492. https://doi.org/10.3390/rs12152492
Chicago/Turabian StyleTan, Yi, Silin Li, and Qian Wang. 2020. "Automated Geometric Quality Inspection of Prefabricated Housing Units Using BIM and LiDAR" Remote Sensing 12, no. 15: 2492. https://doi.org/10.3390/rs12152492
Note that from the first issue of 2016, this journal uses article numbers instead of page numbers. See further details here.