Canopy and Terrain Height Retrievals with ICESat-2: A First Look


University of Texas at Austin, Applied Research Laboratories, Austin, TX 78758, USA
*
Author to whom correspondence should be addressed.
Remote Sens. 2019, 11(14), 1721; https://doi.org/10.3390/rs11141721
Submission received: 4 June 2019
/
Revised: 11 July 2019
/
Accepted: 19 July 2019
/
Published: 20 July 2019
Abstract
:NASA’s Ice, Cloud and Land Elevation Satellite-2 (ICESat-2) launched in fall 2018 and has since collected continuous elevation data over the Earth’s surface. The primary scientific objective is to measure the cryosphere for studies related to land ice and sea ice characteristics. The vantage point from space, however, provides the opportunity to measure global surfaces including oceans, land, and vegetation. The ICESat-2 mission has dedicated products to the represented surface types, including an along-track elevation profile of terrain and canopy heights (ATL08). This study presents the first look at the ATL08 product and the quantitative assessment of the canopy and terrain height retrievals as compared to airborne lidar data. The study also provides qualitative examples of ICESat-2 observations from selected ecosystems to highlight the broad capability of the satellite for vegetation applications. Analysis of the mission’s preliminary ATL08 data product accuracy using an ICESat-2 transect over a vegetated region of Finland indicates a 5 m offset in geolocation knowledge (horizontal accuracy) well within the 6.5 m mission requirement. The vertical RMSE for the terrain and canopy height retrievals for one transect are 0.85 m and 3.2 m respectively.

1. Introduction
A new NASA space-based laser altimetry mission, ICESat-2 (Ice, Cloud, and Land Elevation Satellite-2), launched in September 2018. Although ICESat-2’s primary science objectives focus on the cryosphere, ranging measurements are collected globally over all surface types [1,2]. The first few months of ICESat-2 data have demonstrated unprecedented spatial detail in surface profiles over a variety of surfaces, including ice shelves (rifts, ice fronts, grounding zones, basal channels, and meltwater depth), sea ice, the ocean (near-shore bathymetry and ocean surface topography) and vegetated land (forest canopy height and topography). These data will improve our understanding of how the Earth physical system functions today, how it supports life, how conditions might change in the future, and how humans may influence such change. Over the long term, the accumulation of the satellite laser altimeter record will allow us to understand better understanding of fundamental Earth processes on relevant timescales, sufficient for inclusion in climate models to enable improved predictions and interpretation. Data from ICESat-2 will provide the first comprehensive look at global vegetation structure using lidar from space since the ICESat mission operational from 2003–2009.
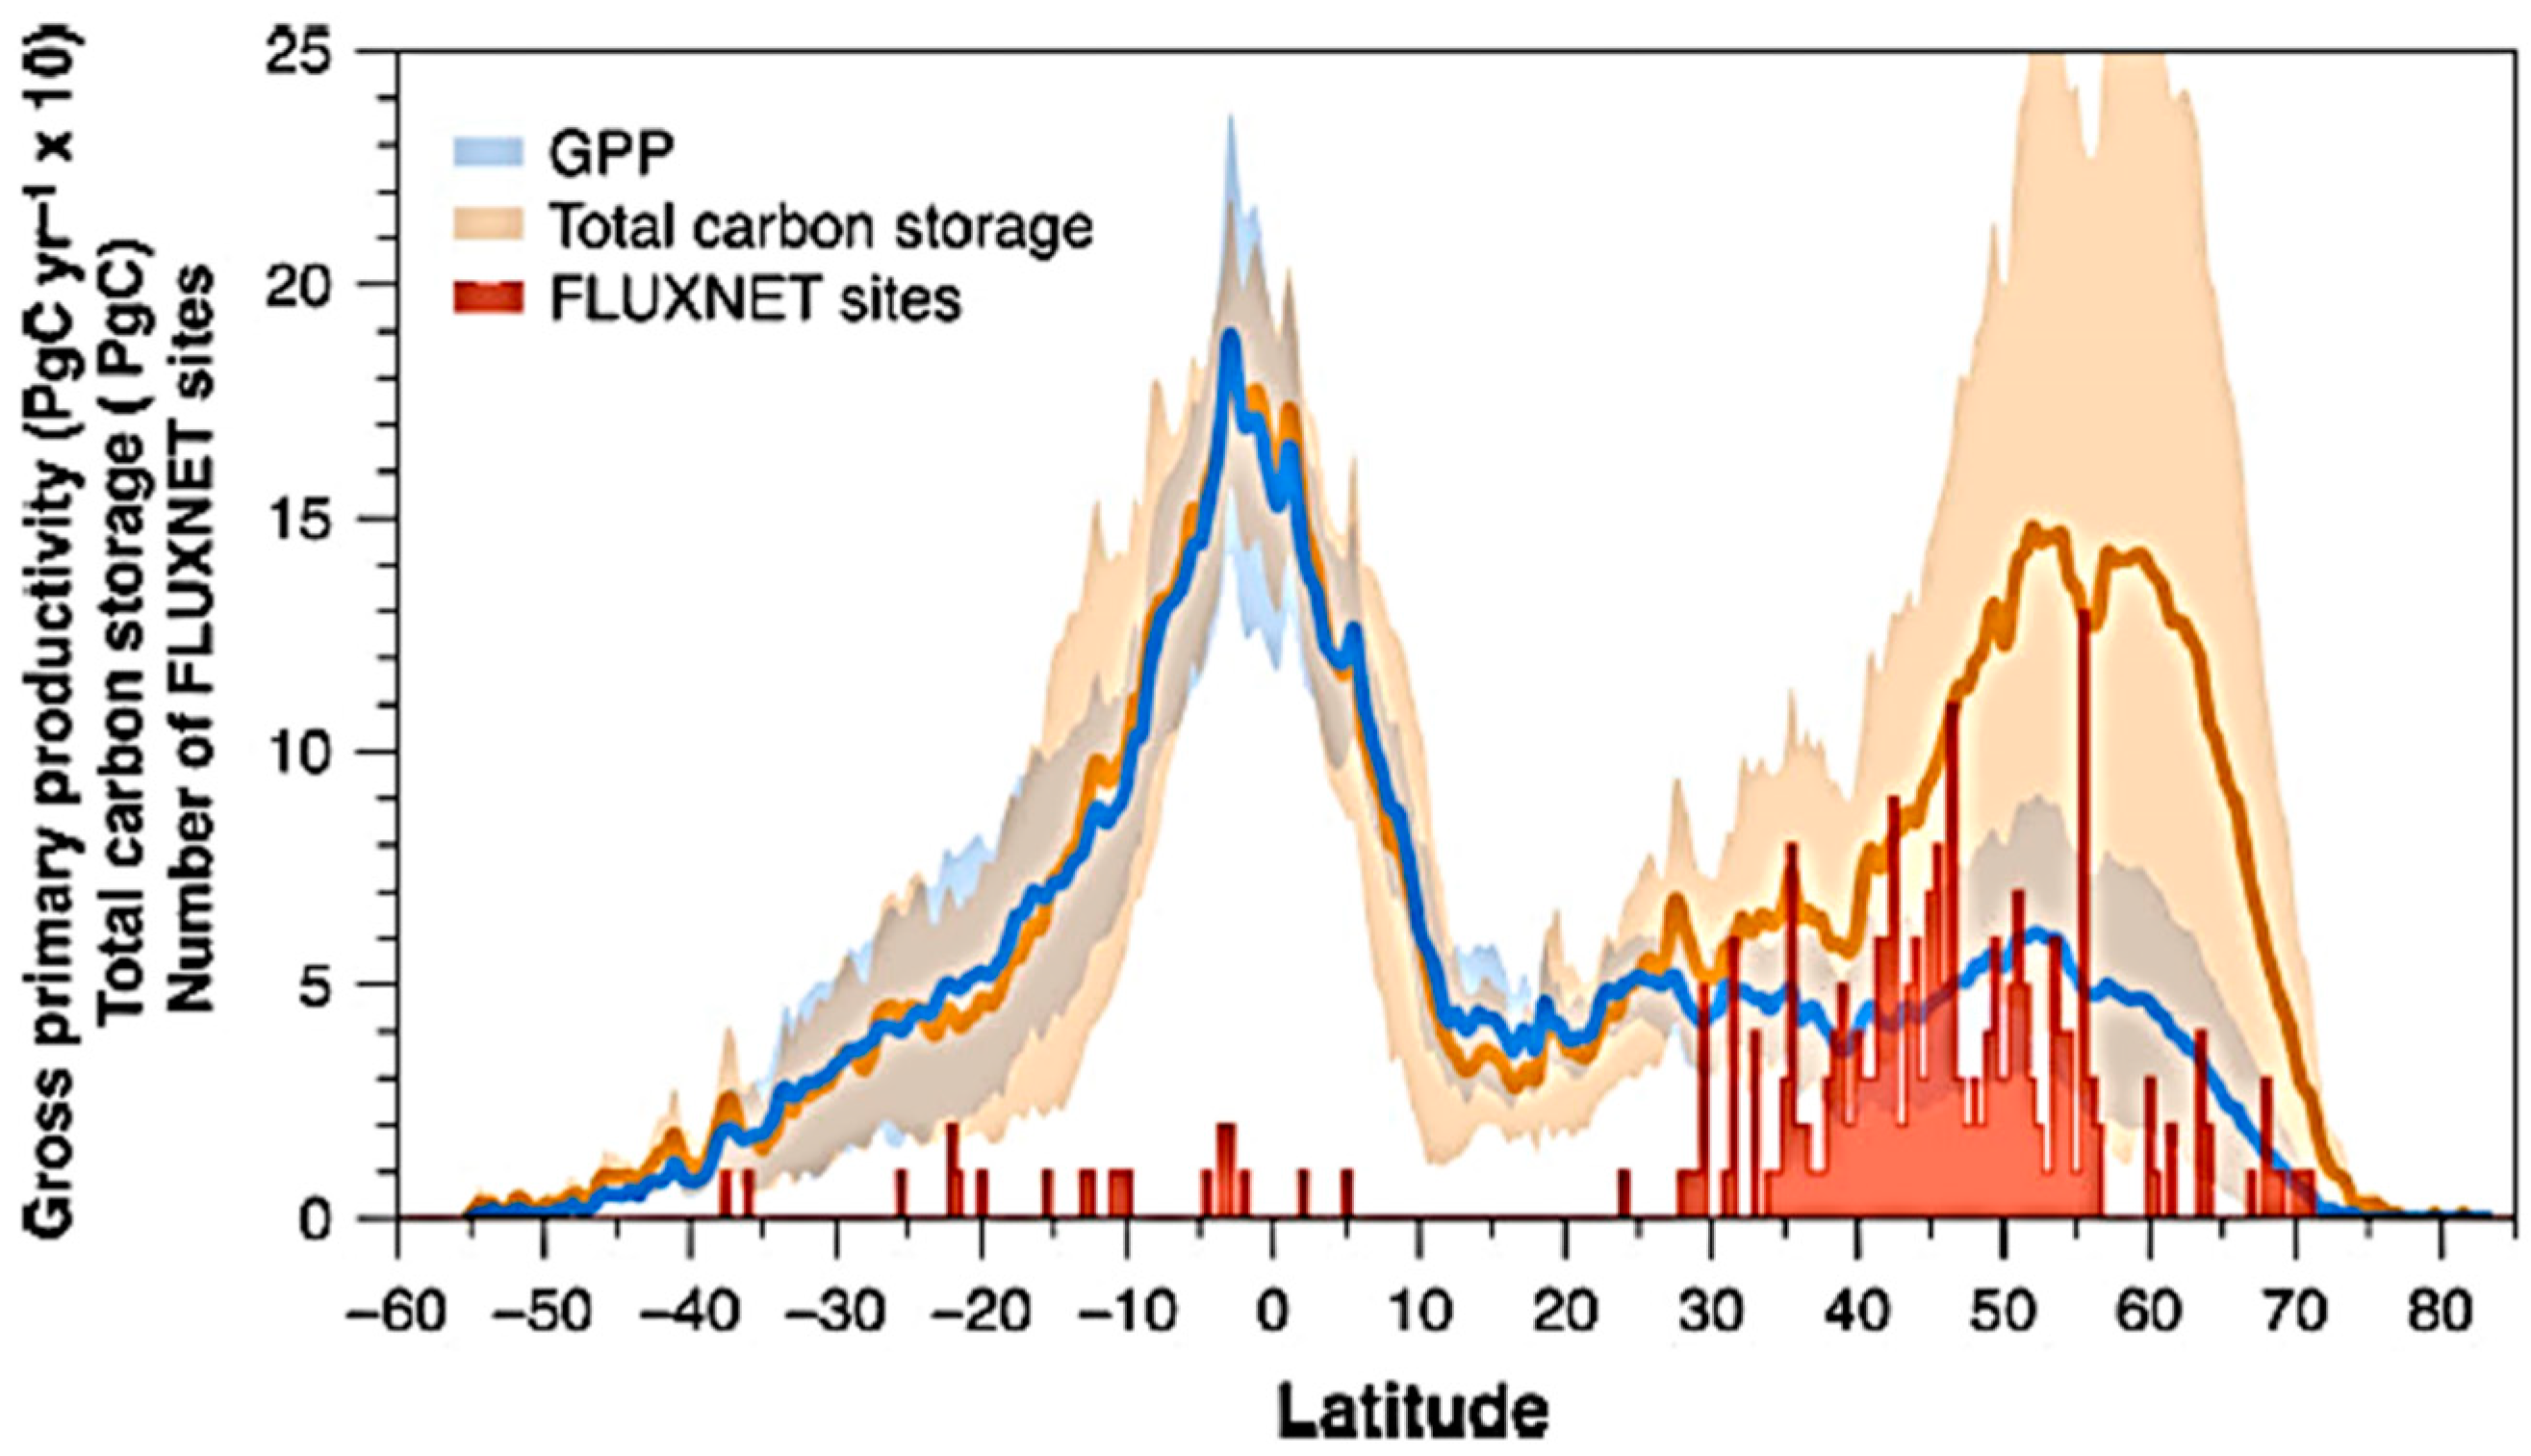
Earth observations from space over terrestrial ecosystems (topography and vegetation) play a critical role in understanding distribution of carbon stocks and fluxes, improving terrain models as controls on ecosystem response, and habitat mapping. In the boreal region, the amount of carbon storage is estimated to be roughly equivalent to that in the tropics, however, there is much greater uncertainty (see Figure 1) due primarily to below-ground carbon stored in boreal soils as well as poorly sampled above-ground vegetation. Schimel et al. [3] describe the need for space-based systematic mapping of vegetation globally to help reduce the uncertainty of carbon storage required for climate modeling scenarios. Baseline estimates of carbon stocks provide modeling groups with important constraints to climate and carbon cycle models as well as to enable the long-term monitoring of changes to above-ground biomass stocks in the future.
Space-based missions, such as ICESat-2, capable of directly measuring canopy heights globally provide a critical observation needed to improve our understanding of global carbon stocks. Furthermore, ICESat-2 is the only space-based lidar system that will collect ranging measurements above 51.5 degrees latitude. As such, ICESat-2 data will provide a new opportunity to directly measure the height and distribution of boreal forest, which would otherwise be omitted from the next generation accounting of forest biomass using only space-based lidar. A premise of ICESat-2 for forest biomass studies is to provide those unique measurements for derived biomass in high latitude regions and sustain an important individual or collaborative assessment of biomass to those latitudes covered by other instruments at lower inclinations such as GEDI (Global Ecosystem Dynamics Investigation). An important factor associated with biomass estimation using lidar measurements is the ability to quantify canopy height and provide an indication of the vegetation structure [4,5,6]. ICESat-2 will report not only canopy height, but also several canopy height metrics that are related to vegetation structure. Vegetation structure refers to the horizontal and vertical distribution of canopy. Historically, structure metrics such as canopy height, canopy cover, distribution of vertical layers, and biomass are collected at local scales (i.e., field plots) [7,8], but airborne and space-based lidar provides an opportunity to scale and link local measurements to global processes. Vegetation structure plays a fundamental role in ecosystem function, and the ability to quantify that structure improves our understanding of ecosystem dynamics [9].
2. Materials and Methods
The unique instrument onboard ICESat-2 is the Advanced Topographic Laser Altimeter System (ATLAS). This instrument uses a 532 nm (green) laser to actively map the surface elevation. What sets the ATLAS instrument apart from other laser ranging systems is that it uses a photon-counting detection technology, which enables a detection modality sensitive to individual photons. In contrast, most commercial lidar systems record thousands of photons from the reflected energy which trigger a detection, or return, when the returned signal amplitude crosses a threshold. A benefit of utilizing a photon counting system is that the laser can operate at a high repetition rate, thus improving the along-track resolution. The 10 kHz laser repetition rate combined with the altitude and velocity of the satellite results in a 70 cm separation for each shot on the Earth’s surface in the along-track direction. ATLAS configuration uses a diffractive optical element to split the laser into six beams arranged as three pairs of beams approximately 3.3 km apart from one another (Figure 2) [2]. Each beam pair consists of a strong and weak energy beam (4:1 ratio) which allows for local slope determination between each beam pair as well as to compensate for varying surface reflectance. The travel time of each detected photon is used to determine a range to the surface which, when combined with satellite attitude and pointing information, can be geolocated into a unique XYZ location on or near the Earth’s surface.
Full waveform, large-footprint systems, such as ICESat, produced large footprint diameters that constrain the derivation of both terrain and canopy heights given the limited vertical resolution. In areas of high relief, the vegetation signal convolves with the terrain signal such that the surfaces are not easily disentangled for individual surface interpretation [10,11,12]. Fortunately, ICESat-2 lidar technology does not have this issue and extraction of both the terrain and canopy surface is possible even in high relief areas. The small footprint and the high laser repetition rate results in a near-continuously sampled profile in the along-track direction. Depending upon the surface reflectance and atmospheric conditions, up to 16 photons per outgoing shot could be detected on the 4x4 detector array for the strong beam. Currently, the laser energy level on the instrument is configured to detect approximately 10 photons per shot over ice- and snow-covered surfaces with standard surface reflectivity (~0.9 at 532 nm). For land and vegetation, the signal expectation is approximately one photon detection per shot from both vegetation and terrain surfaces (strong beam) due to the lower reflectance. During sunlit acquisitions, there is an abundance of noise (background) photons that occur both above and below the perceived surface. The ATL08 algorithm [13] has a noise filtering component to isolate noise photons from the signal returns. The background noise rate is a function of several factors including the surface reflectance, solar elevation angle, and atmospheric conditions. There is a presence of background noise in ICESat-2 data during night collections, however, the noise rate is considerably less than during day acquisitions. The strong beam is recommended for vegetation studies, however, the weak beam does still provide usable data. It just contains ¼ the number of photons as the strong beam.
The ICESat-2 mission will produce along-track geophysical products over select surface types that include land ice (ATL06), sea ice (ATL07), land/vegetation (ATL08) [14], atmosphere (ATL09), oceans (ATL12), and inland water (ATL13). ATL03 [15] is the geolocated photon cloud and serves as the input data for each of the higher-level data products. The ATL08 algorithm developed specifically for the extraction of terrain and canopy heights from the ATL03 photon clouds produces the ATL08 geophysical data product [13] at a 100 m step size in the along-track direction. Based on the distribution of signal photons, this algorithm estimates the ground surface and top of canopy surface elevations and then subsequently labels the individual photons as either noise, ground, canopy, or top of canopy photons. Statistics for both terrain and canopy detections are reported at the 100 m step size based on the label at the photon level. The motivation behind the ATL08 data product is to accumulate enough photons reflecting from both the terrain and top of canopy such that the calculation of canopy and terrain height can be made. The reported canopy statistics on ATL08 not only include the height of the canopy but also several canopy metrics that reveal information about the vertical distribution of the canopy photons and structure of the vegetation. The indices of each labeled photon (ground, canopy, top of canopy) are also provided on the ATL08 data product to directly link to the ATL03 data product. These indices provide the user with an opportunity to calculate terrain and canopy height estimates at scales other than 100 m if it is so desired. All ICESat-2 data are available from the National Snow and Ice Data Center (https://nsidc.org/data/icesat-2).
What sets ICESat-2 data apart from other lidar systems (i.e., discrete return or full waveform) is the photon counting aspect of the instrument. The most basic measurement that ICESat-2 records is the time-of-flight for an individual photon that is subsequently geolocated into an XYZ position above the reference ellipsoid. As the laser illuminates the nominal 17 m diameter footprint on the surface, a photon (or two or three) will be reflected from the surface and detected at the satellite. The detected photons at the instrument can be reflected from any surface within the footprint; they may not hit the ground and they may not reflect from the top of the canopy. The number of photons reflected from the surface is dependent upon the surface reflectance. For vegetation, we anticipate the number of detected photons per outgoing laser shot to vary between zero to two, possibly three. Figure 3 illustrates the acquisition principle. In this illustration, the laser footprint moves at a 70 cm increment across the surface with the current laser footprint shown as yellow. The photons shown as yellow represent the photons detected from the current laser shot. The photons shown as green dots represent the photons recorded from the previous ICESat-2 shots. The heights associated with each detected photon within a footprint are not sufficient to estimate a terrain and canopy height at the footprint level. The motivation behind the ATL08 data product is to accumulate enough photons reflecting from both the terrain and top of canopy such that the calculation of canopy and terrain height can be made. A 100 m step size in the along-track direction was selected by the ICESat-2 Science Definition Team as a consistent increment to calculate terrain and canopy height.
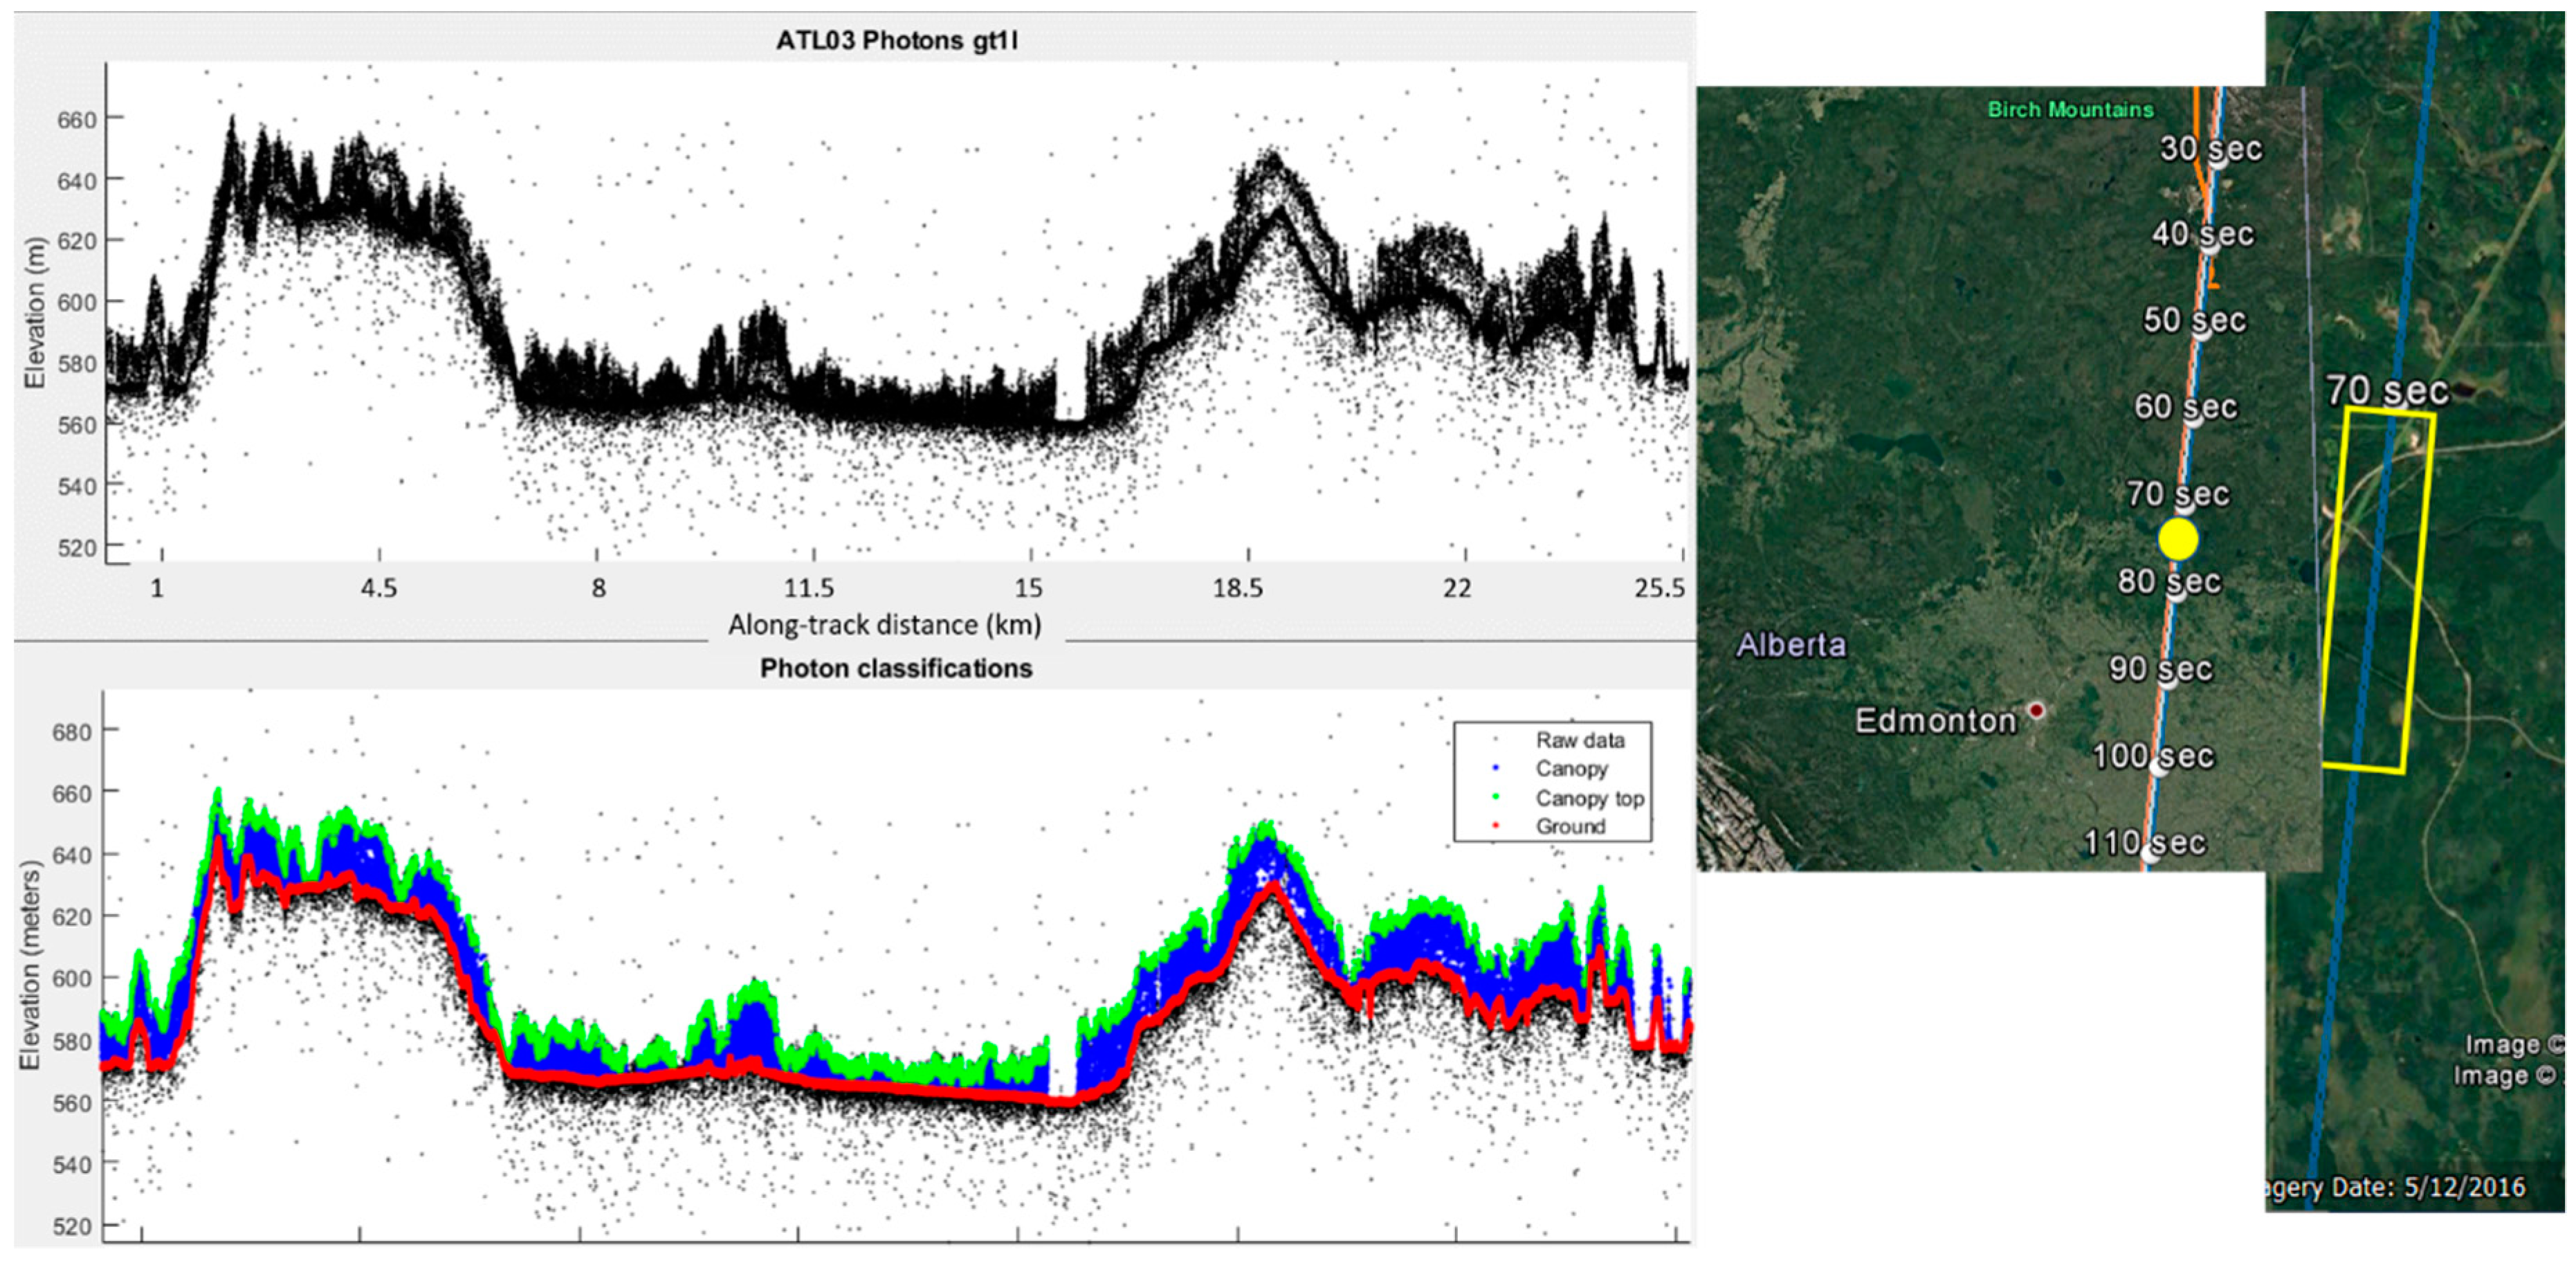
The goal of this paper is to highlight the potential of ICESat-2 for vegetation mapping over a variety of ecosystems. First, we provide a qualitative look at transects of ICESat-2 over three ecosystems; boreal forest, tropical forest, and semi-arid woodlands. Next, we provide a quantitative assessment of the accuracy of terrain and canopy height retrievals for a site in Finland. It is important to emphasize that ICESat-2 does not have the same point density compared to typical airborne lidar missions and calculations at the per-tree level are not realistic. Rather, ICESat-2 provides stand/landscape level quantification of vegetation structure. The first qualitative example of ICESat-2 data is a 25 km transect of boreal forest northeast of Edmonton, Alberta, is shown in Figure 4. The raw photons from the ATL03 data product are shown in the top panel and each dot in the figures are detected photons. Detected photons can originate from reflected laser energy as well as ambient solar background. Solar background photons can occur above and below the surface. In this example, these data were collected during the night as evidenced by the relatively low number of ambient noise photons above the surface signal photons. The bottom panel is the output from the ATL08 algorithm showing surface classification labels for ground photons (red), intermediate canopy photons (blue), and top of canopy photons (green). The panel to the right depicts the location of the ICESat-2 track in Google Earth for context.
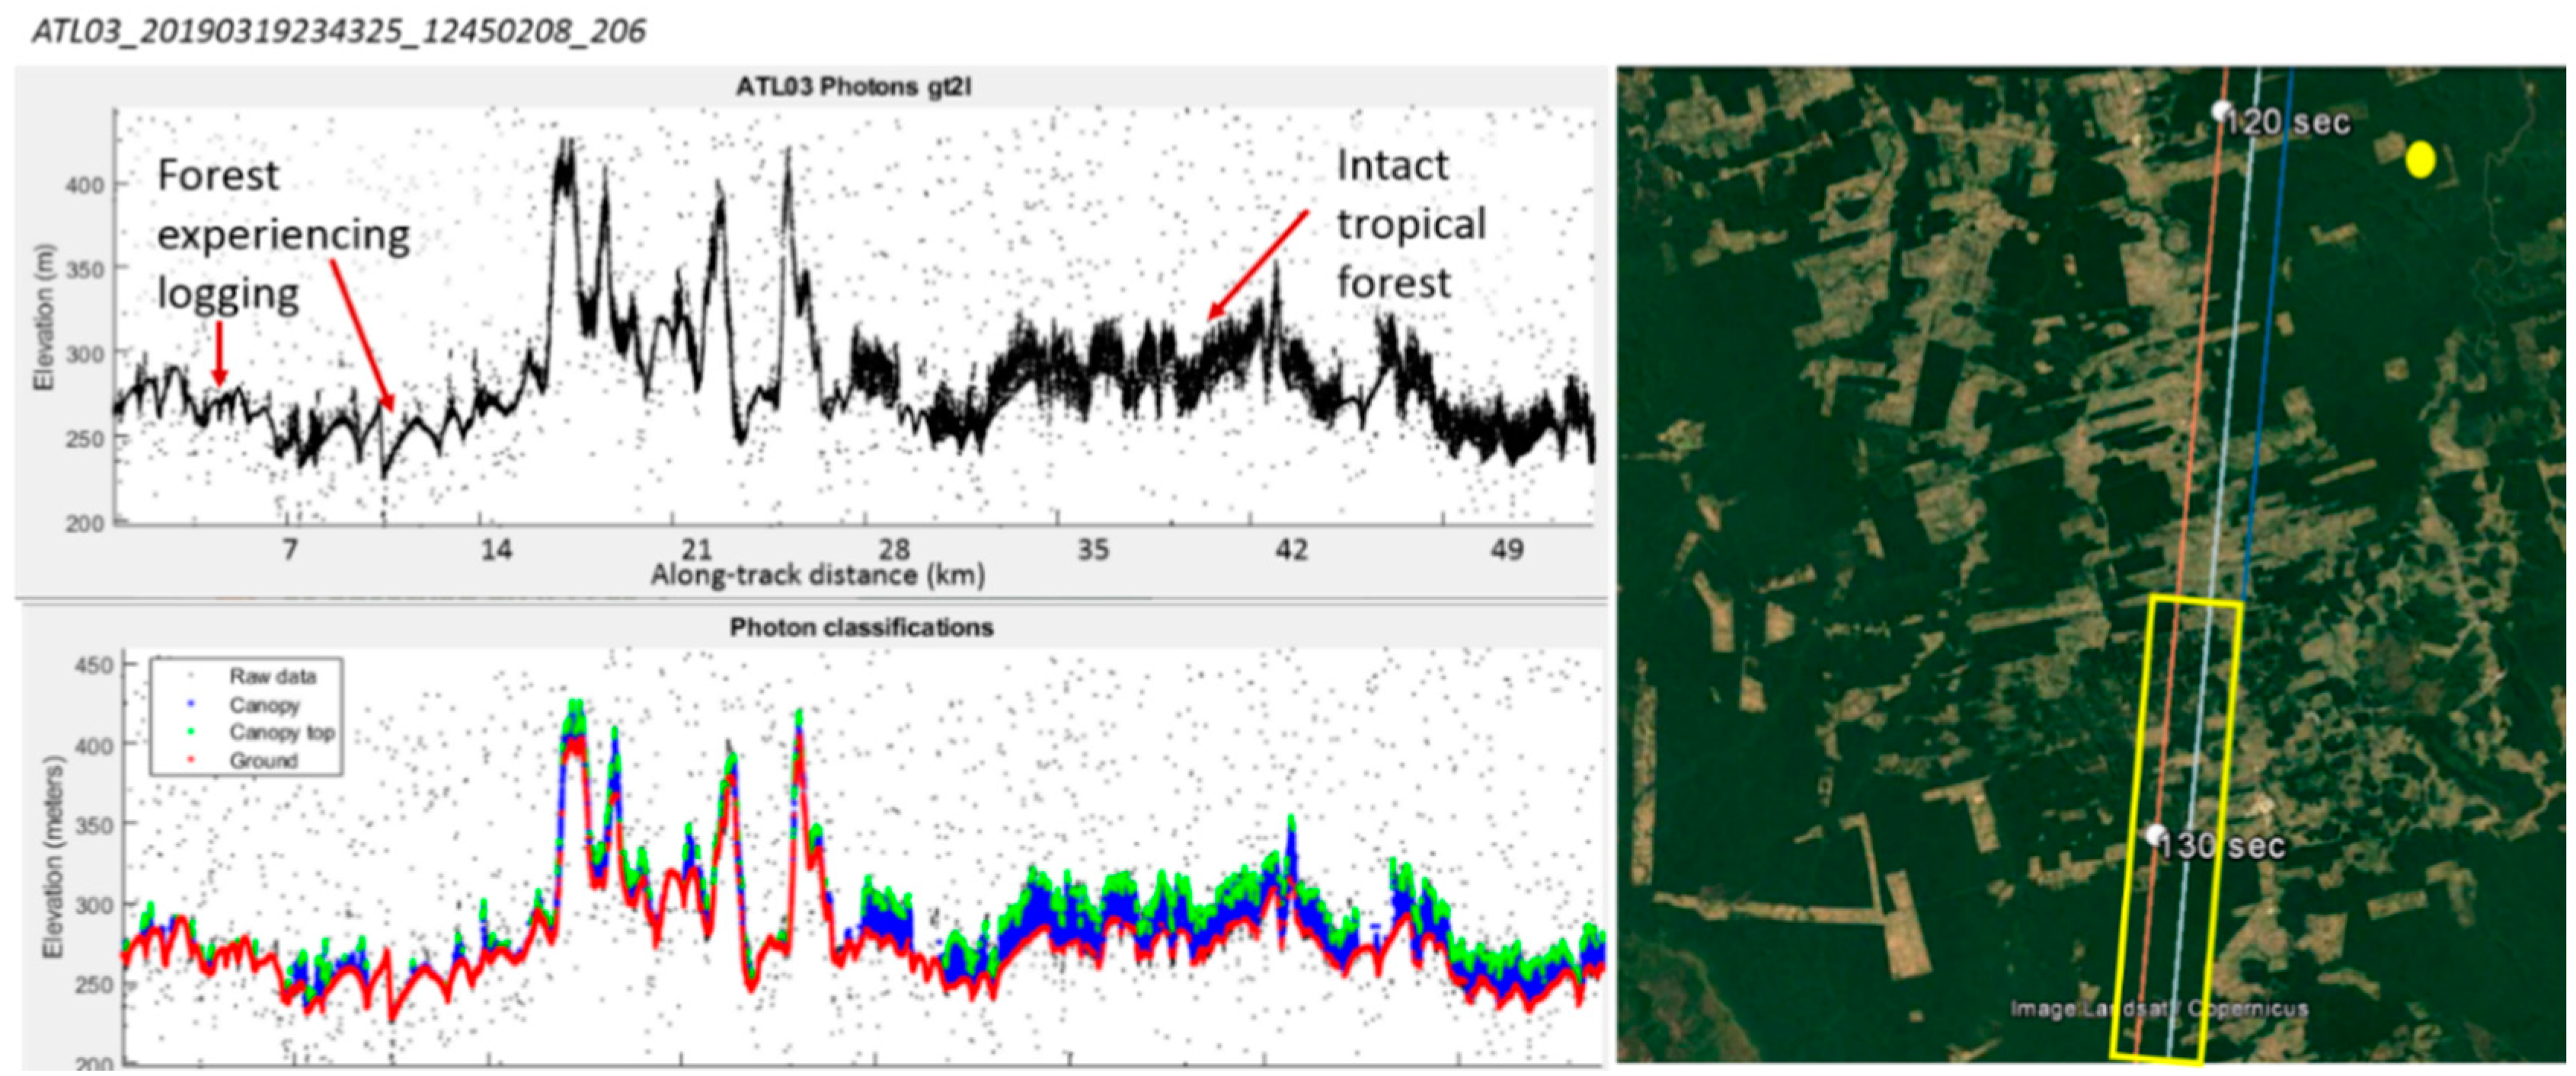
The detection of individual ICESat-2 photons from both the terrain and canopy surfaces in dense tropical forest was uncertain prior to launch. The primary challenge in tropical regions is that the multi-layered canopy often obscures a substantial amount of laser energy from reaching the ground surface. Another significant challenge to detecting photons in these environments is due to the atmospheric conditions which often attenuate the signal so much that signal photons are not discernible from the background noise. In several cases, however, atmospheric conditions at night provide an increased opportunity for estimating terrain and canopy heights in tropical forests. Early looks at the results of ICESat-2 data over the tropics highlight the ability of ATLAS to detect those small-signal returns from the terrain surface and facilitate a tree height determination. Figure 5 provides an example of where ICESat-2 data will be useful for regional estimates of disturbance in vegetation, in this case, deforestation in Brazil. Here, clear cut land is visible due to the lack of vegetation on the left side of the profile, whereas intact forest is present on the right-hand side of the profile. Detection of deforestation or forest degradation is traditionally based on the combination of multiresolution optical imagery, synthetic aperture radar (SAR) and lidar data [17,18,19,20,21]. Incorporating ICESat-2 canopy heights into regional assessments of deforestation will provide a more accurate representation of carbon fluxes for national REDD+ (reducing emissions from deforestation and forest degradation in developing countries) accounting efforts.
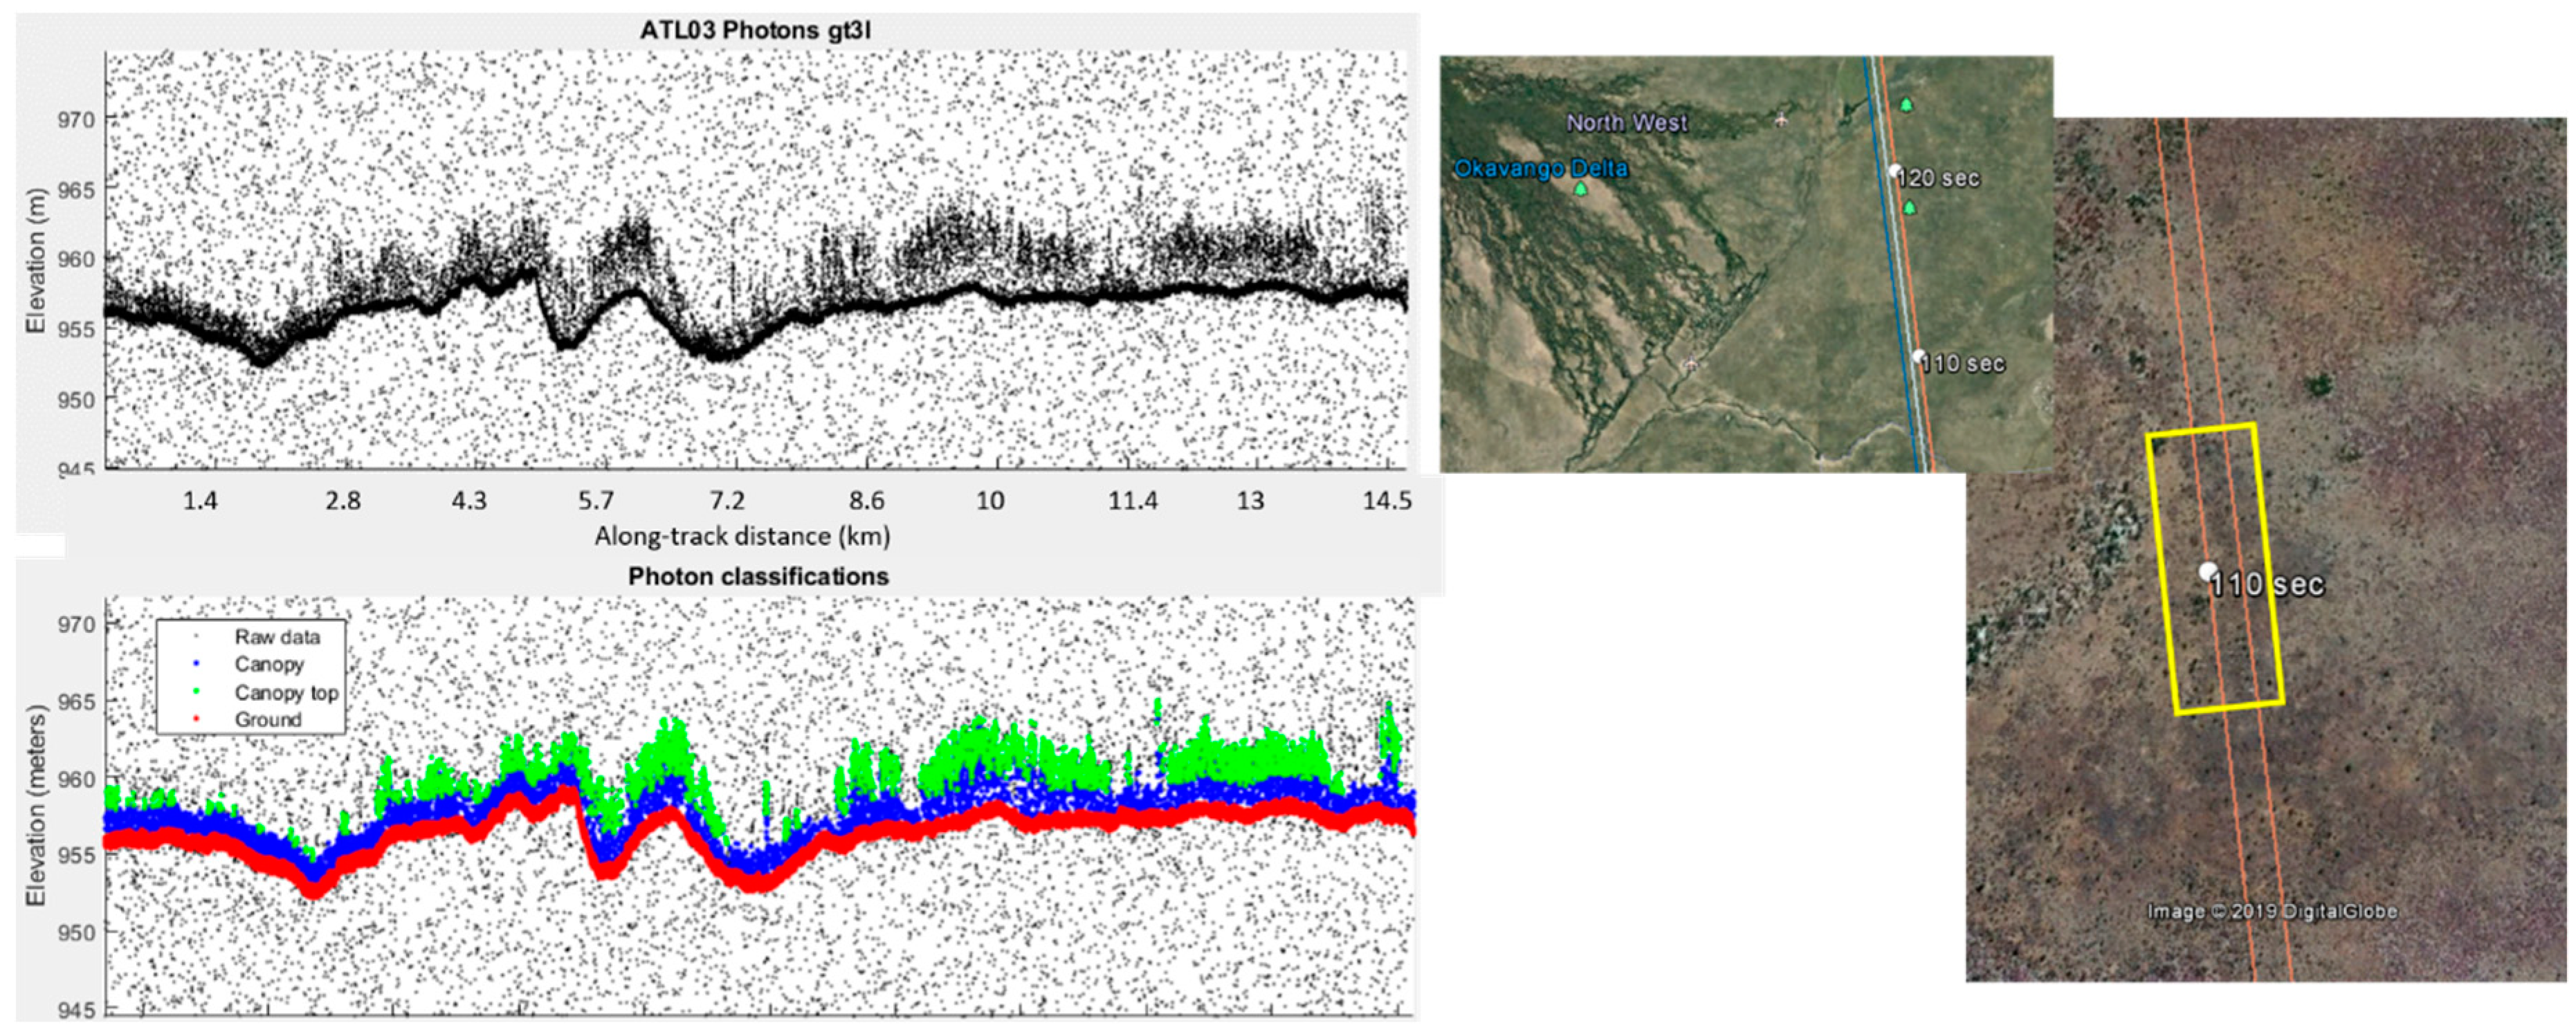
A further capability of ICESat-2 for detecting canopy height in savanna/woodland ecosystems is shown in Figure 6. This figure, located in Botswana east of the Okavango Delta, ICESat-2 estimates the heights of the Mopane and Acacia trees. This example illustrates ICESat-2’s potential to provide canopy heights from semi-arid ecosystems subsequently leading to novel and/or more accurate biomass estimation. Historically, biomass estimates of semi-arid ecosystems are derived from an empirical relationship built on optical imagery (Landsat) that have been calibrated to lidar heights or field data [23,24]. Eisfelder [23] found that the empirical relationships relating remote sensing vegetation indices and biomass were weak due to temporal and spatial differences of the optical imagery, further complicated by soil background. ICESat-2 can now directly measure heights which should reduce the uncertainty of stored carbon and carbon fluxes for these ecosystems.
These three examples indicate that canopy height estimates at the watershed level are certainly feasible for ICESat-2. It is important to highlight, however, that ICESat-2 will not have the same point density and sampling as typical to airborne lidar missions and calculations at the per-tree level are not realistic. An outstanding question, particularly for low canopy cover and short-statured ecosystems, such as boreal forest or shrublands/woodlands, is how much canopy cover is required to reflect enough photons from the top of the vegetation layer to where they are distinguishable from the ground and from the solar background noise. Future studies and analysis should answer these questions.
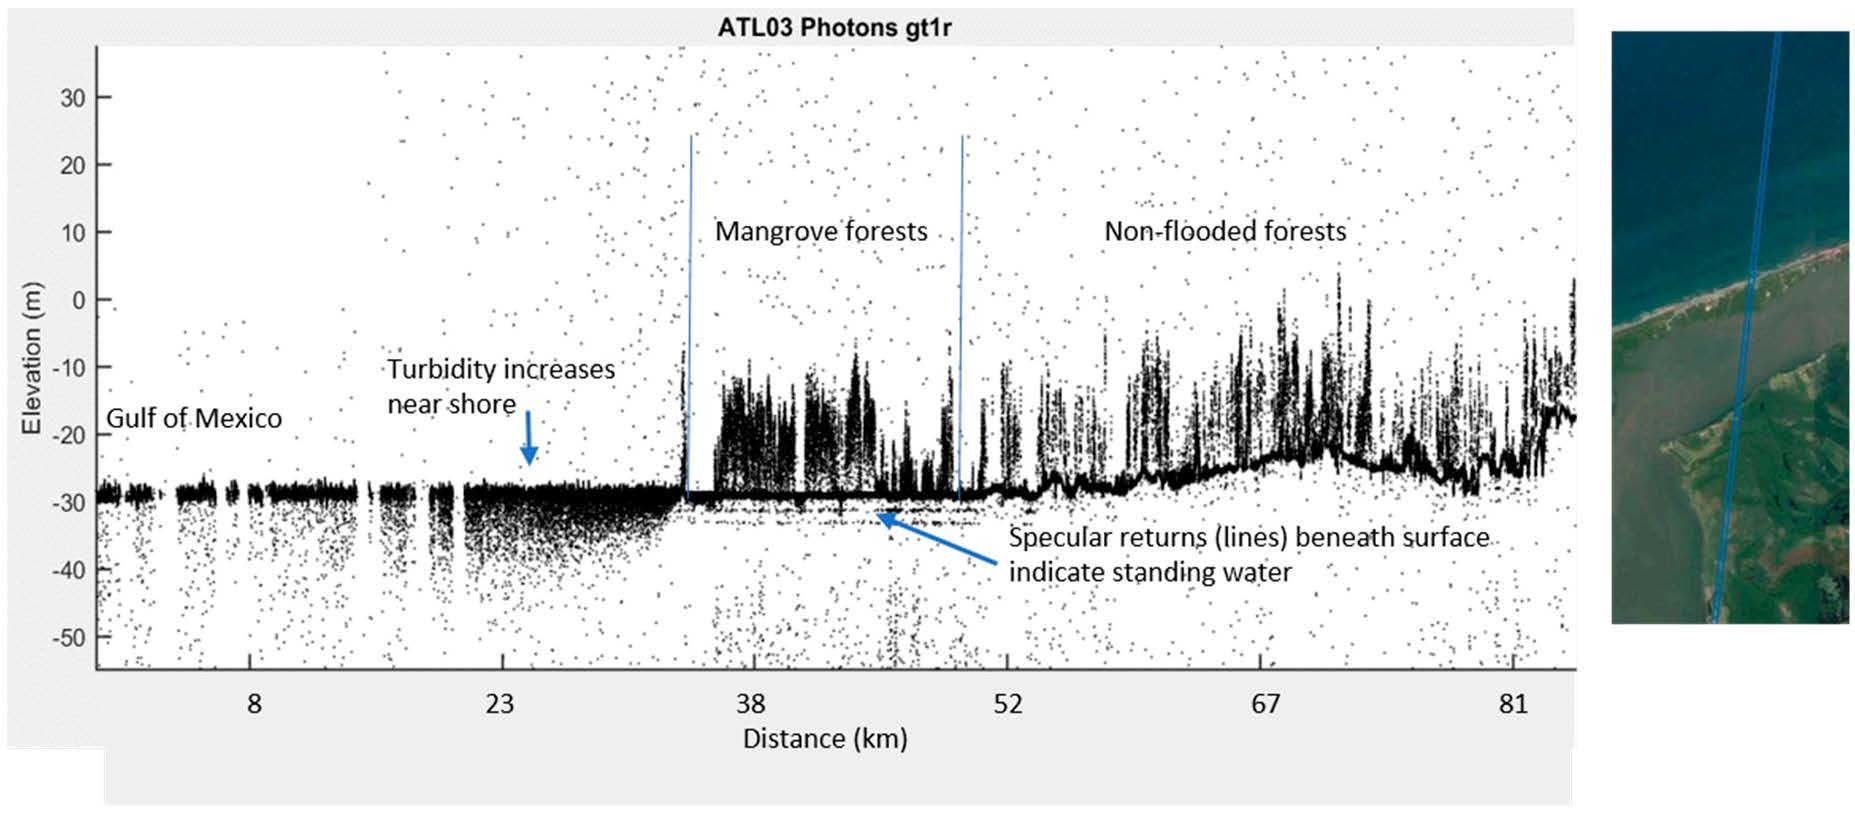
An interesting aspect observed in the ICESat-2 data is a characteristic “ringing” beneath the perceived surface in ATL03 due to specular returns over water. Small water bodies (e.g., rivers) when the surface is smooth and free from waves exhibit this characteristic. This signature has been determined to be an artifact of the detector response to high signal rates. What is particularly exciting is that this specular signature occurs even if there is vegetation present. Figure 7 highlights a profile of ICESat-2 data moving from the Gulf of Mexico to the onshore surface in Mexico. A pocket of mangrove forest is discernable from the non-flooded forest based on the presence of the below surface ringing. The potential exists for ICESat-2 to detect flooded forests or inundated lands based upon this feature.
3. Results
3.1. Geolocation Accuracy
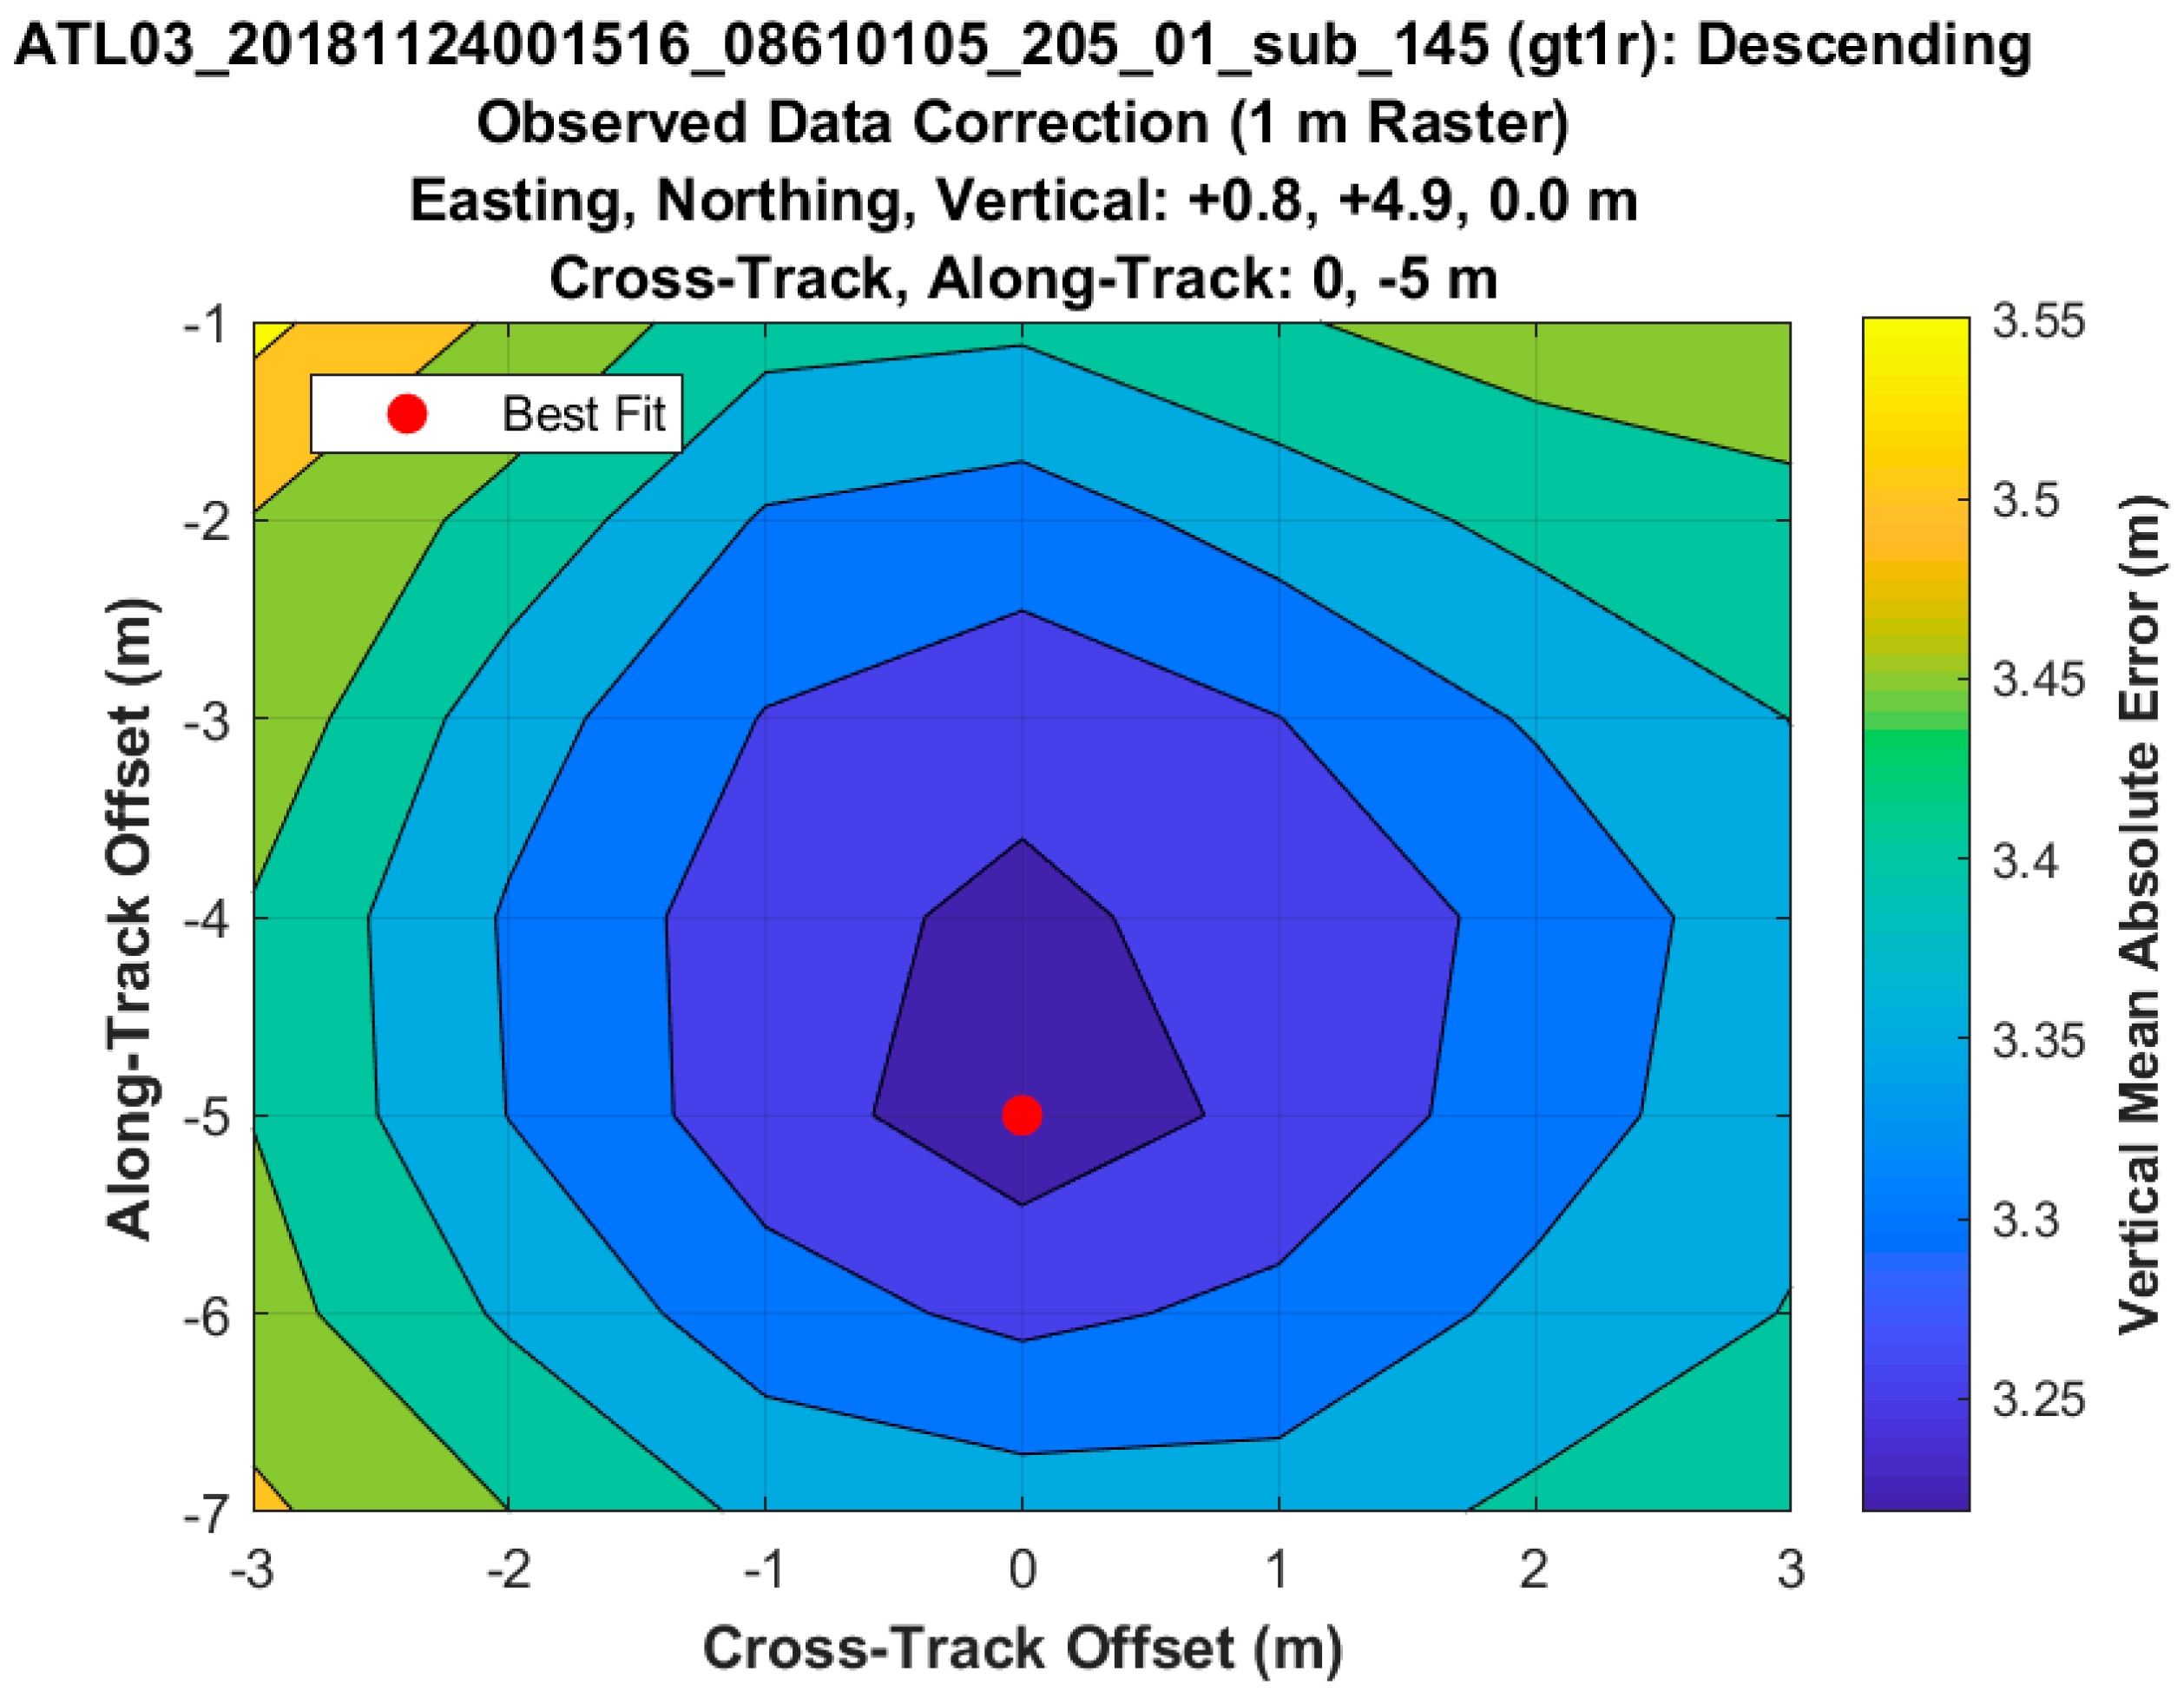
The ICESat-2 data has a geolocation knowledge mission requirement of 6.5 m. This horizontal accuracy is a function of many components that include the pointing determination error budget and the satellite orbit position uncertainties. The authors have developed a series of tools to validate the geolocation accuracy of the ICESat-2 data using comparisons to high-resolution airborne lidar datasets that are known to have accuracy levels well within the performance accuracy of a space-based system. These airborne lidar data act as ‘ground truth’ for the ICESat-2 transects to determine both horizontal and vertical biases and errors of ATLAS. A parameter provided on the ATL03 data product is a signal confidence flag that indicates the level of confidence that a photon is signal versus noise. To determine these offsets for each direction the photons with a signal confidence flag ranging from medium confidence (signal_confidence = 3) or high confidence (signal_confidence = 4) were used from the ATL03 geolocated photon point cloud. The selected signal photons from ATL03 are plotted against a gridded terrain surface derived from the airborne lidar data. The ICESat-2 selected signal photons are moved in the cross-track and along-track direction recursively within the ground truth data such that the vertical error is minimized. The geolocation accuracy for an ICESat-2 track over Finland, using the preliminary data release (release 001) is shown in Figure 8. The plot in Figure 8 shows that the minimum mean absolute error in the Z direction is used to determine the along-track and cross-track offsets. For this example, ICESat-2 had an error of 0 m in the cross-track direction and -5 m in the along-track direction. The ATL03 photons also exhibited a 0 m vertical offset with a 3.25 m RMSE (error of the fit) compared to the airborne lidar data.
3.2. Terrain Height Accuracy
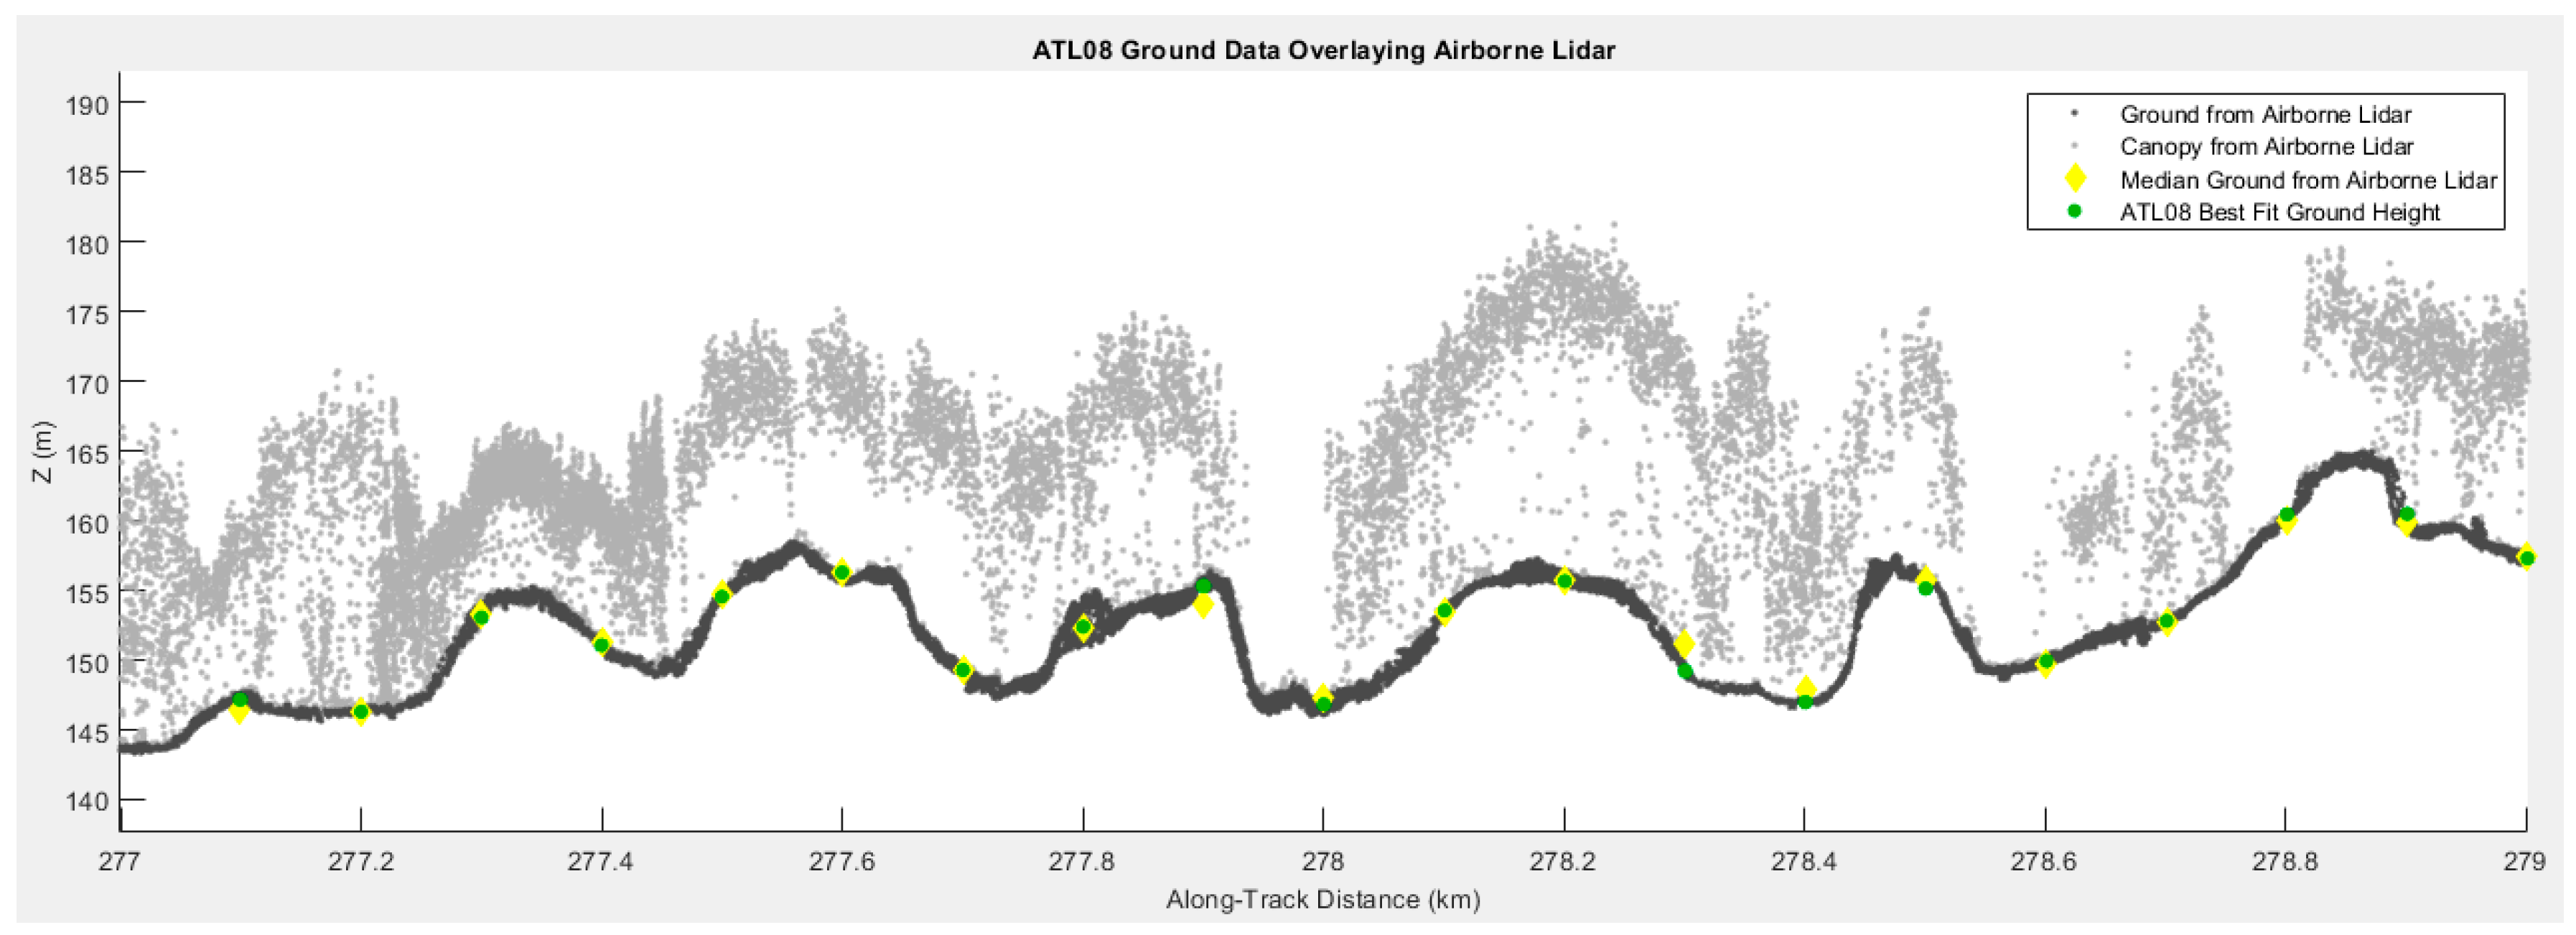
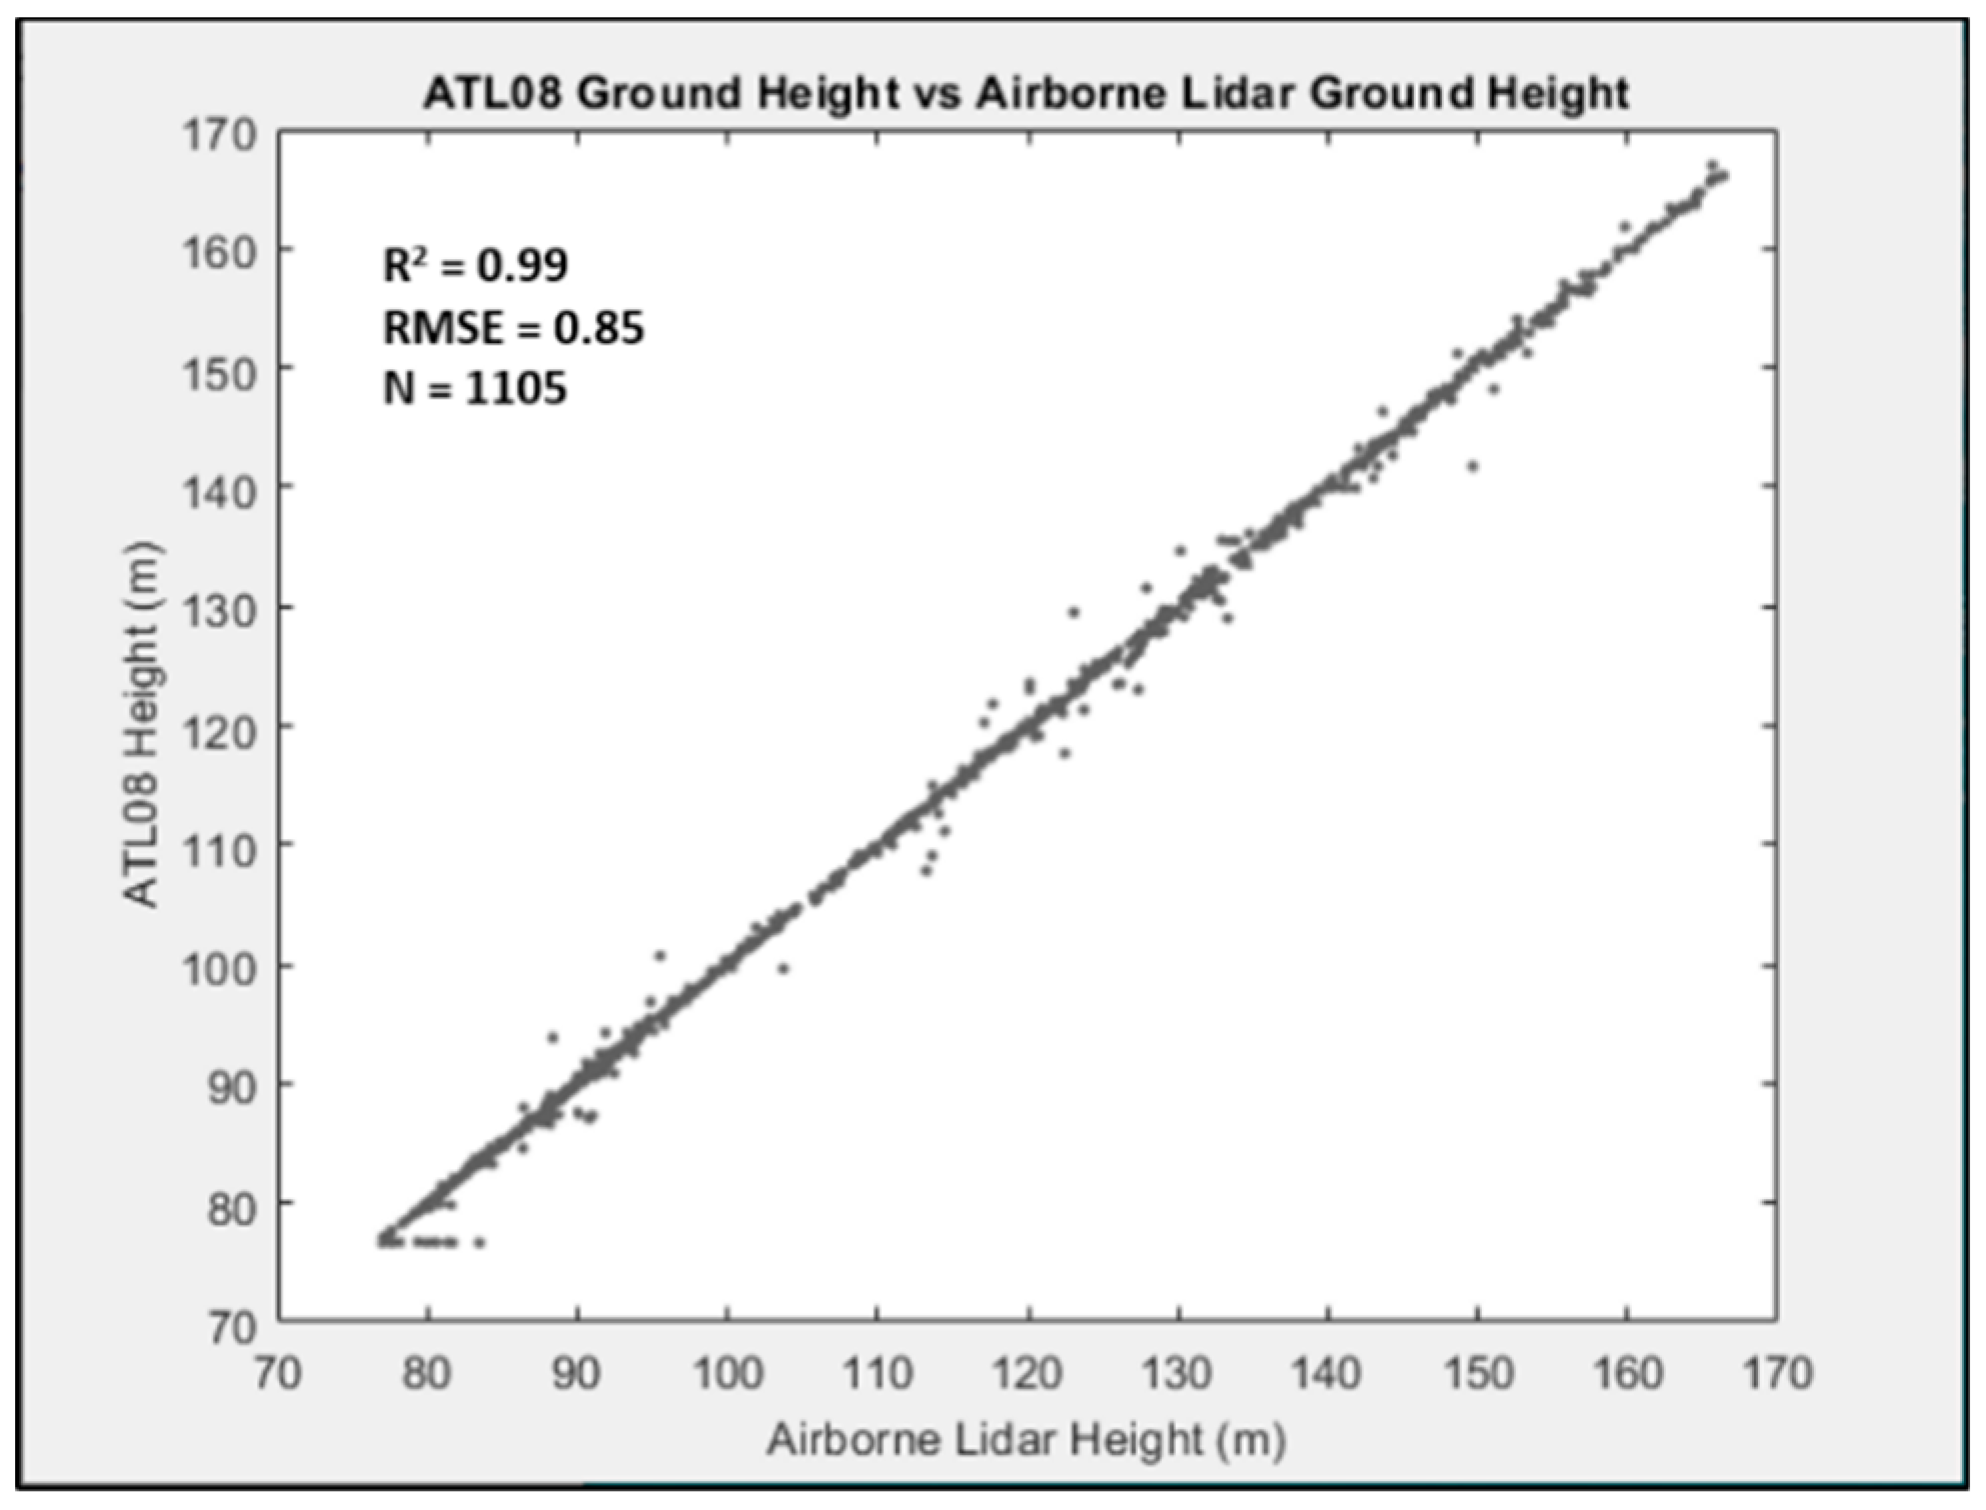
A challenge of validating terrain and canopy height estimates derived from ICESat-2 is having a large expanse of truth data to compare against such that a large sample size can be obtained. For this analysis, airborne lidar data were retrieved from the National Land Survey of Finland (https://tiedostopalvelu.maanmittauslaitos.fi/tp/kartta?lang=en) as lidar data from the entire country are available. These airborne lidar data were acquired in 2014 and have a point density of approximately 1 pt/m2 and a vertical precision of 0.12 m. Although the airborne lidar data are not temporally coincident with ICESat-2, the availability of airborne lidar data for the entire country makes it feasible to validate ATL08 at a large scale. For the ICESat-2 track used in this analysis, approximately 110 km of the 200 km worth of ATL08 data had matching airborne lidar data. For the ICESat-2 track over Finland shown in Figure 8, the ATL08 estimated terrain heights and canopy heights were compared against airborne lidar values. With the geolocation offsets determined as 0 m and 5 m in the cross-track and along-track direction, the ICESat-2 data is first aligned to match the geolocation of the airborne lidar. All airborne lidar data falling within a 100 x 14 m box about each ATL08 segment center longitude and latitude are extracted for the validation process. On the ATL08 data product, the terrain and canopy parameters are calculated at the 100 m step size based upon how the photons are labeled. For example, the ATL08 estimated median terrain height (h_te_median) is calculated as the median height for all photons labeled as terrain within that 100 m segment. In addition to the ATL08 median terrain height, a slope corrected best-fit terrain height (h_te_BestFit) is also reported on the ATL08 data product. In the ATL08 terrain validation, we compare the ATL08 median terrain height and the ATL08 best-fit terrain height against the median terrain height from the airborne lidar data. There were 1105 100 m ATL08 samples used to generate the statistics, however, a 2 km subset of the 200 km worth of ATL08 data over Finland is plotted with the airborne lidar data as a backdrop in Figure 9. The airborne lidar data are partitioned into ground points (shown as dark grey) and canopy points (shown as light grey). The partitioning of the airborne lidar data in this manner allows for more accurate validation of ATL08. The initial results of the terrain validation for this ICESat-2 track over Finland indicate that the terrain residuals have a mean absolute error of less than 0.5 m (median = 0.37 m; best fit = 0.39 m). For this particular track, the RMSE for the ATL08 median terrain height and best fit terrain height are 0.85 m and 0.82 m, respectively. The ATL08 terrain height and airborne lidar terrain height are highly correlated (R2 = 0.99) and this relationship is shown in Figure 10.
3.3. Canopy Height Accuracy
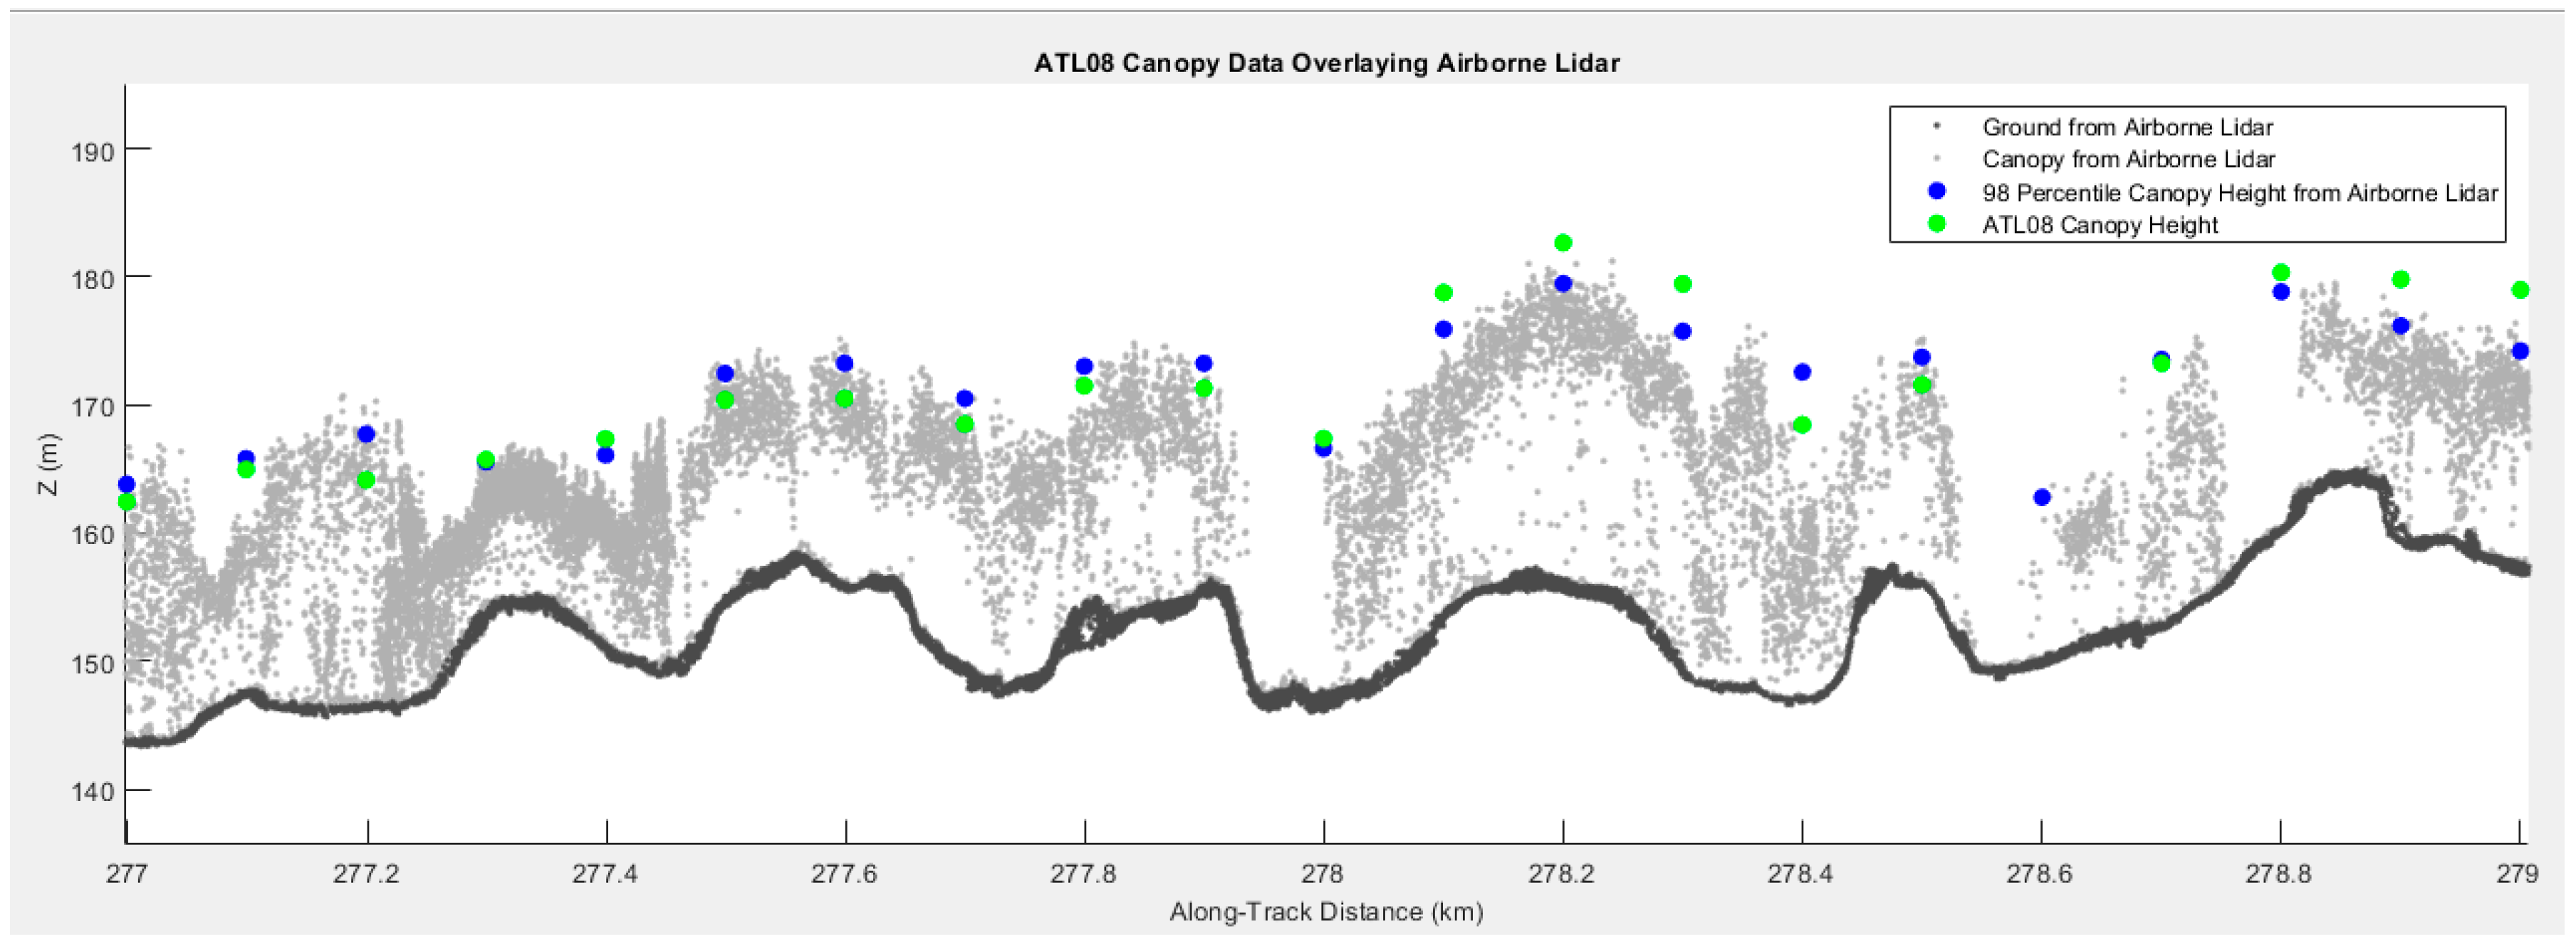
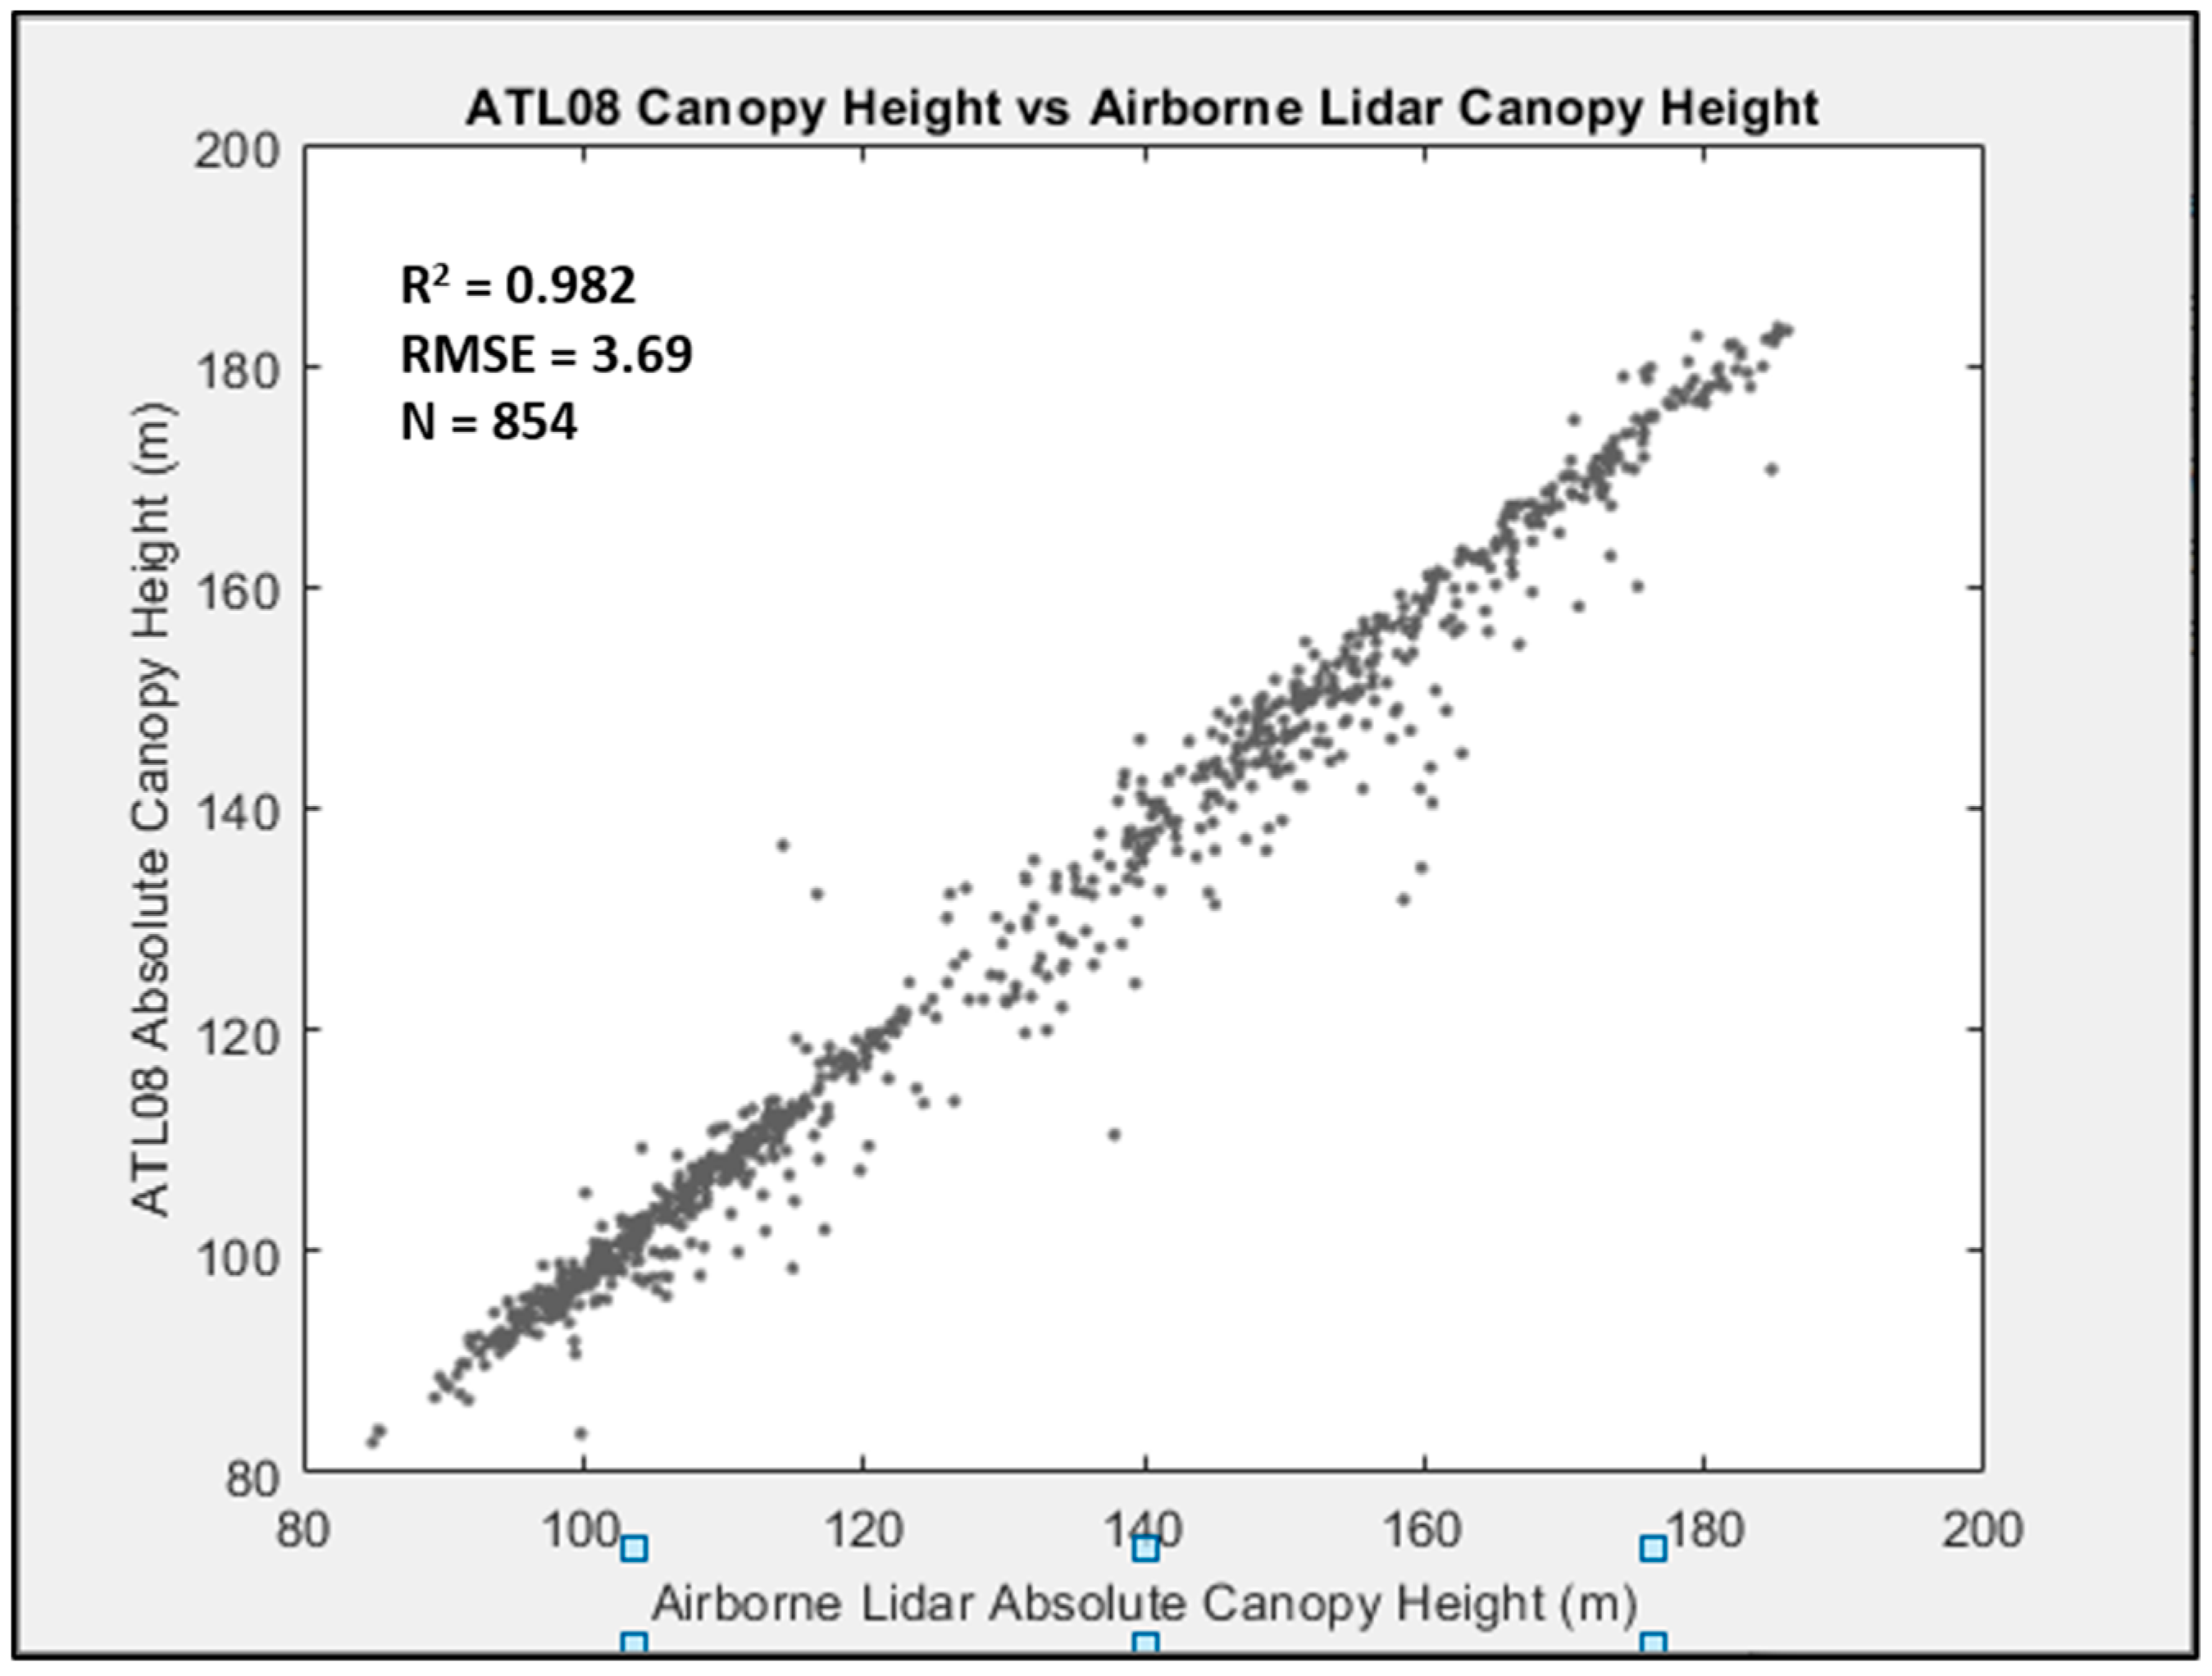
The ATL08 product parameter for canopy height (h_canopy_abs) is defined as the 98th percentile canopy height above the reference ellipsoid, and was compared to the 98th percentile canopy height value from the airborne lidar survey above the reference ellipsoid to validate the satellite observations. The 98th percentile canopy height for the truth data was calculated on all canopy points falling within 100 × 14 m box about the ATL08 coordinate. The same 2 km subset of the 200 km worth of ATL08 data over Finland indicating the top of canopy height retrievals is shown in Figure 11. A scatterplot of all 854 canopy height estimates is shown in Figure 12. The initial results of the absolute canopy height validation for this ICESat-2 track over Finland indicate that the absolute canopy height residuals have a mean absolute error of approximately 3.2 m. For this particular track, the RMSE for the ATL08 canopy height is 3.69 m. When considering the validation of vegetation height, there are several factors that can influence the interpreted errors. A significant consideration is the temporal difference between the airborne lidar acquisition and the ATL08 heights acquired November 24, 2018. For this example, the airborne lidar data were collected in 2014. For some of the 100 m segments, the ATL08 height is above the airborne lidar canopy height, and for other segments, the ATL08 canopy height is below the airborne lidar canopy height. Based on the relatively low sampling rate, we would anticipate that ATL08 heights fall below the true top of the canopy. Unfortunately, due to the temporal difference between the airborne lidar and ICESat-2 acquisition, it is difficult to surmise whether the errors are a true measurement error or if they are due to change. Canopy height estimates from the ICESat/GLAS instrument reported accuracies ranging from 3–8.5 m [12,28] in areas of low topographic relief.
4. Discussion
The data highlighted in this paper are from the first release (v001) of the ICESat-2 data products and are available from NSIDC (https://nsidc.org/data/icesat-2). A list of known issues for the ATL08 product relevant to this first release is also available with the ATL08 data product at NSIDC. This list highlights issues such as clouds, signal attenuation, and ill selected parameters on the ground finding algorithm that could lead to a misinterpretation of the data product. As this is the first release of the ATL08 data product, the data quality and software will improve over time. Prior to launch, the ATL08 algorithm was developed on simulated data as there had not previously been a photon detecting laser system operated from space. Now that actual on-orbit data are available, a few minor modifications to the ATL08 algorithm are required and the majority of those modifications will be completed by the second release. It is anticipated that many of the issues that may be observed with release v001 will be mitigated in release v002. In addition to software modifications, any laser ranging system requires calibration and the data released as release v001 do not have a ranging calibration applied yet to the measurements. Proper ranging calibration requires a comprehensive characterization of the orbital variations throughout the year. Although the data from release v001 do not yet have a ranging calibration applied, we feel they are still quite extraordinary, and we are excited to see the application of these data to a wide range of science investigations.
5. Conclusions
A new space-based laser altimetry mission, ICESat-2, was launched in September 2018 by NASA and data from this mission are poised to provide a comprehensive estimation of global terrain and canopy heights. ICESat-2’s primary science objectives are focused on the cryosphere, however, ranging measurements are collected globally over all surface types, including forests, oceans, lakes, and land. Although ICESat-2 is not a mapping mission nor does it provide data at the same resolution as an airborne lidar survey, data from ICESat-2 will provide global coverage of terrain and vegetation height at the stand level and is highly suitable for regional studies. Several examples of ICESat-2 data over boreal forest, tropical forest, and semi-arid woodlands are highlighted in this first look.
The quantitative results shown here indicate the geolocation accuracy and data product accuracy for one ICESat-2 granule. Over time, the results from multiple locations will help to build a more accurate representation of the performance of ICESat-2 for characterizing terrain and canopy for a variety of landscapes and ecosystems. Additionally, these first looks of the preliminary ICESat-2 data quality do not contain the comprehensive calibrations, particularly for ranging (vertical accuracy). These calibrations require orbital characterization over time. However, this first look at the geolocation knowledge of the satellite indicates that the performance is within the mission requirement of 6.5 m (horizontal). Future analysis will quantitatively assess the data over additional ecosystem examples to understand the true capability of the satellite for estimating terrain and canopy height. These further studies will also reveal new discoveries associated with signal response characteristics with respect to surface type identification and feature extraction, as the example of the mangrove forest indicated.
Author Contributions
Both authors contributed to the analysis of the data and the writing of the manuscript.
Funding
This research was carried out at the Applied Research Laboratories at the University of Texas at Austin. Research was funded by NASA grants NNX15AC68G (PI Magruder), and NNX15AE28G (PI Neuenschwander) for their role on the ICESat-2 Science Definition Team. Neuenschwander has led the development of the ATL08 data product for ICESat-2 and Magruder serves as the science team leader for ICESat-2.
Acknowledgments
We thank our team at University of Texas at Austin: Mike Alonzo, Eric Guenther, Michael Wharton and Brad Klotz in addition to our support from the NASA GSFC Project Science Office: Tom Neumann, David Hancock, and Jeff Lee. We hold extra thanks and appreciation to Ben Jelley for his implementation of the ATL08 algorithm to the NASA ICESat-2 processing software.
Conflicts of Interest
The authors declare no conflict of interest.
References
- Abdalati, W.; Zwally, H.J.; Binschadler, R.; Csatho, B.; Farrell, S.; Fricker, H.; harding, D.; Kwok, R.; Lefsky, M.; Markus, T.; et al. The ICESat-2 laser altimetry mission. Proc. IEEE 2010, 98, 735–751. [Google Scholar] [CrossRef]
- Markus, T.; Neumann, T.; Martino, A.; Abdalati, W.; Brunt, K.; Csatho, B.; Farrell, S.; Fricker, H.; Gardner, A.; Harding, D.; et al. The Ice, cloud, and land elevation satellite-2 (ICESat-2): Science requirements, concept, and implementation. Remote Sens. Environ. 2017, 190, 260–273. [Google Scholar] [CrossRef]
- Schimel, D.; Pavlick, R.; Fisher, J.; Asner, G.; Saatchi, S.; Townsend, P.; Miller, C.; Frankenberg, C.; Hibbard, K.; Cox, P. Observing terrestrial ecosystems and the carbon cycle from space. Glob. Chang. Biol. 2015, 21, 1762–1776. [Google Scholar] [CrossRef] [PubMed]
- Andersen, H.E.; McGaughey, R.; Reutebuch, S. Estimating forest canopy fuel parameters using LIDAR data. Remote Sens. Environ. 2005, 94, 441–449. [Google Scholar] [CrossRef]
- Anderson, J.; Martin, M.; Smith, M.; Dubayah, R.; Hofton, M.; Hyde, P.; Peterson, B.; Blair, J.; Knox, R.G. The use of waveform lidar to measure northern temperate mixed conifer and deciduous forest structure in New Hampshire. Remote Sens. Environ. 2006, 105, 248–261. [Google Scholar] [CrossRef]
- Kane, V.; McGaughey, R.; Bakker, J.; Gersonde, R.; Lutz, J.; Franklin, J. Comparisons between field and lidar based measures of stand structural complexity. Can. J. Res. 2010, 40, 761–773. [Google Scholar] [CrossRef]
- Bergen, K.; Goetz, S.; Dubayah, R.; Henebry, G.; Hunsaker, C.; Imhoff, M.; Nelson, R.; Parker, G.; Radeloff, V. Remote sensing of vegetation 2-D structure for biodiversity and habitat: Review and implications for lidar and radar spaceborne missions. J. Geophys. Res. Biogeosci. 2009, 114. [Google Scholar] [CrossRef]
- Wulder, M.; White, J.; Nelson, R.; Naesset, E.; Ole Orka, H.; Coops, N.; Hilker, T.; Bater, C.; Gobakken, T. Lidar sampling for large-area forest characterization: A review. Remote Sens. Environ. 2012, 121, 196–209. [Google Scholar] [CrossRef] [Green Version]
- Shugart, H.; Saatchi, S.; Hall, F. Importance of structure and its measurement in quantifying function of forest ecosystems. J. Geophys. Res. Biogeosci. 2010, 115. [Google Scholar] [CrossRef]
- Lefsky, M.; Keller, M.; Pang, Y.; deCamargo, P.; Hunter, M. Revised method for forest canopy height estimation from geoscience laser altimeter system waveforms. J. Appl. Remote Sens. 2007, 1, 013537. [Google Scholar] [CrossRef]
- Nelson, R.; Ranson, K.; Sun, G.; Kimes, D.; Kharuk, V.; Montesano, P. Estimating Siberian timber volume using MODIS and ICESat/GLAS. Remote Sens. Environ. 2009, 113, 691–701. [Google Scholar] [CrossRef]
- Bolton, D.; Coops, N.; Wulder, M. Investigating the agreement between global canopy height maps and airborne lidar derived height estimates over Canada. Can. J. Remote Sens. 2014, 39, S129–S151. [Google Scholar] [CrossRef]
- Neuenschwander, A.; Pitts, K. The ATL08 land and vegetation product for the ICESat-2 Mission. Remote Sens. Environ. 2019, 221, 247–259. [Google Scholar] [CrossRef]
- Neuenschwander, A.L.S.C.; Popescu, R.F.; Nelson, D.; Harding, K.L. Pitts; Robbins, J. ATLAS/ICESat-2 L3A Land and Vegetation Height, Version 1. Algorithm Theoretical Basis Document. 2019. Available online: https://nsidc.org/data/icesat-2 (accessed on 28 May 2019).
- Neumann, T.A.; Martino, T.; Markus, S.; Bae, M.R.; Bock, A.C.; Brenner, K.M.; Brunt, J.; Cavanaugh, S.T.; Fernandes, D.W.; Hancock, K.; et al. The Ice, Cloud, and land Elevation Satellite—2 Mission: A Global Geolocated Photon Product. Remote Sens. Environ. 2019. Submitted. [Google Scholar]
- National Snow and Ice Data Center. Boulder, CO, USA. Available online: https://nsidc.org. ATL08_20190212052542_06990206_r001 (accessed on 28 May 2019). [CrossRef]
- Fuller, D. Tropical forest monitoring and remote sensing: A new era of transparency in forest governance. Singap. J. Trop. Geogr. 2006, 27, 15–29. [Google Scholar] [CrossRef]
- Beuchele, R.; Grecchi, R.; Shimabukuro, Y.; Seliger, R.; Eva, H.; Sano, E.; Achard, F. Land cover changes in the Brazilian cerrado and caatinga biomes from 1990 to 2010 based on a systematic remote sensing sampling approach. Appl. Geogr. 2015, 58, 116–127. [Google Scholar] [CrossRef]
- Goetz, S.; Hansen, M.; Houghton, R.; Walker, W.; Laporte, N.; Busch, J. Measurement and monitoring needs, capabilities and potential for addressing reduced emissions from deforestation and forest degradation under REDD+. Environ. Res. Lett. 2015, 10, 123001. [Google Scholar] [CrossRef]
- Reiche, J.; Verbesselt, J.; Hoekman, D.; Herold, M. Fusing Landsat and SAR time series to detect deforestation in the tropics. Remote Sens. Environ. 2015, 156, 276–293. [Google Scholar] [CrossRef]
- Mitchell, A.; Rosenqvist, A.; Mora, B. Current remote sensing approaches to monitoring forest degradation in support of countries measurement, reporting and verification (MRV) systems for REDD+. Carbon Balance Manag. 2017, 12, 9. [Google Scholar] [CrossRef]
- National Snow and Ice Data Center. Boulder, CO, USA. Available online: https://nsidc.org/data/icesat-2. ATL08_20190319234325_12450208_r001 (accessed on 28 May 2019). [CrossRef]
- Eisfelder, C.; Kuenzer, C.; Dech, S. Derivation of biomass information for semi-arid areas using remote sensing data. Int. J. Remote Sens. 2011, 33, 2937–2984. [Google Scholar] [CrossRef]
- Lucas, R.; Mitchel, A.; Armston, J. Measurement of Forest above ground biomass using active and passive remote sensing at large (subnational to global) scales. Curr. For. Rep. 2015, 1, 162–177. [Google Scholar] [CrossRef]
- National Snow and Ice Data Center. Boulder, CO, USA. Available online: https://nsidc.org/data/icesat-2. ATL08_20190203083806_05630214_r001 (accessed on 28 May 2019). [CrossRef]
- National Snow and Ice Data Center. Boulder, CO, USA. Available online: https://nsidc.org/data/icesat-2. ATL08_20181019093533_03170107_r001 (accessed on 28 May 2019). [CrossRef]
- National Snow and Ice Data Center. Boulder, CO, USA. Available online: https://nsidc.org/data/icesat-2. ATL08_20181124001516_08610105_r001 (accessed on 28 May 2019). [CrossRef]
- Lefsky, M. A global forest canopy height map from the Moderate Resolution Imaging Spectroradiometer and the Geoscience Laser Altimeter System. Geophys. Res. Lett. 2010, 37. [Google Scholar] [CrossRef] [Green Version]
Figure 1.
The distribution of gross primary production and total carbon storage as a function of latitude (copyright [3]).
Figure 1.
The distribution of gross primary production and total carbon storage as a function of latitude (copyright [3]).

Figure 2.
Ice, Cloud, and Land Elevation Satellite-2 (ICESat-2) beam configuration on the Earth’s surface.
Figure 2.
Ice, Cloud, and Land Elevation Satellite-2 (ICESat-2) beam configuration on the Earth’s surface.

Figure 3.
Conceptual illustration depicting photon sampling over vegetation.

Figure 4.
Top panel. Profile of 25 km of ATL03 photons from strong beam (GT1L) over boreal forest northeast of Edmonton, Alberta. These data were collected on 21 February 2019 during the night, as evidenced by the relatively low number of noise photons above the surface signal photons. The bottom panel is the result of the ATL08 algorithm surface classification labels for ground photons (red), intermediate canopy photons (blue), and top of canopy photons (green) The panel to the right depicts the location of the ICESat-2 track in Google Earth for context [14,16].

Figure 5.
Deforestation in Brazil. The top panel of approximately 50 km of ATL03 photons from the strong beam of track 2 (GT2L) over tropical forest in Brazil acquired 19 March 2019. The bottom panel is the result of the ATL08 algorithm surface classification labels for ground photons (red), intermediate canopy photons (blue), and top of canopy photons (green). The panel to the right depicts the location of the ICESat-2 track in Google Earth for context [14,22].

Figure 6.
Canopy height mapping of savanna/woodland vegetation. The top panel of approximately 14 km of ATL03 photons from the strong beam of track 3 (GT3L) over Mopane woodlands in Botswana acquired on 3 February 2019. The bottom panel is the result of the ATL08 algorithm surface classification labels for ground photons (red), intermediate canopy photons (blue), and top of canopy photons (green). The panel to the right shows the ICESat-2 tracks across the landscape for context [14,25].

Figure 7.
Profile of ICESat-2 data over mangrove forest stand in Mexico highlight a unique characteristic of photons from specular returns [14,26]. In some instances, these specular returns can be used to identify standing water or potentially saturated soils.

Figure 8.
Geolocation accuracy plot indicating the absolute accuracy of the ICEsat-2 data compared to an airborne lidar survey from Finland.
Figure 8.
Geolocation accuracy plot indicating the absolute accuracy of the ICEsat-2 data compared to an airborne lidar survey from Finland.

Figure 9.
A subset of the ATL08 terrain height validation results from track ATL08_20181124001516_08610105 over Finland. The airborne lidar point cloud (truth) are shown as grey dots where the canopy and terrain points have been isolated [14,27]. The median terrain height derived from the airborne lidar data are shown in yellow, and the ATL08 Best Fit terrain height is shown as green.

Figure 10.
Scatterplot of ATL08 median terrain height compared to airborne lidar median terrain height within the 100 m segment for the full 200 km of analyzed data.
Figure 10.
Scatterplot of ATL08 median terrain height compared to airborne lidar median terrain height within the 100 m segment for the full 200 km of analyzed data.

Figure 11.
A subset of the ATL08 Canopy height validation results from track ATL08_20181124001516_08610105 over Finland [14,27]. The airborne lidar point cloud (truth) are shown as grey dots where the canopy and terrain points have been isolated as light and dark shades of grey. The ATL08 canopy height (green dot) and the airborne lidar canopy height (blue dot) are plotted at the 100 m step size.

Figure 12.
Scatterplot of ATL08 absolute canopy height compared to airborne lidar absolute top of canopy height within the 100 m segment for the full 200 km of analyzed data.
Figure 12.
Scatterplot of ATL08 absolute canopy height compared to airborne lidar absolute top of canopy height within the 100 m segment for the full 200 km of analyzed data.

© 2019 by the authors. Licensee MDPI, Basel, Switzerland. This article is an open access article distributed under the terms and conditions of the Creative Commons Attribution (CC BY) license (http://creativecommons.org/licenses/by/4.0/).
Share and Cite
MDPI and ACS Style
Neuenschwander, A.L.; Magruder, L.A. Canopy and Terrain Height Retrievals with ICESat-2: A First Look. Remote Sens. 2019, 11, 1721. https://doi.org/10.3390/rs11141721
AMA Style
Neuenschwander AL, Magruder LA. Canopy and Terrain Height Retrievals with ICESat-2: A First Look. Remote Sensing. 2019; 11(14):1721. https://doi.org/10.3390/rs11141721
Chicago/Turabian StyleNeuenschwander, Amy L., and Lori A. Magruder. 2019. "Canopy and Terrain Height Retrievals with ICESat-2: A First Look" Remote Sensing 11, no. 14: 1721. https://doi.org/10.3390/rs11141721
Note that from the first issue of 2016, this journal uses article numbers instead of page numbers. See further details here.