Crustal Deformation on the Northeastern Margin of the Tibetan Plateau from Continuous GPS Observations
by
 , ,
, ,
Xiaoning Su
1,2 ,
,
Lianbi Yao
1,*,
Weiwei Wu
2,
Guojie Meng
2,
Lina Su
3,
Renwei Xiong
2 and
Shunying Hong
2 1
College of Surveying and Geo-informatics, Tongji University, Shanghai 200092, China
2
Key Laboratory of Earthquake Prediction, Institute of Earthquake Forecasting, China Earthquake Administration, Beijing 100036, China
3
Shaanxi Earthquake Agency, Xi’an 710068, China
*
Author to whom correspondence should be addressed.
Remote Sens. 2019, 11(1), 34; https://doi.org/10.3390/rs11010034
Submission received: 25 November 2018
/
Revised: 21 December 2018
/
Accepted: 23 December 2018
/
Published: 26 December 2018
(This article belongs to the Special Issue Remote Sensing of Tectonic Deformation)
Abstract
:We installed 10 continuous Global Positioning System (GPS) stations on the northeast margin of the Tibetan Plateau at the end of 2012, in order to qualitatively investigate strain accumulation across the Liupanshan Fault (LPSF). We integrated our newly built stations with 48 other existing GPS stations to provide new insights into three-dimensional tectonic deformation. We employed white plus flicker noise model as a statistical model to obtain realistic velocities and corresponding uncertainties in the ITRF2014 and Ordos-fixed reference frame. The total velocity decrease from northwest to southeast in the Longxi Block (LXB) was 5.3 mm/yr within the range of 200 km west of the LPSF on the horizontal component. The first-order characteristic of the vertical crustal deformation was uplift for the northeastern margin of the Tibetan Plateau. The uplift rates in the LXB and the Ordos Block (ORB) were 1.0 and 2.0 mm/yr, respectively. We adopted an improved spherical wavelet algorithm to invert for multiscale strain rates and rotation rates. Multiscale strain rates showed a complex crustal deformation pattern. A significant clockwise rotation of about 30 nradians/yr (10−9 radians/year) was identified around the Dingxi. Localized strain accumulation was determined around the intersectional region between the Haiyuan Fault (HYF) and the LPSF. The deformation pattern across the LFPS was similar to that of the Longmengshan Fault (LMSF) before the 2008 Wenchuan MS 8.0 earthquake. Furthermore, according to the distributed second invariant of strain rates at different spatial scale, strain partitioning has already spatially localized along the Xiaokou–Liupanshan–Longxian–Baoji fault belt (XLLBF). The tectonic deformation and localized strain buildup together with seismicity imply a high probability for a potential earthquake in this zone.

1. Introduction
Since the Middle Miocene, as a response to the India–Eurasia collision [1,2,3], the northeastern Tibetan Plateau has been undergoing lateral extrusion, which is partially accommodated by sinistral strike–slip movement along the HYF zone and crustal shortening toward the Tibet–Ordos transition zone of the northeastern margin along the Liupanshan area [4,5,6]. The northeastern part of the Tibetan Plateau is widely filled with Cenozoic sedimentary rocks [4,7,8]. To the north of the northeastern Tibetan Plateau, the Alxa Block (ALB) has undergone significant tectonic deformation since the Mesozoic and is a key region related not only to the Mesozoic deformation of Central Asia, but also to the Cenozoic development of the Tibetan Plateau [8,9]. The tectonic deformation west of the Liupanshan (LPS) is characterized by numerous active strike–slip and thrust faults [10]. The slip on these faults contributes to continuing uplift and seismic activity on the northeastern margin of the Tibetan Plateau [11]. East of the Liupanshan is the stable ORB, which tectonically belongs to the North China Block (NCB), a region that seems to share a common late Precambrian to Cenozoic geological history, but which has undergone regional extension during the Cenozoic [12,13,14].
The HYF and LPS are main boundary faults on the northeastern margin of the Tibetan Plateau, and are part of the most significant seismic hazard zone in the region [15]. Between these two main faults is the Xiaokou Fault (XKF), a left-lateral strike–slip fault which intersects the HYF and transfers displacement to the LPS [10,16]. East of the XKF is the Madongshan fold zone (MDFZ), located in the northern part of the Madongshan [10]. To the northeast of the HYF is the Xiangshan–Tianjingshan Fault (XTJSF), a left-lateral strike–slip fault with a large thrust component [3]. These two faults have similar slip features but different slip rates, which are 6.5 and 5.0 mm/yr, respectively, according to the geographical deflection of the Yellow River across the two faults [3]. On the south of the LPS, the Longxian–Baoji fault system (LXBJF) consists of four sub-faults, with the easternmost Qishan–Mazhao Fault (QSMZF) being the most active one, accommodating regional strain accumulation through strike–slip movement [17]. In this area, other major faults are the north fringe fault of the West Qinling Mountains (NWQF) and the East Kunlun Fault (EKF) [6]. Based on fault distribution, tectonic movement, and crustal deformation from geological and geodetic results, the study zone can be divided into five relatively rigid blocks, as shown in Figure 1 [18]. Besides the main boundary faults, there are some secondary faults within the blocks, which play an important role in the accommodation of strain distribution inside blocks. Three great earthquakes have occurred in this area with magnitudes larger than or equal to MS 8.0, including the 1654 MS 8.0 Tianshui earthquake, the 1879 MS 8.0 Wenxian earthquake, and the 1920 MS 8.6 Haiyuan earthquake.
Previous studies have shown that the velocity field derived from geodetic observations could be explained by the elastic block model, indicating gradually declining slip rates from west to east on the HYF, with an average slip rate being about 5.0 mm/yr [11,18,19,20,21]. However, due to the sparse distribution of GPS stations, slip rates on the LPS and LXBJF are poorly constrained. The slip rate gradually declines from west to east on the north fringe fault of the West Qinling Mountains, and tends to be almost zero on the eastern margin [22,23]. Previous studies were mostly based on campaign GPS observations, with a very limited amount of continuous GPS (cGPS) data.
Since 2012, with financial support from the China Earthquake Administration, more cGPS stations have been deployed in some key areas, such as the LPSF zone and the XKF zone. We collected the data from all 58 cGPS sites on the northeastern Tibetan Plateau margin. In this study, we calculated a new velocity field and then calculated the strain field based on an improved multiscale spherical wavelet algorithm. In Section 2, we elaborated the details of the cGPS data processing, the fitting of GPS time series. In Section 3, we described an improved algorithm for strain rate estimation based on wavelet analysis. In Section 4 and Section 5, we presented the results of the estimated velocity and strain rate fields and analyzed their tectonic implications, respectively. In Section 6, we analyzed strain accumulation on different spatial scales and discussed the relationship between horizontal and vertical movements. In Section 7, we presented a concise conclusion.
2. GPS Data and Data Processing
2.1. GPS Observations
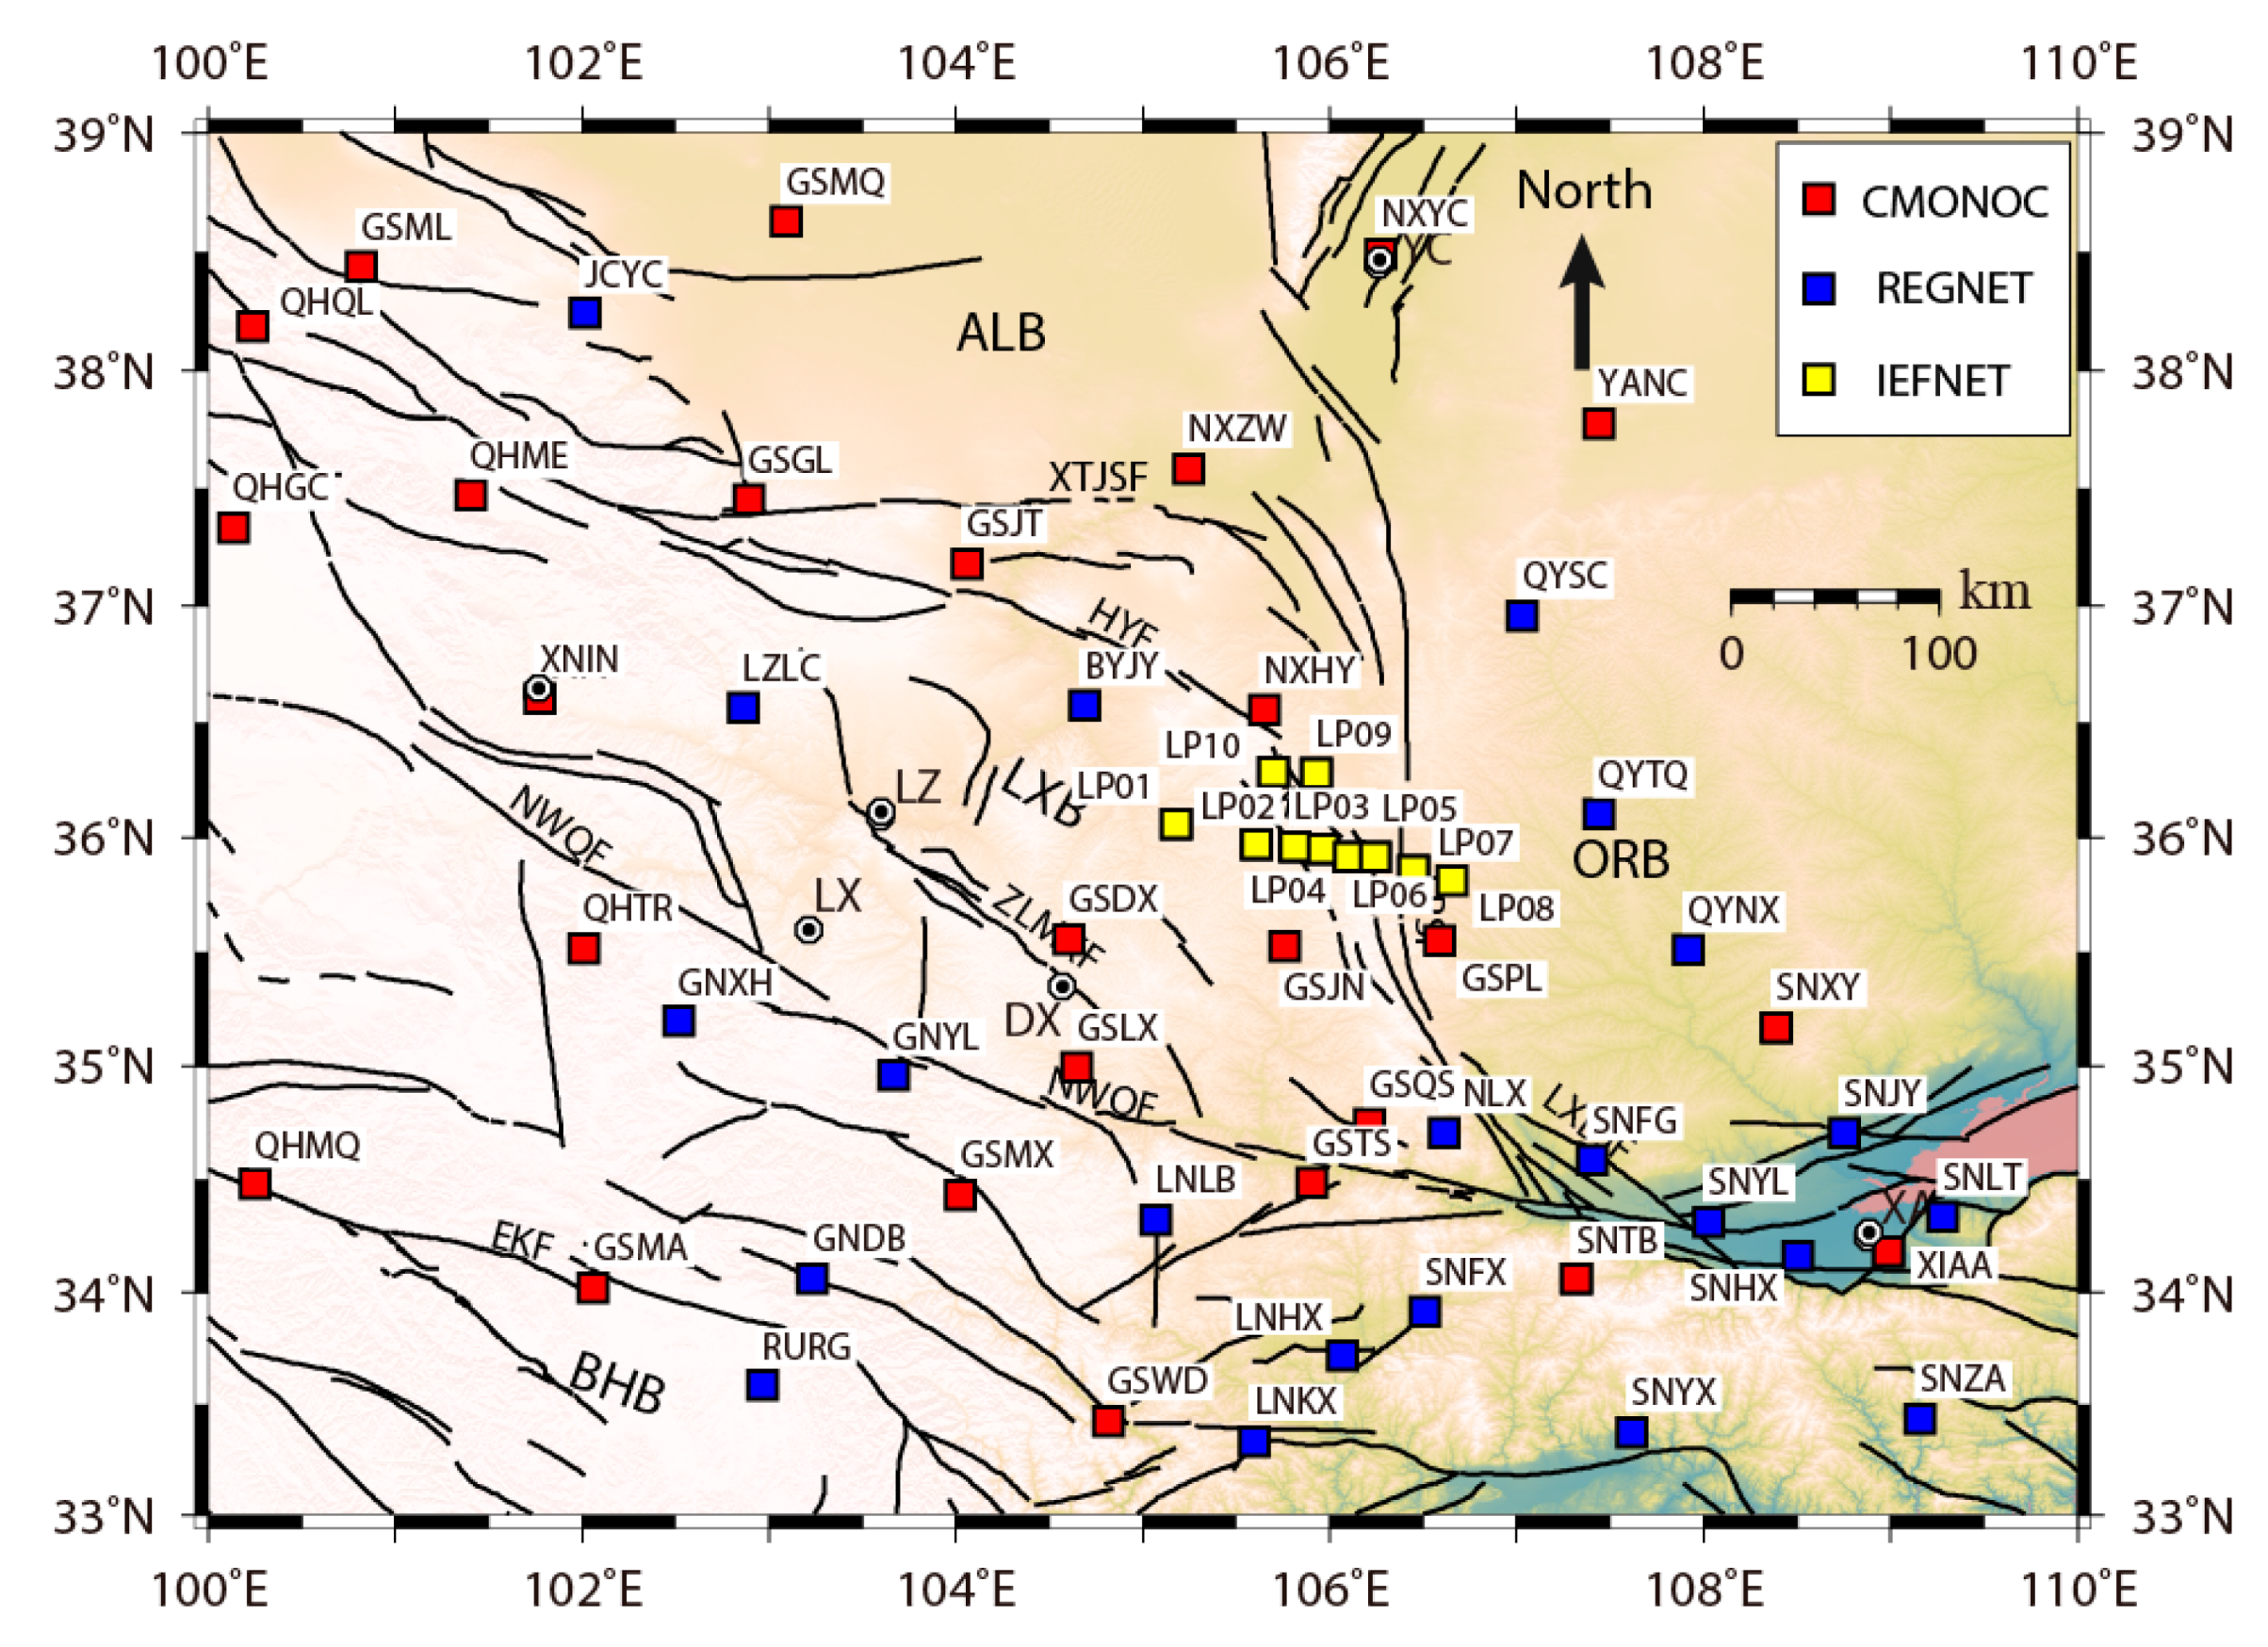
To investigate the slip rate of the LPSF and analyze the seismic hazard of the fault, we installed eight continuously recording GPS stations across this fault. We installed the cGPS profile according to the principle that the inter-site distance gradually increases with the distance from the fault trace, with an average inter-site distance of 20 km, in order to capture fault activity and strain accumulation as precisely as possible. Five stations, LP01 to LP05, are located in the west of the fault, and three stations, LP06 to LP08, are located in the east. We also established two cGPS stations across the XKF, with an inter-station distance of 10 km, in order to determine its slip rate and study the transformation of the slip pattern between the HYF and LPSF. These 10 stations formed a new regional network, named the Institute of Earthquake Forecasting Network (IEFNET), which was established on October 2012, following the Crustal Movement Observation Network of China (CMONOC) reference station standards, and has been operating since April 2013 [24]. Additionally, we collected 48 other cGPS observations in this region, from two networks. Twenty-two of them belong to CMONOC, a high-rate GPS network with sampling rates of up to 50 Hz which consists of 260 continuous stations and 2000 campaign stations installed by the China Earthquake Administration. This network was established in 2009 to benefit the monitoring and investigation of tectonic movement and environmental change in China. The remaining 26 stations belong to a regional network (REGENT) which was installed by local agencies with earthquake, meteorology, and surveying and mapping, in order to increase the spatial density of GPS sites in key tectonic areas and provide positioning services [24]. This regional network has been operational since January 2010, following the CMONOC reference station standards. These stations played an important role in supplying local positioning service. However, they were not employed for the study of tectonic movement. The distribution of the 58 cGPS stations used in this study covers the main tectonic area with a mean inter-site distance of about 110 km, and most GPS stations are located close to major seismogenic zones (Figure 2).
In the following, we obtained 58 cGPS observations over the period of 2010–2018. The velocities of the 10 newly installed cGPS stations are firstly reported. Then, the application of 26 cGPS stations of REGENT and the 22 cGPS stations, which have longer observational time span compared with previous study, of CMONOC to the study of crustal and tectonic deformation is described. Newer and denser cGPS observations are adopted to acquire a three-dimensional velocity field in order to elaborate regional tectonic deformation. The data from the analyzed continuously recording stations spans more than 2.5 years, with majority of them covering more than 5.0 years, which is long enough to reliably estimate crustal velocities.
2.2. GPS Data Processing
The GAMIT/GLOBK package (version 10.6) was employed to estimate the daily solutions of station coordinates in a two-step approach [25,26]. In the first step, we analyzed doubly differenced GPS phase observations in daily session to estimate loosely constrained station coordinates together with orbital and Earth orientation parameters and their associated covariance matrices [27,28]. The sampling frequency was set to 30 s, and the cutoff of the elevation angle was 10° for the GPS raw data. The estimated orbital parameters included 15 elements for each satellite, while the Earth orientation parameters included pole position and rate along with the UT1 and its rate. The ionosphere-free combination was introduced in forming observation equations to eliminate the first-order ionosphere delay effects; however, the high-order ionosphere delay effects remained as errors in the observation equations, which can result in positioning errors of up to 15 mm in some areas with high electron density and taken into account in the precise positioning [29]. The second-order ionosphere effects were correlated with the total electron content and geomagnetic field [28]. Vertical Total Electron Content (VTEC) maps, from the Center for Orbit Determination in Europe (CODE), and the newly updated geomagnetic field model IGRF12 [30,31], from the international geomagnetic reference, were applied in order to mitigate their influences [24]. An automatic cleaning algorithm was applied to check raw data for better handling of poor data by repairing cycle slips and removing outliers [27]. IGS final satellite ephemeris was applied to calculate the position of GPS satellites [32]. The International Earth Rotation and Reference System Service (IERS) Bulletin B value was adopted for determining the initial values of the Earth orientation parameters. The IGS14 absolute phase center model was applied to correct the variation of phase center for satellites and receivers. The Vienna Mapping Function 1 (VMF1) mapping function was employed to model the troposphere delay effects by means of the dry and wet parts [33], with atmosphere pressure and temperature parameters extracted from station meteorological files or GPT2 grid files, to improve the precision of estimated station position on the vertical component [34]. The wet part of the troposphere delay effects was set as unknown hourly parameters in the final estimate of position coordinates, together with two daily gradient parameters in the east and north components, respectively. The ocean tidal loading correction was taken into account according to the FES2004 model [35], and the effects of polar tides and solid Earth tides were corrected according to the IERS2003 model [36]. The atmospheric loading correction was applied in the CM reference frame (center of mass of the solid Earth plus fluid loads) according to the IRES 2003 model. The solar radiation pressure was estimated using the Berne model [37]. In this step, we obtained the variance-covariance matrix, which includes bias-free and bias-fixed solutions. We also collected data from other CMONOC cGPS stations and about 80 ITRF2014 reference stations distributed all over the world to realize the reasonable reference frame [38]. The position time series plots of 58 cGPS stations relative to the ITRF2014 reference frame (Figure S1) are listed in the supplementary materials.
In the second step, we used the daily bias-fixed loosely constrained solutions of the estimated parameters and their covariance matrices as quasi-observation in GLOBK, which is a smoothing Kalman filter, to resolve position time series in the ITRF2014 by means of network adjustments. We constrained all the priori coordinates to 0.1 m to minimize the effects of unmodeled site position biases. The ITRF2014 reference frame was realized by minimal constraining of the 80 ITRF2014 core stations by a seven-parameter Helmert transformation, which used three orientation parameters, three translation parameters, and one scale parameter. We adopted four iterations to eliminate bad sites and to compute station weights for the reference frame stabilization.
2.3. Time Series Analysis
In order to fit coordinate time series, we employed a functional model that encompasses a constant velocity, an annual and a semiannual sinusoidal variation term, and possible offset parameters for each component of each station. The functional model can be written, after [39], as:
where for the east, north, and up components, respectively, is the station position at time , is the linear rate of component , and are the sine and cosine amplitudes at annual period, and are the sine and cosine amplitudes at semi-annual period, is the Heaviside step function which is equal to 1 for and 0 otherwise, is the offset value at time , and is the corresponding noise in the position time series.
Outliers were removed by using the interquartile range algorithm described by [40]. A noise model of time series can affect the estimation of the velocity field, especially the uncertainty of the estimated trend [41]. The white noise assumption that measurement error is random and uncorrelated from one epoch to its neighbor is improper for time series analysis. Time-correlated noise was confirmed to be present in the GPS position time series [42]. We employed the Hector software to estimate the power index of the noise model, which includes both white and power index models [43]. The results of the noise analysis show that the corresponding noise model is the white plus flicker noise model [41]. Therefore, to precisely estimate the velocity field, we applied a white plus flicker noise model to form the covariance matrix for the least squares adjustment of secular trends and acquired realistic uncertainties for the velocity estimates.
3. Strain Rate Calculation
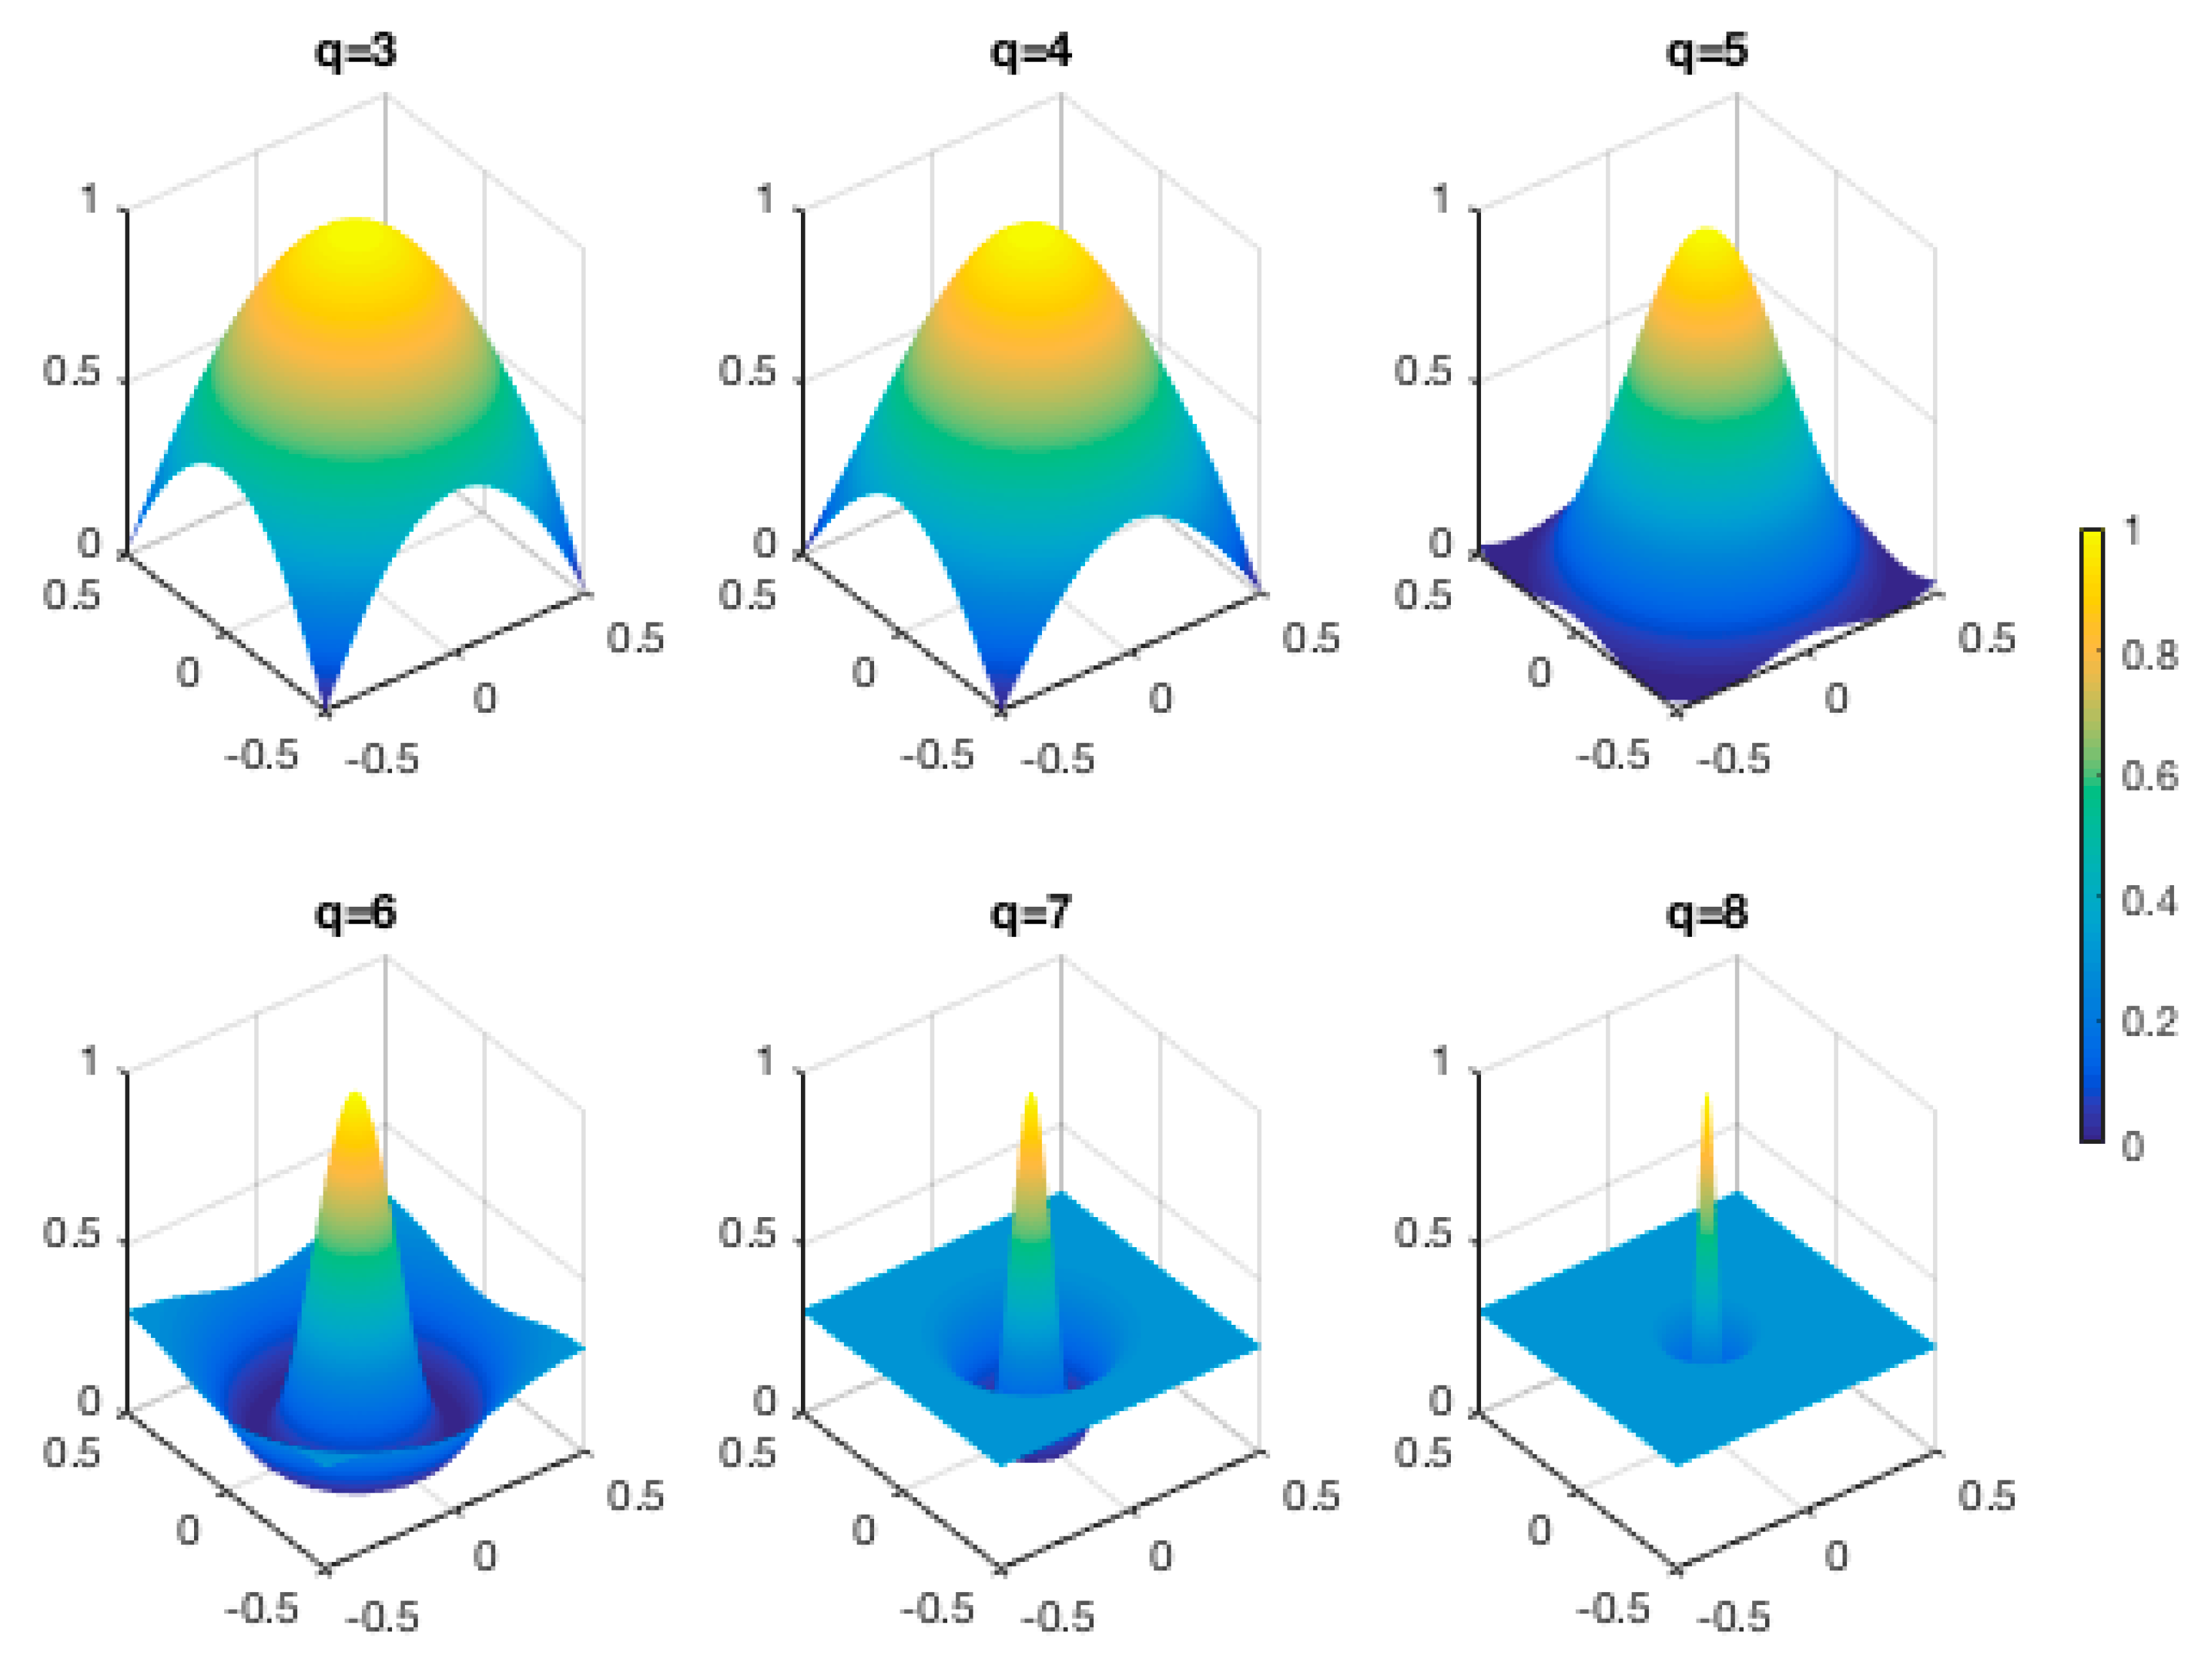
Strain rate is independent of GPS reference frame, and provides a better way to characterize crustal deformation and fault strain accumulation [27]. We employed an improved spherical wavelet method, which can decompose total strain into various spatial scales compared to the method of Tape et al. [44], to acquire multiscale strain rates for an irregular distribution of GPS stations. The spherical wavelet theorem is evolved from infinite plane space to finite spherical space. The spherical wavelet basis function is derived from their mother function by means of the translation and scaling. We employed the difference of Gaussian (DOG) function to construct the wavelet basic function. The spatial distribution of the wavelet basic function was heterogeneous due to the spatial irregularity of the GPS stations. Figure 3 shows the shape of the normalized DOG wavelet basis function on different decomposition scales against the distance between the observational point and the location of the wavelet base function.
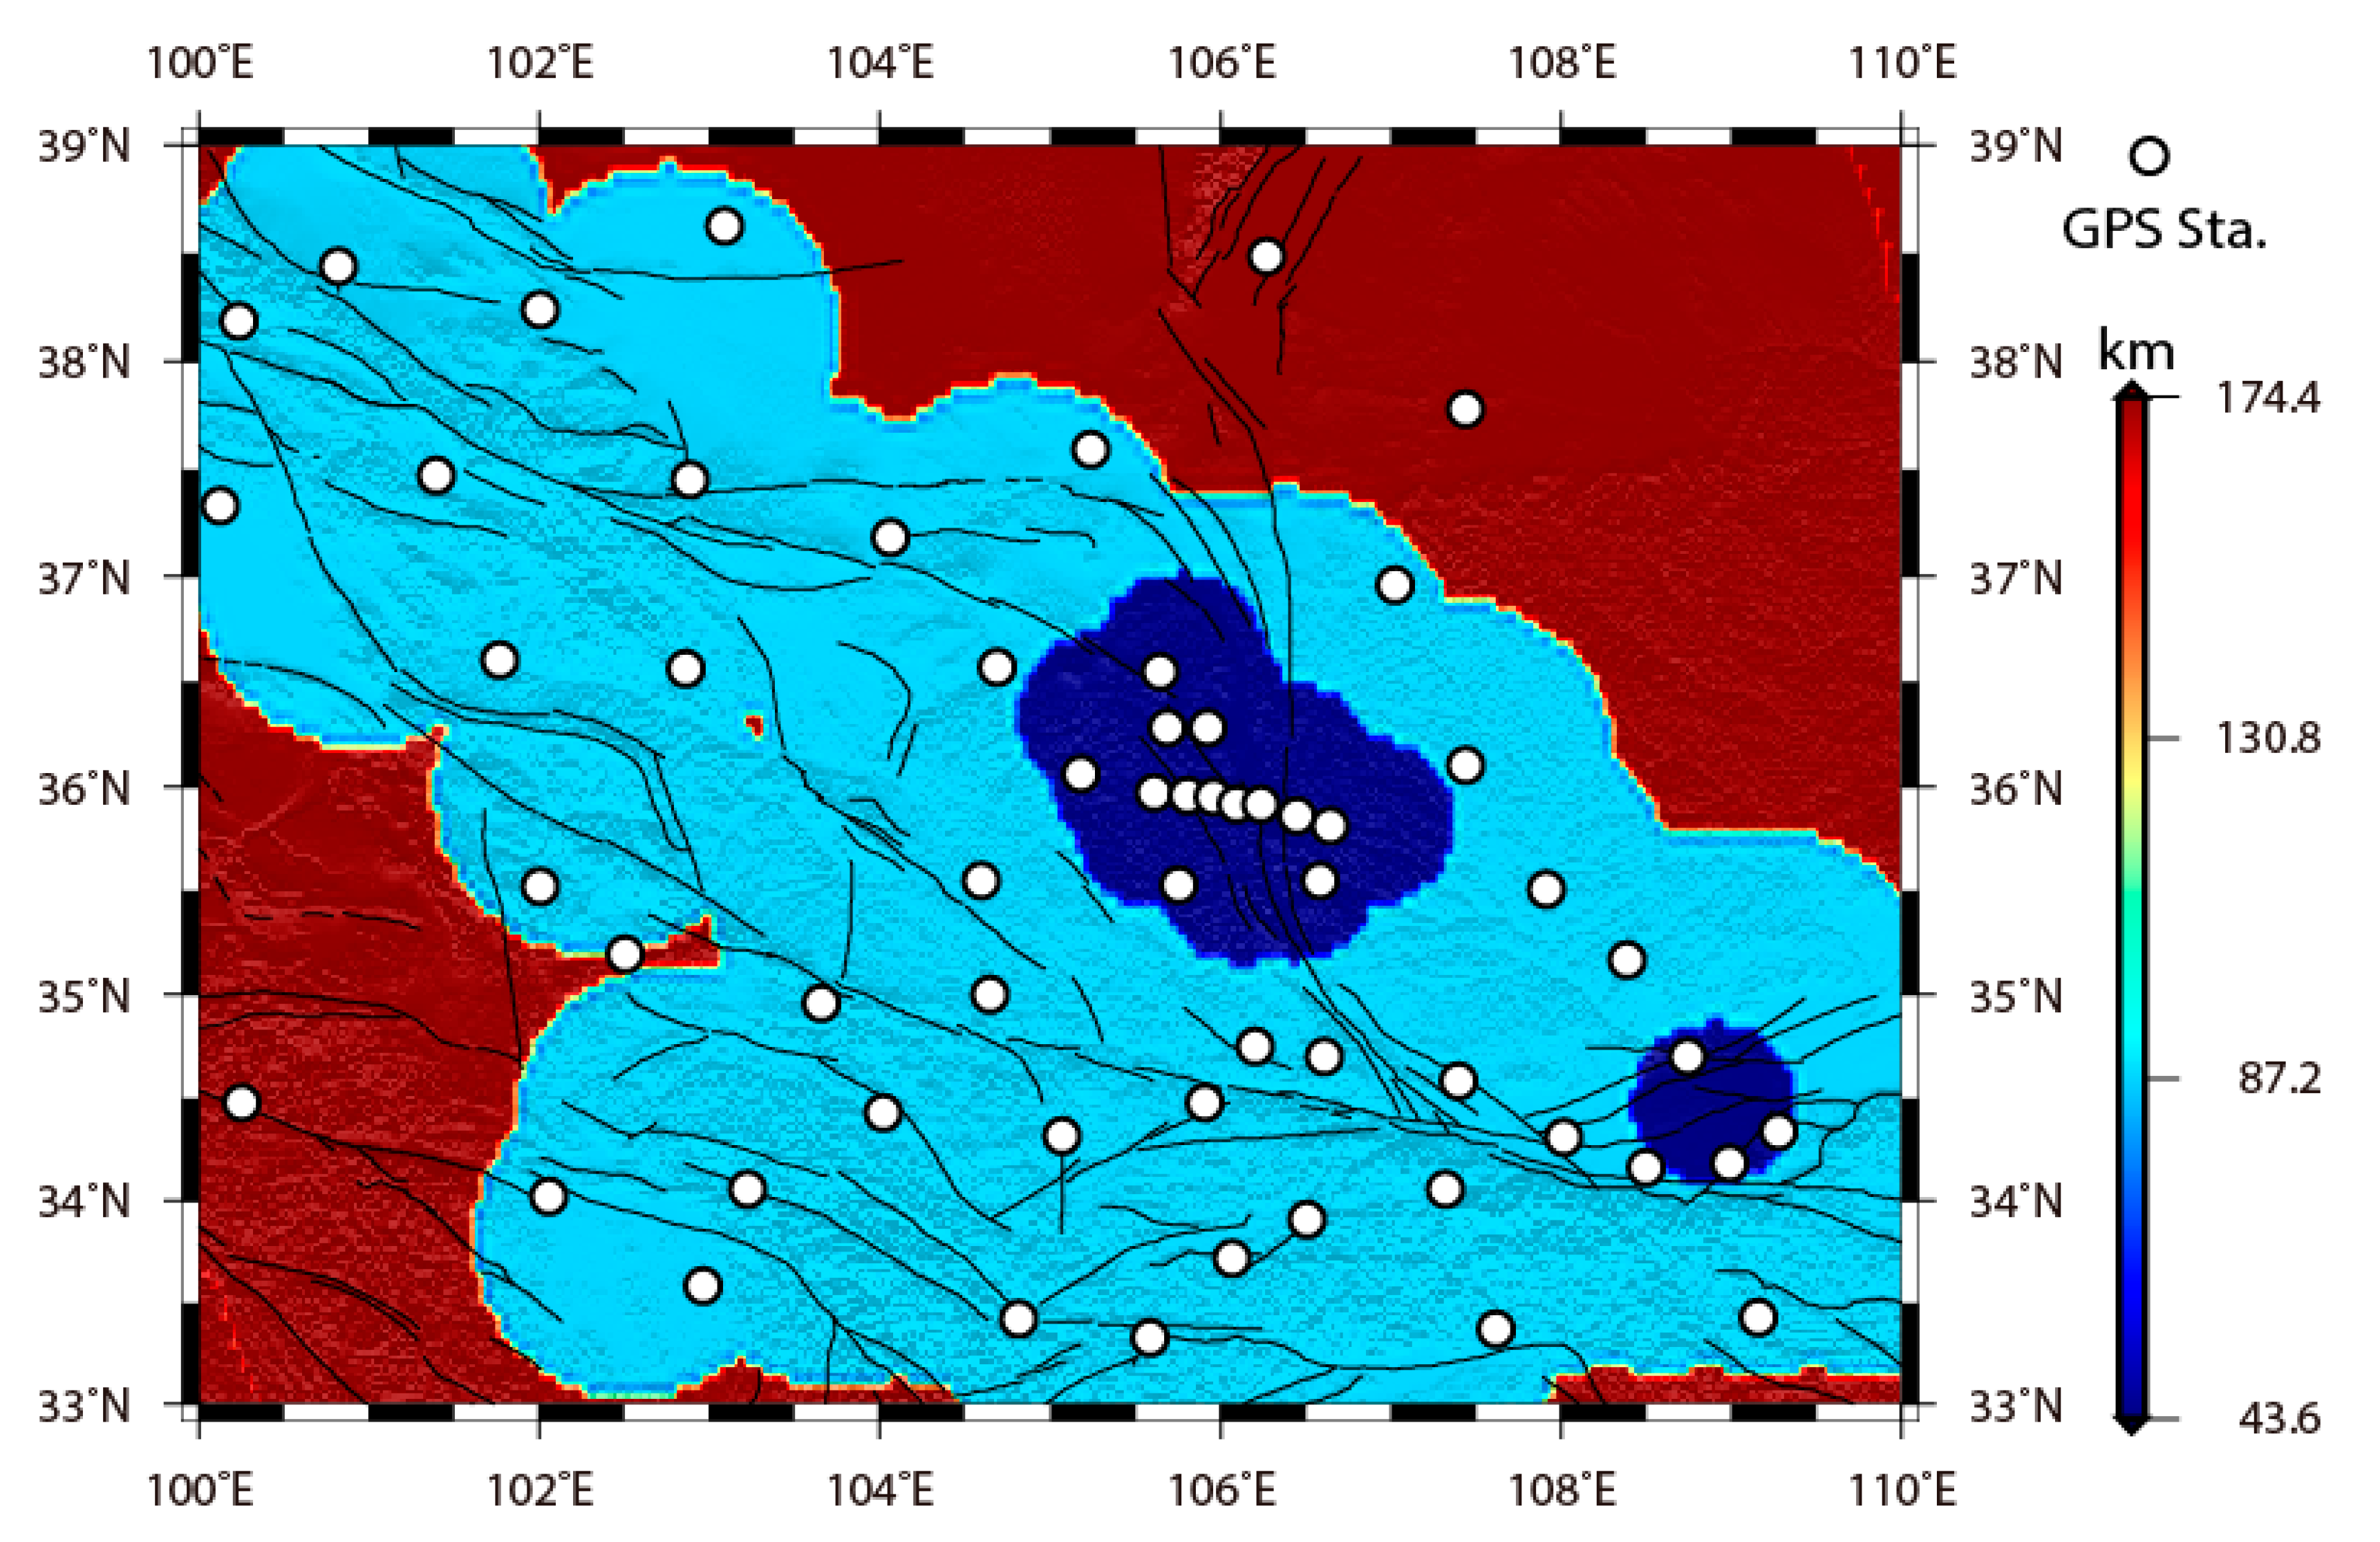
We determined the minimum decomposition scale 3 according to the radius of the study area. The maximum decomposition scale was determined by the density of the cGPS stations. We obtained the maximum decomposition scale by searching for the area with the smallest radius, which included three cGPS stations, at the location of the wavelet basic function. The decomposition scales 6, 7, and 8 correspond to spatial resolutions of 174.4, 87.2, and 43.6 km, respectively. Figure 4 displays the distribution of spatial resolution; most of the area attained a spatial resolution of 87.2 km. Therefore, we determined scales 3–7 as the decomposition scales to estimate the strain rates.
When we constructed the spherical wavelet basic function at various scales, we were able to build the relationship between the GPS-derived velocities and the coefficients of the wavelet basic function, which can be written as
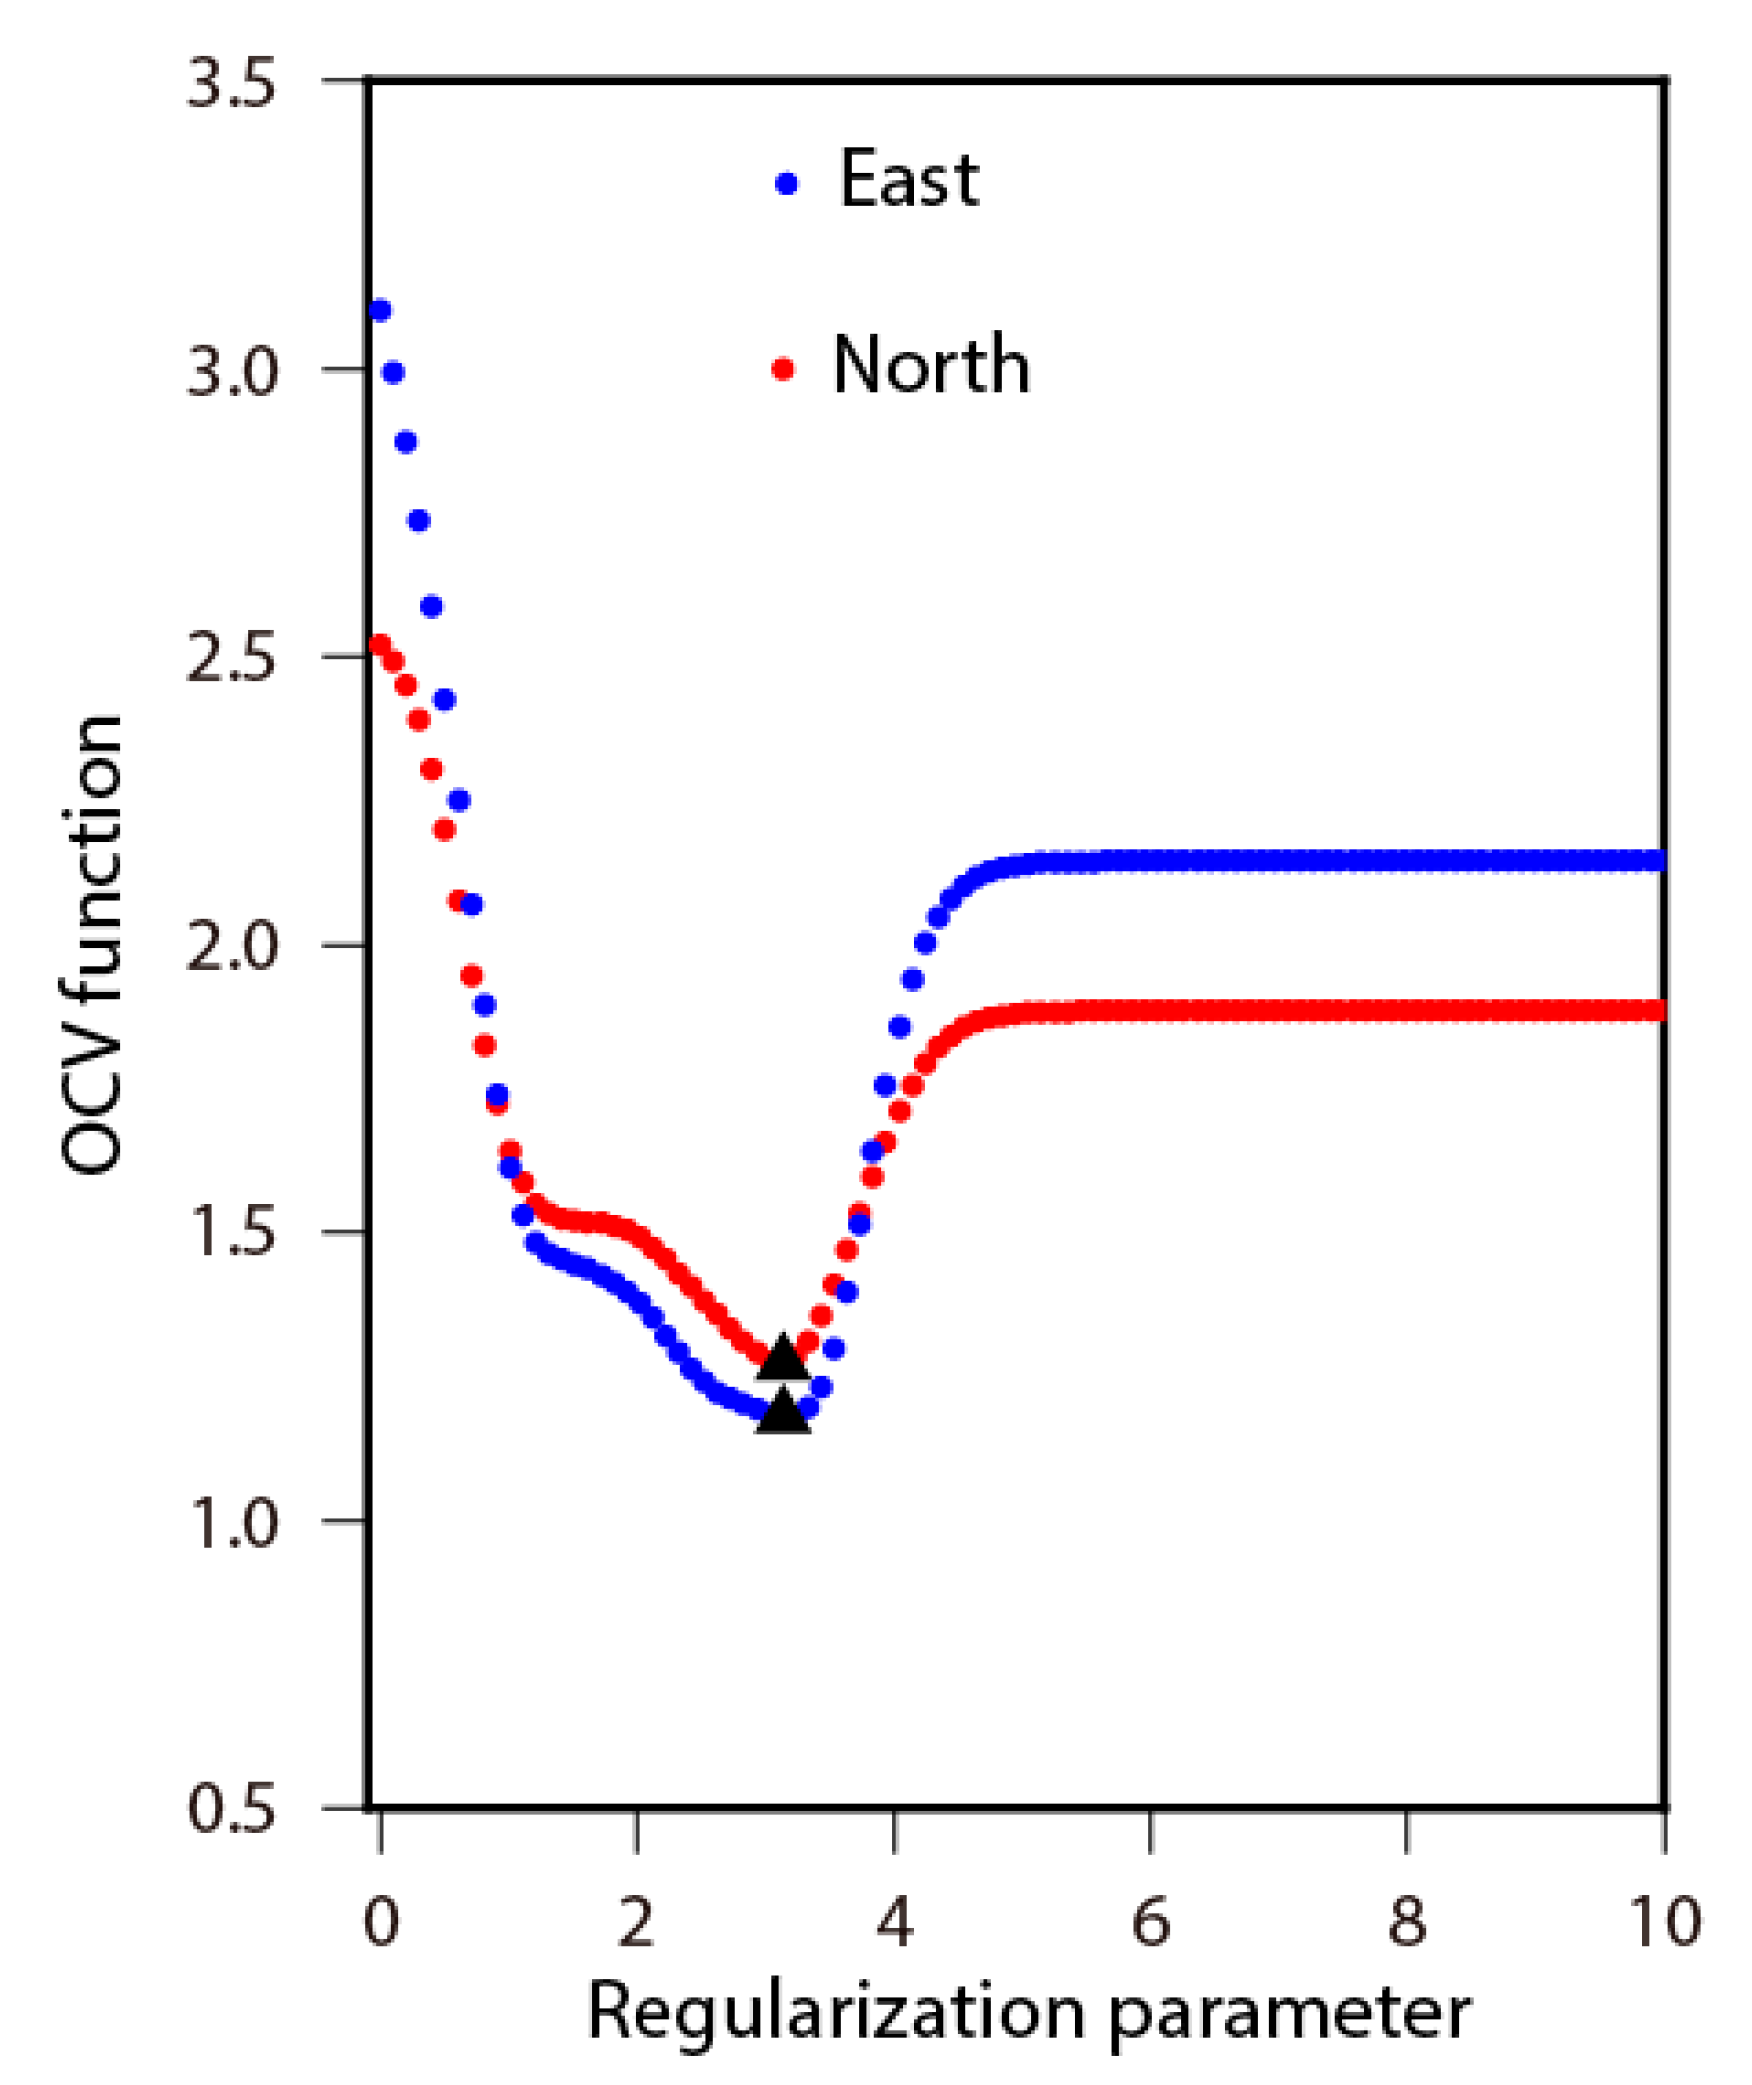
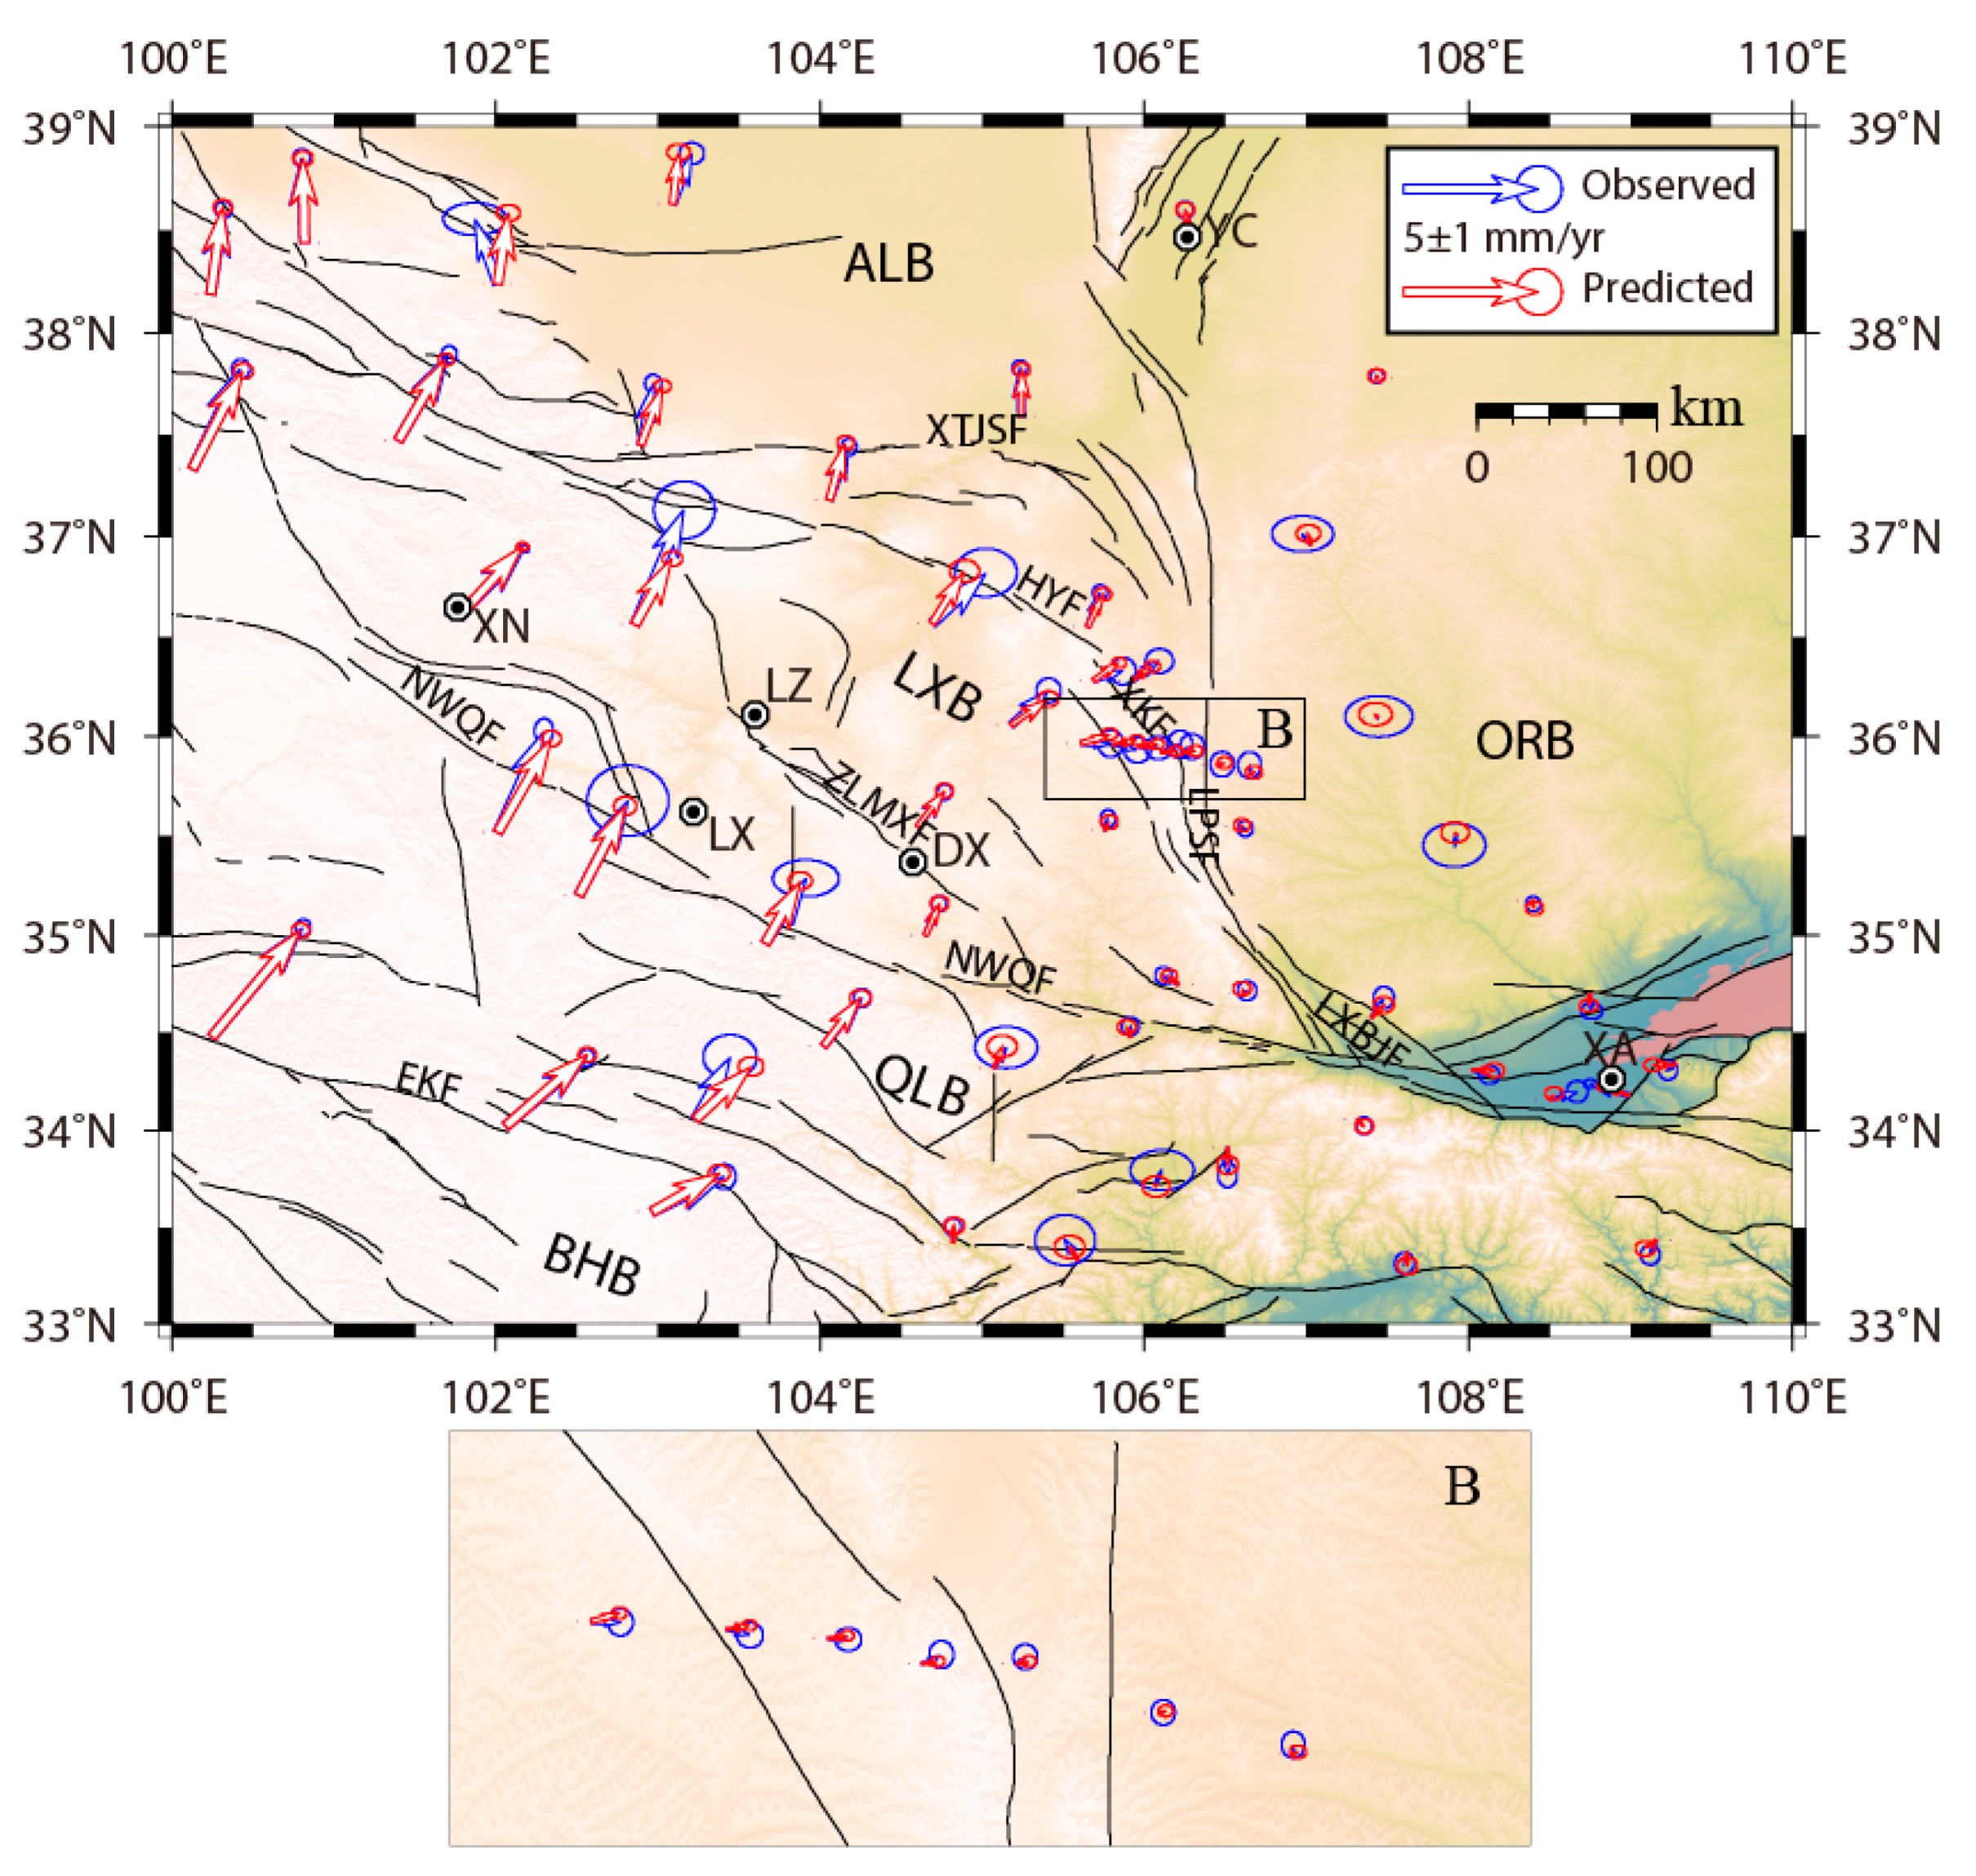
where and are the colatitude and longitude of the specified GPS site, respectively, is the unit vector of the north component and is the unit vector of the east component, is the observational velocity vector of the GPS site at , M is the total number of wavelet basis functions, is the k-th DOG wavelet basis function, and and are the k-th estimated parameters on the east and north components, respectively. As the DOG wavelet basis functions are derived from the translation and scaling of their mother functions, they are non-orthogonal, which results in rank deficiency for the coefficient matrix of the normal equation obtained from the observed equation. The Tikhonov criterion was employed to balance residual and smoothness to address this issue. Figure 5 shows regularization parameter curves in the fitting of the GPS observational velocities. The optimal regularization can be obtained with the minimum value of the ordinary cross-validation (OCV) function for the north and east components, respectively. Figure 6 displays the observed and modeled velocities with arrows of different colors. Our spherical wavelet model reconciles the observed GPS velocities well: 86% (50 of 58) of the residual velocity components are less than 1.0 mm/yr, indicating that our model can effectively reconstruct observed velocities.
The first derivatives are calculated for the wavelet basis functions, and the velocity gradient tensor at a specified point can be expressed as
where , , , and are the components of the velocity gradient tensor, and are first-order partial differentials of the wavelet basis functions in the north and east components, respectively, and are estimated parameters for the north and east components, respectively. We constructed a uniform grid and used the wavelet basic function to calculate the two-dimensional velocity gradient tensor. The strain rate tensor and rotation rate tensor at a specified site can be obtained with the velocity gradient tensor. The strain rate tensor can be further used to calculate various strain components, such as second invariant, principal strain, dilatation, and maximum shear strain [45].
4. GPS-Derived Three-Dimensional Velocities
The ITRF2014 velocity solution, accounting for annual periodical signal, semi-annual periodical signal, offsets, and time-correlated noise contents, was derived through the combination of individual daily solutions. In order to highlight crustal deformation, we transformed the ITRF2014-fixed velocity field into a local reference frame by the Euler angular vector. We defined the Ordos-fixed reference frame through the Euler angular vector from five stations (YANC, QYSC, QYTQ, QYNX, and SNXY) over the interior of the ORB. The estimated angular rotation rate of the ORB relative to ITRF2014 was 0.3980 ± 0.0319°/Myr (Million year), with a pole at 77.4059 ± 0.7839°N and 179.6720 ± 1.5001°W. To validate the applicability of the estimated Euler angular parameters, we performed a comparison between the predicted velocities and the observed velocities. The mean discrepancy between the two was 0.9 mm/yr, which is on the same level as the uncertainties in the GPS velocities. The station velocities and their uncertainties, both relative to the ITRF2014 and to the Ordos-fixed reference frame (Table S1), are listed in the supplementary materials.
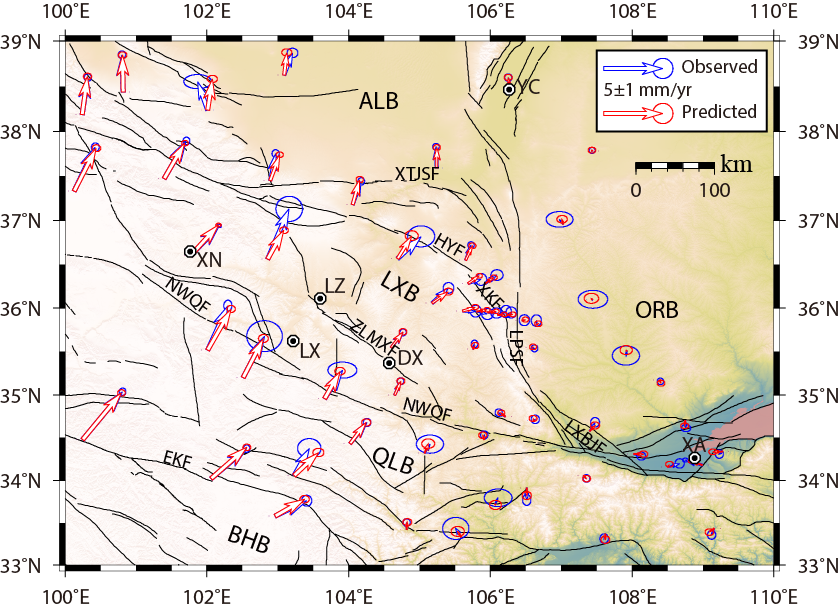
The lateral expansion in the northeastern Tibetan Plateau was obstructed by the ORB, resulting in large-scale crustal shortening, as can be seen from the velocity field shown in Figure 6. The pattern and magnitude of our velocities are in general agreement with previous results derived from both campaign-mode and cGPS stations [18]. However, our cGPS station profile across the LPSF provided a higher resolution kinematic pattern. The determined horizontal movement on the northeastern margin of the Tibetan Plateau was about 8.8 ± 0.7 mm/yr in the northeastern direction, which was an average from three stations in the southwestern corner (stations QHMQ, GSMA, and QHTR). The magnitude of the horizontal movement gradually decreased to 3.2 ± 0.6 mm/yr with an azimuth of 38° at station GSDX which was located at the center of the LXB and far away from the boundary faults. Furthermore, the closer to the LPS the GPS stations were, the smaller their velocities were. This indicates that the deformation was localized near the LPS because of the resistance of the relatively stable ORB [10]. From the LXB to the ALB, the magnitude of velocities decreased significantly, and the direction of velocities changed from northeast to north, indicating that the two boundary faults (the HYF and the XTJSF) are both presently active.
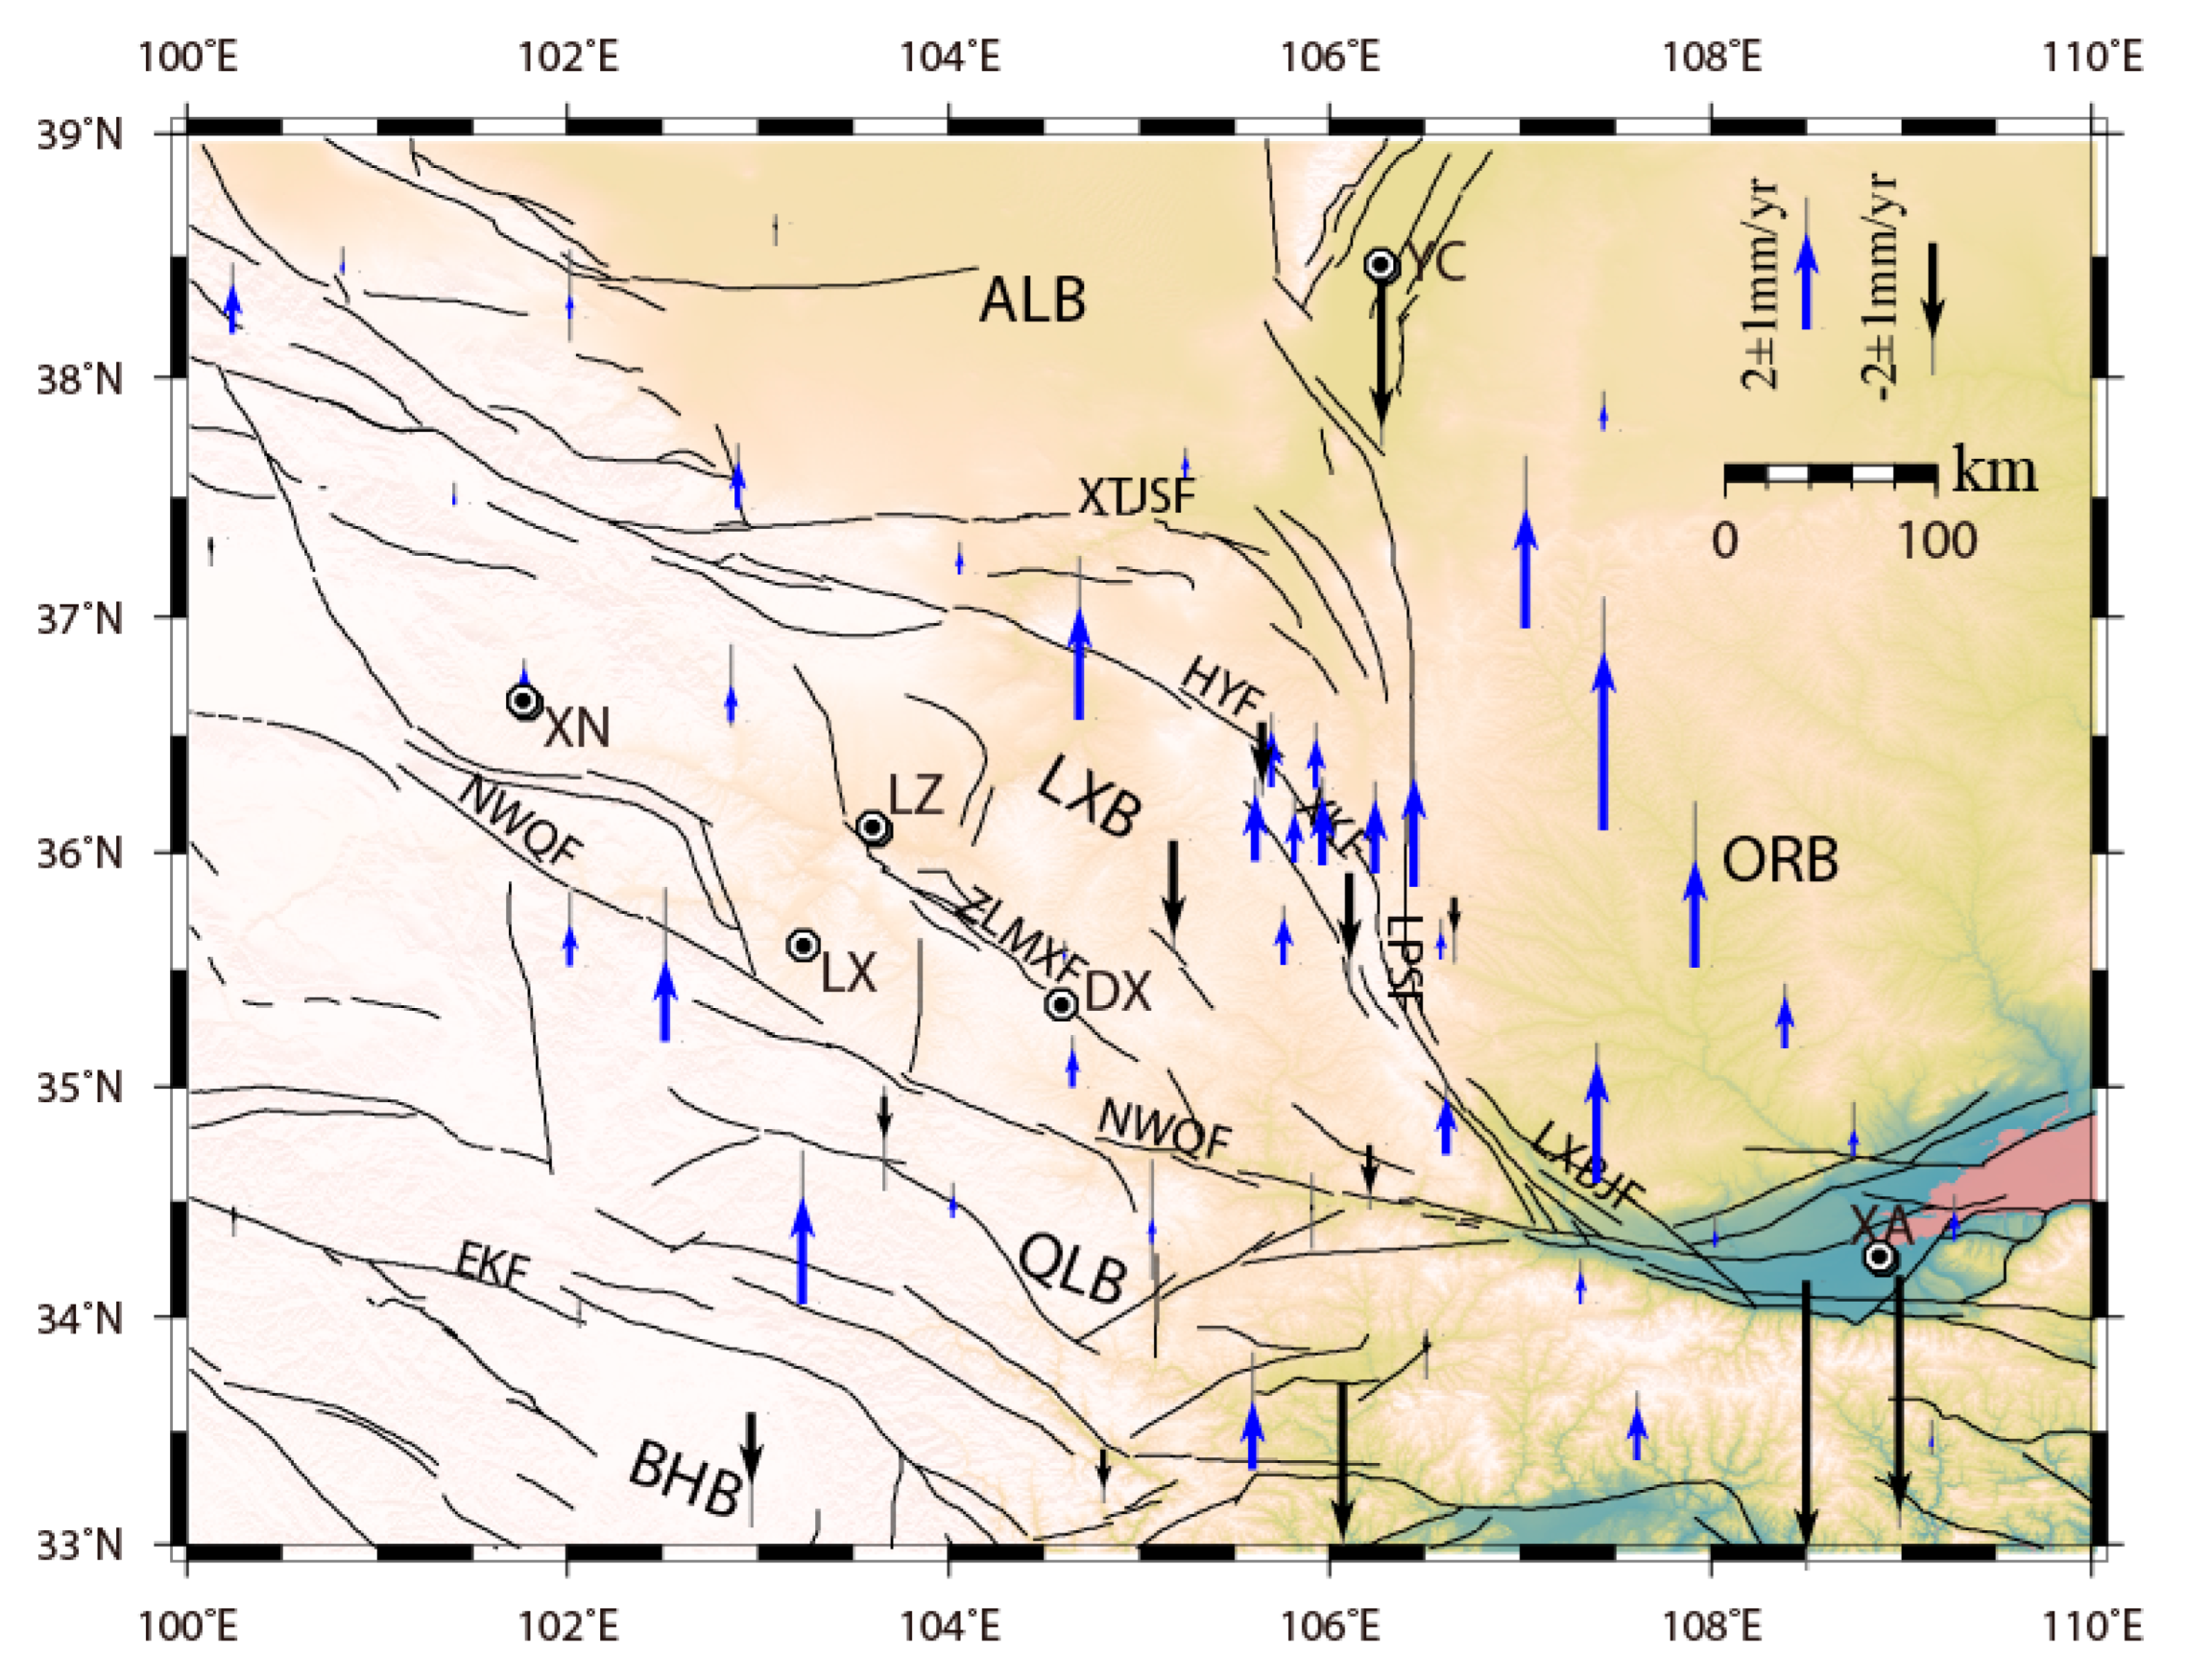
The vertical movement at most GPS sites was characterized by uplift, except for several sites which were situated on localized sedimentation layer (Figure 7). The average uplift rate (relative to the ITRF2014 reference frame) was 1.6 mm/yr in the northeastern Tibetan Plateau. Using the leveling data which have been observed repeatedly between 1970 and 2012, Li et al. [18] estimated the vertical motion in the northeastern Tibetan Plateau with a maximum uplift rate of 7.0 mm/yr. Using the same data as Li et al. [18], we obtained the average uplift rate of 3.7 mm/yr in this area. The discrepancy between our GPS and leveling results was about 2.0 mm/yr, which may be attributed partly to the different time spans of observation. The change in vertical velocities across the HYF and the NWQF was small, while significant change was observed across the LPS. The two faults were both dominated by lateral slip, which generated horizontal crustal movement. However the latter was dominated by extrusion slip, which generated deformation horizontally and vertically [46]. There were a few stations in the ALB, showing small but consistent uplift which is insignificant relative to their uncertainties. The vertical movements in the Qinling Block (QLB) were quite diffuse, indicating a heterogeneous tectonic deformation pattern. The vertical movements of the LXB was characterized by uplift, with an average rate of 1.0 ± 0.9 mm/yr, and a gradual increase from northwest to southeast. Although the average rate was insignificant relative to its uncertainty, the uniform uplift feature at the majority of GPS stations can be observed at the interior of LXB. Five stations in the ORB were uplifting, with an average rate of 2.0 ± 1.1 mm/yr and a maximum rate of 3.7 ± 1.5 mm/yr, which is a larger than that of LXB.
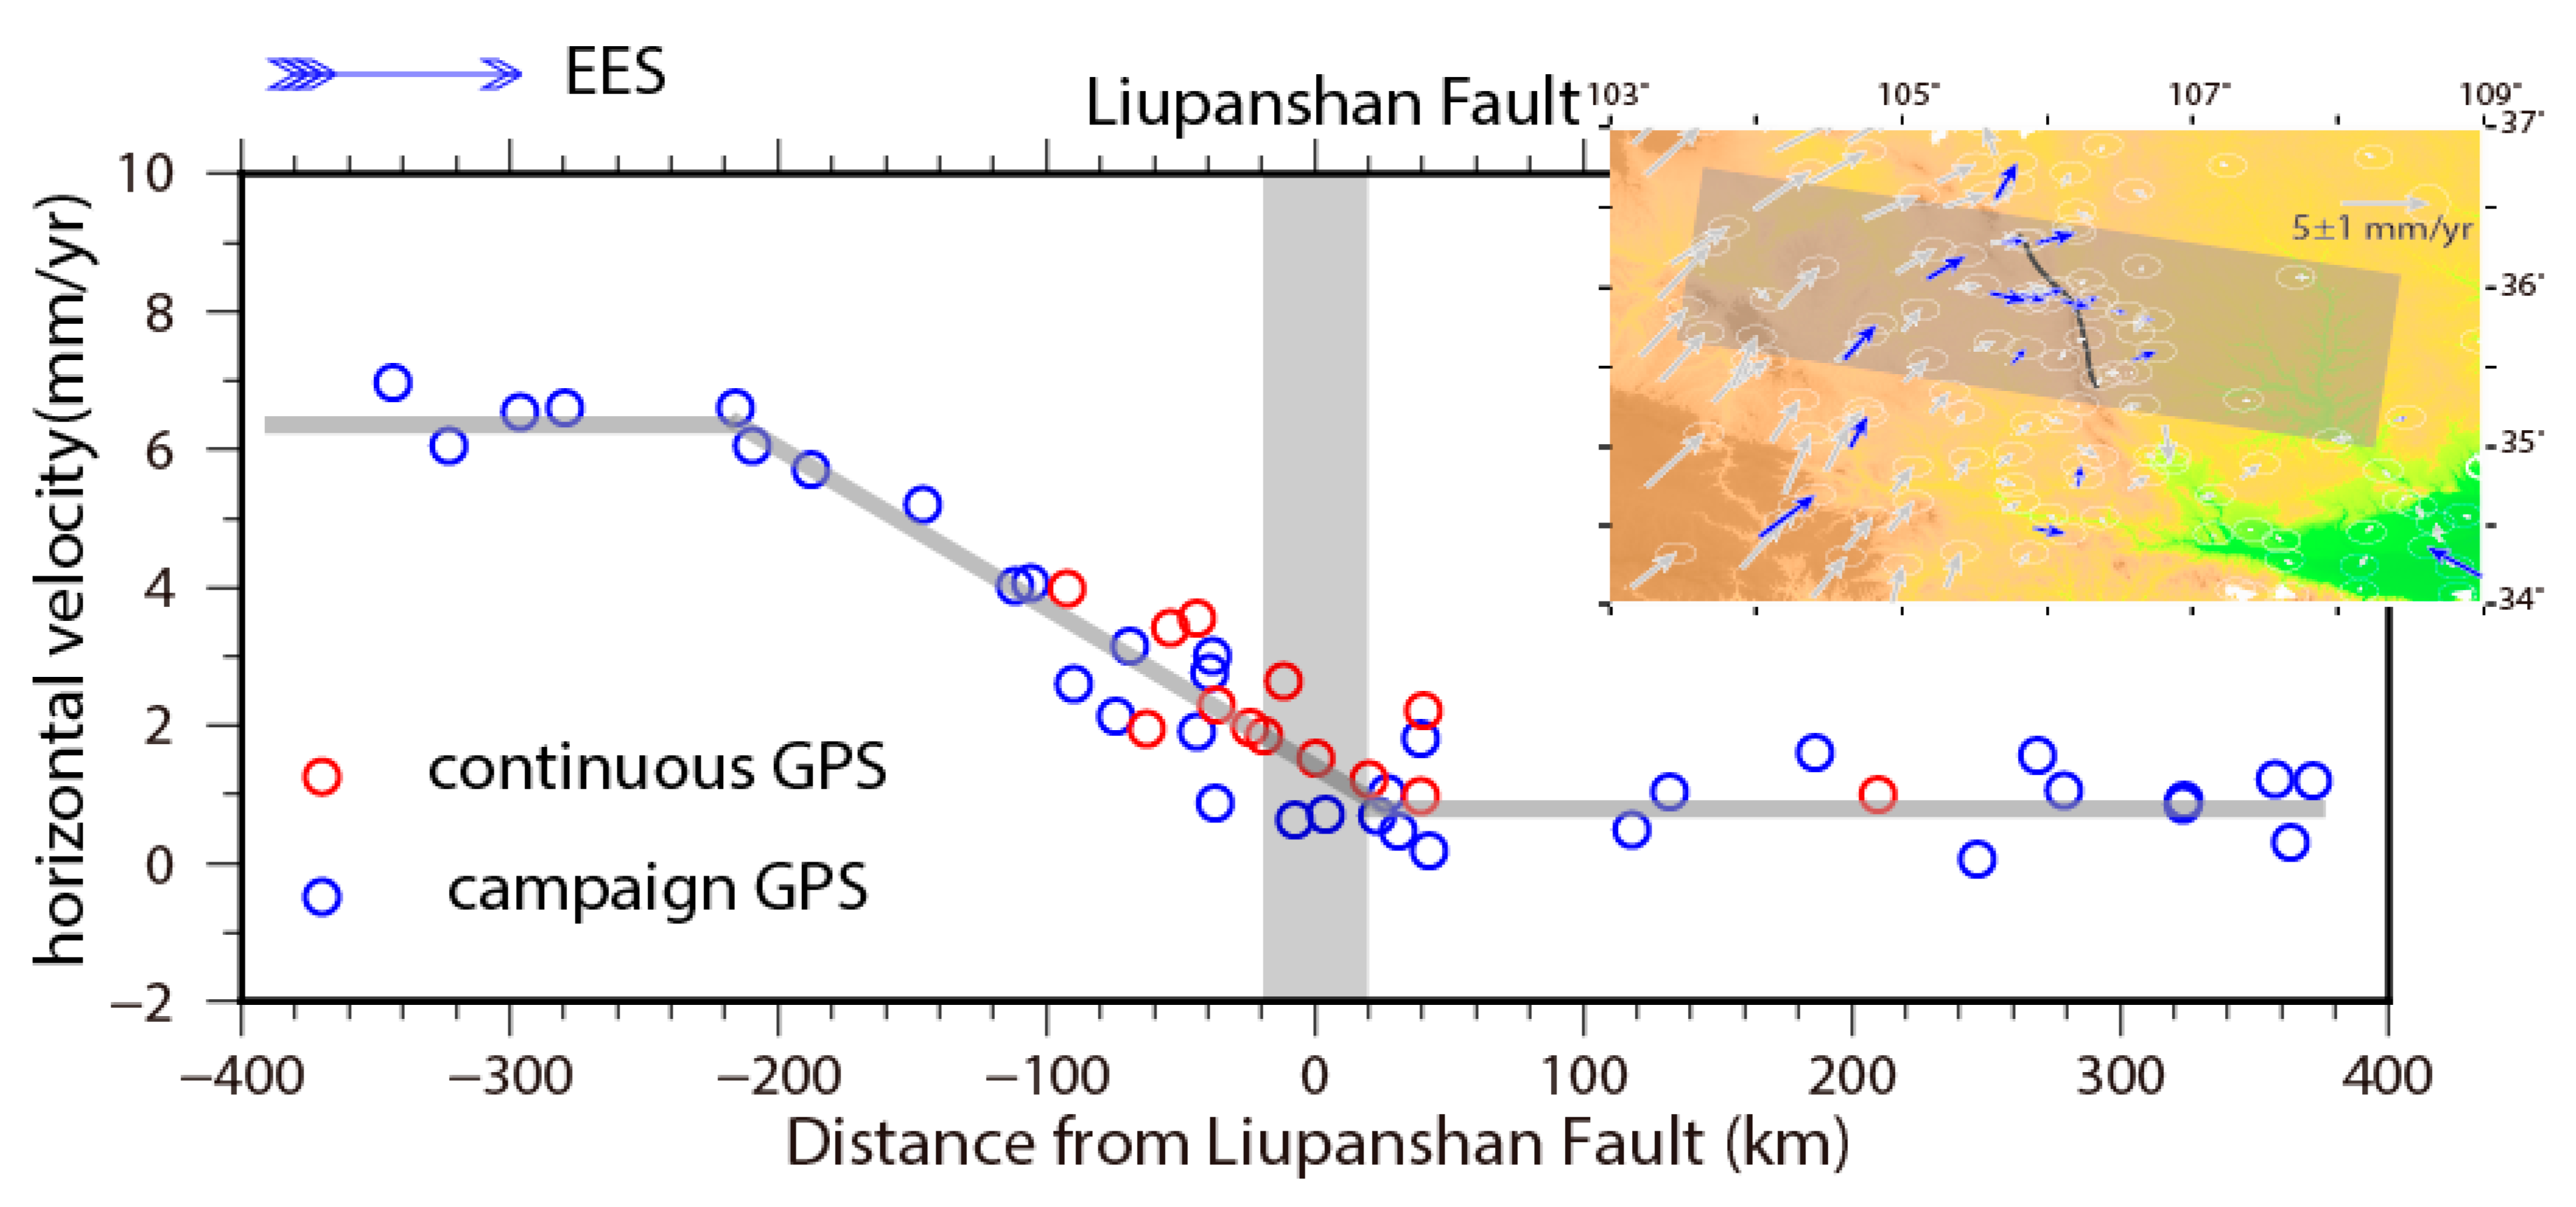
To qualitatively analyze the deformation process from the LXB to the ORB, we incorporated our velocities with the campaign-mode GPS velocities of Ye et al. [47], which adopted the same data processing strategy with this study and the observational period being 1999–2017. We took a velocity profile to identify the change of velocities (Figure 8). A noticeable velocity decrease from northwest to southeast interior of the LXB was identified on the horizontal component. We estimated a reduced velocity of 5.3 ± 0.7 mm/yr within the range of 200 km west of the LPSF. However, no significant differential motions were identified in the ORB. This deformation pattern across the LPS is similar with that observed across the LMSF before the 2008 Wenchuan MS 8.0 earthquake [48,49].
5. GPS-Derived Strain Rates
By performing a multiscale spherical wavelet strain calculation, we obtained a two-dimensional strain rate tensor and rotation rate tensor. Dilatation rate is the first invariant of the strain tensor, which is equal to the sum of the maximum and minimum strain rate vectors, and is independent of coordinate system, indicating the areal change of the tiny deformation unit. The formula of the second invariant is , which reflects the magnitude of total strain rates. Maximum shear strain rate is equal to the difference between the maximum and minimum strain rate and is related to regional tectonic shear deformation. By these strain rate components, we can determine comprehensive horizontal surface deformation. The rotation rate is the antisymmetric part of the velocity gradient tensor, representing the rotation feature of the very small deformation unit.
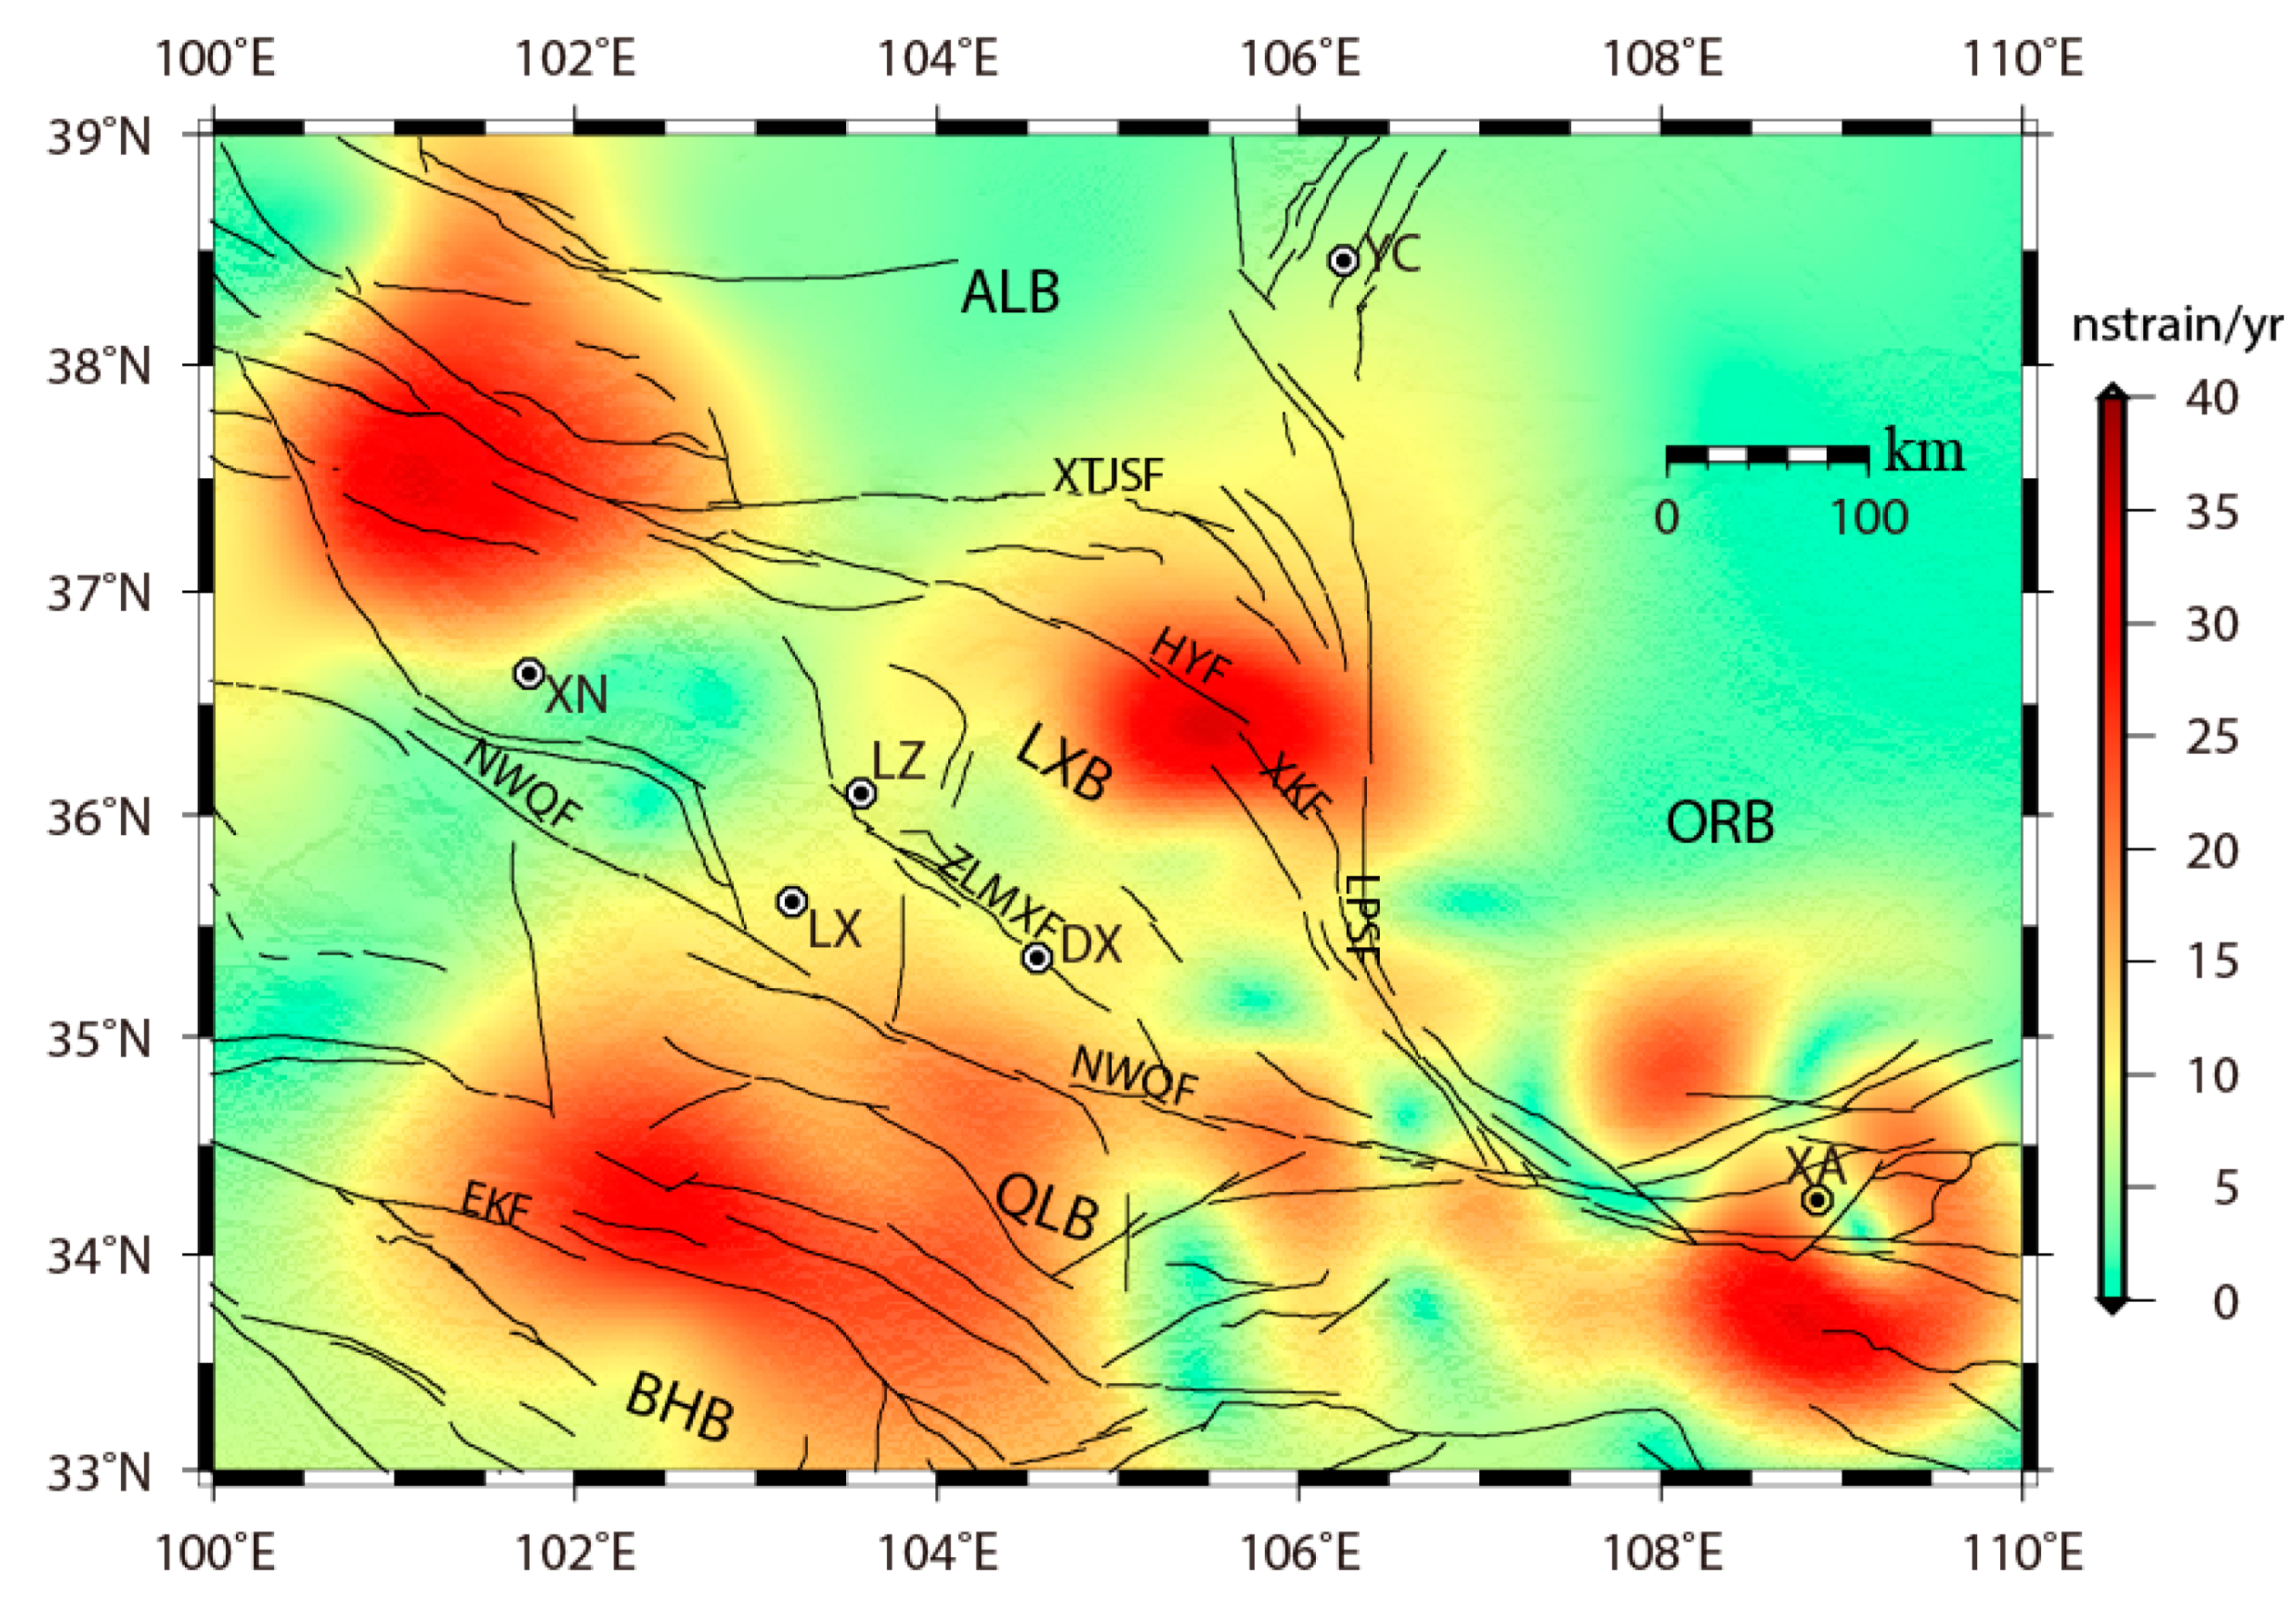
Figure 9 shows the second invariant and corresponding uncertainties. The maximum magnitude of the uncertainties is about 8 nstrain/yr (10−9/year), much smaller than the second invariant at the significant strain partitioning area. The remarkable strain rates were located in the main fault zone and tectonic transformation area. In the intersection area between the HYF and Lenglongling Fault (LLLF), a wide region of strain rates were obtained with a maximum magnitude of about 45 nstrain/yr. Along the XKF, located at the intersection region between the HYF and LPSF, localized strain rates were obtained with a magnitude of about 50 nstrain/yr. Along the NWQF and the EKF, significant strain rates were also obtained with various magnitudes. Additionally, a large strain rate (about 70 nstrain/yr) was obtained in the Weihe Basin (WHB), possibly due to the shortening between stations SNHX and XIAA. However, these two stations are undergoing significant subsidence, which may have affected the estimation of the horizontal velocities.
The principal strain rates showed a wide range of crustal deformation behaviors in the northeastern margin of the Tibetan Plateau (Figure 10). Across the HYF, XTJSF, and LPSF, the magnitude of the strain rate vectors gradually decreased, and tended to zero in the ALB and the ORB. Li et al. [18] also obtained negligible strain at the interior of the ALB and the ORB using combined cGPS and campaign-mode observation on the period of 1999–2017. The HYF and LPSF, as the main boundary faults in this region, played an important role in the adjustment of the strain distribution [6]. Several great earthquakes have occurred along these two boundary faults, including the 1622 Guyuan MS 7.0 earthquake and the 1920 Haiyuan MS 8.6 earthquake.
The determined orientation of the principal strain rates along the HYF is consistent with the pattern of pure strike–slip fault [46], the axes of the strain rates being oriented close to 45° to the fault trace, and even swinging around to maintain that angle as the fault zone changes strike [46]. However, the magnitudes of the strain rates decrease from west to east. Along the XKF, the magnitude of extension reduces to about 40 nstrain/yr, and the azimuth of extension is different from that of other segments of the HYF. Along the LPSF, the magnitude of shortening was small, indicating insignificant strain accumulation near the fault and significant strain accumulation in a large area, quite similar to what was observed in the LMSF before the 2008 Wenchuan earthquake [48,49].
Significant positive dilatation (about 60 nstrain/yr) was observed around the LXBJF, with the direction of extension being perpendicular to the fault trace. This indicates that the effective slipping from the four faults of the fault is a mixture of normal faulting and strike–slip faulting. Using geological data and earthquake focal mechanism solutions, Li. et al. [17] concluded that the late Quaternary activity of the QSMZF is left-lateral with normal component, with a strike–slip rate of about 0.5–1.0 mm/yr. In the LXB, the negative dilatation was the first-order feature, while a positive dilatation belt with a north-northeast direction was mapped in the central part of LXB. The Zhuanglanghe–Maxianshan Fault (ZLMXF) is the main active fault in this positive dilatation belt. The Zhuanglanghe Fault (ZLHF) is dominated by thrust slipping at a rate of 3.9 mm/yr as estimated from previous GPS observations [50]. Strain rates are diffuse in the QLB, indicating a complicated pattern of regional tectonic deformation.
Large shear strain rates were obtained at the location of large second invariant (Figure 11). Along the HYF, the magnitude of the shear rates was varied, indicating spatial differences in the slip rates and the locking depth [19,20]. Based on a elastic model, the inversion result from geodetic data showed that on the western part of the HYF, from the Tuolaishan segment (TLS) to the Laohushan segment (LHS), the locking depth of the fault was 15 km, while on the eastern segment the locking depth was shallower, at about 5 km [19,20].
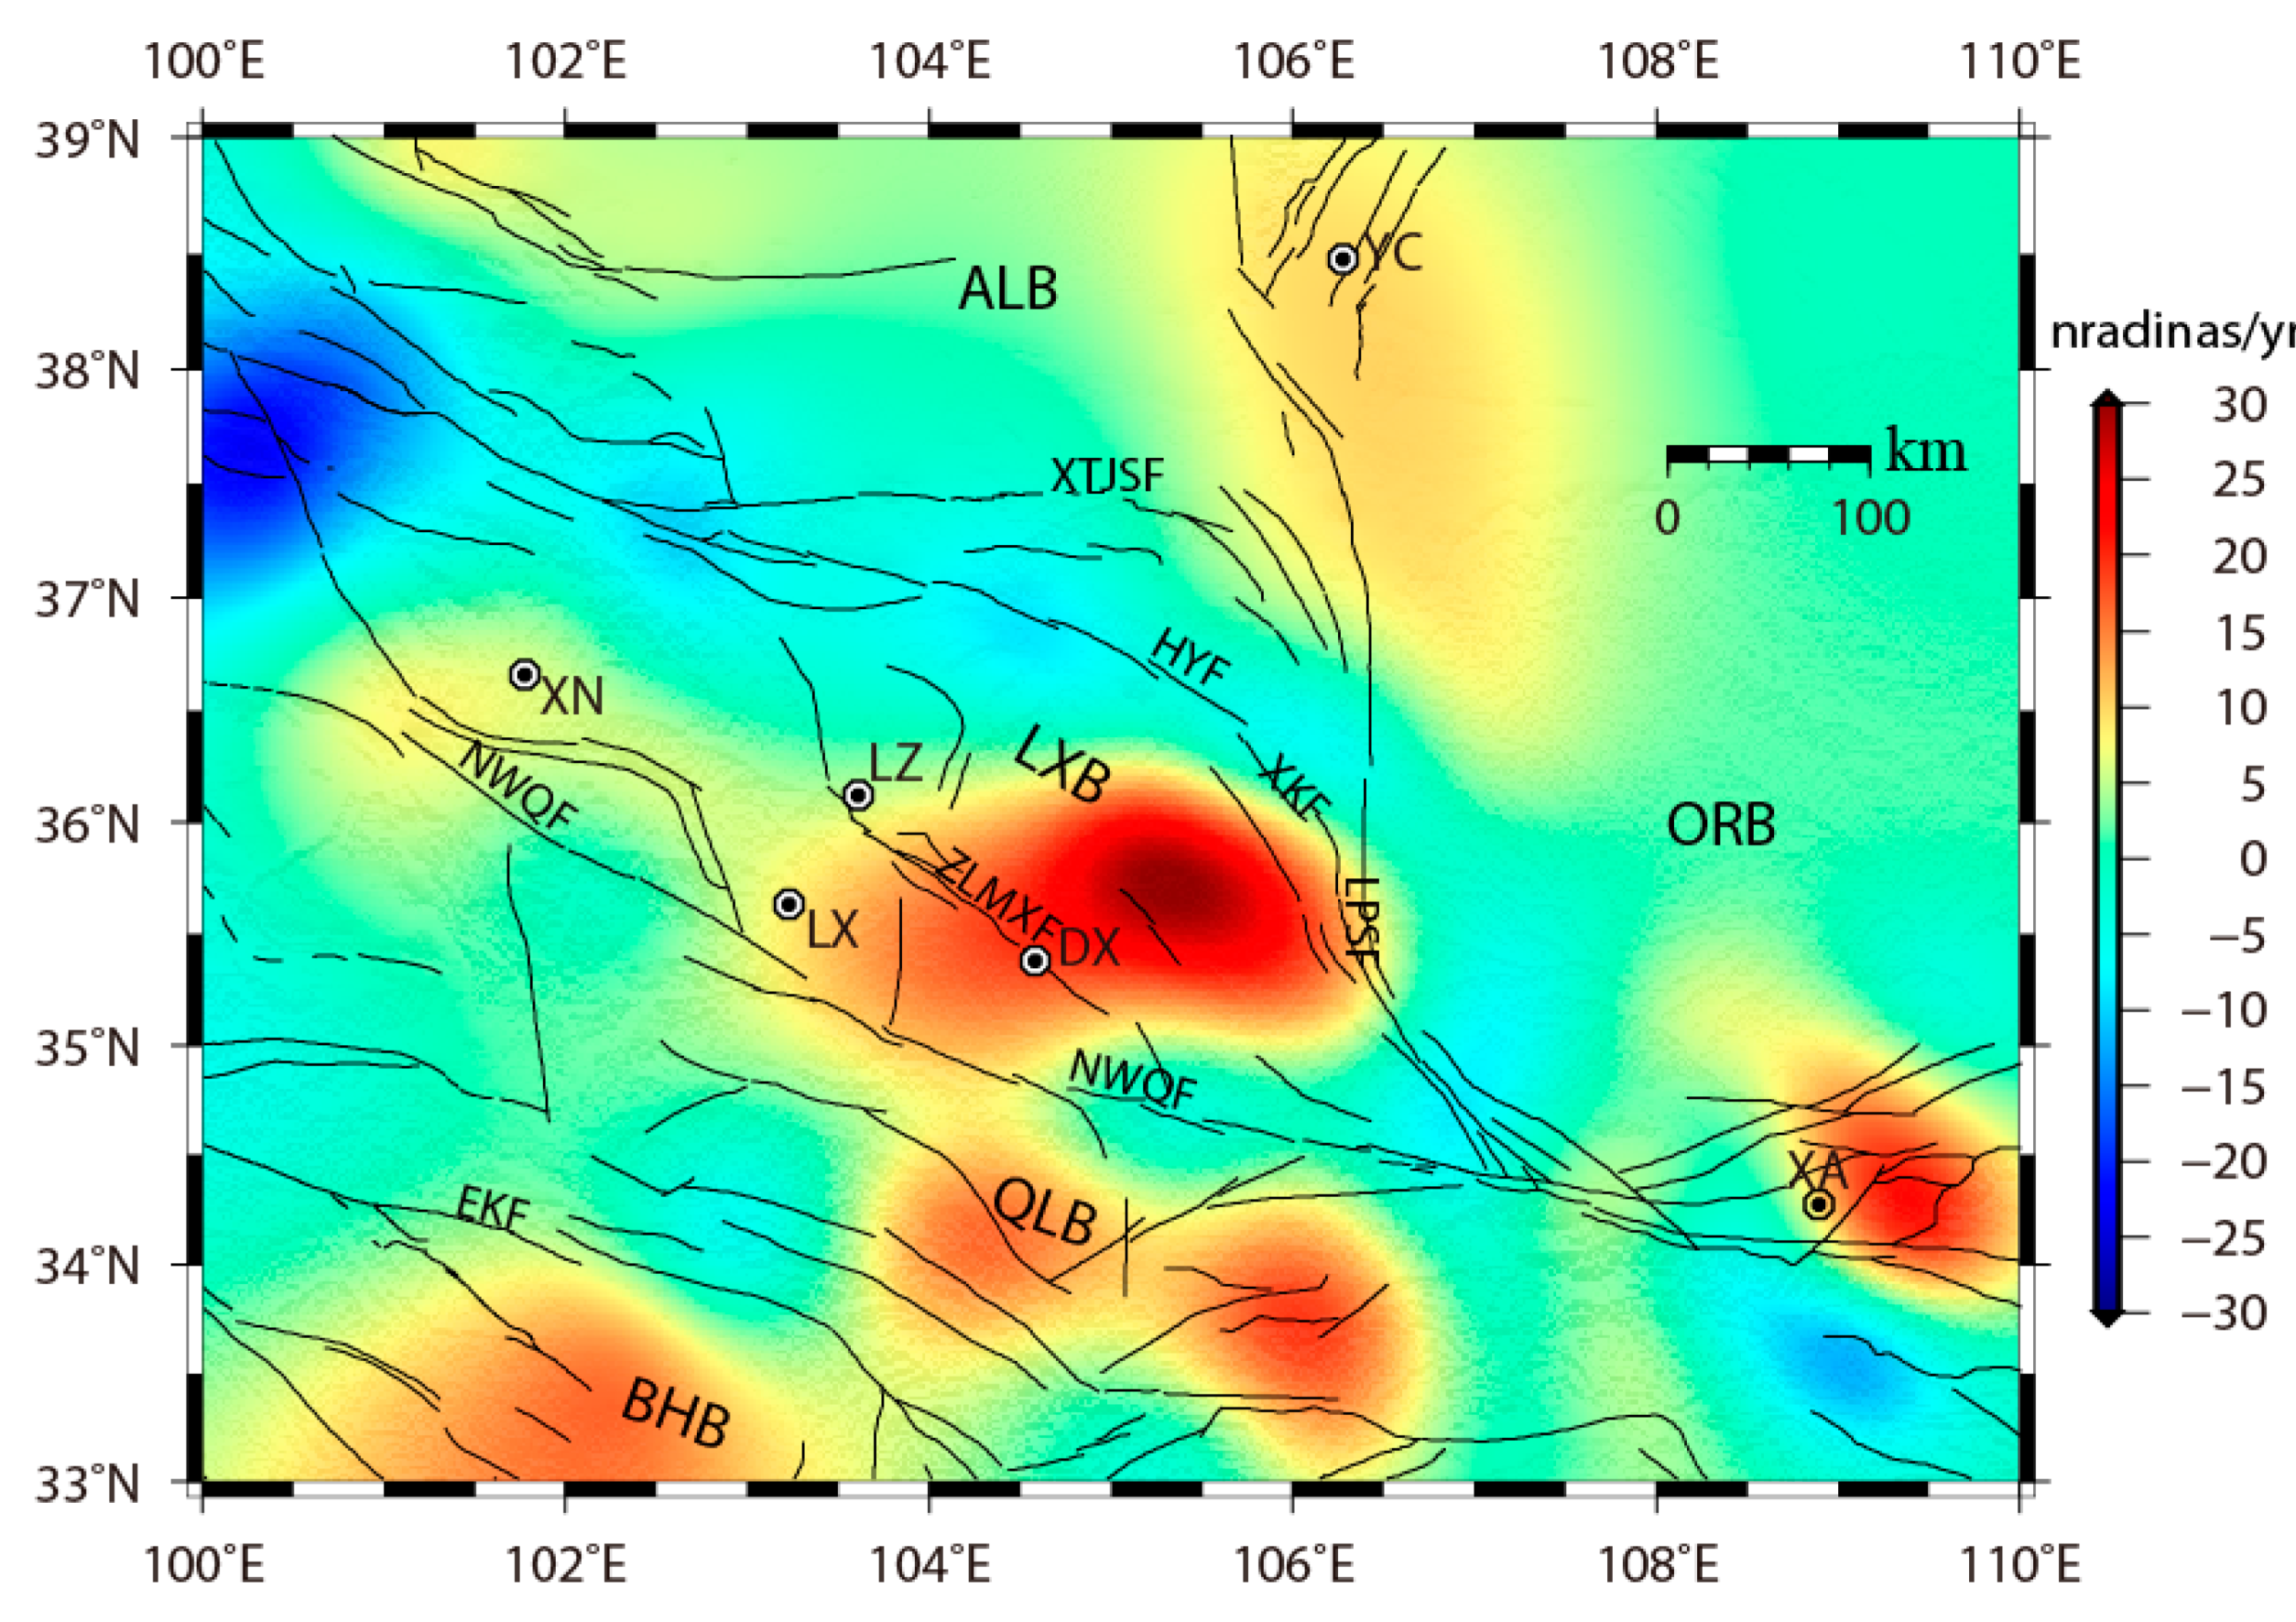
A significant clockwise rotation can be observed around the Dingxi (Figure 12). In this area, we observed a clockwise rotation of 5–7°/Myr, which was in agreement with the result of Li et al. [18]. Paleomagnetic data [51] indicated a significant clockwise rotation of 20–30°/Myr near Lanzhou. Our estimates of rotation rates based on cGPS data show that this region was still undergoing a clockwise rotation. However, the magnitude of this rotation was smaller by a factor of four compared to the paleomagnetically-determined rotation. Along the HYF, we observed an anticlockwise rotation belt with an average rate of 10 nradians/yr. If we used the absolute value of the rotation rate to map the magnitude which was adopted by Li et al. [18], we can obtain the similar results with them, indicating that our rotation rate along the Haiyuan fault agreed with the result of Li et al. [18].
6. Discussion
6.1. Strain Buildup at Various Spatial Scales
GPS strain rate estimated by multiscale spherical wavelet approach can be decomposed into different spatial scales which is dominated by scales of structures. We decomposed total strain rates into scales 3–6 and scale 7, as shown in Figure 13. At scales 3–6, several areas with significant strain accumulation can be identified. A distinct strain rate belt can be observed along the XLLBF at scale 7. This indicates that strain rate, along the HYF, NWQF, and EKF, was significant at the large spatial scale. However, the strain rate was spatially localized along the XLLBF. According to the seismicity and tectonic deformation near the XLLBF, Du et al. [52] concluded this belt has a high probability for a future earthquake with the magnitude of 7.0. The spatially localized strain suggested a high seismic probability along the XLLBF.
6.2. Strain Partitioning at Different Fault Activity Styles
On the northeastern margin of the Tibetan Plateau, except for several main faults, there were numerous strike and thrust faults, indicating complicated historical tectonic deformation. Geodetic data from GPS and InSAR has shown that the left-lateral slip gradually decreased from west to east across the Haiyuan Fault, transformed to shortening on the Liupanshan Fault, and led to multiple thrust fold belts and secondary strike faults [53]. The heterogeneous distribution on space is related to the active styles of the faults. The pattern of strain rates was consistent with present-day geological structures.
6.3. Decoupling between Uplift of the Ordos Block and Horizontal Extrusion on the Northeastern Tibetan Plateau
GPS-derived horizontal velocities revealed that there was a large area of crustal shortening deformation on the northeastern margin of the Tibetan Plateau, while the shortening was insignificant from the LPS to the ORB. Due to the limited distribution of GPS stations, we cannot precisely delineate the specific boundary of the deformation. However, we can confirm that the LPS was at the forefront of the deformation zone, and the ORB was quite stable with no relative deformation at its interior. The structures of the LPS area were characterized by numerous active thrust and strike–slip faults that suggest thin-skinned deformation there [8,16].
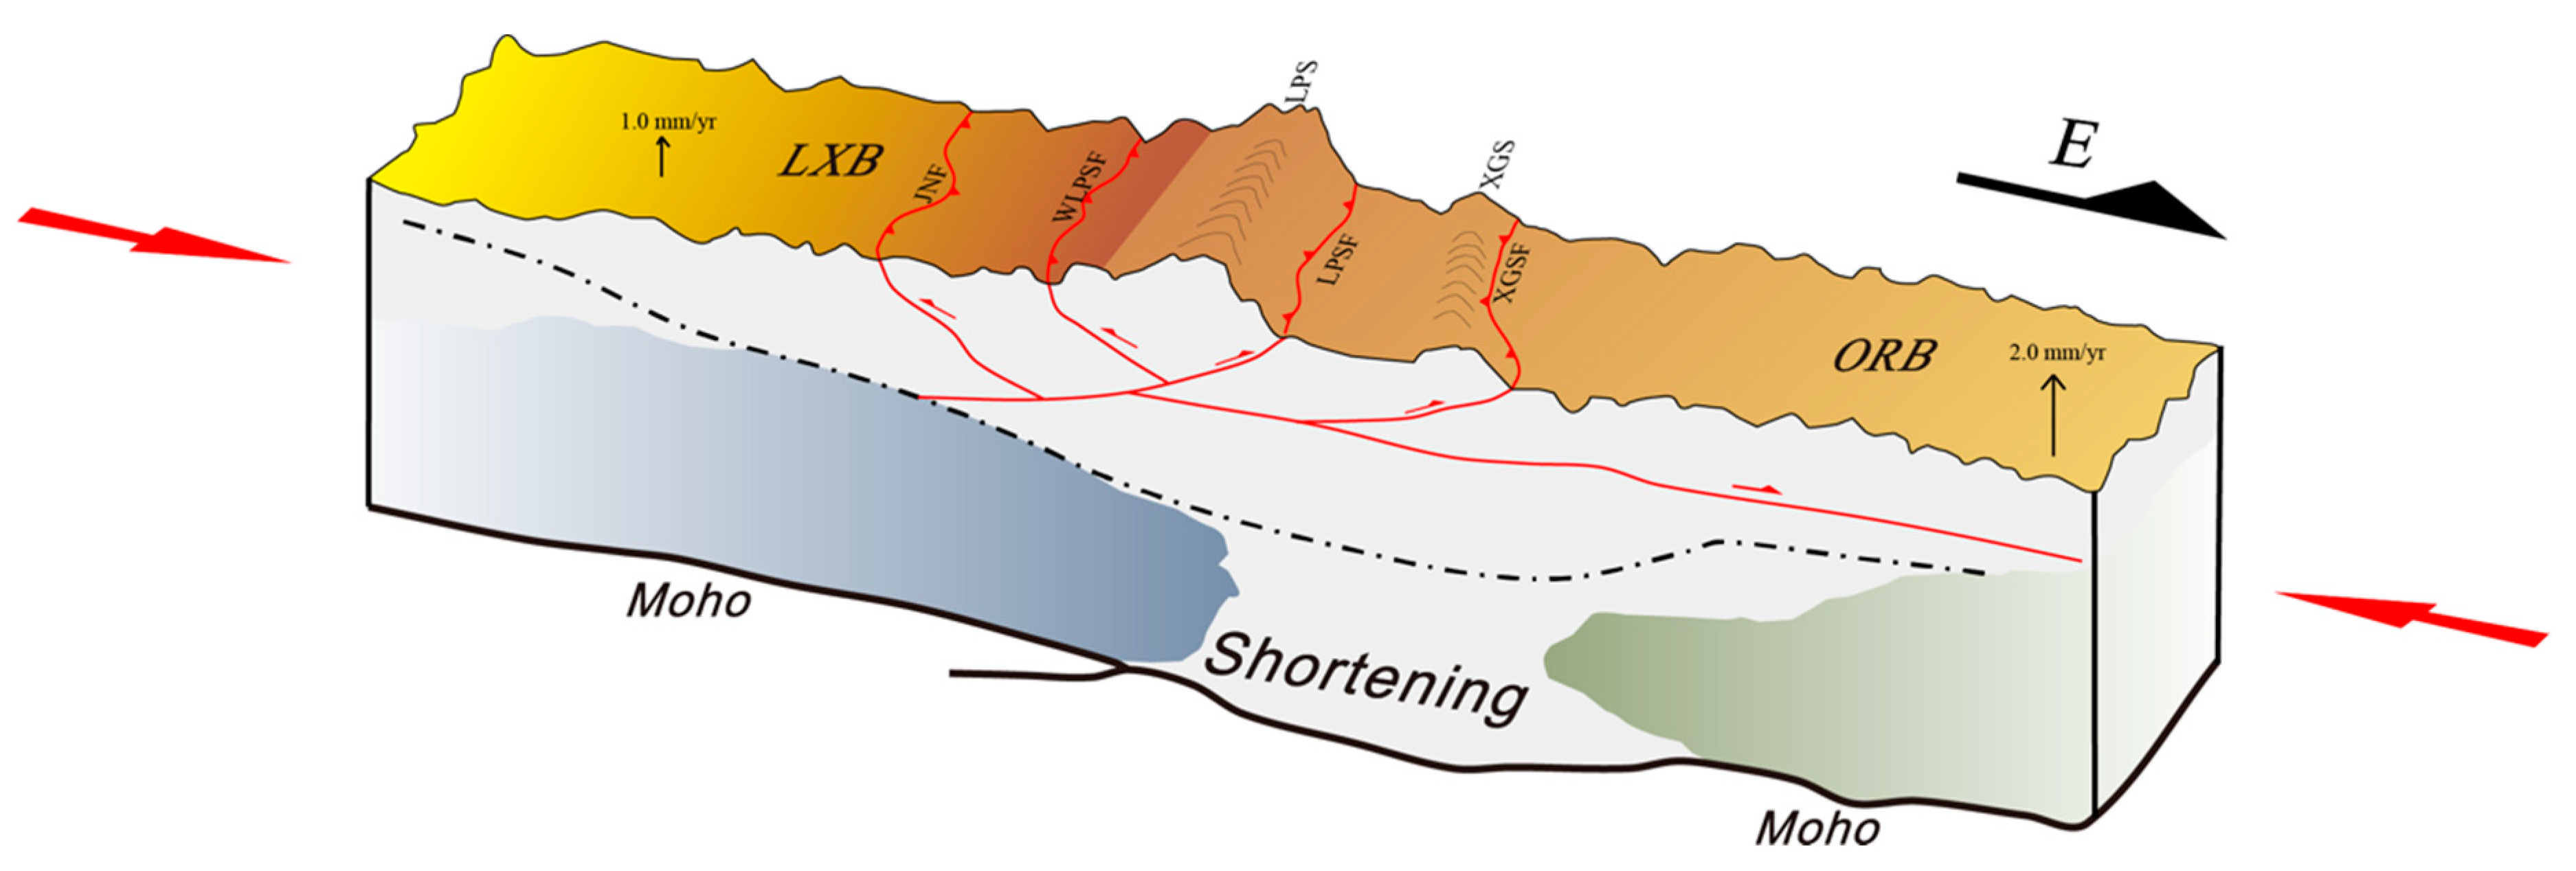
A deep seismic reflection line across the Tibet–Ordos transition zone revealed a complex crustal structure underlying the transition zone and adjacent areas [14]. The thrust deformation on the northeastern margin of the Tibetan Plateau appeared to stop just east of the Xiaoguanshan Fault (XGSF), marking the easternmost edge of the strata [16], indicating that the XGSF is at the frontier of the thrust deformation of the Tibetan Plateau (Figure 14). The overall movement of the ORB on the eastern side of the XGSF was decoupled with the deformation mode of the Tibetan Plateau.
According to previous results of tectonic model across the LPSF [2,54], we could assume that the northeastern part of the Tibetan Plateau should have a larger uplift rate compared with the ORB. However, our results indicated an inconsistent pattern. The first-order vertical crustal deformation is characterized by uplift in the northeastern margin of the Tibetan Plateau. The LXB is uplifting at an average rate of 1.0 mm/yr, while the ORB is uplifting at a rate of 2.0 mm/yr, indicating that the lateral expansion of the Tibetan Plateau had insignificant effect on the uplift pattern of the stable ORB. The vertical crustal deformation derived from GPS observations in NCB (except for the North China Plain area but along the Yanshan and Taihangshan orogenic belts) was characterized by uplift with a rate of 2.0–3.0 mm/yr, similar to the value obtained for the ORB. Therefore, we can infer that the uplift pattern of the ORB was coupled with the NCB but decoupled with the deformation of the northeastern Tibetan Plateau. The similarity of the stratigraphic sequence present in the ORB to that of the rest of the larger NCB indicated that the entire region has undergone a common depositional and tectonic evolution [16].
7. Conclusions
Using GPS data from 58 cGPS stations over the period of 2010–2018, we presented an updated three-dimensional velocity field on the northeastern margin of the Tibetan Plateau and its surrounding areas. We employed a color noise model to represent the statistical characteristic of coordinate time series, and solved for reasonable velocity uncertainties. We adopted an improved spherical wavelet algorithm to estimate multiscale strain rates and rotation rates and analyzed the characteristic of strain accumulation. Some conclusions can be drawn as follows:
The GPS-derived velocities showed a noticeable decrease in magnitude and a change in orientation from the southwestern QLB to the western edge of LPS. The total velocity decrease from the northwest to southeast in the LXB, on the horizontal component, was 5.3 mm/yr within the range of 200 km west of the LPSF. The direction and magnitude of the velocities are diffuse near the boundary of the LPSF. The tectonic deformation and localized strain buildup, together with seismicity jointly imply a high probability for a potential large earthquake at this belt.
The vertical crustal deformation was characterized by uplift in the northeastern margin of the Tibetan Plateau. The LXB and the ORB are both uplifting, with rates of 1.0 and 2.0 mm/yr, respectively. With the new GPS observations, we derived a more rapid uplift rate of the ORB compared to the LXB, refuting the detached structural model of the northeastern margin of the Tibetan Plateau.
Multiscale components of strain rate tensor show a complex deformation pattern on the northeastern margin of Tibet Plateau. Positive dilation was observed around the LXBJF. A significant clockwise rotation was obtained around the Dingxi. The HYF and LPSF played an important role in controlling regional strain partitioning. The distribution of the principal strain rates along the HYF is in agreement with the pattern of strike–slip faults. However, along the LPSF, the direction of principal strain rates is in disorder, indicating that the LPSF is undergoing complicated activities. Strain partitioning demonstrated various spatial scales in different regions, such as a wide range strain near the LLLF and a localized strain near the XKF. The strain rate was spatially localized along the XLLBF. The tectonic deformation and localized strain buildup together with seismicity imply a high probability for a potential large earthquake at this belt.
Supplementary Materials
The following are available online at https://www.mdpi.com/2072-4292/11/1/34/s1, Table S1: Three dimensional GPS velocities in ITRF2014 reference frame and horizontal GPS velocities in Ordos-fixed reference (in mm/yr) together with associated one-sigma uncertainties that have been estimated by using a combined noise model of white plus flicker noise. Figure S1: the position time series of 58 cGPS stations relative to ITRF 2014 reference frame.
Author Contributions
Conceptualization, X.S. and L.Y.; Methodology, X.S., G.M., and L.S.; Data curation, X.S., S.H., and R.X.; Writing—original draft preparation, X.S.; Writing—review and editing, W.W. and G.M.
Funding
This research was funded by the Basic Research Project of the Institute of Earthquake Forecasting, China Earthquake Administration, grant number 2016IES010203; the National Natural Science Foundation of China, grant numbers 41771482, 41604007, and 41874012; and the Basic Research Project of the Institute of Earthquake Forecasting, China Earthquake Administration, grant numbers 2018IEF010102 and 2018IEF010103 and 2016IES010205; and the APC was funded by 2016IES010203.
Acknowledgments
Thanks to Data Center of CMONOC and Shaanxi Earthquake Agency for providing GPS data. The figures are partly drawn using GMT software.
Conflicts of Interest
The authors declare no conflict of interest.
References
- Tapponnier, P.; Xu, Z.; Francoise, R.; Bertrand, M.; Nicolas, A.; Gérard, W.; Yang, J.S. Oblique Stepwise Rise and Growth of the Tibet Plateau. Science 2001, 294, 1671–1677. [Google Scholar] [CrossRef] [PubMed]
- Zhang, P.; Shen, Z.; Wang, M.; Gan, W.; Bürgmann, R.; Molnar, P.; Wang, Q.; Niu, Z.; Sun, J.; Wu, J.; et al. Continuous deformation of the Tibetan Plateau from global positioning system data. Geology 2004, 32, 809–812. [Google Scholar] [CrossRef]
- Ding, G.; Chen, J.; Tian, Q.; Shen, X.; Xing, C.; Wei, K. Active faults and magnitudes of left-lateral displacement along the northern margin of the Tibetan Plateau. Tectonophysics 2004, 380, 243–260. [Google Scholar] [CrossRef]
- Dayem, K.E.; Molnar, P.; Clark, M.K.; Houseman, G.A. Far-field lithospheric deformation in Tibet during continental collision. Tectonics 2009, 28. [Google Scholar] [CrossRef] [Green Version]
- Lease, R.O.; Burbank, D.W.; Zhang, H.; Liu, J.; Yuan, D. Cenozoic shortening budget for the northeastern edge of the Tibetan Plateau: Is lower crustal flow necessary? Tectonics 2012, 31. [Google Scholar] [CrossRef] [Green Version]
- Yuan, D.; Ge, W.; Chen, Z.; Li, C.; Wang, Z.; Zhang, H.; Zhang, P.; Zheng, D.; Zheng, W.; Craddock, W.H.; et al. The growth of northeastern Tibet and its relevance to large-scale continental geodynamics: A review of recent studies. Tectonics 2013, 32, 1358–1370. [Google Scholar] [CrossRef] [Green Version]
- Wang, W.; Kirby, E.; Zhang, P.; Zheng, D.; Zhang, G.; Zhang, H.; Zheng, W.; Cai, C. Tertiary basin evolution along the northeastern margin of the Tibetan Plateau: Evidence for basin formation during Oligocene transtension. Geol. Soc. Am. Bull. 2012, 125, 377–400. [Google Scholar] [CrossRef] [Green Version]
- Guo, X.; Gao, R.; Li, S.; Xu, X.; Huang, X.; Wang, H.; Li, W.; Zhao, S.; Li, X. Lithospheric architecture and deformation of NE Tibet: New insights on the interplay of regional tectonic processes. Earth Planet. Sci. Lett. 2016, 449, 89–95. [Google Scholar] [CrossRef]
- Zheng, R.; Wu, T.; Zhang, W.; Xu, C.; Meng, Q.; Zhang, Z. Late Paleozoic subduction system in the northern margin of the Alxa block, Altaids: Geochronological and geochemical evidences from ophiolites. Gondwana Res. 2014, 25, 842–858. [Google Scholar] [CrossRef] [Green Version]
- Zhang, P.; Burchfiel, B.C.; Molnar, P.; Zhang, W.; Jiao, D.; Deng, Q.; Wang, Y.; Royden, L.; Song, F. Amount and style of Late Cenozoic Deformation in the Liupan Shan Area, Ningxia Autonomous Region, China. Tectonics 1991, 10, 1111–1129. [Google Scholar] [CrossRef]
- Li, C.; Zhang, P.; Yin, J.; Min, W. Late Quaternary left-lateral slip rate of the Haiyuan fault, northeastern margin of the Tibetan Plateau. Tectonics 2009, 28. [Google Scholar] [CrossRef] [Green Version]
- Bao, X.; Xu, M.; Wang, L.; Mi, N.; Yu, D.; Li, H. Lithospheric structure of the Ordos Block and its boundary areas inferred from Rayleigh wave dispersion. Tectonophysics 2011, 499, 132–141. [Google Scholar] [CrossRef]
- Darby, B.J.; Gehrels, G. Detrital zircon reference for the North China block. J. Asian Earth Sci. 2006, 26, 637–648. [Google Scholar] [CrossRef]
- Guo, X.; Gao, R.; Wang, H.; Li, W.; Keller, G.R.; Xu, X.; Li, H.; Encarnacion, J. Crustal architecture beneath the Tibet-Ordos transition zone, NE Tibet, and the implications for plateau expansion. Geophys. Res. Lett. 2015, 42, 10631–10639. [Google Scholar] [CrossRef]
- Burchfiel, B.C.; Zhang, P.; Wang, Y.; Zhang, W.; Song, F.; Deng, Q.; Molnar, P.; Royden, L. Geology of the Haiyuan Fault Zone, Ningxia-Hui Autonomous Region, China, and its relation to the evolution of the Northeastern Margin of the Tibetan Plateau. Tectonics 1991, 10, 1091–1110. [Google Scholar] [CrossRef]
- Zhang, P.; Burchfiel, B.C.; Molnar, P.; Zhang, W.; Jiao, D.; Deng, Q.; Wang, Y.; Royden, L.; Song, F. Late Cenozoic tectonic evolution of the Ningxia-Hui Autonomous Region, China. Geol. Soc. Am. Bull. 1990, 192, 1484–1498. [Google Scholar] [CrossRef]
- Li, X.; Zhang, P.; Zheng, W.; Feng, X.; Pierce, L.K.D.; Xu, H.; Li, X.; Ai, M.; Chen, G.; Dong, J.; et al. Kinematics of Late Quaternary slip along the Qishan-Mazhao fault: Implications for tectonic deformation on the southwestern Ordos, China. Tectonics 2018, 37, 2983–3000. [Google Scholar] [CrossRef]
- Li, Y.; Liu, M.; Wang, Q.; Cui, D. Present-day crustal deformation and strain transfer in northeastern Tibetan Plateau. Earth Planet. Sci. Lett. 2018, 487, 179–189. [Google Scholar] [CrossRef]
- Li, Y.; Shan, X.; Qu, C.; Wang, Z. Fault locking and slip rate deficit of the Haiyuan-Liupanshan fault zone in the northeastern margin of the Tibetan Plateau. J. Geodyn. 2016, 102, 47–57. [Google Scholar] [CrossRef]
- Li, Y.; Shan, X.; Qu, C.; Zhang, Y.; Song, X.; Jiang, Y.; Zhang, G.; Nocquet, J.M.; Gong, W.; Gan, W.; et al. Elastic block and strain modeling of GPS data around the Haiyuan-Liupanshan fault, northeastern Tibetan Plateau. J. Asian Earth Sci. 2017, 150, 87–97. [Google Scholar] [CrossRef]
- Liang, S.; Gan, W.; Shen, C.; Xiao, G.; Liu, J.; Chen, W.; Ding, X.; Zhou, D. Three-dimensional velocity field of present-day crustal motion of the Tibetan Plateau derived from GPS measurements. J. Geophys. Res. 2013, 118, 5722–5732. [Google Scholar] [CrossRef] [Green Version]
- Qu, W.; Lu, Z.; Zhang, Q.; Hao, M.; Wang, Q.; Qu, F.; Zhu, W. Present-day crustal deformation characteristics of the southeastern Tibetan Plateau and surrounding areas by using GPS analysis. J. Asian Earth Sci. 2018, 163, 22–31. [Google Scholar] [CrossRef]
- Zheng, W.; Liu, X.; Yu, J.; Yuan, D.; Zhang, P.; Ge, W.; Pang, J.; Liu, B. Geometry and late Pleistocene slip rates of the Liangdang-Jiangluo fault in the western Qinling mountains, NW China. Tectonophysics 2016, 687, 1–13. [Google Scholar] [CrossRef]
- Chen, J.; Yang, S.; Yan, W.; Wang, J.; Chen, Q.; Zhang, Y. Recent results of the Chinese CMONOC GNSS network. In Proceedings of the ION Pacific PNT 2017 Conference (ION PNT 2017), Honolulu, HI, USA, 1–4 May 2017; pp. 539–546. [Google Scholar]
- Herring, T.A.; King, R.W.; Floyd, M.A.; McClusky, S.C. GAMIT Reference Manual (Version 10.6); Massachusetts Institute of Technology: Cambridge, MA, USA, 2015; Available online: http://geoweb.mit.edu/gg/GAMIT_Ref.pdf (accessed on 16 June 2015).
- Herring, T.A.; King, R.W.; Floyd, M.A.; McClusky, S.C. GLOBK Reference Manual (Version 10.6); Massachusetts Institute of Technology: Cambridge, MA, USA, 2015; Available online: http://geoweb.mit.edu/gg/GLOBK_Ref.pdf (accessed on 16 June 2015).
- Chousianitis, K.; Ganas, A.; Evangelidis, C.P. Strain and rotation rate patterns of mainland Greece from continuous GPS data and comparison between seismic and geodetic moment release. J. Geophys. Res. 2015, 120, 3909–3931. [Google Scholar] [CrossRef] [Green Version]
- Chousianitis, K.; Ganas, A.; Gianniou, M. Kinematic interpretation of present-day crustal deformation in central Greece from continuous GPS measurements. J. Geodyn. 2013, 71, 1–13. [Google Scholar] [CrossRef]
- Petrie, E.J. Modelling Higher-Order Ionospheric Effects on Global GPS Solutions. Ph.D. Thesis, University of Newcastle upon Tyne, Newcastle, UK, December 2010. [Google Scholar]
- Thébault, E.; Finlay, C.C.; Alken, P.; Beggan, C.D.; Canet, E.; Chulliat, A.; Langlais, B.; Lesur, V.; Lowes, F.J.; Manoj, C.; et al. Evaluation of candidate geomagnetic field models for IGRF-12. Earth Planets Space 2015, 67, 112. [Google Scholar] [CrossRef]
- Thébault, E.; Finlay, C.C.; Beggan, C.D.; Alken, P.; Aubert, J.; Barrois, O.; Bertrand, F.; Bondar, T.; Boness, A.; Brocco, L.; et al. International Geomagnetic Reference Field: The 12th generation. Earth Planets Space 2015, 67, 79. [Google Scholar] [CrossRef]
- Beutler, G.; Moore, A.W.; Mueller, I.I. The international global navigation satellite systems service (IGS): Development and achievements. J. Geodesy 2009, 83, 297–307. [Google Scholar] [CrossRef]
- Boehm, J.; Werl, B.; Schuh, H. Troposphere mapping functions for GPS and very long baseline interferometry from European Centre for Medium-Range Weather Forecasts operational analysis data. J. Geophys. Res. 2006, 111. [Google Scholar] [CrossRef] [Green Version]
- Zus, F.; Dick, G.; Dousa, J.; Wickert, J. Systematic errors of mapping functions which are based on the VMF1 concept. GPS Solut. 2014, 19, 277–286. [Google Scholar] [CrossRef]
- Lyard, F.; Lefevre, F.; Letellier, T.; Francis, O. Modelling the global ocean tides: Modern insights from FES2004. Ocean Dynam. 2006, 56, 394–415. [Google Scholar] [CrossRef]
- Petit, G.; Luzum, B. IERS Conventions; IERS Technical Note No. 32; International Earth Rotation and Reference Systems Service: Frankfurt, Germany, 2004. [Google Scholar]
- Beutler, G.; Brockmann, E.; Gurtner, W.; Hugentobler, U.; Mervart, L.; Rothacher, M.; Verdun, A. Extended orbit modeling techniques at the CODE Processing Center of the International GPS Service for Geodynamics (IGS): Theory and initial results. Manuscripta Geodaetica 1994, 19, 367–386. [Google Scholar]
- Altamimi, Z.; Rebischung, P.; Métivier, L.; Collilieux, X. ITRF2014: A new release of the International Terrestrial Reference Frame modeling nonlinear station motions. J. Geophys. Res. 2016, 121, 6109–6131. [Google Scholar] [CrossRef] [Green Version]
- Langbein, J. Noise in two-color electronic distance meter measurements revisited. J. Geophys. Res. 2004, 109. [Google Scholar] [CrossRef] [Green Version]
- Nikolaidis, R. Observation of Geodetic and Seismic Deformation with the Global Positioning System. Ph.D. Thesis, University of California, San Diego, CA, USA, January 2002. [Google Scholar]
- Su, X.; Meng, G.; Sun, H.; Wu, W. Positioning Performance of BDS Observation of the Crustal Movement Observation Network of China and Its Potential Application on Crustal Deformation. Sensors 2018, 18, 3353. [Google Scholar] [CrossRef] [PubMed]
- Williams, S.D.P. Error analysis of continuous GPS position time series. J. Geophys. Res. 2004, 109. [Google Scholar] [CrossRef] [Green Version]
- Bos, M.S.; Fernandes, R.M.S.; Williams, S.D.P.; Bastos, L. Fast Error Analysis of Continuous GNSS Observations with Missing Data. J. Geodesy 2013, 87, 351–360. [Google Scholar] [CrossRef]
- Tape, C.; Musé, P.; Simons, M.; Dong, D.; Webb, F. Multiscale estimation of GPS velocity fields. Geophys. Int. 2009, 179, 945–971. [Google Scholar] [CrossRef] [Green Version]
- Wu, W.; Su, X.; Meng, G.; Li, C. Crustal deformation prior to the 2017 Jiuzhaigou, Northeastern Tibetan Plateau(China), Ms 7.0 earthquake derived from GPS observations. Remote Sens. 2018, 10, 2028. [Google Scholar] [CrossRef]
- Allmendinger, R.W.; Reilinger, R.; Loveless, J. Strain and rotation rate from GPS in Tibet, Anatolia, and the Altiplano. Tectonics 2007, 26. [Google Scholar] [CrossRef] [Green Version]
- Ye, M.; Meng, G.; Su, X. Locking characteristics and slip deficits of the main faults in the Northeast margin of Tibetan Plateau. Earthquake 2018, 38, 1–12. [Google Scholar]
- Wu, Y.; Jiang, Z.; Zhao, J.; Liu, X.; Wei, W.; Liu, Q.; Zou, Z.; Zhang, L. Crustal deformation before the 2008 Wenchuan Ms 8.0 earthquake studied using GPS data. J. Geodyn. 2015, 85, 11–23. [Google Scholar] [CrossRef]
- Wu, Y.; Jiang, Z.; Liang, H.; Pang, Y.; Zhu, S.; Chang, L.; Chen, C.; Li, J. Deformation Response of Seismogenic Faults to the Wenchuan MS 8.0 Earthquake: A Case Study for the Southern Segment of the Longmenshan Fault Zone. Remote Sens. 2018, 10, 894. [Google Scholar] [CrossRef]
- Zhou, D.; Can, W.; Ren, J. Inversion of slip rates of the Zhuanglanghe Faults and the northern marginal fault of Maxianshan based on GPS measurements. Dizhen Dizhi (Seismol. Geol.) 2005, 27, 706–714. [Google Scholar]
- Sun, Z.; Yang, Z.; Yang, T.; Lin, A. Early Cretaceous Paleomagnetic Results From The Haiyuan Area And Their Tectonic Implications. Chin. J. Geophys. 2001, 44, 675–683. [Google Scholar] [CrossRef]
- Du, F.; Wen, X.; Feng, J.; Liang, M.; Long, F.; Wu, J. Seismo-tectonics and seismic potential of the Liupanshan fault zone (LPSFZ), China. Chin. J. Geophys. 2018, 41, 545–559. [Google Scholar] [CrossRef]
- Zheng, W.; Zhang, P.; He, W.; Yuan, D.; Shao, Y.; Zheng, D.; Ge, W.; Min, W. Transformation of displacement between strike-slip and crustal shortening in the northern margin of the Tibetan Plateau: Evidence from decadal GPS measurements and late Quaternary slip rates on faults. Tectonophysics 2013, 584, 267–280. [Google Scholar] [CrossRef]
- Gao, R.; Wang, H.; Yin, A.; Dong, S.; Kuang, Z.; Zuza, A.V.; Li, W.; Xiong, X. Tectonic development of the northeastern Tibetan Plateau as constrained by high-resolution deep seismic-reflection data. Lithosphere 2013, 5, 555–574. [Google Scholar] [CrossRef]
Figure 1.
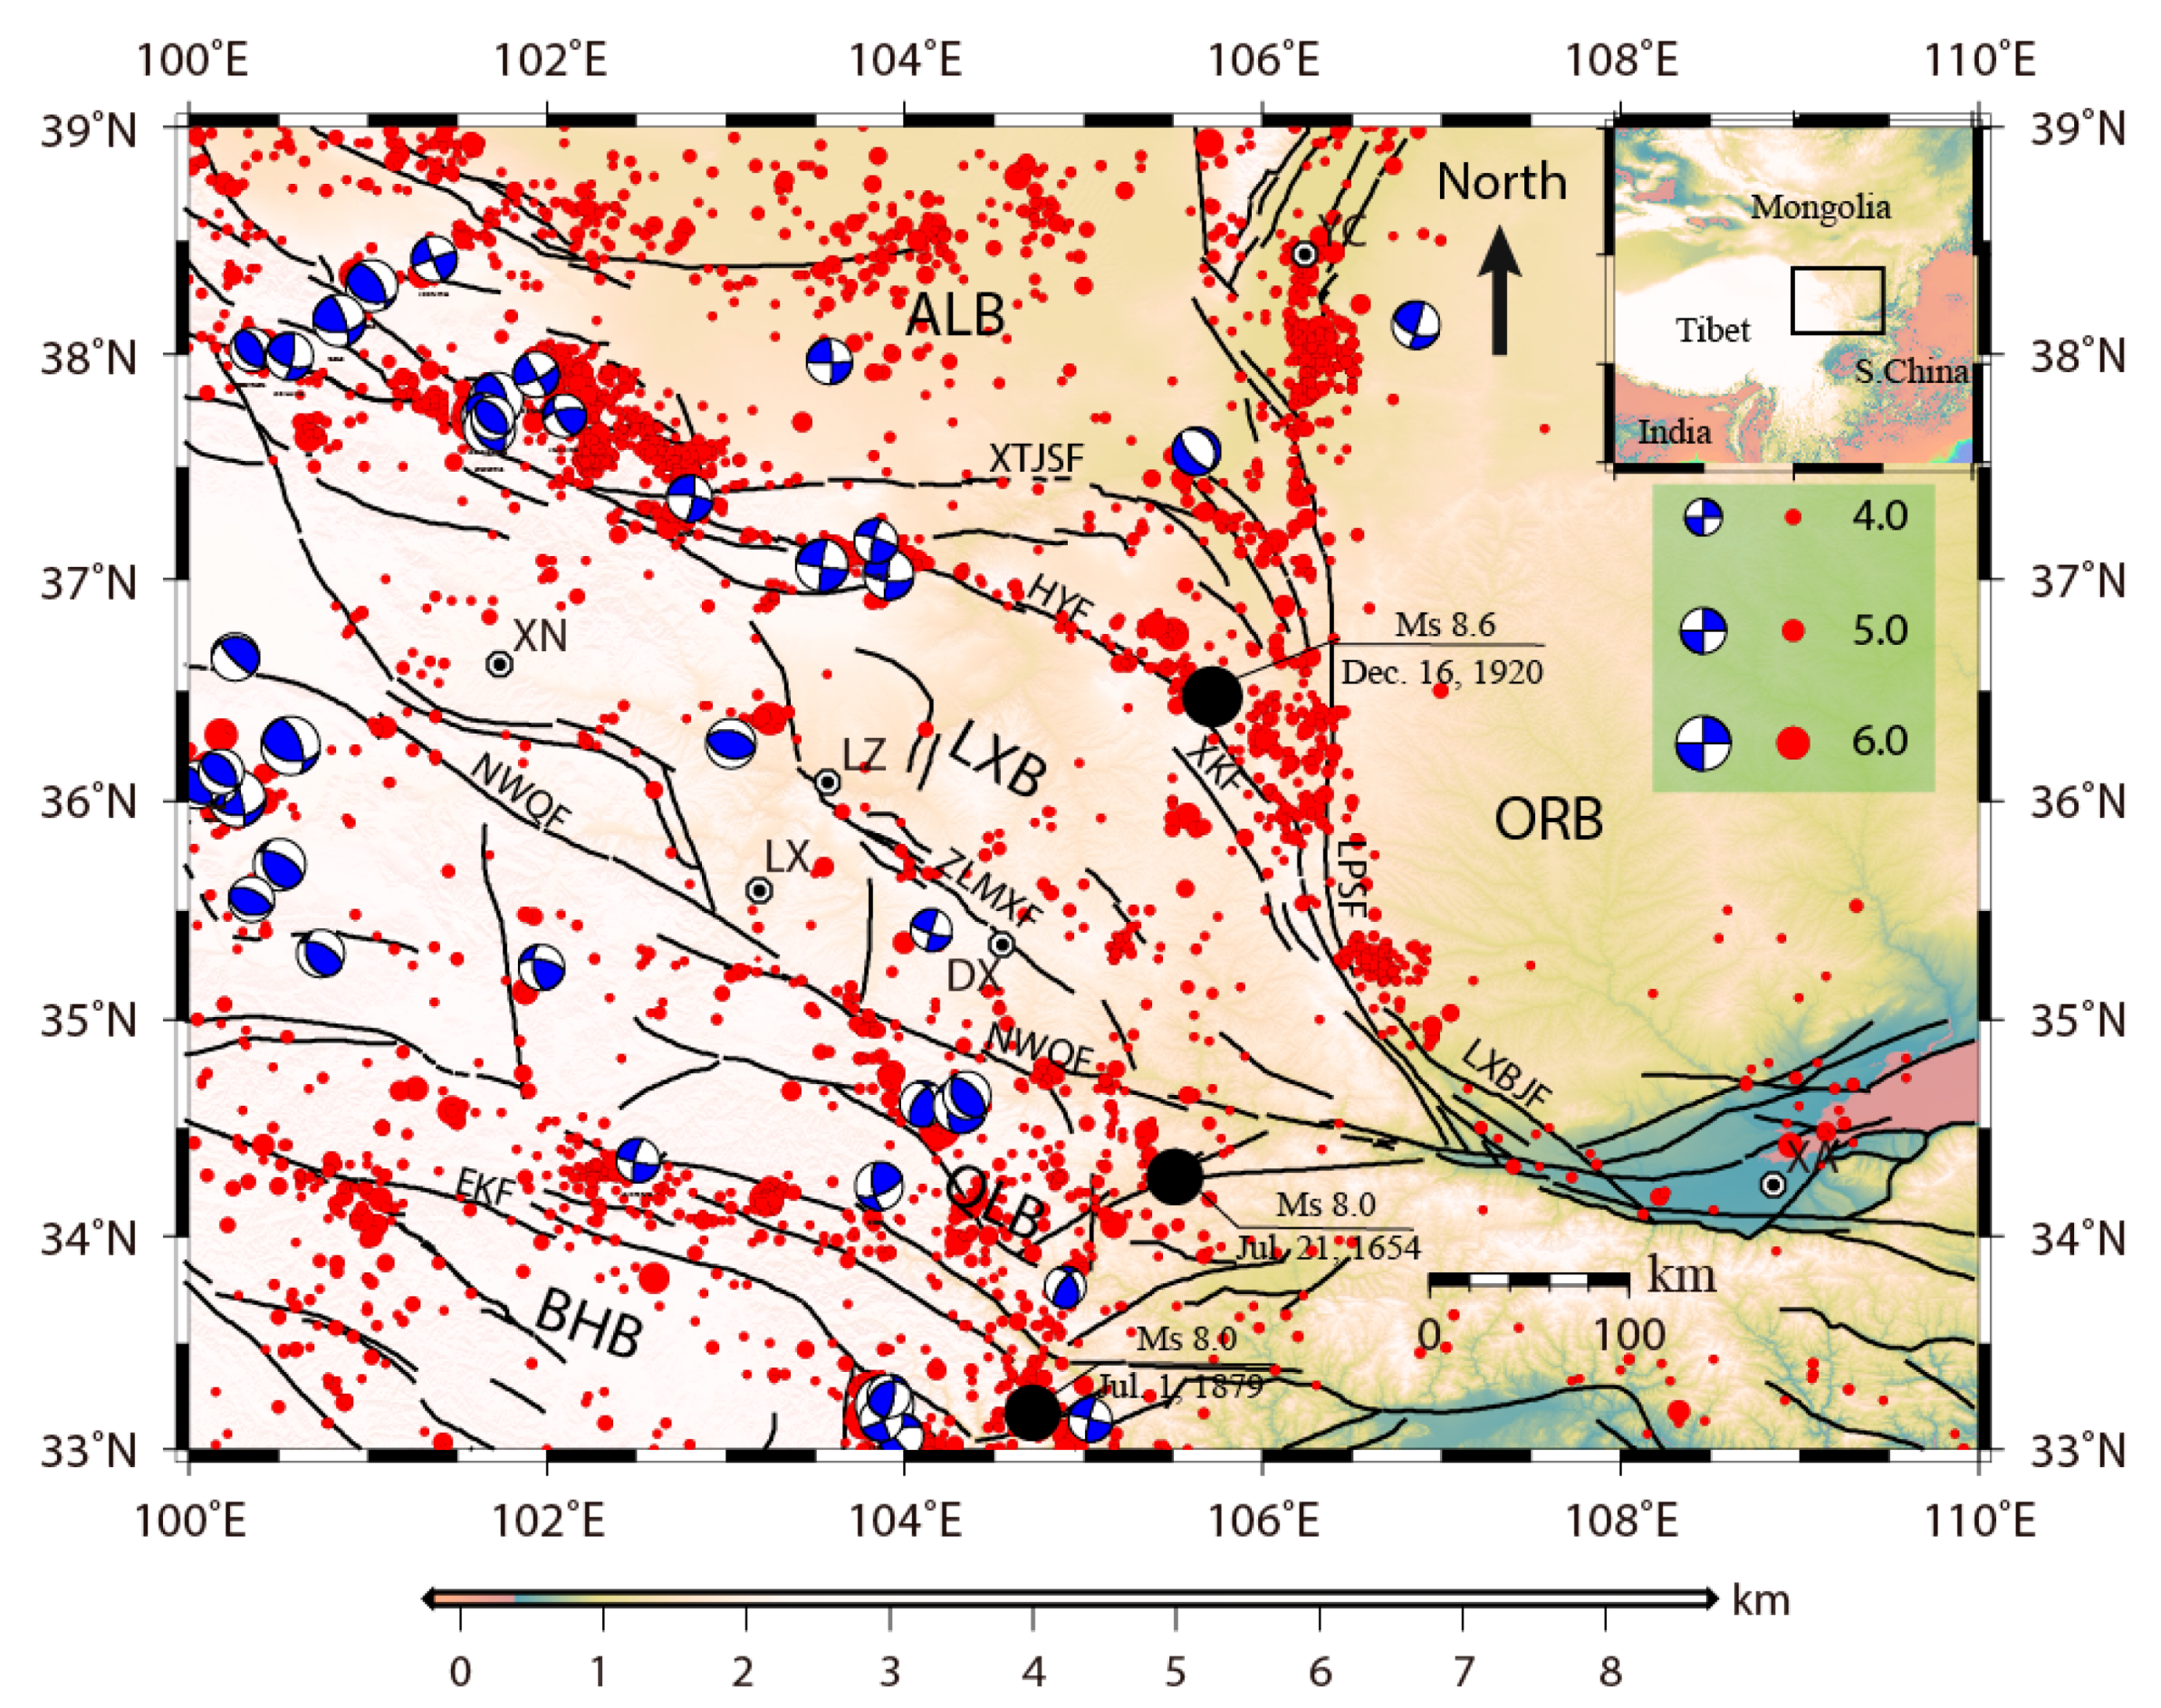
Map of the study area, showing topographic relief, major active faults, earthquake epicenters with Mw > 3.0 (after the China Earthquake Networks Center catalog over 1976–2018), and focal mechanisms of Mw > 5.0 earthquakes (after the Centroid Moment Tensor catalog over 1976–2018). The black lines denote major active faults. The upper right inset map shows the location of the study area. Capital letters are abbreviations of the cities, the block, and the regional active faults. XN denotes Xining city, LZ denotes Lanzhou city, LX denotes Linxia city, DX denotes Dingxi city, XA denotes Xi’an city, and YC denotes Yinchuan city. ALB denotes Alxa block, LXB denotes Longxi block, QLB denotes Qinling block, BHB denotes Bayan Har block, and ORB denotes Ordos block. XTJSF denotes Xiangshan–Tianjingshan Fault, HYF denotes Haiyuan Fault, ZLMXF denotes Zhuanglanghe–Maxianshan Fault, NWQF denotes north fringe fault of the West Qinling Mountains, EKF denotes East Kunlun Fault, LXBJF denotes Longxian–Baoji fault system, XKF denotes Xiaokou Fault, and LPSF denotes Liupanshan Fault. The same abbreviations of the cities, the block, and the regional active faults were adopted in the following figures.
Figure 1.
Map of the study area, showing topographic relief, major active faults, earthquake epicenters with Mw > 3.0 (after the China Earthquake Networks Center catalog over 1976–2018), and focal mechanisms of Mw > 5.0 earthquakes (after the Centroid Moment Tensor catalog over 1976–2018). The black lines denote major active faults. The upper right inset map shows the location of the study area. Capital letters are abbreviations of the cities, the block, and the regional active faults. XN denotes Xining city, LZ denotes Lanzhou city, LX denotes Linxia city, DX denotes Dingxi city, XA denotes Xi’an city, and YC denotes Yinchuan city. ALB denotes Alxa block, LXB denotes Longxi block, QLB denotes Qinling block, BHB denotes Bayan Har block, and ORB denotes Ordos block. XTJSF denotes Xiangshan–Tianjingshan Fault, HYF denotes Haiyuan Fault, ZLMXF denotes Zhuanglanghe–Maxianshan Fault, NWQF denotes north fringe fault of the West Qinling Mountains, EKF denotes East Kunlun Fault, LXBJF denotes Longxian–Baoji fault system, XKF denotes Xiaokou Fault, and LPSF denotes Liupanshan Fault. The same abbreviations of the cities, the block, and the regional active faults were adopted in the following figures.

Figure 2.
Distribution of the continuous GPS (cGPS) sites. Black lines denote the main active faults [3].
Figure 2.
Distribution of the continuous GPS (cGPS) sites. Black lines denote the main active faults [3].

Figure 3.
The spatial distribution of the normalized difference of Gaussian (DOG) wavelet basis function on differential decomposition scales.
Figure 3.
The spatial distribution of the normalized difference of Gaussian (DOG) wavelet basis function on differential decomposition scales.

Figure 4.
Spatial scales of multiscale spherical strain based on the distribution of GPS stations.

Figure 5.
Ordinary cross-validation (OCV) function values against regularization parameter. Black solid triangles indicate optimal estimates.
Figure 5.
Ordinary cross-validation (OCV) function values against regularization parameter. Black solid triangles indicate optimal estimates.

Figure 6.
GPS-derived horizontal velocities with respect to the Ordos-fixed reference frame (blue arrows) and the horizontal velocities predicted by the multiscale spherical wavelet method (red arrows). Error ellipses are at the 95% confidence level. We enlarged the rectangle B for a distinct view.
Figure 6.
GPS-derived horizontal velocities with respect to the Ordos-fixed reference frame (blue arrows) and the horizontal velocities predicted by the multiscale spherical wavelet method (red arrows). Error ellipses are at the 95% confidence level. We enlarged the rectangle B for a distinct view.

Figure 7.
GPS-derived vertical velocities with respect to the ITRF2014 reference frame. Error ellipses are at the 68% confidence level. Blue and black arrows denote uplift and subsidence vectors, respectively.
Figure 7.
GPS-derived vertical velocities with respect to the ITRF2014 reference frame. Error ellipses are at the 68% confidence level. Blue and black arrows denote uplift and subsidence vectors, respectively.

Figure 8.
GPS-derived velocity profile across the Liupanshan Fault (LPSF). The rectangle in the upper right inset map shows the location of the profile. GPS-derived velocities within the rectangle were used to form the velocity profile.
Figure 8.
GPS-derived velocity profile across the Liupanshan Fault (LPSF). The rectangle in the upper right inset map shows the location of the profile. GPS-derived velocities within the rectangle were used to form the velocity profile.

Figure 9.
Principal strain rates and magnitudes of the second invariant (a) and the uncertainties of the second invariant (b). For the principal strain rates, red and blue arrows show extension and compression, respectively.
Figure 9.
Principal strain rates and magnitudes of the second invariant (a) and the uncertainties of the second invariant (b). For the principal strain rates, red and blue arrows show extension and compression, respectively.

Figure 10.
Principal strain rates and magnitudes of the dilatational strain rates. For the principal strain rates, red and blue arrows show extension and compression, respectively. For dilatation rates, red is positive and blue is negative.
Figure 10.
Principal strain rates and magnitudes of the dilatational strain rates. For the principal strain rates, red and blue arrows show extension and compression, respectively. For dilatation rates, red is positive and blue is negative.

Figure 11.
Magnitude of the two-dimensional maximum shear strain rates.

Figure 12.
Magnitude of the vertical axis rotation rate. Red indicates clockwise rotation and blue indicates counterclockwise rotation.
Figure 12.
Magnitude of the vertical axis rotation rate. Red indicates clockwise rotation and blue indicates counterclockwise rotation.

Figure 13.
Principal strain rates and the second invariant at scales 3–6 (a) and scale 7 (b).

Figure 14.
Schematic sketch of the geological setting across LXB to ORB modified from Guo et al. [8]. LPS denotes Liupanshan mountains, XGS denotes Xiaoguanshan mountains, JNF denotes Jingning Fault, WLPSF denotes the west fringe fault of the Liupanshan mountains, and XGSF denotes Xiaoguanshan Fault.

© 2018 by the authors. Licensee MDPI, Basel, Switzerland. This article is an open access article distributed under the terms and conditions of the Creative Commons Attribution (CC BY) license (http://creativecommons.org/licenses/by/4.0/).
Share and Cite
MDPI and ACS Style
Su, X.; Yao, L.; Wu, W.; Meng, G.; Su, L.; Xiong, R.; Hong, S. Crustal Deformation on the Northeastern Margin of the Tibetan Plateau from Continuous GPS Observations. Remote Sens. 2019, 11, 34. https://doi.org/10.3390/rs11010034
AMA Style
Su X, Yao L, Wu W, Meng G, Su L, Xiong R, Hong S. Crustal Deformation on the Northeastern Margin of the Tibetan Plateau from Continuous GPS Observations. Remote Sensing. 2019; 11(1):34. https://doi.org/10.3390/rs11010034
Chicago/Turabian StyleSu, Xiaoning, Lianbi Yao, Weiwei Wu, Guojie Meng, Lina Su, Renwei Xiong, and Shunying Hong. 2019. "Crustal Deformation on the Northeastern Margin of the Tibetan Plateau from Continuous GPS Observations" Remote Sensing 11, no. 1: 34. https://doi.org/10.3390/rs11010034
Note that from the first issue of 2016, this journal uses article numbers instead of page numbers. See further details here.