Article

Spatiotemporal Patterns of Vegetation Greenness Change and Associated Climatic and Anthropogenic Drivers on the Tibetan Plateau during 2000–2015

1
Key Laboratory of Land Surface Pattern and Simulation, Institute of Geographic Sciences and Natural Resources Research, CAS, Beijing 100101, China
2
University of Chinese Academy of Sciences, Beijing 100049, China
3
CAS Center for Excellence in Tibetan Plateau Earth Sciences, Beijing 100101, China
4
Freie Universität Berlin, Institute of Biology, Biodiversity/Theoretical Ecology, 14195 Berlin, Germany
5
School of Public Administration, China University of Geosciences, Wuhan 430074, China
6
Key Lab of Poyang Lake Wetland and Watershed Research of Ministry of Education and School of Geography and Environment, Jiangxi Normal University, Nanchang 330028, China
*
Authors to whom correspondence should be addressed.
Remote Sens. 2018, 10(10), 1525; https://doi.org/10.3390/rs10101525
Submission received: 30 July 2018 / Revised: 18 September 2018 / Accepted: 20 September 2018 / Published: 23 September 2018

Abstract

:
Alpine vegetation on the Tibetan Plateau (TP) is known to be sensitive to both climate change and anthropogenic disturbance. However, the magnitude and patterns of alpine vegetation dynamics and the driving mechanisms behind their variation on the TP remains under debate. In this study, we used updated MODIS Collection 6 Normalized Difference Vegetation Index (NDVI) from the Terra satellite combined with linear regression and the Break for Additive Season and Trend model to reanalyze the spatiotemporal patterns of vegetation change on the TP during 2000–2015. We then quantified the responses of vegetation variation to climatic and anthropogenic factors by coupling climatic and human footprint datasets. Results show that growing season NDVI (GNDVI) values increased significantly overall (0.0011 year−1, p < 0.01) during 2000–2015 and that 70.37% of vegetated area on the TP (23.47% significantly with p < 0.05) exhibited greening trends with the exception of the southwest TP. However, vegetation greenness experienced trend shifts from greening to browning in half of the ecosystem zones occurred around 2010, likely induced by spatially heterogeneous temporal trends of climate variables. The vegetation changes in the northeastern and southwestern TP were water limited, the mid-eastern TP exhibited strong temperature responses, and the south of TP was driven by a combination of temperature and solar radiation. Furthermore, we found that, to some extent, anthropogenic disturbances offset climate-driven vegetation greening and aggravated vegetation browning induced by water deficit. These findings suggest that the impact of anthropogenic activities on vegetation change might not overwhelm that of climate change at the region scale.

Graphical Abstract

1. Introduction

Climate-induced changes in vegetation can feedback into the climate-vegetation-soil continuum via various biotic and abiotic interactions [1,2]. Additionally, anthropogenic activities can also drive vegetation change significantly at the global scale [3]. Therefore, the spatiotemporal variability in vegetation growth can be attributed to the heterogeneity of either climate change or anthropogenic influences, or of both [1,3,4,5]. Thus, monitoring and attributing such spatiotemporal changes in vegetation growth is not only critical to understanding the role that this land cover type plays in the Earth’s climatic system [6], but is also a requirement for developing more sustainable strategies and policies for ecosystem management [7,8].
Long-term records of vegetation indices derived from satellite remote sensing provide unparalleled information regarding the vegetation response to climatic and anthropogenic factors at regional-to-global scales over the last two decades, such as the Normalized Difference Vegetation Index (NDVI) derived from Generation of Global Inventory Modeling and Mapping Studies 3rd Version (GIMMS3g), Système Pour l’Observation de la Terre (SPOT), and MODerate resolution Imaging Spectroradiometer (MODIS) [9,10,11]. A range of evaluation studies have, however, noted the fact that these remote sensing products did not yield consistent patterns of vegetation change [12,13,14,15], likely due to the impacts of sensor shifts or degradation [14,16,17]. In some studies, the widespread areas of browning identified by MODIS Collection 5 (C5) vegetation indices from the Terra satellite could not be detected by Collection 6 (C6) vegetation indices, which is mainly because the algorithm used in the former did not take the effects of sensor degradation into account [14,16].
The Tibetan Plateau (TP), referred to as the “Earth’s third pole” [18], is an ideal location for investigating how fragile and sensitive alpine ecosystems are in response to global change [19]. Numerous studies have addressed vegetation variation and its interactions with the atmosphere on the TP, generally using NDVI as a proxy of vegetation activity. Nevertheless, the magnitude and patterns of vegetation change in this plateau are still debated, to a large extent due to data uncertainties [20,21,22]. For example, growing season NDVI (GNDVI) derived from GIMMS3g exhibited a decreasing trend from 2000 to 2012, however, the GNDVI from C5 products of MODIS Terra remained showing increasing trends for the same period on the TP [23,24,25]. Moreover, these inconsistencies of vegetation changing trends might further intensify the ongoing disputes over drivers for vegetation dynamics on the TP [24,25,26,27]. Studies based on GIMMS3g NDVI, for example, have found a positive correlation between vegetation greenness and temperature [28,29], whereas studies based on MODIS Terra-C5 NDVI argued that climate warming adversely affected vegetation growth [24]. In addition, the TP has experienced pronounced warming since the 1950s [30], while a temporary warming slowdown since the late 1990s has been detected in this region [31], especially after the mid-2000s [32]. However, how recent warming fluctuation influenced vegetation growth on the TP remains poorly understood.
Furthermore, although vegetation change is a consequence of both climate change and anthropogenic activities, relatively less attention has been paid to the latter in studies of the TP [22,33]. The intensity of anthropogenic activities is low overall on the TP but increases rapidly [34,35]. The increase of human population has promoted the development of agriculture and animal husbandry, transportation, urbanization, and tourism, as well as the increase of other forms of human activities [36]. The human population, the number of livestock, and the accessibility factors were known as important driving factors in vegetation degradation at local scales [37,38,39]. Such studies were mostly conducted within an individual factor perspective, e.g., road network and settlement locations. The role of human activities is becoming more and more important in influencing vegetation change [27]. Several studies even argued that anthropogenic activities were the primary contributors to changes in one-third alpine vegetation on the TP since 2000 [33,40]. However, little is known about the relationship of vegetation change with comprehensive anthropogenic disturbances [22].
In light of MODIS NDVI datasets updated from C5 to C6 [16], it is reasonable to reanalyze the changes in vegetation greenness and its major underlying drivers across the TP since the start of the new millennium. Specifically, our aim is: (1) to clarify spatiotemporal patterns of changes in vegetation greenness on the TP; and (2) to quantify the attribution of vegetation change from the perspective of both climatic and anthropogenic factors.

2. Materials and Methods
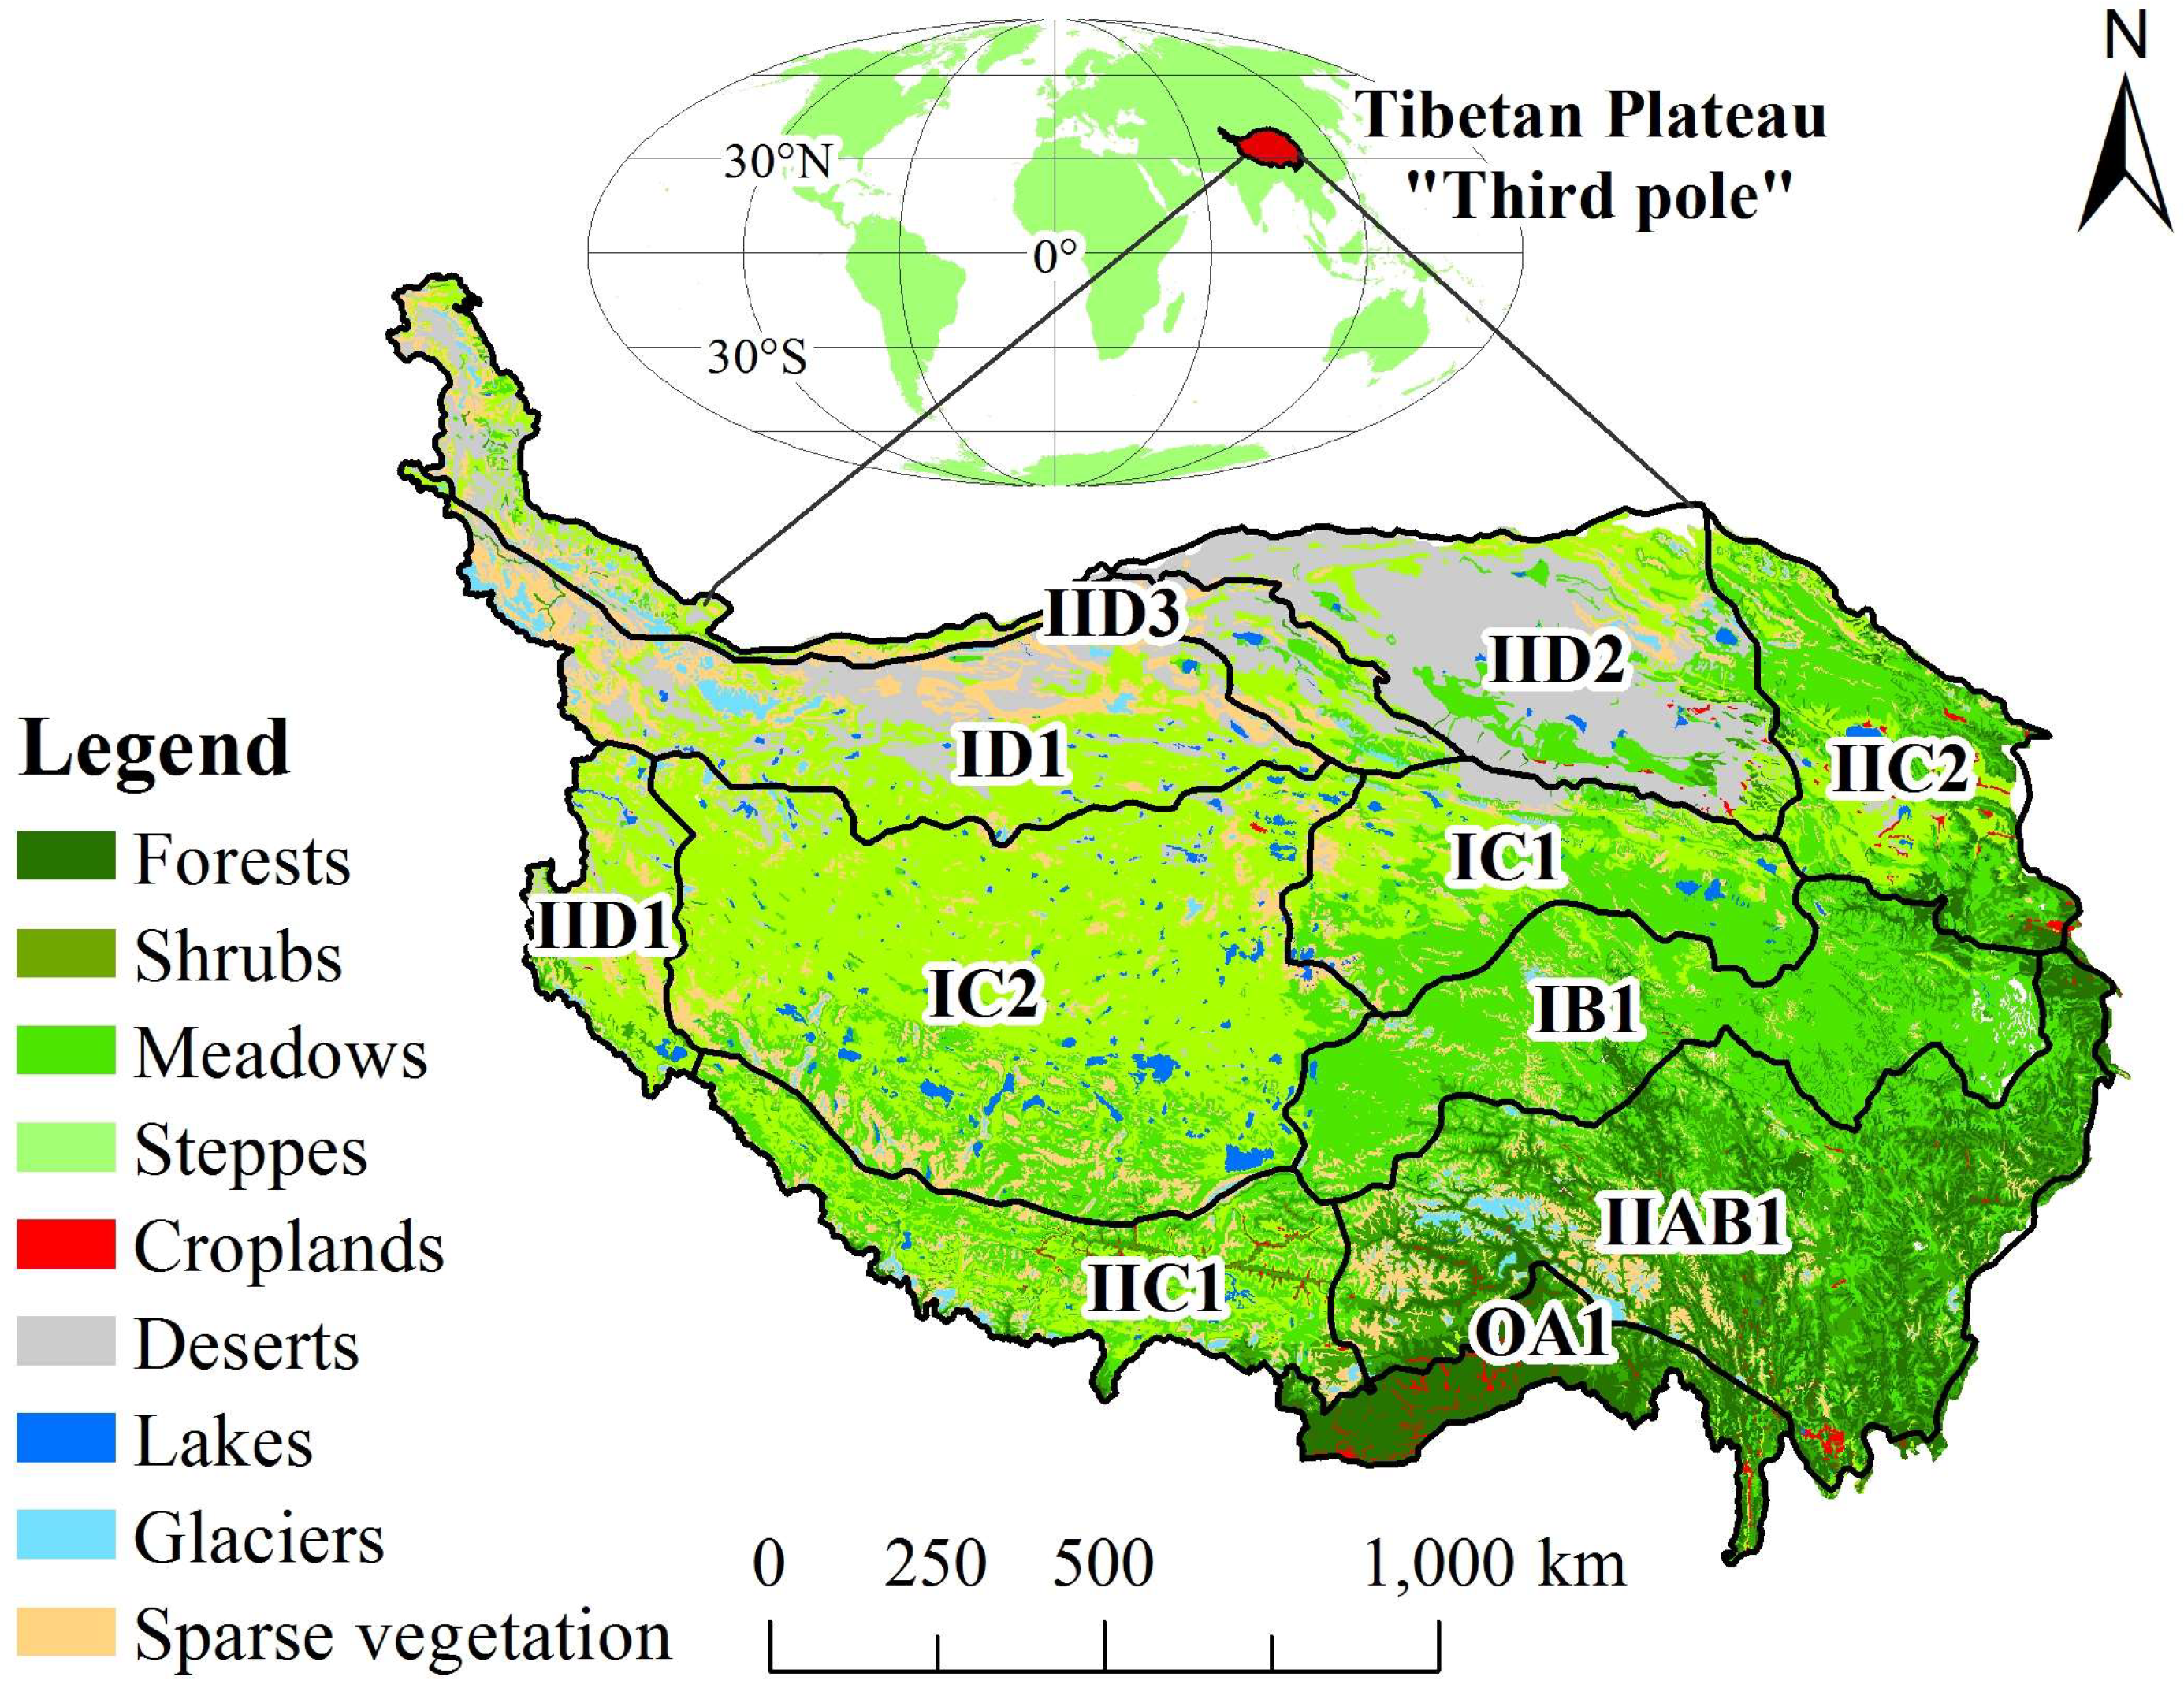
2.1. Study Area

The TP encompasses an area of 2.56 × 10⁶ km2 at an average elevation of higher than 4000 m above sea level (a.s.l.) and is, thus, the highest and largest plateau on Earth [18]. This region is therefore characterized by low temperatures, especially at high altitudes. Annual precipitation in the southeast TP is more than 1000 mm, while it is less than 50 mm in the northwest [41], and this results in a corresponding humidity gradient from humid in the southeast to arid in the northwest. The interactions between these diverse climatic regimes and terrestrial ecosystems contribute to the development of diverse biomes, ranging from subtropical rainforest in the southeast to alpine desert in the northwest of the TP. Ecological regionalization divides the plateau into 11 distinct ecosystem zones (Figure 1, Table 1) [41]. The intensity of anthropogenic activities exhibits significant spatial heterogeneity on the TP [34,35]. Specifically, the intensity of anthropogenic activities is mainly higher in the population-concentrated in the southern and eastern TP than in the sparsely-populated northwestern regions. The northwestern TP was identified to be one of the ten largest wilderness areas [42].

2.2. Data Sources and Pre-Processing

2.2.1. NDVI Datasets

NDVI is one of the most sensitive available indicators of large-scale vegetation growth and has therefore been utilized quite widely in investigations of vegetation greenness and underlying drivers [4,11]. C6 NDVI dataset from MODIS-Terra (MOD13A2) during 2000–2015 used in this study was acquired from National Aeronautics and Space Administration (NASA) (https://ladsweb.modaps.eosdis.nasa.gov/). The comprehensive MODIS products (e.g., NDVI) updated from C5 to C6 was initialized by NASA in February 2015 using a more advanced calibration approach, in order to address this sensor problem as well as other issues. Several evaluation studies have shown that the major sensor degradation impacts have been removed for MODIS-C6 NDVI as compared to MODIS-C5 NDVI [14,16]. This dataset comprises 16-day maximum composite with a spatial resolution of 1 km. We applied an adaptive Savitzky-Golay approach to smooth annual NDVI cycle and to reconstruct a time series in order to mitigate contamination caused by clouds, snow and ice cover; this was done using the TIMESAT software package in the MATLAB environment [43]. We then calculated growing season (May–September) averaged NDVI (GNDVI) in order to analyze change in vegetation greenness and its responses to climate change and anthropogenic disturbance. We masked out the pixels with a GNDVI less than 0.1 to exclude non-vegetated areas [23].

2.2.2. Climatic, Human Footprint Pressure, and Auxiliary Datasets

Climatic datasets, including mean monthly air temperature, precipitation, and solar radiation, were obtained from the China Meteorological Forcing Dataset (http://dam.itpcas.ac.cn/) [44]. The temperature dataset was the combination of observations from 740 meteorological stations across China and Princeton forcing data [45]. The precipitation dataset within south of 40 °N was generated by merging meteorological station records, GLDAS precipitation for the period between 1979 and 1998, and TRMM precipitation data for the period between 1998 and present. The solar radiation dataset was produced by combining the meteorological station data, GEWEX-SRB and GLDAS datasets. These climatic datasets have relatively high accuracy and a spatial resolution of 0.1° × 0.1° from the period between 1979 and the present [44], and have previously been applied to investigate the responses of vegetation growth to climate change [46,47]. In this study, we resampled all climatic datasets to a spatial resolution of 1 km using the nearest neighbor algorithm, to match with NDVI data.
We used a recently updated human footprint pressure dataset (https://www.nature.com/articles/sdata201667) to quantify the relationship between vegetation change and anthropogenic activities [48]. This grid dataset provides a globally-standardized measure for cumulative human pressure on the terrestrial environment and has been used to investigate the impact of anthropogenic activities on environment change such as biodiversity loss [49] and vegetation change [50]. This dataset has a spatial resolution of 1 km covering both 1993 and 2009. In this study, we used human footprint data for 2009 because this is the year that falls within our study period. The values of global human footprint pressure range from 0 to 64 [48], and a high value corresponds with a high level of human pressure. In this study region, the maximum value of human footprint pressure is 46, and over 38% of the area has values of human footprint pressure below 1, while just 5% of the region has values of human footprint pressure above 12.
Auxiliary data, encompassing vegetation cover type, drought, topography, and livestock numbers, were also collected to support the results of this analysis and to enable a discussion of vegetation variation and major driving forces on the TP. The vegetation cover type data was obtained from Institute of Botany, Chinese Academy of Sciences (CAS) (Figure 1) [51]. The Standardized Precipitation-Evapotranspiration Index (SPEI) database was obtained from the Climatic Research Unit of the University of East Anglia (http://sac.csic.es/spei/) [52], which was based on monthly precipitation and potential evapotranspiration at a spatial resolution of 0.5 degrees for 1901–2015. A lower the SPEI value indicates the climate to be drier. The topography data were acquired from the United States Geological Survey global digital elevation model (DEM) with a 1 km spatial resolution grid (https://lta.cr.usgs.gov/GTOPO30). Livestock numbers in the study were obtained from the statistical yearbooks for Qinghai Province and Tibet Autonomous Region.

2.3. Methods

2.3.1. Linear Regression Analysis

We performed a linear regression analysis to analyze monotonic trends in GNDVI. Thus, the trend slope in a multi-year regression equation represents inter-annual change, and can be solved using the ordinary least squares method (OLS), as follows:
S l o p e = n × t = 1 n t × G N D V I t ( t = 1 n t ) ( t = 1 n G N D V I t ) n × t = 1 n t 2 ( t = 1 n t ) 2
where Slope refers to the inter-annual trend in GNDVI, n is the number of years simulated, and GNDVIt is the value of this index in the tth year. A positive slope therefore indicates vegetation greening, while a negative one indicates vegetation browning [14]. We determined the significance of variation via F-tests to calculate confidence levels. Additionally, the change percentages of GNDVI in each case correspond to the ratio between Slope and averaged GNDVI.

2.3.2. The Break for Additive Season and Trend Model (BFAST)

The BFAST model was developed to identify gradual and abrupt changes in land surface [53]. This approach is essentially an iterative procedure to decompose observed time series data into three additive components of trend, seasonality, and remainder components (e.g., noise), and has been widely applied to time series data derived from satellite images (e.g., NDVI) to detect climate-driven biophysical indicators [53,54]. The method is described mathematically, as follows:
Y t = T t + S t + e t , t = 1 , , n
where Yt denotes the NDVI time series at time t, while Tt, St, and et refer to the trend, seasonal, and remainder components of corresponding records, respectively.
We used a model with either zero or one breakpoint (namely bfast01classify in the R project, available at https://cran.r-project.org/web/packages/bfast/index.html) as modified by de Jong et al. [54] to detect the most influential trend shifts in vegetation greenness. This model was always fitted to pre-processed monthly NDVI time series. However, as the plant growing season in most regions of the TP is very short (May–September) [55], we fitted pre-processed 16-day NDVI time series in this model. The existence of a breakpoint was estimated though moving sums (MOSUMs) of OLS residuals (OLS-MOSUM), and if OLS-MOSUM test signaled significant instability (at the 5% significance level), then the breakpoint was captured and its date was also extracted. Finally, the presence of no break or a single ‘most important’ event was confined to within the period 2004–2012 in order to avoid regression in one period with too few data points (Figure S1).

2.3.3. Partial Correlation Analysis

Partial correlation analysis has been widely used to detect the major climatic driving factors on vegetation growth via exploring the links between vegetation growth and a single climate factor while eliminating the effects of other climatic factors [47,56]. Ongoing work has led to an increasing recognition of time lag effects on vegetation responses to climate change at the regional and global scale [5,56]. The time lag of the vegetation response to climate at the monthly scale is generally shorter than three months, but those time lags differ among different vegetation type [56]. Since the length of the growing season on the TP is generally less than five months, we considered time lags of up to two months in this study. In consideration of the time-lag effects of the vegetation greenness responses to different climatic factors, including temperature, precipitation and solar radiation, we selected growing season (May to September) without monthly lag, one-month lag of growing season (April to August), and two-month lag of growing season (March to July) as the three types of time lag for analyses. We then calculated partial correlations between GNDVI and each climatic factor, setting the other two variables for control in each ecosystem zone. For each climatic factor, the lag months (e.g., 0, 1, and 2) of the growing season exhibiting the maximum partial correlation coefficient were considered as the best periods to evaluate the responses of vegetation greenness to that climatic factor. We used F-tests to calculate the significance level for each partial correlation.

3. Results

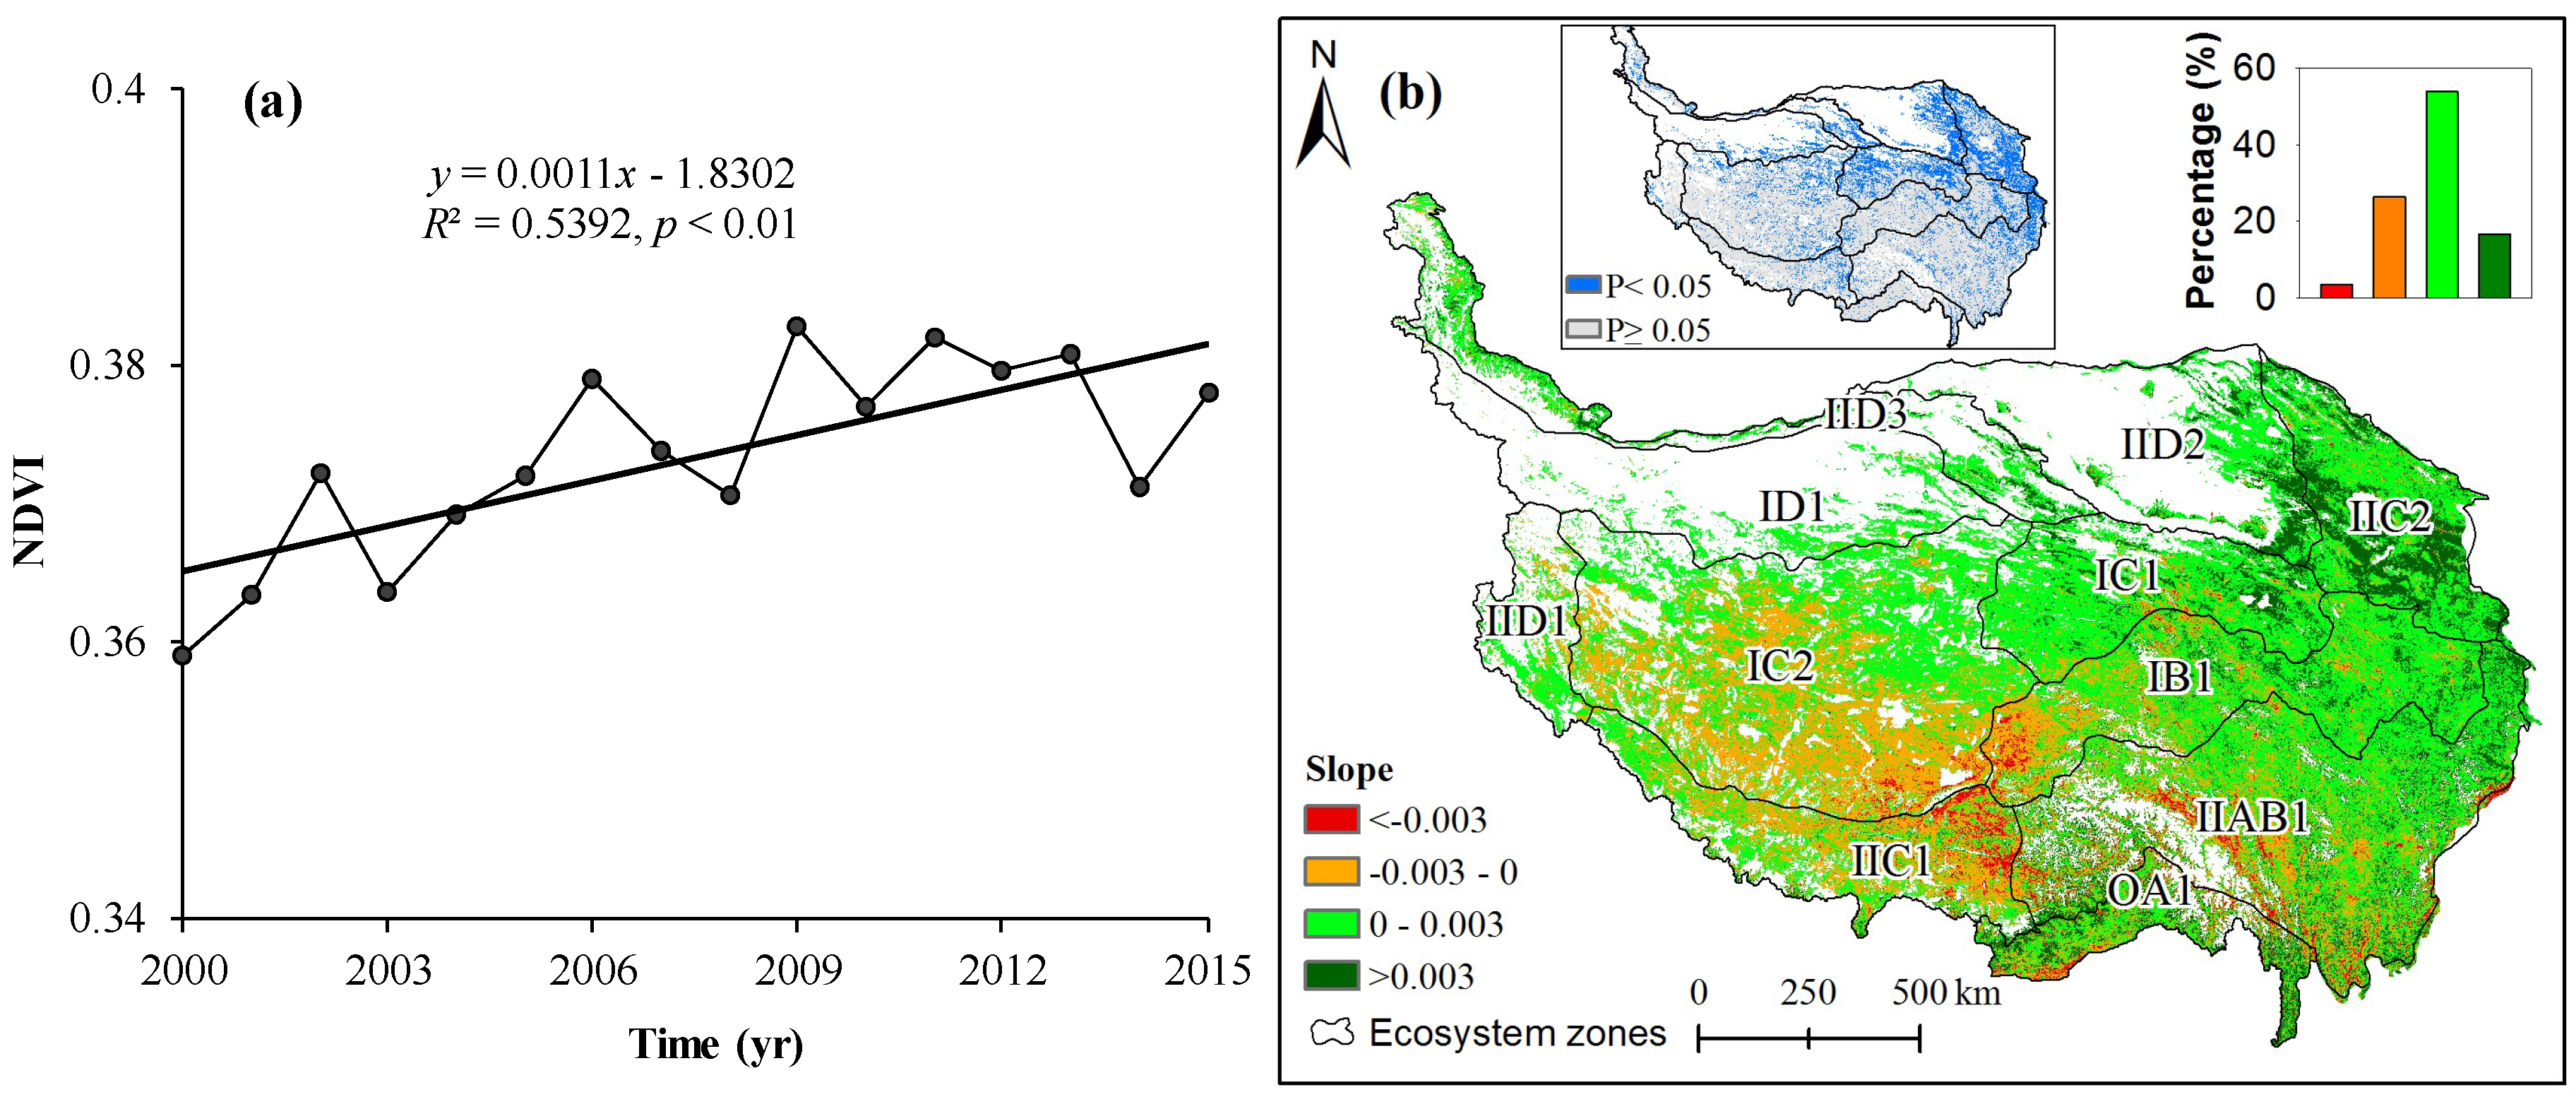
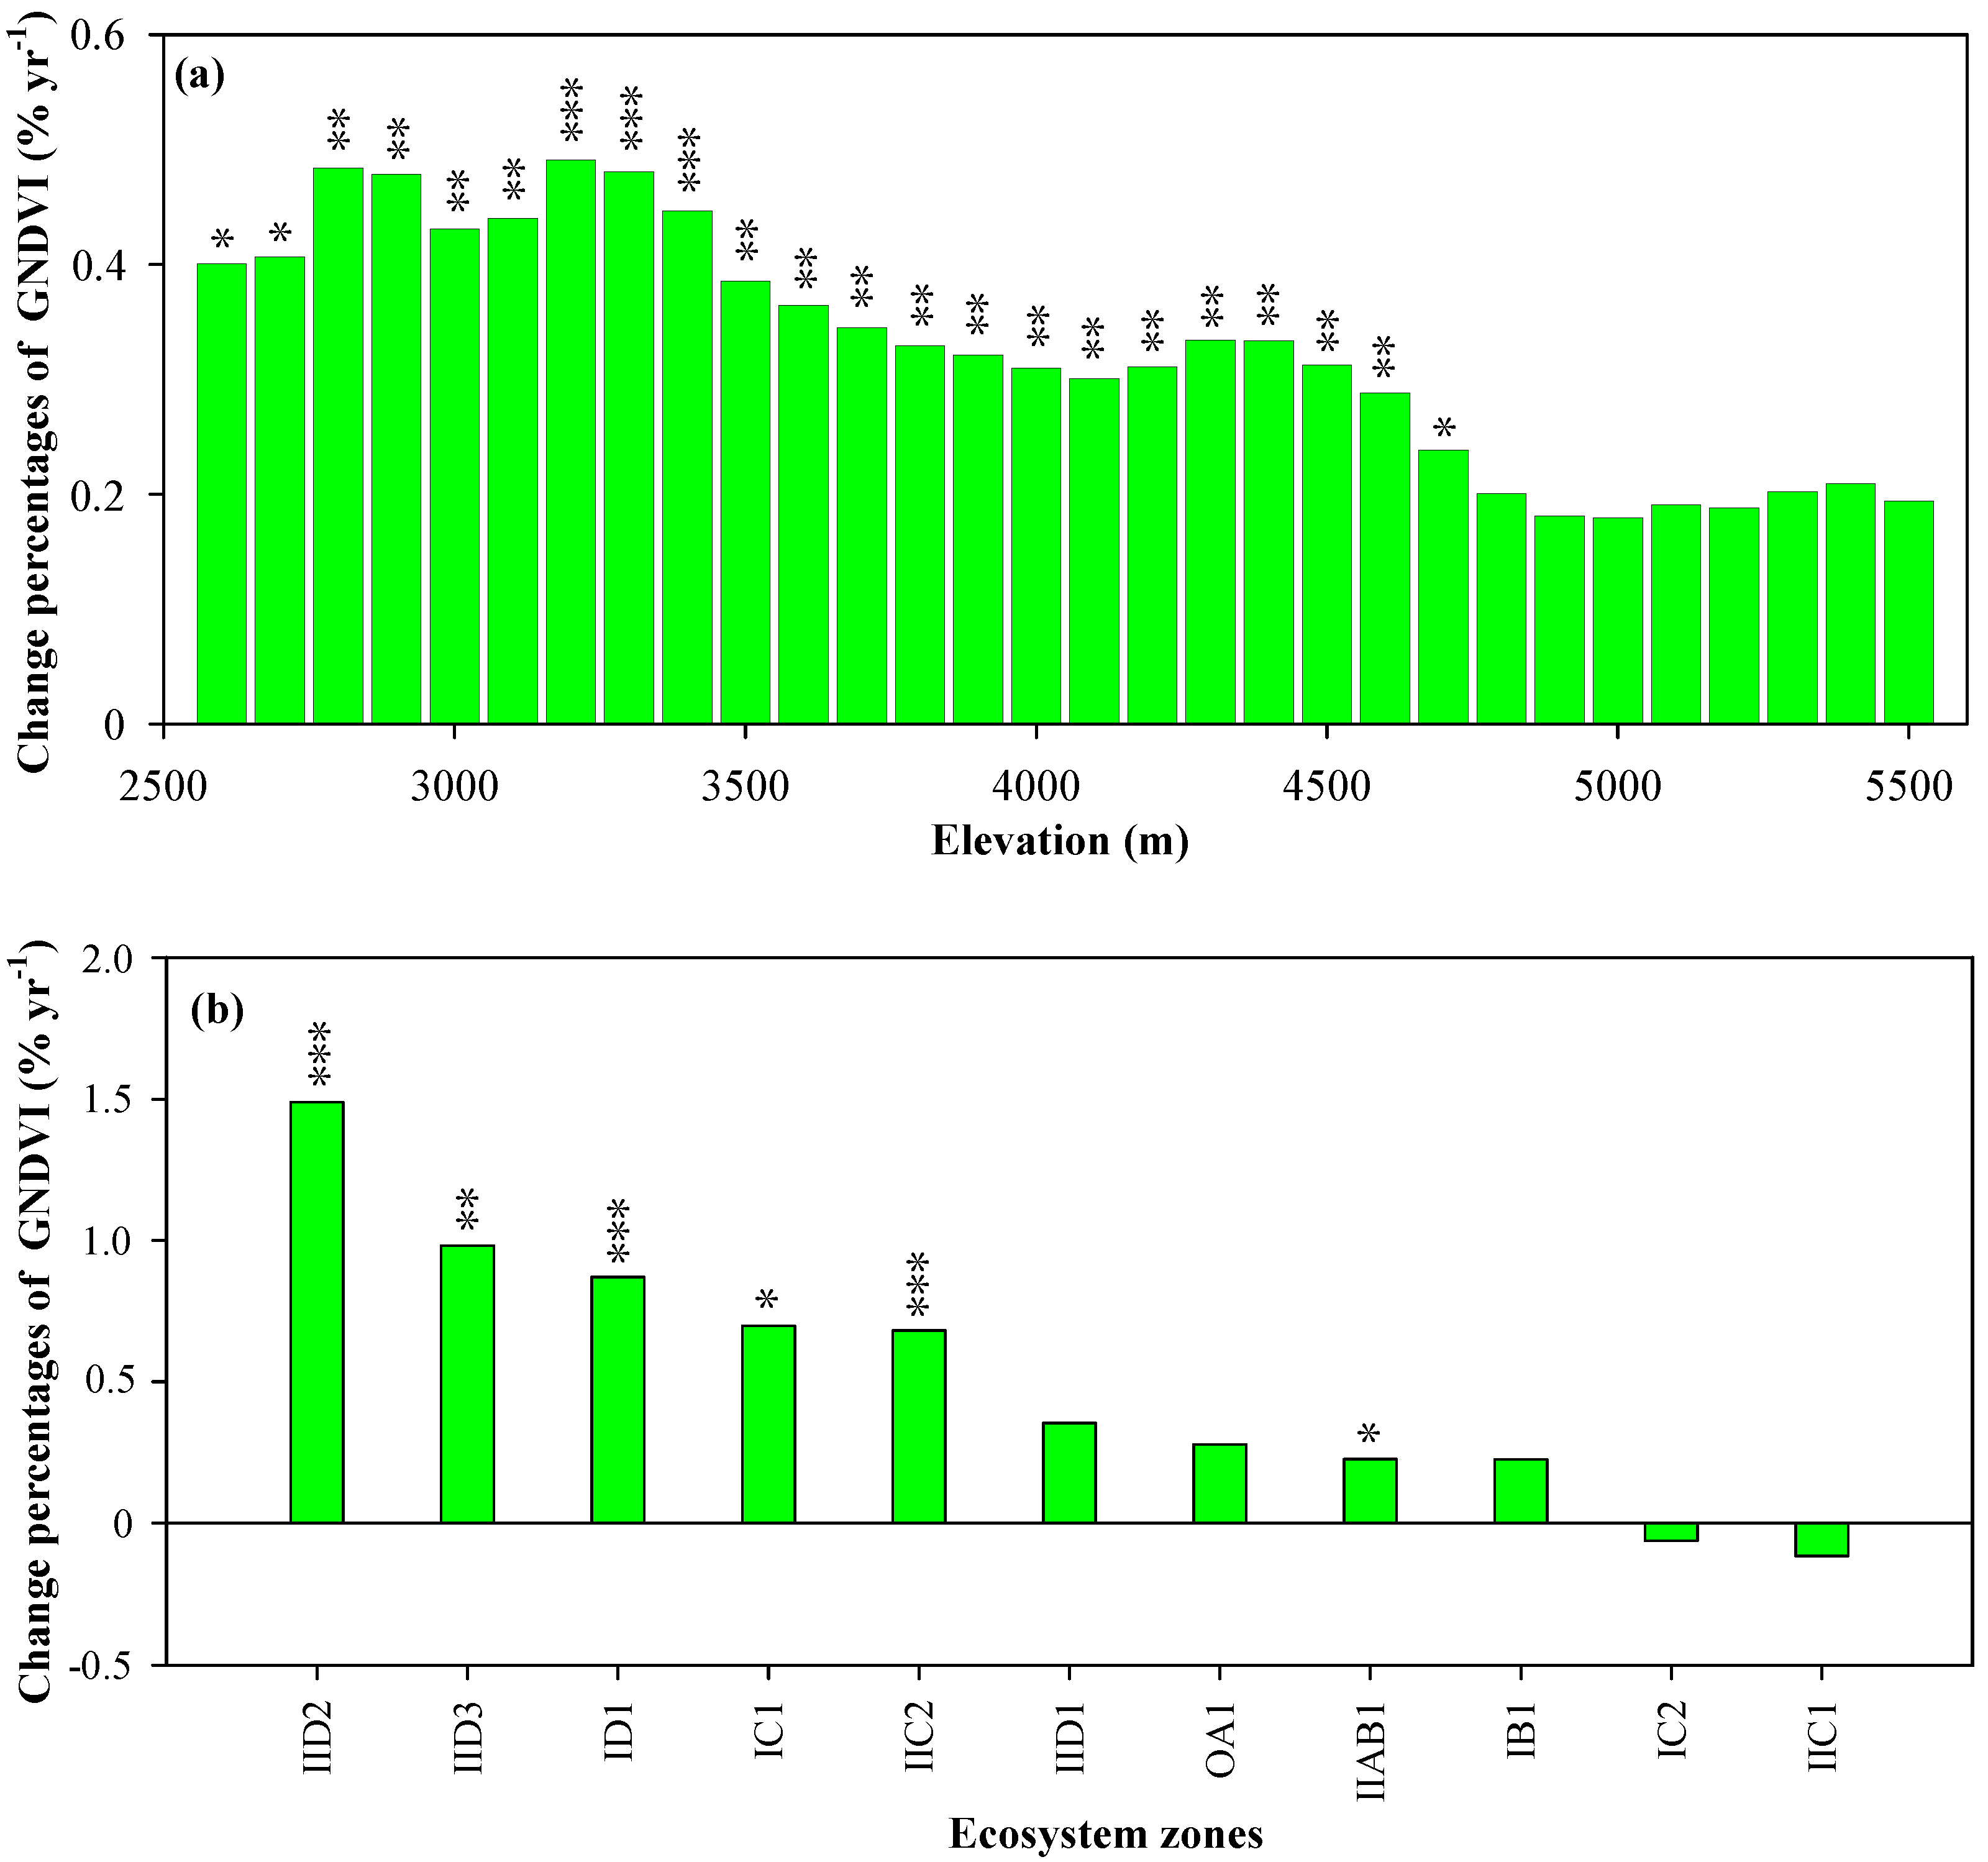
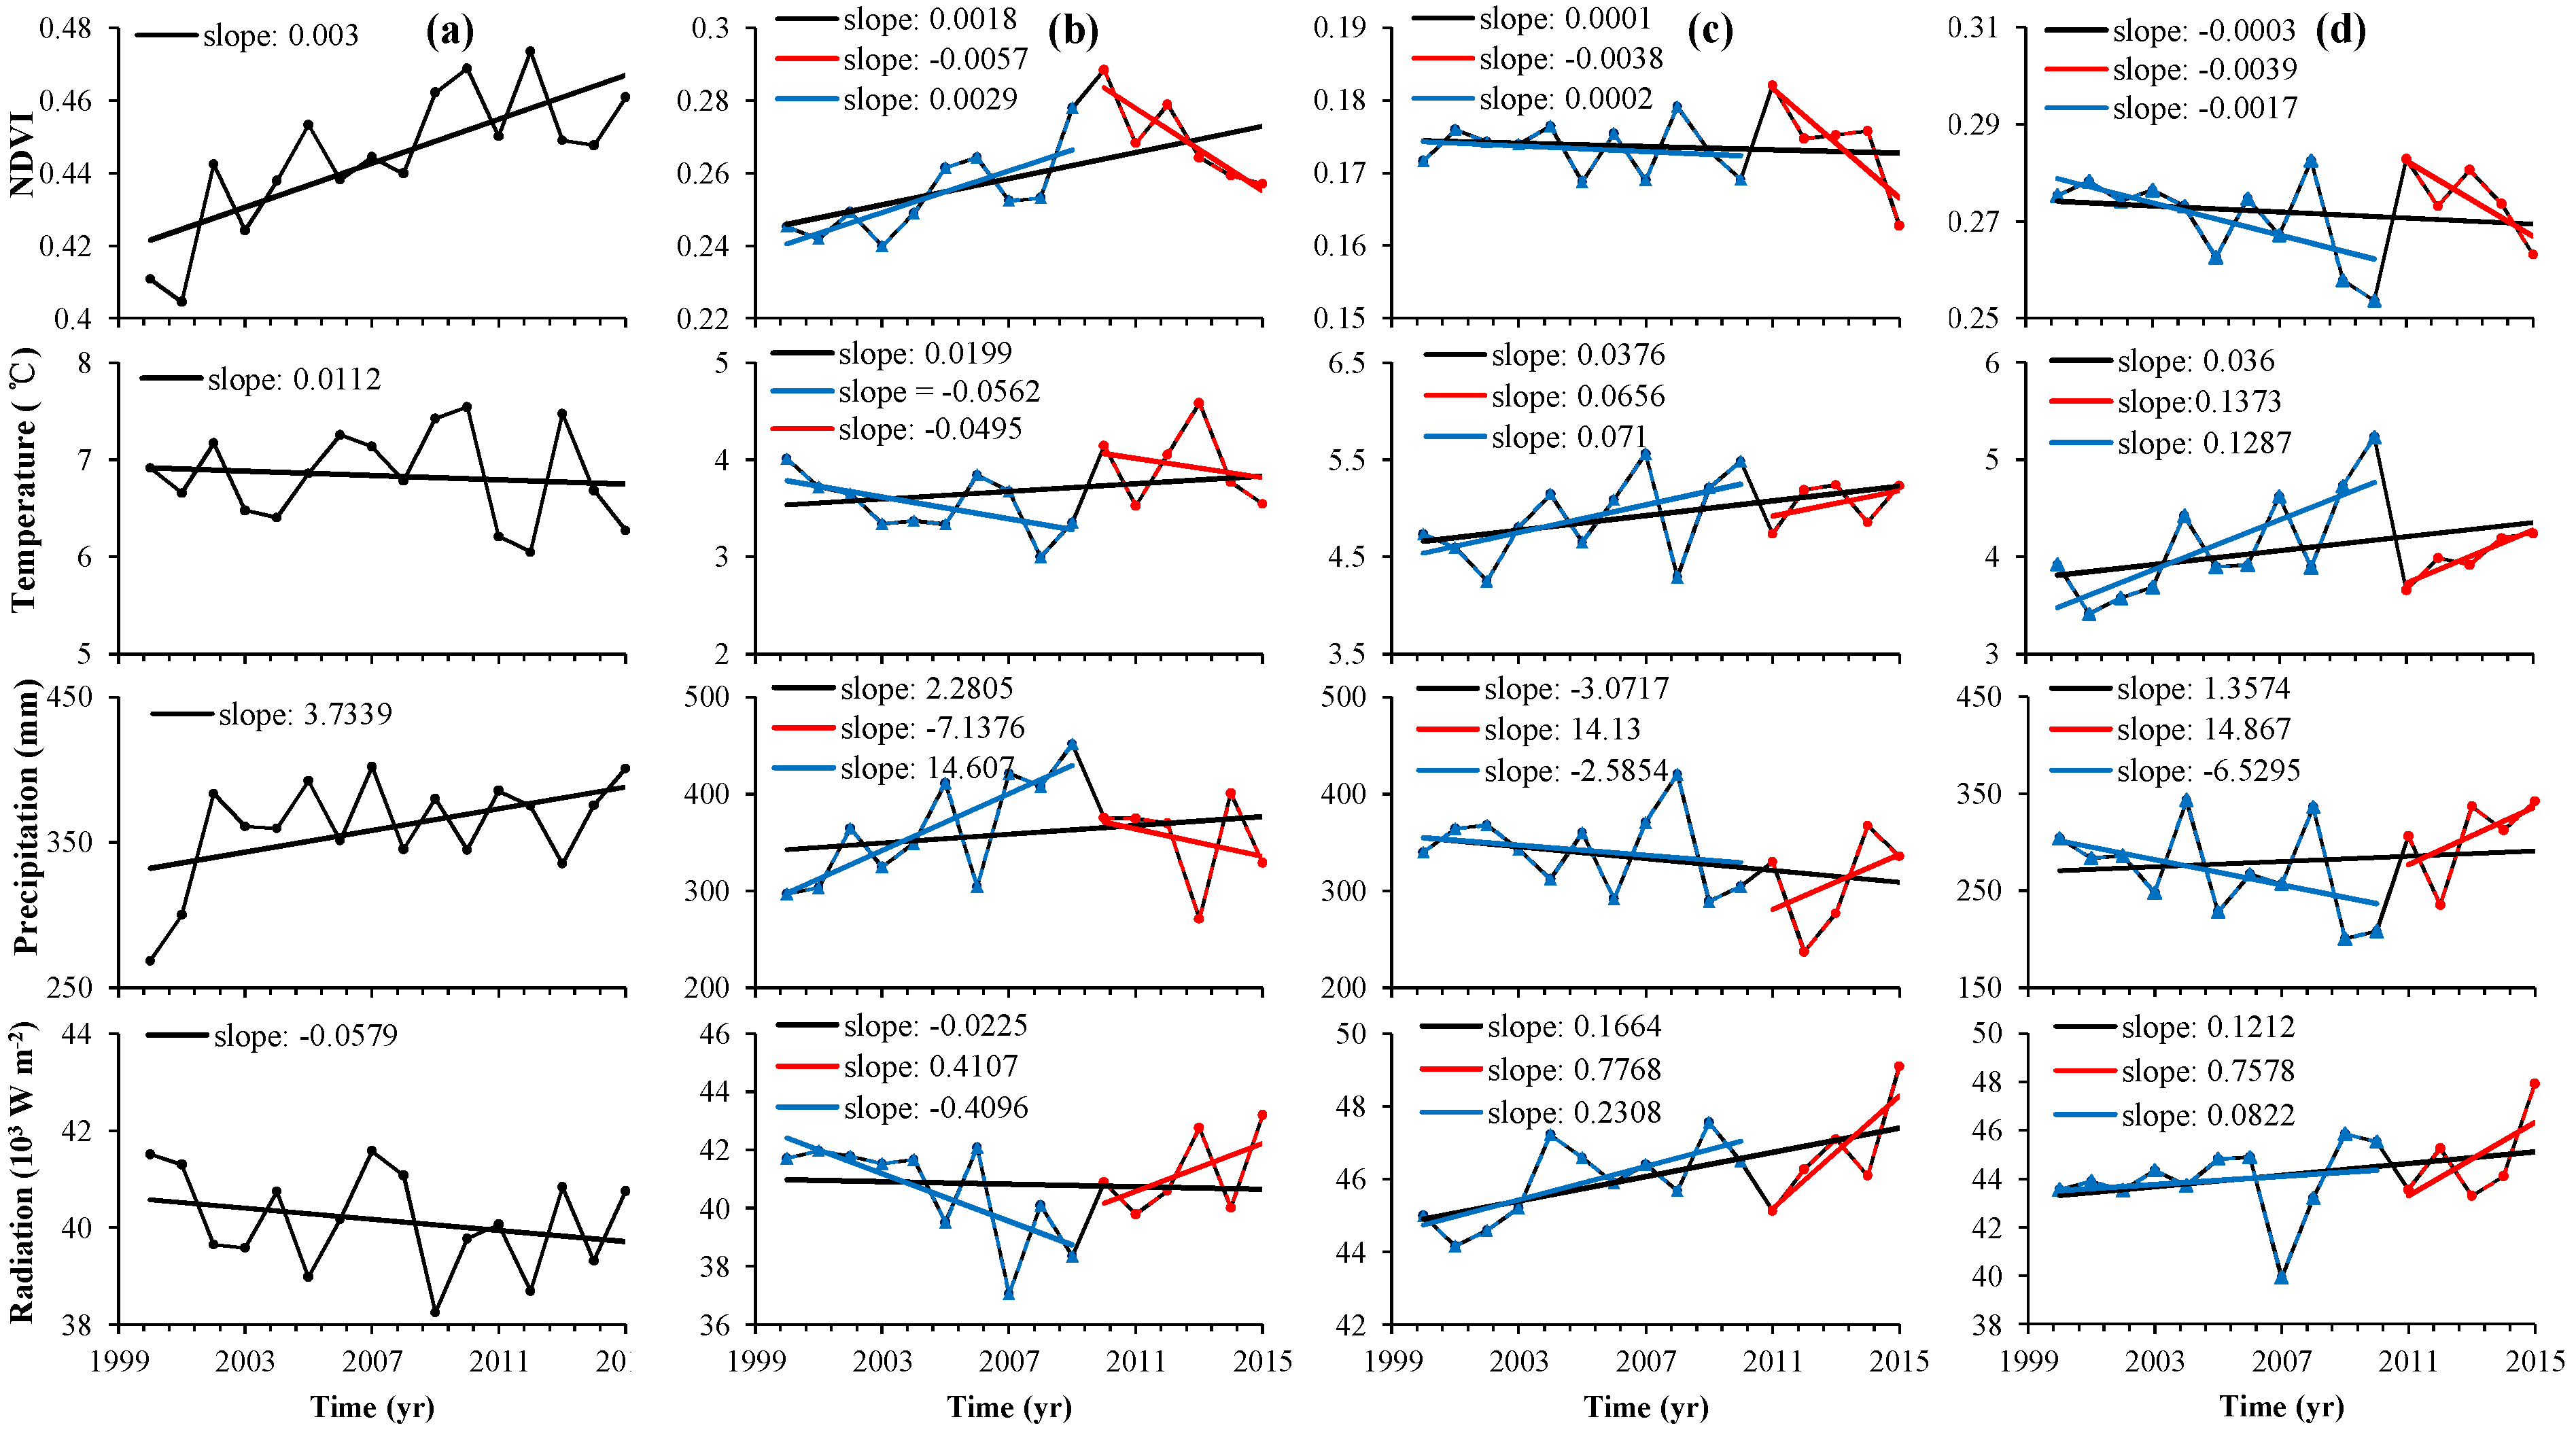
3.1. Inter-Annual Variations in Growing Season Vegetation Greenness

Figure 2 shows inter-annual change of area-averaged GNDVI and its spatial distribution on the TP for the period of 2000–2015. The area-averaged GNDVI significantly increased at a rate of 0.0011 year−1 (p < 0.01, Figure 2a). GNDVI trend patterns from 2000 to 2015 were spatially heterogeneous, but the main GNDVI trend was increasing (Figure 2b). GNDVI exhibited greening trends at 70.37% of vegetated area (23.47% significantly with p < 0.05) on the TP, primarily located in eastern and northern areas of the TP; about 16.56% of vegetated areas characterized by the greening trend over 0.003 year−1, which mainly located in the northeast part of the TP. On the contrary, 29.63% of the vegetated area displayed browning trends, primarily in the south-central and southwest TP, but most of these trends were not significant; only 3.31% of vegetated areas characterized by the browning trend below −0.003 year−1, which sparsely distributed within local areas of the southwest TP. However, such greening trends were not completely detected on the basis of GNDVI from Terra-C5 and GIMMS3g, especially the latter. The details on differences within inter-annual variations of NDVI data derived from MODIS Terra-C5, Terra-C6, and GIMMS3g can be found in Text S1 in the Supporting Information.
We further calculated the change percentages of GNDVI for different elevation bins and ecological zones across the plateau over the study period. As shown in Figure 3, the trends of GNDVI were positive at all elevation bins (Figure 3a). The change percentages of GNDVI increased from about 0.40% year−1 at 2600 m to 0.49% year−1 at 3300 m and then decreases to 0.19% year−1 at 5500 m. The greening trends at the elevation bins below 4700 m a.s.l. were significant, while that above 4700 m a.s.l. were not significant. Moreover, the change percentages of GNDVI varied among the ecological zones (Figure 3b). The high value of greening percentages among the ecosystem zones occurred in the northern TP, including IID2, IID3, ID1, IC1, and IIC2 zones. On the contrary, the value of trends in IIC1 and IC2 zones were negative, but these browning trends were not significant.

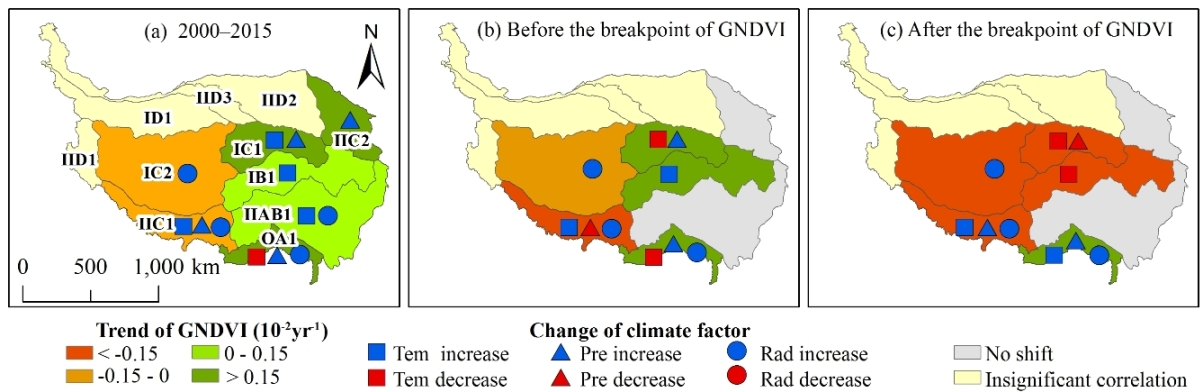
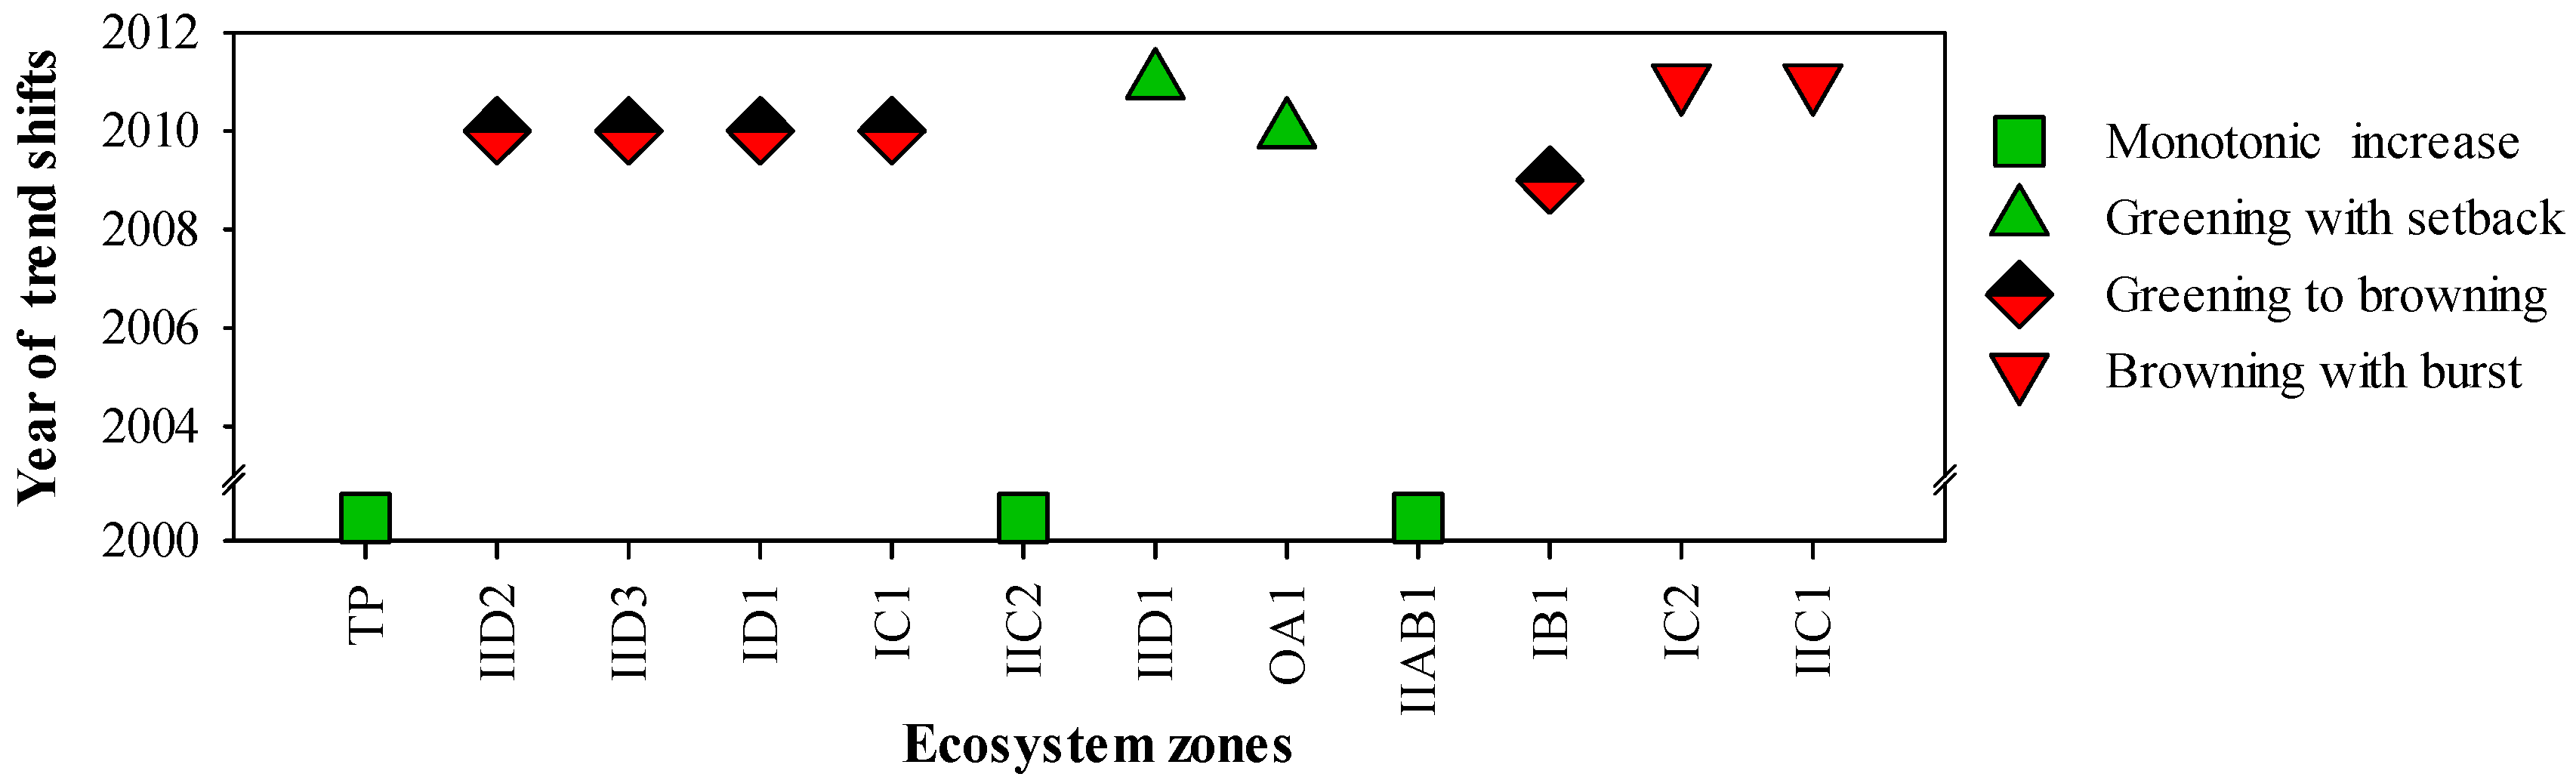
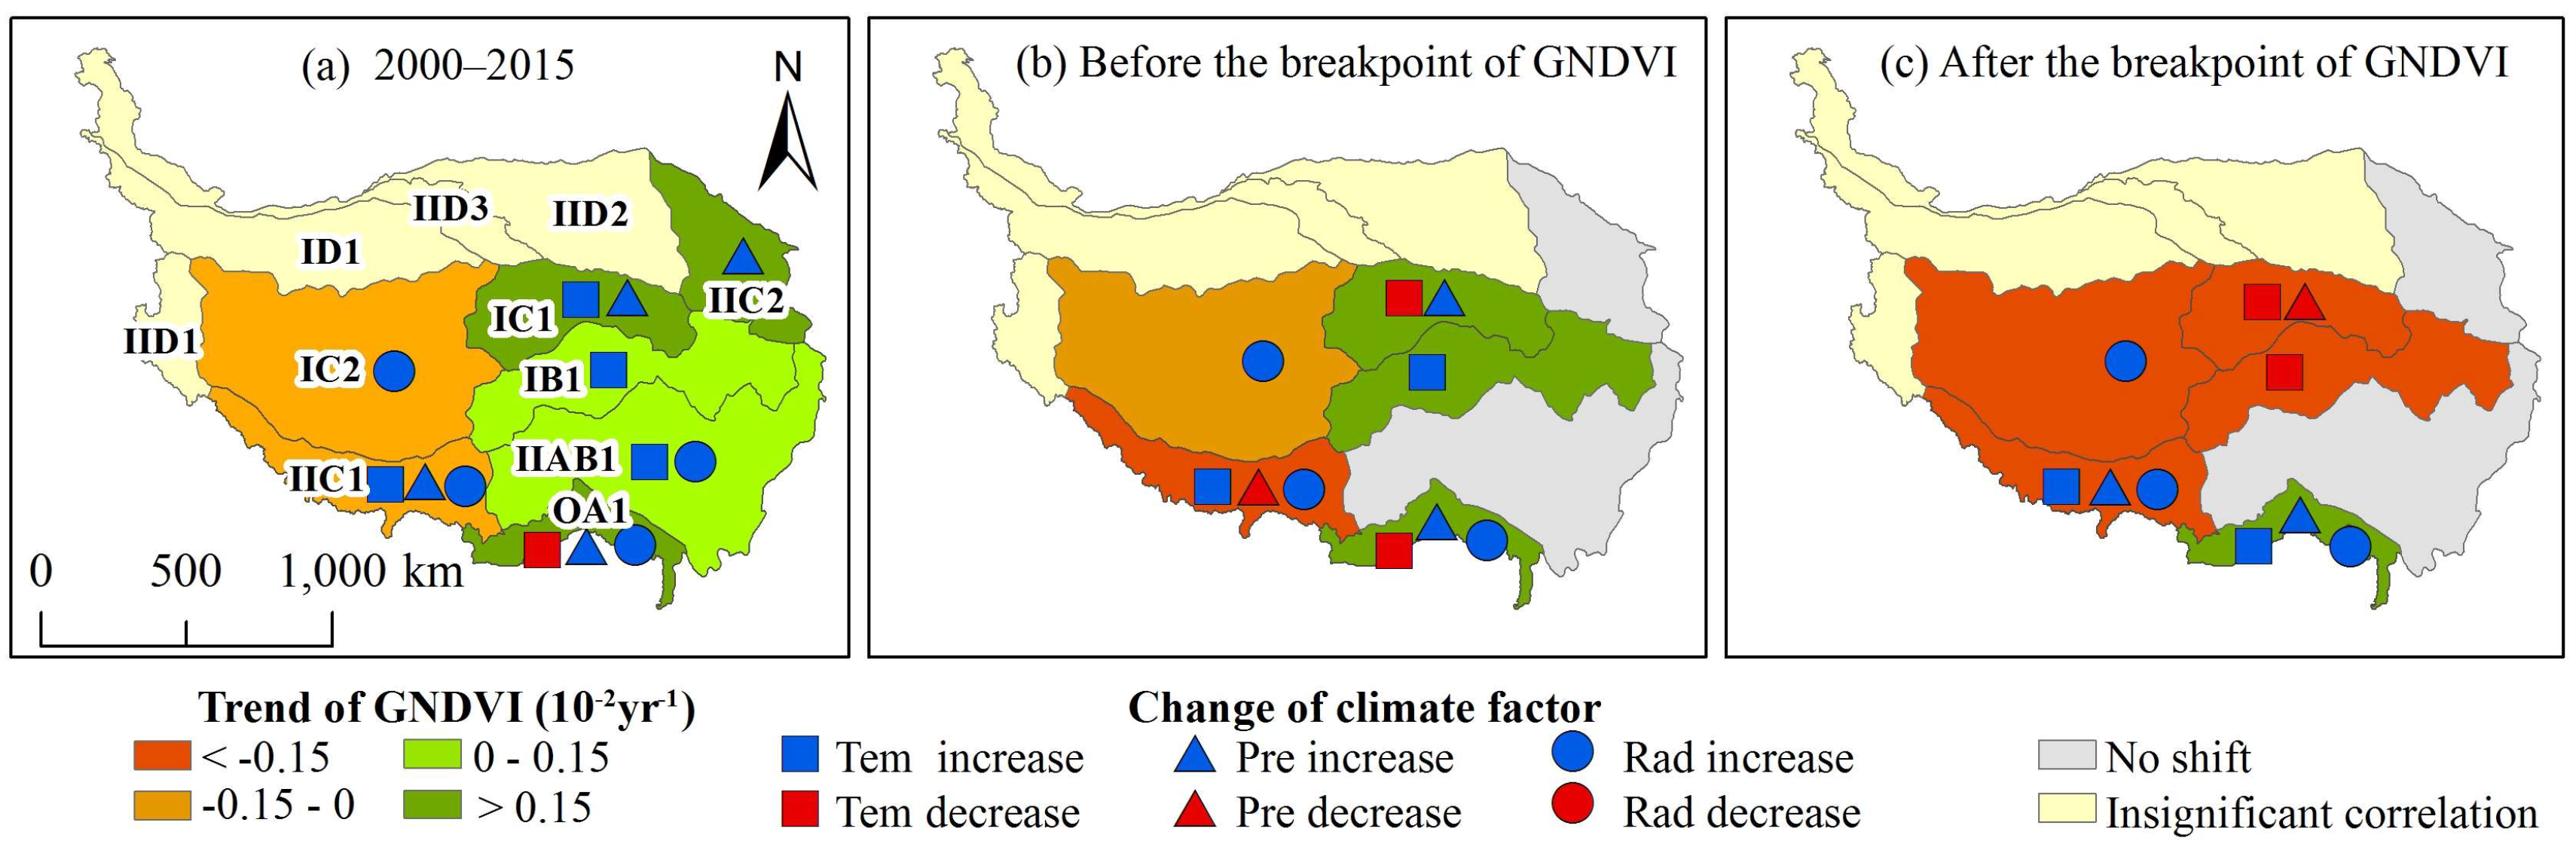
3.2. Major Shifts in Vegetation Greenness Trends

Based on the BFAST model, we examined the major trend shifts in vegetation greenness across the entire TP and different ecosystem zones (Figure 4 and Figure S1). Monotonic greening trends in vegetation greenness were detected across the vegetated areas of entire TP. The trend shifts in vegetation greening and browning regimes, however, varied depending on ecosystem zones. All ecosystem zones have experienced abrupt changes with the exception of IIC2 and IIAB1 zones. Vegetation greenness in five ecosystem zones (i.e., IID2, IID3, ID1, IC1, and IB1 zones), located in the northern and middle regions of TP, shifted from greening to browning in either 2009 or 2010. Conversely, the vegetation greenness of IIC1 and IC2 zones in the southwestern part of TP was characterized by a shift regime of browning with a burst in 2011.

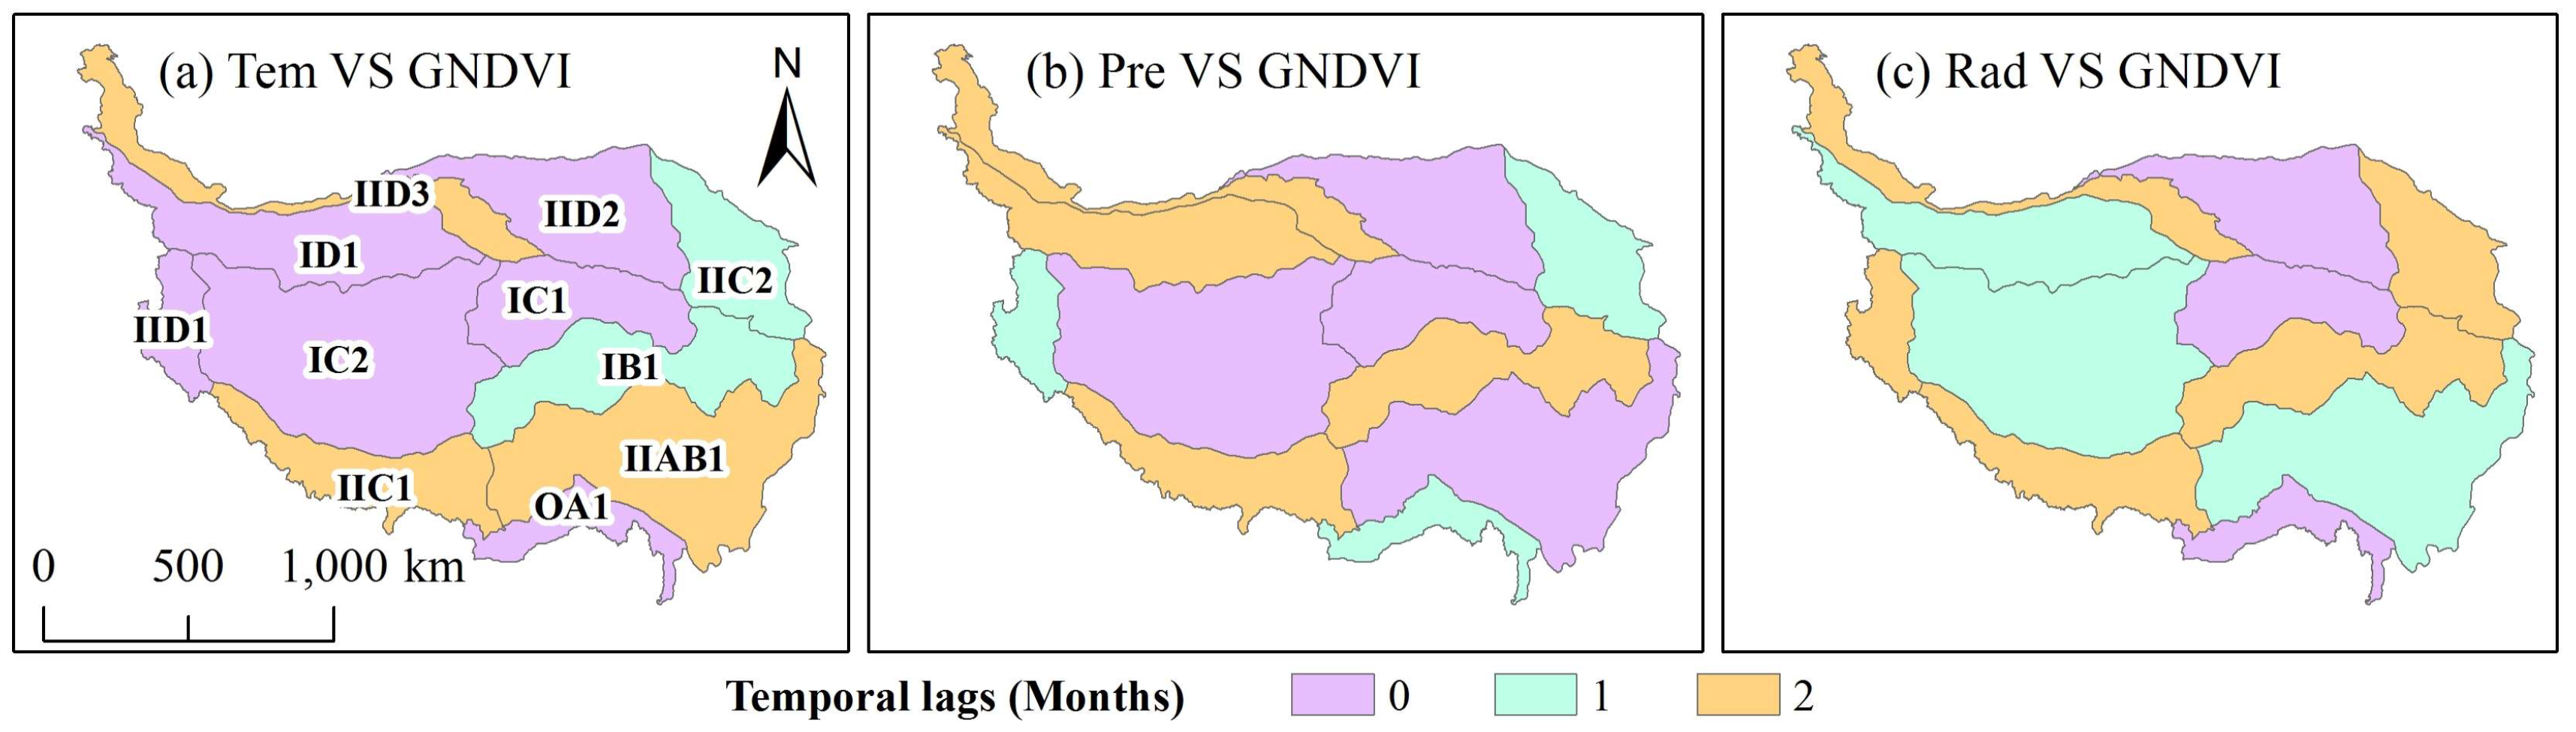
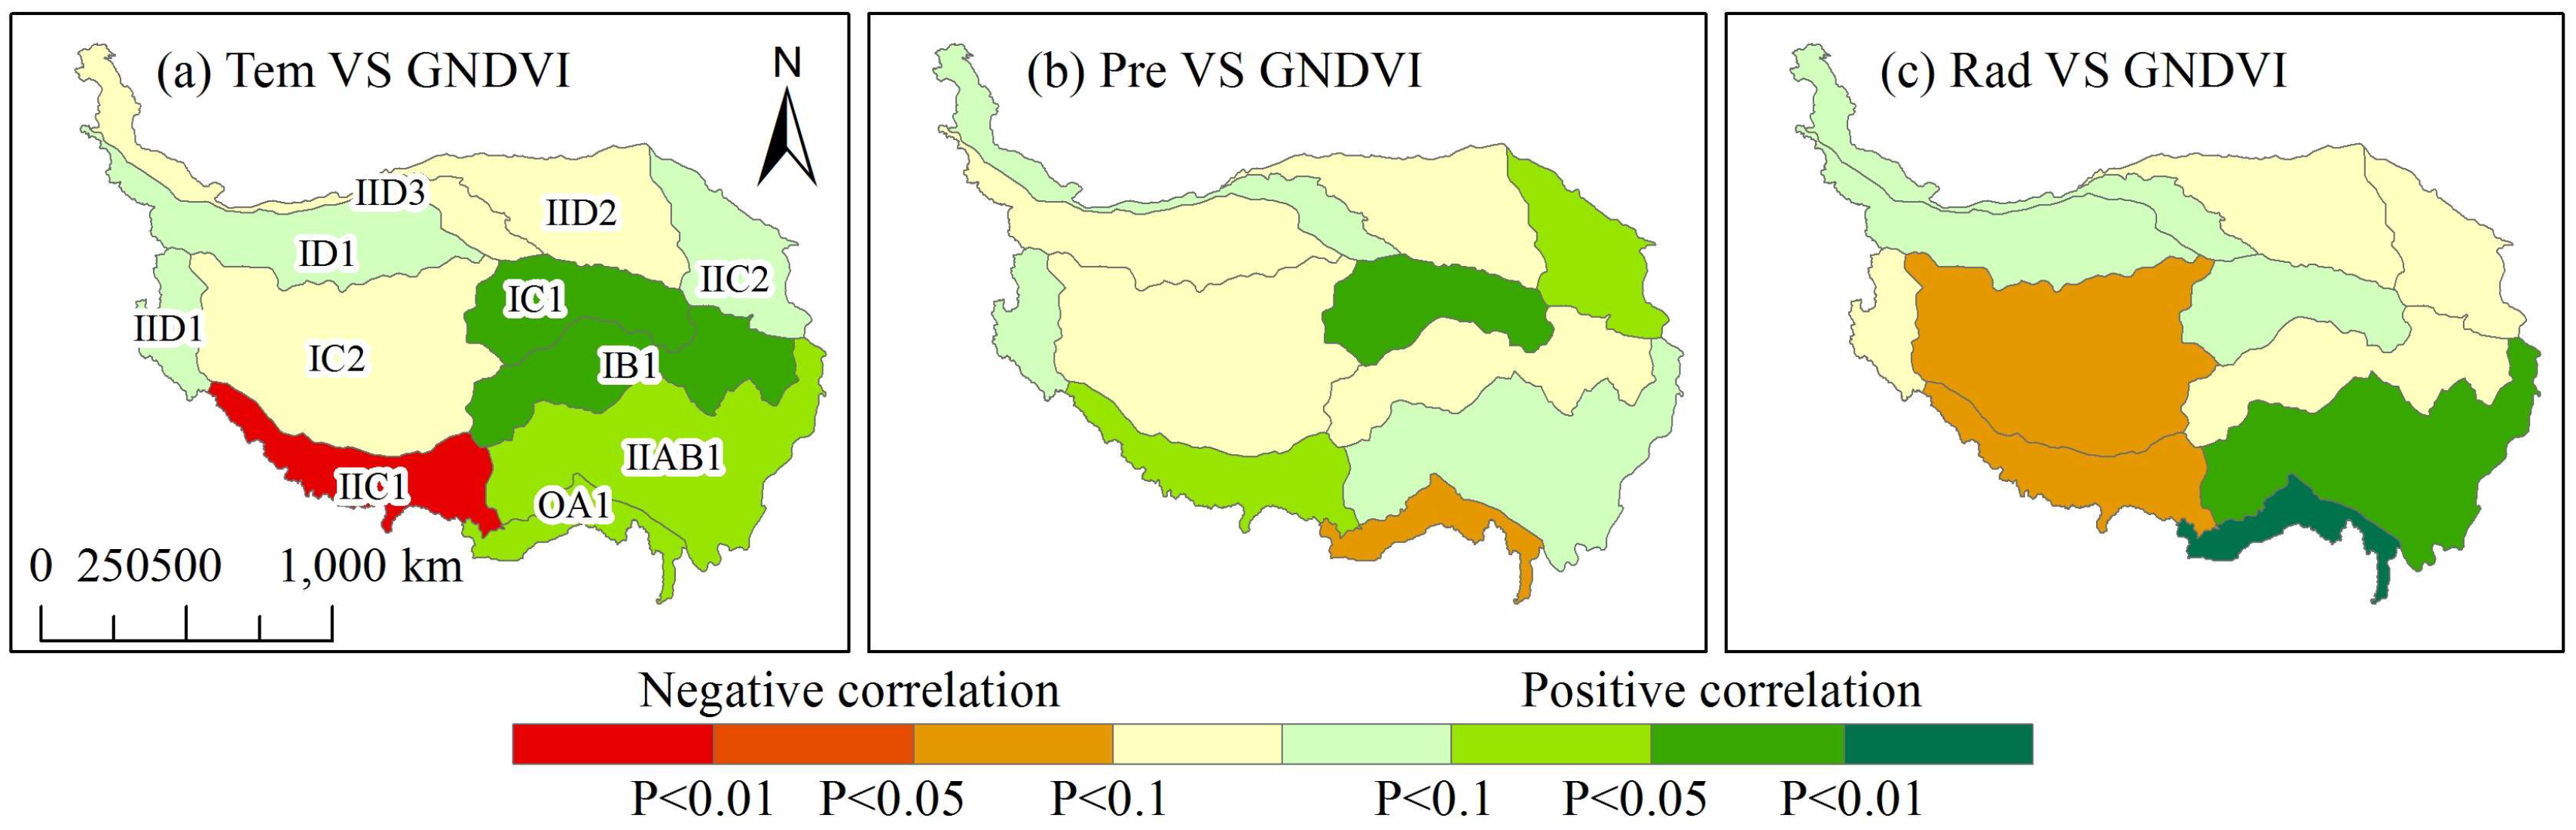
3.3. Vegetation Greenness Responses to Climate Change

Based on partial correlation analyses, we demonstrated that the presence of clear disparities in vegetation greenness responses to air temperature, precipitation, and radiation in different ecological zones of the TP between 2000 and 2015. Time lag effects in vegetation responses to major climatic factors were also seen in some ecological zones (Figure 5, Figure 6 and Figure 7).
Increases in GNDVI were closely related to increasing precipitation on the northeastern TP, including within the IIC2 and IC1 zones (Figure 6 and Figure 7), and a one-month lag effect response of GNDVI to precipitation existed in the IIC2 zone (Figure 5). Although the positive partial correlation between GNDVI and temperature was significant within the IC1 zone, this was not the case within the IIC2 zone; and despite the fact that temperature declined in the IC1 zone before the GNDVI breakpoint, both GNDVI and precipitation increased (Figure 8a,b). We also demonstrated that both GNDVI and precipitation declined after the GNDVI breakpoint within IC1 zone. These results indicate vegetation change in the northeastern TP was sensitive to precipitation variation.
By contrast, GNDVI declined in the southwestern TP under the comprehensive influence of warming and increased solar radiation, combined with inter-annual fluctuations in precipitation (Figure 6 and Figure 7). We also found a significant decrease of SPEI in this region during 2000–2015 (Figure S2), indicating that this region seems to be warming and drying. Besides, there was a two-month lag effect response of GNDVI to temperature, precipitation, and radiation within the IIC1 zone, and a one-month lag effect response of GNDVI to radiation within the IC2 zone (Figure 5). Prior to the breakpoint of GNDVI, temperature and solar radiation increased, but precipitation decreased; all of these changes led to decreases in GNDVI, especially within the IIC1 zone (Figure 8c,d). Subsequent to the breakpoint of GNDVI, however, this index continued to decrease as warming and solar radiation increased despite a concomitant increase in precipitation. These findings might suggest that under conditions of insufficient water in the southwestern TP, increases in temperature and solar radiation both adversely affected vegetation growth as water availability decreased.
In the more humid areas, the impact of temperature and solar radiation became more prominent. GNDVI was mainly affected by climate warming across the IB1 zone, located in the mid-eastern TP (Figure 6 and Figure 7). This increase of GNDVI was closely related to rising temperature prior to the breakpoint, and vice versa. In the southeastern region, including the IIAB1 and OA1 zones, GNDVI was mainly affected by a combination of temperature and solar radiation. Additionally, a one-month lag effect was found in the response of GNDVI to radiation in the IIAB2 zone (Figure 5). In other ecosystem zones in the northwestern TP such as IID2 and IID3 zone, the partial correlations between GNDVI and temperature, precipitation, and solar radiation were insignificant.

3.4. Relationship between Vegetation Greenness and Anthropogenic Disturbance

Over the entire TP, an enhanced degree of vegetation greening is seen in areas where anthropogenic disturbance is lower (Figure 9). In order to evaluate this trend in more detail we, therefore, selected zones in two regions characterized by significant differences in both vegetation change, anthropogenic disturbance, and climate change—northeastern ecosystem zones (IIC2 and IC1 zones) and southwestern ecosystem zones (IC2 and IIC1 zones)—as the typical regions for further comparisons (Figure 2b, Figure 7, and Figure 8).
Along with increasing human footprint pressure, the percentage of greening trend declined gradually within the northeastern ecosystem zones (IIC2 and IC1 zones) while the percentage of browning trend increased in the southwestern ecosystem zones (IC2 and IIC1 zones) (Figure 9). This result implies an obvious negative impact of anthropogenic disturbance on vegetation greenness. Specifically, the trends in all levels of human footprint pressure in the northeastern ecosystem zones (IIC2 and IC1 zones) were positive, which indicates the fact that although the positive impact of wetting was weakened along with anthropogenic disturbance increase, the former was not overwhelmed by the latter. By contrast, in the southwestern ecosystem zones (IC2 and IIC1 zones), vegetation greenness in areas with lower human footprint pressure showed a greening trend, while a browning trend was clear in areas characterized by higher disturbance, suggesting that a larger degree of anthropogenic disturbance lead to a more negative impact of the water deficit on vegetation growth.

4. Discussion

In this study, based on the updated NDVI form MODIS Terra-C6, we found that 70.37% of vegetated areas of the TP (23.47% significantly with p < 0.05) exhibited greening trends and the change percentages of GNDVI were positive across all elevation bins and most ecosystem zones over the TP during the past 16 years (Figure 2 and Figure 3). These results further corroborate the finding that vegetation greenness on the TP has increased overall, albeit with the exception of local areas that have been degraded [57,58]. A similar pattern of greening has also been reported for the neighboring Himalayan region based on Terra-C6 NDVI [7]. However, GNDVI derived from Terra-C5 and GIMMS3g underestimate the greening trend on the TP to different extents (the details can be found in Text S1 in the Supporting Information), largely due to the impacts of sensor shifts or degradation [14,16,17,20].
GNDVI increased in the eastern and northern TP but decreased in the south-central and southwest TP during 2000–2015 (Figure 2), and most ecosystem zones experienced major shifts in GNDVI between 2009 and 2011 (Figure 4). The main explanation for this is that spatially heterogeneous temporal trends in major climatic factors induced complex responses in vegetation growth on the TP [59,60,61]. This study shows that the role of temperature, precipitation, and solar radiation played in vegetation dynamics varied depending on ecosystem zones, where the vegetation composition and humidity are different.
Vegetation growth in the southwestern and northeastern TP requires more water as these are mostly arid and semi-arid areas of alpine meadow and alpine steppe. These areas are consequently greatly affected by water availability. We show that vegetation greening was mainly the result of increasing precipitation on the northeastern TP, which is in accordance with the findings of other similar studies [24]. Geographically, the northeastern and southwestern TP are characterized by distinct water vapor sources and different thermal heating systems [62]. In contrast, within the context of the weakening Indian monsoon [62], vegetation browning in the southwestern TP was caused by a water deficit (Figure S2), which induced by interactions among changes in temperature, solar radiation, and precipitation [60,63]. In this respect, the results of this study contradict the previous study that increasing temperature drove vegetation greening within the Yarlung Zangbo River Basin [26], perhaps because the greening trend was over-estimated on the basis of SPOT-VGT-NDVI (Figure S3). Furthermore, a two-month lag effect response of vegetation to temperature, precipitation and radiation appeared in IIC2 zone (Figure 5), which was consistent with the previous result that the browning trend in this region was associated with a delayed vegetation green-up date, likely affected by pre-monsoonal droughts [23,64,65].
In more humid areas on the mid-eastern and southeastern TP, the impact of temperature became prominent [66,67,68,69]. Furthermore, in forested areas in the southern TP, solar radiation appeared to be the main climatic driver of vegetation change, which is in good agreement with previous findings [70]. Interestingly, a recent study also reported that the solar radiation became an increasingly important factor for vegetation growth in the wet region of South Asia [71]. However, in the northwest TP, the partial correlations between GNDVI and major climatic factors were insignificant; one potential explanation for this is that other factors in this region play an important role in changing greenness such as ephemeral plants [72,73], frozen soil [61] and winter snow [74]. Apart from the direct precipitation from the atmosphere, permafrost soils, winter snow, and glacier melting might also provide an indirect supply of soil moisture in this high elevation region [66], but more underlying mechanism for vegetation change in this region need further research.
Although vegetation growth at high altitudes and latitudes is very sensitive to temperature [5,47], the monotonic greening trend of vegetation greenness across the entire TP and in most elevation bins over the past 16 years could not mirror the warming hiatus [32]. Spatially, even though vegetation greenness shifted from greening to browning in the half of zones (Figure 4), vegetation greenness in these zones were also sensitive to other factors (Figure 6 and Figure 7). These results suggest that the recent temporary warming hiatus might not be useful as a direct indicator of a major trend shift in vegetation greenness across the TP.
Furthermore, the positive impact of increasing precipitation on vegetation growth has been obviously offset by an increase in anthropogenic disturbance in the northeastern TP, while a higher degree of anthropogenic disturbance has led to a more negative impact of water deficit in the southwestern TP (Figure 9). This result is not only in line with the previous finding that climate change is the key factor responsible for the vegetation change at the region scale [57,61], but also indicates that local degradation is mainly caused by the dual effects of climate change and anthropogenic disturbance, particularly in areas characterized by higher degree of anthropogenic disturbance.
Human footprint pressure increased rapidly overall on the TP [34]. At the same time, a series of projects have been implemented to facilitate ecosystem adaptation and restoration on the TP, especially after 2004, which reduced human footprint pressure to some extent. Several assessments of ecological projects also pointed out that a certain efficacy has been achieved [33,75,76,77]. The reduction of livestock was considered as an important effective ecosystem management strategy in these projects over the TP. However, vegetation greenness dynamics mismatched to the change in total number of livestock on the TP [33]. In this study, we demonstrated that both vegetation greenness and total number of livestock increased between 2000 and 2005, whereas the total number of livestock decreased after 2005, but vegetation greenness continuously increased until 2010 in most zones of the TP, except for southwestern ecosystem zones (IC2 and IIC1 zones) (Figure 2 and Figure 4 and Figure S4). These further indicate that increases in livestock number weakened the vegetation greenness greening or exacerbated browning but might not overwhelm the impact of climate change, which corresponds with previous research [61]. In addition, within the context of water deficit, even though both the total number of livestock and vegetation greenness decreased after implementation of these ecological projects in the southwestern ecosystem zones (Figure 2 and Figure 8) [40,61], a larger degree of human footprint pressure led to a more negative impact of the climate condition on vegetation growth (Figure 9). Thus, we suggest that future research should pay more attention to evaluate the ecosystem natural capacity and improve animal husbandry management strategies on the areas with moderately and high human footprint pressure, in order to mitigate the negative effect caused by changing climate to this extremely fragile ecosystem.

5. Conclusions

We revisited the spatiotemporal patterns of vegetation change and its major underlying drivers on the TP during 2000–2015 based on the updated NDVI form MODIS Terra-C6. Overall, the area-averaged GNDVI exhibited monotonic greening trends on the TP during the past 16 years, with a rate of 0.0011 year−1 (p < 0.01). Over 70% of vegetated areas across the TP displayed greening trends apart from the southwest TP. However, GNDVI in most ecosystem zones underwent major shifts around 2010. Spatially heterogeneous temporal trends in major climate factors have induced different responses of vegetation dynamics on the TP. We demonstrated that water availability was the main factor of vegetation growth in the northeastern and southwestern TP, while the impact of temperature became prominent in the mid-eastern TP, and solar radiation and temperature were the two primary climatic drivers in the southern TP. Additionally, along with anthropogenic disturbance increase, the greening trend declined in the northeastern TP while the browning trend increased in the southwestern TP, suggesting that impacts of anthropogenic disturbance on vegetation change cannot be ignored and more attention should be paid to the areas with moderate and high human footprint pressure. This study provides an objective assessment of vegetation greenness and its climatic and anthropogenic drivers, which are of scientific significance for better environment management on the TP.

Supplementary Materials

The following are available online at https://www.mdpi.com/2072-4292/10/10/1525/s1, Figure S1. Four types of trend shifts in vegetation greenness on the entire Tibetan Plateau (a), OA1 zone (b), IC1 zone (c), and IIC2 zone (d); Figure S2. Inter-annual variations of the Standardized Precipitation-Evapotranspiration Index (SPEI) within growing season in the southwestern Tibetan Plateau; Figure S3. Comparison of growing season NDVI (GNDVI) in vegetated areas on the Tibetan Plateau based on MODIS (a), and SPOT-VGT and GIMMS3g (b); Figure S4. Variation in livestock inventories in Qinghai Province and Tibet Autonomous Region (TAR) between 2000 and 2015. Text S1. Consistencies and differences among inter-annual variations of NDVI data derived from MODIS and GIMMS3g.

Author Contributions

Y.Z. and L.L. (Linshan Liu) conceived and designed the experiments; L.L. (Lanhui Li), H.Z. and J.Z. performed the satellite imagery pre-processing and data analysis; L.L. (Lanhui Li) wrote the paper; Y.Z., J.W., Z.W., S.L. M.D. and B.P. revised the paper and contributed to the result explanation and discussion.

Funding

This work is funded by a Strategic Priority Research Program of the Chinese Academy of Sciences (XDA20040201); National Natural Science Foundation of China (grant nos: 41671104, 41761144081); and the International Partnership Program of Chinese Academy of Sciences (131C11KYSB20160061).

Acknowledgments

We thank Binghua Zhang, Qionghuan Liu and Wei Qi from the Institute of Geographic Sciences and Natural Resources Research of the CAS for their constructive comments on this manuscript. We are also grateful to two anonymous reviewers and editors for their useful suggestions to improve the paper.

Conflicts of Interest

The authors declare no conflicts of interest.

References

  1. Nemani, R.R.; Keeling, C.D.; Hashimoto, H.; Jolly, W.M.; Piper, S.C.; Tucker, C.J.; Myneni, R.B.; Running, S.W. Climate-driven increases in global terrestrial net primary production from 1982 to 1999. Science 2003, 300, 1560–1563. [Google Scholar] [CrossRef] [PubMed]
  2. Peng, S.; Piao, S.; Zeng, Z.; Ciais, P.; Zhou, L.; Li, L.Z.X.; Myneni, R.B.; Yin, Y.; Zeng, H. Afforestation in China cools local land surface temperature. Proc. Natl. Acad. Sci. USA 2014, 111, 2915–2919. [Google Scholar] [CrossRef] [PubMed] [Green Version]
  3. Haberl, H.; Erb, K.H.; Krausmann, F.; Gaube, V.; Bondeau, A.; Plutzar, C.; Gingrich, S.; Lucht, W.; Fischer-Kowalski, M. Quantifying and mapping the human appropriation of net primary production in earth’s terrestrial ecosystems. Proc. Natl. Acad. Sci. USA 2007, 104, 12942–12945. [Google Scholar] [CrossRef] [PubMed]
  4. Myneni, R.B.; Keeling, C.D.; Tucker, C.J.; Asrar, G.; Nemani, R.R. Increased plant growth in the northern high latitudes from 1981 to 1991. Nature 1997, 386, 698–702. [Google Scholar] [CrossRef]
  5. Seddon, A.W.R.; Macias-Fauria, M.; Long, P.R.; Benz, D.; Willis, K.J. Sensitivity of global terrestrial ecosystems to climate variability. Nature 2016, 531, 229–232. [Google Scholar] [CrossRef] [PubMed] [Green Version]
  6. Arneth, A.; Harrison, S.P.; Zaehle, S.; Tsigaridis, K.; Menon, S.; Bartlein, P.J.; Feichter, J.; Korhola, A.; Kulmala, M.; O’Donnell, D.; et al. Terrestrial biogeochemical feedbacks in the climate system. Nat. Geosci. 2010, 3, 525–532. [Google Scholar] [CrossRef] [Green Version]
  7. Mishra, N.B.; Mainali, K.P. Greening and browning of the Himalaya: Spatial patterns and the role of climatic change and human drivers. Sci. Total Environ. 2017, 587, 326–339. [Google Scholar] [CrossRef] [PubMed]
  8. Piao, S.; Yin, G.; Tan, J.; Cheng, L.; Huang, M.; Li, Y.; Liu, R.; Mao, J.; Myneni, R.B.; Peng, S.; et al. Detection and attribution of vegetation greening trend in China over the last 30 years. Glob. Chang. Biol. 2015, 21, 1601–1609. [Google Scholar] [CrossRef] [PubMed] [Green Version]
  9. Pinzon, J.; Tucker, C. A Non-Stationary 1981–2012 AVHRR NDVI3g Time Series. Remote Sens. 2014, 6, 6929–6960. [Google Scholar] [CrossRef] [Green Version]
  10. Toté, C.; Swinnen, E.; Sterckx, S.; Clarijs, D.; Quang, C.; Maes, R. Evaluation of the SPOT/VEGETATION Collection 3 reprocessed dataset: Surface reflectances and NDVI. Remote Sens. Environ. 2017, 201, 219–233. [Google Scholar] [CrossRef]
  11. Huete, A.; Didan, K.; Miura, T.; Rodriguez, E.P.; Gao, X.; Ferreira, L.G. Overview of the radiometric and biophysical performance of the MODIS vegetation indices. Remote Sens. Environ. 2002, 83, 195–213. [Google Scholar] [CrossRef]
  12. Fensholt, R.; Rasmussen, K.; Nielsen, T.T.; Mbow, C. Evaluation of earth observation based long term vegetation trends—Intercomparing NDVI time series trend analysis consistency of Sahel from AVHRR GIMMS, Terra MODIS and SPOT VGT data. Remote Sens. Environ. 2009, 113, 1886–1898. [Google Scholar] [CrossRef]
  13. Tian, F.; Fensholt, R.; Verbesselt, J.; Grogan, K.; Horion, S.; Wang, Y. Evaluating temporal consistency of long-term global NDVI datasets for trend analysis. Remote Sens. Environ. 2015, 163, 326–340. [Google Scholar] [CrossRef]
  14. Zhang, Y.; Song, C.; Band, L.E.; Sun, G.; Li, J. Reanalysis of global terrestrial vegetation trends from MODIS products: Browning or greening? Remote Sens. Environ. 2017, 191, 145–155. [Google Scholar] [CrossRef]
  15. Kern, A.; Marjanović, H.; Barcza, Z. Evaluation of the Quality of NDVI3g Dataset against Collection 6 MODIS NDVI in Central Europe between 2000 and 2013. Remote Sens. 2016, 8, 955. [Google Scholar] [CrossRef]
  16. Lyapustin, A.; Wang, Y.; Xiong, X.; Meister, G.; Platnick, S.; Levy, R.; Franz, B.; Korkin, S.; Hilker, T.; Tucker, J.; et al. Scientific impact of MODIS C5 calibration degradation and C6+ improvements. Atmos. Meas. Tech. 2014, 7, 4353–4365. [Google Scholar] [CrossRef] [Green Version]
  17. Detsch, F.; Otte, I.; Appelhans, T.; Nauss, T. A Comparative Study of Cross-Product NDVI Dynamics in the Kilimanjaro Region—A Matter of Sensor, Degradation Calibration, and Significance. Remote Sens. 2016, 8, 159. [Google Scholar] [CrossRef]
  18. Zhang, Y.; Li, B.; Zheng, D. Datasets of the Boundary and Area of the Tibetan Plateau (DBATP); Glob. Chang. Res. Data Publ. Reposit. 2014. [Google Scholar] [CrossRef]
  19. Piao, S.; Fang, J.; He, J. Variations in Vegetation Net Primary Production in the Qinghai-Xizang Plateau, China, from 1982 to 1999. Clim. Chang. 2006, 74, 253–267. [Google Scholar] [CrossRef]
  20. Zhang, G.; Zhang, Y.; Dong, J.; Xiao, X. Green-up dates in the Tibetan Plateau have continuously advanced from 1982 to 2011. Proc. Natl. Acad. Sci. USA 2013, 110, 4309–4314. [Google Scholar] [CrossRef] [PubMed] [Green Version]
  21. Yu, Z.; Wang, J.X.; Liu, S.R.; Sun, P.S.; Liu, W.G. Inconsistent NDVI trends from AVHRR, MODIS, and SPOT sensors in the Tibetan Plateau. In Proceedings of the 2013 Second International Conference on Agro-Geoinformatics (Agro-Geoinformatics), Fairfax, VA, USA, 12–16 August 2013; pp. 97–101. [Google Scholar]
  22. Zhao, H.; Liu, S.; Dong, S.; Su, X.; Wang, X.; Wu, X.; Wu, L.; Zhang, X. Analysis of vegetation change associated with human disturbance using MODIS data on the rangelands of the Qinghai-Tibet Plateau. Rangel. J. 2015, 37, 77–87. [Google Scholar] [CrossRef]
  23. Shen, M.; Piao, S.; Jeong, S.; Zhou, L.; Zeng, Z.; Ciais, P.; Chen, D.; Huang, M.; Jin, C.; Li, L.Z.X.; et al. Evaporative cooling over the Tibetan Plateau induced by vegetation growth. Proc. Natl. Acad. Sci. USA 2015, 112, 9299–9304. [Google Scholar] [CrossRef] [PubMed] [Green Version]
  24. Pang, G.; Wang, X.; Yang, M. Using the NDVI to identify variations in, and responses of, vegetation to climate change on the Tibetan Plateau from 1982 to 2012. Quatern. Int. 2017, 444, 87–96. [Google Scholar] [CrossRef]
  25. Zhang, L.; Guo, H.; Ji, L.; Lei, L.; Wang, C.; Yan, D.; Li, B.; Li, J. Vegetation greenness trend (2000 to 2009) and the climate controls in the Qinghai-Tibetan Plateau. J. Appl. Remote Sens. 2013, 7. [Google Scholar] [CrossRef]
  26. Li, H.; Li, Y.; Shen, W.; Li, Y.; Lin, J.; Lu, X.; Xu, X.; Jiang, J. Elevation-Dependent Vegetation Greening of the Yarlung Zangbo River Basin in the Southern Tibetan Plateau, 1999–2013. Remote Sens. 2015, 7, 16672–16687. [Google Scholar] [CrossRef] [Green Version]
  27. Li, L.; Zhang, Y.; Liu, L.; Wu, J.; Li, S.; Zhang, H.; Zhang, B.; Ding, M.; Wang, Z.; Paudel, B. Current challenges in distinguishing climatic and anthropogenic contributions to alpine grassland variation on the Tibetan Plateau. Ecol. Evol. 2018, 8, 5949–5963. [Google Scholar] [CrossRef] [PubMed] [Green Version]
  28. Sun, J.; Cheng, G.; Li, W.; Sha, Y.; Yang, Y. On the Variation of NDVI with the Principal Climatic Elements in the Tibetan Plateau. Remote Sens. 2013, 5, 1894–1911. [Google Scholar] [CrossRef] [Green Version]
  29. Yu, H.; Xu, J.; Okuto, E.; Luedeling, E. Seasonal response of grasslands to climate change on the Tibetan Plateau. PLoS ONE 2012, 7, e49230. [Google Scholar] [CrossRef] [PubMed]
  30. Kuang, X.; Jiao, J.J. Review on climate change on the Tibetan Plateau during the last half century. J. Geophys. Res. Atmos. 2016, 121, 3979–4007. [Google Scholar] [CrossRef]
  31. Liu, Y.; Zhang, Y.; Zhu, J.; Huang, K.; Zu, J.; Chen, N.; Cong, N.; Stegehuis, A.I. Warming slowdown over the Tibetan Plateau in recent decades. Theor. Appl. Climatol. 2018, 1–11. [Google Scholar] [CrossRef]
  32. An, W.; Hou, S.; Hu, Y.; Wu, S. Delayed warming hiatus over the Tibetan Plateau. Earth Space Sci. 2017, 4, 128–137. [Google Scholar] [CrossRef] [Green Version]
  33. Chen, B.; Zhang, X.; Tao, J.; Wu, J.; Wang, J.; Shi, P.; Zhang, Y.; Yu, C. The impact of climate change and anthropogenic activities on alpine grassland over the Qinghai-Tibet Plateau. Agric. For. Meteorol. 2014, 189–190, 11–18. [Google Scholar] [CrossRef]
  34. Li, S.; Wu, J.; Gong, J.; Li, S. Human footprint in Tibet: Assessing the spatial layout and effectiveness of nature reserves. Sci. Total Environ. 2018, 621, 18–29. [Google Scholar] [CrossRef] [PubMed]
  35. Fan, J.; Xu, Y.; Wang, C.; Niu, Y. The effects of human activities on the ecological environment of Tibet over the past half century. Chin. Sci. Bull. 2015, 60, 3057–3066. [Google Scholar]
  36. Yu, C.; Zhang, Y.; Claus, H.; Zeng, R.; Zhang, X.; Wang, J. Ecological and Environmental Issues Faced by a Developing Tibet. Environ. Sci. Technol. 2012, 46, 1979–1980. [Google Scholar] [CrossRef] [PubMed] [Green Version]
  37. Gao, Q.; Wan, Y.; Li, Y.; Guo, Y.; Ganjurjav; Qin, X.; Jiangcun, W.; Wang, B. Effects of topography and human activity on the net primary productivity (NPP) of alpine grassland in northern Tibet from 1981 to 2004. Int. J. Remote Sens. 2013, 34, 2057–2069. [Google Scholar] [CrossRef]
  38. Liu, L.; Zhang, Y.; Bai, W.; Yan, J.; Ding, M.; Shen, Z.; Li, S.; Zheng, D. Characteristics of grassland degradation and driving forces in the source region of the Yellow River from 1985 to 2000. J. Geogr. Sci. 2006, 16, 131–142. [Google Scholar] [CrossRef]
  39. Li, H.; Li, Y.; Gao, Y.; Zou, C.; Yan, S.; Gao, J. Human Impact on Vegetation Dynamics around Lhasa, Southern Tibetan Plateau, China. Sustainability 2016, 8, 1146. [Google Scholar] [CrossRef]
  40. Wang, Z.; Zhang, Y.; Yang, Y.; Zhou, W.; Gang, C.; Zhang, Y.; Li, J.; An, R.; Wang, K.; Odeh, I.; et al. Quantitative assess the driving forces on the grassland degradation in the Qinghai-Tibet Plateau, in China. Ecol. Inform. 2016, 33, 32–44. [Google Scholar] [CrossRef]
  41. Zheng, D. The system of physico-geographical regions of the Qinghai-Xizang (Tibet) plateau. Sci. China Earth Sci. 1996, 39, 410–417. [Google Scholar]
  42. Allan, J.R.; Venter, O.; Watson, J.E.M. Temporally inter-comparable maps of terrestrial wilderness and the Last of the Wild. Sci. Data 2017, 4, 170187. [Google Scholar] [CrossRef] [PubMed] [Green Version]
  43. Jönsson, P.; Eklundh, L. TIMESAT—A program for analyzing time-series of satellite sensor data. Comput. Geosci. 2004, 30, 833–845. [Google Scholar] [CrossRef]
  44. Chen, Y.; Yang, K.; He, J.; Qin, J.; Shi, J.; Du, J.; He, Q. Improving land surface temperature modeling for dry land of China. J. Geophys. Res. Atmos. 2011, 116. [Google Scholar] [CrossRef] [Green Version]
  45. Sheffield, J.; Goteti, G.; Wood, E.F. Development of a 50-year high-resolution global dataset of meteorological forcings for land surface modeling. J. Clim. 2006, 19, 3088–3111. [Google Scholar] [CrossRef]
  46. Wen, Z.; Wu, S.; Chen, J.; Lü, M. NDVI indicated long-term interannual changes in vegetation activities and their responses to climatic and anthropogenic factors in the Three Gorges Reservoir Region, China. Sci. Total Environ. 2017, 574, 947–959. [Google Scholar] [CrossRef] [PubMed]
  47. Shen, M.; Piao, S.; Chen, X.; An, S.; Fu, Y.H.; Wang, S.; Cong, N.; Janssens, I.A. Strong impacts of daily minimum temperature on the green-up date and summer greenness of the Tibetan Plateau. Glob. Chang. Biol. 2016, 22, 3057–3066. [Google Scholar] [CrossRef] [PubMed]
  48. Venter, O.; Sanderson, E.W.; Magrach, A.; Allan, J.R.; Beher, J.; Jones, K.R.; Possingham, H.P.; Laurance, W.F.; Wood, P.; Fekete, B.M.; et al. Sixteen years of change in the global terrestrial human footprint and implications for biodiversity conservation. Nat. Commun. 2016, 7, 12558. [Google Scholar] [CrossRef] [PubMed]
  49. Jones, K.R.; Venter, O.; Fuller, R.A.; Allan, J.R.; Maxwell, S.L.; Negret, P.J.; Watson, J. One-third of global protected land is under intense human pressure. Science 2018, 360, 788–791. [Google Scholar] [CrossRef] [PubMed]
  50. Li, D.; Wu, S.; Liu, L.; Zhang, Y.; Li, S. Vulnerability of the global terrestrial ecosystems to climate change. Glob. Chang. Biol. 2018. [Google Scholar] [CrossRef] [PubMed]
  51. Zhang, X.S.; Sun, S.; Yong, S.; Al, E. Vegetation Map of the People’s Republic of China (1: 1,000,000); Geology Publishing House: Beijing, China, 2007. [Google Scholar]
  52. Begueria, S.; Vicente-Serrano, S.M.; Angulo-Martinez, M. A multiscalar global drought dataset: The SPEIbase: A new gridded product for the analysis of drought variability and impacts. Bull. Am. Meteorol. Soc. 2010, 91, 1351–1354. [Google Scholar] [CrossRef]
  53. Verbesselt, J.; Hyndman, R.; Newnham, G.; Culvenor, D. Detecting trend and seasonal changes in satellite image time series. Remote Sens. Environ. 2010, 114, 106–115. [Google Scholar] [CrossRef]
  54. De Jong, R.; Verbesselt, J.; Zeileis, A.; Schaepman, M.E. Shifts in Global Vegetation Activity Trends. Remote Sens. 2013, 5, 1117–1133. [Google Scholar] [CrossRef] [Green Version]
  55. Ding, M.; Li, L.; Zhang, Y.; Sun, X.; Liu, L.; Gao, J.; Wang, Z.; Li, Y. Start of vegetation growing season on the Tibetan Plateau inferred from multiple methods based on GIMMS and SPOT NDVI data. J. Geogr. Sci. 2015, 25, 131–148. [Google Scholar] [CrossRef] [Green Version]
  56. Wu, D.; Zhao, X.; Liang, S.; Zhou, T.; Huang, K.; Tang, B.; Zhao, W. Time-lag effects of global vegetation responses to climate change. Glob. Chang. Biol. 2015, 21, 3520–3531. [Google Scholar] [CrossRef] [PubMed]
  57. Zhang, X.; Yang, Y.; Piao, S.; Bao, W.; Wang, S.; Wang, G.; Sun, H.; Luo, T.; Zhang, Y.; Shi, P.; et al. Ecological change on the Tibetan Plateau. Chin. Sci. Bull. 2015, 60, 3048–3056. [Google Scholar]
  58. Zhang, Y.; Qi, W.; Zhou, C.; Ding, M.; Liu, L.; Gao, J.; Bai, W.; Wang, Z.; Zheng, D. Spatial and temporal variability in the net primary production of alpine grassland on the Tibetan Plateau since 1982. J. Geogr. Sci. 2014, 24, 269–287. [Google Scholar] [CrossRef]
  59. Cong, N.; Shen, M.; Yang, W.; Yang, Z.; Zhang, G.; Piao, S. Varying responses of vegetation activity to climate changes on the Tibetan Plateau grassland. Int. J. Biometeorol. 2017, 61, 1433–1444. [Google Scholar] [CrossRef] [PubMed]
  60. Gao, Q.; Li, Y.; Wan, Y.; Qin, X.; Jiangcun, W.; Liu, Y. Dynamics of alpine grassland NPP and its response to climate change in Northern Tibet. Clim. Chang. 2009, 97, 515–528. [Google Scholar] [CrossRef]
  61. Lehnert, L.W.; Wesche, K.; Trachte, K.; Reudenbach, C.; Bendix, J. Climate variability rather than overstocking causes recent large scale cover changes of Tibetan pastures. Sci. Rep. 2016, 6, 24367. [Google Scholar] [CrossRef] [PubMed] [Green Version]
  62. Yao, T.; Thompson, L.; Yang, W.; Yu, W.; Gao, Y.; Guo, X.; Yang, X.; Duan, K.; Zhao, H.; Xu, B.; et al. Different glacier status with atmospheric circulations in Tibetan Plateau and surroundings. Nat. Clim. Chang. 2012, 2, 663–667. [Google Scholar] [CrossRef]
  63. Liu, H.; Piao, S. Drought threatened semi-arid ecosystems in the Inner Asia. Agric. For. Meteorol. 2013, 178–179, 1–2. [Google Scholar] [CrossRef]
  64. Shen, M.; Zhang, G.; Cong, N.; Wang, S.; Kong, W.; Piao, S. Increasing altitudinal gradient of spring vegetation phenology during the last decade on the Qinghai–Tibetan Plateau. Agric. For. Meteorol. 2014, 189–190, 71–80. [Google Scholar] [CrossRef]
  65. Ganjurjav, H.; Gao, Q.; Schwartz, M.W.; Zhu, W.; Liang, Y.; Li, Y.; Wan, Y.; Cao, X.; Williamson, M.A.; Jiangcun, W.; et al. Complex responses of spring vegetation growth to climate in a moisture-limited alpine meadow. Sci. Rep. 2016, 6. [Google Scholar] [CrossRef] [PubMed]
  66. Huang, K.; Zhang, Y.; Zhu, J.; Liu, Y.; Zu, J.; Zhang, J. The Influences of Climate Change and Human Activities on Vegetation Dynamics in the Qinghai-Tibet Plateau. Remote Sens. 2016, 8, 876. [Google Scholar] [CrossRef]
  67. Wang, X.; Yi, S.; Wu, Q.; Yang, K.; Ding, Y. The role of permafrost and soil water in distribution of alpine grassland and its NDVI dynamics on the Qinghai-Tibetan Plateau. Glob. Planet. Chang. 2016, 147, 40–53. [Google Scholar] [CrossRef]
  68. Xu, X.; Chen, H.; Levy, J.K. Spatiotemporal vegetation cover variations in the Qinghai-Tibet Plateau under global climate change. Sci. Bull. 2008, 53, 915–922. [Google Scholar] [CrossRef]
  69. Kang, X.; Hao, Y.; Cui, X.; Chen, H.; Huang, S.; Du, Y.; Li, W.; Kardol, P.; Xiao, X.; Cui, L. Variability and Changes in Climate, Phenology, and Gross Primary Production of an Alpine Wetland Ecosystem. Remote Sens. 2016, 8, 391. [Google Scholar] [CrossRef]
  70. Wang, H.; Liu, D.; Lin, H.; Montenegro, A.; Zhu, X. NDVI and vegetation phenology dynamics under the influence of sunshine duration on the Tibetan plateau. Int. J. Climatol. 2015, 35, 687–698. [Google Scholar] [CrossRef]
  71. Wang, X.; Wang, T.; Liu, D.; Guo, H.; Huang, H.; Zhao, Y. Moisture-induced greening of the South Asia over the past three decades. Glob. Chang. Biol. 2017, 23, 4995–5005. [Google Scholar] [CrossRef] [PubMed]
  72. Cong, N.; Piao, S.; Chen, A.; Wang, X.; Lin, X.; Chen, S.; Han, S.; Zhou, G.; Zhang, X. Spring vegetation green-up date in China inferred from SPOT NDVI data: A multiple model analysis. Agric. For. Meteorol. 2012, 165, 104–113. [Google Scholar] [CrossRef]
  73. Wang, Y. Phenological observation of the early spring ephemeral and ephemeriod plant in Xinjiang. Arid Zone Res. 1993, 34–39. [Google Scholar]
  74. Zhang, W.; Miller, P.A.; Jansson, C.; Samuelsson, P.; Mao, J.; Smith, B. Self-Amplifying Feedbacks Accelerate Greening and Warming of the Arctic. Geophys. Res. Lett. 2018. [Google Scholar] [CrossRef]
  75. Cai, H.; Yang, X.; Xu, X. Human-induced grassland degradation/restoration in the central Tibetan Plateau: The effects of ecological protection and restoration projects. Ecol. Eng. 2015, 83, 112–119. [Google Scholar] [CrossRef] [Green Version]
  76. Zhang, Y.; Hu, Z.; Qi, W.; Wu, X.; Bai, W.; Li, L.; Ding, M.; Liu, L.; Wang, Z.; Zheng, D. Assessment of effectiveness of nature reserves on the Tibetan Plateau based on net primary production and the large sample comparison method. J. Geogr. Sci. 2016, 26, 27–44. [Google Scholar] [CrossRef] [Green Version]
  77. Xu, H.; Wang, X.; Zhang, X. Alpine grasslands response to climatic factors and anthropogenic activities on the Tibetan Plateau from 2000 to 2012. Ecol. Eng. 2016, 92, 251–259. [Google Scholar] [CrossRef]
Figure 1. Vegetation types and ecosystem zones on the Tibetan Plateau (TP).
Remotesensing 10 01525 g001
Figure 2. Inter-annual change of growing season NDVI (GNDVI) on the Tibetan Plateau (TP), (a) the area-averaged GNDVI trend, (b) the spatial patterns of GNDVI trends. Insets in the top of panel (b) show the significance level of the trends and the percentage of the pixels in each interval of trend indicated by the color in the legend in the left bottom.
Remotesensing 10 01525 g002
Figure 3. Change percentages of growing season NDVI (GNDVI) across different elevation bins (a) and ecosystem zones (b) on the Tibetan Plateau (TP). *** p < 0.001; ** p < 0.01; * p < 0.05.
Remotesensing 10 01525 g003
Figure 4. Timing of major trend shifts in vegetation greenness across the entire Tibetan Plateau (TP) and different ecosystem zones based on the BFAST model.
Remotesensing 10 01525 g004
Figure 5. Climatic factors’ time lag at which the maximum partial correlation coefficient between GNDVI and (a) temperature (Tem), (b) total precipitation (Pre), and (c) radiation (Rad) across different ecosystem zones.
Remotesensing 10 01525 g005
Figure 6. The responses of the GNDVI to temperature (Tem), total precipitation (Pre), and radiation (Rad) within different ecosystem zones during 2000–2015 considering time-lag effects (according to Figure 5). (a) The partial correlation between GNDVI and temperature (Tem) after controlling for total precipitation (Pre) and radiation (Rad); and (b) the partial correlation between GNDVI and total precipitation (Pre) after controlling for temperature (Tem) and radiation (Rad); (c) the partial correlation between GNDVI and radiation (Rad) after controlling for temperature (Tem) and total precipitation (Pre). The significance level for partial correlation was calculated by F-tests.
Remotesensing 10 01525 g006
Figure 7. Spatial distribution of changes in growing season NDVI (GNDVI), temperature (Tem), total precipitation (Pre), and radiation (Rad) during different periods before and after the breakpoints according to Figure 4. The trends in GNDVI, temperature (Tem), total precipitation (Pre), and radiation (Rad) were shown in panel during 2000–2015 (a), before the breakpoint (b), and after the breakpoint of GNDVI (c). Time lag of temperature (Tem), total precipitation (Pre), and radiation (Rad) were based on Figure 5.
Remotesensing 10 01525 g007
Figure 8. Inter-annual variations of growing season NDVI (GNDVI) and the related climate variables considering time-lag effects in the following ecosystem zones: IIC2 (a), IC1 (b), IC2 (c), and IIC1 (d). The black solid line indicates linear fits for the period of 2000–2015. The green and red solid lines represent linear fits before and after the breakpoint of GNDVI according to Figure 4, respectively.
Remotesensing 10 01525 g008
Figure 9. Differences in change percentage of growing season NDVI (GNDVI) versus human footprint pressure (HFP) from 2000 to 2015. *** p < 0.001; ** p < 0.01; * p < 0.05.
Remotesensing 10 01525 g009
Table 1. Information of the 11 ecosystem zones on the Tibetan Plateau (TP).
CodeClimate ConditionEcosystem Zones
OA1Plateau subtropical humidSoutheastern Himalayas montane evergreen broad-leaved forest zone
IIAB1Plateau temperate humid/sub-humidWestern Sichuan-eastern Tibet montane coniferous forest zone
IB1Plateau sub-cold sub-humidGuoluo-Naqu mountain alpine shrub-meadow zone
IC1Plateau sub-cold semi-aridSouthern Qinghai alpine meadow-steppe zone
IC2Plateau sub-cold semi-aridQiangtang Plateau alpine steppe zone
IIC1Plateau temperate semi-aridSouthern Tibet montane shrub-steppe zone
IIC2Plateau temperate semi-aridEastern Qinghai-Qilian montane steppe zone
IID1Plateau temperate aridNgali montane desert zone
IID2Plateau temperate aridQaidam Basin desert region
IID3Plateau sub-cold aridNorth Kunlun desert zone

