Physical Simulation of Molten Steel Homogenization and Slag Entrapment in Argon Blown Ladle

 , , ,
, , ,
Abstract
:1. Introduction
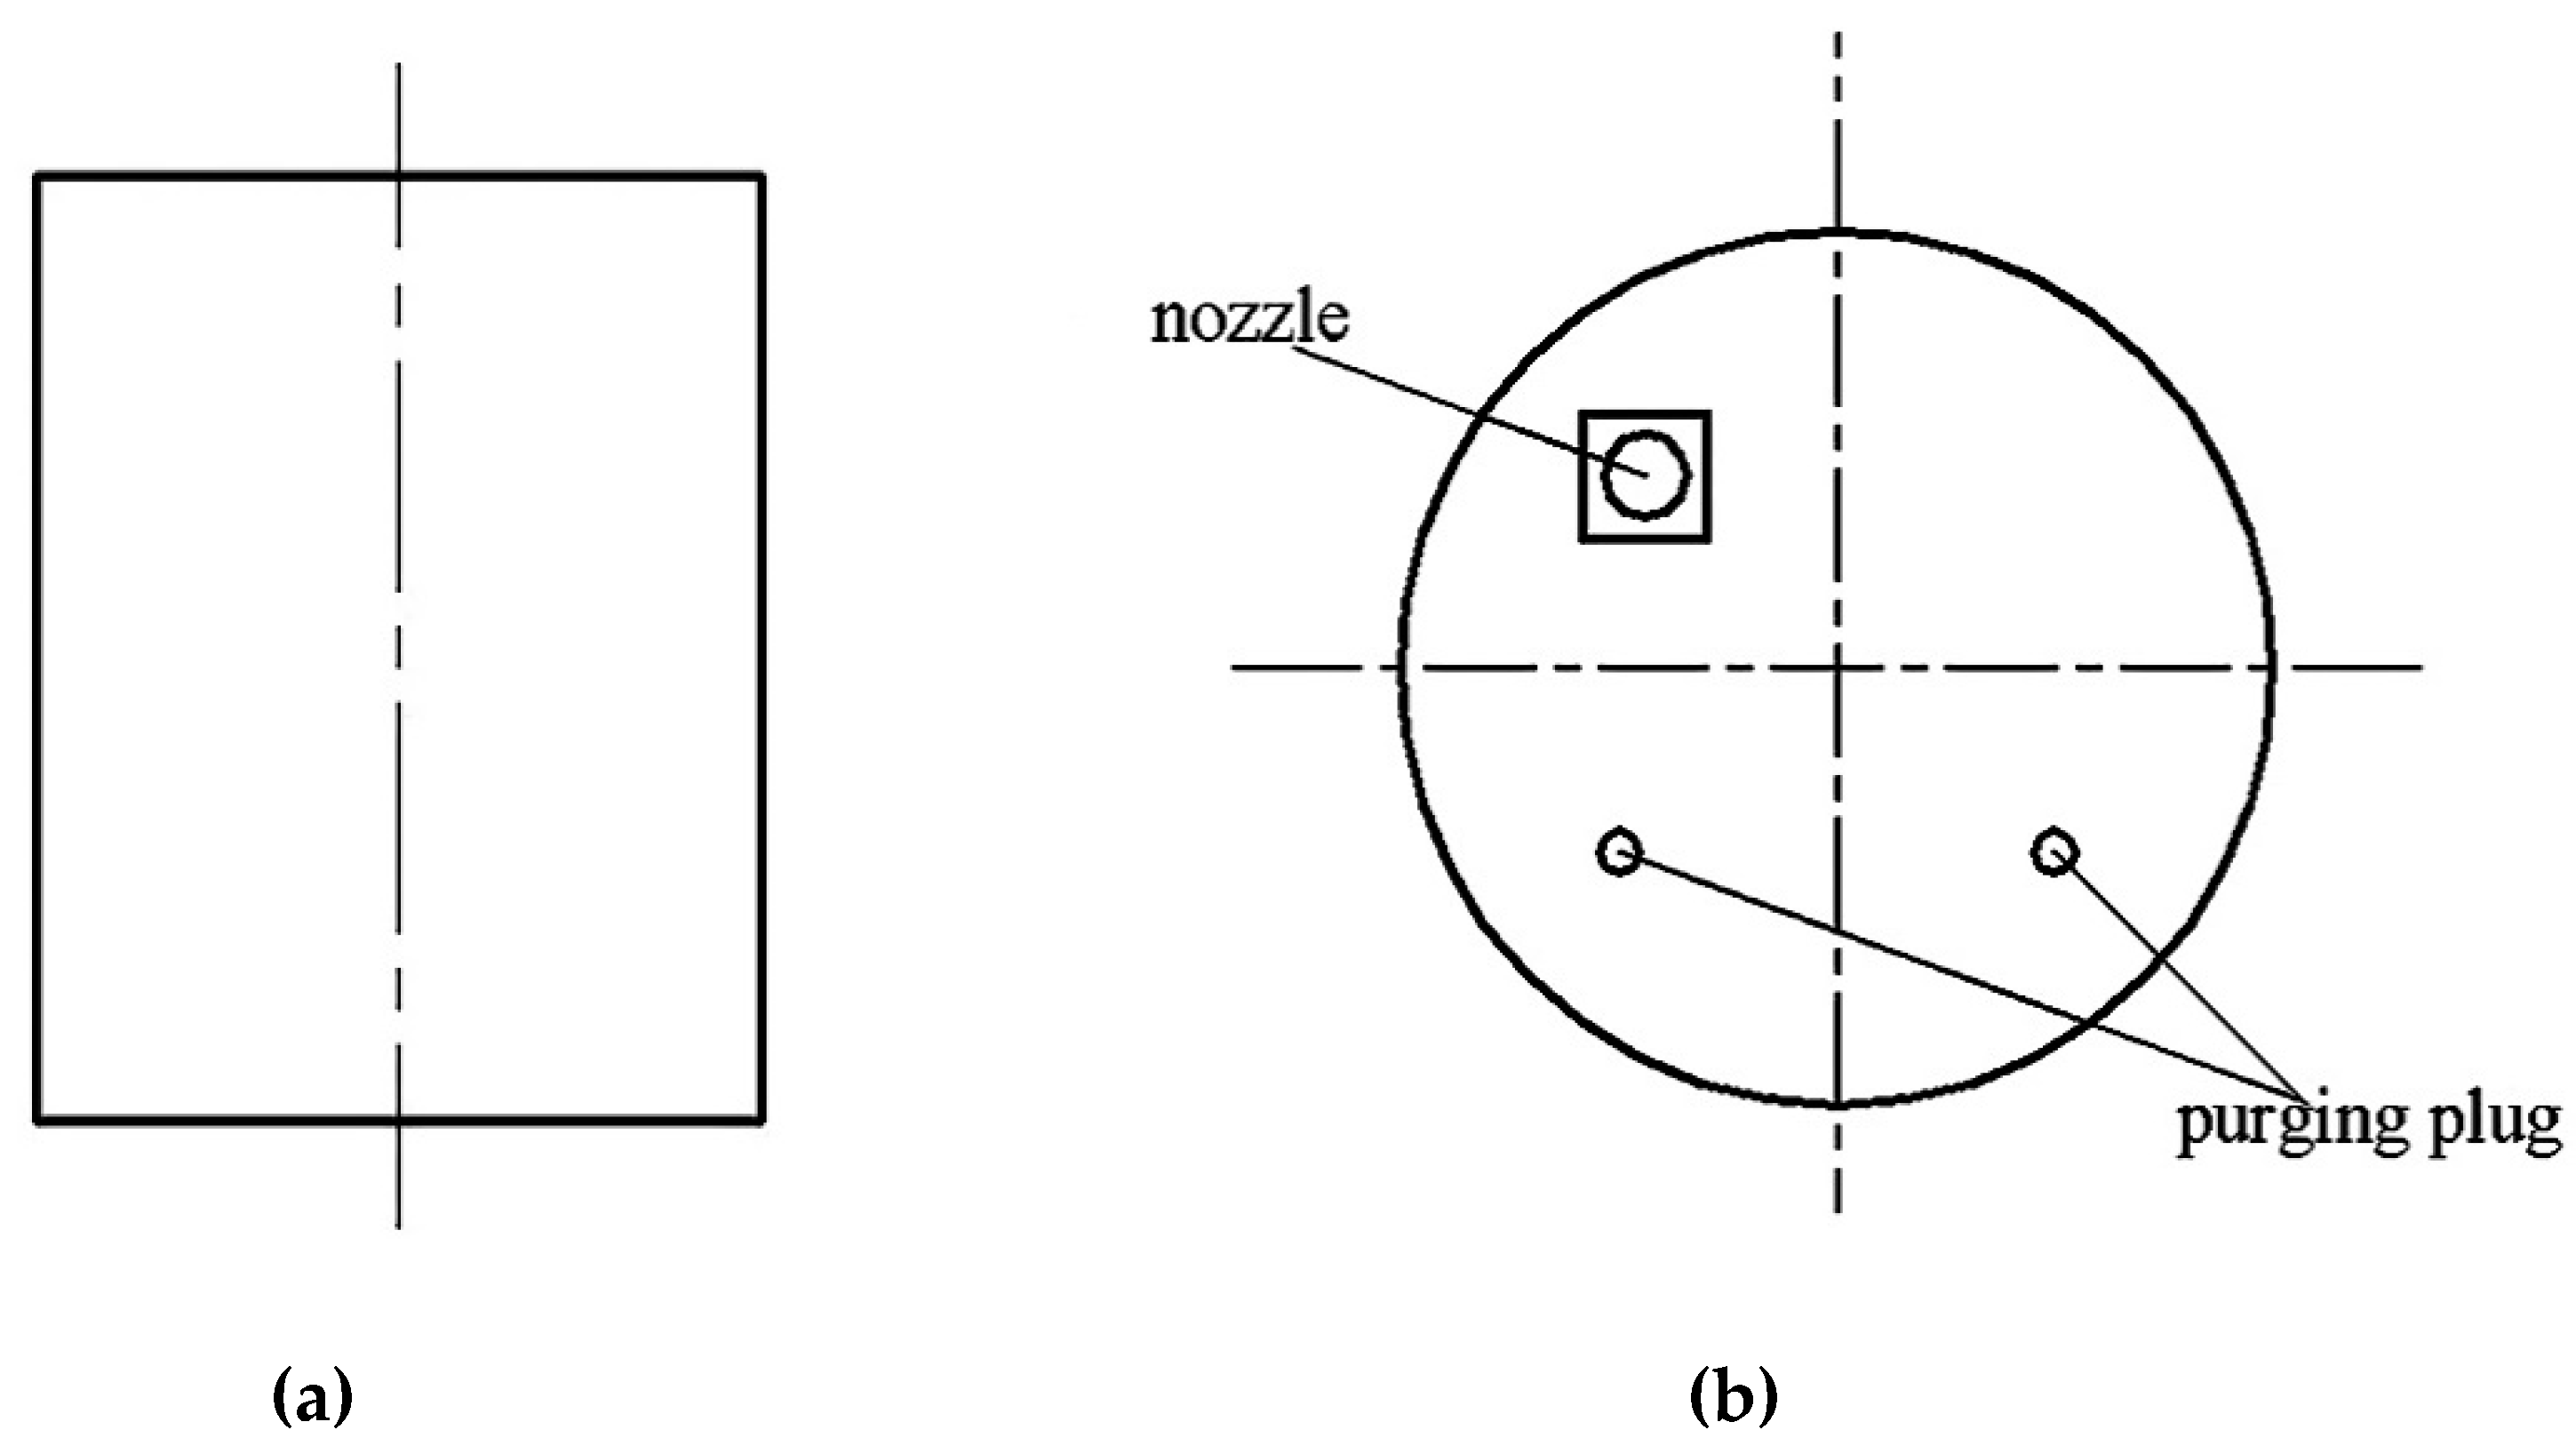
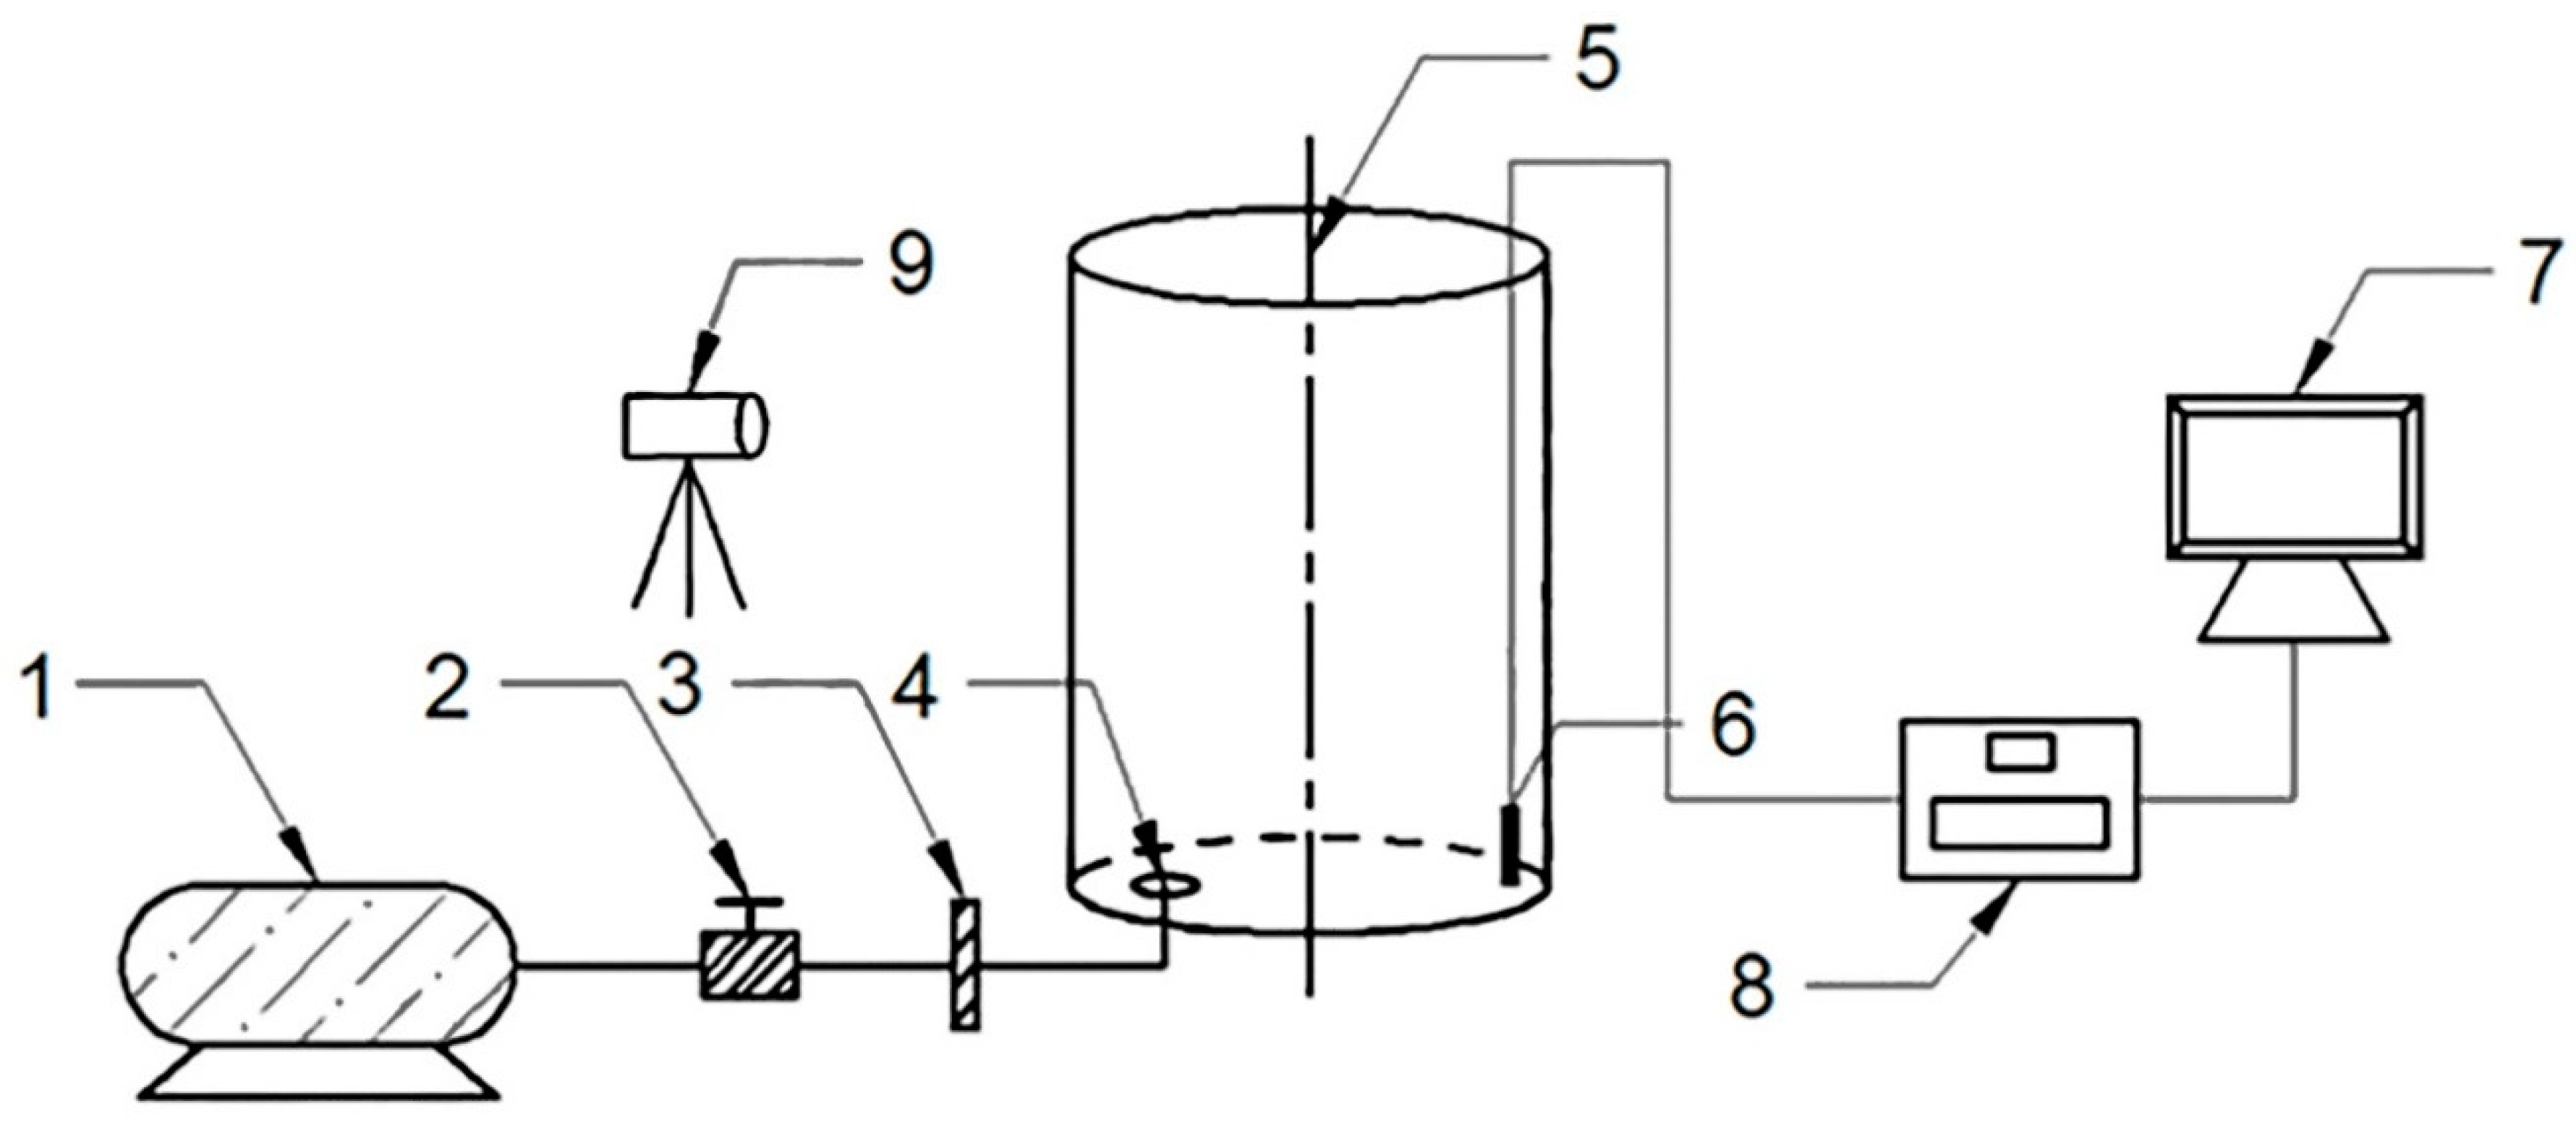
2. Water Model
3. Results and Discussion
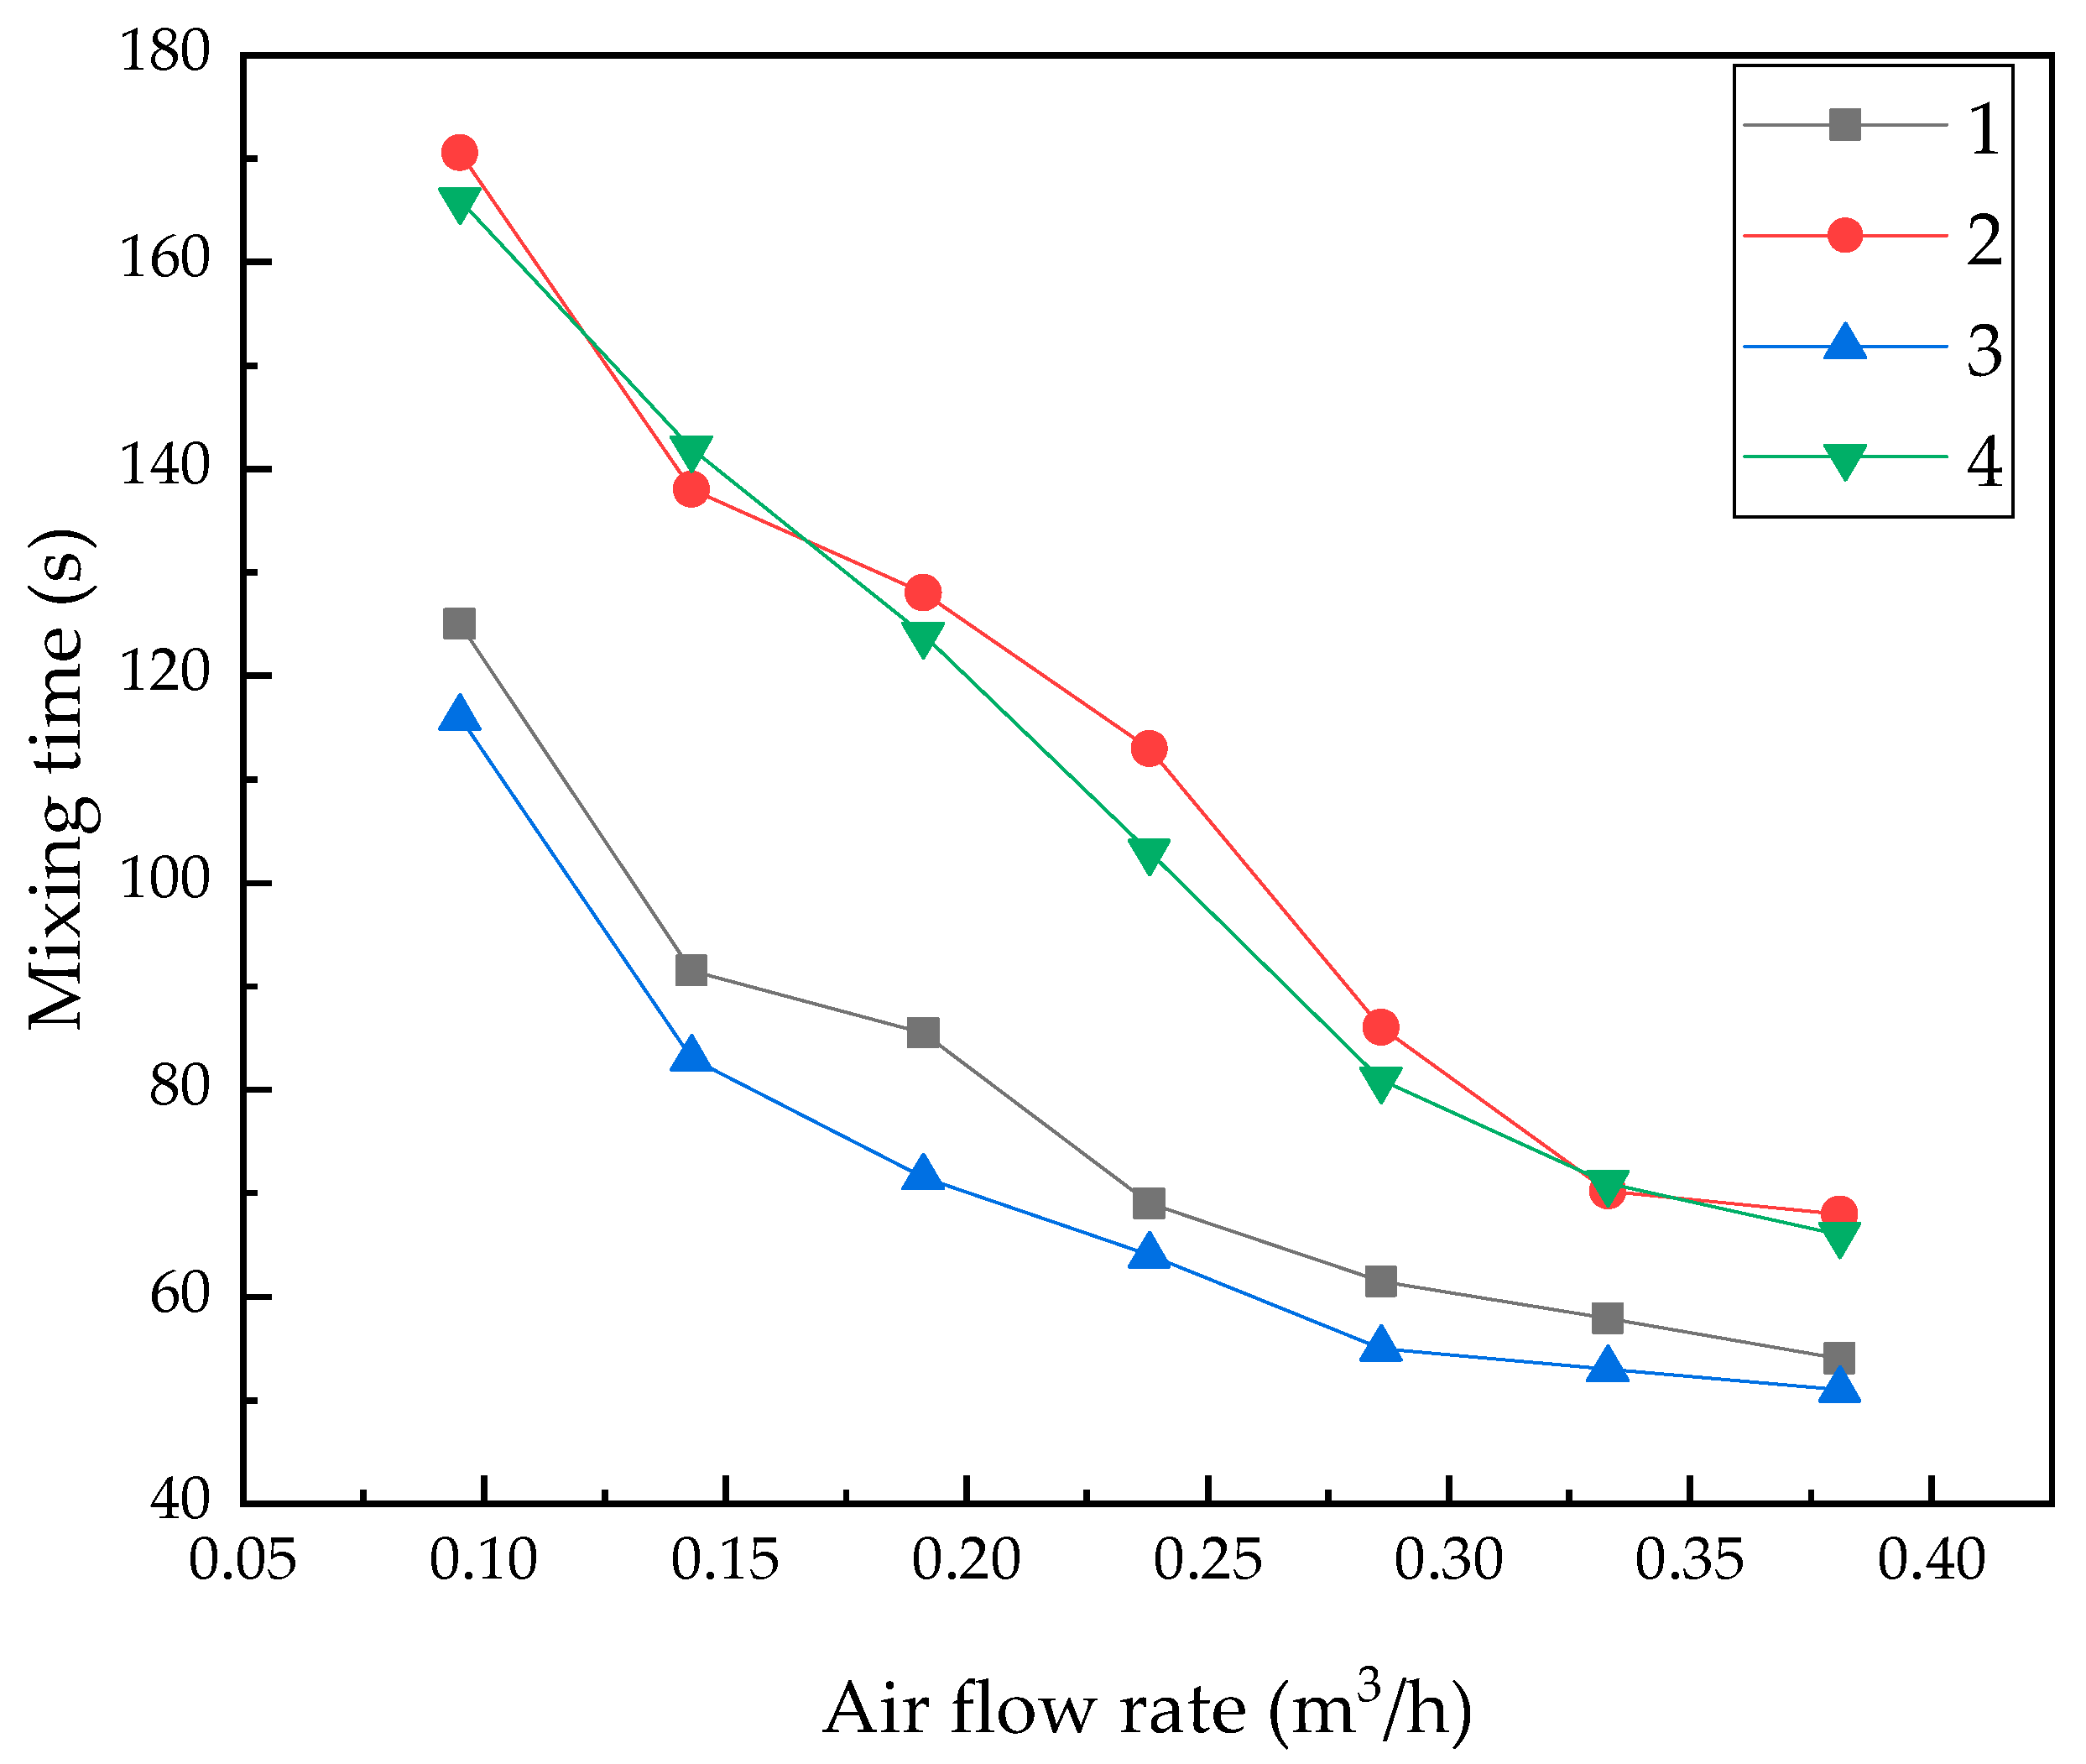
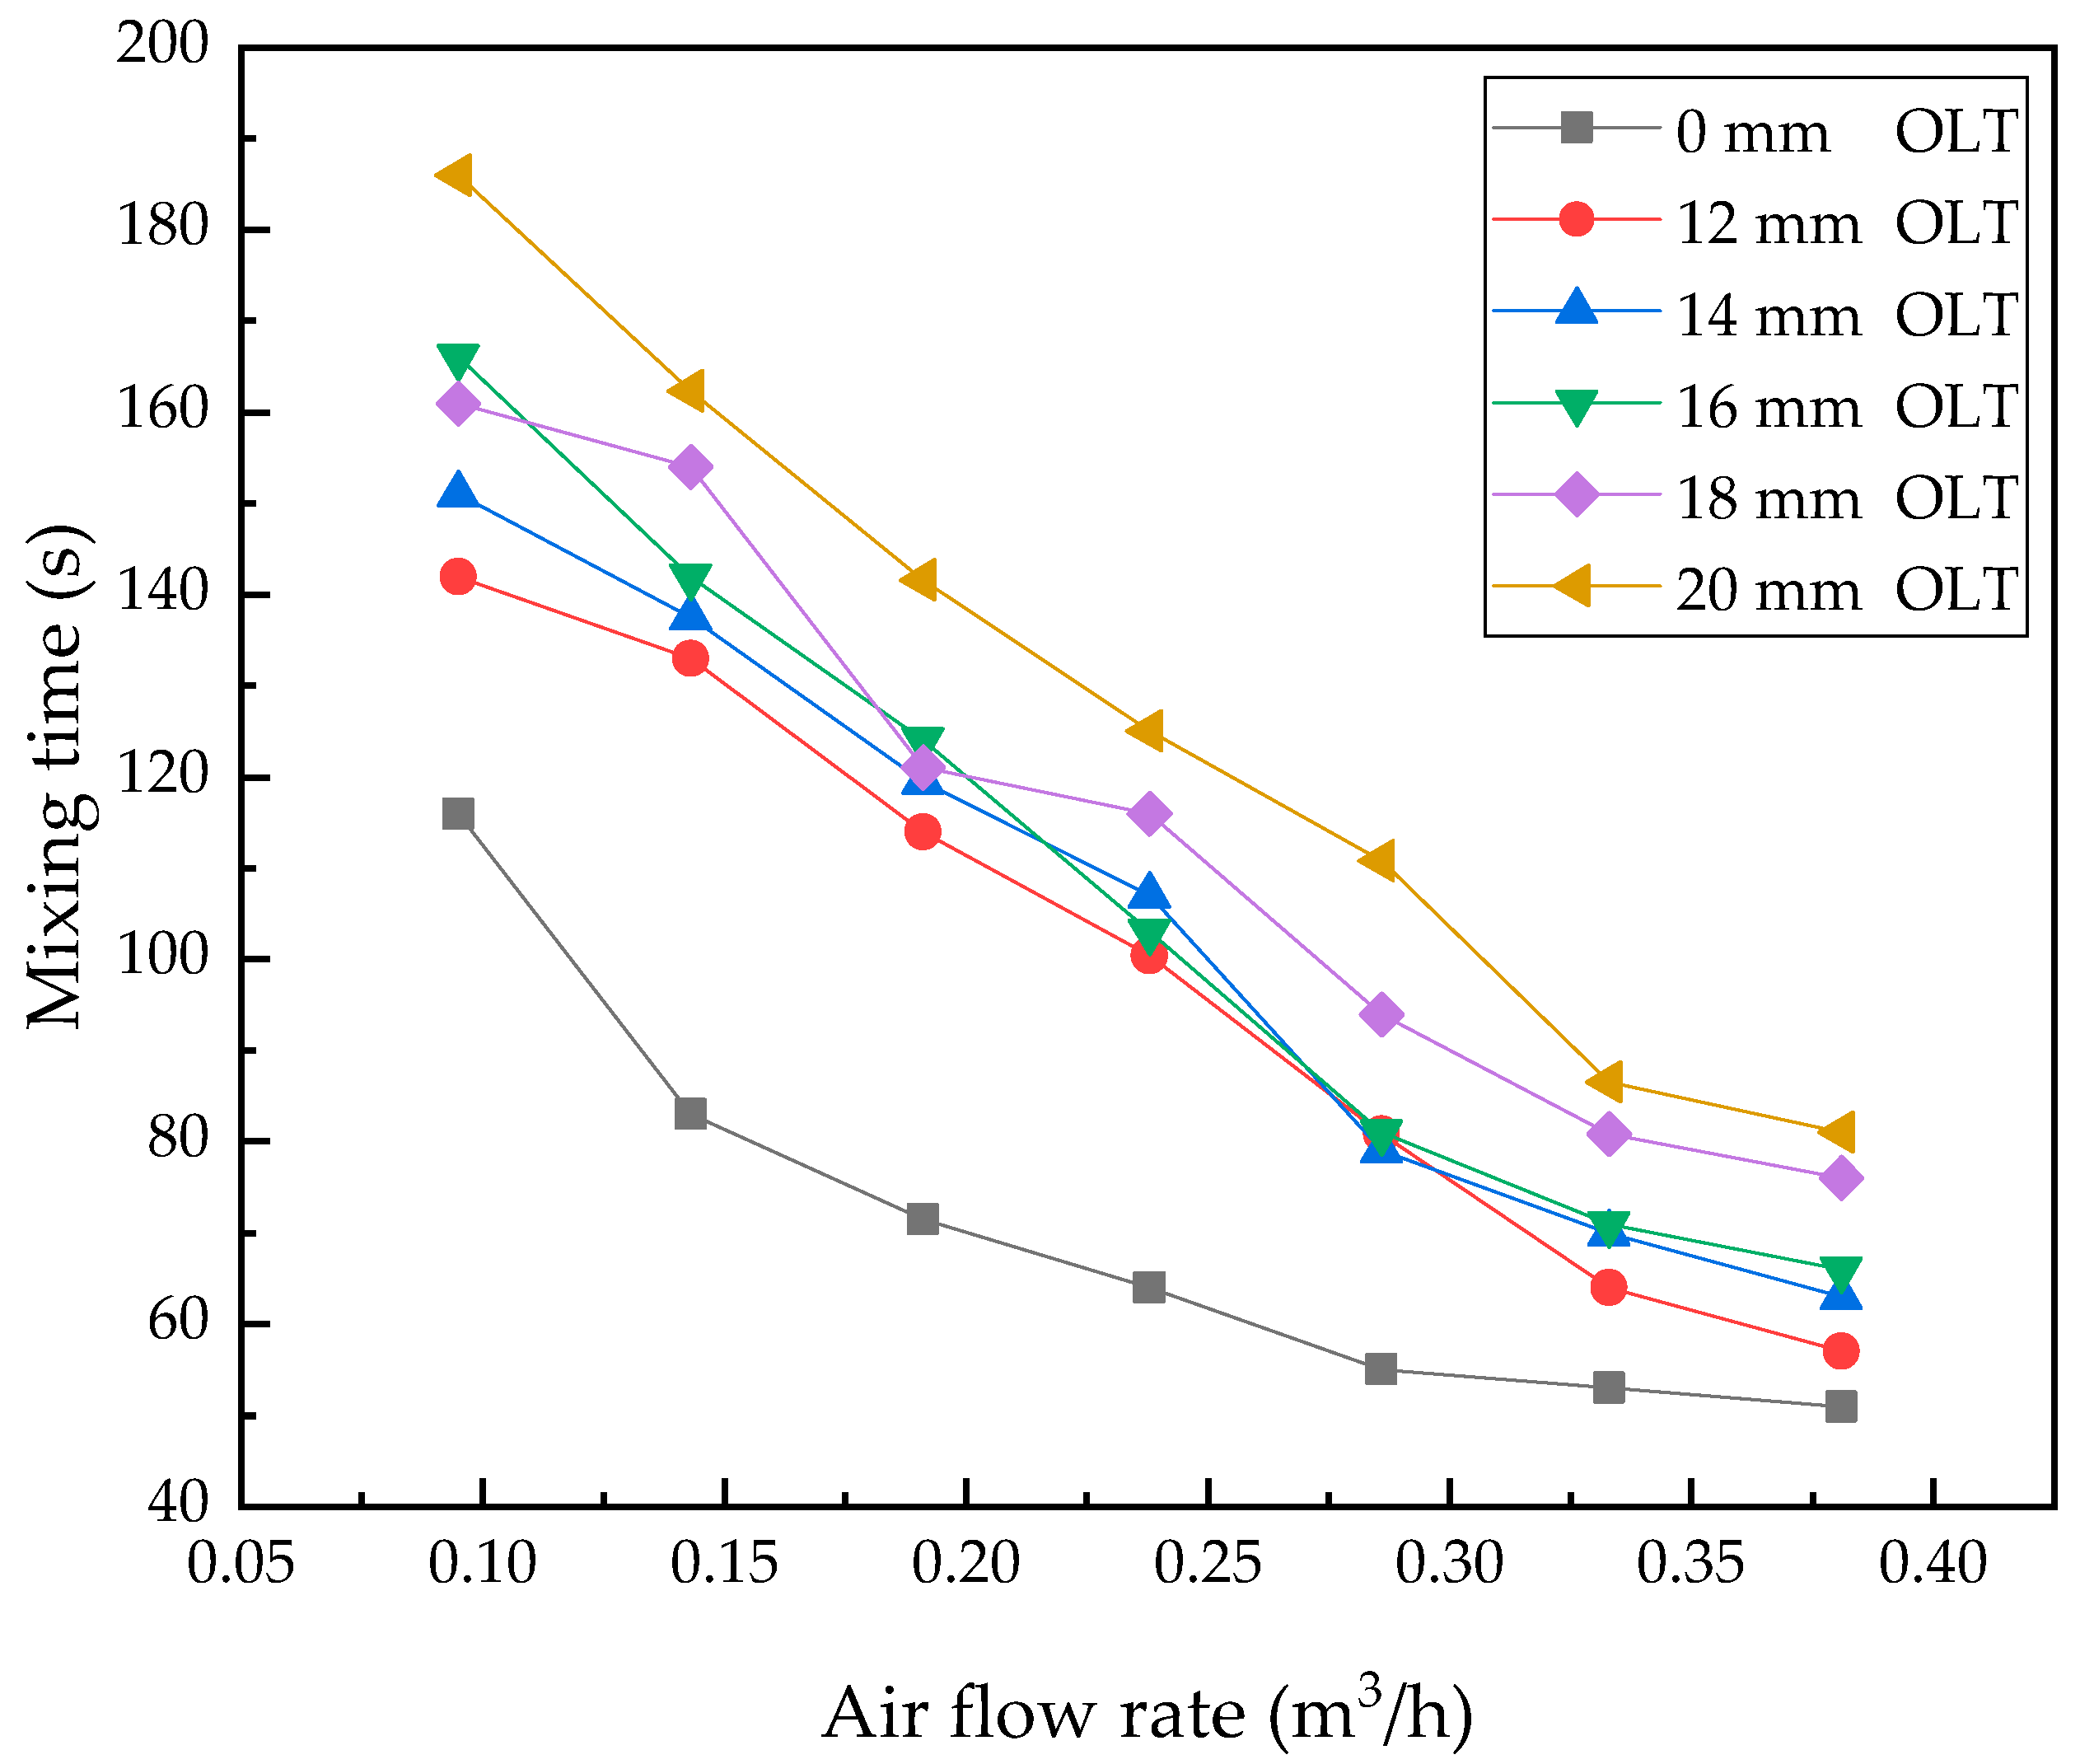
3.1. Mixing Time
3.2. The Entrapment of Slag in Ladle
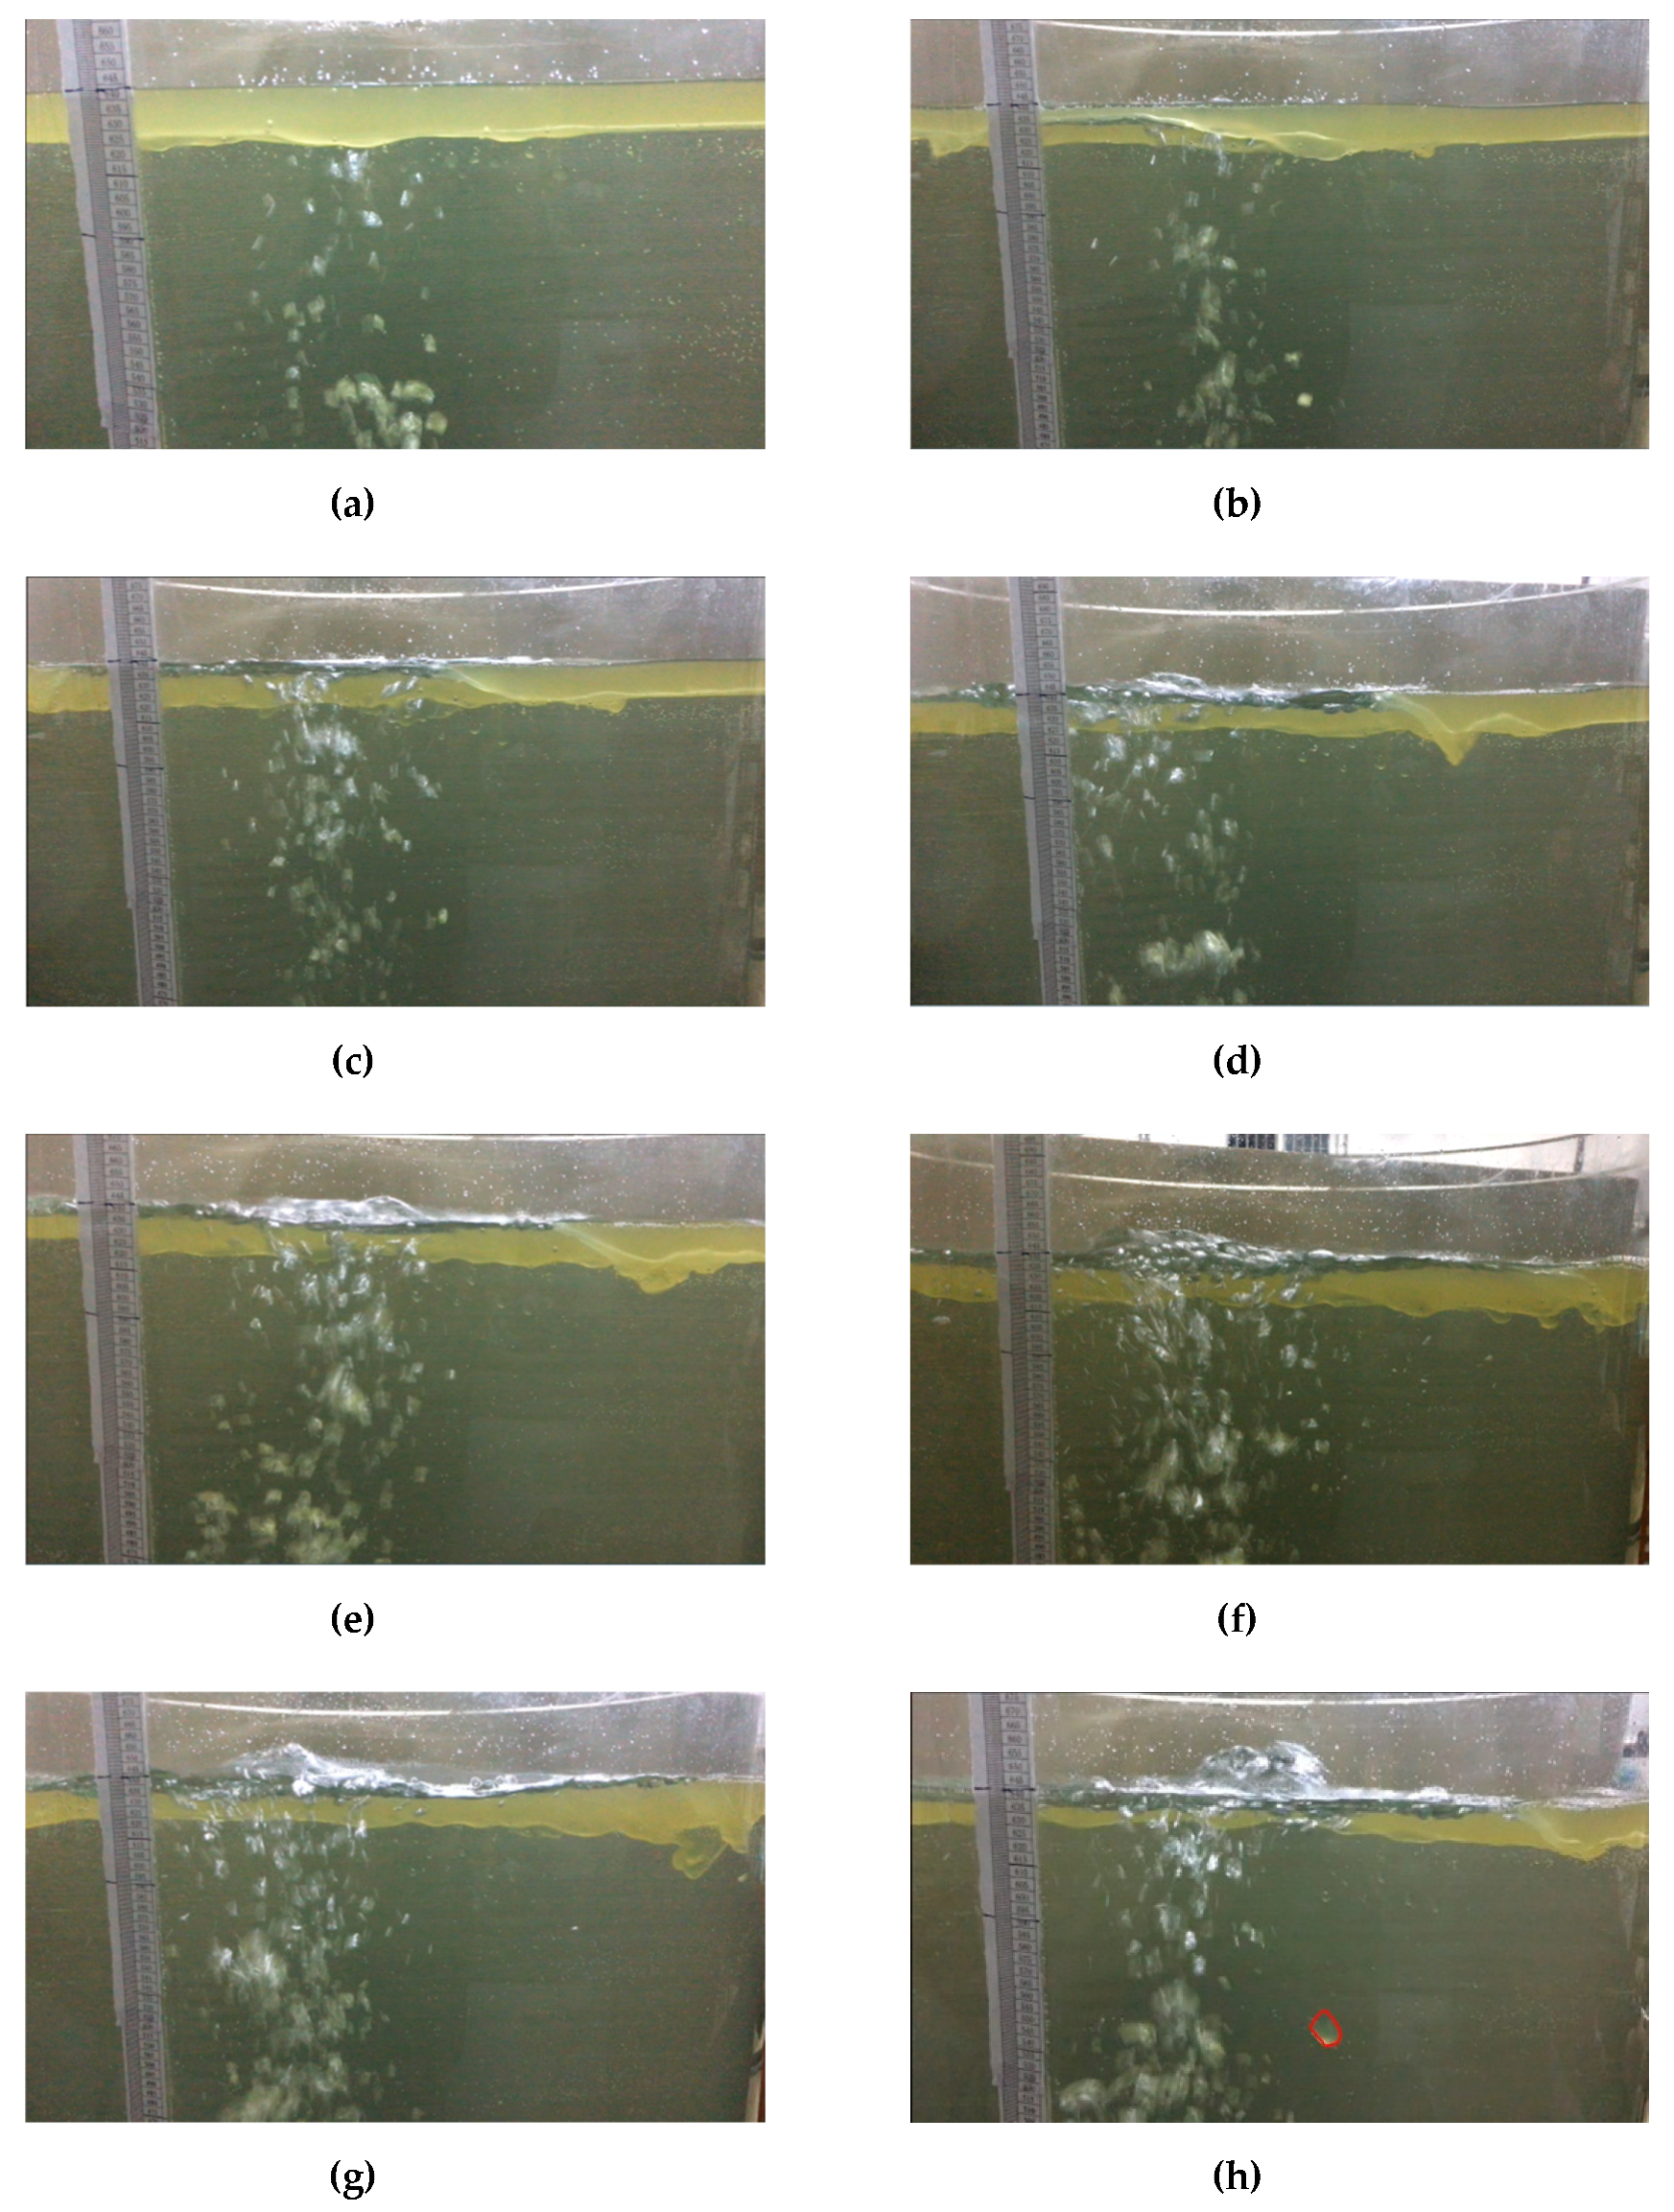
3.2.1. The Entrapment of Slag in Ladle with Single Porous Plug
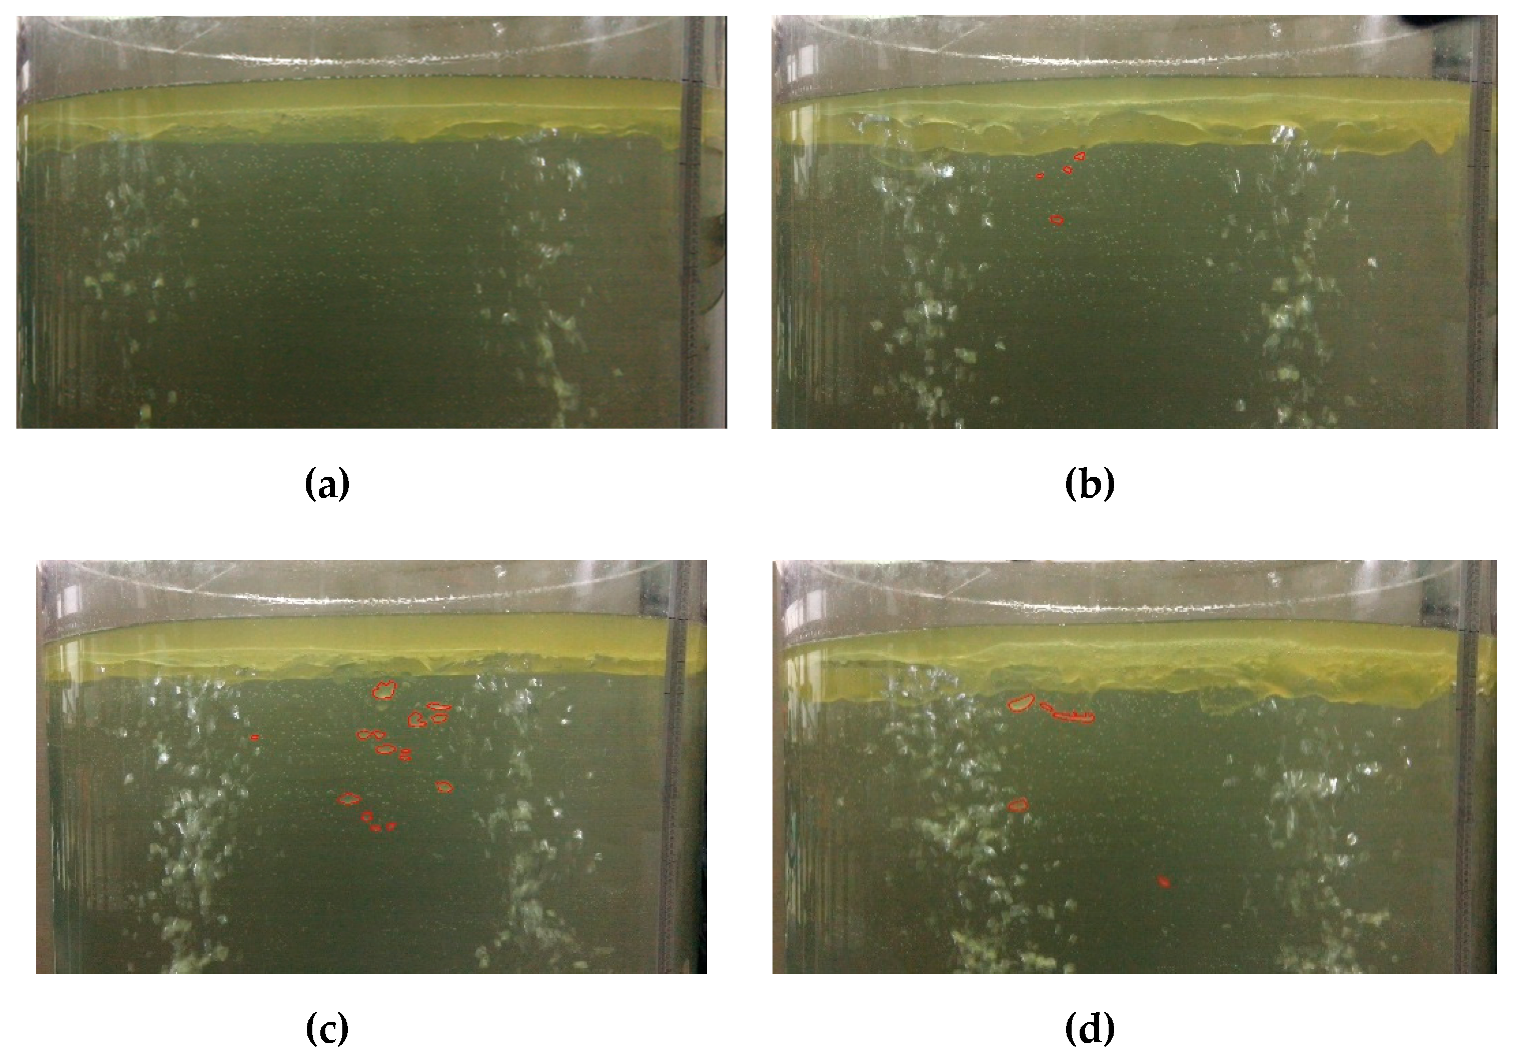
3.2.2. The Entrapment of Slag in Ladle with Double Porous Plugs
3.3. Comprehensive Analysis of Mixing and Slag Entrapment
4. Conclusions
- (1)
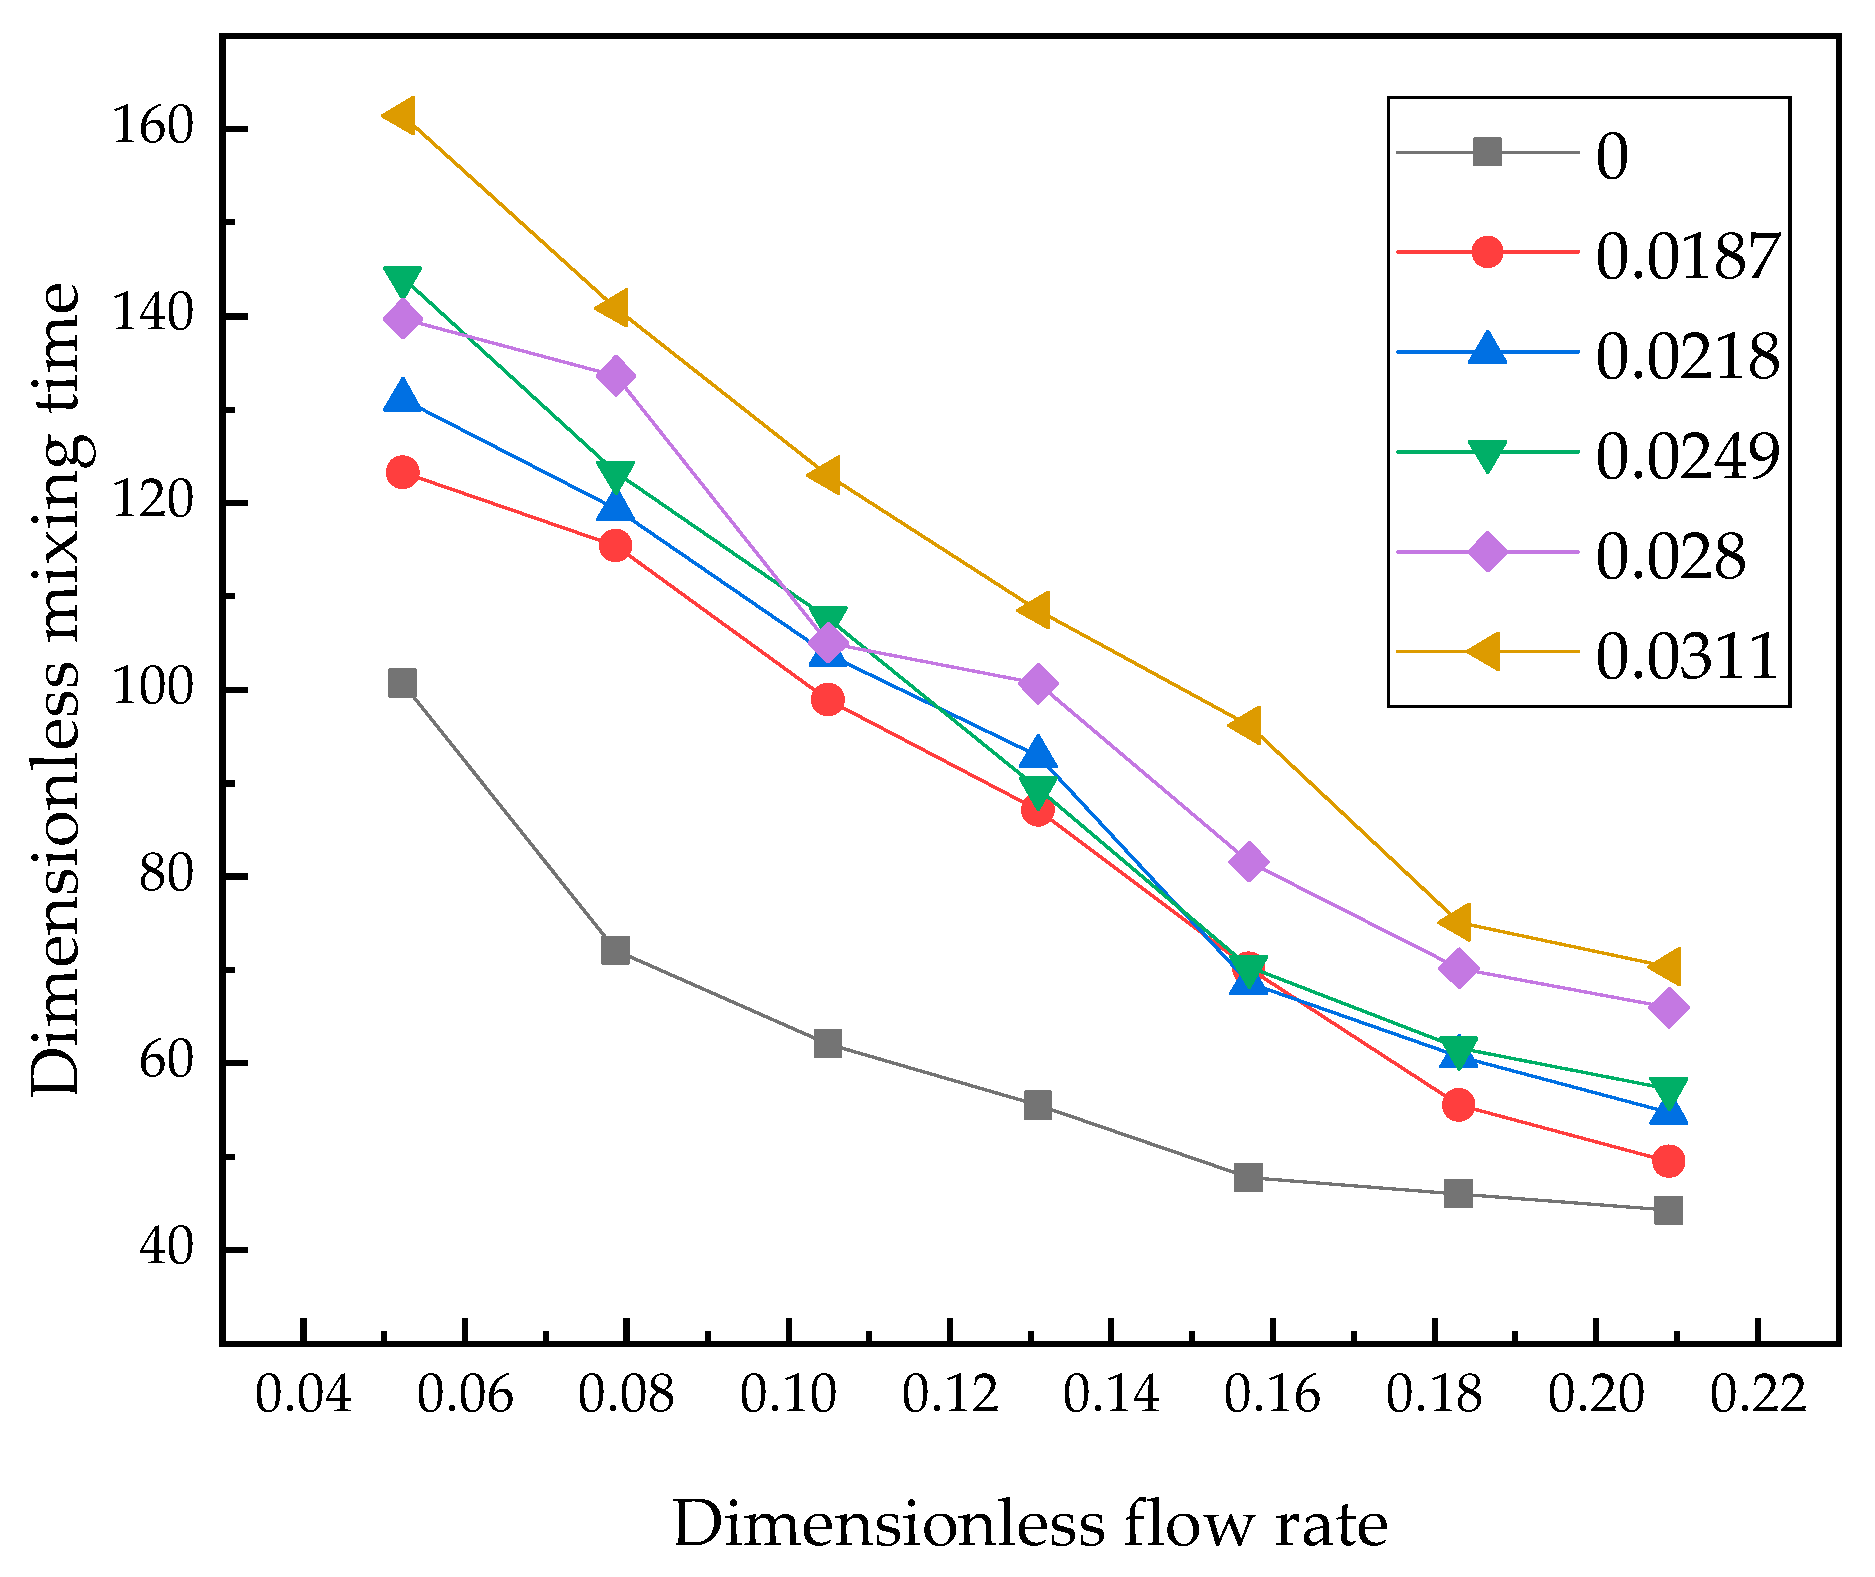
- The bath mixing in the ladle is affected by the number of porous plugs, flow rate and slag layer. Under the same blowing flow rate, the mixing time of double porous plugs is shorter than that of a single porous plug. The mixing time of the two methods eccentric blowing is basically the same, and the mixing time decreases with the increase of the blowing flow rate, and increases with the increase of the slag layer thickness. There is an inflection point in the mixing time curve, the flow rate at the point is 0.333 m3/h (corresponding 42 m3/h in prototype), the mixing time before the inflection point changes significantly, but after the inflection point, the mixing time changes slowly. The mixing time of the ladle without the slag layer is significantly shorter than that with the slag layer.
- (2)
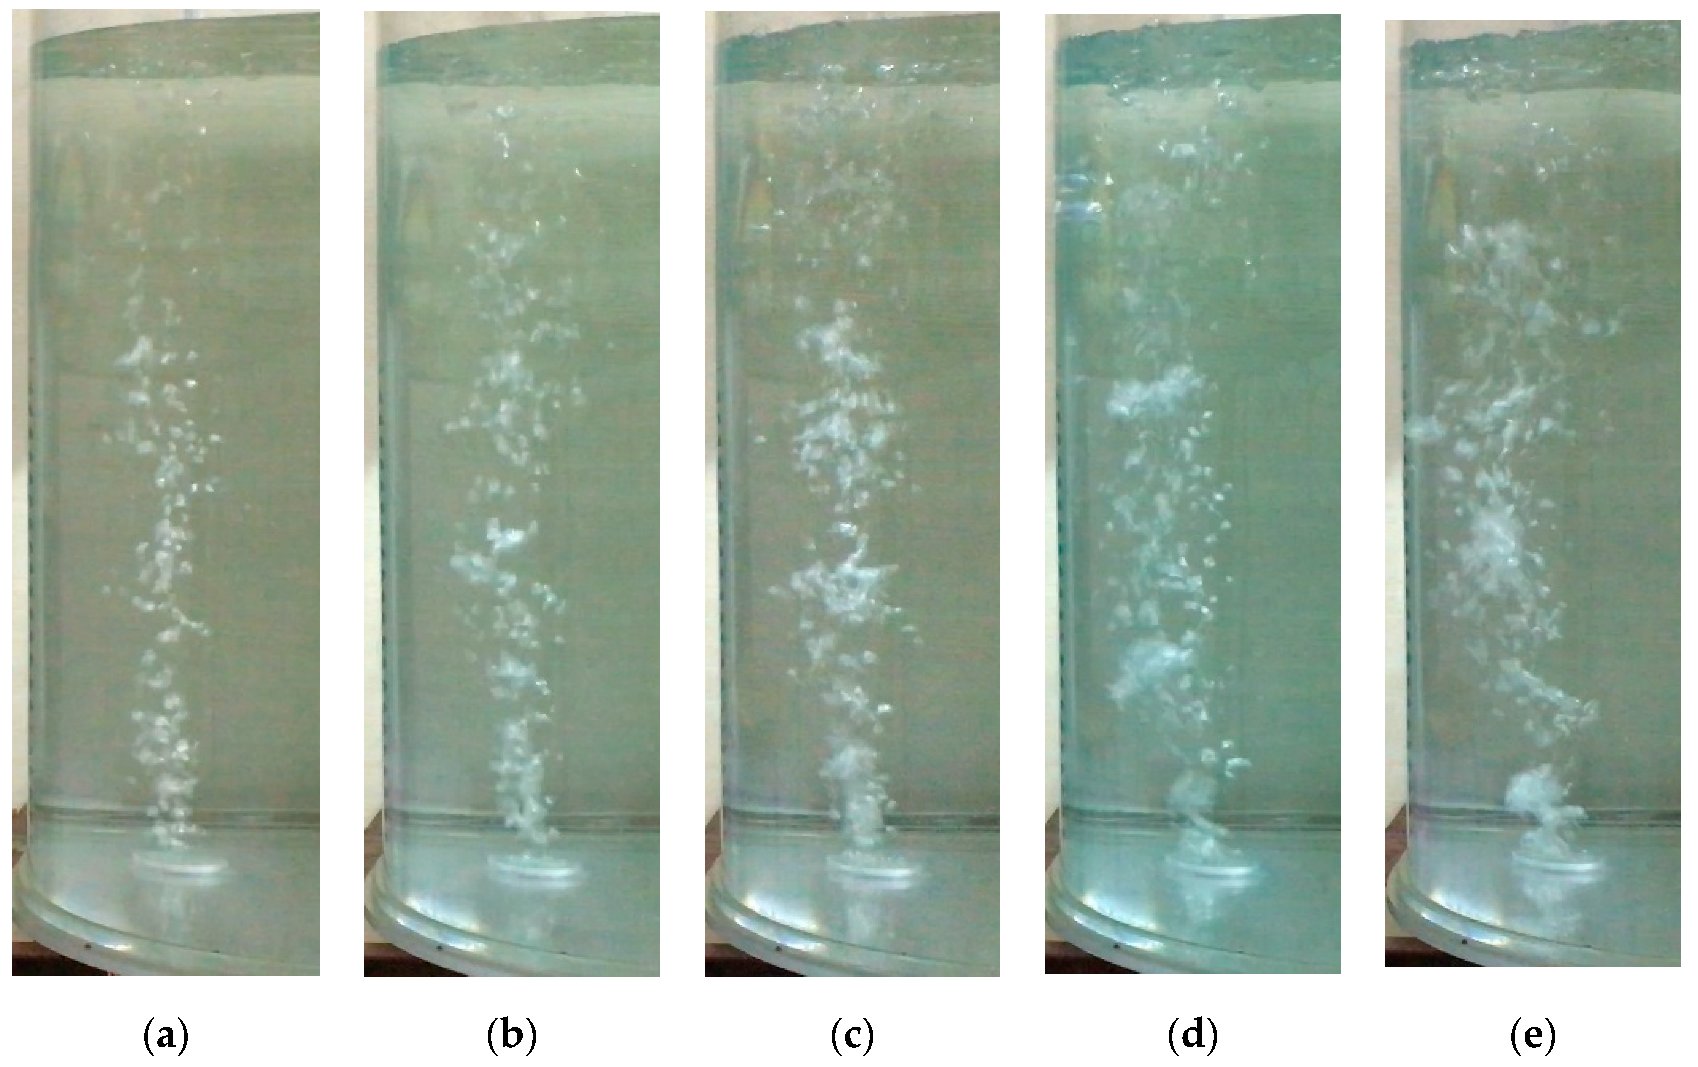
- The critical bottom flow rates for oil entrapment in the water model were in the range of 0.095–0.143 m3/h (18–24 m3/h for the prototype ladle) for the ladle with a single porous plug, and the critical bottom flow rate causing entrapment was 0.095 m3/h (12 m3/h for the prototype ladle) for the ladle with a double porous plug, the double porous plug is easier to the entrapped slag.
- (3)
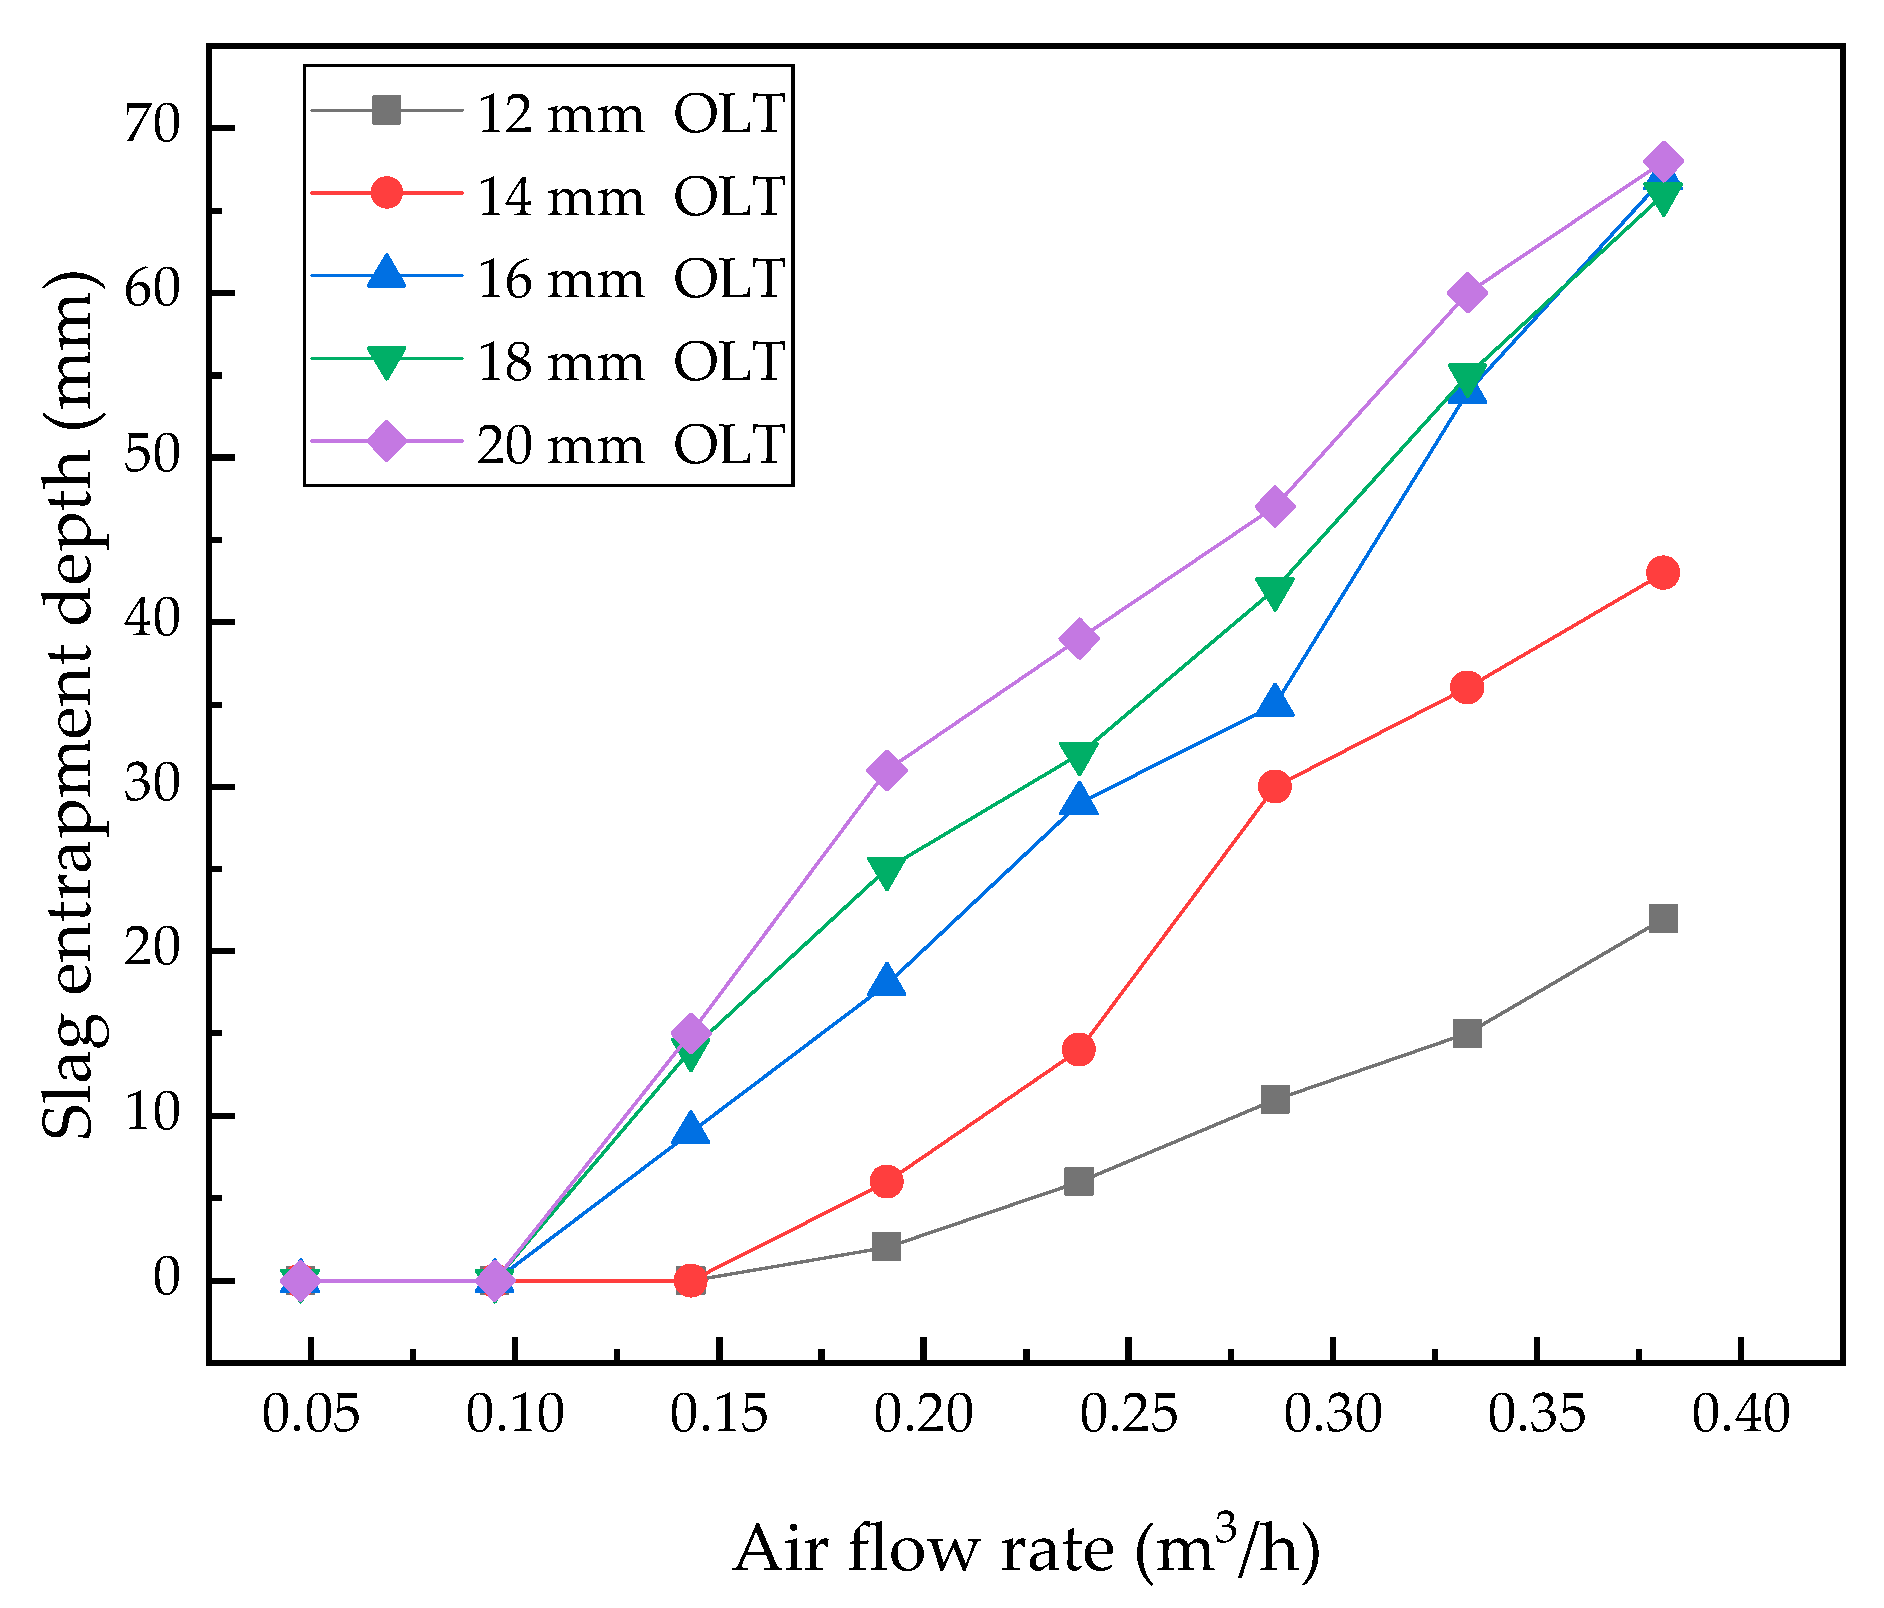
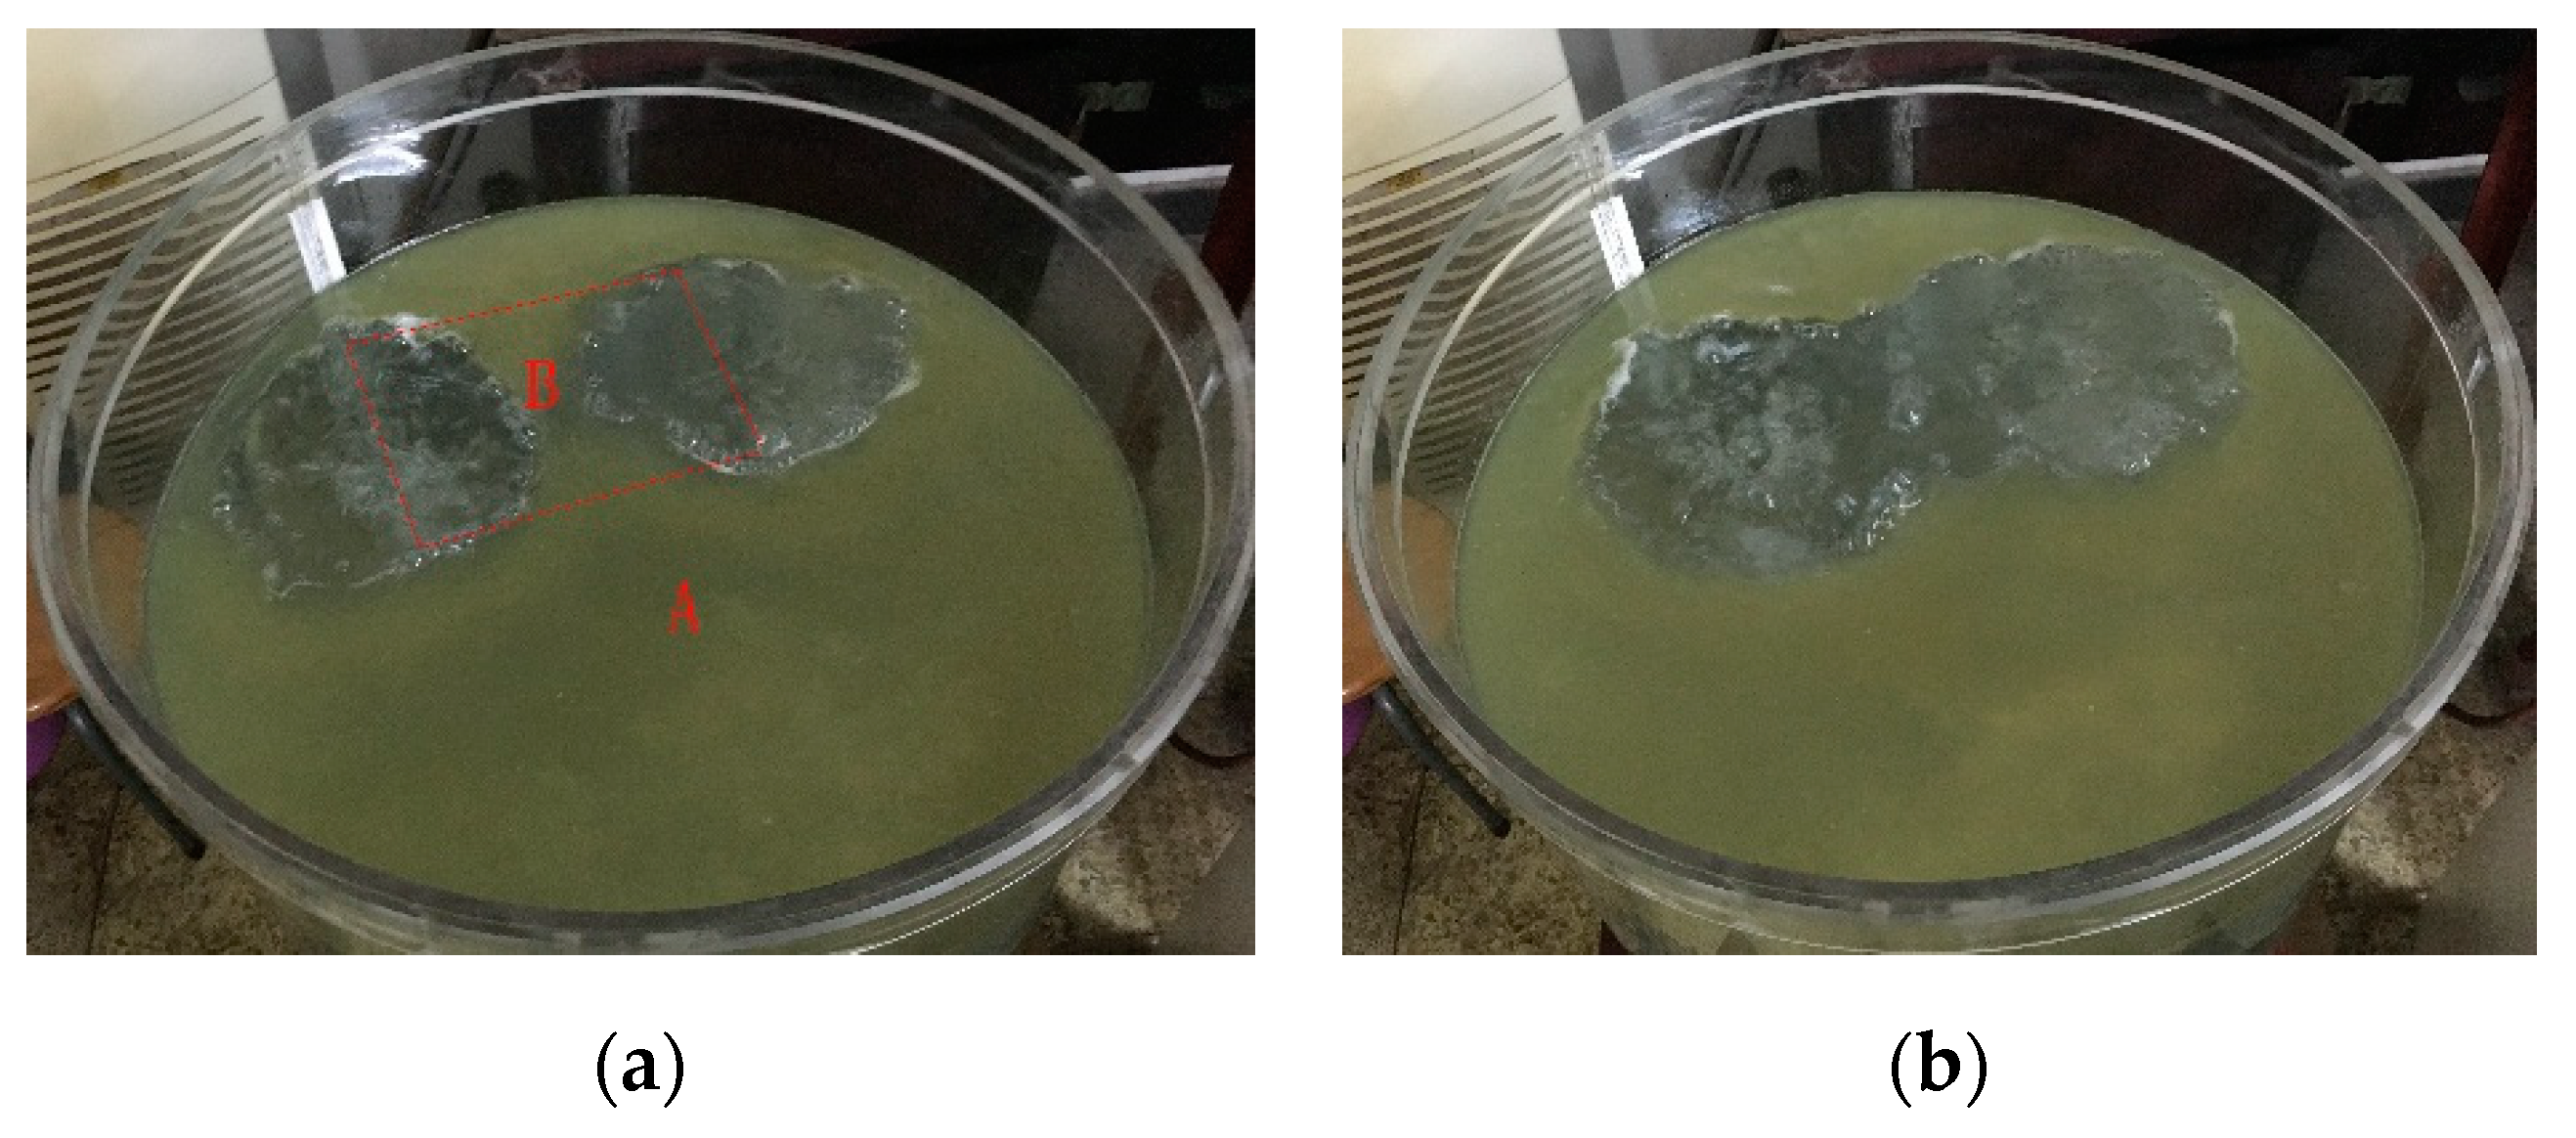
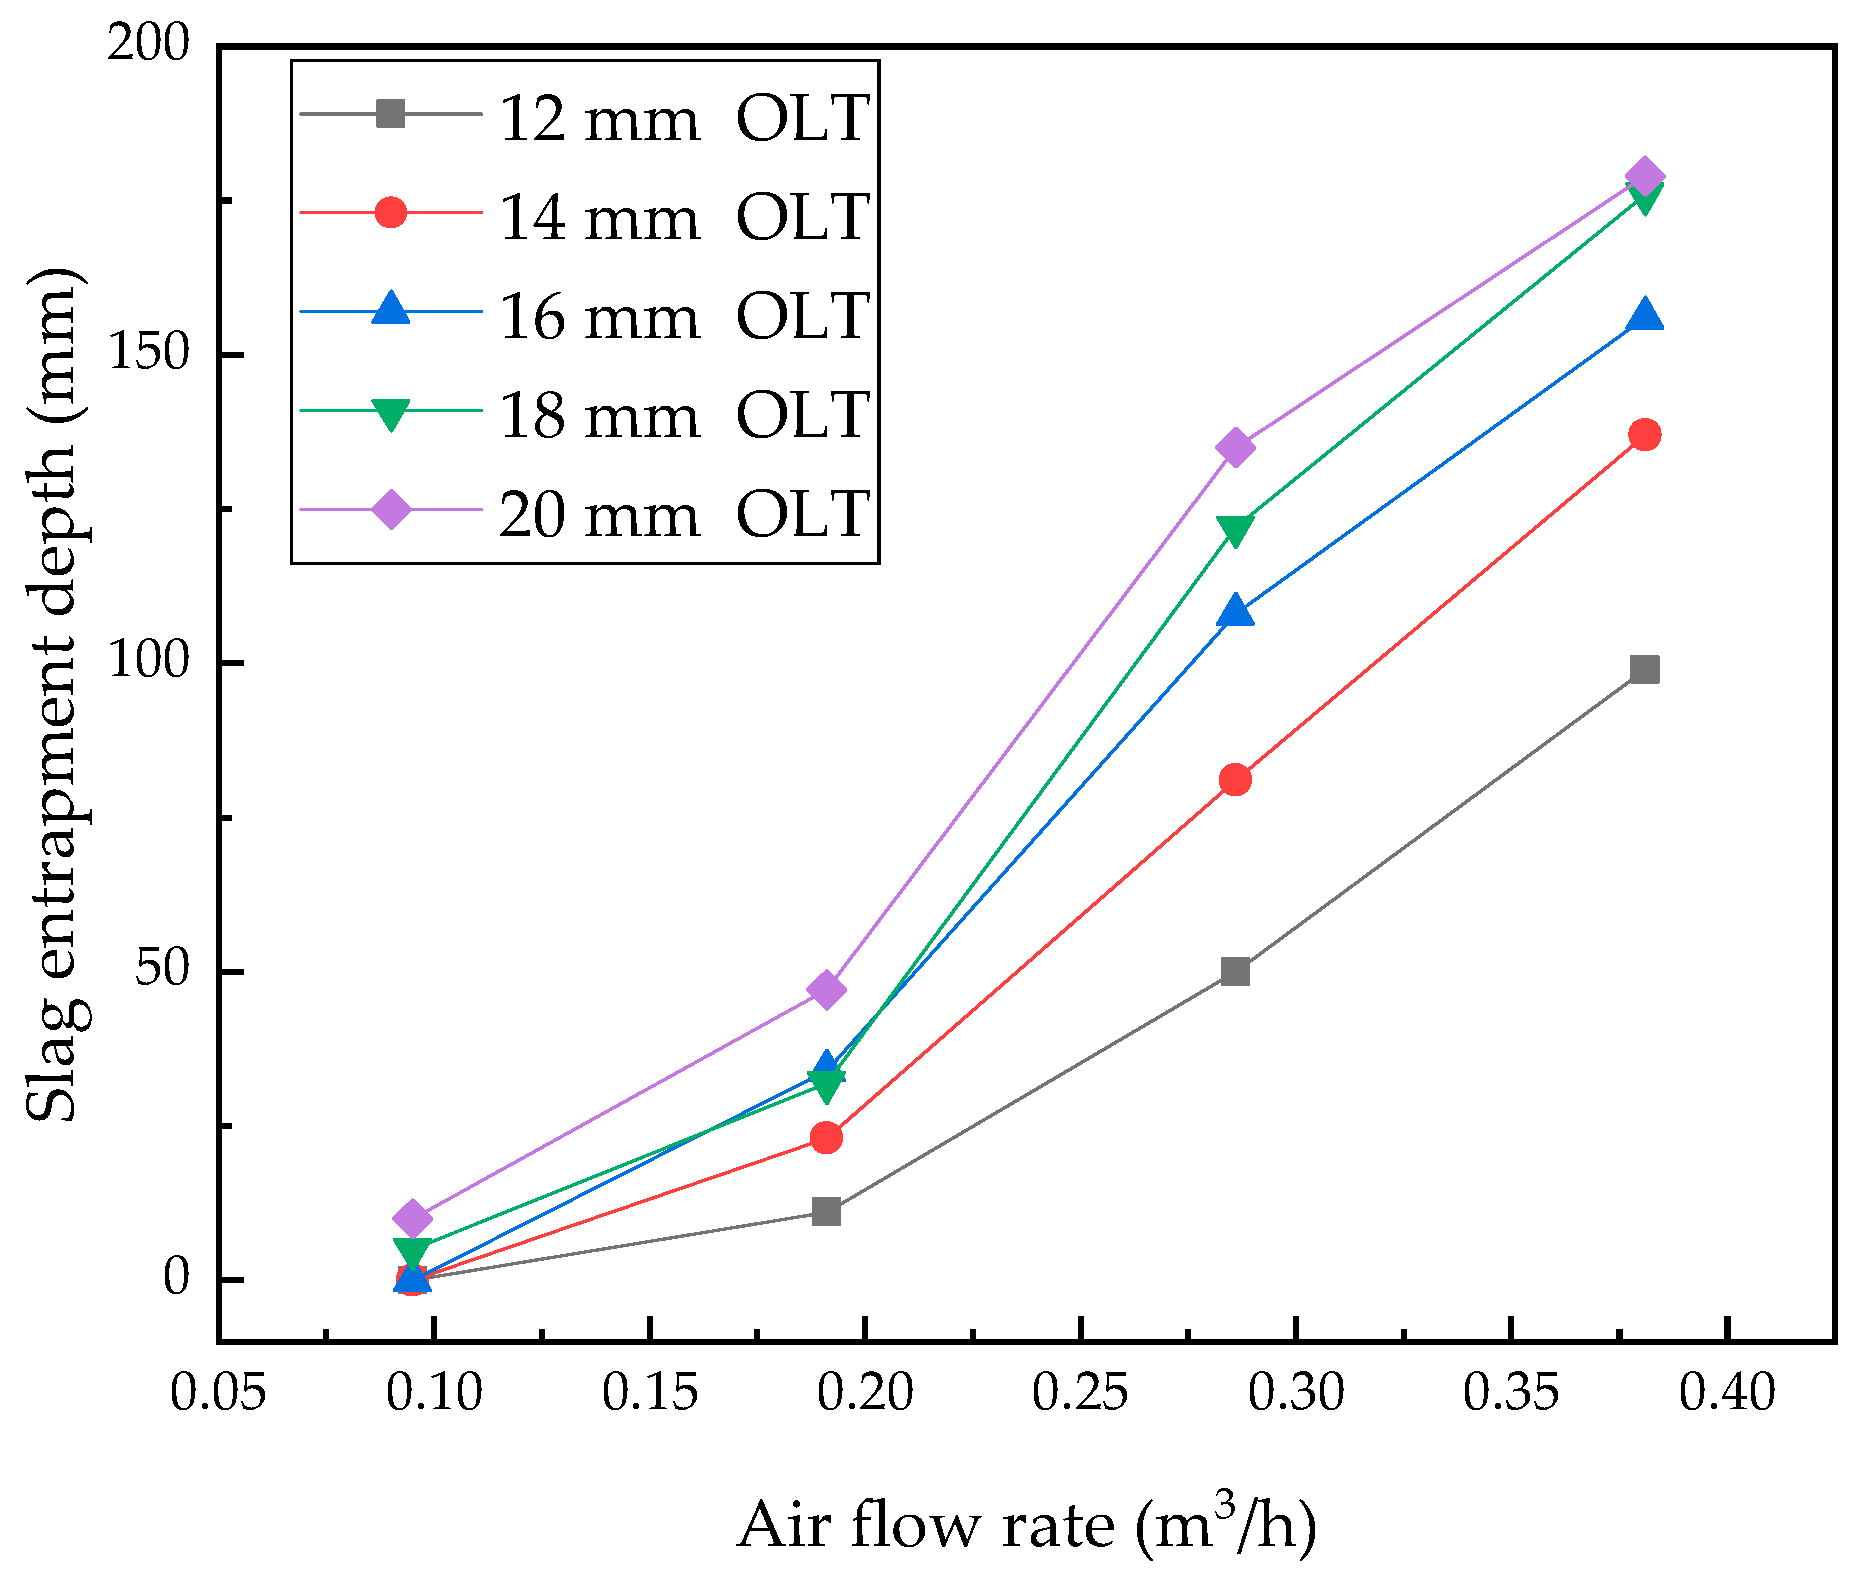
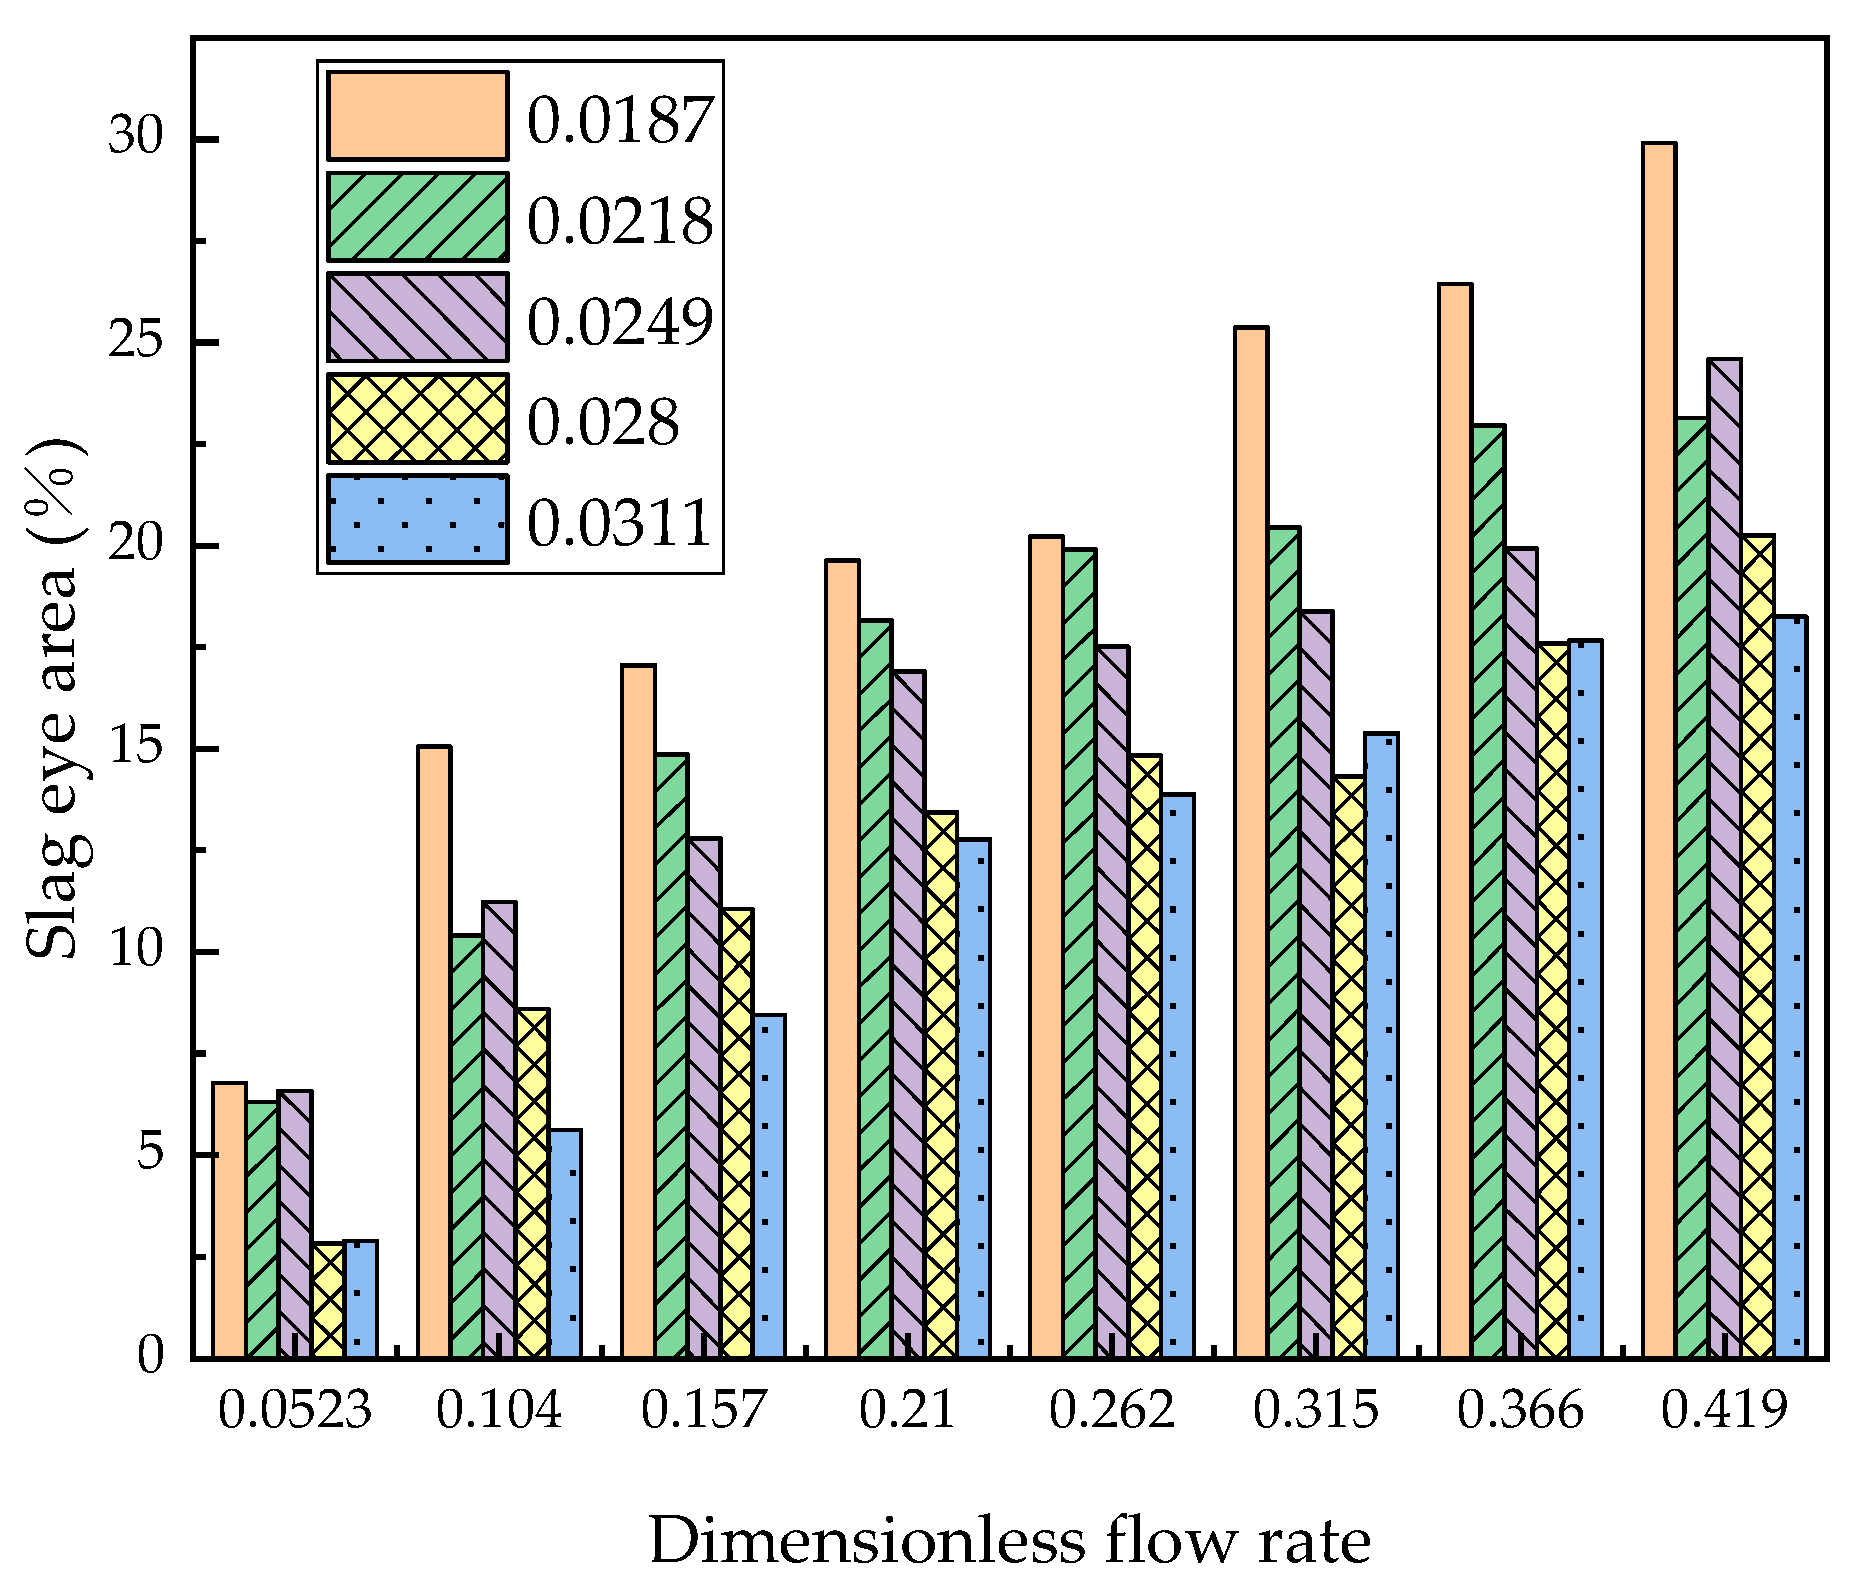
- The entrapped slag depth increases with the argon flow rate and slag thickness; the area of slag eyes increases with the argon flow rate and decreases with slag thickness.
- (4)
- Considering the mixing time and slag entrainment, the optimized injection mode for the prototype ladle is a double porous plug with a flow rate of 36–42 m3/h.
Author Contributions
Funding
Acknowledgments
Conflicts of Interest
References
- Zhu, M.Y.; Lou, W.T.; Wang, W.L. Research Progress of Numerical Simulation in Steelmaking and Continuous Casting Processes. Acta Metall. Sin. 2018, 54, 131–150. [Google Scholar]
- Parra, F.D.M.; Argáez, M.A.R.; Conejo, A.N.; Gonzalez, C. Effect of Both Radial Position and Number of Porous Plugs on Chemical and Thermal Mixing in an Industrial Ladle Involving Two Phase Flow. ISIJ Int. 2011, 51, 1110–1118. [Google Scholar] [CrossRef] [Green Version]
- Villeda, A.M.A.; Argáez, M.A.R.; Conejo, A.N. Effect of Slag Properties on Mixing Phenomena in Gas-stirred Ladles by Physical Modeling. ISIJ Int. 2014, 54, 1–8. [Google Scholar] [CrossRef] [Green Version]
- Zheng, W.; Tu, H.; Li, G.Q.; Shen, X.; Xu, Y.L.; Zhu, C.Y.; Lu, K. Physical simulation of refining process optimization for bottom argon blowing in a 250 t ladle. J. Univ. Sci. Technol. Beijing 2011, 36, 53–59. [Google Scholar]
- Liu, Z.Q.; Li, L.M.; Cao, M.X.; Li, B.K. Water model of mixing time and critical flow rate in a gas-stirred ladle. J. Mater. Metall. 2016, 15, 176–180. [Google Scholar]
- Conejo, A.N.; Kitamura, S.; Maruoka, N. Effects of Top Layer, Nozzle Arrangement, and Gas Flow Rate on Mixing Time in Agitated Ladles by Bottom Gas Injection. Metall. Mater. Trans. B 2013, 44, 914–923. [Google Scholar] [CrossRef]
- Li, L.M.; Liu, Z.Q.; Li, B.K.; Matsuura, H.; Tsukihashi, F. Water Model and CFD-PBM Coupled Model of Gas-Liquid-Slag Three-Phase Flow in Ladle Metallurgy. ISIJ Int. 2015, 55, 1337–1346. [Google Scholar] [CrossRef] [Green Version]
- Geng, D.Q.; Lei, H.; He, J.C. Optimization of mixing time in a ladle with dual plugs. Int. J. Miner. Metall. Mater. 2010, 18, 709–714. [Google Scholar] [CrossRef]
- Zhu, M.Y.; Inomoto, T.; Sawada, I.; Hsiao, T.C. Fluid fow and mixing phenomena in the ladle stirred by argon through multi-tuyere. ISIJ Int. 1995, 35, 472–479. [Google Scholar] [CrossRef]
- Van-Khang, N.; Bao, Y.P.; Wang, M.; Lin, L.; Li, X. Flow characteristics of argon bottom blowing in an ellipse ladle. J. Univ. Sci. Technol. Beijing 2014, 36, 1–5. [Google Scholar]
- Liu, H.P.; Qi, Z.Y.; Xu, M.G. Numerical Simulation of Fluid Flow and Interfacial Behavior in Three-phase Argon-Stirred Ladles with One Plug and Dual Plugs. Steel Res. Int. 2011, 82, 440–458. [Google Scholar] [CrossRef]
- Perez, L.E.J.; Amaro-Villeda, A.; Conejo, A.N.; Gonzalez-Rivera, C.; Ramirez-Argáez, M.A. Optimizing gas stirred ladles by physical modeling and PIV measurements. Mater. Manuf. Process. 2017, 33, 1–9. [Google Scholar]
- Amaro-Villeda, A.M.; Bello, G.J.A.; Ramirez-Argáez, M.A. Experimental Study on Mixing in Gas-Stirred Ladles with and without the Slag Phase through a Water Physical Model. MRS Online Proc. Libr. Arch. 2012, 1373. [Google Scholar] [CrossRef]
- Zhao, L.H.; Ma, W.J.; Wang, M. Physical modeling of argon bottom blowing refining in a 100 t ladle. J. Univ. Sci. Technol. Beijing 2014, 36, 140–144. [Google Scholar]
- Chattopadhyay, K.; SenGupta, A.; Ajmani, S.K.; Lenka, S.N.; Singh, V. Optimisation of dual purging location for better mixing in ladle: A water model study. Ironmak. Steelmak. 2009, 36, 537–542. [Google Scholar] [CrossRef]
- Cho, S.H.; Kim, C.W.; Han, J.W.; You, B.D.; Kim, D.S. Effect of Melt Depth and Nozzle Type on the Mixing Behavior in Bottom-Blown Steelmaking Ladle—A Water Model Approach. Mater. Sci. Forum 2006, 510–511, 494–497. [Google Scholar] [CrossRef]
- Zhan, Z.H.; Li, Q.C.; Yin, S.B.; Zhang, B.Q. Physical simulation of mixing time and critical flow rate of bottom blowing argon in a 135 t LF ladle. Contin. Cast. 2018, 43, 29–33. [Google Scholar]
- Amaro-Villeda, A.M.; Conejo, A.; Ramirez-Argáez, M.A. Effect of Slag on Mixing Time in Gas-Stirred Ladles Assisted with a Physical Model. MRS Online Proc. Libr. 2012, 1485, 101–106. [Google Scholar] [CrossRef]
- Cho, S.H.; Hong, S.H.; Han, J.W.; You, B.D. Effect of Slag Layer on Flow Patterns in a Gas Stirred Ladle. Mater. Sci. Forum 2006, 510–511, 490–493. [Google Scholar] [CrossRef]
- Patil, S.; Kumar, D.S.; Peranandhanathan, M.; Mazumdar, D. Mixing Models for Slag Covered, Argon Stirred Ladles. ISIJ Int. 2010, 50, 1117–1124. [Google Scholar] [CrossRef] [Green Version]
- Ramasetti, E.K.; Visuri, V.V.; Sulasalmi, P.; Mattila, R.; Fabritius, T. Modeling of the Effect of the Gas Flow Rate on the Fluid Flow and Open-Eye Formation in a Water Model of a Steelmaking Ladle. Steel Res. Int. 2019, 90. [Google Scholar] [CrossRef]
- Ramírez-Argáez, M.A.; Dutta, A.; Amaro-Villeda, A.; González-Rivera, C.; Conejo, A.N. A Novel Multiphase Methodology Simulating Three Phase Flows in a Steel Ladle. Processes 2019, 7, 175. [Google Scholar] [CrossRef]
- Gou, D.Z.; Wang, W.X.; Geng, D.Q.; Lei, H. Bubble Coalescence/Breakage and Movement in the Ladle with Argon Blowing. J. Northeast. Univ. Nat. Sci. 2018, 39, 195–199. [Google Scholar]
- Pan, S.M.; Chiang, J.D.; Hwang, W.S. Simulation of Large Bubble/Molten Steel Interaction for Gas-Injected Ladle. J. Mater. Eng. Perform. 1999, 8, 236–244. [Google Scholar] [CrossRef]
- Jardón-Pérez, L.E.; González-Morales, D.R.; Trápaga, G.; González-Rivera, C.; Ramírez-Argáez, M.A. Effect of Differentiated Injection Ratio, Gas Flow Rate, and Slag Thickness on Mixing Time and Open Eye Area in Gas-Stirred Ladle Assisted by Physical Modeling. Metals 2019, 9. [Google Scholar] [CrossRef]
- Xiao, X.G.; Xie, Y.G. Yejin Fanying Gongchengxue Congshu, 1st ed.; Metallurgical Industry Press: Beijing, China, 1997; p. 40. [Google Scholar]


| Parameters | Prototype | Water Model |
|---|---|---|
| Top diameter of ladle/mm | 3034 | 606.8 |
| Bottom diameter of ladle/mm | 3000 | 600 |
| Ladle height/mm | 3950 | 790 |
| Blowing mode | Bottom blowing through porous plug | Bottom blowing through porous plug |
| Bottom blowing gas | Argon | Air |
| The density of blowing gas/kg/m3 | 1.78 | 1.29 |
| The density of liquid/kg/m3 | 7020 | 1000 |
| The temperature of liquid/K | 1853 | 293 |
| The flow rate in prototype/m3/h | 12 | 18 | 24 | 30 | 36 | 42 | 48 |
| The flow rate in water model/m3/h | 0.095 | 0.143 | 0.191 | 0.238 | 0.286 | 0.333 | 0.381 |
| Item | 1 | 2 | 3 | 4 | 5 |
| Oil layer thickness/mm | 12 | 14 | 16 | 18 | 20 |
| Bottom Gas Flow Rate, m3/h | Area (%) of Slag Eye to Top Area of Water Model | ||||
|---|---|---|---|---|---|
| 12 mm OLT | 14 mm OLT | 16 mm OLT | 18 mm OLT | 20 mm OLT | |
| 0.0475 | 6.79 | 6.30 | 6.58 | 2.83 | 2.88 |
| 0.095 | 15.06 | 10.40 | 11.24 | 8.60 | 5.62 |
| 0.143 | 17.05 | 14.87 | 12.80 | 11.06 | 8.46 |
| 0.191 | 19.63 | 18.16 | 16.92 | 13.43 | 12.77 |
| 0.238 | 20.22 | 19.90 | 17.51 | 14.84 | 13.87 |
| 0.286 | 25.37 | 20.46 | 18.39 | 14.32 | 15.38 |
| 0.333 | 26.44 | 22.96 | 19.92 | 17.60 | 17.67 |
| 0.381 | 29.91 | 23.14 | 24.60 | 20.25 | 18.26 |
| Bottom Gas Flow Rate, m3/h | Area (%) of Slag Eye to Top Area of Water Model | ||||
|---|---|---|---|---|---|
| 12 mm OLT | 14 mm OLT | 16 mm OLT | 18 mm OLT | 20 mm OLT | |
| 0.095 | 13.38 | 11.55 | 9.27 | 7.73 | 4.67 |
| 0.191 | 20.22 | 17.95 | 18.07 | 13.75 | 10.11 |
| 0.286 | 26.97 | 20.67 | 23.21 | 19.98 | 12.59 |
| 0.381 | 30.95 | 26.28 | 28.22 | 20.37 | 15.67 |
© 2019 by the authors. Licensee MDPI, Basel, Switzerland. This article is an open access article distributed under the terms and conditions of the Creative Commons Attribution (CC BY) license (http://creativecommons.org/licenses/by/4.0/).
Share and Cite
Yang, F.; Jin, Y.; Zhu, C.; Dong, X.; Lin, P.; Cheng, C.; Li, Y.; Sun, L.; Pan, J.; Cai, Q. Physical Simulation of Molten Steel Homogenization and Slag Entrapment in Argon Blown Ladle. Processes 2019, 7, 479. https://doi.org/10.3390/pr7080479
Yang F, Jin Y, Zhu C, Dong X, Lin P, Cheng C, Li Y, Sun L, Pan J, Cai Q. Physical Simulation of Molten Steel Homogenization and Slag Entrapment in Argon Blown Ladle. Processes. 2019; 7(8):479. https://doi.org/10.3390/pr7080479
Chicago/Turabian StyleYang, Fu, Yan Jin, Chengyi Zhu, Xiaosen Dong, Peng Lin, Changgui Cheng, Yang Li, Lin Sun, Jianhui Pan, and Qiang Cai. 2019. "Physical Simulation of Molten Steel Homogenization and Slag Entrapment in Argon Blown Ladle" Processes 7, no. 8: 479. https://doi.org/10.3390/pr7080479