
Selection and Optimization Mechanism of the Lower Return Roadway Layout in the near Residual Coal Pillar Area

1
School of Energy and Mining Engineering, China University of Mining and Technology (Beijing), Beijing 100083, China
2
State Key Laboratory of Water Resources and Hydropower Engineering Science, Wuhan University, Wuhan 430072, China
3
Transportation College, Jilin University, Changchun 130000, China
4
School of Management, Dalian Polytechnic University, Dalian 116034, China
*
Author to whom correspondence should be addressed.
Processes 2022, 10(12), 2471; https://doi.org/10.3390/pr10122471
Submission received: 31 October 2022
/
Revised: 10 November 2022
/
Accepted: 17 November 2022
/
Published: 22 November 2022
(This article belongs to the Special Issue Process Safety in Coal Mining)
Abstract
:Background: To optimize the layout position of the residual coal pillar return roadway when mining a close coal seam group and to clarify the optimization mechanism, a roadway optimization layout analysis was conducted on the Tashan coal mine. Methods: Surface displacement monitoring was conducted using field tests, and the main stress magnitude, plastic zone morphology, deformation variables, and connectivity between the plastic zone of the roadway and the plastic zone of the residual coal pillar were analyzed at different locations with the help of FLAC3D numerical simulation software. Results: It was found that, in the process of close coal seam group mining, the residual coal pillar of the overlying coal seam seriously affects the stress state and plastic zone distribution of the lower coal seam roadway. The roadway is arranged in a position that is relatively far away from the residual coal pillar, which could reduce the stress influence of the residual coal pillar on the roadway and guarantee the stability of the roadway. Conclusion: Since the Tashan Mine uses the top release method for mining, the stability of the roadway can be better ensured by placing the roadway in the middle and lower regions of the coal seam and using the layout method to retain small coal pillars.
1. Introduction
The distribution of coal seam clusters in close proximity to one another is a major characteristic of coal distribution in China. Mining a proximity coal seam group is different from single-seam mining, and it is influenced by the adjacent seam, which can lead to mine pressure and potentially disastrous accidents [1,2,3,4,5]. Mining an upper coal seam of a proximity coal seam group can not only trigger the loosening of the roof of the lower coal seam but also affect the stress state of the surrounding rocks of the lower coal seam roadway, causing roadway deformation damage [6,7,8].
The coal seam under original rock stress is redistributed after the excavation of the roadway, and once the mining disturbance triggers the local stress concentration in the roadway, it can lead to the occurrence of roadway disasters [9,10]. In order to determine the causes of roadway hazards and reduce the possibility of roadway hazards, some scholars have proposed theoretical approaches for stabilizing surrounding rocks. The classical circular plastic zone determines the range of the plastic zone of the roadway enveloped by rock, which is considered to be a circular area [11,12,13]. The theory of natural caving supplies states that under the action of mine pressure, the roof of the roadway’s surrounding rock will appear loose, causing deformation, damage, and bubble falls. The roof of the roadway forms an arch of support after the roof pressure balances out, and the roof surrounding the rock no longer causes bubble falls [14]. The theory of axial variations considers that the damage law of the surrounding rock is the result of the joint influence of the surrounding rock stress and the mechanical properties of the rock mass, as well as the deformation characteristics of the surrounding rock [15,16]. The theory of maximum horizontal stress [17] comprises the analysis of the damage characteristics of rocks and the evolution law of pores and fissures inside the rocks from structural defects inside the rocks, which play a significant role in supporting the rock surrounding the roadway [18,19,20,21]. Małkowski et al. conducted a long-term study of three different roadways over a period of six years and found that different support schemes can have significant effects on roof deformations [22]. Khalymendyk et al. analyzed the deformation mechanisms of deep laminated rock roadways and determined that the deformation of the roadway rock was a result of the mutual extrusion of the laminated surrounding rocks, as well as the linear relationship of the deformation and damage between the top and bottom slabs [23]; these observations have been verified by other research studies in the field.
Usually, the excavated coal seam is a non-uniform stress field, and the presence of the non-uniform stress field also has an impact on the distribution of the plastic zone [24]. Fenner’s formula and Castanet’s formula can determine the radius of the plastic zone around the circular hole under hydrostatic pressure conditions [25] to solve the asymmetric damage phenomenon generated by the roadway in the actual production process. Ma et al. proposed a model for the distribution of the plastic zone of the roadway under a non-uniform stress field. They established the roadway butterfly damage theory and derived the boundary equation of the plastic zone of the roadway butterfly [26,27,28,29,30]. Based on this formula, Guo et al. [31] predicted potential hazard zones in circular roadways and proposed evaluation guidelines for dynamic hazard critical points in circular roadways. Reducing the difficulties of roadway support is a key concern for roadways. In order to optimize the design of the transportation roadway in the Beskempir field, Abdrakhman et al. used numerical simulations to analyze the stress characteristics and deformation patterns of the surrounding transportation roadway’s rock, and the stability of the surrounding rock was discussed to determine a support scheme for the transportation roadway [32]. Gan et al. [33], Yang et al. [34], and Li et al. [35], as well as a large number of other scholars, analyzed the state of the roadway and used experiments and numerical simulations to demonstrate a reasonable arrangement form for the roadway, which reduces the difficulty of implementing roadway supports.
The lower back mining roadway’s close residual coal pillar areas easily triggers the occurrence of roadway disasters due to the complex surrounding rock stress. In this paper, we measured the short-term deformation variables of the return roadway of the 30503 working faces in Tashan coal mine by using the method of roadway surface displacement monitoring, and the measurement results showed that the original roadway arrangement would lead to substantial deformations over a short period of time. By determining the asymmetrical damage inflicted upon the roadway, we established a numerical model for the multi-point arrangement of the lower return roadway in the close residual coal pillar area and simulated the main stress magnitude, plastic zone morphology, and deformation variables of the roadway in the horizontal and vertical directions, respectively. The connectivity between the plastic zone and the plastic zone of the residual coal pillar was analyzed at different positions on the roadway, and the mechanical characteristics and deformation features of the roadway at different positions were determined. Based on the coal mining process of the 30503 working face of the Tashan mine, it was established that the roadway should be arranged in the middle and lower positions of the coal seam as a method for retaining small coal pillars (away from the residual coal pillars), which could ensure the stability of the roadway. This provides the theoretical basis for the reasonable arrangement of the lower return roadway of the residual coal pillars in the mining process of the close coal seam group.
2. Materials and Methods
2.1. Engineering Background
The Tashan coal mine is located in the middle and east edge of Datong coalfield, China. The main coal seam comprises 3–5# coal, with an average thickness of 18.0 m. The coal is recovered by releasing the top coal. The upper coal seam is 2# coal; in order to ensure safe production operations, after mining 2# coal, the 2# coal emptying area is filled. According to the mining succession plan, the 30503 working face is the successive mining face. The spatial positions of the 3–5# coal seam and 2# coal seam and the original layout plan of the tunnel are shown in Figure 1; as we are ignoring the influence of other factors, the diagram only depicts the 30503 working face return roadway. After the roadway was excavated at 860 m in depth, serious deformations occurred in the roadway’s roof, and the local area had to be completely closed; thus, the 30503 return roadway was repaired, but during the repair process, the roadway experienced continuous deformations, and there was a local large deformation. To analyze the degree of damage, surface displacement observations were made on the roof of the 30503 return roadway, and the degree of damage was analyzed visually in the form of data.
2.2. Field Tests
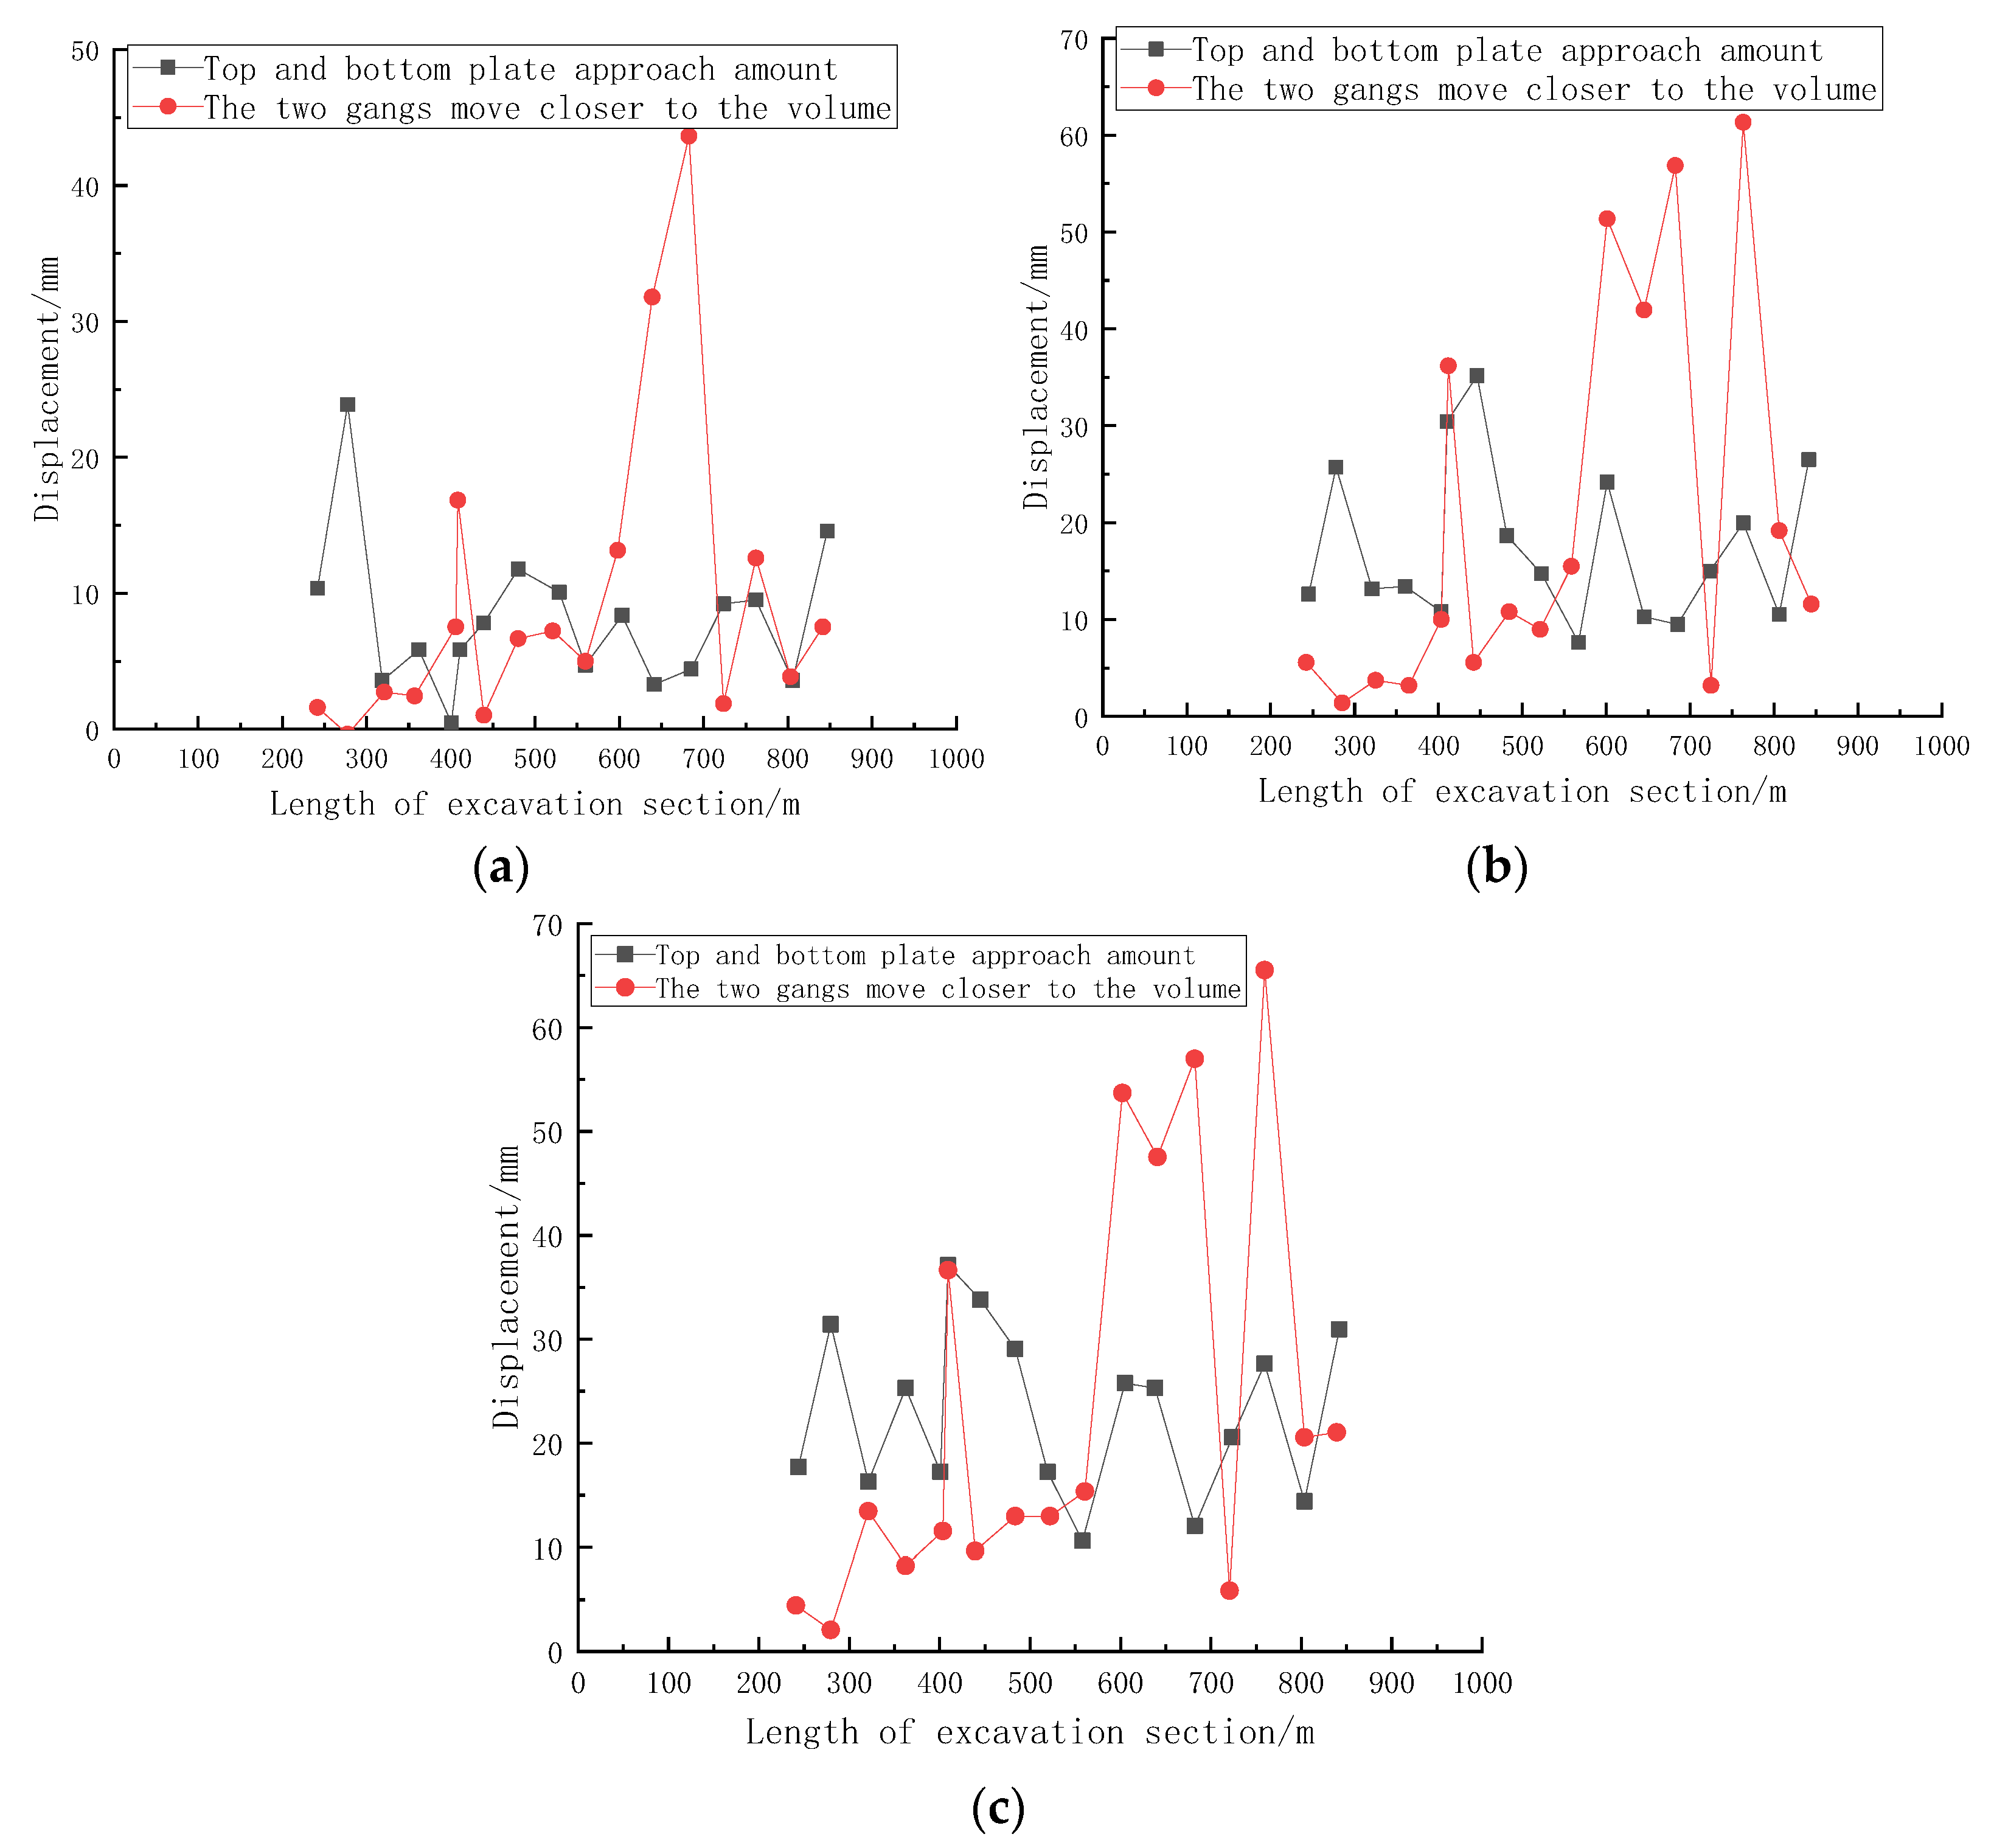
In order to study the deformation degree of the roadway enclosure, the 30503 return roadway repair, at the section at about 240 m~840 m, was selected, and the roadway surface displacement observation points were laid out within this area. One observation point was arranged every 40 m, with a total of 16 observation points, numbered 1~16. Short-term observations were carried out for 10 days, and the observation data of the 3rd, 7th, and 10th days were taken. Based on the data of the first measurement, roadway deformations at different mileages were calculated for each measurement, and the measured data are shown in Figure 2.
According to Figure 2a, it can be seen that, on the 3rd day of the test, the maximum value of top plate displacement is located at 280 m of the dug-in section, which is 24 mm, and the maximum value of the two gang displacements is located at 680 m of the dug-in section, which is 4 mm. According to Figure 2b, it can be seen that on the 7th day of the test that the repaired section of the roadway showed extensive deformations; here, the maximum value of top plate displacement is located at 440 m of the dug-in section, which is 34 mm. The maximum amount of top plate displacements is located at 440 m of the excavated section, reaching 34 mm, and the top plate displacement increased by 3 mm compared with the measured value at 280 m of the excavated section on the third day and by 35 mm compared with the measured value at the same point on the third day; the maximum amount of the displacement of both gangs is located at 680 m of the excavated section, reaching 61.5 mm, and the displacement of both gangs increased by 9 mm compared with the measured value at 680 m of the excavated section on the third day and by 49.5 mm compared with the measured value at the same point on the third day. After 4 days, significant deformations occurred at the same measurement point. According to Figure 2c, it can be observed that on the 10th day of the test, the deformation phenomenon of the repaired section of roadway still existed and spread, among which the maximum amount of top plate displacement was located at 400 m of the dug-in section, reaching 35 mm; this is an increase of 5 mm compared with the measured value at the same point on the 7th day. The maximum amount of two gang displacement was located at 760 m of the dug-in section, reaching 66 mm, an increase of 4.5 mm compared with the measured value at the same point on the 7th day. Although the periodic deformation at the same measurement point is less than the amount of displacement in 3–7 days, there is still deformation and a growing trend.
In summary, within 10 days, the 30503 return roadway repair section had top plate sinkage changes within the range of 3~35 mm. The two gangs moved closer at a range of 0~66 mm, and the displacement of the two gangs is significantly larger than the top plate’s displacement. The same measurement point, the two gangs’ displacement, and the top plate’s displacement also have obvious differences. The roadway exhibited obvious non-uniform damage phenomena. To control the deformation and damage of the roadway and avoid accidents, the following is an analysis of the extent of damage to the plastic zone and the degree of deformation of the surrounding rock under different arrangements of the roadway from both vertical and horizontal directions. The distribution rules of stress and the plastic zone in the surrounding rock of the 30503 roadway along the top slab, along the bottom slab, along the top left and bottom coal slab, differently sized coal pillars, and the area located directly below the residual coal pillars are analyzed. Based on the above analysis, reasonable arrangements and the arrangement principles of the residual coal pillar’s lower return roadway are determined. The diagram for different roadway layout schemes is shown in Figure 3, and the dashed line in the figure denotes the limit of coal pillar retentions for different horizontal roadway layout schemes; from right to left, the coal pillars are 4 m, 8 m, 15 m, 20 m, and 25 m.
2.3. Methods
A geometric model was established based on the 30503 return roadway, as shown in Figure 4, and the perspective view is shown in Figure 5. In order to reduce the influence of other factors on the model, the model was constructed with 3–5 coal as the vertical center and based on the coal seam histogram. Nine layers of rock were constructed upward and downward, and the length and width of the model were set to 100 times the width of the roadway and rounded to 500 m; in other words, the model’s size was 500 m × 500 m × 156 m. Moreover, since the burial depth of the top of the model was 348 m, according to the traditional ground stress calculation method, the top of the model was subjected to a vertical stress of 8.7 MPa. The vertical stress of 8.7 MPa was applied to the top of the model, and the numerical simulation was carried out by FLAC3D finite element difference software. Due to the large size of the model, the influence of the roadway and residual coal pillars is negligible, so the front, back, left, and right sides of the model as well as the bottom are fixed with fixed displacement and fixed boundaries, and the Mohr–Coulomb principal structure model is used. In order to improve the accuracy of the calculation, the encryption around 30 m of the roadway is 1 m per frame; at around 15 m, it is 0.5 m per frame, and around 15 m of the coal pillar, it is 1 m per frame. The demonstrated basic mechanical parameters involved in the numerical simulation are shown in Table 1. These data were obtained from the paper “Research on the mining method of close extra-thick coal seam in Datong Tashan coal mine of China National Investment Corporation” [36].
3. Results
3.1. Plastic Zone Morphology and Distribution
3.1.1. Roadways with Vertical Layer Differences
(1) Roadway excavation along the roof
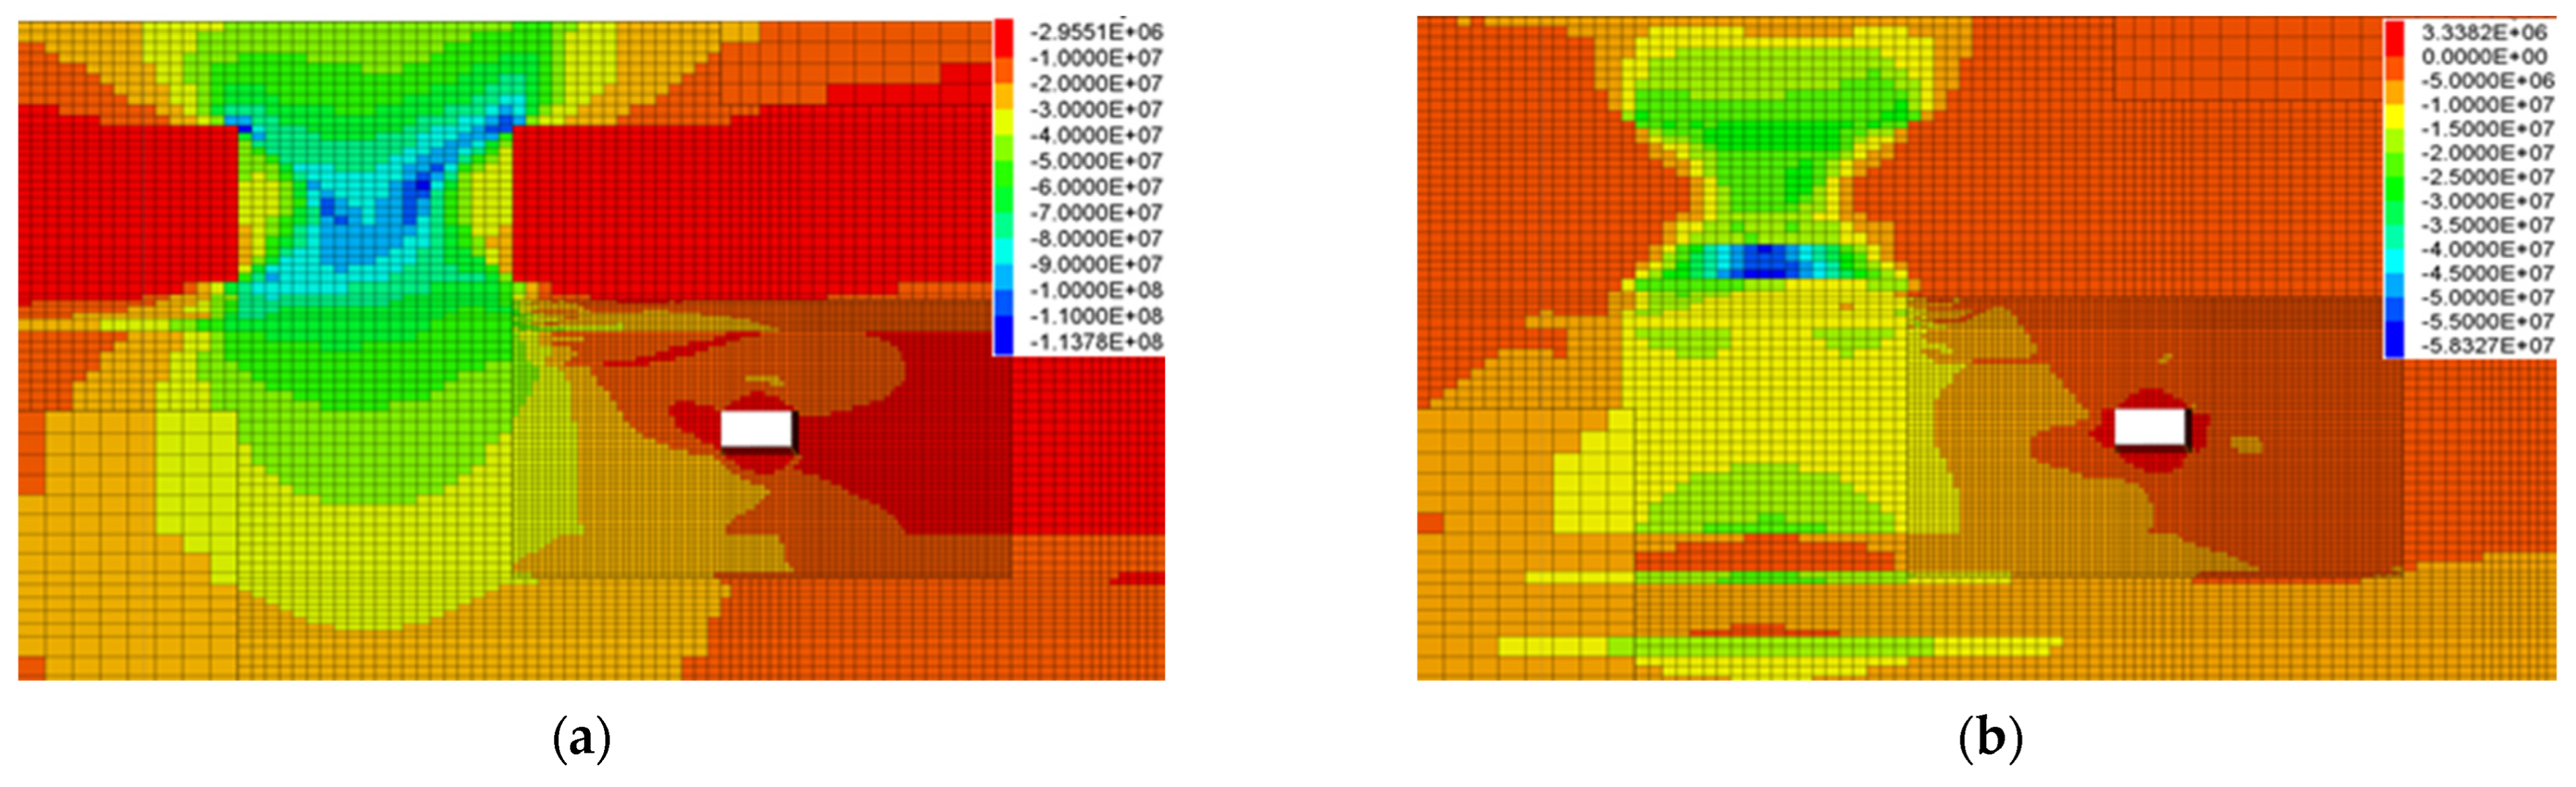
The horizontal distance between the roadway dug along the top and the residual coal column of the overlying coal seam is 15.2 m, and the vertical distance is about 4.4 m. From the stress cloud diagram (Figure 6), the maximum and minimum principal stresses appear at the residual coal pillar, and the maximum principal stress (σ1) near the coal pillar is about 70–120 MPa; the minimum principal stress (σ3) is about 26–50 MPa. σ1 around the roadway is about 6–20 MPa, and σ3 is about 3–10 MPa.
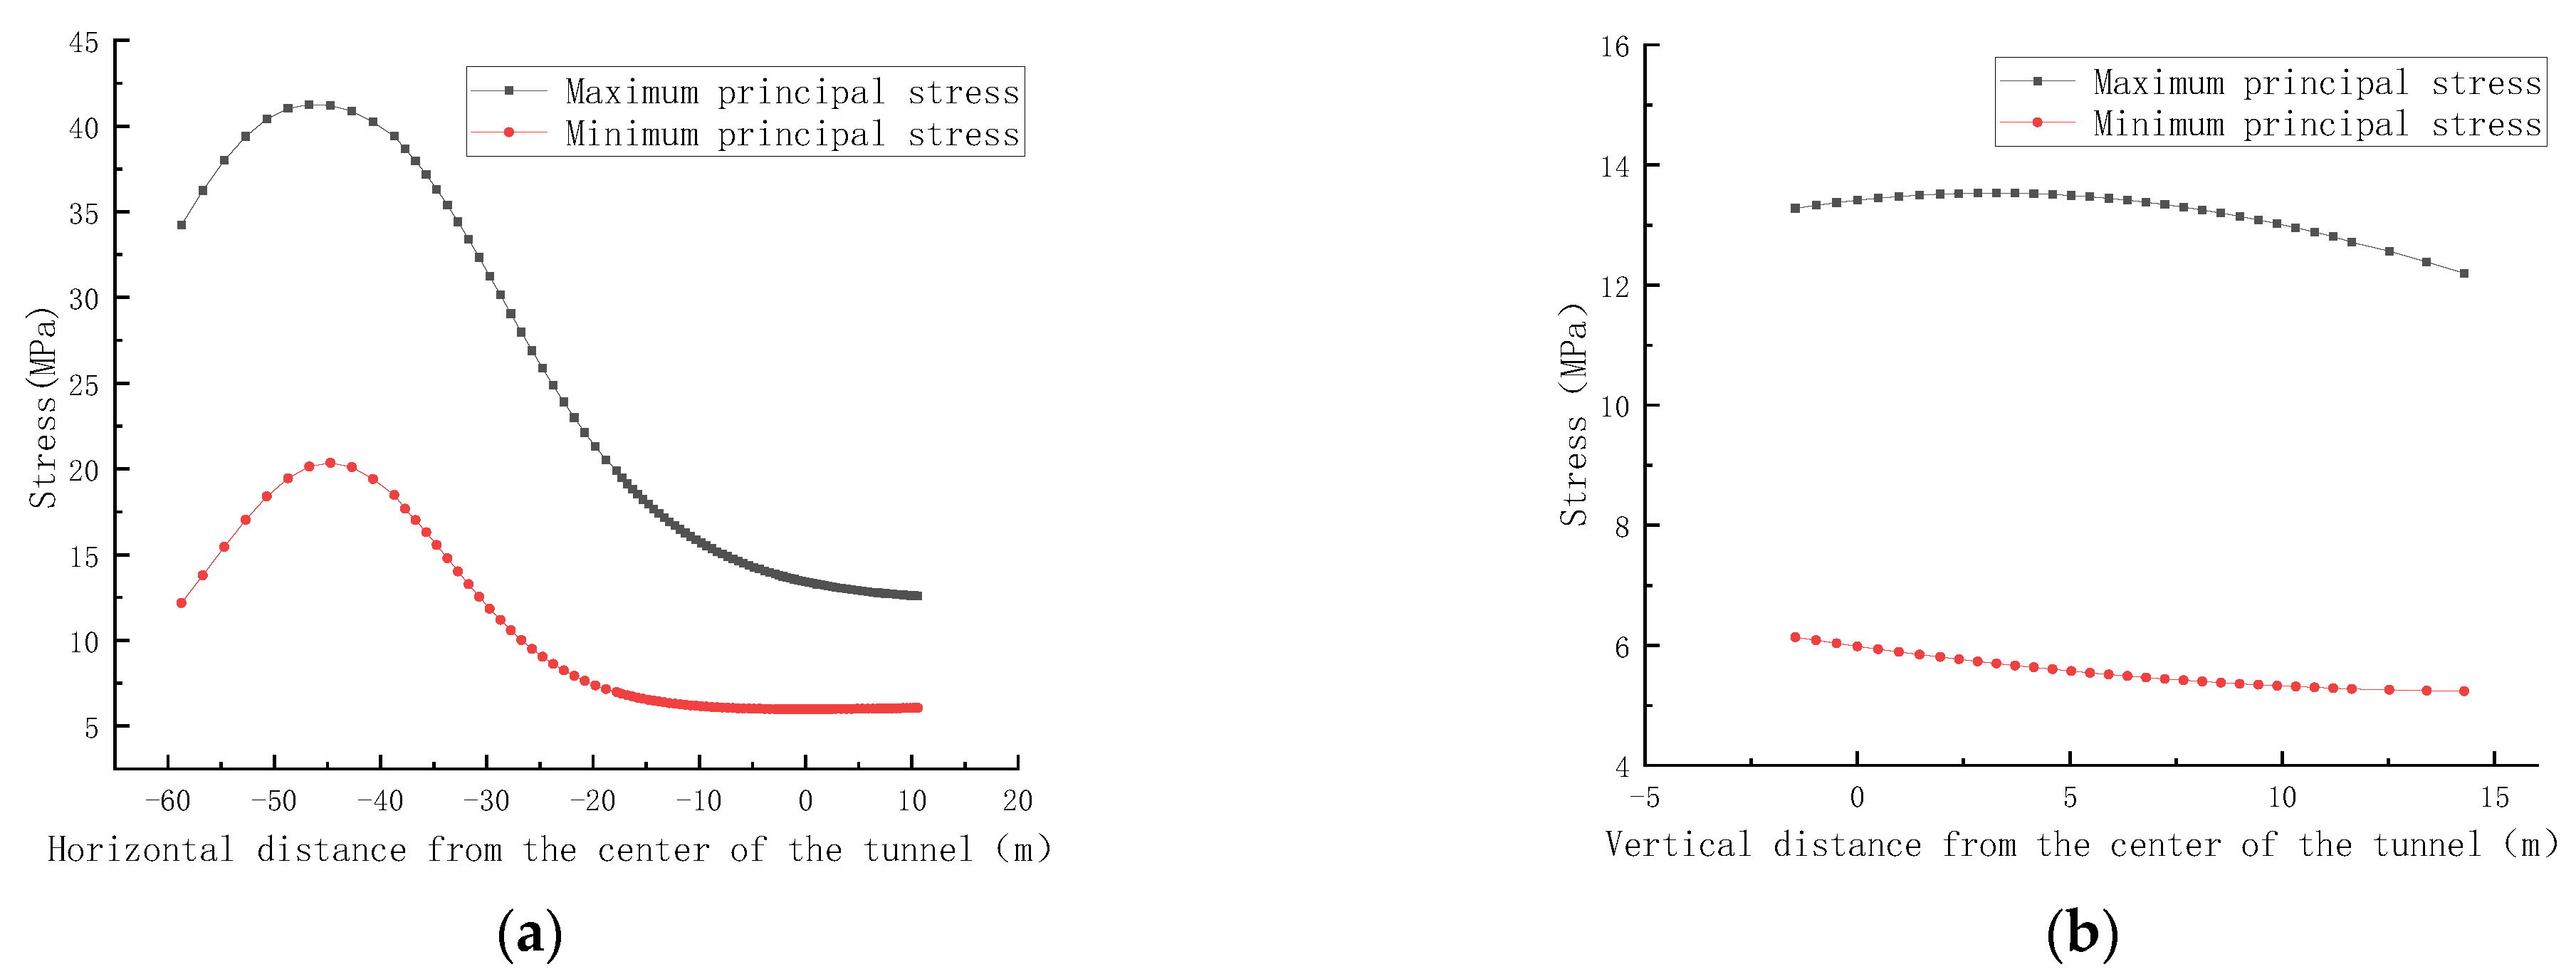
To further analyze changes in the surrounding rock stress in the vertical direction and horizontal direction of the roadway when digging along the top, the measurement lines were arranged in the vertical direction and horizontal direction of the roadway center, respectively, and the main stress change curve was obtained (Figure 7). In the horizontal direction, σ1 and σ3 in the surrounding rock gradually decrease from the positive gang to the negative gang of the roadway. At approximately −30 m away from the positive gang of the roadway, σ1 and σ3 in the surrounding rocks reach the peak values of 67 MPa and 15 MPa, respectively, and the site is located below the residual coal pillar. Meanwhile, the ratio of σ1 and σ3 in the surrounding rocks can be found from in positive gang to the negative gang of the roadway. The ratios of σ1 and σ3 in the surrounding rocks gradually decrease from the positive to the negative gang of the roadway. From the vertical direction, σ1 and σ3 at the location of the roadway are small, while the principal stresses below the roadway are large, and the principal stresses at the location of the coal seam floor reach the peak; the ratio between σ1 and σ3 reaches the maximum at this moment. σ1 and σ3 at the roadway are about 9.5 MPa and 4.5 MPa, respectively.
Figure 8 shows the cloud map of the plastic zone. In the figure, the range of different color areas represents the range of the plastic zone. Each color distribution indicates the damage form at the location, including shear damage, tension damage, and volume damage. “n” in the figure represents the current state, and “p” represents the previously existing state. As observed in the figure, the plastic zone of the roadway presents an asymmetric distribution pattern, and the plastic zone of the positive gang of the roadway is larger in scope due to the superposition and concentration of stress at the residual coal pillar, which is connected with the plastic zone of the residual coal pillar. As the roadway is excavated along the top, the top plate of the roadway comprises rock, and the strength of the coal seam is smaller than the strength of rock, so the range of plastic zone of the top plate of the roadway is smaller than the two gangs and the bottom plate.
(2) Roadway excavation leaves top coal bottom coal
The horizontal distance between the roadway dug by the retained top coal and bottom coal and the residual coal column of the overlying coal seam is 15.2 m, and the vertical distance is about 15.4 m. According to the stress cloud diagram (Figure 9), σ1 and σ3 appear in the residual coal column of the overlying coal seam, σ1 near the residual coal column of the overlying coal seam is about 60–110 MPa, and σ3 is about 25–58 MPa. σ1 around the roadway is about 8–16 MPa, and σ3 is about 0.3–5 MPa.
As observed in the main stress change curve (Figure 10), in the horizontal direction, the maximum main stress and the minimum main stress increase and then decrease from the residual coal pillar relative to the direction of the roadway. The peak stress appears at the residual coal pillar; the further the location from the residual coal pillar, the smaller the stress value and the smaller the stress ratio. From the upper and lower levels, the further away from the bottom plate, the smaller σ1 and σ3 are, and the stress ratio also decreases. Due to the influence of the residual coal pillar, the σ1 value decreases at the location of where the roadway’s layout increases, and σ1 at the location of the roadway roof reaches the lowest point of the stage, and then, the maximum principal stress continues the decreasing trend after a slight increase is inflicted by the influence of the residual coal column of the upper coal seam. The maximum principal stress and the minimum principal stress at the center position of the roadway are about 16.2 MPa and 6.2 MPa, respectively.
According to the plastic zone distribution cloud map (Figure 11), the plastic zone of the roadway is still asymmetrically distributed. The range is slightly smaller than the range of the roadway when dug along the top, and the plastic zone of the roadway is connected with the plastic zone of the residual coal column. The plastic zone mainly appears at the top and negative gang of the roadway, while the plastic zone at the positive gang and bottom of the roadway is smaller.
(3) Roadway excavation along the floor
The horizontal distance between the roadway dug along the bottom and the residual coal column of the overlying coal seam is 15.2 m, and the vertical distance is about 20.4 m. According to the stress cloud diagram (Figure 12), σ1 and σ3 appear at the residual coal column of the overlying coal seam, and σ1 near the residual coal column is about 70–110 MPa; σ3 is about 25–58 MPa. σ1 around the roadway is about 5–13 MPa, and σ3 is about 0.8–2 MPa.
This can be seen in the main stress variation curve (Figure 13). In the horizontal direction, σ1 and σ3 increase and then decrease from the residual coal pillar to the direction of the roadway, and the peak stress appears at the residual coal pillar. At the location away from residual coal pillars, the smaller the stress value, the smaller the stress ratio. From the vertical direction, at distances further from the bottom plate, σ1 and σ3 experience smaller decreases, and the stress ratio also decreases. σ1 at the roadway is about 18.5 MPa, and σ3 is about 6.5 MPa.
According to the plastic zone’s distribution cloud map (Figure 14), the plastic zone of the roadway is not connected with the plastic zone at the residual coal pillar, and the range of the plastic zone of the roadway obviously reduced the plastic zone. The maximum damage depth is 6 m, and the plastic zone mainly appears at the top plate and positive gang of the roadway.
3.1.2. Roadways with Horizontal Layer Differences
(1) The coal column is 4 m
When the coal pillar is 4 m, the horizontal distance between the roadway and the residual coal pillar is 31.85 m, and the vertical distance is about 18.5 m. According to the stress cloud diagram (Figure 15), σ1 and σ3 appear at the residual coal column of the overlying coal seam, and σ1 near the residual coal column is about 60–115 MPa. σ3 is about 22–60 MPa. σ1 around the roadway is about 5–18 MPa, and σ3 is about 0.4–1 MPa.
This can be seen in the main stress variation curve (Figure 16). In the horizontal direction, σ1 and σ3 increase and then decrease from the residual coal pillar to the direction of the roadway, and the peak stress appears at the residual coal pillar. At a location away from residual coal pillars, the smaller the stress value, the smaller the stress ratio. From the vertical direction, σ1 increases and then decreases as it moves away from the center of the roadway, while σ3 gradually decreases. σ1 at the center of the roadway is about 13.5 MPa, and σ3 is about 6 MPa.
According to the plastic zone distribution cloud map (Figure 17), the maximum damage depth of the roadway plastic zone is 3 m. The range is small and is mainly distributed in the top plate and two gang positions. The bottom side has almost no plastic zone distributions, the roadway plastic zone in an independent state.
(2) The coal column is 8 m
When the coal column is 8 m, the horizontal distance from the residual coal column is 27.85 m and the vertical distance is about 18.5 m. According to the stress cloud diagram (Figure 18), σ1 and σ3 appear at the residual coal column of the overlying coal seam, and σ1 near the residual coal column is about 54–115 MPa; σ3 is about 25–59 MPa. σ1 around the roadway is about 6–18 MPa, and σ3 is about 0.2–4 MPa.
The stress change curve shows (Figure 19) that, along the horizontal direction, the stress peak directly below the residual coal pillar is reached, and after moving away from the residual coal pillar, σ1 and σ3 gradually decrease, and σ1/σ3 gradually decrease. Along the vertical direction, σ1 first increases and then decreases as it moves away from the center of the roadway, while σ3 gradually decreases. σ1 at the center of the roadway is about 14 MPa, and σ3 is about 6 MPa.
According to the plastic zone’s distribution cloud map (Figure 20), the maximum damage depth of the plastic zone of the roadway is 3.5 m, the range is slightly increased than that of the 4 m coal pillar, and the distribution pattern is similar to that of the 4 m coal pillar.
(3) The coal column is 15 m
When the coal column is 15 m, the horizontal distance from the residual coal column is 20.85 m, and the vertical distance is about 18.5 m. According to the stress cloud diagram (Figure 21), σ1 and σ3 appear at the residual coal column of the overlying coal seam, and σ1 near the residual coal column is about 67–113 MPa; σ3 is about 26–59 MPa. σ1 around the roadway is about 5–26 MPa, and σ3 is about 0.6–5 MPa.
The stress change curve shows (Figure 22) that along the horizontal direction, the stress peak directly below the residual coal pillar is reached, and after moving away from the residual coal pillar, σ1 and σ3 gradually decrease, and σ1/σ3 gradually decrease. Along the vertical direction, σ1 first increases and then decreases as it moves away from the center of the roadway, while σ3 gradually decreases. σ1 at the center of the roadway is about 15.6 MPa, and σ3 is about 6 MPa.
According to the plastic zone distribution cloud map (Figure 23), the maximum damage depth of the plastic zone of the roadway is 5.5 m, and the range further increases. The distribution pattern is similar to those above the 4 m and 8 m coal pillars. When the coal pillar’s size is 20 m, this condition is consistent with the situation of the roadway dug along the bottom in the previous subsection, and it will not be repeated here. The maximum depth of damage in the plastic zone of the roadway is 6 m, and the extent of the plastic zone continues to grow.
(4) The coal column is 25 m
When the coal column is 25 m, the horizontal distance from the residual coal column is 10.85 m, and the vertical distance is about 18.5 m. According to the stress cloud diagram (Figure 24), σ1 and σ3 appear at the residual coal column of the overlying coal seam, and σ1 near the residual coal column is about 65–110 MPa; σ3 is about 25–58 MPa. σ1 around the roadway is about 4–25 MPa, and σ3 is about 0.4–6 MPa.
The stress change curve shows (Figure 25) that along the horizontal direction, the stress peak is reached directly below the residual coal pillar, and after moving away from the residual coal pillar, σ1 and σ3 gradually decrease, and σ1/σ3 gradually decreases. Along the vertical direction, σ1 first increases and then decreases as it moves away from the center of the roadway, while σ3 gradually decreases. σ1 at the center of the roadway is about 21 MPa, and σ3 is about 7.5 MPa. σ1 and σ3 are in a constant state of growth.
According to the plastic zone distribution cloud map (Figure 26), the maximum damage depth of the plastic zone of the roadway is 7.5 m, the plastic zone appears with an obvious butterfly shape, and the upper butterfly lobe’s development is obvious and is mainly distributed at the top of the roadway and the positive gang. The lower butterfly lobe’s development is smaller. The upper butterfly lobe points to the direction of the residual coal pillar. The plastic zone of the roadway’s surrounding rock and the plastic zone at the residual coal pillar are not yet connected.
(5) Roadway dug directly below the residual coal pillar
When the roadway is located directly below the residual coal pillar, the vertical distance from the residual coal pillar of the overlying coal seam is about 18.5 m. According to the stress cloud diagram (Figure 27), σ1 and σ3 appear at the residual coal pillar of the overlying coal seam, and σ1 near the overlying residual coal pillar is about 61–104 MPa, and σ3 is about 22–50 MPa. σ1 around the roadway is about 5–24 MPa, and σ3 is about 0.4–7 MPa.
The stress change curve shows (Figure 28) that along the horizontal direction, the stress peak is reached directly below the residual coal pillar, and after moving away from the residual coal pillar, σ1 and σ3 gradually decrease, and σ1/σ3 gradually decreases. Along the vertical direction, as the distance from the center of the roadway increases, σ1 gradually increases, while σ3 gradually decreases. σ1 at the center of the roadway is about 41 MPa, and σ3 is about 20 MPa, at which time both σ1 and σ3 reach their maximum values.
According to the plastic zone’s distribution cloud map (Figure 29), the plastic zone of the roadway is connected with the plastic zone at the residual coal pillar. The plastic zone appears with an obvious butterfly shape, and the butterfly’s lobe development is obvious. the top plate of the roadway and the top angle position of the two helpers have a large ranged plastic zone.
3.2. Deformation Law and Evolution of the Surrounding Rock of the Roadway under Different Positions
Figure 30 shows the cloud map of the deformation of the surrounding rock of the roadway at different locations. According to the cloud map’s data (Figure 31), the deformation curves of the surrounding rock of the roadway at different locations are drawn. When conducting an analysis along the vertical layer, the deformation volume of the roadway dug along the bottom slab is the largest, the deformation of the surrounding rock mainly appears in the positive gang and the top slab of the roadway, and the deformation of the positive gang of the roadway is about 27 mm. The deformation of the top slab is about 28 mm, and the deformation of the negative gang is smaller at about 13 mm. The bottom slab has almost no deformations at about 6 mm. When conducting an analysis along the horizontal layer, the deformation of the surrounding rock mainly occurs at the top plate and the negative gang of the roadway, and the bottom plate also has some deformations. The maximum deformation of the top plate of the roadway is about 140 mm, the deformation of the positive and negative helpers of the roadway is about 130 mm, and the deformation of the bottom plate is about 30 mm.
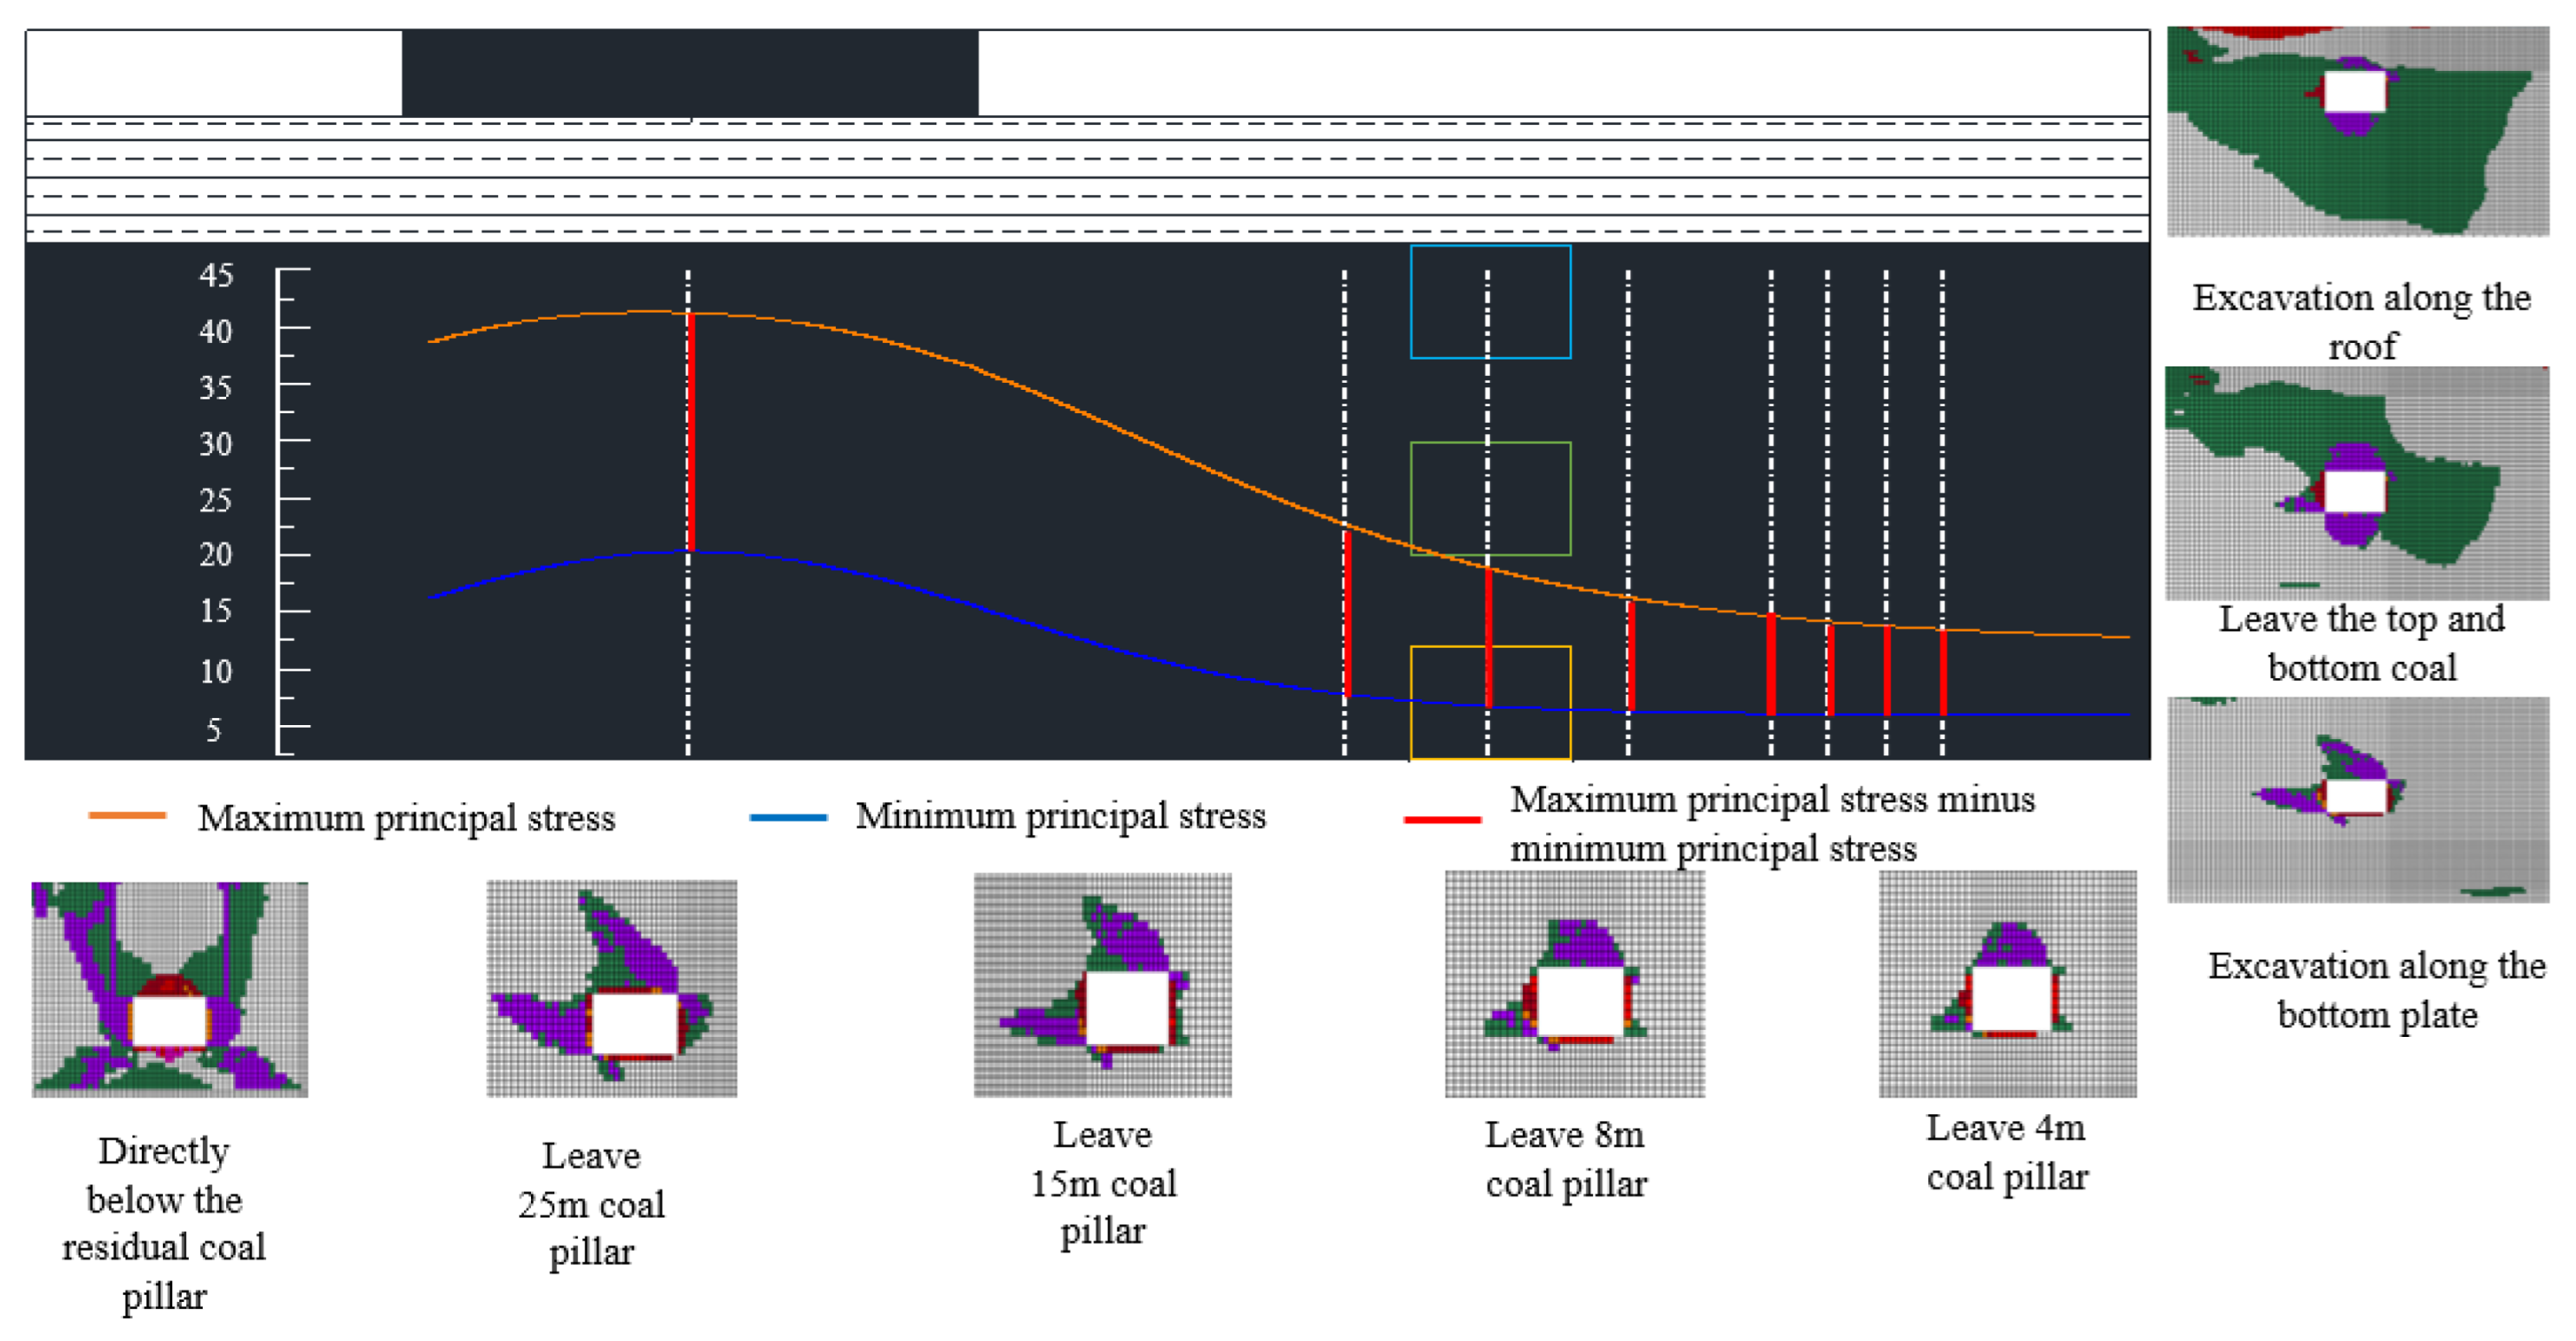
3.3. Analysis of Results
According to Figure 32, when the horizontal distance of the roadway from the residual coal pillar remains unchanged, the deformation of the roadway excavation along the floor is the largest, which is 27 mm, and the deformation mainly occurs in the secondary gang and the top slab. When the roadway is dug along the top and left top bottom coal boring, the plastic zone of the roadway’s surrounding rock is much larger than the range of the plastic zone when the roadway is dug along the bottom, which indicates that the deformation of the surrounding rock is smaller, and the roadway is more stable when the roadway is arranged along the top. However, based on the fact that the mine is mined by the caving mining method, the roadway’s layout should be located in the middle and lower positions of the coal seam.
When the vertical direction of the roadway remains unchanged, the deformation of the roadway and the range of the plastic zone increase with the increase in the size of the left coal pillar. When the roadway is arranged directly below the residual coal pillar, the deformation of the roadway reaches the maximum, the maximum deformation of the top plate of the roadway reaches 140 mm. The deformation of the two helpers also reaches 130 mm, and the plastic zone is connected with the plastic zone of the residual coal pillar. This indicates that this location is most prominently affected by the concentrated stress of the residual coal pillar, and the roadway’s stability is poor. With the comprehensive analysis conducted above, in the process mining a close coal seam group, the stress influence of residual coal column on the roadway is reduced and can effectively improve the stability of the roadway.
4. Discussion
For the analysis of roadway deformation variables, distinct from the long-term displacement monitoring methods used in the past [22], short-term surface displacement monitoring methods were used in this study to analyze roadway deformation variables. Long-term displacement monitoring methods can measure the deformation of the roadway more accurately, and air can be used to analyze the deformation and damage law of the roadway with a large amount of long-term data to obtain more accurate information on the deformation and damage mechanisms of the roadway. However, in the actual production process, when the roadway experiences excessive deformation or even closure, short-term surface displacement monitoring methods can be used to analyze the damage pattern of the roadway. Combined with the geological environments in which the roadway is located, it is clear that in the non-uniform stress field, the roadway exhibits asymmetric damage morphologies.
In order to guarantee the stability of the roadway and to improve the support efficiency, FLAC3D numerical simulation software was used to establish a numerical model for the multi-point roadway arrangement, and the main stress values, the ratio of main stresses, the deformation variables of the roadway, and the connectivity between the roadway and the plastic zone of the residual coal column were analyzed in detail from different directions. In previous studies, the connectivity of the plastic zone was not used as a criterion for measuring the stability of the roadway [32,33,34,35]. However, in the actual production operation, the plastic zone of the residual coal pillar is the damage range of the surrounding rock. If the roadway and the plastic zone of the residual coal pillar appear in a superimposed area, then it will seriously affect the support of the roadway and cannot guarantee the stability of the roadway. In this study, the above factors were analyzed and combined with the mining processes adopted by the coal mine. It is proposed that, in the context of this type of project, the layout of the roadway in the middle and lower positions of the coal seam and the use of small coal pillars can guarantee the stability of the roadway.
5. Conclusions
In this paper, the deformation volume and deformation characteristics of the return airway of 30503 in Tashan mine were analyzed. We conducted short-term surface displacement monitoring by using field testing and determined the existence of the asymmetric damage morphology of the roadway and established a roadway layout optimization model by means of numerical simulations for the actual engineering situation of the working face. We also analyzed the main stress magnitude and the plastic zone morphology of the roadway for eight groups at different positions. The study showed the following.
(1) Via surface displacement observations, it can be seen that the 30503 working face return roadway experienced large deformations within a short period of time, and the two gangs’ displacement is obviously larger than the top plate’s displacement. At the same measurement point position, the two gangs’ displacement and the top plate’s displacement also has obvious differences. The roadway exhibits obvious non-uniform damage phenomena.
(2) The residual coal pillar of the overlying coal seam affects the stress environment of the lower coal seam roadway due to the stress from its own weight. The change in the roadway’s layout position has little effect on the trend of the main stress curve of the lower coal seam, and the peaks of σ1 and σ3 in the horizontal direction appear at the residual coal pillar. σ1 and σ3 and σ1/σ3 are smaller at the position far from the residual coal pillar.
(3) As the coal mine is mined by releasing the top coal, the arrangement of the roadway in the vertical direction should be in the middle and lower positions of the coal seam. Although the distribution of the plastic zone along the bottom of the roadway is small, its roadway’s deformation variable is larger. In order to guarantee the stability of the roadway, the roadway should be arranged in the middle position of the coal seam.
(4) When the coal column left in the lower coal seam’s roadway is 4 m, the maximum deformation of the roadway’s surrounding rock is the smallest. At this time, the roadway is farthest away from the residual coal column of the overlying coal seam and is least affected by its stress; therefore, during the mining process of the coal seam group, the roadway is arranged as a small coal column (far away from the residual coal column), which can effectively improve the stability of the roadway.
Author Contributions
Conceptualization, X.-H.W., H.-H.Z. and R.-Q.G.; methodology, X.-H.W. and Z.W.; software, Z.W. and X.-L.L.; validation, R.-Q.G. and Y.S.; formal analysis, H.-H.Z. and Y.S.; investigation, X.-H.W. and R.-Q.G.; resources, X.-H.W. and Z.W.; data curation, Z.W. and X.-L.L.; writing—original draft preparation, X.-H.W. and R.-Q.G.; writing—review and editing, H.-H.Z. and Y.S.; visualization, X.-L.L. and Y.S.; supervision, Z.W.; project administration, X.-H.W. and Z.W.; funding acquisition, X.-H.W. All authors have read and agreed to the published version of the manuscript.
Funding
This research was funded by the Natural Science Foundation of China (U22A20165), grant number “51574224”, and the Guizhou Province Science and Technology Support Plan Project of China, grant number “Guizhou Province Science and Technology Support Plan Project [2021] General 400”.
Institutional Review Board Statement
Not applicable.
Informed Consent Statement
Not applicable.
Data Availability Statement
The data presented in this study are available upon request from the corresponding author.
Conflicts of Interest
The authors declare no conflict of interest.
References
- Kang, H.P.; Xu, G.; Wang, B.M.; Wu, Y.Z.; Jiang, P.F.; Pan, J.F.; Pang, Y.H. Forty years development and prospects of underground coal mining and strata control technologies in China. J. Min. Strat. Control. Eng. 2019, 1, 013501. [Google Scholar]
- Wang, J. Sustainable coal mining is based on mining ground control. J. Min. Strat. Control. Eng. 2019, 1, 013505. [Google Scholar]
- Su, S.; Du, Y.; Zhu, J. Numerical study on bearing behavior of layered rock mass for deep roadway. J. Min. Strat. Control. Eng. 2020, 2, 013002. [Google Scholar]
- Kang, H. Spatial scale analysis on coalmining and strata control technologies. J. Min. Strat. Control. Eng. 2020, 2, 023538. [Google Scholar]
- Zhang, Z.; Deng, M.; Wang, X.; Yu, W.; Zhang, F.; Dao, V.D. Field and numerical investigations on the lower coal seam entry failure analysis under the remnant pillar. Eng. Fail. Anal. 2020, 115, 104638. [Google Scholar] [CrossRef]
- Eberhardt, E. The hoek-brown failure criterion. Rock Mech. Rock Eng. 2012, 45, 981–988. [Google Scholar] [CrossRef] [Green Version]
- Zhang, Y.; Zhang, C.L.; Wei, C.C.; Liu, Y.D.; Zhang, S.Q.; Zhao, J.J. The study on roadway layout in coordination of mining coal seams base on failure of floor strata. Adv. Mater. Res. 2014, 889, 1362–1374. [Google Scholar] [CrossRef]
- Xia, Z.; Yao, Q.; Meng, G.; Xu, Q.; Tang, C.; Zhu, L.; Wang, W.; Shen, Q. Numerical study of stability of mining roadways with 6.0-m section coal pillars under influence of repeated mining. Int. J. Rock Mech. Min. Sci. 2021, 138, 104641. [Google Scholar] [CrossRef]
- Zou, H.; Yan, E.C. The surrounding rock deformation and failure mechanism of wudang group schists tunnel. Electron. J. Geotech. Eng. 2015, 20, 6557–6576. [Google Scholar]
- Lee, K.H.; Kim, D.H.; Park, J.J. A study on critical strain based damage-controlled test for the evaluation of rock tunnel stability. J. Med. Screen. 2011, 13, 91–97. [Google Scholar] [CrossRef] [Green Version]
- Thompson. Estimation of minimum support resistance and maximum allowable deformation in elastic-plastic enclosures. J. Geotech. Eng. 1986, 4, 81–88. [Google Scholar]
- Miao, X. Natural equilibrium arch and the stability of roadway envelope. Mine Press. Roof Manag. 1990, 2, 55–57. [Google Scholar]
- He, F.; Liu, L.; Qian, M. Analysis and prevention of direct topping of blocky loose rocks at header mining face. Coal 1995, 4, 7–10. [Google Scholar]
- Zhao, P. The shape of the natural balance archon the roadway roof considering the original stress in the horizontal direction. J. China Univ. Min. Technol. 1978, 7, 51–58. [Google Scholar]
- Yu, X.; Qiao, D. Theory of axial variation and three roles of axial ratio for stabilizing country rock. Nonferrous Met. Eng. 1981, 33, 8–15. [Google Scholar]
- Yu, X. The theory of axial variation and basic rules of deformation and fracture of rock surrounding. Uranium Min. Metall. 1982, 1, 8–17. [Google Scholar]
- Chen, G. Mechanism Research of the Maximum Horizontal Stress on Rockburst and Its Application; China University of Mining and Technology: Xuzhou, China, 2009; pp. 1–20. [Google Scholar]
- Wang, C.; Liu, Y.; Hou, X.; Elmo, D. Investigation of the spatial distribution pattern of 3D microcracks in single-cracked breakage. Int. J. Rock Mech. Min. Sci. 2022, 154, 105126. [Google Scholar] [CrossRef]
- Wang, C.; Zhou, B.; Li, C.; Cao, C.; Sui, Q.; Zhao, G.; Yu, W.; Chen, Z.; Wang, Y.; Liu, B.; et al. Experimental investigation on the spatiotemporal-energy evolution pattern of limestone fracture using acoustic emission monitoring. J. Appl. Geophys. 2022, 206, 104787. [Google Scholar] [CrossRef]
- Chen, S.; Xia, Z.; Feng, F.; Yin, D. Numerical study on strength and failure characteristics of rock samples with different hole defects. Bull. Eng. Geol. Environ. 2020, 80, 1523–1540. [Google Scholar] [CrossRef]
- Li, X.; Chen, S.; Wang, E.; Li, Z. Rockburst mechanism in coal rock with structural surface and the microseismic (MS) and electromagnetic radiation (EMR) response. Eng. Fail. Anal. 2021, 124, 105396. [Google Scholar] [CrossRef]
- Małkowski, P.; Niedbalski, Z.; Majcherczyk, T.; Bednarek, Ł. Underground monitoring as the best way of roadways support design validation in a long time period. Min. Miner. Deposits 2020, 14, 1–14. [Google Scholar] [CrossRef]
- Khalymendyk, I.; Baryshnikov, A. The mechanism of roadway deformation in conditions of laminated rocks. J. Sustain. Min. 2018, 17, 41–47. [Google Scholar] [CrossRef]
- Wang, X.H.; Zhao, Z.Q.; Wu, Z.; Zhang, H.H.; Wang, J.; Sui, Y.; Ren, Z.C. Deformation and Failure Mechanism of the Lower Roadway in a Close-Range Residual Coal Pillar Area. Front. Earth Sci. 2022, 10. [Google Scholar] [CrossRef]
- Goodman, R.E. Introduction to Rock Mechanics; Willy: New York, NY, USA, 1978; pp. 66–68. [Google Scholar]
- Zhao, Z.Q. Study on Mechanism and Control Method of Deformation and Failure of Surrounding Rock in Large Deformation Mining Roadway; China University of Mining and Technology: Beijing, China, 2014; pp. 26–32. [Google Scholar]
- Ma, N.J.; Guo, X.F.; Zhao, Z.Q. Occurrence mechanisms and judging criterion on circular tunnel butterfly rock burst in homogeneous medium. J. China Coal Soc. 2016, 41, 2679–2688. [Google Scholar] [CrossRef]
- Ma, N.J.; Zhao, X.D.; Zhao, Z.Q.; Guo, X.F.; Liu, H.T. Conjecture of butterfly shape coal and gas outburst mechanism in excavation roadway. Min. Sci. Tech. 2017, 2, 136–148. [Google Scholar]
- Zhao, Z.Q.; Ma, N.J.; Guo, X.F.; Zhao, X.D.; Fan, L. Falling principle and support design of butterfly-failure roof in large de-formation mining roadways. China Coal Soc. 2016, 41, 2932–2939. [Google Scholar]
- Zhao, Z.Q.; Ma, N.J.; Guo, X.F.; Zhao, X.D.; Xia, Y.X.; Ma, Z.K. Mechanism conjecture of butterfly rock burst in coal seam road-way. China Coal Soc. 2016, 41, 2689–2697. [Google Scholar]
- Guo, X.F.; Zhao, Z.Q.; Gao, X.; Wu, X.Y.; Ma, N.J. Analytical solutions for characteristic radii of circular roadway surrounding rock plastic zone and their application. Int. J. Min. Sci. Technol. 2019, 29, 263–272. [Google Scholar] [CrossRef]
- Begalinov, A.; Almenov, T.; Zhanakova, R.; Bektur, B. Analysis of the stress deformed state of rocks around the haulage roadway of the Beskempir field (Kazakhstan). Min. Miner. Deposits 2020, 14, 28–36. [Google Scholar] [CrossRef]
- Jin, G.; Wang, L.; Zhang, J.; Hu, M.; Duan, N. Roadway layout for recycling residual coal pillar in room-and-pillar mining of thick coal seam. Int. J. Min. Sci. Technol. 2015, 25, 729–734. [Google Scholar] [CrossRef]
- Yang, W.; Liu, C.; Yang, Y. Reasonable malposition setting in close distance coal seams under influence of interlaminar stresses. Rock Mechan. Eng. 2012, 31, 2965–2972. [Google Scholar]
- Li, J.; Li, H.; Li, Z. Research on river dike failure of short-distance coal seams mining under Hunchun River. J. Min. Strat. Control. Eng. 2020, 2, 013538. [Google Scholar]
- Fan, Y. Research on the Mining Method of Close Extra-Thick Coal Seam in Datong Tashan Coal Mine of China National Investment Corporation; China University of Mining and Technology: Beijing, China, 2014. [Google Scholar]
Figure 1.
Diagram of the layout of the roadway between coal seams #3–5 and #2.

Figure 2.
Figure for 30503: ventilation roadway. (a) Day 3 alleyway deformation. (b) Day 7 alleyway deformation. (c) Day 10 alleyway deformation.
Figure 2.
Figure for 30503: ventilation roadway. (a) Day 3 alleyway deformation. (b) Day 7 alleyway deformation. (c) Day 10 alleyway deformation.

Figure 3.
Schematic diagram of different roadway layout schemes.

Figure 4.
A figure of the numerical model.

Figure 5.
Numerical model perspective view.

Figure 6.
Principal stress distribution contour of the roadway’s surrounding rock when the roadway excavation along the roof. (a) σ1 cloud. (b) σ3 cloud.
Figure 6.
Principal stress distribution contour of the roadway’s surrounding rock when the roadway excavation along the roof. (a) σ1 cloud. (b) σ3 cloud.

Figure 7.
Changes in the principal stresses of the roadway’s surrounding rock when the roadway excavation along the roof. (a) Horizontal direction. (b) Variation direction.
Figure 7.
Changes in the principal stresses of the roadway’s surrounding rock when the roadway excavation along the roof. (a) Horizontal direction. (b) Variation direction.

Figure 8.
Plastic zone distribution cloud map when the roadway excavation along the roof.

Figure 9.
Principal stress distribution contour of the roadway’s surrounding rock when the roadway excavation leaves top coal bottom coal. (a) σ1 cloud. (b) σ3 cloud.
Figure 9.
Principal stress distribution contour of the roadway’s surrounding rock when the roadway excavation leaves top coal bottom coal. (a) σ1 cloud. (b) σ3 cloud.

Figure 10.
Changes in the principal stresses of the roadway’s surrounding rock when the roadway excavation leaves top coal bottom coal. (a) Horizontal direction. (b) Variation direction.
Figure 10.
Changes in the principal stresses of the roadway’s surrounding rock when the roadway excavation leaves top coal bottom coal. (a) Horizontal direction. (b) Variation direction.

Figure 11.
Plastic zone distribution cloud map when the roadway excavation leaves top coal bottom coal.
Figure 11.
Plastic zone distribution cloud map when the roadway excavation leaves top coal bottom coal.

Figure 12.
Principal stress distribution contour of the roadway’s surrounding rock when the roadway excavation along the floor. (a) σ1 cloud. (b) σ3 cloud.
Figure 12.
Principal stress distribution contour of the roadway’s surrounding rock when the roadway excavation along the floor. (a) σ1 cloud. (b) σ3 cloud.

Figure 13.
Changes in the principal stresses of the roadway’s surrounding rock when the roadway excavation along the floor. (a) Horizontal direction. (b) Variation direction.
Figure 13.
Changes in the principal stresses of the roadway’s surrounding rock when the roadway excavation along the floor. (a) Horizontal direction. (b) Variation direction.

Figure 14.
Plastic zone distribution cloud map when the roadway excavation along the floor.

Figure 15.
Principal stress distribution contour of the roadway’s surrounding rock when the coal column is 4 m. (a) σ1 cloud. (b) σ3 cloud.
Figure 15.
Principal stress distribution contour of the roadway’s surrounding rock when the coal column is 4 m. (a) σ1 cloud. (b) σ3 cloud.

Figure 16.
Changes in the principal stresses of the roadway’s surrounding rock when the coal column is 4 m. (a) Horizontal direction. (b) Variation direction.
Figure 16.
Changes in the principal stresses of the roadway’s surrounding rock when the coal column is 4 m. (a) Horizontal direction. (b) Variation direction.

Figure 17.
Plastic zone distribution cloud map when the coal column is 4 m.

Figure 18.
Principal stress distribution contour of the roadway’s surrounding rock when the coal column is 8 m. (a) σ1 cloud. (b) σ3 cloud.
Figure 18.
Principal stress distribution contour of the roadway’s surrounding rock when the coal column is 8 m. (a) σ1 cloud. (b) σ3 cloud.

Figure 19.
Changes in the principal stresses of the roadway’s surrounding rock when the coal column is 8 m. (a) Horizontal direction. (b) Variation direction.
Figure 19.
Changes in the principal stresses of the roadway’s surrounding rock when the coal column is 8 m. (a) Horizontal direction. (b) Variation direction.

Figure 20.
Plastic zone distribution cloud map when the coal column is 8 m.

Figure 21.
Principal stress distribution contour of the roadway’s surrounding rock when the coal column is 15 m. (a) σ1 cloud. (b) σ3 cloud.
Figure 21.
Principal stress distribution contour of the roadway’s surrounding rock when the coal column is 15 m. (a) σ1 cloud. (b) σ3 cloud.

Figure 22.
Changes in the principal stresses of the roadway’s surrounding rock when the coal column is 15 m. (a) Horizontal direction. (b) Variation direction.
Figure 22.
Changes in the principal stresses of the roadway’s surrounding rock when the coal column is 15 m. (a) Horizontal direction. (b) Variation direction.

Figure 23.
Plastic zone distribution cloud map when the coal column is 15 m.

Figure 24.
Principal stress distribution contour of the roadway’s surrounding rock when the coal column is 25 m. (a) σ1 cloud. (b) σ3 cloud.
Figure 24.
Principal stress distribution contour of the roadway’s surrounding rock when the coal column is 25 m. (a) σ1 cloud. (b) σ3 cloud.

Figure 25.
Changes in the principal stresses of the roadway’s surrounding rock when the coal column is 25 m. (a) Horizontal direction. (b) Variation direction.
Figure 25.
Changes in the principal stresses of the roadway’s surrounding rock when the coal column is 25 m. (a) Horizontal direction. (b) Variation direction.

Figure 26.
Plastic zone distribution cloud map when the coal column is 25 m.

Figure 27.
Principal stress distribution contour of the roadway’s surrounding rock when the roadway dug directly below the residual coal pillar. (a) σ1 cloud. (b) σ3 cloud.
Figure 27.
Principal stress distribution contour of the roadway’s surrounding rock when the roadway dug directly below the residual coal pillar. (a) σ1 cloud. (b) σ3 cloud.

Figure 28.
Changes in the principal stresses of the roadway’s surrounding rock when the roadway dug directly below the residual coal pillar. (a) Horizontal direction. (b) Variation direction.
Figure 28.
Changes in the principal stresses of the roadway’s surrounding rock when the roadway dug directly below the residual coal pillar. (a) Horizontal direction. (b) Variation direction.

Figure 29.
Plastic zone distribution cloud map when the roadway dug directly below the residual coal pillar.
Figure 29.
Plastic zone distribution cloud map when the roadway dug directly below the residual coal pillar.

Figure 30.
Deformation cloud diagram of the roadway’s surrounding rock at different locations. (a) Roadway excavation along the roof. (b) Roadway excavation leaves: top coal bottom coal. (c) Roadway excavation along the floor. (d) The coal column is 4 m. (e) The coal column is 8 m. (f) The coal column is 15 m. (g) The coal column is 25 m. (h) Roadway dug directly below the residual coal pillar.


Figure 31.
Deformation curves of the roadway’s surrounding rock at different locations.

Figure 32.
Principal stress distribution and the plastic zone area under different roadway layout positions.
Figure 32.
Principal stress distribution and the plastic zone area under different roadway layout positions.


Table 1.
Rock mechanics parameter table.
| Parameters Lithology | Density (kg/m3) | Bulk Modulus (GPa) | Shear Modulus (GPa) | The Angle of Internal Friction (°) | Internal Cohesion (MPa) | Tensile Strength (MPa) |
|---|---|---|---|---|---|---|
| Siltstone | 2560 | 11.69 | 10.67 | 38.57 | 6.4 | 3.34 |
| Sandy mudstone | 2500 | 10.2 | 8.4 | 36.4 | 3.72 | 1.73 |
| Coarse-grained sandstone | 2700 | 14 | 10.7 | 39.4 | 5.68 | 6.4 |
| 2#vCoal | 1400 | 3.48 | 0.78 | 34.45 | 2.13 | 0.92 |
| 3–5# Coal | 1500 | 3.48 | 1.61 | 34.45 | 2.13 | 0.92 |
| Kaolinite | 2100 | 8.2 | 7.6 | 35 | 5.5 | 1.73 |
| 6# Coal | 1500 | 3.48 | 1.61 | 34.45 | 2.13 | 0.92 |
| 7# Coal | 1500 | 3.48 | 1.61 | 34.45 | 2.13 | 0.92 |
| 8# Coal | 1500 | 3.48 | 1.61 | 34.45 | 2.13 | 0.92 |
| 9# Coal | 1500 | 3.48 | 1.61 | 34.45 | 2.13 | 0.92 |
| Shan 4# Coal | 1400 | 3.48 | 0.78 | 34.45 | 2.13 | 0.92 |
Publisher’s Note: MDPI stays neutral with regard to jurisdictional claims in published maps and institutional affiliations. |
© 2022 by the authors. Licensee MDPI, Basel, Switzerland. This article is an open access article distributed under the terms and conditions of the Creative Commons Attribution (CC BY) license (https://creativecommons.org/licenses/by/4.0/).
Share and Cite
MDPI and ACS Style
Wang, X.-H.; Zhang, H.-H.; Wu, Z.; Li, X.-L.; Sui, Y.; Gao, R.-Q. Selection and Optimization Mechanism of the Lower Return Roadway Layout in the near Residual Coal Pillar Area. Processes 2022, 10, 2471. https://doi.org/10.3390/pr10122471
AMA Style
Wang X-H, Zhang H-H, Wu Z, Li X-L, Sui Y, Gao R-Q. Selection and Optimization Mechanism of the Lower Return Roadway Layout in the near Residual Coal Pillar Area. Processes. 2022; 10(12):2471. https://doi.org/10.3390/pr10122471
Chicago/Turabian StyleWang, Xiao-He, Hao-Hao Zhang, Zheng Wu, Xiao-Long Li, Yi Sui, and Ruo-Qi Gao. 2022. "Selection and Optimization Mechanism of the Lower Return Roadway Layout in the near Residual Coal Pillar Area" Processes 10, no. 12: 2471. https://doi.org/10.3390/pr10122471
Note that from the first issue of 2016, this journal uses article numbers instead of page numbers. See further details here.