Article

Genome-Wide Association Analysis for Tuber Dry Matter and Oxidative Browning in Water Yam (Dioscorea alata L.)

1
International Institute of Tropical Agriculture (IITA), Ibadan 200001, Nigeria
2
Pan African University, Institute of Life and Earth Sciences, University of Ibadan, Ibadan 200001, Nigeria
3
Department of Agronomy, University of Ibadan, Ibadan 200001, Nigeria
*
Author to whom correspondence should be addressed.
Plants 2020, 9(8), 969; https://doi.org/10.3390/plants9080969
Submission received: 21 June 2020 / Revised: 24 July 2020 / Accepted: 29 July 2020 / Published: 31 July 2020
(This article belongs to the Section Plant Genetics, Genomics and Biotechnology)

Abstract

:
Yam (Dioscorea spp.) is a nutritional and medicinal staple tuber crop grown in the tropics and sub-tropics. Among the food yam species, water yam (Dioscorea alata L.) is the most widely distributed and cultivated species worldwide. Tuber dry matter content (DMC) and oxidative browning (OxB) are important quality attributes that determine cultivar acceptability in water yam. This study used a single nucleotide polymorphism (SNP) assay from a diversity arrays technology (DArT) platform for a genome-wide association study (GWAS) of the two quality traits in a panel of 100 water yam clones grown in three environments. The marker–trait association analysis identified significant SNPs associated with tuber DMC on chromosomes 6 and 19 and with OxB on chromosome 5. The significant SNPs cumulatively explained 45.87 and 12.74% of the total phenotypic variation for the tuber DMC and OxB, respectively. Gene annotation for the significant SNP loci identified important genes associated in the process of the proteolytic modification of carbohydrates in the dry matter accumulation pathway as well as fatty acid β-oxidation in peroxisome for enzymatic oxidation. Additional putative genes were also identified in the peak SNP sites for both tuber dry matter and enzymatic oxidation with unknown functions. The results of this study provide valuable insight for further dissection of the genetic architecture of tuber dry matter and enzymatic oxidation in water yam. They also highlight SNP variants and genes useful for genomics-informed selection decisions in the breeding process for improving food quality traits in water yam.

1. Introduction

Yams are herbaceous perennial vine plants in the genus Dioscorea, comprising over 600 species [1,2]. They grow in the tropics and sub-tropics of Africa, the Caribbean, Latin America, Asia, and Oceania as a source of dietary food and ingredients for pharmaceuticals and traditional medicine. In West Africa, where over 92% of its global production occurs [3], yam is involved in many key life ceremonies [4]. Dioscorea alata, also known by the common names ‘water yam’ or ‘greater yam’, is one of the most important food yams. It is the world’s most widely distributed cultivated yam, though it is not cultivated on the same magnitude as D. rotundata due to traditional bias that overlooks its nutritional and agronomic potential [5].
End-use quality significantly influences the acceptance of yam varieties by farmers and consumers [6]. In effect, the success of newly developed yam varieties depends not only on their agronomic attributes but also on their acceptability to consumers in terms of both sensory and utilization characteristics [7]. The yam tuber has diverse uses as a result of the wide variation in organoleptic, culinary and nutritional properties, making some yam cultivars more appropriate for certain types of food preparation than others. Water yam cultivars with good eating qualities are characterized by high dry matter, starch, and amylose contents [8]. The rapid change in colour of the tissue from white to yellow or brown after the tuber is cut, which is the result of the oxidation of polyphenols, influences its processing and utilization [9]. Polyphenolic oxidation is also linked to bitterness, off-flavours and in some instances necessitates special preparation processes to make acceptable dishes [10].
Boiled yam, pounded yam (also known as “fufu”), and “amala” (prepared from cooking and stirring of the fermented yam flour—“elubo”) are the three leading food forms of yams in West and Central African regions [11,12]. In this region, Dioscorea rotundata (white yam) is preferred to water yam for “fufu” and “amala” due to its ease of dough formation when pounded. However, some collections and advanced breeding lines of water yam at the International Institute of Tropical Agriculture (IITA, Ibadan, Nigeria) have displayed the capacity to form good dough, similar to or even superior to that of some genotypes of D. rotundata [7]. Additionally, some water yam clones have higher total dietary fibre and amylose content than that reported for brown rice and whole wheat flour together with low sodium but high potassium content, indicating the nutritional role that water yam could play in managing chronic diseases including diabetes [13].
This highlights the potential of water yam for food and nutritional security in West and Central Africa, particularly as it has a very wide adaptation, high genetic potential to produce fairly high yield under low to average soil fertility, early vigour for weed suppression, ease of propagation through the production of bulbils resulting in a high multiplication ratio, low post-harvest losses, good processing quality and high nutritive value [5,14].
An improvement in the food quality of D. alata remains a key objective in yam breeding programmes [7] and is critical for increasing the adoption level of newly developed varieties. To date, the genetic improvement efforts to develop water yam varieties with enhanced tuber quality attributes are mainly by conventional breeding strategies based on phenotypic records/data. This is, however, arduous and slow due to the lengthy screening process of identifying superior individuals from clonal populations [5,15]. In addition, the genetic basis of traits that define tuber quality has not received much attention. With the advent of molecular markers, tremendous progress has been made to understand the genetic diversity and relationships in Dioscorea species including D. alata (water yam) [16]. The use of genotypic and phenotypic data has also proven to elucidate genetic diversity in different Dioscorea spp. [17].
The advancements in next-generation sequencing technologies have led to the rapid development of DNA-informed breeding techniques such as marker-assisted breeding and genomic selection through which many crops have recorded fast genetic gains. The increasing availability of molecular markers enables researchers to tag regions of the genome associated with specific phenotypes of interest in Quantitative trait locus (QTL) mapping and genome-wide association studies [18]. The genetic mapping of loci underlying important tuber quality traits of water yam has not been conducted yet to assist selection decisions in the breeding process. Mapping based on genome-wide associations has become increasingly popular and powerful because of the emergence of more cost-effective, high-throughput genotyping platforms. Using molecular approaches, such as the candidate gene technique, to unravel the causal gene(s) would hasten efforts in introgressing tuber quality traits into preferred genetic backgrounds of D. alata. The precision and speed of crop breeding have been improved by the evolution of genetic linkage and association mapping of the quantitative traits. This has been clearly demonstrated by Pétro et al. [19] in water yam. Genomic resources for D. alata are being rapidly developed [20]. These include the recent pre-release of a chromosome-scale “v2” assembly of Dioscorea alata see release notes and assembly [20]. This genome sequence enables genome-wide association studies of key traits in water yam.
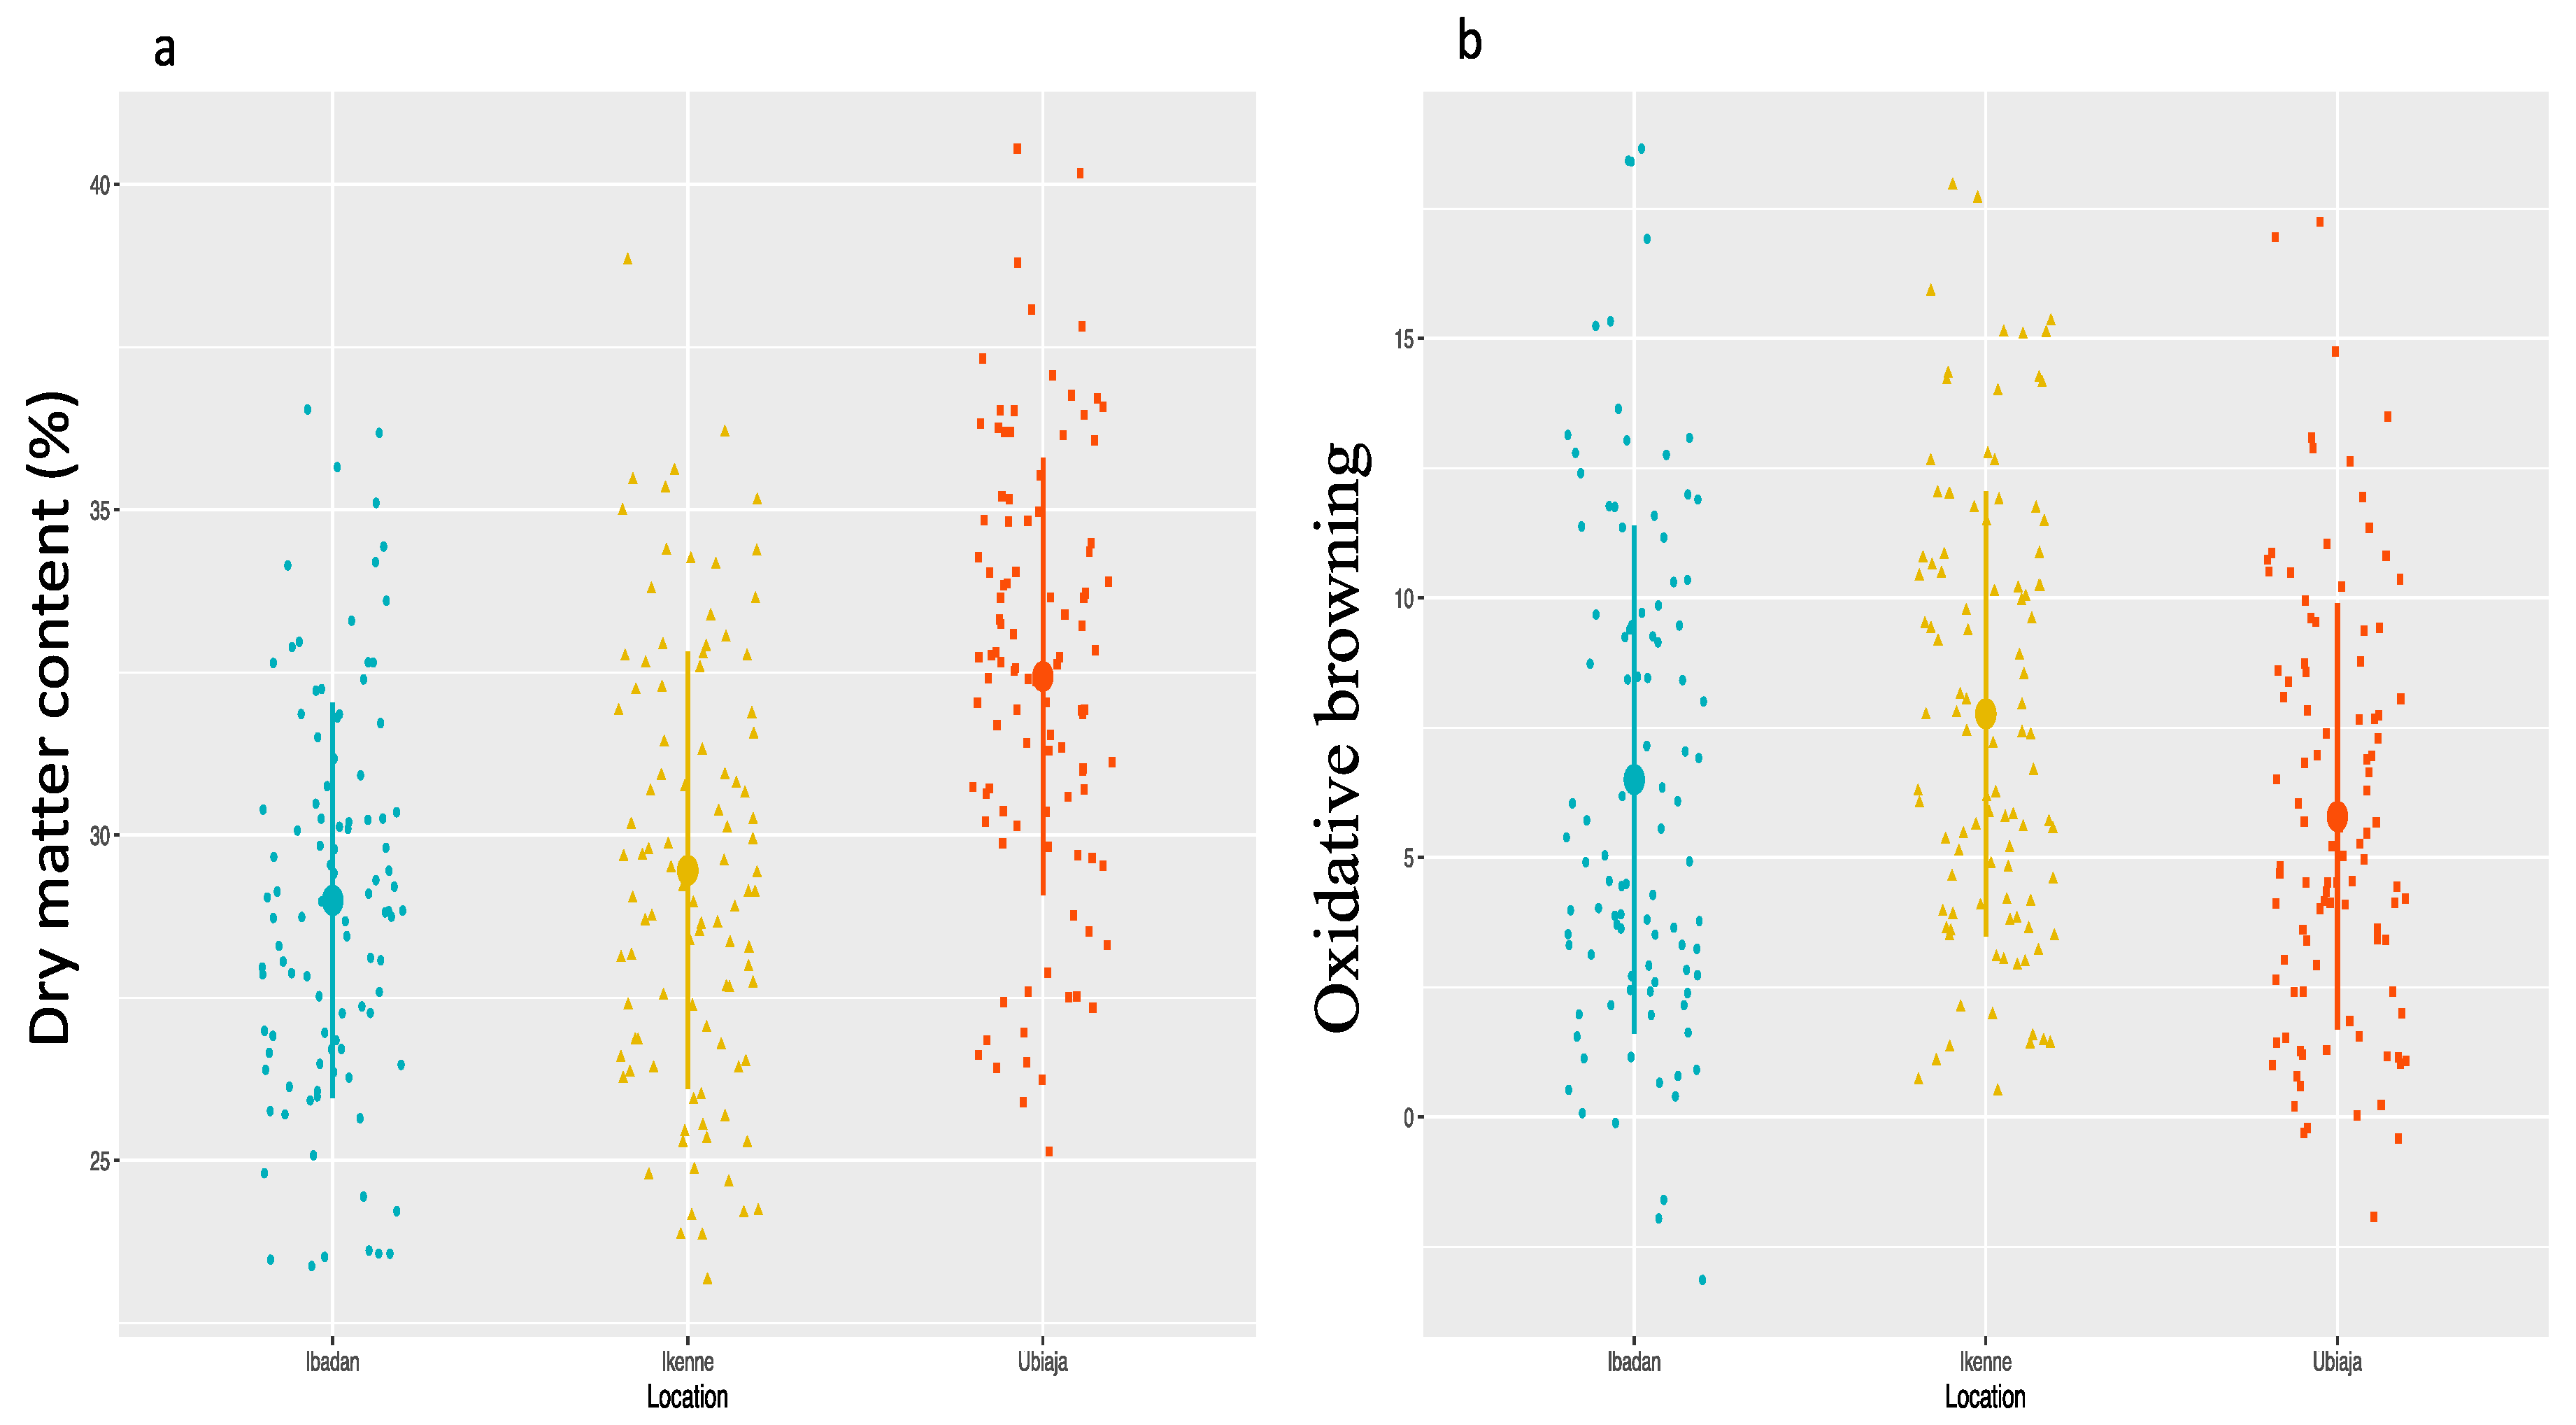
To elucidate the genetic factors for tuber dry matter content and oxidative browning, a diversity panel consisting of 100 water yam clones was genotyped by diversity arrays technology sequencing. While whole-genome sequencing provides the highest resolution, it still remains expensive for non-model species such as yams. A genome-wide association study was conducted to identify single nucleotide polymorphism loci or QTL regions and genes associated with tuber dry matter and oxidative browning. The SNP loci and associated candidate genes, when validated, would be a valuable resource for marker-assisted selection in the breeding process to develop new water yam varieties with acceptable end-user qualities.

2. Results

2.1. Genotypic Variability for Tuber DMC and OxB

We analysed phenotypic data from the three locations to estimate the variance for total genotypic value and genotype × location effect (Table 1). The variance estimates for the two traits were statistically significant (p < 0.05) for total genotypic and genotype × location effects. The variance estimate for the total genotypic value was higher than that of the genotype × location effects. Genotypic differences among the diversity panel for DMC and OxB were statistically significant (p < 0.05) in each of the three locations (Figure 1). Mean DMC was highest in Ubiaja (32.43%), followed by Ikenne (29.20%) and Ibadan (28.83%), while mean oxidative browning was high at Ikenne, followed by Ibadan and Ubiaja. Significant negative correlation (r2 = −0.39, p < 6.825074 × 10⁻⁵) was obtained between DMC and the OxB.

2.2. Genotyping, Population Structure, and Linkage Disequilibrium

Table 2 presents the number of SNPs on D. alata chromosomes before and after filtering for missing data, allele frequency, and heterozygosity (see Materials and Methods for details). The SNP calling pipeline yielded 22,140 highly polymorphic SNP markers, of which 18,067 were mapped onto the 20 D. alata chromosomes while 4073 were unmapped. Out of the mapped markers, 9687 SNPs that qualified the filtering criteria were used as input for GWAS analysis. The filtered SNPs were not proportionally distributed across the 20 chromosomes with highest counts of 923, 893, and 843 displayed on chromosomes 5, 4, and 19, respectively (Table 2, Supplementary Figure S1a,b). The lowest number of SNPs, 299 and 304, were mapped on chromosome 1 and 13, respectively (Table 2). Minor allele frequency (MAF) across 9687 SNP markers varied from 0.05 to 0.50 with an average of 0.209. Observed and expected heterozygosity varied from 0.01 to 0.71 and 0.009 to 0.5, respectively. Across the chromosome, the polymorphism information content (PIC) of filtered SNPs varied from 0.20777 (chromosome 18) to 0.27728 (chromosome 10) with mean 0.23553 (Table 2). Genetic diversity conducted previously by Agre et al. [21] through discriminant analysis of principal components (DAPC) and admixture (population structure) revealed three major clusters with a low genetic pair-wise fixation index among clones of each group. Through admixture analysis, very few clones were identified as pure while 66% of the total accessions were found to be admixed.
Linkage disequilibrium analysis revealed 312,479 loci pairs within a physical distance that extends up to 998,066 bp. About, 6.04% (450) of the loci pairs were in significant linkage disequilibrium (LD) (p < 0.001). In addition, 221 (3.10%) of the pairs were in complete LD (R2 = 1). Pearson’s correlation coefficients were negative (r = −0.035) between linkage disequilibrium (R2) and physical distance (bp), as well as between p-value and R2 (r = −0.40), showing the existence of linkage decay. Linkage disequilibrium (LD) decay differed across the chromosomes, ranging from 8289 bp for chromosome 1 to 58,562 bp for chromosome 11.

2.3. Genome-Wide Association Scan for Tuber Dry Matter Content

We identified three SNP markers significantly associated with DMC (Figure 2, Table 3). Of these three SNP loci, two (Chr6_59775 and Chr6_615325) were on chromosome 6 at 59,775 and 615,325 bp physical positions, respectively (Table 3). These two SNP loci had marker effects of −4.01 and −3.33, respectively, and explained 15.50% of the total phenotypic variation. The third SNP locus associated with the tuber DMC was on chromosome 19 (Chr19_8692) at 8692 bp physical position. This SNP had a marker effect of 1.39 and explained 30.37% of the total phenotypic variation on DMC (Table 3). Of the four-gene action models (general, additive, simple dominant (1-dom-alt) and dominant reference (1-dom-ref) used in our analysis, one SNP (Chr19_8692) was identified through the additive gene action model, while two SNPs (Chr6_615325 and Chr19_8692) were identified through the dominant reference model (Figure 2).
The three QTLs associated with DMC showed significant QTL × location interaction (Table 4). The SNP marker Chr19_8692 was significant at each of the three locations, while the two markers on chromosome 6 were significant in two (Ibadan and Ikenne) of the three locations (Table 5). The Quantile–Quantile (QQ) plot corroborated with reducing −log10 (p-value) toward the expected level for the dry matter (Figure 2). Further dissection of the two SNP loci associated with the tuber DMC on chromosome 6 showed that clones with the homozygous allele AA possessed higher tuber DMC than those with the heterozygous allele AG and/or homozygous allele GG (Figure 3). A marker effect on chromosome 19 revealed the allele CC to be linked with low DMC in the studied population, while allele CT and TT accounted for high DMC (Figure 4).

2.4. Genome-Wide Scan for Oxidative Browning

We identified two SNP markers, “Chr5_118279” and “Chr5_125093”, both on chromosome 5 that had a significant association with the oxidative browning (Figure 5). The two significant SNP markers, “Chr5_118279” and “Chr5_125093”, with marker effects of −4.06 and −3.48, were detected at LOD scores of 4.30 and 4.19, respectively (Table 3). Three (general, additive, and dominant alternative) of the four gene action models used in the analysis showed a significant marker–trait association for OxB on chromosome 5 that explained 12.74% of the total phenotypic variation (Table 3). The genotypic status of significant QTL markers associated with OxB and their corresponding mean phenotypic values presented in Figure 6. The two SNP markers were significant at Ikenne and Ibadan but not at Ubiaja (Table 5). The average phenotypic values of tuber oxidation for GA and GG genotypes were 5.22 and 7.36 for Chr5_11279, 4.91 and 7.48 for Chr5_125093 (Figure 6). Analysis of variance (ANOVA) revealed that the OxB value for the allele GA was significantly lower than that predicted by the allele GG (Figure 6).

2.5. Gene Annotations

The significant SNP loci were related to structural genes using a candidate approach that takes advantage of the protein-coding gene annotation of the D. alata genome in preparation [20] (used with permission). This approach resulted in the identification of candidate genes on chromosomes 6 and 19 associated with DMC and chromosome 5 for the OxB. Through the annotation, various putative genes (26) associated with DMC, including ATP-grasp fold and succinyl-CoA synthetase-type (IPR013650) were identified at 4 kb from Chr19_8692, while glycoside hydrolase family 9 (IPR001701) and six-hairpin glycosidase superfamily (IPR008928) were identified on the marker associated with DMC on chromosome 6. For OxB, six putative candidate genes, including the thioesterase domain (IPR006683), phenylacetic acid degradation-related domain (IPR003736), histone deacetylase family (IPR000286), histone deacetylase domain (IPR023801), DUF630 (IPR006868), Cwf19-like and C-terminal domain-1 (IPR006768) were identified near the peak SNPs.
LD block heatmaps based on the LD of each identified SNP loci are shown in Figure 7 and Figure 8. For DMC, the LD analysis of the three loci (two on chromosome 6 and one on chromosome 19) showed that these markers had a relatively average to high LD parameter (R2  > 0.8), showing a relatively high correlation (Figure 7). For OxB, the LD analysis on two loci (two markers on chromosome 5) showed that these markers had relatively low LD parameters (R2  < 0.6) (Figure 8).

3. Discussion

Dry matter content and oxidation properties of yam tubers are very important quality traits that influence the rate of adoption of new clones for cultivation and consumption. Yam improvement efforts worldwide, especially in West Africa, have tested several clones within yam populations for DMC and none or minimal oxidation of fresh tuber using conventional selective breeding based on phenotypic records [8,22,23], an approach that is slow and arduous. For quality traits, DNA-based strategies such as GWAS reported in this study have advantages over the conventional selection breeding approach because it has the potential to fast-track the development and delivery of improved yam varieties with acceptable end-user attributes. The potential of GWAS to dissect complex traits has been proven in root and tuber crops such as cassava [24,25,26] and potatoes [27,28]. The present GWAS sought to identify QTL (s) and putative candidate genes associated with genetic variation in DMC and OxB in water yam. The highly significant genotype variance for DMC content and OxB in the current D. alata panel warrant further analysis for the dissection of the genetic basis of variation for these two traits.
Detailed knowledge of population structure and familial relationships (kinship) in the association panel is crucial to prevent sham associations in GWAS [29]. Population structure and admixture for this population were reported in a previous study [
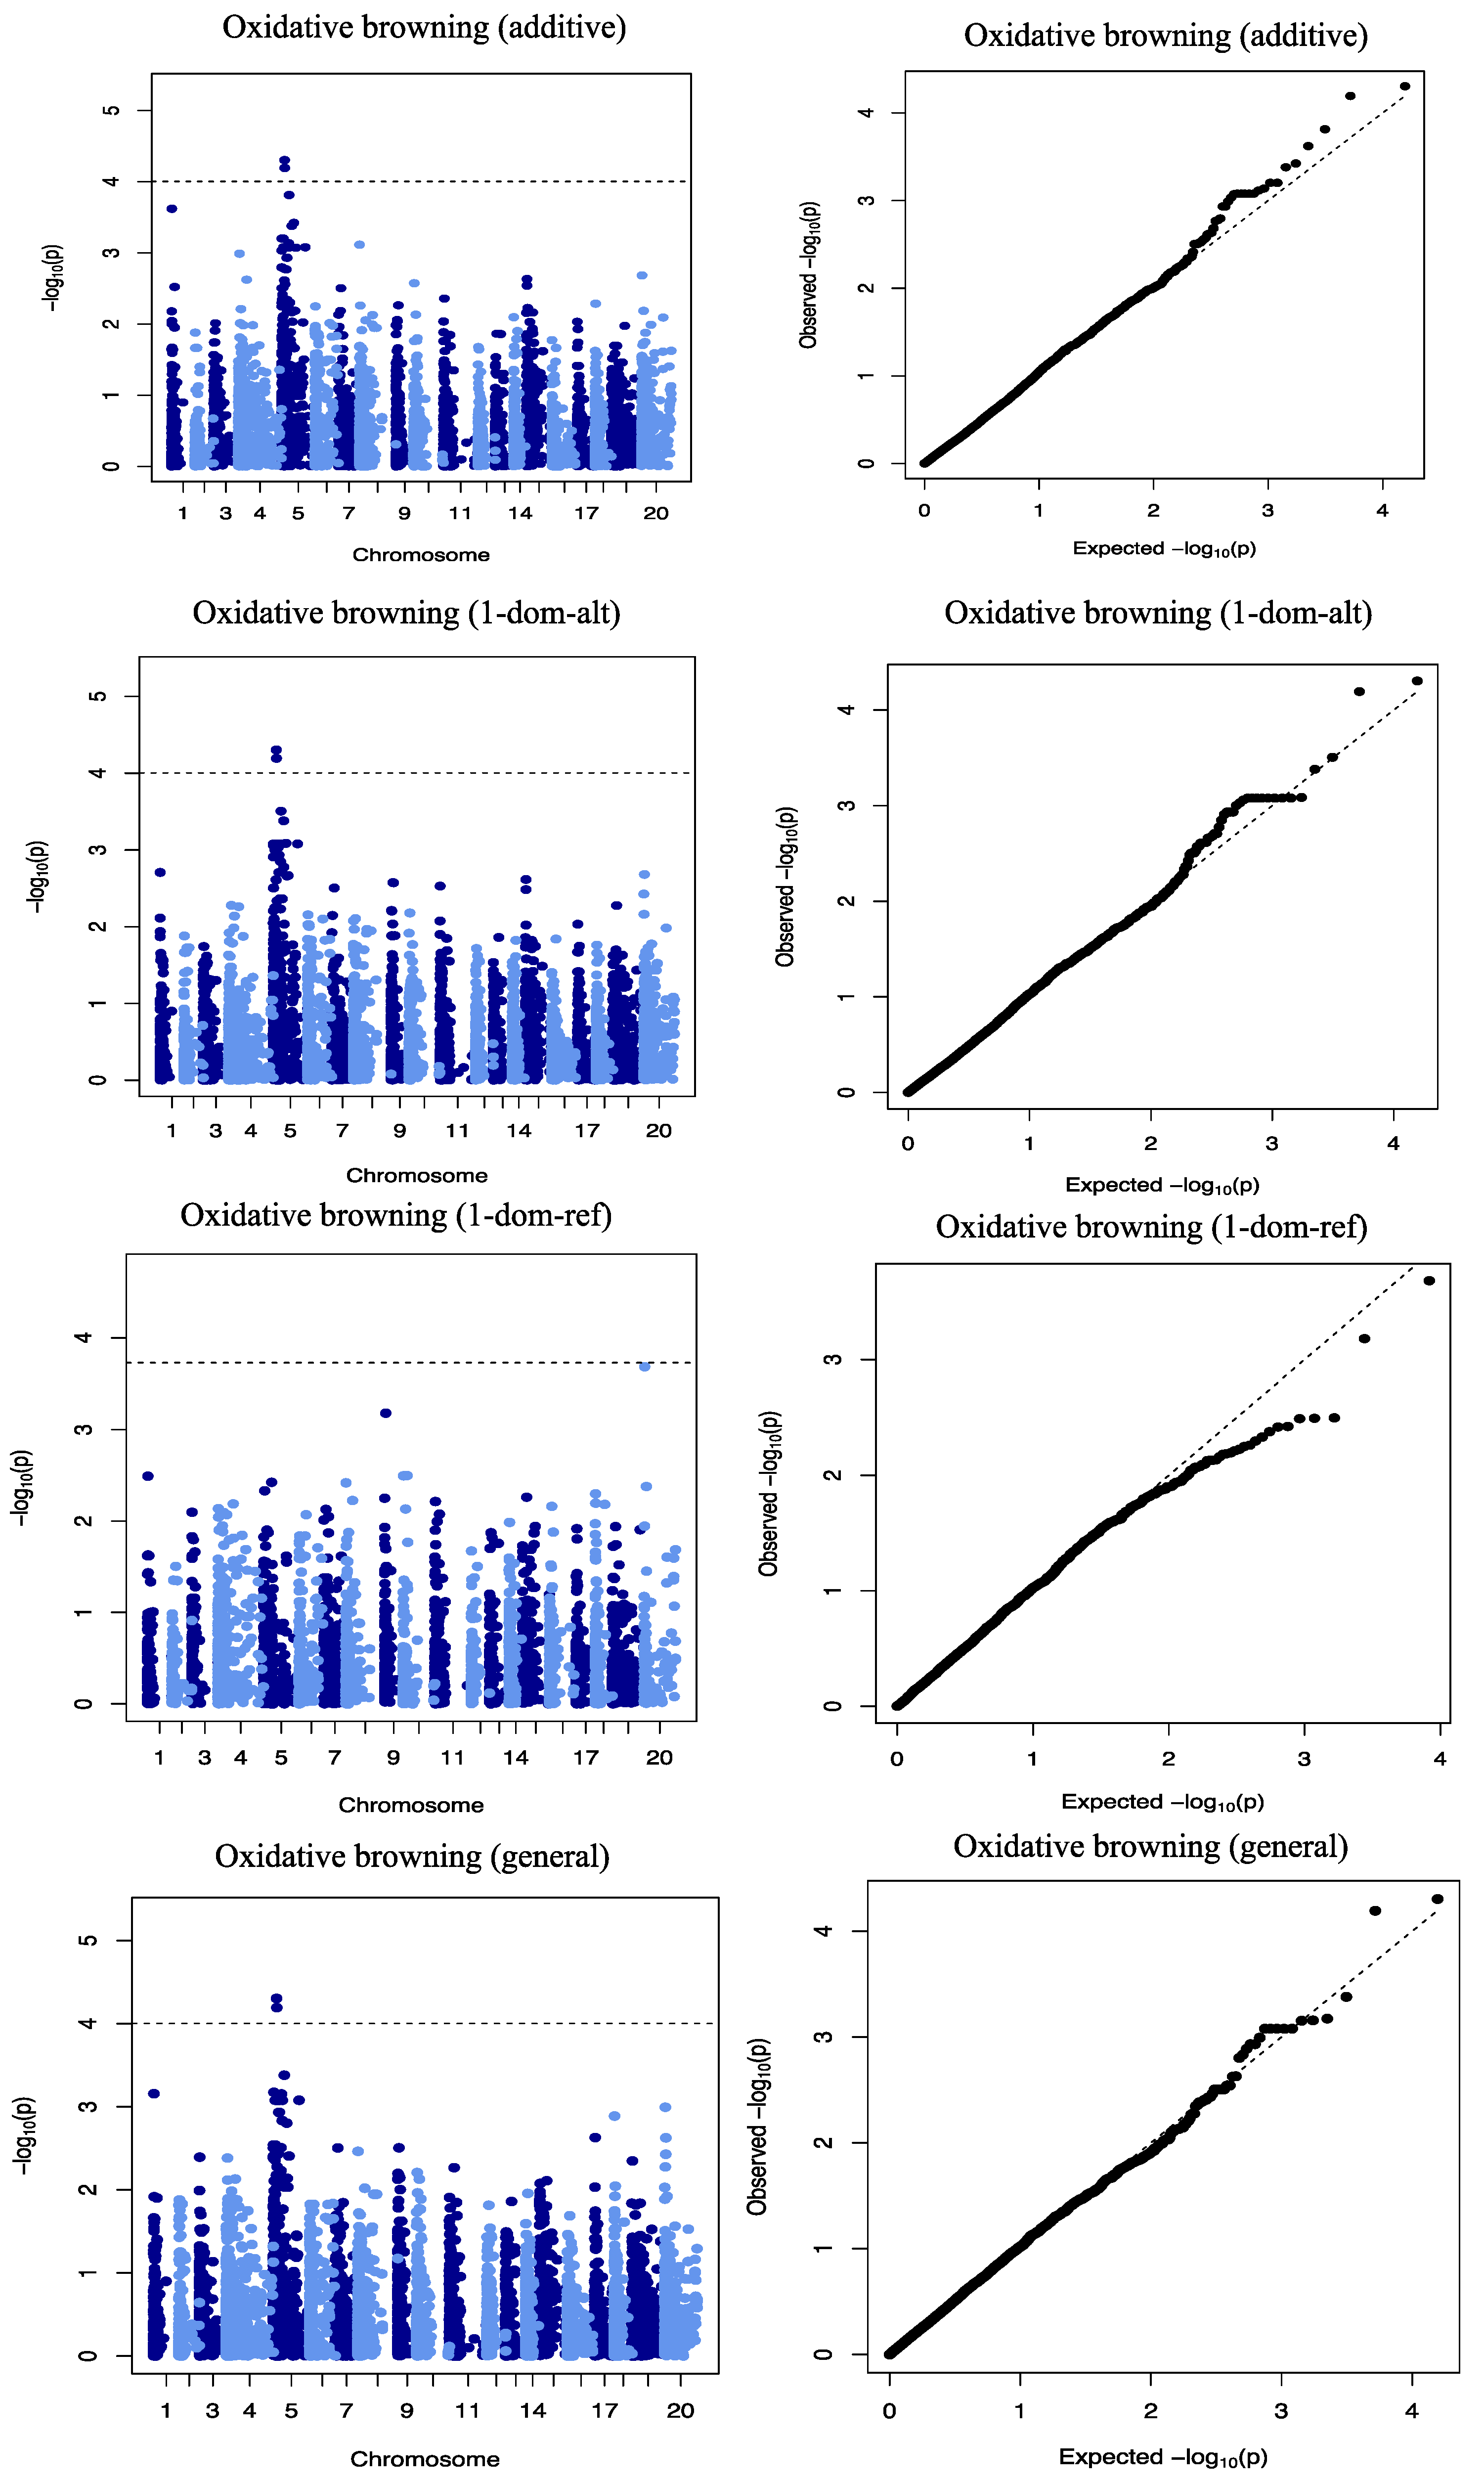
21]. The Q matrix (population structure) and K matrix (Admixture) were used as covariates in a mixed linear model for the association analysis to reduce false-positive associations. The reducing −log10 (
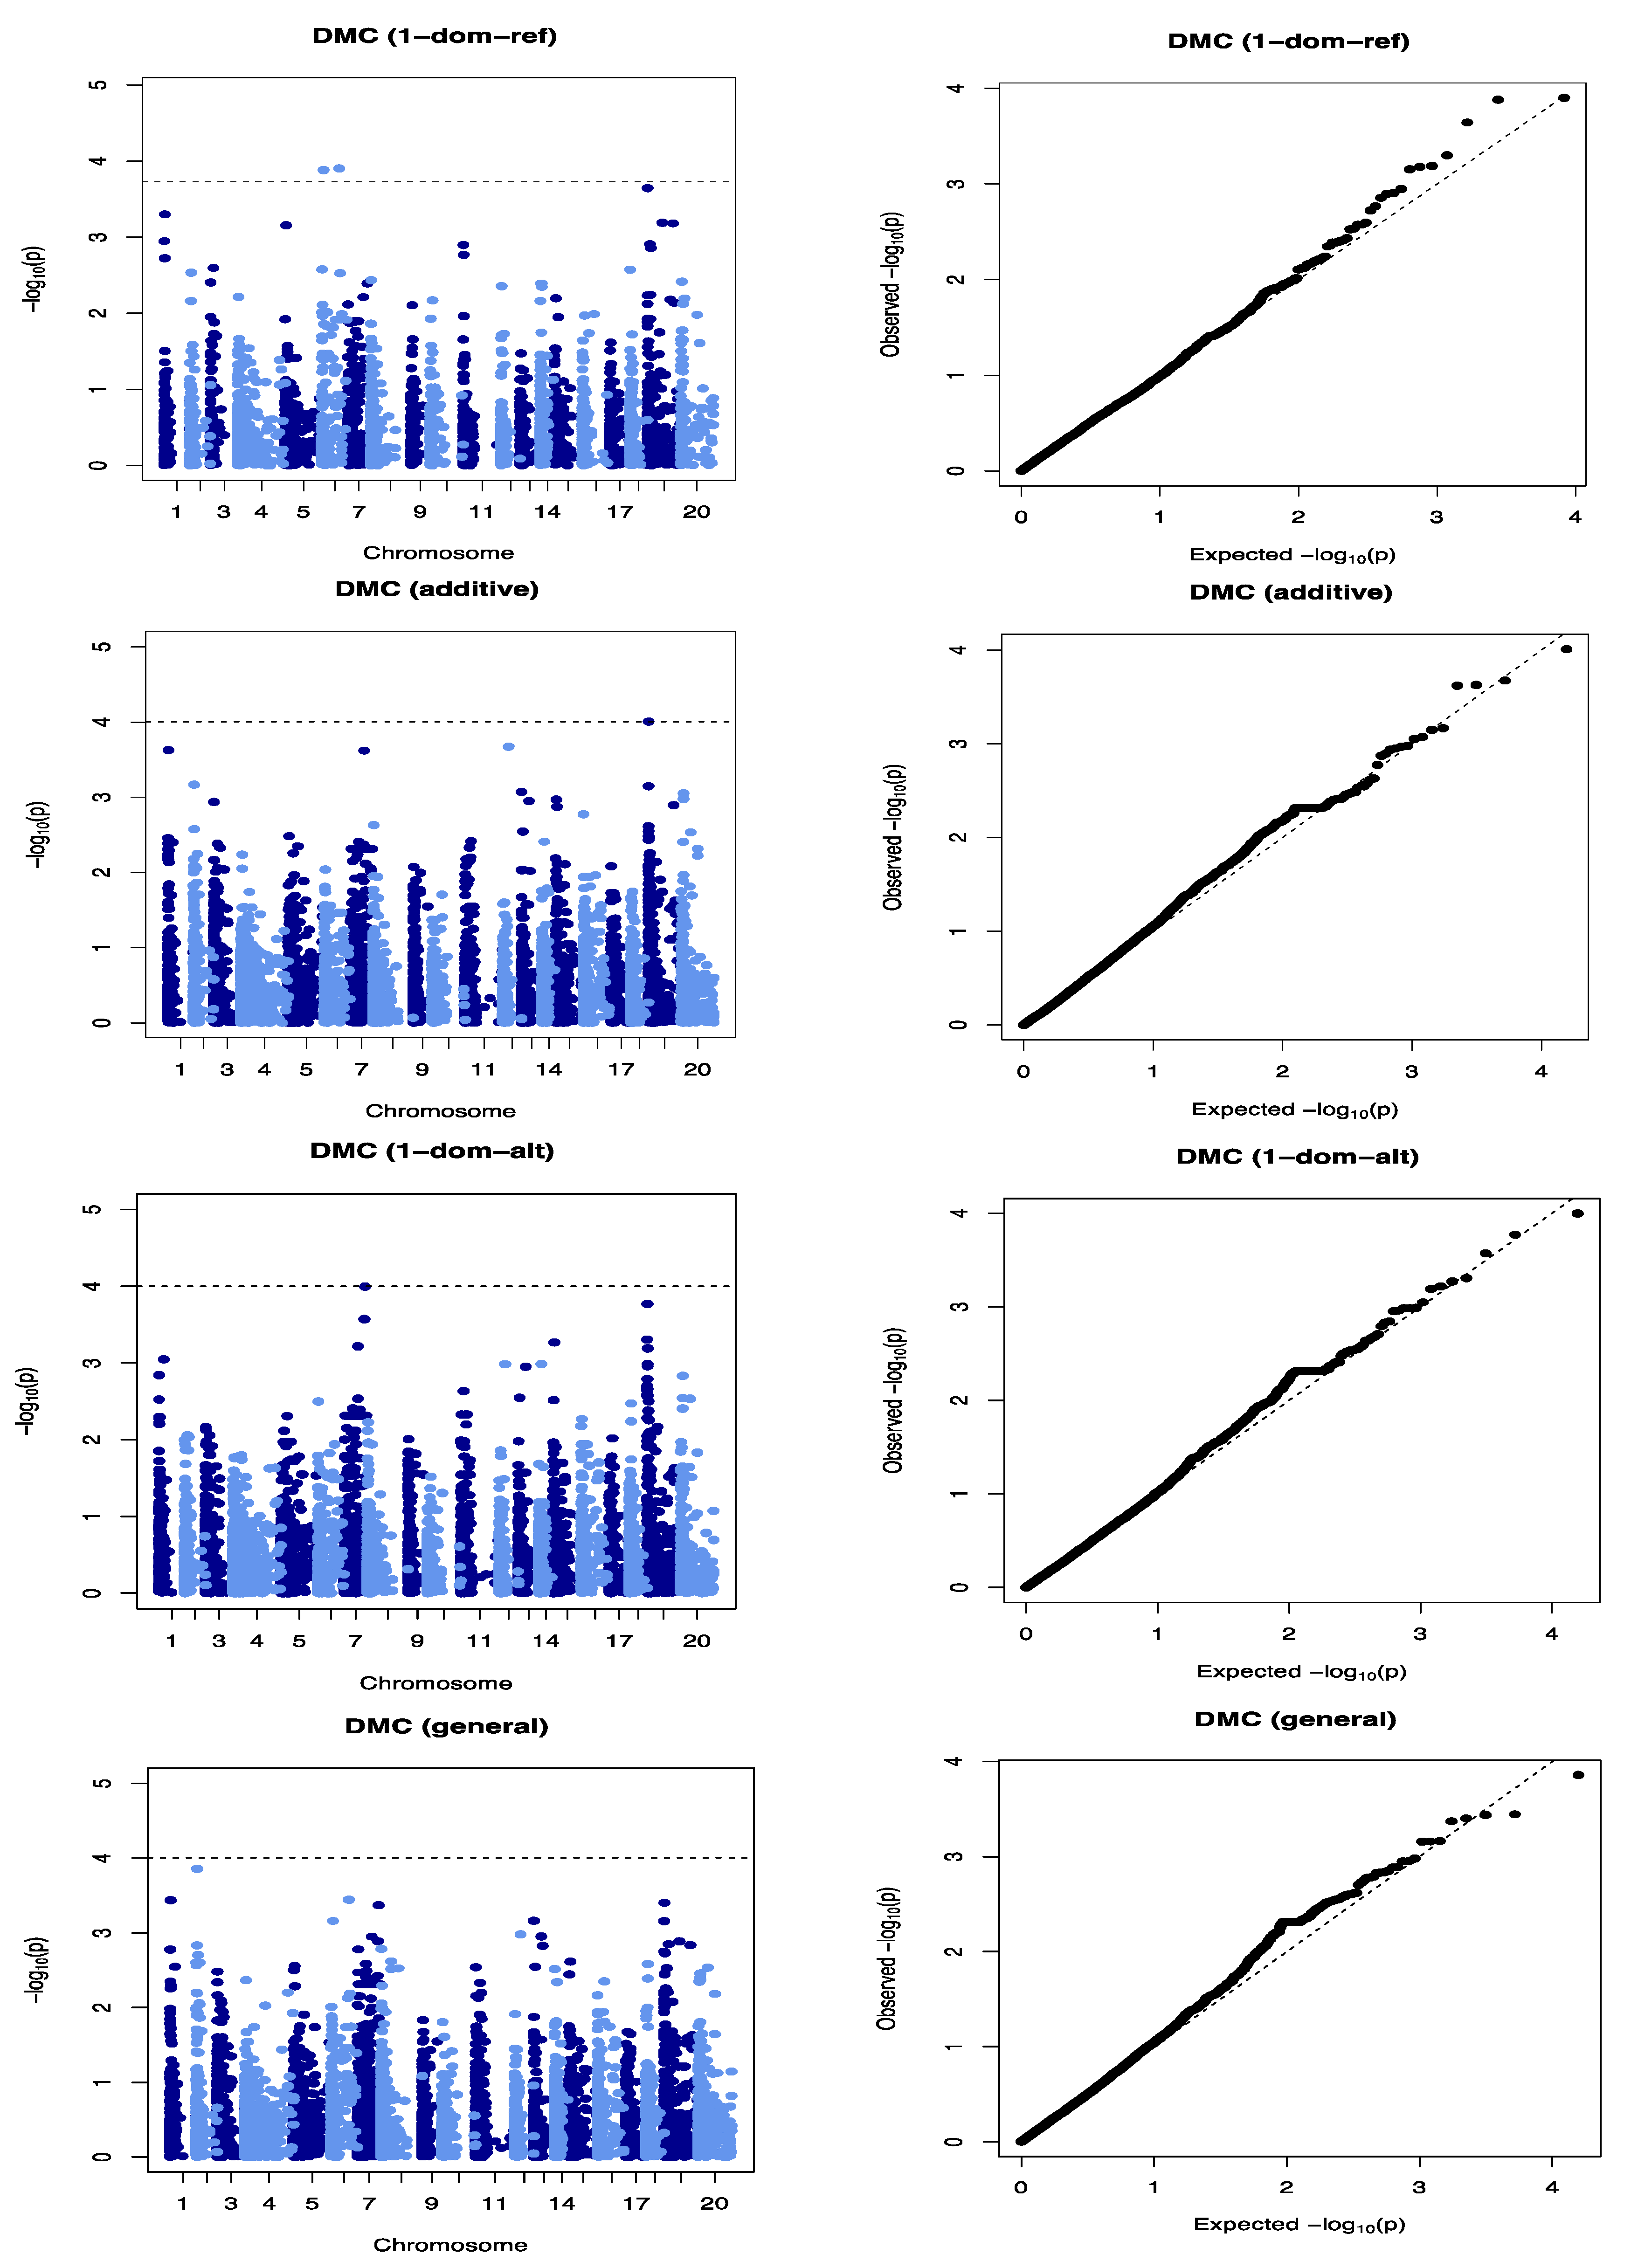
p-values) toward the expected level for both traits on the quantile–quantile plots is a sign that the model successfully accounted for population structure and familial relationships in the GWAS analysis.
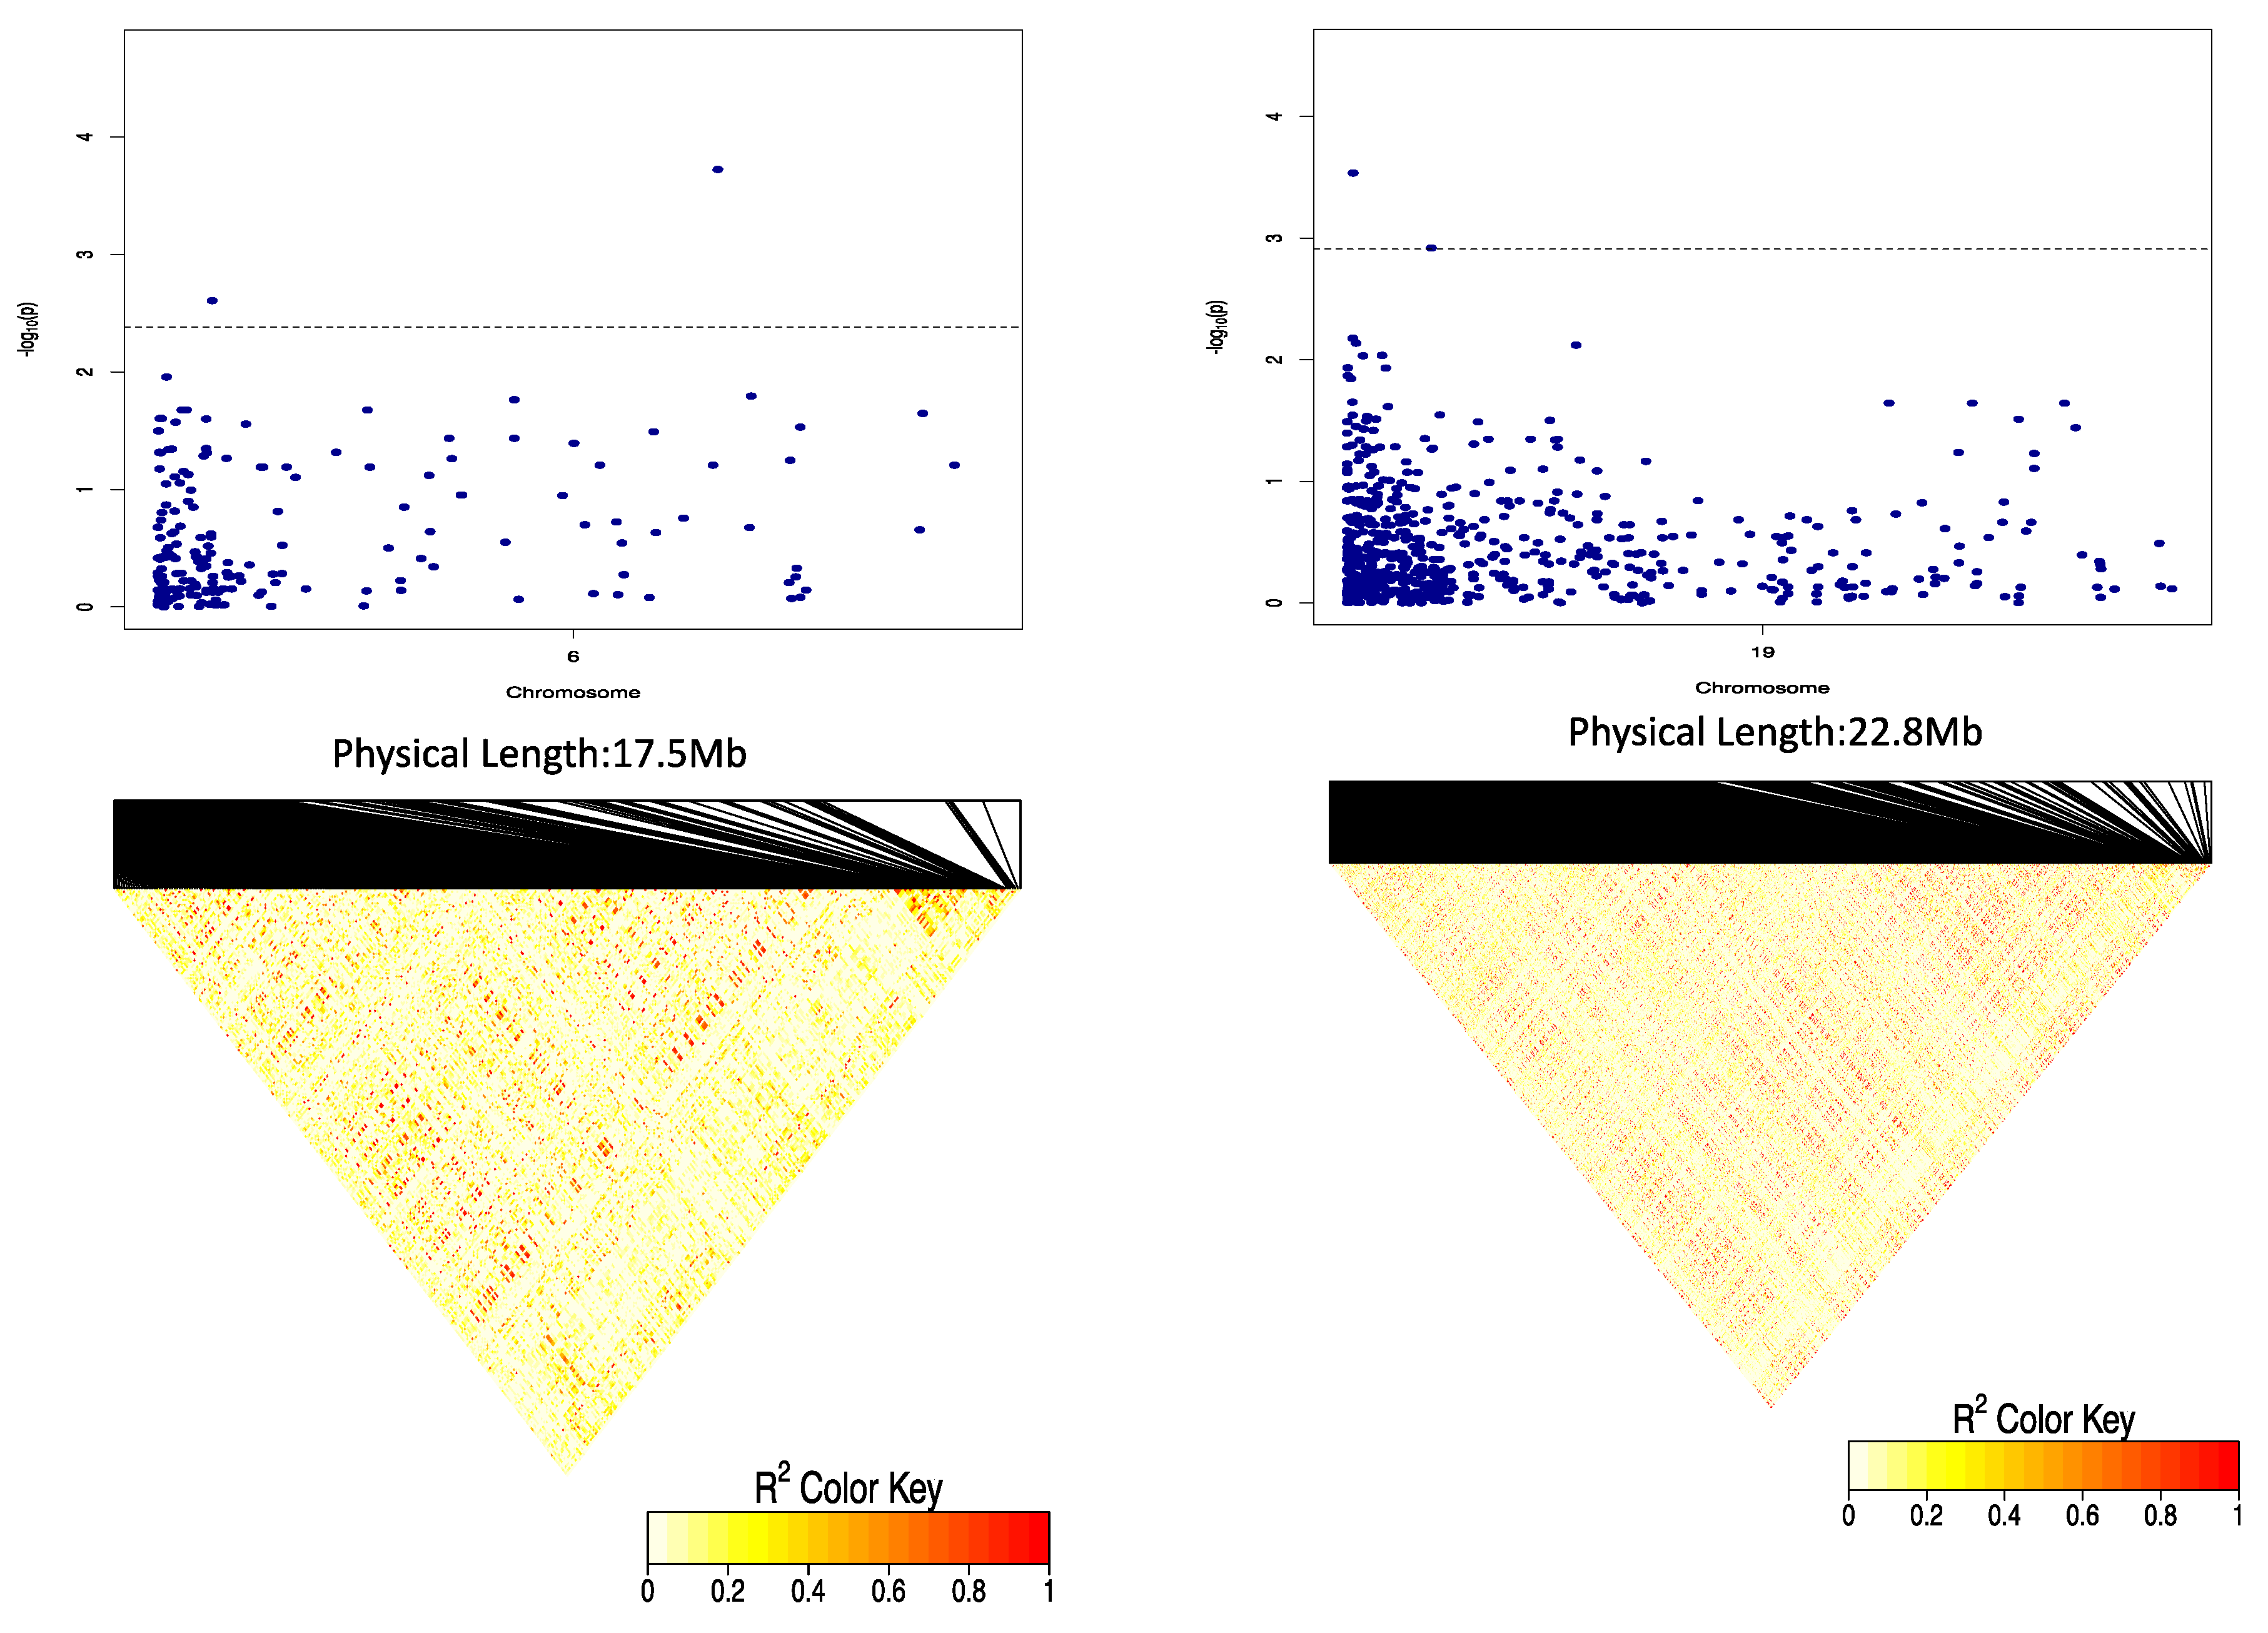
Three QTLs were identified to be associated with DMC, 2 of which showed significant QTL-by-Environment interactions (QEI). In a study to identify QTLs associated with cassava brown streak disease, Kayondo et al. [30] reported similar results with QTLs identified at different locations and highlighted the effects of many factors such as the panel size, harvest time and environmental conditions influencing QTL identification. To address this, the best approach for increasing the resolution of associations of traits and QTLs is to combine multi-location genotypic and phenotypic scores from different diversity panels [30,31]
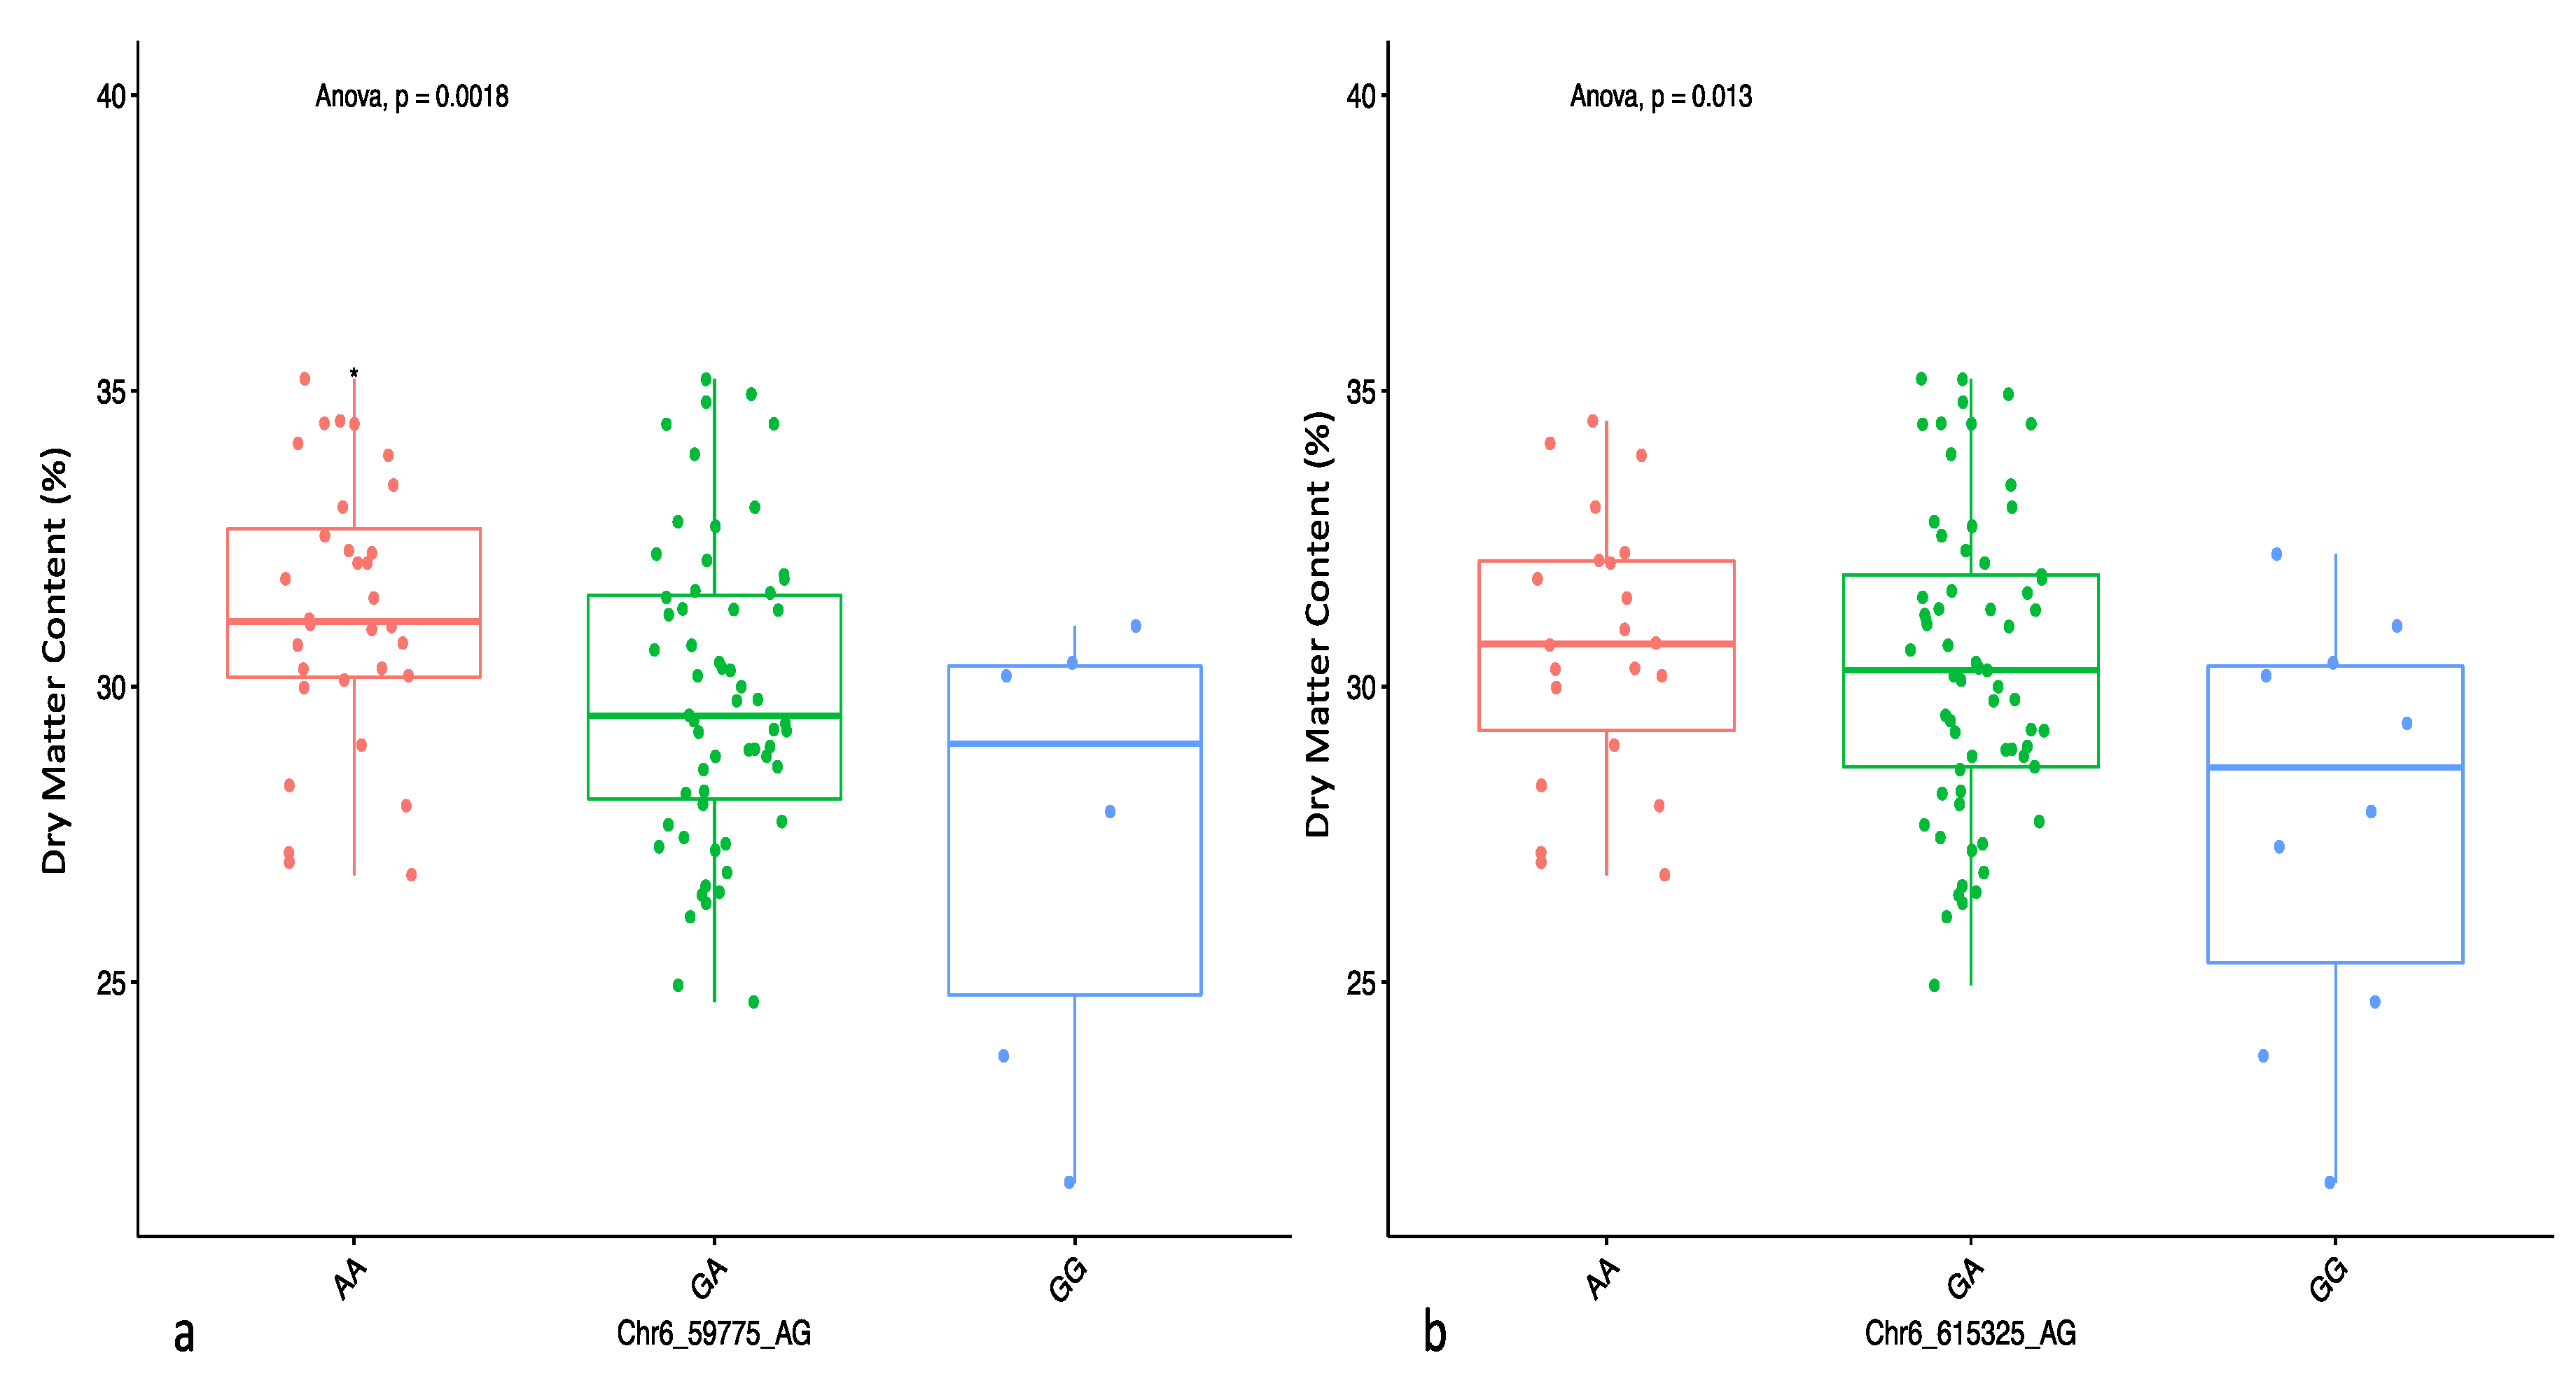
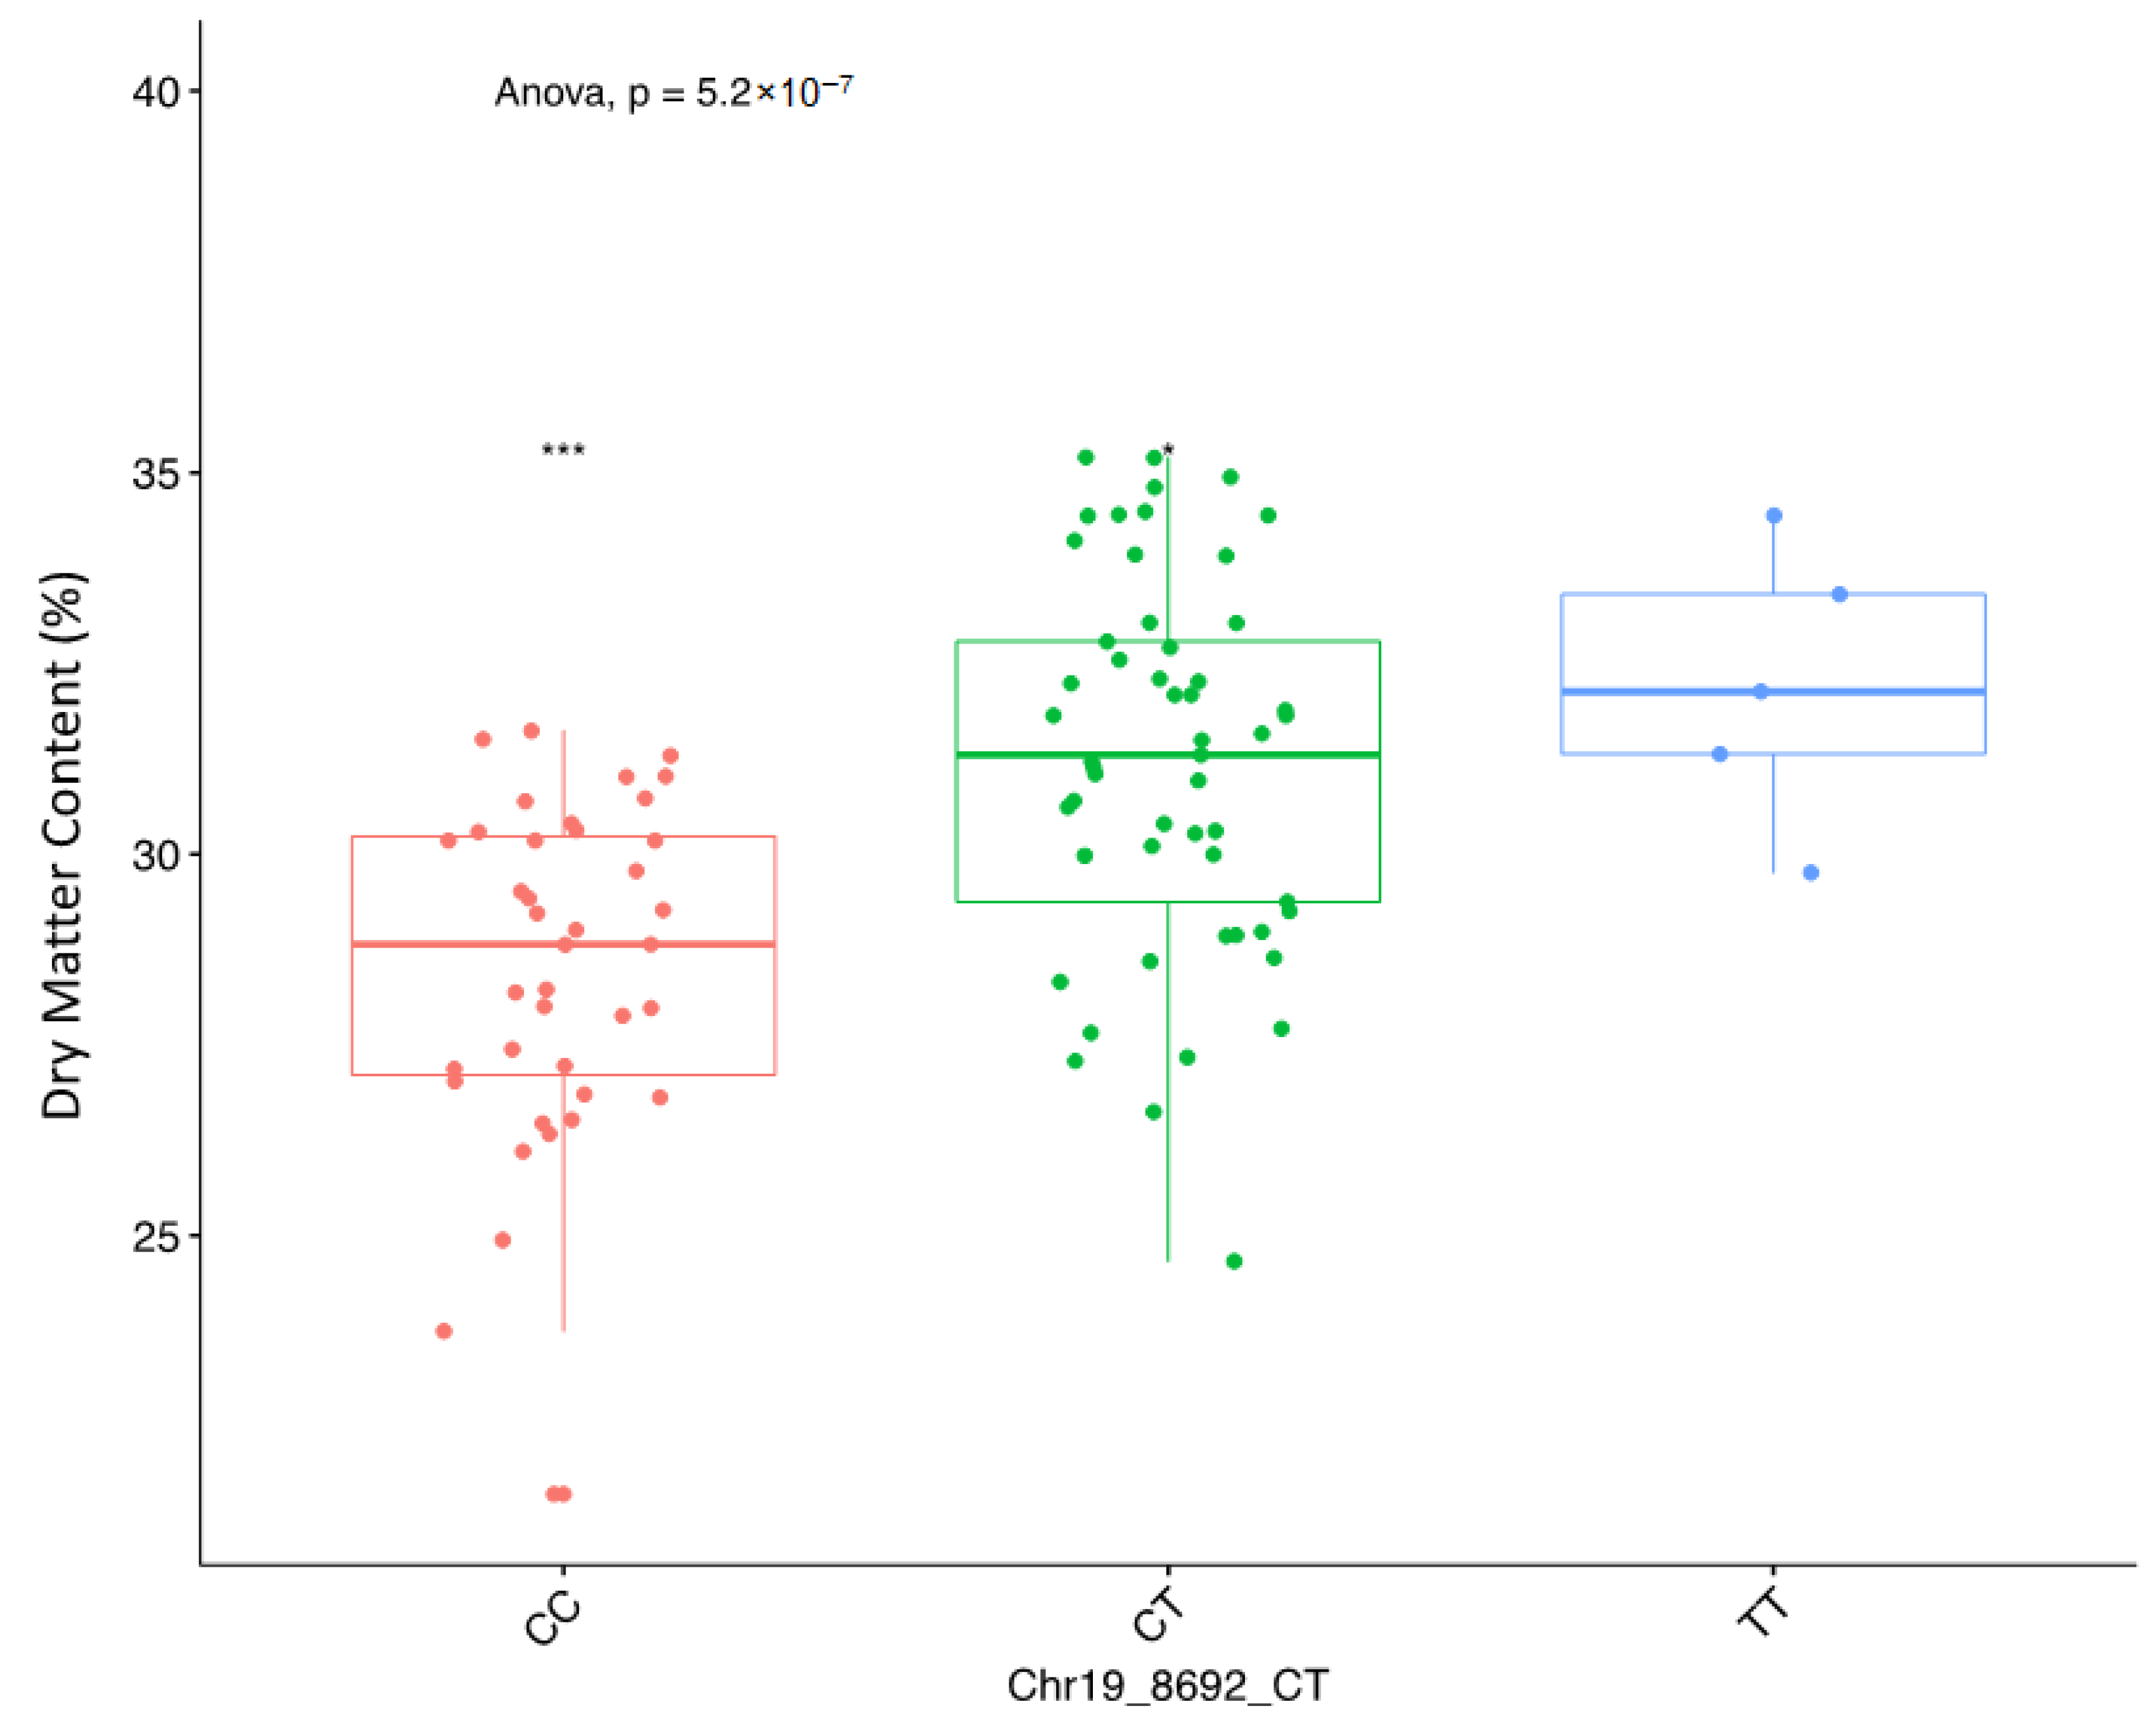
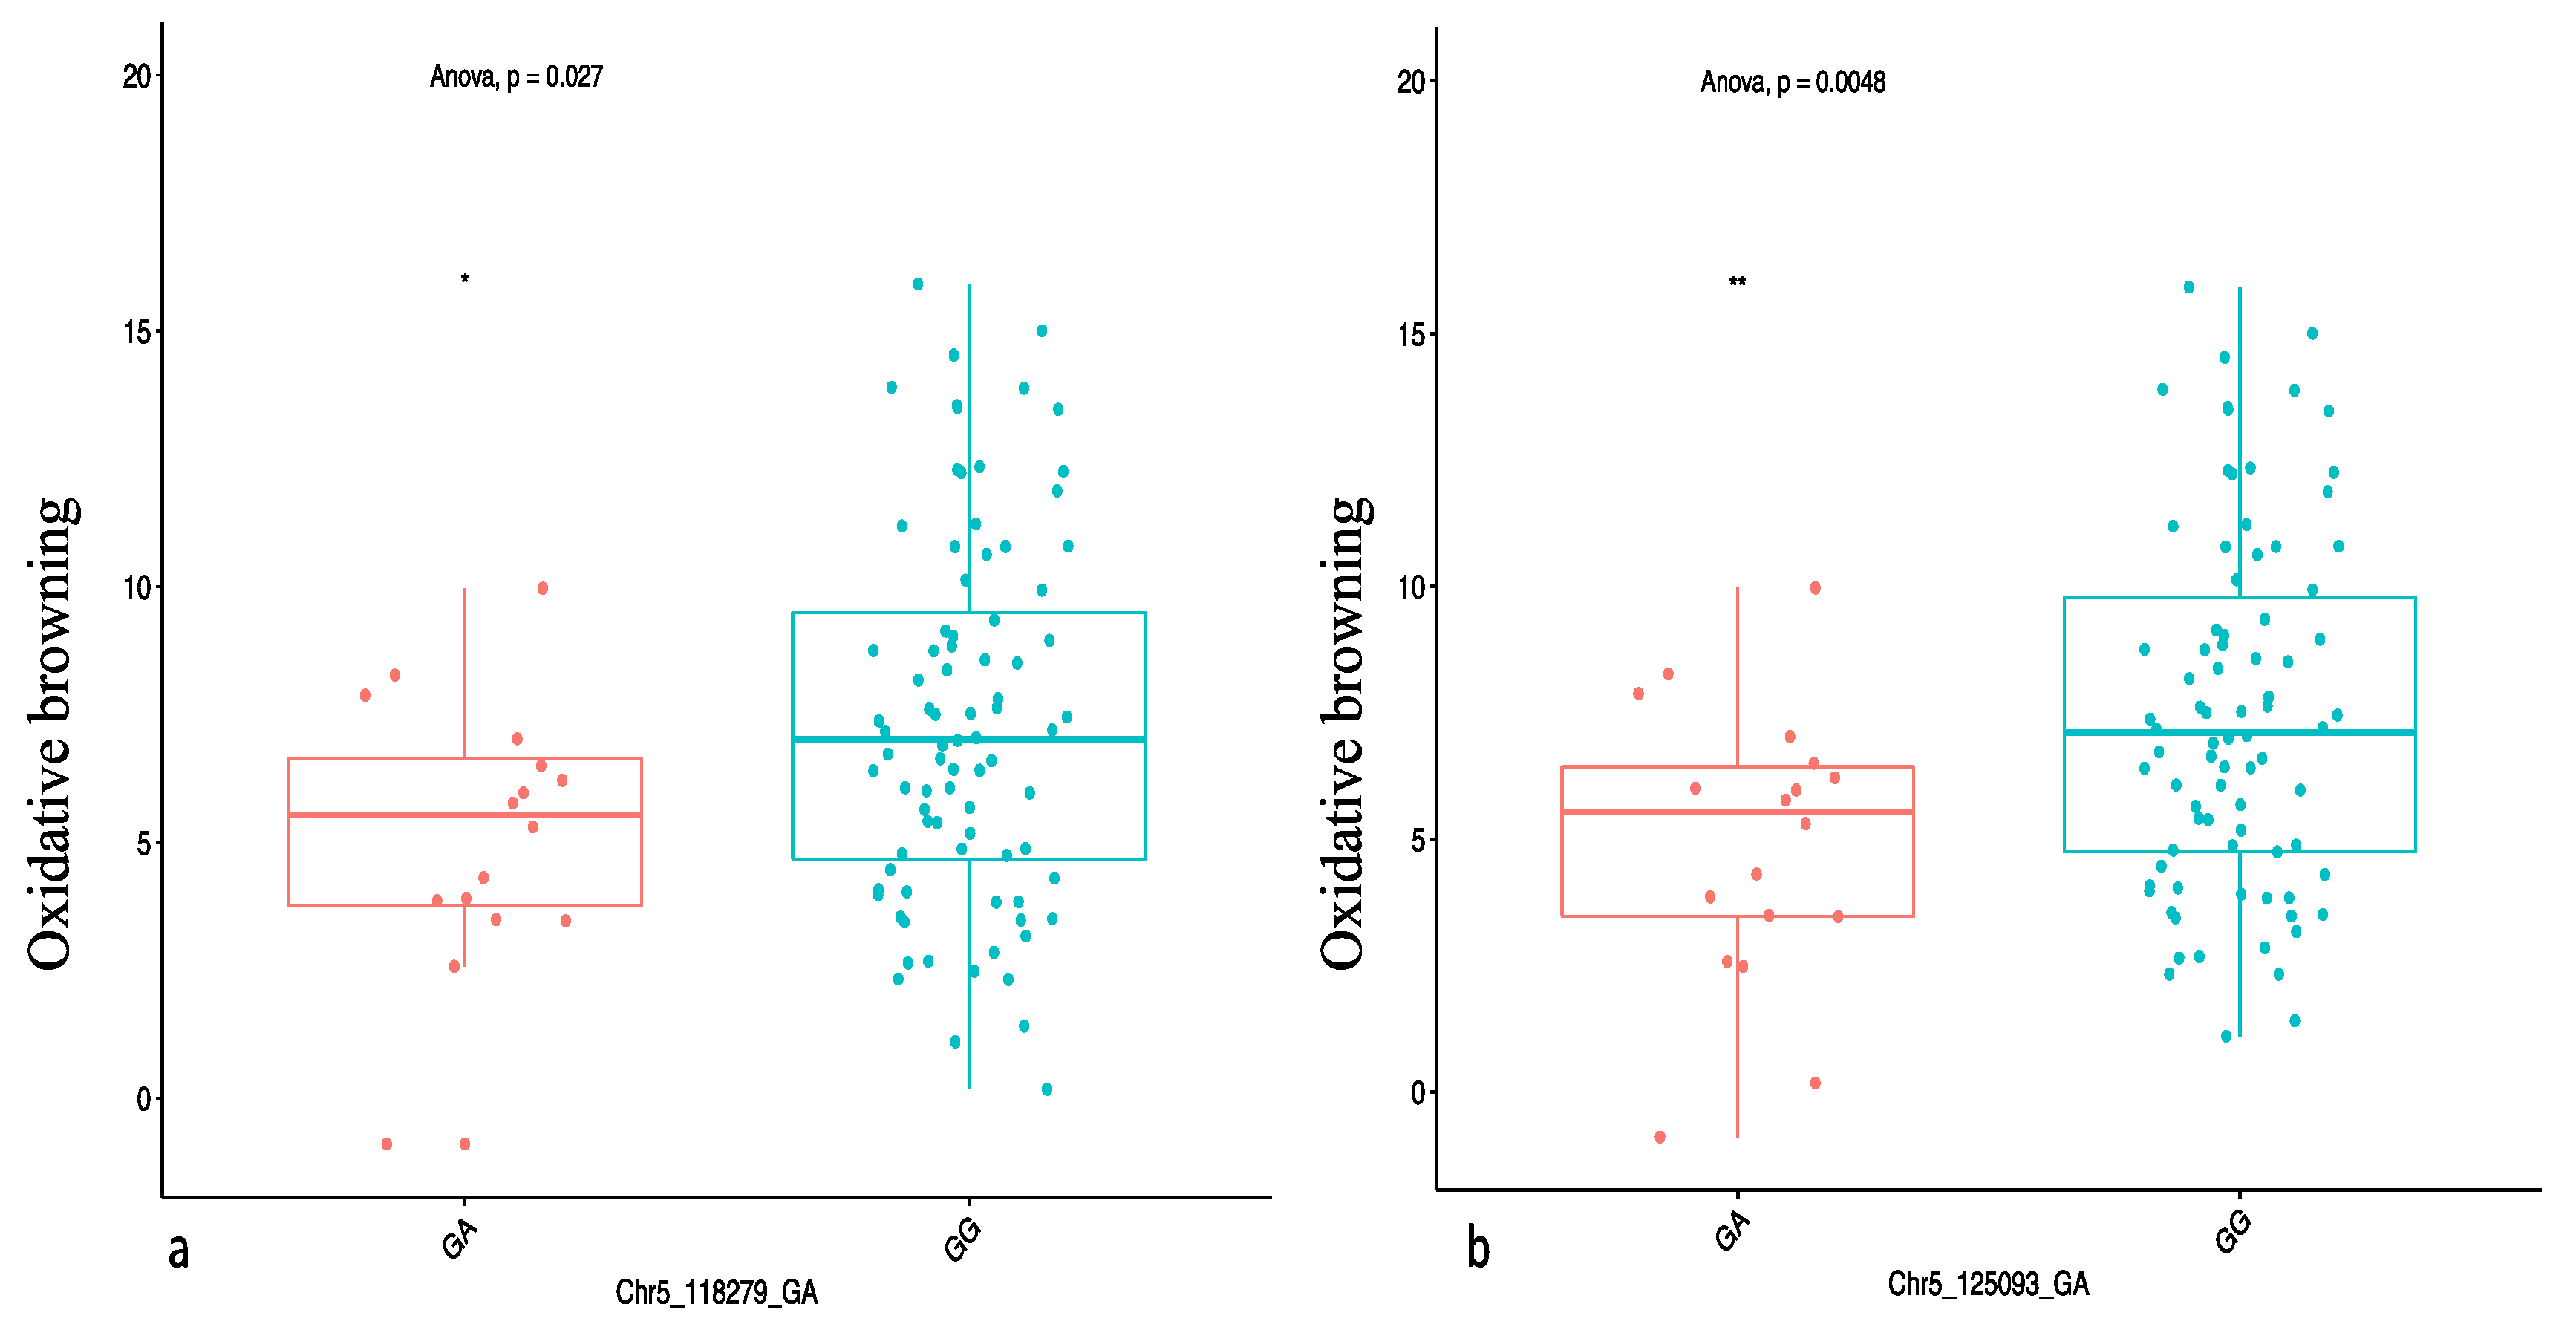
Using the marker effect, we observed allele AA on chromosome 6 and allele TT on chromosome 19 to be responsible for high DMC in the diversity panel used in the study. Information on marker effect through the segregation pattern is fundamental for marker validation and deployment in a breeding programme [32,33,34]. We also identified the heterozygous allele GA to be significantly associated with low OxB.
Our study also identified putative candidate genes within the QTL regions of the targeted traits. A total of 26 putative candidate genes were detected upstream and downstream of the SNP associated with DMC, of which 3 genes (Serine/threonine-protein kinase, Tetratricopeptide-like helical domain superfamily and Glycoside hydrolase family 9) were reported to play important roles in DMC. Serine/threonine-protein kinase (SnRK1) was reported to participate in the process of starch and sugar biosynthesis in potatoes and stimulated glucose pyrophosphorylase [35,36,37]. In potato (Solanum tuberosum) and wheat (Triticum aestivum), SnRK1 was reported to stimulate some enzymes in the starch biosynthesis pathways [38,39]. The Tetratricopeptide-like helical domain superfamily genes were reported to mediate protein–protein interactions and involved in the production of protein and starch that are the principal storage carbohydrates in plants [40,41]. The third important putative gene “Glycoside hydrolase family 9” was reported to be involved in diverse enzymatic metabolisms of carbohydrate compounds available in many plant tissues [42].
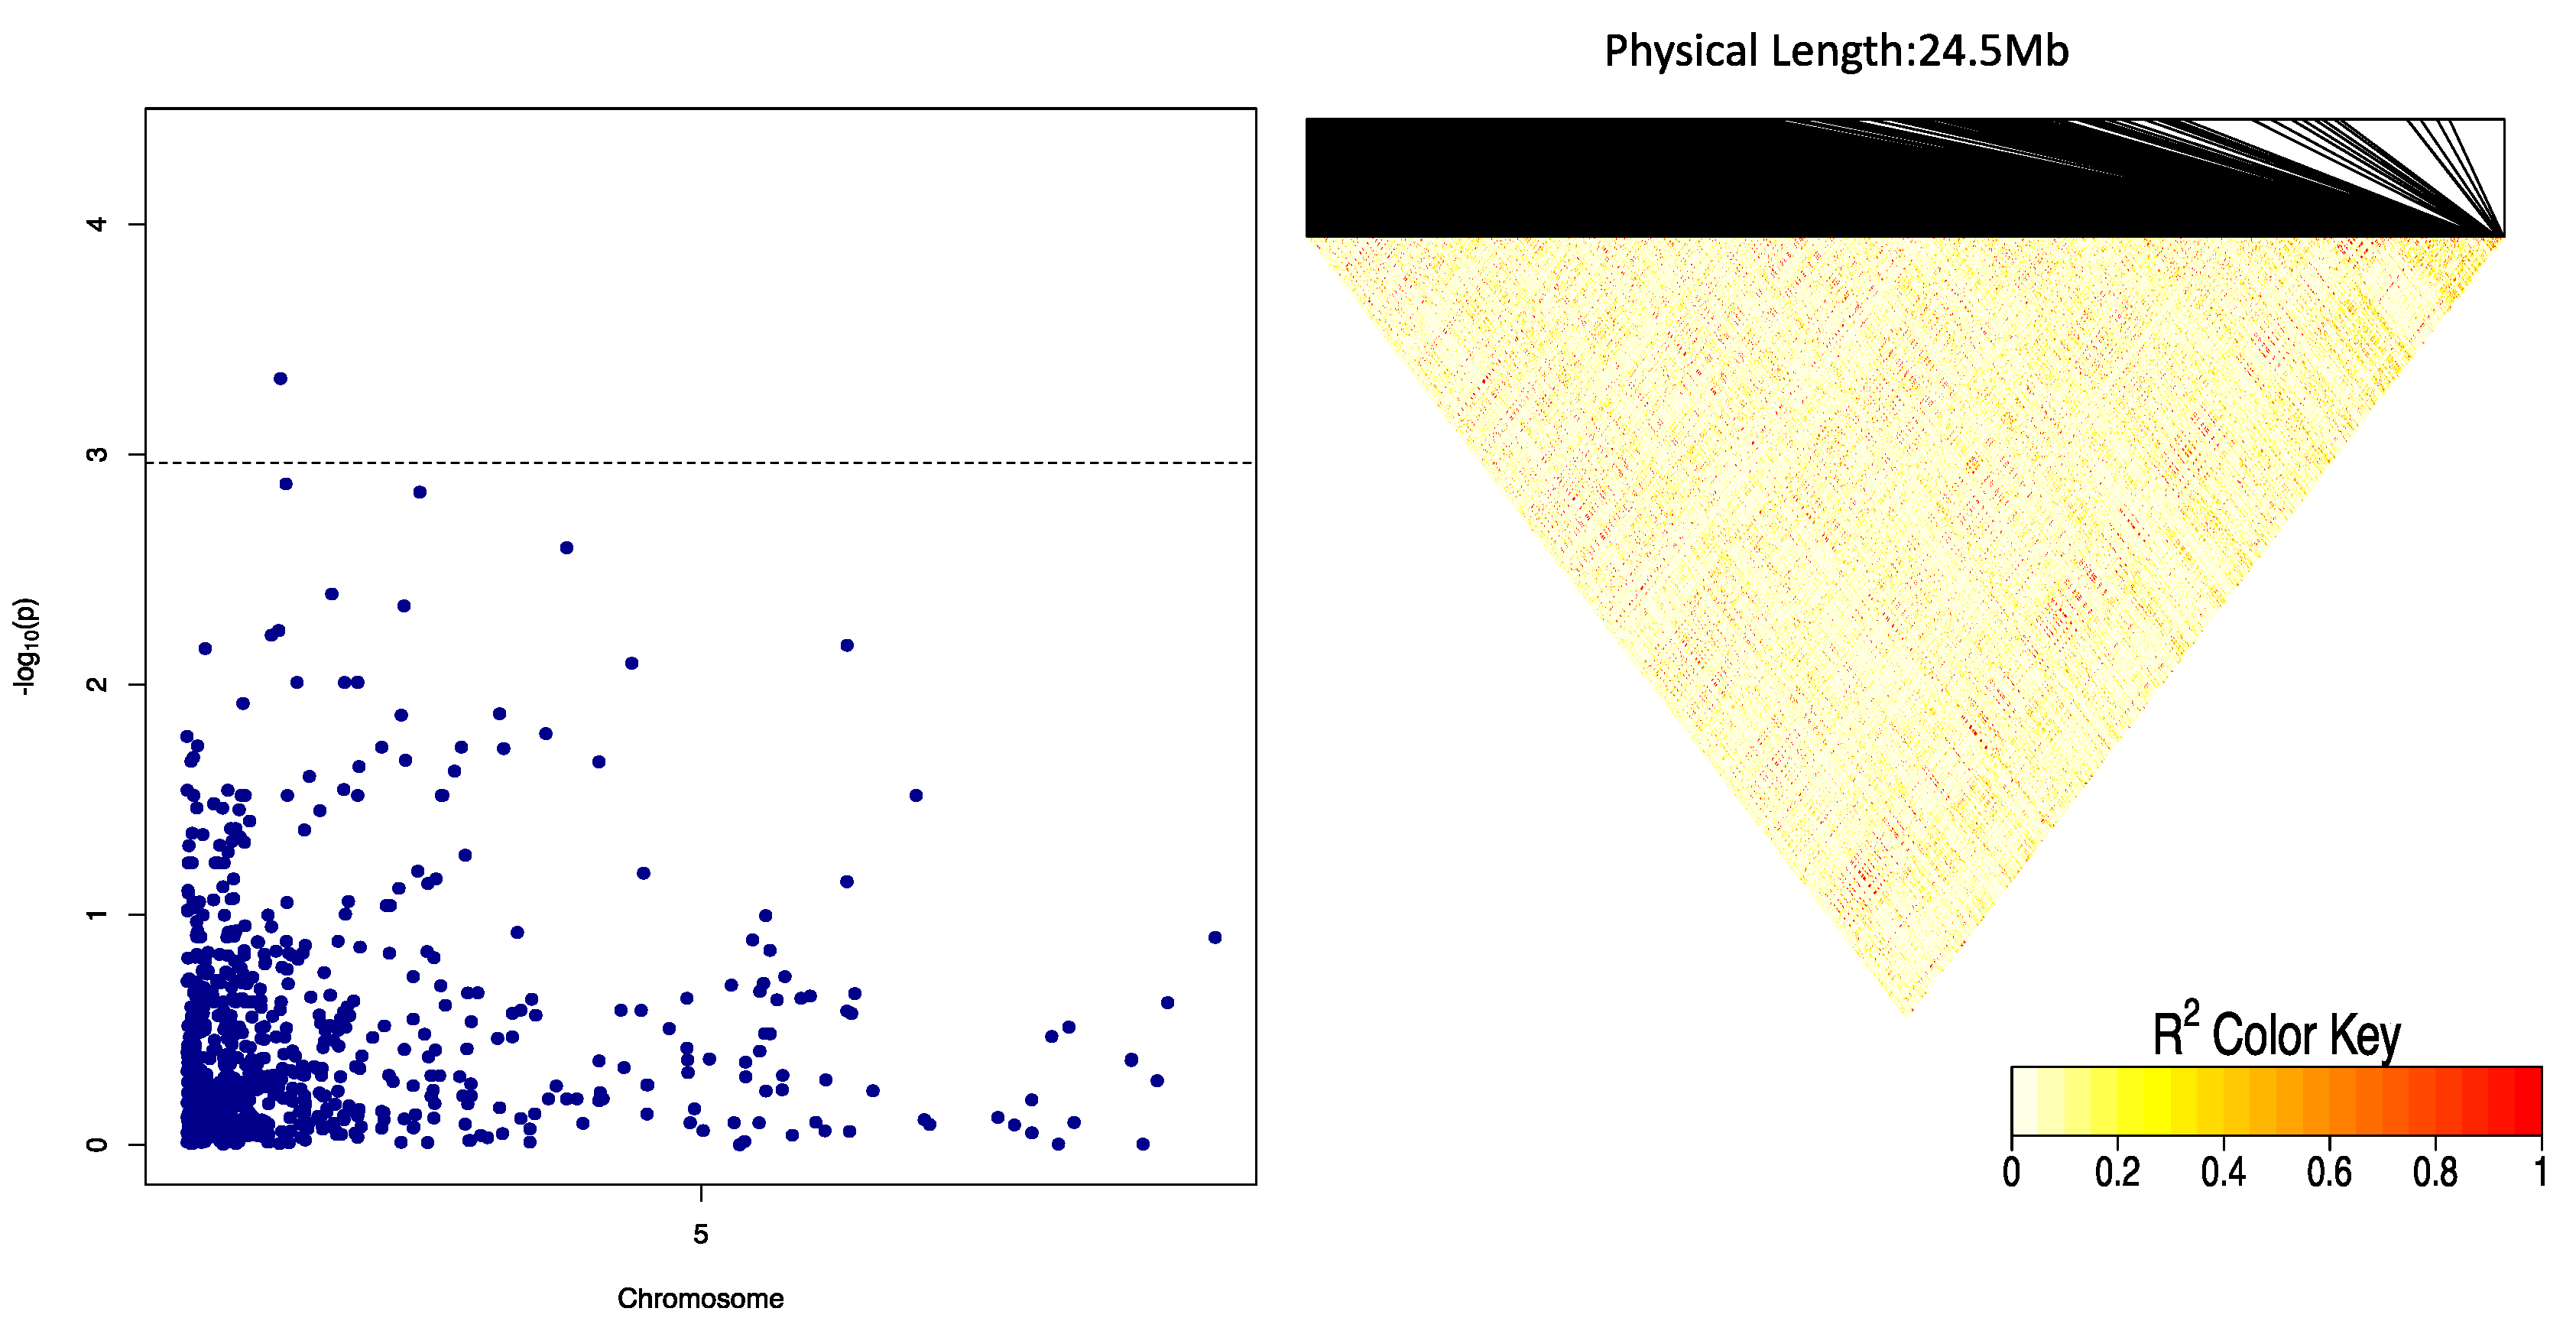
Six putative candidate genes were identified within the QTL regions of the peak SNPs detected for OxB. Of these 6 genes, the Thioesterase domain (IPR006683) has been reported to play a major role in tuber oxidative browning pathway [43]. The thioesterase domain is part of peroxisomes that contain soluble thioesterases (oxalate oxidase), which play a significant role in regulating flux of various substrates by releasing CoA from β-oxidation intermediates and products [44]. The oxalate oxidase is an enzyme containing manganese that catalyse the oxidation of oxalate to carbon dioxide by reducing the oxygen to hydrogen peroxide [45].
Tuber dry matter had a negative correlation with OxB. This desirable correlation suggests that selection for high DMC is expected to reduce enzymatic browning following oxidation of the tuber flesh. The genotypic factors greatly contribute for trait linkages and the negative correlations between the two phenotypic traits may be an indication of pleiotropism, genetic coupling and/or linkage disequilibrium with population structure effects [46]. However, our GWAS result did not reveal co-localized SNP markers for both traits to confirm that such an association is due to pleiotropy. In any case, the observed trait association provided the opportunity to select superior yam clones that indeed offer increased tuber dry matter and less tuber flesh enzymatic oxidation simultaneously. Our study identified significant and functional SNPs established at the genome level and revealed the known genes, which showed the presence of the disequilibrium between SNP markers and causative variants of DMC and OxB within or near identified genes. It is plausible that the allelic variation for oxidation observed in our study, which is associated with browning, is the result of enzymatic activities in yam, which includes polyphenol oxidase and peroxidase activities that play a major role in the phenolic content of yam tubers [47,48].
The functions and characteristics of some identified genes have not been explored. However, the identified genes from this study may provide new intuition into the genetic fundamentals of DMC and OxB in D. alata.

4. Materials and Methods

4.1. Plant Materials

A total of 100 D. alata clones, made up of breeding lines and landraces, obtained from the Yam Breeding Unit of the International Institute of Tropical Agriculture (IITA), Ibadan, Nigeria, were utilized for this study. The clones were planted at three locations in Nigeria in the 2018 growing season: Ibadan (72°4′ N, 3°54′ E), Ubiaja (6°39′ N, 6°22′ E) and Ikenne (6°58′ N, 4°0′ E). A lattice design with two replications was used in each of the three locations.

4.2. Phenotypic Data Collection

4.2.1. Tuber Dry Matter Content

Healthy yam tubers were sampled in each replication for dry matter determination. After harvest, the fresh tubers of each clone were cleaned with water to remove soil particles. Thereafter, the tubers were peeled and sliced into small sizes for easy oven drying; 100 g of freshly grated tuber flesh sample was weighed, put into a Kraft paper bag and dried at 105 °C for 16 h. After drying to s constant weight, the weight of each samples was recorded, and the DMC was determined using the following formula:
%   D r y   m a t t e r   c o n t e n t ( D M C ) = w e i g h t   o f   d r y   s a m p l e ( g )   w e i g h t   o f   w e t   s a m p l e ( g ) × 100

4.2.2. Oxidative Browning

After harvest, one well-developed and mature representative tuber was sampled in each replication. The sampled tuber was peeled, cut and chipped with a hand chipper to get small thickness size pieces (5 cm and 0.5 mm thickness). A chromameter (CR-410, Konica Minolta, Japan) was used to read the total colour of sampled pieces placed on a petri dish immediately after tubers cut and exposure to air (0 min) and 30 min after. The lightness (L*), red/green coordinate (a*) and yellow/blue coordinate (b*) parameters were recorded for each chroma meter reading for the determination of the total colour difference. A reference white porcelain tile was used to calibrate the chromameter before each determination [49].
The total colour difference (ΔE*) between all the three coordinates was determined using the following formula [50]:
Δ E * = [ Δ L * 2 + Δ a * 2 + Δ b * 2 ] 1 / 2
where ΔE* = the total colour difference, ΔL* = the difference in lightness and darkness (+ = lighter, − = darker, Δa* = the difference in red and green (+ = redder, − = greener) and Δb* = the difference in yellow and blue (+ = yellower, − = bluer).
Oxidative browning was estimated from the total variation from the difference in the final and initial colour reading as:
Oxidative   browning   ( OxB ) = Δ E F Δ E I
where ΔEF = the colour reader value at final time (30 min) and ΔEI = the initial colour reader value at 0 min.

4.3. DNA Extraction, Library Construction and SNP Calling

About one gram of fresh, healthy and young leaves was collected from a field-grown plant of each clone and placed on dry ice immediately. The leaf samples were lyophilized and kept at under room temperature. DNA was extracted from lyophilized leaf samples using the CTAB (cetyltrimethylammonium bromide) protocol [51] with slight modification. The DNA quality was assessed on 0.8% agarose gel and concentration was estimated using nanodrop (Amersham Bioscience, Piscataway, NJ, USA) following the manufacturer’s instructions. Subsequently, 50 µL of 50 ng/µL diluted DNA of each clone was prepared and sent to Diversity Arrays Technology (DArT) Pty Ltd., Australia for a genome scan using the DArT marker procedure described by Agre et al. [21].

4.3.1. Phenotypic Data Analysis

Phenotypic data obtained from the three locations were pooled and subjected to a linear mixed model analysis using the lme4 package implemented in R [52]. The best linear unbiased estimates (BLUEs) for three locations were obtained by considering clone main effect as fixed and location and replication effect as random in the mixed model as follows:
Y i j k l = μ + B ( E ) j ( i ) + G k + G E i j + e i j k l
where Yijkl = phenotypic observation for a trait, µ = grand mean, E = environment effect (location), B(E) = replication effect nested in location, G = genotype effect, GE = genotype by environment interaction, e = random residual error.

4.3.2. Genotypic Data Analysis

Multiple sequences were generated by the DArTSeq platform using proprietary analytical pipelines (Diversity Array Technology, Canberra, Australia) and mapped to the Dioscorea alata v2 reference genome assembly in preparation [20] (used with permission) using a local BLAST server. This produced a raw dataset of 22,140 SNPs that were subjected to quality control filtering with the following criteria: markers with low sequence depth <5; SNP markers with missing values >20%; minor allele frequency (MAF) <0.05; genotype quality <20; and heterozygosity >50; which resulted in 9687 good-quality SNPs. These filtered 9687 SNPs were subjected to summary statistics such as minor allele frequency, polymorphism information content (PIC), observed and expected heterozygosity (OH/EH) using PLINK 2 [53]. The SNP distributions and density across linkage groups obtained by using bin.size1e6 for scaling the physical position from bp to Mb in the CMplot package [54].

4.3.3. Linkage Decay, GWAS Analysis and Gene Annotation

A mixed linear model implemented in the GWASpoly package in R was used to compute associations using the mixed model y = X b + Z u + e [55], where y is the vector of the phenotypic observations (BLUEs for DMC and OxB), X represents the SNP markers (fixed effect), Z represents the random kinship (co-ancestry) matrix, b is a vector representing the estimated SNP effects, u is a vector representing random additive genetic effects, and e is the vector for random residual errors. A co-ancestry matrix from ADMIXTURE and kinship were included as covariates in the GWASpoly to account for population structure and familial relatedness, respectively, to reduce spurious associations. Four different gene action models (additive, general, dominant alternative (1-dom-alt) and dominant reference (1-dom-ref)) were considered for the trait association study [56]. The GWAS analysis was performed using BLUEs across locations and significant QTLs were determined based on the p-value (p < 0.05) adjusted by the Bonferroni correction implemented in GwasPoly [56].
Quantile–quantile (QQ) plots were generated by plotting the negative logarithms (−log10) of the p-values against their expected p-values to fit the appropriateness of the GWAS model with the null hypothesis of no association and to determine how well the models accounted for population structure. The Manhattan plot was created for visualizing GWAS on the entire genome and zoom mapping was performed on a particular chromosome after identifying a significant SNP marker.
The marker effect or SNP contribution was estimated for the significant SNPs using a multiple regression analysis using lm function implemented in R where the trait was considered as a response variable while the SNP markers above the Bonferroni threshold for the trait the independent variable.
For gene annotation, linkage disequilibrium (LD) was evaluated between the significant SNPs at 5 kb (downstream and upstream) using the LDheatmap library [57]; the generic feature format (GFF3) of the reference genome was used to identify the main gene in the inter-genic region using the SNPReff. Public database Interpro, European Molecular Biology Laboratory-European Bioinformatics Institute (EMBL-EBI) [58] was used to determine the functions of the genes associated with the different SNPs identified.

5. Conclusions

Tuber dry matter and oxidative browning are key quality attributes that determine cultivar acceptability in water yam. The results of this study represent significant progress toward dissecting the genetic architecture of these two key traits in yam breeding. We reported three SNP markers associated with DMC and two SNP markers for OxB. Markers associated with these key traits showed significant phenotypic variation, which could be useful to breeders for marker-assisted selection (MAS) in the yam breeding program. This study provides the basis for a long-term collective exploration to determine valuable genes and alleles from the yam and consequently yam varieties’ improvement.

Supplementary Materials

The following are available online at https://www.mdpi.com/2223-7747/9/8/969/s1, Figure S1a: Single nucleotide polymorphism (SNP) distribution and density plot across the D. alata reference genome before filtering. Figure S1b: Single nucleotide polymorphism (SNP) distribution and density plot across the D. alata reference genome after filtering.

Author Contributions

Conceptualization, A.A.; Data curation, P.A.; Formal analysis, P.A.; Funding acquisition, A.A., R.A.; Methodology, C.G., R.M. and A.A.; Supervision, A.A.; Validation, A.A.; Writing—original draft, C.G., P.A. and A.A.; Writing—review & editing, C.G., P.A., R.M., A.E., V.A., R.B., R.A. and A.A. All authors have read and approved the proof version to be published.

Funding

We acknowledge funding from IITA through a research grant (OPP1052998) to the AfricaYam project received from the Bill and Melinda Gates Foundation.

Acknowledgments

The scholarship provided to the first author by the Pan African University to pursue this study as part of the candidate’s Ph.D. research is gratefully acknowledged. We acknowledge Jessen Bredeson and collaborators in the NSF-BREAD funded D. alata genomic resources project for early access to the v2 genome assembly and for permission to use it in this study. Special thanks to Kwabena Darkwa for his critical review and suggestions during the manuscript preparation and Flora Assibe for assistance provided during the field evaluation.

Conflicts of Interest

The authors declare no conflict of interest.

Abbreviations

ANOVAAnalysis of variance
CTABCetyltrimethylammonium bromide
DAPCDiscriminant analysis of principal components
DArTDiversity arrays technology
DMCDry matter content
DNADeoxyribonucleic acid
EHExpected heterozygosity
EMBL-EBIEuropean Bioinformatics Institute
GWASGenome-wide association study
IITAInternational institute of tropical agriculture
LDLinkage disequilibrium
MAFMinor allele frequency
MASMarker assisted selection
OHObserved heterozygosity
OxBOxidative browning
PICPolymorphism information content
QQQuantile–quantile
QTLQuantitative trait locus
SNPSingle nucleotide polymorphism

References

  1. Mahalakshmi, V.; Ng, Q.; Atalobhor, J.; Ogunsola, D.; Lawson, M.; Ortiz, R. Development of a West African yam Dioscorea spp. core collection. Genet. Resour. Crop Evol. 2007, 54, 1817–1825. [Google Scholar] [CrossRef]
  2. Ghosh, S.; Patil, S.; Ahire, M.; Kitture, R.; Kale, S.; Pardesi, K.; Chopade, B.A. Synthesis of silver nanoparticles using Dioscorea bulbifera tuber extract and evaluation of its synergistic potential in combination with antimicrobial agents. Int. J. Nanomed. 2012, 7, 483. [Google Scholar]
  3. FAOSTAT. Food and Agriculture Organization of the United Nations Statistics Database, FAOSTAT. 2017. Available online: http://www.fao.org/faostat/en/#data/QC (accessed on 21 June 2020).
  4. Hahn, S.K.; Osiru, D.S.O.; Akoroda, M.O.; Otoo, J.A. Yam production and its future prospects. Outlook Agric. 1987, 16, 105–110. [Google Scholar] [CrossRef]
  5. Baah, F.D.; Maziya-Dixon, B.; Asiedu, R.; Oduro, I.; Ellis, W.O. Nutritional and biochemical composition of D. alata (Dioscorea spp.). Tubers 2009, 7, 373–378. [Google Scholar]
  6. Asiedu, R.; Wanyera, N.; Ng, S.Y.C.; Ng, N.Q. Yams; Cambridge University Press: Cambridge, UK, 1997; Volume 2, pp. 57–66. [Google Scholar]
  7. Egesi, C.N.; Asiedu, R.; Egunjobi, J.K.; Bokanga, M. Genetic diversity of organoleptic properties in water yam (Dioscorea alata L). J. Sci. Food Agric. 2003, 83, 858–865. [Google Scholar] [CrossRef]
  8. Lebot, V.; Malapa, R.; Molisalé, T.; Marchand, J.L. Physico-chemical characterisation of yam (Dioscorea alata L.) tubers from Vanuatu. Genet. Resour. Crop Evol. 2006, 53, 1199–1208. [Google Scholar] [CrossRef]
  9. Shittu, T.A.; Olaitan, O.F. Functional effects of dried okra powder on reconstituted dried yam flake and sensory properties of ojojo—A fried yam (Dioscorea alata L.) snack. J. Food Sci. Technol. 2014, 51, 359–364. [Google Scholar] [CrossRef] [Green Version]
  10. Martin, F.W.; Ruberte, R. Polyphenol of Dioscorea alata (yam) tubers associated with oxidative browning. J. Agric. Food Chem. 1976, 24, 67–70. [Google Scholar] [CrossRef]
  11. Osagie, A.U. The Yam Tuber in Storage; Postharvest Research Unit, University of Benin: Benin City, Nigeria, 1992; pp. 174–191. [Google Scholar]
  12. Ukpabi, U.J.; Omodamiro, R.M.; Ikeorgu, J.G.; Asiedu, R. Sensory evaluation of amala from improved water yam (Dioscorea alata) genotypes in Nigeria. Afr. J. Biotechnol. 2008, 7, 1134–1138. [Google Scholar]
  13. Dufie, W.M.F.; Oduro, I.; Ellis, W.O.; Asiedu, R.; Maziya-Dixon, B. Potential health benefits of water yam (Dioscorea alata). Food Funct. 2013, 4, 1496–1501. [Google Scholar] [CrossRef]
  14. Sartie, A.; Asiedu, R. Segregation of vegetative and reproductive traits associated with tuber yield and quality in water yam (Dioscorea alata L.). Afr. J. Biotechnol. 2014, 13, 2807–2818. [Google Scholar]
  15. Asiedu, R.; Ng, S.Y.C.; Bai, K.V.; Ekanayake, I.J.; Wanyera, N.M.W. Genetic improvement. Food Yams 1998, 21, 63–104. [Google Scholar]
  16. Siqueira, M.V.; Bonatelli, M.L.; Günther, T.; Gawenda, I.; Schmid, K.J.; Pavinato, V.A.; Veasey, E.A. Water yam (Dioscorea alata L.) diversity pattern in Brazil: An analysis with SSR and morphological markers. Genet. Resour. Crop Evol. 2014, 61, 611–624. [Google Scholar] [CrossRef]
  17. Sartie, A.; Asiedu, R.; Franco, J. Genetic and phenotypic diversity in a germplasm working collection of cultivated tropical yams (Dioscorea spp.). Genet. Resour. Crop Evol. 2012, 59, 1753–1765. [Google Scholar] [CrossRef]
  18. Biscarini, F.; Cozzi, P.; Casella, L.; Riccardi, P.; Vattari, A.; Orasen, G.; Perrini, R.; Tacconi, G.; Tondelli, A.; Biselli, C.; et al. Genome-wide association study for traits related to plant and grain morphology, and root architecture in temperate rice accessions. PLoS ONE 2016, 11, e0155425. [Google Scholar] [CrossRef]
  19. Pétro, D.; Onyeka, T.J.; Etienne, S.; Rubens, S. An intraspecific genetic map of water yam (Dioscorea alata L.) based on AFLP markers and QTL analysis for anthracnose resistance. Euphytica 2011, 179, 405–416. [Google Scholar] [CrossRef]
  20. Bredeson, J.V.; Lyons, J.B.; Shu, S.; Ogunleye, I.; Bhattacharjee, R.; Obidiegwu, J.; Rokhsar, D.S. “The Genome Sequence of D. alata,” Manuscript in Preparation. Assembled Genome Sequence. Available online: https://phytozome-next.jgi.doe.gov/info/Dalata_v2_1 (accessed on 21 June 2020).
  21. Agre, P.; Asibe, F.; Darkwa, K.; Edemodu, A.; Bauchet, G.; Asiedu, R.; Asfaw, A. Phenotypic and molecular assessment of genetic structure and diversity in a panel of winged yam (Dioscorea alata) clones and cultivars. Sci. Rep. 2019, 9, 1–11. [Google Scholar] [CrossRef] [Green Version]
  22. Wanasundera, J.P.D.; Ravindran, G. Nutritional assessment of yam (Dioscorea alata) tubers. Plant Food Hum. Nutr. 1994, 46, 33–39. [Google Scholar] [CrossRef]
  23. Lebot, V.; Trilles, B.; Noyer, J.L.; Modesto, J. Genetic relationships between Dioscorea alata L. cultivars. Genet. Resour. Crop Evol. 1988, 45, 499–509. [Google Scholar] [CrossRef]
  24. Rabbi, I.Y.; Udoh, L.I.; Wolfe, M.; Parkes, E.Y.; Gedil, M.A.; Dixon, A.; Kulakow, P. Genome-wide association mapping of correlated traits in cassava: Dry matter and total carotenoid content. Plant Genome 2017, 10, 1–14. [Google Scholar] [CrossRef]
  25. Wolfe, M.D.; Rabbi, I.Y.; Egesi, C.; Hamblin, M.; Kawuki, R.; Kulakow, P.; Jannink, J.L. Genome-wide association and prediction reveals genetic architecture of cassava mosaic disease resistance and prospects for rapid genetic improvement. Plant Genome 2016, 9, 1–13. [Google Scholar] [CrossRef] [Green Version]
  26. Zhang, S.; Chen, X.; Lu, C.; Ye, J.; Zou, M.; Lu, K.; Ma, P.A. Genome-wide association studies of 11 agronomic traits in cassava (Manihot esculenta Crantz). Front. Plant Sci. 2018, 9, 503. [Google Scholar] [CrossRef] [Green Version]
  27. Uitdewilligen, J.G.; Wolters, A.M.A.; Bjorn, B.; Borm, T.J.; Visser, R.G.; van Eck, H.J. A next-generation sequencing method for genotyping-by-sequencing of highly heterozygous autotetraploid potato. PLoS ONE 2013, 8, e62355. [Google Scholar] [CrossRef] [Green Version]
  28. Björn, B.; Keizer, P.L.; Paulo, M.J.; Visser, R.G.; Van Eeuwijk, F.A.; Van Eck, H.J. Identification of agronomically important QTL in tetraploid potato cultivars using a marker–trait association analysis. Theor. Appl. Genet. 2014, 127, 731–748. [Google Scholar]
  29. Yu, D.; Lane, S.N. Urban fluvial flood modelling using a two-dimensional diffusion-wave treatment, part 2: Development of a sub-grid-scale treatment. Hydrol. Proccess. 2006, 20, 1567–1583. [Google Scholar] [CrossRef]
  30. Kayondo, S.I.; Del Carpio, D.P.; Lozano, R.; Ozimati, A.; Wolfe, M.; Baguma, Y.; Jannink, J.L. Genome-wide association mapping and genomic prediction for CBSD resistance in Manihot esculenta. Sci. Rep. 2018, 8, 1–11. [Google Scholar] [CrossRef] [Green Version]
  31. Jing, Y.; Zhao, X.; Wang, J.; Teng, W.; Qiu, L.; Han, Y.; Li, W. Identification of the genomic region underlying seed weight per plant in Soybean (Glycine max L. Merr.) via high-throughput single-nucleotide polymorphisms and a genome-wide association study. Front. Plant Sci. 2018, 9, 1392. [Google Scholar] [CrossRef]
  32. Knoll, J.; Ejeta, G. Marker-assisted selection for early-season cold tolerance in sorghum: QTL validation across populations and environments. Theor. Appl. Genet. 2008, 116, 541–553. [Google Scholar] [CrossRef]
  33. Li, L.; Tacke, E.; Hofferbert, H.R.; Lübeck, J.; Strahwald, J.; Draffehn, A.M.; Gebhardt, C. Validation of candidate gene markers for marker-assisted selection of potato cultivars with improved tuber quality. Theor. Appl. Genet. 2013, 126, 1039–1052. [Google Scholar] [CrossRef] [Green Version]
  34. Pryce, J.E.; Bolormaa, S.; Chamberlain, A.J.; Bowman, P.J.; Savin, K.; Goddard, M.E.; Hayes, B.J. A validated genome-wide association study in 2 dairy cattle breeds for milk production and fertility traits using variable length haplotypes. J. Dairy Sci. 2010, 93, 3331–3345. [Google Scholar] [CrossRef] [Green Version]
  35. Geigenberger, P. Regulation of sucrose to starch conversion in growing potato tubers. J. Exp. 2003, 54, 457–465. [Google Scholar] [CrossRef] [Green Version]
  36. Tiessen, A.; Prescha, K.; Branscheid, A.; Palacios, N.; McKibbin, R.; Halford, N.G.; Geigenberger, P. Evidence that SNF1-related kinase and hexokinase are involved in separate sugar-signalling pathways modulating post-translational redox activation of ADP-glucose pyrophosphorylase in potato tubers. Plant J. 2003, 35, 490–500. [Google Scholar] [CrossRef]
  37. McKibbin, R.S.; Muttucumaru, N.; Paul, M.J.; Powers, S.J.; Burrell, M.M.; Coates, S.; Halford, N.G. Production of high-starch, low-glucose potatoes through over-expression of the metabolic regulator SnRK1. Plant Biotechnol. J. 2006, 4, 409–418. [Google Scholar] [CrossRef]
  38. Purcell, P.C.; Smith, A.M.; Halford, N.G. Antisense expression of a sucrose non-fermenting-1-related protein kinase sequence in potato results in decreased expression of sucrose synthase in tubers and loss of sucrose-inducibility of sucrose synthase transcripts in leaves. Plant J. 1998, 14, 195–202. [Google Scholar] [CrossRef] [Green Version]
  39. Laurie, S.; McKibbin, R.S.; Halford, N.G. Antisense SNF1-related (SnRK1) protein kinase gene represses transient activity of an α-amylase (α-Amy2) gene promoter in cultured wheat embryos. J. Exp. 2003, 54, 739–747. [Google Scholar] [CrossRef] [Green Version]
  40. Lane, B.G. Oxalate, germin, and the extracellular matrix of higher plants. FASEB J. 1994, 8, 294–301. [Google Scholar] [CrossRef]
  41. Woo, E.J.; Dunwell, J.M.; Goodenough, P.W.; Marvier, A.C.; Pickersgill, R.W. Germin is a manganese containing homohexamer with oxalate oxidase and superoxide dismutase activities. Nat. Struct. Biol. 2000, 7, 1036–1040. [Google Scholar]
  42. Minic, Z. Physiological roles of plant glycoside hydrolases. Planta 2008, 227, 723. [Google Scholar] [CrossRef]
  43. Cantu, D.C.; Chen, Y.; Reilly, P.J. Thioesterases: A new perspective based on their primary and tertiary structures. Protein Sci. 2010, 19, 1281–1295. [Google Scholar] [CrossRef] [Green Version]
  44. Carrier, D.J.; Van Roermund, C.W.; Schaedler, T.A.; Rong, H.L.; IJlst, L.; Wanders, R.J.; Baker, A. Mutagenesis separates ATPase and thioesterase activities of the peroxisomal ABC transporter, Comatose. Sci. Rep. 2019, 9, 1–13. [Google Scholar] [CrossRef] [Green Version]
  45. REQUENA, L.; BORNEMANN, S. Barley (Hordeum vulgare) oxalate oxidase is a manganese-containing enzyme. Biochem. J. 1999, 343, 185–190. [Google Scholar] [CrossRef] [PubMed]
  46. Asfaw, A.; Ambachew, D.; Shah, T.; Blair, M.W. Trait associations in diversity panels of the two common bean (Phaseolus vulgaris L.) gene pools grown under well-watered and water-Stress conditions. Front. Plant Sci. 2017, 8, 733. [Google Scholar] [CrossRef] [PubMed]
  47. Akissoé, N.; Hounhouigan, J.; Mestres, C.; Nago, M. How blanching and drying affect the colour and functional characteristics of yam (Dioscorea cayenensis-rotundata) flour. Food Chem. 2003, 82, 257–264. [Google Scholar] [CrossRef]
  48. Mestres, C.; Dorthe, S.; Akissoé, N.; Hounhouigan, J.D. Prediction of sensorial properties (color and taste) of amala, a paste from yam chips flour of West Africa, through flour biochemical properties. Plant Food. Hum. Nutr. 2004, 59, 93–99. [Google Scholar] [CrossRef]
  49. Cavalcante, P.T.; Dondi, M.; Ercolani, G.; Guarini, G.; Melandri, C.; Raimondo, M.; Almendra, E.R. The influence of microstructure on the performance of white porcelain stoneware. Ceram. Int. 2004, 30, 953–963. [Google Scholar] [CrossRef] [Green Version]
  50. Hoffmann, G. Cielab Color Space. Wik., Encycl. Mht. 2003. Available online: http://docs-hoffmann.de/cielab03022003.pdf (accessed on 21 June 2020).
  51. Porebski, S.; Bailey, L.G.; Baum, B.R. Modification of a CTAB DNA extraction protocol for plants containing high polysaccharide and polyphenol components. Plant Mol. Biol. Rep. 1997, 15, 8–15. [Google Scholar] [CrossRef]
  52. Pinheiro, J.; Bates, D.; DebRoy, S.; Sarkar, D. R Core Team. 2018. nlme: Linear and nonlinear mixed effects models. R Package Version 2018, 3, 1–137. [Google Scholar]
  53. Purcell, S.; Neale, B.; Todd-Brown, K.; Thomas, L.; Ferreira, M.A.; Bender, D.; Sham, P.C. PLINK: A tool set for whole-genome association and population-based linkage analyses. Am. J. Hum. Genet. 2007, 81, 559–575. [Google Scholar] [CrossRef] [Green Version]
  54. Yin, L. CMplot: Circle Manhattan Plot. 2018. Available online: https://github.com/YinLiLin/R-CMplot (accessed on 21 June 2020).
  55. Yu, J.; Pressoir, G.; Briggs, W.H.; Vroh Bi, I.; Yamasaki, M.; Doebley, J.F.; Buckler, E.S. A Unified mixed-model method for association mapping that accounts for multiple levels of relatedness. Nat. Genet. 2006, 38, 203–208. [Google Scholar] [CrossRef]
  56. Rosyara, U.R.; De Jong, W.S.; Douches, D.S.; Endelman, J.B. Software for genome-wide association studies in autopolyploids and its application to potato. Plant Genome 2016, 9, 1–10. [Google Scholar] [CrossRef] [Green Version]
  57. Shin, J.H.; Blay, S.; McNeney, B.; Graham, J. LDheatmap: An R function for graphical display of pairwise linkage disequilibria between single nucleotide polymorphisms. J. Stat. Softw. 2006, 16, 1–10. [Google Scholar] [CrossRef] [Green Version]
  58. Hunter, S.; Jones, P.; Mitchell, A.; Apweiler, R.; Attwood, T.K.; Bateman, A.; Yong, S.Y. InterPro new developments in the family and domain prediction database. Nucleic Acids Res. 2011, 40, 306–312. [Google Scholar] [CrossRef] [PubMed] [Green Version]
Figure 1. Dot plots for the distributions of tuber dry matter content (a) and oxidative browning (b) across three locations. The dots represent the clones, while the solid line represents the error bar.
Plants 09 00969 g001
Figure 2. Genome-wide association analysis of tuber DMC. Manhattan and Quantile–Quantile plots for DMC on chromosomes 6 and 19. The dashed lines on the Manhattan plot represent the significant threshold.
Plants 09 00969 g002
Figure 3. Boxplots showing the effect of the significant markers associated with tuber DMC on chromosome 6 with two SNPs: (a) Chr6_59775 and (b) Chr6_615325. The letters on the X axis represent allele variants (AA, GA, and GG); significant codes: * = 0.05 and p represents the analysis of variance probability value associated with the variation across variants.
Plants 09 00969 g003
Figure 4. Boxplots showing the effect of the significant markers associated with tuber DMC on chromosome 19. The letters on the X-axis represent allele variants (CC, CT, and TT); p represents the analysis of variance probability value associated with the variation across variants.
Plants 09 00969 g004
Figure 5. Genome-wide association analysis for OxB. Manhattan and Quantile–quantile plots for OxB on chromosome 5. The dashed lines on the Manhattan plot represent a significant threshold.
Plants 09 00969 g005
Figure 6. Marker effect of the significant markers associated with OxB on chromosome 5 with two markers: (a) chr5_118279 and (b) chr5_125093. The letters on the X-axis represent allele variants (GA and GG). Significant codes: ** = 0.01; * = 0.05 and p represents the ANOVA probability value associated with the variation across variants.
Plants 09 00969 g006
Figure 7. Linkage disequilibrium (LD heatmap) showing pairwise LD between the SNP markers covering the entire chromosomes 6 and 19, respectively, carrying the genes encoding for tuber DMC. The red colour shows the markers with high LD followed by yellow then the white colour. The dashed lines on the Manhattan plot represent the significant threshold while the X-axis presents physical distances.
Plants 09 00969 g007
Figure 8. Linkage disequilibrium (LD) heatmap showing pairwise LD between the SNP markers covering the entire chromosome 5 carrying genes encoding for OxB. The red colour shows the markers with high LD followed by yellow then the white colour. The dashed lines on the Manhattan plot represent the significant threshold while the X-axis presents physical distances.
Plants 09 00969 g008
Table 1. Estimates of variance for total genotypic and genotype × location effects in a panel of 100 water yam clones phenotyped at three locations.
Source of VarianceDry Matter ContentOxidative Browning
VarianceStandard DeviationVarianceStandard Deviation
Genotype6.3152.51290147.88056.9196
Location3.921.9802327.87432.8061
Replication7.294 × 10−20.2700777.87432.8061
Genotype × location1.8061.34386320.99574.5821
Residual6.6302.57485975.40868.6838
Table 2. Number of single nucleotide polymorphism (SNP) D. alata chromosomes before and after filtering alongside the average polymorphism information content (PIC).
ChromosomeAll SNPsFiltered SNPsChr Size (Mb)PIC of Filtered SNPs
169829918.50.218
289833514.50.224
363543219.60.219
4122589333.40.241
5114392326.30.223
644236016.20.276
773558316.50.265
894364028.40.217
9996346140.221
10109632623.60.277
11118639226.70.262
12765329140.225
13839304150.226
14108052811.20.237
1558342420.10.255
1694438619.30.243
17113643614.20.230
18111347712.20.208
19104684323.70.213
2056443123.10.229
Total18,0679687390.5
Table 3. Summary of significant single nucleotide polymorphism (SNPs) describing different genomic regions associated with tuber DMC and OxB in a panel of 100 D. alata clones.
TraitsSNP MarkersChrAllelesModelPhysical Position (bp)LODEffectR2%
DMCChr19_869219CTadditive86924.011.7930.37
Chr6_597756GA1-dom-ref59,7753.88−4.018.06
Chr6_6153256GA1-dom-ref615,3253.90−3.337.44
OxBChr5_1182795GAAdditive, general, 1-dom-alt118,2794.30−4.064.91
Chr5_1250935GAAdditive, general 1-dom-alt125,0934.19−3.487.83
Chr: chromosome, Pos: position; LOD: logarithm of the odds; R2 = r-square.
Table 4. Markers associated with the tuber DMC and OxB with their variation across locations.
TraitsMarker InteractionMSp-ValueAdjusted R
DMCChr6_59775: Location124.688.822 × 10−14 ***0.2139
Chr6_615325: Location122.1122.081 × 10−13 ***0.209
Chr19_8692: Location191.3242.2 × 10−16 ***0.343
OxBChr5_118279: Location67.8290.01475 *0.03051
Chr5_125093: Location90.3770.001929 **0.0463
MS: Mean square. p represents the analysis of variance probability value associated with the variation across variants.
Table 5. QTL interaction across each location.
Marker Locationp-Value
DMCChr6_59775: Ikenne0.00532 **
Chr6_59775: Ibadan0.00762 **
Chr6_59775: Ubiaja0.21641
Chr6_615325: Ikenne0.003599 **
Chr6_615325: Ibadan0.000982 ***
Chr6_615325: Ubiaja0.467
Chr19_8692: Ikenne0.000207 ***
Chr19_8692: Ibadan2.83 × 105 ***
Chr19_8692: Ubiaja0.000617 ***
OxBChr5_118279: Ikenne0.00699 **
Chr5_118279: Ibadan0.02513 *
Chr5_118279: Ubiaja0.19550
Chr5_125093: Ikenne0.002499 **
Chr5_125093: Ibadan0.012047 *
Chr5_125093: Ubiaja0.146802
p represents the analysis of variance probability value associated with the variation across variants.

