Article

Variations in Nitrogen Metabolism are Closely Linked with Nitrogen Uptake and Utilization Efficiency in Cotton Genotypes under Various Nitrogen Supplies

State Key Laboratory of Cotton Biology, Institute of Cotton Research of Chinese Academy of Agricultural Sciences, Anyang 455000, China
*
Authors to whom correspondence should be addressed.
Plants 2020, 9(2), 250; https://doi.org/10.3390/plants9020250
Submission received: 21 January 2020 / Revised: 11 February 2020 / Accepted: 12 February 2020 / Published: 15 February 2020
(This article belongs to the Special Issue Plant Nitrogen Assimilation and Metabolism)

Abstract

:
Cotton production is highly sensitive to nitrogen (N) fertilization, whose excessive use is responsible for human and environmental problems. Lowering N supply together with the selection of N-efficient genotypes, more able to uptake, utilize, and remobilize the available N, could be a challenge to maintain high cotton production sustainably. The current study aimed to explore the intraspecific variation among four cotton genotypes in response to various N supplies, in order to identify the most distinct N-efficient genotypes and their nitrogen use efficiency (NUE)-related traits in hydroponic culture. On the basis of shoot dry matter, CCRI-69 and XLZ-30 were identified as N-efficient and N-inefficient genotypes, respectively, and these results were confirmed by their contrasting N metabolism, uptake (NUpE), and utilization efficiency (NUtE). Overall, our results indicated the key role of shoot glutamine synthetase (GS) and root total soluble protein in NUtE. Conversely, tissue N concentration and N-metabolizing enzymes were considered as the key traits in conferring high NUpE. The remobilization of N from the shoot to roots by high shoot GS activity may be a strategy to enhance root total soluble protein, which improves root growth for N uptake and NUE. In future, multi-omics studies will be employed to focus on the key genes and pathways involved in N metabolism and their role in improving NUE.

1. Introduction

Nitrogen (N) is one of the most important and limiting nutrients for crop production [1]. It is the main component of several macromolecules, which are necessary for normal growth and productivity [2]. N fertilization has significantly improved crop production and thus reduces the pressure of global population growth [1]. However, low N is a major constraint in crop production and can decrease the yield up to 50% [3,4]. To maintain better crop growth and production, the demand for N fertilizer increases [5,6] and this increase may continue up to threefold in the future [7]. On the other side, plants can only utilize half of the applied fertilizer [8], and the rest of fertilizer leaks into groundwater and causes a great threat in terms of human and environmental problems [9,10]. Therefore, it is an urgent need to enhance N use efficiency (NUE) in plants to reduce N fertilizer application into soils.
The intraspecific variation in the genotypes belongs to the same species are the valuable resources for breeding the desirable traits for further improvement [11]. The use of crop genotypes to select the ideal form with desirable traits is an effective approach in order to attain high NUE [12]. Significant progress has been made in Arabidopsis, and different accessions have been used for exploiting natural variations in N uptake, utilization, and NUE in response to various N supply [12,13]. Moreover, such approaches also have been applied in crop plants such as rice [14], wheat [15], maize [16], rapeseed [17], tomato [18,19], soybean [20], and barley [21]. In all these studies, the main focus was to observe the natural variations in terms of selecting plants with high NUE. Besides these crops, very little attention has been paid to understanding the intraspecific variation in cotton genotypes for NUE.
NUE is a complex trait affected by both genetic and environmental factors [22]. It is composed of two main components, N uptake efficiency (NUpE) and N utilization efficiency (NUtE), which are influenced by biochemistry, phenology, and architecture, as well as the external environment such as N availability [23,24]. Studies have shown the role of total plant dry matter, nitrogen absorption, and root morphological traits in improving NUE [19,25,26]. However, few studies have been conducted to understand the role of N metabolism [27]; specifically, the enzymes involved in N metabolism such as nitrate reductase (NR), glutamine synthetase (GS), glutamate synthase (GOGAT), and glutamate dehydrogenase (GDH), which play central roles in the primary assimilation of N [28,29]. In addition, the N-containing compounds such as amino acids and proteins are also used as indicators to detect genotypic responses to the N supply [21]. These N-containing compounds regulate N uptake, assimilation, and metabolism in the plants on the basis of external N availability. Therefore, the key enzymes involved in N assimilation and the final products of N metabolism are the most important biochemical features for improving NUE [6]. Thus, investigating the levels of these indicators in cotton with contrasting N-efficient genotypes will increase our understanding of N metabolism and may be useful in identifying and improving NUE in response to various nitrogen supplies.
Cotton (Gossypium L.) is grown all over the world and is the backbone of the world’s natural textile fibers [30]. Among the production inputs, high N fertilization is a big challenge that not only increases the cost for farmers but also brings environmental and human problems [31]. To reduce this costly component of crop production, there is an immediate need to identify and develop cotton genotypes with high NUEs. In the current study, four contrasting N-efficient cotton genotypes were exposed to various nitrogen levels for 4 weeks to investigate the variation in NUE-related traits such as shoot dry matter, NUpE, NUtE, and N metabolism. Global ANOVA was conducted to find the relative contribution of N supply, genotype, and their interaction for each studied trait. Similarly, principal component analysis (PCA) was performed to understand the N response patterns of contrasting N-efficient cotton genotypes and the most essential traits contributing to NUE. Furthermore, correlation analysis was also performed to know the possible correlations among all the studied traits that might explain the variations in NUpE and NUtE among the genotypes under various N supply. Consequently, the objectives of our study were (1) to investigate the interspecific variation for NUE-related traits in cotton genotypes and (2) to find out the most distinct genotypes for contrasting NUE in response to various nitrogen supplies.

2. Results

2.1. Growth and Photosynthesis

The results of the current study showed a dramatic reduction in shoot length (67%), total plant dry matter (44%), and single leaf area (83%) under low nitrogen (0.25 mM) as compared to high nitrogen levels. However, the reduction was more prominent for N-inefficient genotypes compared to N-efficient genotypes (Table 1). The shortest shoot length (30%), least total dry matter (25%), and the smallest single leaf area (40%) were from genotype XLZ-30, whereas the greatest values were from genotype CCRI-69 (Table 1).
The leaf photosynthetic traits such as net photosynthetic rate, stomatal conductance, transpiration rate, and intercellular CO2 concentration of cotton genotypes were differentially influenced by various nitrogen supplies (Table 1). The results showed that high nitrogen significantly increased photosynthetic rate (32%), stomatal conductance (6%), and transpiration rate (24%), whereas intercellular CO2 concentration was 46% lower as compared to low nitrogen supply (Table 1). In particular, CCRI-69 had the highest photosynthetic rate (17%), stomatal conductance (7%), and transpiration rate (16%), whereas XLZ-30 had the lowest values for these three traits at each nitrogen level (Table 1). The high intercellular CO2 concentration level under low nitrogen level (0.25 mM), especially in N-inefficient genotypes, indicated their lower efficiencies in carboxylating the available carbon dioxide (Table 1).

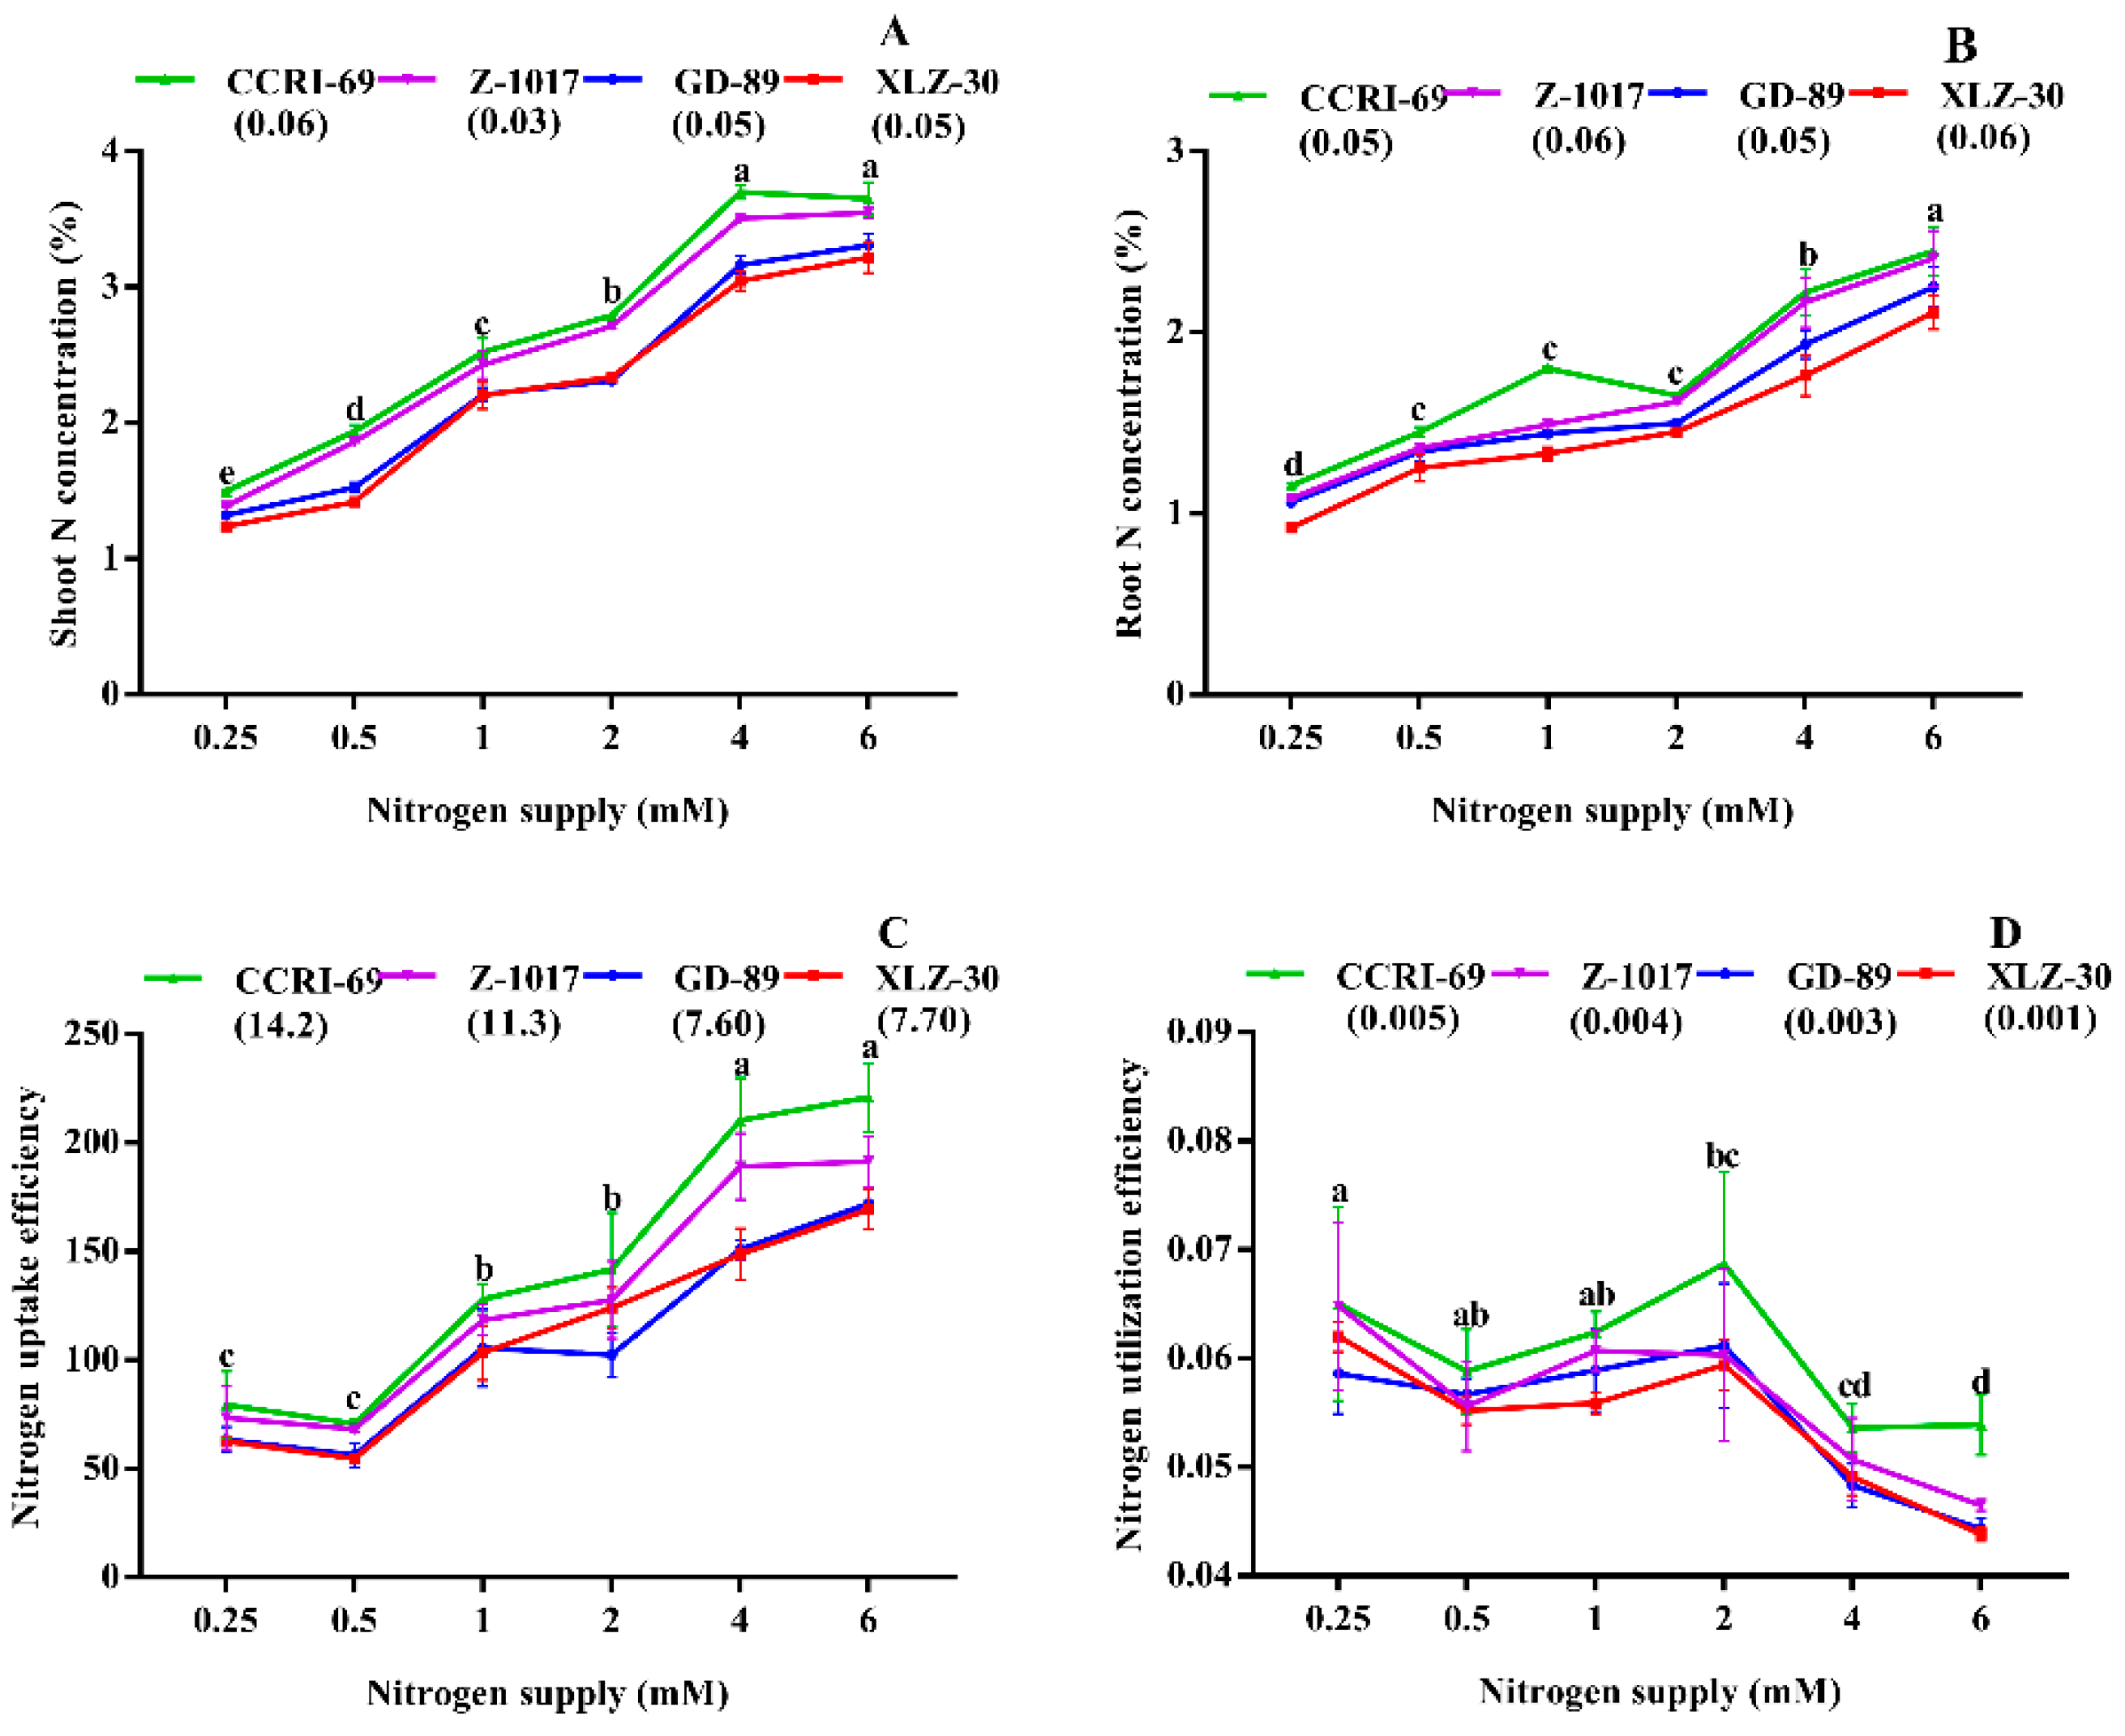
2.2. Nitrogen Use Efficiency

The performance of genotypes was analyzed by directly comparing the values of α (shoot dry matter) and β (nitrogen levels) using non-linear regression analysis [19] (Table 2). The values for α or maximum shoot dry matter ranged from 1.99 to 2.79 g for XLZ-30 and CCRI-69, which had the lowest and highest values among all the genotypes, respectively (Table 2). The values of β or nitrogen level used to produce maximum shoot dry matter ranged from 0.24 to 0.59 for CCRI-69 and XLZ-30, respectively, showing the lowest and highest values among the cotton genotypes. The results suggested that N-inefficient genotypes, particularly XLZ-30, needed significantly more nitrogen to achieve their maximum shoot dry matter than the N-efficient genotype CCRI-69 (Table 2). Thus, the genotypes CCRI-69 and XLZ-30 exhibited contrasting responses (α and β) and were considered the most distinct N-efficient and N-inefficient genotypes, respectively (Table 2).
A significant difference was noted for the shoot and root N concentrations in response to N supply (Figure 1A,B). The N concentration in the shoot and root of cotton genotypes significantly decreased by 51%–60% and 41%–54% under 0.5 and 0.25 mM nitrogen, respectively. In CCRI-69, N concentration in the shoot and root were enhanced by 16% and 18%, respectively compared to XLZ-30 (Figure 1A,B). No significant difference was observed in shoot N concentration at high N levels (4–6 mM) and moderate N levels (1–2 mM) in the root (Figure 1A,B).
Nitrogen uptake efficiency was significantly improved by 63%–67% under high nitrogen 6 mM as compared to 0.5 mM and 0.25 mM nitrogen. However, the increase was more obvious for CCRI-69 compared with other genotypes, especially GD-89 and XLZ-30, which showed a reduction of 22% and 24%, respectively (Figure 1C). Conversely, nitrogen utilization efficiency decreased with an increase in nitrogen supply; however, low nitrogen levels improved nitrogen utilization efficiency by 20%–33% (Figure 1D). The increase in nitrogen utilization efficiency was 10% higher in CCRI-69 as compared to XLZ-30 (Figure 1D). To better understand these genotypic differences, the activities of enzymes involved in N metabolism were also determined.

2.3. Nitrogen Metabolism

To understand the genotypic difference in nitrogen metabolism, we monitored the activities of enzymes involved in N metabolism. The results showed that both shoot and root NR activities were increased with an increase in nitrogen supply. Under high nitrogen supply, shoot and root NR activity increased by 29% and 69% as compared to low nitrogen supply, respectively (Figure 2A). Similarly, shoot and root NR activities of CCRI-69 increased by 12% and 42% as compared to XLZ-30, respectively (Figure 2A). Both shoot and root GS activities were increased with an increase in nitrogen supply (Figure 2C,D). However, both shoot and root GS activities were larger in CCRI-69 compared to XLZ-30. The activity state of GS in shoot and root were significantly different at 32% and 13% for CCRI-69 and XLZ-30, respectively (Figure 2C,D).
Nitrogen supply had a significant influence on GOGAT and GDH activities, which tended to increase with an increase with nitrogen levels (Figure 3). The increase in shoot and root GOGAT activities of CCRI-69 were 32% and 21%, respectively, as compared to XLZ-30 (Figure 3A,B). Similarly, shoot (14%) and root (19%) GDH activities were significantly increased in CCRI-69 compared with XLZ-30 (Figure 3C,D).
The final products of nitrogen metabolism such as amino acids and total soluble proteins were also significantly affected by nitrogen supply (Figure 4). A significant increase in shoot and root free amino acid was observed under high nitrogen supply (Figure 4A,B). However, the increase in both shoot and root free amino acid in CCRI-69 was significantly higher than XLZ-30 (Figure 4A,B). Consistently, shoot-soluble protein was increased by 26% under high nitrogen. In contrast, root-soluble protein was reduced by 36% under high nitrogen supply. Both shoot and root total soluble protein in CCRI-69 were 13% and 8% higher than XLZ-30, respectively (Figure 4C,D).

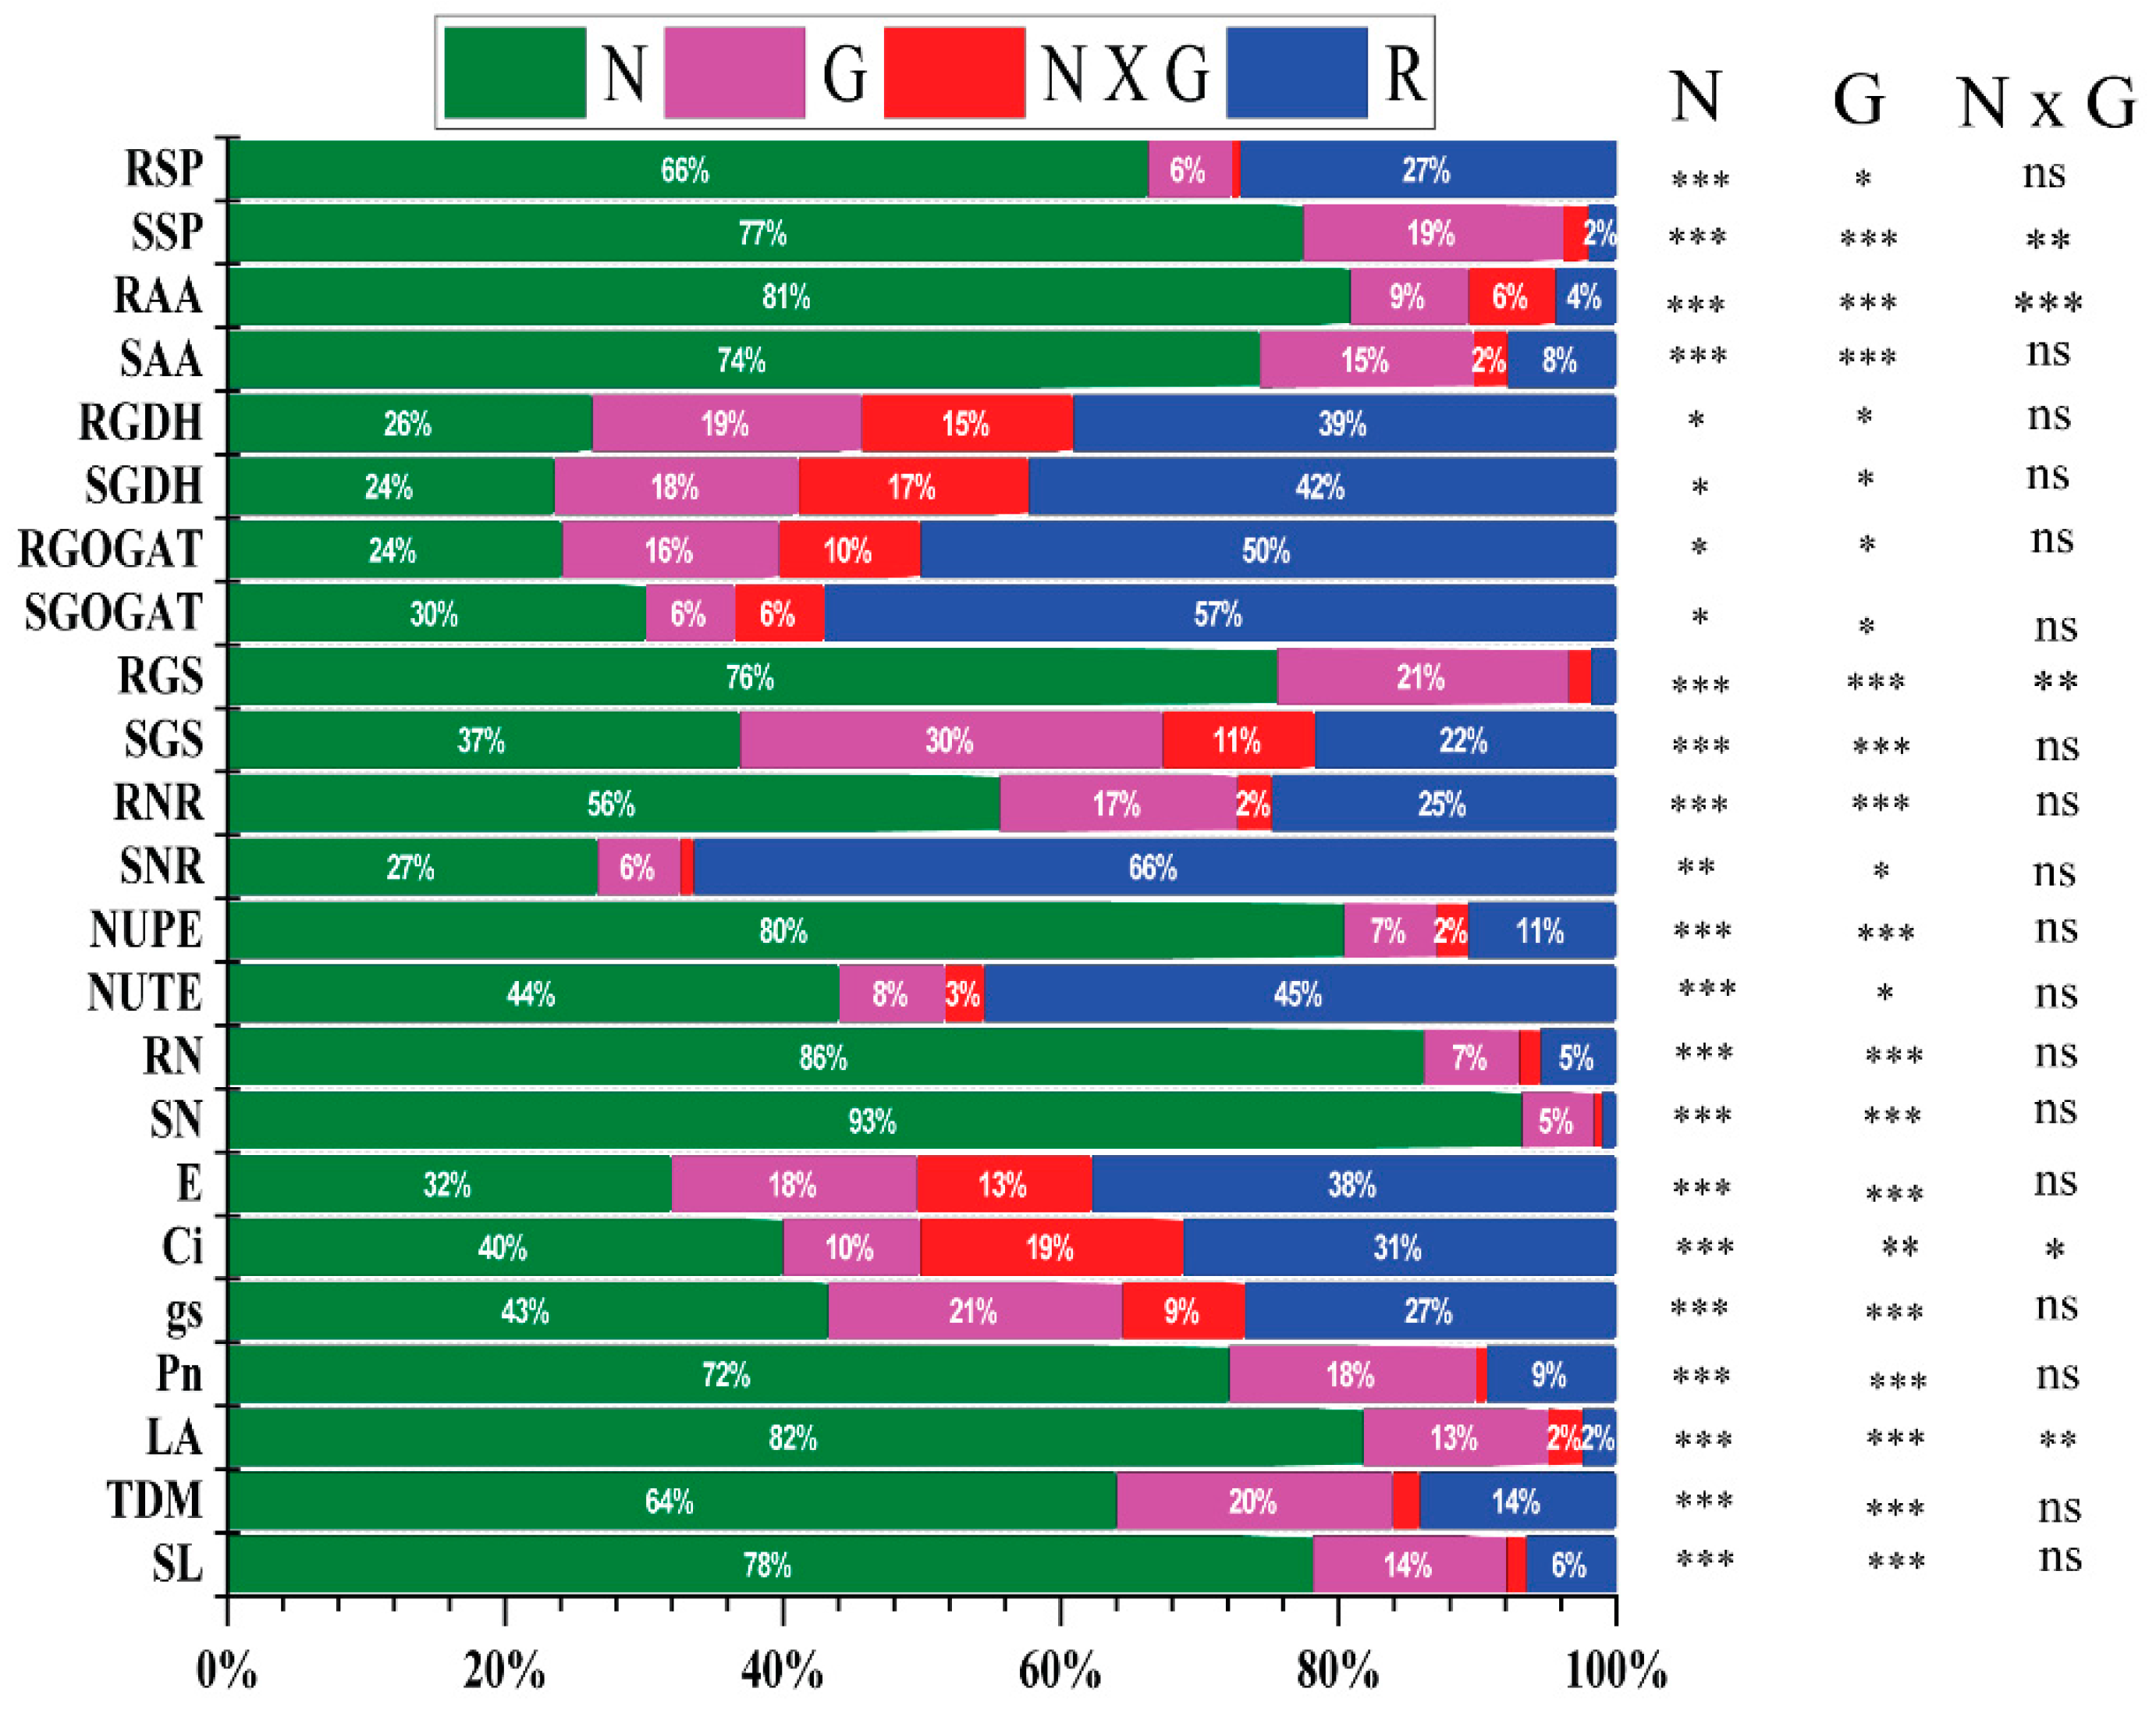
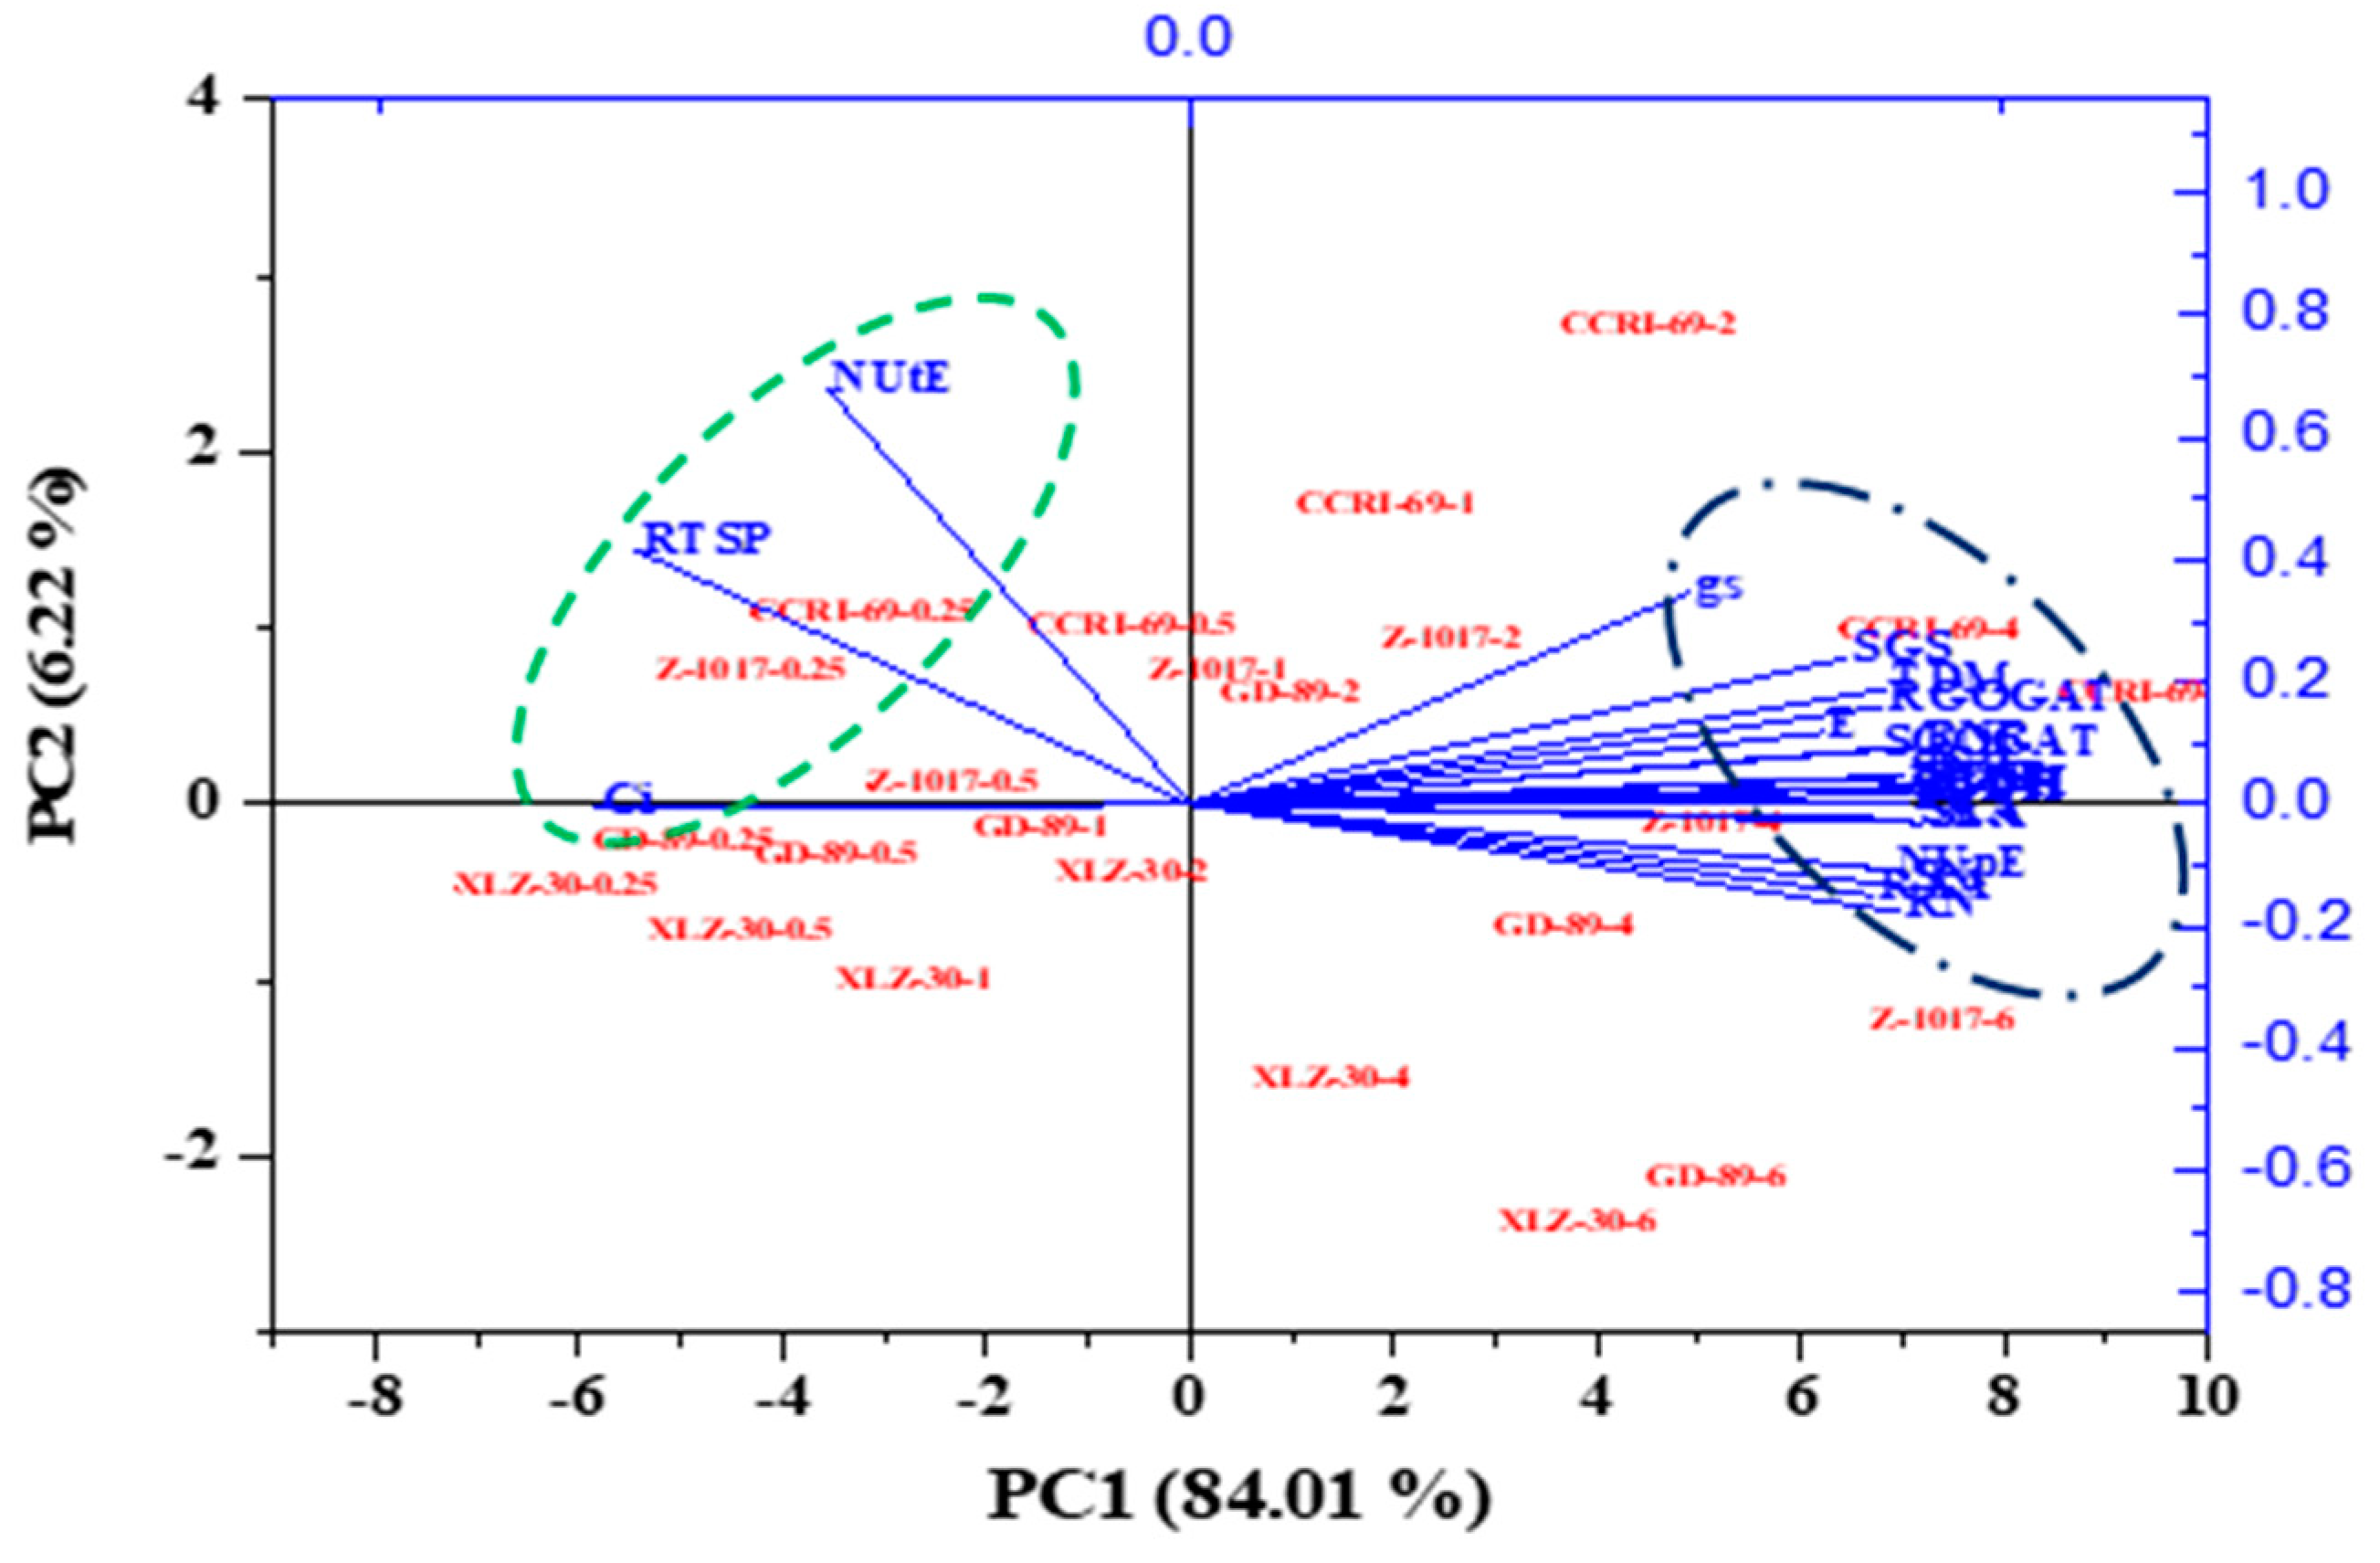
2.4. ANOVA and Principal Component Analysis

In the current study, 23 different morphophysiological and biochemical traits were analyzed, which had significant effects for nitrogen supply (N), genotypes (G), and their interaction (N × G). N supply significantly affected the detected traits and described 24%–93% of the total variance. For some traits (shoot N concentration, root N concentration, single leaf area, root amino acid, N uptake efficiency, shoot length, shoot-soluble protein, root glutamine synthetase, shoot free amino acid, net photosynthetic rate, root-soluble protein, total plant dry matter, and root nitrate reductase activity), the effects of nitrogen supply accounted over 50% of the total variance (Figure 5). The genotypic effects were also significant for all the traits and described 5%–30% of the total variance. The maximum genotypic difference was noted for shoot glutamine synthetase activity (Figure 5). Interaction effects also had a vital role in total variance, and about eight traits (root free amino acid, shoot-soluble protein, root glutamine synthetase, leaf area, and intercellular CO2 concentration) had significant effects and contributed 2%–19% of the total variance. Among the detected traits, the highest interaction effect was noted for intercellular CO2 concentration, which explained 19% of the total variance (Figure 5).
The principal component analysis was also performed to disclose the response patterns of cotton genotypes to N supply and the key traits contributing to NUE. The loading plots of principal components 1 and 2 of the PCA analysis included 23 selected traits obtained from the average values of the four genotypes under various nitrogen supplies (Figure 6 and Table S1). Nitrogen levels were associated with PC1 and explained 84.01% of the variation. Cotton genotypes were associated with PC2 and contributed 6.22% of the total variation. Growth, photosynthetic rate, tissue N concentrations, N-metabolizing enzymes, and NUpE were the key contributors to PC1, whereas stomatal conductance, shoot GS activity, root total soluble protein, and NUtE were the key contributors to PC2 (Figure 6 and Table S1). Thus, the results suggested that the genotypes had a large variation for NUtE, which was also shown in the ANOVA.

2.5. Correlation Analysis

To know the key traits contributing to nitrogen uptake and utilization efficiency, we selected 3 morphological, 6 physiological, and 12 biochemical traits for Pearson correlation analysis. The visualization in Cytoscape revealed that a total of 21 nodes (traits) were connected in the network with 253 edges in the network (Figure 7). Out of the total direct correlation, 15 traits had positive correlations and 7 traits had negative correlations with nitrogen uptake efficiency (Figure 7). Among the traits, shoot N concentration had a strong positive correlation (r = 0.86) with nitrogen uptake efficiency. Nitrogen utilization efficiency had a positive correlation with 11 traits and also a negative correlation with 11 traits. Among the traits, root total soluble protein and shoot GS activity had a strong positive relationship with NUtE (Figure 7).

3. Discussion

3.1. Variations in Morphophysiological and Biochemical Traits among Cotton Genotypes

It has been observed that most of the plants showed some behavioral changes in response to changing environments [32] such as N availability [33]. This resulted in a decrease in growth, photosynthetic activity, translocation of N, and accumulation of pigments [34]. These different responses of plants help the researchers to select the potential genotypes. Previous studies showed a significant variation in the Arabidopsis [35] and crops such as rapeseed [36], maize [37], and barley [21] under contrasting nitrogen supply, and as a result significant genotypic variation was found in the traits contributing to NUE [36]. In cotton, very few studies have been performed to understand the key traits contributing to NUE in different genotypes under contrasting nitrogen supply. In the current study, large phenotypic differences were found among the cotton genotypes. Relatively higher morphological traits such as shoot length, shoot dry matter, total plant dry matter, and single leaf area were noted in N-efficient genotypes (CCRI-69 and Z-1017) as compared to N-inefficient genotypes (XLZ-30 and GD-89). The increase in these morphological traits in N-efficient genotypes might be due to improve N uptake, photosynthetic activity, and N metabolism. The current results are consistent with the previous studies performed on Arabidopsis [11], maize [38], tomato [19], and cotton [39], where efficient genotypes performed better than inefficient genotypes. In addition, ANOVA showed that the genotypic effects accounted for 5%–30% of the total variance, suggesting that cotton genotypes have significant variations in morphological traits. In PCA analysis, PC2 clearly determined that the genotypic effect and total plant dry matter contributed more to the genotypic effect. Thus, cotton genotypes showed considerable variation in morphological traits under various nitrogen supplies.
In addition to morphological traits, a clear difference among the genotypes was observed for photosynthetic traits. Photosynthesis is very sensitive to N availability [40,41] because 57% of the leaf nitrogen is located in the chloroplast and is used for the synthesis of photosynthetic components and related enzymes [6,42]. The previous study showed a positive correlation between leaf N concentration and photosynthesis [43,44] and, consistently, a positive correlation was noted between N concentration and photosynthetic activity (r = 0.93). Similarly, the increasing trend of photosynthesis with N supply in N-efficient genotype (CCRI-69) was consistent with our previous results [39], as well as results in poplar species [45,46]. Conversely, the photosynthetic activity in N-inefficient genotypes especially XLZ-30 decreased, which might have been due to inhibition in the photosystem, as many genes involved in the photosystem were downregulated under contrasting nitrogen supply [46]. Similarly, low nitrogen significantly decreased the photosynthetic activities in cotton genotypes, which are consistent with the previous results in which Arabidopsis, rice, maize, wheat, and other nitrogen-deficient plants were reduced [47,48,49,50]. This reduction in photosynthetic activities under low nitrogen may also be due to poor carboxylation, as noted from the high levels of intercellular CO2 concentration, which are in line with the results obtained in rice and sunflower [51]. Thus, these results suggested that N is important for photosynthesis and the genotypes having high photosynthetic activity can increase growth, productivity, and NUE.
To keep normal growth and productivity under low N supply, improvement in NUE is very important [6,7]. Subsequently, identifying the potential genotypes under various N supply is the best way to understand the mechanism and the key traits contributing to NUE [52]. There are many methods to measure NUE; however, we have compared cotton genotypes by shoot dry matter and its relation to nitrogen supply, which was previously described for the identification of efficient genotypes in legumes [53] and tomato [19]. In the current study, a large genotypic difference was found in shoot dry matter and the amounts of nitrogen used to achieve the maximum shoot dry matter (Table 2). Conclusively, CCRI-69 and XLZ-30 were considered the most distinct N-efficient and N-inefficient genotypes, respectively. Moreover, the contrasting behavior of these genotypes was confirmed from N uptake, utilization, and metabolism levels. The lower potential of XLZ-30 might be due to low photosynthetic efficiency, poor N uptake, utilization, and metabolism as described in the Results section, and these results are consistent with the previous studies [54,55].
In addition, the enzymes involved in N metabolism were measured to find the potential of genotypes for N metabolism. After uptake, nitrogen reduced in the roots or is translocated to the shoots for assimilation [6]. During primary assimilation, nitrogen is converted into glutamine and glutamate following the synthesis of amino acids, proteins, and other nitrogenous compounds [56]. This primary assimilation of nitrogen is accompanied by various enzymatic activities such as NR, GS, GOGAT, and GDH [33,57]. In the current study, large genotypic variations were observed among the key enzymes regulating N metabolism. Interestingly, enzymatic activities in CCRI-69 were the highest among the studied genotypes, indicating its greater potential for N metabolism (Figure 2 and Figure 3). In consistent with the current results, a significant increase in N enzymatic activities were found in [58] and N-efficient Brassica napus genotypes [59]. This genotypic difference in enzymatic activities might be due to differences in transporters and N fluxes in the roots [60]. This assumption is based on the Km data of rice and Arabidopsis nitrate transporters, as described in a previous study [61]. In line with these results, the α value, which is similar to Km, was higher in CCRI-69, suggesting that the activities of cotton transporters may be similar to those of rice transporters. Thus, we assumed that in CCRI-69, the low-affinity transporters may be more active in the roots and shoots, which might lead to the high N uptake and assimilation even under low nitrogen supply, as discussed in previous studies [61,62]. Another reason for high N metabolism in CCRI-69 might be due to the constant conversion of nitrate to nitrite and then to ammonia and amino acids [63,64]. Thus, a well-coordinated system of N uptake and assimilation may be the base of the high N use efficiency in CCRI-69 (Yun et al., 2008), which was explained by their high enzymatic activities (Figure 2 and Figure 3).
In general, the efficiency of any process can be verified from the end products. The final products of N metabolism are amino acids and proteins [65,66]. Therefore, free amino acids and total soluble protein were also measured to further find the genotypic difference in N metabolism. As discussed in the Results section, nitrogen-efficient genotypes have significantly more soluble protein, free amino acids, and soluble sugar than inefficient genotypes. Under low nitrogen, a significant increase in the root total soluble protein and total soluble sugar were observed in the cotton genotypes. As mentioned in the Results section, a significant reduction in free amino acids and shoot total soluble proteins were observed under low nitrogen supply, whereas root total soluble protein was increased under low nitrogen supply (Figure 4A–C). The increase in root total soluble protein was more prominent in CCRI-69, which is in line with the results obtained in maize ear [67]. The reason for this high root-soluble protein might be due to an increase in transcript levels encoding various proteins [68], or due to higher protease activity in the roots, resulting in a greater level of protein degradation [69]. Moreover, this increase in root total soluble protein acting as N sources for photosynthetic processes and CCRI-69 can transfer more N to shoots and, in return, more carbon to roots, resulting in better growth and NUE. Thus, clear genotypic differences in cotton were noted for N metabolism and its importance in increasing NUE.

3.2. Variations in Morphophysiological and Biochemical Traits Are Associated with NUE

ANOVA and principal component analysis showed that most of the traits were affected by nitrogen supply and contributed to the total variation explain by PC1. Shoot glutamine synthetase activity and NUtE shared most of the genotypic variation and contributed to PC2, which was mainly associated with cotton genotypes (Figure 5 and Figure 6). Moreover, NUtE was negatively correlated with increasing nitrogen supply, which is in line with the previous results [70,71,72]. The reduction in NUtE with increasing nitrogen supply might be due to excessive storage of external N beyond plant requirements, and thus the external N cannot stimulate further growth [73]. As a result, lower growth, with a high tissue N concentration, may reduce NUtE under high N supply.
To uncover the relationship between NUpE and NUtE with morphophysiological and biochemical traits, a correlation network was constructed (Figure 7). Interestingly, NUpE had direct interaction with 22 traits, having 15 negative and 7 positive correlations. The N concentration in the shoot and N-metabolizing enzymes were strongly associated with NUpE and shared a large N effect, which indicated that N uptake and metabolism were more affected by nitrogen supply than genotype. Thus, N-metabolizing enzymes may be targets for increasing NUE. Similarly, NUtE had a strong positive correlation with root total soluble protein and shoot GS activity (Figure 7). Moreover, root total soluble protein and NUtE were higher under low nitrogen supply, which is consistent with the results of the previous studies [45,74]. This increase in NUtE and root total soluble protein under low N supply may be associated with the nitrogen metabolism due to an increase in transcripts levels encoding various proteins [68] or due to high protease activity that can lead to higher protein degradation [69]. It was also reported that high NUtE is linked with the acceleration of N-related physiological and biochemical processes [45]. Thus, increase in GS activity, as well as root total soluble protein under low nitrogen may be an adaptive strategy, helping the cotton plant in promoting better root systems for enhancing nitrogen uptake, assimilation, and finally NUE. These results suggest that NUE in cotton genotypes is likely determined by biochemical processes; thus, improving N metabolism through genetic approaches might improve NUE.

4. Materials and Methods

4.1. Plant Cultivation and Nitrogen Treatment

A greenhouse experiment was carried out at the Cotton Research Institute of the Chinese Academy of Agriculture Sciences, Anyang, China. The representative four cotton genotypes comprising of two N-efficient (CCRI-69 and Z-1017) and two N-inefficient (GD-89 and XLZ-30) genotypes were selected from the previously screened genotypes on the basis of dry biomass and NUE [31]. Healthy seeds of each genotype were germinated in a growth chamber. Seven-day-old seedlings with uniform size were transplanted into plastic containers (7 L) in the growth chamber (16/8 h light/dark cycle, 28 °C temperature, 60% relative humidity). During the first week, the seedlings were provided with half-strength Hoagland solution, followed by full-strength according to Iqbal et al. [39]. At two leaf-stage, seedlings were exposed to various N supplies 0.25, 0.5, 1, 2, 4, and 6 mM as Ca(NO3)2. A total concentration of 0–4 mM CaCl2 was added to control treatment to equalize calcium concentration among the treatments [75]. The solutions were replaced on a weekly basis and aerated with an electric pump. The position of each plant was randomly changed every week to eliminate the effect of position.

4.2. Plant Morphological Characteristics

Before harvest, the shoot length of the four randomly selected plants from each replication was measured with the help of a ruler [76]. The leaf area of each representative plant was recorded as described by Iqbal et al. [39]. After harvesting, the plants were placed in the oven at 105 °C for 1 h, followed by 80 °C for 48 h. The complete dried root, shoot, and total plant dry matter was measured with the help of an electronic balance (Shimadzu electronic balance, Tatzendpromenade 2, 07745 Jena, Germany).

4.3. Measurement of Photosynthetic Characteristics

Before harvest, photosynthetic measurement was conducted from the top three leaves developed after N treatments. The photosynthetic traits such as net photosynthetic rate, stomatal conductance, transpiration rate, and intercellular CO2 concentration were measured with the help of a portable photosynthesis system (Li-Cor-6400; Li-Cor, Inc., Lincoln, NE, USA) from 9:00 a.m. to 11:00 a.m. in the growth chamber, according to a previously reported method [77]. Carbon dioxide concentration inside the chamber was maintained at 400 ± 1 µmoL CO2 (mol air)−1, and the light intensity was set as 1000 μmol photon m−2 s−1, as recommended by Cao et al. [78].

4.4. Measurement of N Concentration and NUE Traits

Tissue N concentrations were measured through the Kjeldahl method [39]. The grounded samples of about 0.2 g were weighed and digested with H2SO4-H2O2 for N concentration analysis [79] using Bran + Luebbe Continuous-Flow AutoAnalyzer III (AA3-Australlia). Shoot dry matter data of the cotton genotypes in response to N supply were described by non-linear regression analysis, where α shows the maximum shoot dry matter and β represents the N supply at half maximum shoot dry matter or the rate of N at which α was reached (Table 2). The performance of genotypes was analyzed by directly comparing the values of α and β in a way that was similar to the well-known Michaelis–Menten enzyme kinetics Vmax and Km [53]. Additionally, NUE definitions for cotton genotypes in response to various N supply were calculated as follows:
(1)
Total N accumulation (TNA) calculated as the N concentration x total plant dry weight (mg N) [80];
(2)
Nitrogen utilization efficiency (NUtE) calculated as the total plant dry weight divided by N concentration (g2 TDW mg−1 N) [81];
(3)
Nitrogen uptake efficiency (NUpE) calculated as TNA divided by root dry weight (mg N g−1 root dry matter) [82].

4.5. Measurement of N-Metabolizing Enzymatic Activities

NR activity was analyzed according to Silveira et al. [83] and expressed as microgram nitrogen dioxide per hour per gram. About 0.2 g of fresh samples were grounded in liquid nitrogen. Following the addition of fresh tissue sample (0.2 g) added with 2 mL extraction solution 2.0 mL extraction (25.0 mM phosphate buffer (pH 7.5), 5.0 mM cysteine, and Ethylene diamine tetra acetic acid (EDTA-Na2) and centrifuged at 8000 rpm for 10 min at 4 °C. From each sample, 0.4 mL supernatant was mixed with 1.6 mL of a mixture containing 1.2 mL of 0.1 M KNO3 phosphate buffer and 0.4 mL of 2.0 mg·mL−1 nicotinamide adenine dinucleotide (NADH) solution, while the control was kept as NADH-free. Both control and treatment samples were kept in a water bath at 30 °C for 30 min. Then, 1.0 mL of 1% p-aminobenzene sulfonic acid and 0.2% α-naphthylamine were added to the supernatant, color developed for 20 min, and centrifuged for 5 min at 4000 rpm. The absorbance was determined by calorimetry at a wavelength of 540 nm using a spectrophotometer (722N, Shanghai Metash Instrument Co., Shanghai, China).
GS activity was determined according to the previously established method [84]. The enzyme activity was assessed by grinding fresh samples (0.2 g) on ice with an extraction containing 2.0 mL of an extract (0.05 M Tris–HCl buffer, pH 8.0, 2.0 mM MgSO4, 2.0 mM dithiothreitol (DTT), and 0.4 M sucrose), and centrifuged at 15,000 rpm for 20 min at 4 °C. After centrifugation, 0.7 mL of supernatant was mixed with 1.6 mL of 0.1 M Tris–HCl buffer (pH 7.4, 80.0 mM MgSO4, 20.0 mM sodium glutamate, 20.0 mM cysteine, 2.0 mM EDTA, containing 80.0 mM HONH3Cl) and 0.7 mL of 40.0 mM ATP solution. The mixture was placed in a water bath at 25 °C for 30 min, to which 1.0 mL of a chromogenic reagent (0.2 M trichloroacetic acid, 0.37 M FeCl3, and 0.6 M HCl) was added, incubated for 15 min, and centrifuged at 5000 rpm for 10 min at 25 °C; then, the supernatant was collected and the absorbance was measured at a wavelength of 540 nm. The reaction mixture of 1.6 mL of 0.1 M Tris–HCl solution (pH 7.4, not containing 80.0 mM HONH3Cl) was added as control. GOGAT and GDH activities of both tissues were measured according to the previous method at a wavelength of 340 nm using a spectrophotometer [85]. The enzyme extraction from the samples were the same as those of GS. Then, 100 mM K+ phosphate (pH 7.6), containing 0.1% (v/v) 2-mercaptoethanol, was used to determine the activity of the GDH and GOGAT enzymes. In addition, the reaction solution of GOGAT was 2.5 mM α-ketoglutarate, 100 μM NADH, 10.0 mM L-glutamine, and 1.0 mM aminooxyacetate, and that of GDH was 2.5 mM α-ketoglutarate, 100.0 μM NADH, and 100.0 mM (NH4)2SO4. One unit of both GOGAT and GDH was calculated as the oxidation of 1 nmol of NADH per minute.

4.6. Measurement of Total Soluble Protein and Total Free Amino Acids

In the current experiment, total soluble protein was also measured according to the supposed method by Bradford [86] using Coomassie Brilliant Blue (G-250) as a dye and albumin as standard according to [87]. Root and shoot samples (0.5 g) were grounded in liquid nitrogen and homogenized in phosphate buffer (5 mL). The samples were then placed in a water bath 100 °C (10 min) and then centrifuged at 3000× g for 5 min at 22–25 °C. Reaction mixture composed of 2 mL distilled Water (dH2O), enzyme extract (20 µL), and Bradford reagent (0.5 mL). Finally, the values were recorded at a 595 nm wavelength using distilled water as a blank control and bovine albumin (BSA) as a standard with the help of a spectrophotometer (UV-2600) (722N, Shanghai Metash Instrument Co., Shanghai, China).
For the determination of total free amino acids, the ninhydrin method was used as previously described [88] with some modifications [89]. Extraction buffer composed of acetic acid/sodium acetate (pH 5.4) and the final values of free amino acids were detected at 580 nm by using a spectrophotometer (UV-2600) (722N, Shanghai Metash Instrument Co., Shanghai, China).

4.7. Statistical Analysis

The effects of genotypes, N supply, and their interaction were evaluated by two-way ANOVA with a split-plot arrangement using Statistix 10 software (Analytical Software, Tallahassee, FL, USA). Nitrogen treatments were used as the main plot, whereas genotypes were used as subplot factor during analysis. Means were separated using the least significant test (LSD) at a 5% level of significance. Graphs were generated using GraphPad Prism 7, and PCA was calculated in OriginPro 2015 (b9.2.214, OriginLab Corporation, Northampton, MA, USA). Various studied traits were used to calculate the relationships with NUpE and NUtE using R package GeneNT [90], and the results were visualized according to the method of Iqbal et al. [91].

5. Conclusions

In conclusion, two NUE-contrasting genotypes, CCRI-69 and XLZ-30, were selected as N-efficient and N-inefficient genotypes, respectively. Of note, CCRI-69 showed higher NUE-related traits values, such as shoot dry matter, NUpE, NUtE, and N metabolism. Moreover, root-soluble protein and shoot glutamine synthetase were positively correlated with NUtE, whereas N-metabolizing enzymes and N concentration was positively correlated with NUpE. Interestingly, shoot glutamine synthetase shared more genotypic variation, suggesting the importance of glutamine synthetase in improving NUE. Moreover, enhanced accumulation root total soluble protein and shoot glutamine synthetase activity requires deep interpretation on the molecular level to fully understand the underlying mechanism of NUE.

Supplementary Materials

The following are available online at https://www.mdpi.com/2223-7747/9/2/250/s1: Table S1: Principal component analysis (PCA) of morphophysiological and biochemical traits of contrasting N-efficient cotton genotypes under various nitrogen supply (0.25, 0.5, 1, 2, 4 and 6 mM).

Author Contributions

Conceptualization, M.S., A.I., and Q.D.; methodology, A.I.; software, X.W.; validation, H.G. and H.Z.; formal analysis, H.G. and H.Z.; investigation, A.I.; resources, M.S.; data curation, Q.D.; writing—original draft preparation, A.I.; writing review and editing, X.Z.; visualization, X.W.; supervision, M.S. and Q.D.; project administration, M.S.; funding acquisition, M.S. All authors have read and agreed to the published version of the manuscript.

Funding

This research was funded by the National Key Research and Development Program of China (grant no. 2017YFD0101600) and the State Key Laboratory of Cotton Biology (grant no. CB2019C17) for their financial support.

Conflicts of Interest

All the authors declare no conflict of interest.

References

  1. Iqbal, A.; Qiang, D.; Alamzeb, M.; Xiangru, W.; Huiping, G.; Hengheng, Z.; Nianchang, P.; Xiling, Z.; Meizhen, S. Untangling the molecular mechanisms and functions of nitrate for improving nitrogen use efficiency. J. Sci. Food Agric. 2020, 100, 904–914. [Google Scholar] [CrossRef]
  2. Castro-Rodríguez, V.; Cañas, R.A.; de la Torre, F.N.; Pascual, M.B.; Avila, C.; Cánovas, F.M. Molecular fundamentals of nitrogen uptake and transport in trees. J. Exp. Bot. 2017, 68, 2489–2500. [Google Scholar] [CrossRef]
  3. Jones, D.L.; Clode, P.L.; Kilburn, M.R.; Stockdale, E.A.; Murphy, D.V. Competition between plant and bacterial cells at the microscale regulates the dynamics of nitrogen acquisition in wheat (Triticum aestivum). New Phytol. 2013, 200, 796–807. [Google Scholar] [CrossRef] [Green Version]
  4. Iqbal, J.; Mitchell, D.C.; Barker, D.W.; Miguez, F.; Sawyer, J.E.; Pantoja, J.; Castellano, M.J. Does nitrogen fertilizer application rate to corn affect nitrous oxide emissions from the rotated soybean crop? J. Environ. Qual. 2015, 44, 711–719. [Google Scholar] [CrossRef] [PubMed] [Green Version]
  5. Rennenberg, H.; Dannenmann, M. Nitrogen nutrition of trees in temperate forests—the significance of nitrogen availability in the pedosphere and atmosphere. Forests 2015, 6, 2820–2835. [Google Scholar] [CrossRef]
  6. Xu, G.; Fan, X.; Miller, A.J. Plant nitrogen assimilation and use efficiency. Annu. Rev. Plant Biol. 2012, 63, 153–182. [Google Scholar] [CrossRef] [PubMed] [Green Version]
  7. Good, A.G.; Shrawat, A.K.; Muench, D.G. Can less yield more? Is reducing nutrient input into the environment compatible with maintaining crop production? Trends Plant Sci. 2004, 9, 597–605. [Google Scholar] [CrossRef] [PubMed]
  8. Schroeder, J.I.; Delhaize, E.; Frommer, W.B.; Guerinot, M.L.; Harrison, M.J.; Herrera-Estrella, L.; Horie, T.; Kochian, L.V.; Munns, R.; Nishizawa, N.K. Using membrane transporters to improve crops for sustainable food production. Nature 2013, 497, 60. [Google Scholar] [CrossRef] [PubMed] [Green Version]
  9. Miao, Y.; Stewart, B.A.; Zhang, F. Long-term experiments for sustainable nutrient management in China. A review. Agron. Sustain. Dev. 2011, 31, 397–414. [Google Scholar] [CrossRef] [Green Version]
  10. Cameron, K.C.; Di, H.J.; Moir, J.L. Nitrogen losses from the soil/plant system: A review. Ann. Appl. Biol. 2013, 162, 145–173. [Google Scholar] [CrossRef]
  11. Chardon, F.; Barthélémy, J.; Daniel-Vedele, F.; Masclaux-Daubresse, C. Natural variation of nitrate uptake and nitrogen use efficiency in Arabidopsis thaliana cultivated with limiting and ample nitrogen supply. J. Exp. Bot. 2010, 61, 2293–2302. [Google Scholar] [CrossRef] [PubMed] [Green Version]
  12. Chietera, G.; Chaillou, S.; Bedu, M.; Marmagne, A.; Masclaux-Daubresse, C.; Chardon, F. Impact of the genetic–environment interaction on the dynamic of nitrogen pools in arabidopsis. Agriculture 2018, 8, 28. [Google Scholar] [CrossRef] [Green Version]
  13. De Gernier, H.; De Pessemier, J.; Xu, J.; Cristescu, S.M.; Van Der Straeten, D.; Verbruggen, N.; Hermans, C. A comparative study of ethylene emanation upon nitrogen deficiency in natural accessions of Arabidopsis thaliana. Front. Plant Sci. 2016, 7, 70. [Google Scholar] [CrossRef] [PubMed] [Green Version]
  14. Cheng, J.; Jiang, H.; Liu, Y.; Dai, T.; Cao, W. Methods on identification and screening of rice genotypes with high nitrogen efficiency. Rice Sci. 2011, 18, 127–135. [Google Scholar] [CrossRef]
  15. Hitz, K.; Clark, A.J.; Van Sanford, D.A. Identifying nitrogen-use efficient soft red winter wheat lines in high and low nitrogen environments. Field Crop. Res. 2017, 200, 1–9. [Google Scholar] [CrossRef] [Green Version]
  16. Gallais, A.; Hirel, B. An approach to the genetics of nitrogen use efficiency in maize. J. Exp. Bot. 2004, 55, 295–306. [Google Scholar] [CrossRef] [Green Version]
  17. Bouchet, A.-S.; Laperche, A.; Bissuel-Belaygue, C.; Snowdon, R.; Nesi, N.; Stahl, A. Nitrogen use efficiency in rapeseed. A review. Agron. Sustain. Dev. 2016, 36, 38. [Google Scholar] [CrossRef]
  18. Sánchez-Rodríguez, E.; Rubio-Wilhelmi, M.M.; Blasco, B.; Constán-Aguilar, C.; Romero, L.; Ruiz, J.M. Variation in the use efficiency of N under moderate water deficit in tomato plants (Solanum lycopersicum) differing in their tolerance to drought. Acta Physiol. Plant. 2011, 33, 1861–1865. [Google Scholar] [CrossRef]
  19. Abenavoli, M.R.; Longo, C.; Lupini, A.; Miller, A.J.; Araniti, F.; Mercati, F.; Princi, M.P.; Sunseri, F. Phenotyping two tomato genotypes with different nitrogen use efficiency. Plant Physiol. Biochem. 2016, 107, 21–32. [Google Scholar] [CrossRef]
  20. Spaeth, S.C.; Sinclair, T.R. Variation in nitrogen accumulation and distribution among soybean cultivars. Field Crop. Res. 1983, 7, 1–12. [Google Scholar] [CrossRef]
  21. Quan, X.; Zeng, J.; Han, Z.; Zhang, G. Ionomic and physiological responses to low nitrogen stress in Tibetan wild and cultivated barley. Plant Physiol. Biochem. 2017, 111, 257–265. [Google Scholar] [CrossRef] [PubMed]
  22. Mauceri, A.; Bassolino, L.; Lupini, A.; Badeck, F.; Rizza, F.; Schiavi, M.; Toppino, L.; Abenavoli, M.R.; Rotino, G.L.; Sunseri, F. Genetic variation in eggplant (Solanum melongena L.) for nitrogen use efficiency (NUE) under contrasting NO3-supply. J. Integr. Plant Biol. 2019. [Google Scholar] [CrossRef] [PubMed] [Green Version]
  23. Hawkesford, M.J. Genetic variation in traits for nitrogen use efficiency in wheat. J. Exp. Bot. 2017, 68, 2627–2632. [Google Scholar] [CrossRef]
  24. Hawkesford, M.J.; Griffiths, S. Exploiting genetic variation in nitrogen use efficiency for cereal crop improvement. Curr. Opin. Plant Biol. 2019, 49, 35–42. [Google Scholar] [CrossRef] [PubMed]
  25. Lea, P.J.; de Azevedo, R.A. Nitrogen use efficiency. 1. Uptake of nitrogen from the soil. Ann. Appl. Biol. 2006, 149, 243–247. [Google Scholar] [CrossRef]
  26. Luo, J.; Zhou, J.-J. Growth performance, photosynthesis, and root characteristics are associated with nitrogen use efficiency in six poplar species. Environ. Exp. Bot. 2019, 164, 40–51. [Google Scholar] [CrossRef]
  27. Forde, B.G.; Lea, P.J. Glutamate in plants: Metabolism, regulation, and signalling. J. Exp. Bot. 2007, 58, 2339–2358. [Google Scholar] [CrossRef]
  28. Krapp, A.; Berthomé, R.; Orsel, M.; Mercey-Boutet, S.; Yu, A.; Castaings, L.; Elftieh, S.; Major, H.; Renou, J.-P.; Daniel-Vedele, F. Arabidopsis roots and shoots show distinct temporal adaptation patterns toward nitrogen starvation. Plant Physiol. 2011, 157, 1255–1282. [Google Scholar] [CrossRef] [Green Version]
  29. Gu, R.; Duan, F.; An, X.; Zhang, F.; von Wirén, N.; Yuan, L. Characterization of AMT-mediated high-affinity ammonium uptake in roots of maize (Zea mays L.). Plant Cell Physiol. 2013, 54, 1515–1524. [Google Scholar] [CrossRef]
  30. de Oliveira Araújo, É.; Antonio Camacho, M.; Vincensi, M.M. Nitrogen use efficiency by cotton varieties. Rev. Ciências Agrárias 2013, 36, 10–16. [Google Scholar]
  31. Zhang, H.; Xiaoqiong, F.U.; Xiangru, W.; Huiping, G.U.I.; Qiang, D.; Nianchang, P.; Zhun, W.; Zhang, X.; Meizhen, S. Identification and screening of nitrogen-efficient cotton genotypes under low and normal nitrogen environments at the seedling stage. J. Cotton Res. 2018, 1, 6. [Google Scholar] [CrossRef] [Green Version]
  32. Sakakibara, H.; Takei, K.; Hirose, N. Interactions between nitrogen and cytokinin in the regulation of metabolism and development. Trends Plant Sci. 2006, 11, 440–448. [Google Scholar] [CrossRef] [PubMed]
  33. Hakeem, K.R.; Ahmad, A.; Iqbal, M.; Gucel, S.; Ozturk, M. Nitrogen-efficient rice cultivars can reduce nitrate pollution. Environ. Sci. Pollut. Res. 2011, 18, 1184–1193. [Google Scholar] [CrossRef] [PubMed]
  34. Li, D.; Tian, M.; Cai, J.; Jiang, D.; Cao, W.; Dai, T. Effects of low nitrogen supply on relationships between photosynthesis and nitrogen status at different leaf position in wheat seedlings. Plant Growth Regul. 2013, 70, 257–263. [Google Scholar] [CrossRef]
  35. Ikram, S.; Bedu, M.; Daniel-Vedele, F.; Chaillou, S.; Chardon, F. Natural variation of Arabidopsis response to nitrogen availability. J. Exp. Bot. 2011, 63, 91–105. [Google Scholar] [CrossRef] [Green Version]
  36. Kessel, B.; Schierholt, A.; Becker, H.C. Nitrogen use efficiency in a genetically diverse set of winter oilseed rape (Brassica napus L.). Crop Sci. 2012, 52, 2546–2554. [Google Scholar] [CrossRef]
  37. Abdel-Ghani, A.H.; Kumar, B.; Reyes-Matamoros, J.; Gonzalez-Portilla, P.J.; Jansen, C.; San Martin, J.P.; Lee, M.; Lübberstedt, T. Genotypic variation and relationships between seedling and adult plant traits in maize (Zea mays L.) inbred lines grown under contrasting nitrogen levels. Euphytica 2013, 189, 123–133. [Google Scholar] [CrossRef] [Green Version]
  38. Medici, L.O.; Azevedo, R.A.; Smith, R.J.; Lea, P.J. The influence of nitrogen supply on antioxidant enzymes in plant roots. Funct. Plant Biol. 2004, 31, 1–9. [Google Scholar] [CrossRef]
  39. Iqbal, A.; Gui, H.; Zhang, H.; Wang, X.; Pang, N.; Dong, Q.; Song, M. Genotypic variation in cotton genotypes for phosphorus-use efficiency. Agronomy 2019, 9, 689. [Google Scholar] [CrossRef] [Green Version]
  40. Qin, F.; Liu, G.; Huang, G.; Dong, T.; Liao, Y.; Xu, X. Zinc application alleviates the adverse effects of lead stress more in female Morus alba than in males. Environ. Exp. Bot. 2018, 146, 68–76. [Google Scholar] [CrossRef]
  41. Xu, X.; Li, Y.; Wang, B.; Hu, J.; Liao, Y. Salt stress induced sex-related spatial heterogeneity of gas exchange rates over the leaf surface in Populus cathayana Rehd. Acta Physiol. Plant. 2015, 37, 1709. [Google Scholar] [CrossRef]
  42. Ziadi, N.; Brassard, M.; Bélanger, G.; Claessens, A.; Tremblay, N.; Cambouris, A.N.; Nolin, M.C.; Parent, L.-É. Chlorophyll measurements and nitrogen nutrition index for the evaluation of corn nitrogen status. Agron. J. 2008, 100, 1264–1273. [Google Scholar] [CrossRef]
  43. Ghannoum, O.; Evans, J.R.; Chow, W.S.; Andrews, T.J.; Conroy, J.P.; von Caemmerer, S. Faster Rubisco is the key to superior nitrogen-use efficiency in NADP-malic enzyme relative to NAD-malic enzyme C4 grasses. Plant Physiol. 2005, 137, 638–650. [Google Scholar] [CrossRef] [PubMed] [Green Version]
  44. Illman, A.M.; Scragg, A.H.; Shales, S.W. Increase in Chlorella strains calorific values when grown in low nitrogen medium. Enzym. Microb. Technol. 2000, 27, 631–635. [Google Scholar] [CrossRef]
  45. Li, H.; Li, M.; Luo, J.; Cao, X.; Qu, L.; Gai, Y.; Jiang, X.; Liu, T.; Bai, H.; Janz, D. N-fertilization has different effects on the growth, carbon and nitrogen physiology, and wood properties of slow-and fast-growing Populus species. J. Exp. Bot. 2012, 63, 6173–6185. [Google Scholar] [CrossRef] [PubMed]
  46. Luo, J.; Zhou, J.; Li, H.; Shi, W.; Polle, A.; Lu, M.; Sun, X.; Luo, Z.-B. Global poplar root and leaf transcriptomes reveal links between growth and stress responses under nitrogen starvation and excess. Tree Physiol. 2015, 35, 1283–1302. [Google Scholar] [CrossRef] [PubMed] [Green Version]
  47. Beatty, P.H.; Good, A.G. Improving Nitrogen Use Efficient in Crop Plants Using Biotechnology Approaches. In Engineering Nitrogen Utilization in Crop Plants; Springer: Berlin/Heidelberg, Germany, 2018; pp. 15–35. [Google Scholar]
  48. Makino, A. Photosynthesis, grain yield, and nitrogen utilization in rice and wheat. Plant Physiol. 2011, 155, 125–129. [Google Scholar] [CrossRef] [Green Version]
  49. Vidal, E.A.; Álvarez, J.M.; Moyano, T.C.; Gutiérrez, R.A. Transcriptional networks in the nitrate response of Arabidopsis thaliana. Curr. Opin. Plant Biol. 2015, 27, 125–132. [Google Scholar] [CrossRef]
  50. Markelz, R.J.C.; Strellner, R.S.; Leakey, A.D.B. Impairment of C4 photosynthesis by drought is exacerbated by limiting nitrogen and ameliorated by elevated [CO2] in maize. J. Exp. Bot. 2011, 62, 3235–3246. [Google Scholar] [CrossRef] [Green Version]
  51. Huang, Z.-A.; Jiang, D.-A.; Yang, Y.; Sun, J.-W.; Jin, S.-H. Effects of nitrogen deficiency on gas exchange, chlorophyll fluorescence, and antioxidant enzymes in leaves of rice plants. Photosynthetica 2004, 42, 357–364. [Google Scholar] [CrossRef]
  52. Hajari, E.; Snyman, S.J.; Watt, M.P. Nitrogen use efficiency of sugarcane (Saccharum spp.) varieties under in vitro conditions with varied N supply. Plant Cell Tissue Organ Cult. 2015, 122, 21–29. [Google Scholar] [CrossRef]
  53. Gourley, C.J.P.; Allan, D.L.; Russelle, M.P. Plant nutrient efficiency: A comparison of definitions and suggested improvement. Plant Soil 1994, 158, 29–37. [Google Scholar] [CrossRef]
  54. Uribelarrea, M.; Crafts-Brandner, S.J.; Below, F.E. Physiological N response of field-grown maize hybrids (Zea mays L.) with divergent yield potential and grain protein concentration. Plant Soil 2009, 316, 151. [Google Scholar] [CrossRef] [Green Version]
  55. Mu, X.; Chen, Q.; Chen, F.; Yuan, L.; Mi, G. Within-leaf nitrogen allocation in adaptation to low nitrogen supply in maize during grain-filling stage. Front. Plant Sci. 2016, 7, 699. [Google Scholar] [CrossRef]
  56. Pratelli, R.; Pilot, G. Regulation of amino acid metabolic enzymes and transporters in plants. J. Exp. Bot. 2014, 65, 5535–5556. [Google Scholar] [CrossRef]
  57. Funayama, K.; Kojima, S.; Tabuchi-Kobayashi, M.; Sawa, Y.; Nakayama, Y.; Hayakawa, T.; Yamaya, T. Cytosolic glutamine synthetase1; 2 is responsible for the primary assimilation of ammonium in rice roots. Plant Cell Physiol. 2013, 54, 934–943. [Google Scholar] [CrossRef]
  58. Lemaître, T.; Gaufichon, L.; Boutet-Mercey, S.; Christ, A.; Masclaux-Daubresse, C. Enzymatic and metabolic diagnostic of nitrogen deficiency in Arabidopsis thaliana Wassileskija accession. Plant Cell Physiol. 2008, 49, 1056–1065. [Google Scholar] [CrossRef]
  59. Ye, X.; Hong, J.; Shi, L.; Xu, F. Adaptability mechanism of nitrogen-efficient germplasm of natural variation to low nitrogen stress in Brassica napus. J. Plant Nutr. 2010, 33, 2028–2040. [Google Scholar] [CrossRef]
  60. Britto, D.T.; Kronzucker, H.J. NH4+ toxicity in higher plants: A critical review. J. Plant Physiol. 2002, 159, 567–584. [Google Scholar] [CrossRef] [Green Version]
  61. Gupta, N.; Gupta, A.K.; Gaur, V.S.; Kumar, A. Relationship of nitrogen use efficiency with the activities of enzymes involved in nitrogen uptake and assimilation of finger millet genotypes grown under different nitrogen inputs. Sci. World J. 2012, 2012, 625731. [Google Scholar] [CrossRef] [Green Version]
  62. Remans, T.; Nacry, P.; Pervent, M.; Girin, T.; Tillard, P.; Lepetit, M.; Gojon, A. A central role for the nitrate transporter NRT2. 1 in the integrated morphological and physiological responses of the root system to nitrogen limitation in Arabidopsis. Plant Physiol. 2006, 140, 909–921. [Google Scholar] [CrossRef] [PubMed] [Green Version]
  63. Ali, A.; Sivakami, S.; Raghuram, N. Effect of nitrate, nitrite, ammonium, glutamate, glutamine and 2-oxoglutarate on the RNA levels and enzyme activities of nitrate reductase and nitrite reductase in rice. Physiol. Mol. Biol. Plants 2007, 13, 17. [Google Scholar]
  64. Vijayalakshmi, P.; Vishnukiran, T.; Kumari, B.R.; Srikanth, B.; Rao, I.S.; Swamy, K.N.; Surekha, K.; Sailaja, N.; Subbarao, L.V.; Rao, P.R. Biochemical and physiological characterization for nitrogen use efficiency in aromatic rice genotypes. Field Crop. Res. 2015, 179, 132–143. [Google Scholar] [CrossRef]
  65. Miller, A.J.; Cramer, M.D. Root nitrogen acquisition and assimilation. In Root Physiology: From Gene to Function; Springer: Berlin/Heidelberg, Germany, 2005; pp. 1–36. [Google Scholar]
  66. Cañas, R.A.; Quilleré, I.; Christ, A.; Hirel, B. Nitrogen metabolism in the developing ear of maize (Zea mays): Analysis of two lines contrasting in their mode of nitrogen management. New Phytol. 2009, 184, 340–352. [Google Scholar] [CrossRef]
  67. Yu, J.; Han, J.; Wang, R.; Li, X. Down-regulation of nitrogen/carbon metabolism coupled with coordinative hormone modulation contributes to developmental inhibition of the maize ear under nitrogen limitation. Planta 2016, 244, 111–124. [Google Scholar] [CrossRef]
  68. Stitt, M. Nitrate regulation of metabolism and growth. Curr. Opin. Plant Biol. 1999, 2, 178–186. [Google Scholar] [CrossRef]
  69. Galangau, F.; Daniel-Vedele, F.; Moureaux, T.; Dorbe, M.-F.; Leydecker, M.-T.; Caboche, M. Expression of leaf nitrate reductase genes from tomato and tobacco in relation to light-dark regimes and nitrate supply. Plant Physiol. 1988, 88, 383–388. [Google Scholar] [CrossRef] [Green Version]
  70. Chen, C.-Z.; Lv, X.-F.; Li, J.-Y.; Yi, H.-Y.; Gong, J.-M. Arabidopsis NRT1. 5 is another essential component in the regulation of nitrate reallocation and stress tolerance. Plant Physiol. 2012, 159, 1582–1590. [Google Scholar] [CrossRef] [Green Version]
  71. Fu, F.; Li, F.; Kang, S. Alternate partial root-zone drip irrigation improves water–and nitrogen–use efficiencies of sweet-waxy maize with nitrogen fertigation. Sci. Rep. 2017, 7, 17256. [Google Scholar] [CrossRef] [Green Version]
  72. Jankowski, K.; Neill, C.; Davidson, E.A.; Macedo, M.N.; Costa, C.; Galford, G.L.; Santos, L.M.; Lefebvre, P.; Nunes, D.; Cerri, C.E.P. Deep soils modify environmental consequences of increased nitrogen fertilizer use in intensifying Amazon agriculture. Sci. Rep. 2018, 8, 13478. [Google Scholar] [CrossRef] [Green Version]
  73. Luo, J.; Zhou, J.-J.; Masclaux-Daubresse, C.; Wang, N.; Wang, H.; Zheng, B. Morphological and physiological responses to contrasting nitrogen regimes in Populus cathayana is linked to resources allocation and carbon/nitrogen partition. Environ. Exp. Bot. 2019, 162, 247–255. [Google Scholar] [CrossRef]
  74. Gan, H.; Jiao, Y.; Jia, J.; Wang, X.; Li, H.; Shi, W.; Peng, C.; Polle, A.; Luo, Z.-B. Phosphorus and nitrogen physiology of two contrasting poplar genotypes when exposed to phosphorus and/or nitrogen starvation. Tree Physiol. 2015, 36, 22–38. [Google Scholar] [CrossRef] [PubMed] [Green Version]
  75. Jiang, S.; Sun, J.; Tian, Z.; Hu, H.; Michel, E.J.S.; Gao, J.; Jiang, D.; Cao, W.; Dai, T. Root extension and nitrate transporter up-regulation induced by nitrogen deficiency improves nitrogen status and plant growth at the seedling stage of winter wheat (Triticum aestivum L.). Environ. Exp. Bot. 2017, 141, 28–40. [Google Scholar] [CrossRef]
  76. Shao, S.; Li, M.X.; Yang, D.S.; Zhang, J.; Shi, L.X. The physiological variations of adaptation mechaniam in Glycine soja seedlings under saline and alkaline stresses. Pak. J. Bot. 2016, 48, 2183–2193. [Google Scholar]
  77. He, J.; Qin, J.; Long, L.; Ma, Y.; Li, H.; Li, K.; Jiang, X.; Liu, T.; Polle, A.; Liang, Z. Net cadmium flux and accumulation reveal tissue-specific oxidative stress and detoxification in Populus× canescens. Physiol. Plant. 2011, 143, 50–63. [Google Scholar] [CrossRef] [PubMed]
  78. Cao, X.; Jia, J.B.; Li, H.; Li, M.C.; Luo, J.; Liang, Z.S.; Liu, T.X.; Liu, W.G.; Peng, C.H.; Luo, Z.B. Photosynthesis, water use efficiency and stable carbon isotope composition are associated with anatomical properties of leaf and xylem in six poplar species. Plant Biol. 2012, 14, 612–620. [Google Scholar] [CrossRef] [PubMed]
  79. Li, B.; Xin, W.; Sun, S.; Shen, Q.; Xu, G. Physiological and molecular responses of nitrogen-starved rice plants to re-supply of different nitrogen sources. Plant Soil 2006, 287, 145–159. [Google Scholar] [CrossRef]
  80. Lawlor, D.W. Carbon and nitrogen assimilation in relation to yield: Mechanisms are the key to understanding production systems. J. Exp. Bot. 2002, 53, 773–787. [Google Scholar] [CrossRef]
  81. Siddiqi, M.Y.; Glass, A.D.M. Utilization index: A modified approach to the estimation and comparison of nutrient utilization efficiency in plants. J. Plant Nutr. 1981, 4, 289–302. [Google Scholar] [CrossRef]
  82. Iqbal, A.; Qiang, D.; Xiangru, W.; Huiping, G.; Hengheng, Z.; Nianchang, P.; Xiling, Z.; Meizhen, S. Nitrogen preference and genetic variation of cotton genotypes for nitrogen use efficiency. J. Sci. Food Agric. 2020. [Google Scholar] [CrossRef]
  83. Silveira, J.A.G.; Matos, J.C.S.; Cecatto, V.M.; Viegas, R.A.; Oliveira, J.T.A. Nitrate reductase activity, distribution, and response to nitrate in two contrasting Phaseolus species inoculated with Rhizobium spp. Environ. Exp. Bot. 2001, 46, 37–46. [Google Scholar] [CrossRef]
  84. Wang, G.; Ding, G.; Li, L.; Cai, H.; Ye, X.; Zou, J.; Xu, F. Identification and characterization of improved nitrogen efficiency in interspecific hybridized new-type Brassica napus. Ann. Bot. 2014, 114, 549–559. [Google Scholar] [CrossRef] [PubMed]
  85. Groat, R.G.; Vance, C.P. Root nodule enzymes of ammonia assimilation in alfalfa (Medicago sativa L.): Developmental patterns and response to applied nitrogen. Plant Physiol. 1981, 67, 1198–1203. [Google Scholar] [CrossRef] [PubMed] [Green Version]
  86. Bradford, M.M. A rapid and sensitive method for the quantitation of microgram quantities of protein utilizing the principle of protein-dye binding. Anal. Biochem. 1976, 72, 248–254. [Google Scholar] [CrossRef]
  87. Theymoli, B.; Sadasivam, S. Biochemical methods 2nd edition. Plants Foods Hum. Nutr. 1987, 37, 41–46. [Google Scholar]
  88. Yokoyama, S.; Hiramatsu, J.-I. A modified ninhydrin reagent using ascorbic acid instead of potassium cyanide. J. Biosci. Bioeng. 2003, 95, 204–205. [Google Scholar] [CrossRef]
  89. Iqbal, A.; Qiang, D.; Xiangru, W.; Huiping, G.; Hengheng, Z.; Xiling, Z.; Meizhen, S. High nitrogen enhance drought tolerance in cotton through antioxidant enzymatic activities, nitrogen metabolism and osmotic adjustment. Plants 2020, 9, 178. [Google Scholar] [CrossRef] [Green Version]
  90. Zhu, D.; Hero, A.O.; Qin, Z.S.; Swaroop, A. High throughput screening of co-expressed gene pairs with controlled false discovery rate (FDR) and minimum acceptable strength (MAS). J. Comput. Biol. 2005, 12, 1029–1045. [Google Scholar] [CrossRef] [Green Version]
  91. Iqbal, A.; Qiang, D.; Zhun, W.; Xiangru, W.; Huiping, G.; Hengheng, Z.; Nianchang, P.; Xiling, Z.; Meizhen, S. Growth and nitrogen metabolism are associated with nitrogen-use efficiency in cotton genotypes. Plant Physiol. Biochem. 2020, 149, 61–74. [Google Scholar] [CrossRef]
Figure 1. (A) Shoot nitrogen concentration (%), (B) root nitrogen concentration (%), (C) N uptake efficiency (mg N g−1 RDW), and (D) N utilization efficiency (NUtE, g2 RDW mg−1) of contrasting nitrogen-efficient cotton genotypes under various nitrogen concentrations (0.25, 0.5, 1, 2, 4, or 6 mM NO3). The values are presented as mean ± standard error (n = 9).
Plants 09 00250 g001
Figure 2. (A) Shoot nitrate reductase activity (µg g−1 FW h−1), (B) root nitrate reductase activity (µg g−1 FW h−1), (C) shoot glutamine synthetase activity (µmol g−1 FW h−1), (D) and root glutamine synthetase activity (µmol g−1 FW h−1) of contrasting nitrogen efficient cotton genotypes under various nitrogen concentrations (0.25, 0.5, 1, 2, 4, or 6 mM NO3). The values are presented as mean ± standard error (n = 9).
Plants 09 00250 g002
Figure 3. (A) Shoot glutamate synthase activity (shoot glutamate synthase (GOGAT), U mg−1 protein), (B) root glutamate synthase activity (root GOGAT, U mg−1 protein), (C) shoot glutamate dehydrogenase (shoot glutamate dehydrogenase (GDH), U mg−1 protein), and (D) root glutamate dehydrogenase activity (root GOGAT, U mg−1 protein) of contrasting nitrogen efficient cotton genotypes under various nitrogen concentrations (0.25, 0.5, 1, 2, 4, or 6 mM NO3). The values are presented as mean ± standard error (n = 9).
Plants 09 00250 g003
Figure 4. (A) Shoot free amino acid (mg g−1), (B) root free amino acid (mg g−1), (C) shoot-soluble protein (mg g−1), and (D) root-soluble protein (mg g−1) of contrasting nitrogen-efficient cotton genotypes under various nitrogen concentrations (0.25, 0.5, 1, 2, 4, or 6 mM NO3). The values are presented as mean ± standard error (n = 9).
Plants 09 00250 g004
Figure 5. ANOVA of morphological, physiological, and biochemical traits of contrasting nitrogen-efficient cotton genotypes in response to various nitrogen concentrations (0.25, 0.5, 1, 2, 4, and 6 mM). The main effects (nitrogen (N) and genotypes (G), interaction (N × G)) and residual (R) are represented as percentage of type III sums of squares. p-values of the F-test are indicated. * p < 0.05; ** p < 0.01; *** p < 0.001; ns: not significant. RSP, root-soluble protein; SSP, shoot-soluble protein; RAA, root-free amino acid; SAA, shoot-free amino acid; RGDH, root GDH activity; SGDH, shoot GDH activity; RGOGAT, root GOGAT activity; SGOGAT, shoot GOGAT activity; RGS, root GS activity; SGS, shoot GS activity; RNR, root NR activity; SNR, shoot NR activity; NUpE, N uptake efficiency; NUtE, N utilization efficiency; RN, root N concentration; SN, shoot N concentration; E, transpiration rate; Ci, intercellular CO2 concentration; gs, stomatal conductance; Pn, net photosynthesis; LA, leaf area, TDM, total plant dry matter; SL, shoot length.
Plants 09 00250 g005
Figure 6. Principal component analysis (PCA) of morphophysiological and biochemical traits of contrasting N-efficient cotton genotypes in response to various nitrogen concentrations (0.25, 0.5, 1, 2, 4, and 6 mM NO3). The PCA shows the biplot of the first two principal components. The eigenvectors are shown in Table S1.
Plants 09 00250 g006
Figure 7. Relationships between morphological (yellow), physiological (green), and biochemical (red) traits with NUpE and NUtE (brown). Nodes represent the traits and edges (red, positive; blue, negative) represent the correlations. The thickness of the edges represents the strength of correlation coefficient for each pair. TDM, total plant dry matter; SL, shoot length; SLA, single leaf area; Pn, net photosynthesis; gs, stomatal conductance; E, transpiration rate; Ci, intercellular CO2 concentration; SN, shoot nitrogen concentration; RN, root nitrogen concentration; SNR, shoot nitrate reductase activity; RNR, root nitrate reductase activity; SGS, shoot glutamine synthetase activity; RGS, root glutamine synthetase activity; SGOGAT, shoot glutamate synthase activity; RGOGAT, root glutamate synthase activity; SGDH, shoot glutamate dehydrogenase activity; RGDH, root glutamate dehydrogenase activity; SAA, shoot-free amino acid; RAA, root-free amino acid; STSP, shoot total soluble protein; RTSP, root total soluble protein.
Plants 09 00250 g007
Table 1. Shoot length (cm), total dry matter (g plant−1), single leaf area (cm2), net photosynthetic rate (µmol m−2 s−1), stomatal conductance (mmol H2O m−2 s−1), transpiration rate (mmol m−2 s−1), and intercellular CO2 (mmol CO2 moL¹ air) of contrasting nitrogen-efficient cotton genotypes under various nitrogen supplies (0.25, 0.5, 1, 2, 4, and 6 mM).
N Supply (mM)GenotypeSLTDMSLAPngsECi
0.25GD-895.951.4016.026.400.2743.31324
XLZ-305.681.3413.715.230.2632.93311
CCRI-6910.451.7323.436.730.2793.21251
Z-10178.251.6120.766.540.2763.36315
0.5GD-8910.781.6329.996.700.2843.04267
XLZ-309.951.4927.945.670.2823.33294
CCRI-6916.251.9647.717.090.2984.22259
Z-101714.121.8240.936.780.2933.40308
1GD-8916.382.1645.807.470.2913.19260
XLZ-3013.081.9839.696.510.2803.46283
CCRI-6918.452.7069.007.840.3053.80232
Z-101717.182.3855.057.650.2983.69223
2GD-8919.382.3456.657.770.2903.98269
XLZ-3016.582.2748.457.180.2813.39290
CCRI-6922.383.0679.368.460.3164.06212
Z-101721.922.6270.677.910.3053.66234
4GD-8920.622.4779.728.340.3183.84219
XLZ-3018.152.3857.697.650.2903.37235
CCRI-6926.223.18104.328.940.3224.30224
Z-101725.752.8791.958.500.3223.80286
6GD-8922.782.4796.509.030.2794.18226
XLZ-3019.852.3578.858.480.2913.67220
CCRI-6926.523.30120.659.990.3014.47209
Z-101723.952.78104.639.350.2864.60166
N × G********nsnsns*
CV-I (%)11.885.0421.4210.333.6610.2512.8
CV-II (%)6.5113.5811.843.634.1211.0211.3
Note: ns, not significant; * p < 0.05, ** p < 0.01, *** p < 0. SL, shoot length; TDM, total plant dry matter; SLA, single leaf area; Pn, photosynthetic rate; gs, stomatal conductance; E, transpiration rate; Ci, intercellular CO2 concentration; CV-I, coefficient of variation (main plot); CV-II, coefficient variation (subplot).
Table 2. Kinetic parameters for cotton genotypes of the shoot dry-matter (α, g plant−1) and N supply response (β mM), where R2 or coefficient of determination was p < 0.05 for all genotypes.
GenotypesαβR2
CCRI-692.79 a0.24 c0.64
Z-10172.50 ab0.33 b0.63
GD-892.16 b0.40 b0.60
XLZ-301.99 b0.59 a0.20
Note: means followed by the same letters within the same columns are not different statistically at 5% probability using least significant test (LSD).

