Article

In Silico Identification of QTL-Based Polymorphic Genes as Salt-Responsive Potential Candidates through Mapping with Two Reference Genomes in Rice

by
Buddini Abhayawickrama
1,
Dikkumburage Gimhani
1,
Nisha Kottearachchi
1,*,
Venura Herath
2,
Dileepa Liyanage
1 and
Prasad Senadheera
3
1
Department of Biotechnology, Faculty of Agriculture and Plantation Management, Wayamba University of Sri Lanka, Makandura, Gonawila 60170, Sri Lanka
2
Department of Agricultural Biology, Faculty of Agriculture, University of Peradeniya, Peradeniya 20400, Sri Lanka
3
Department of Botany, Faculty of Natural Sciences, Open University of Sri Lanka, Nawala 11222, Sri Lanka
*
Author to whom correspondence should be addressed.
Plants 2020, 9(2), 233; https://doi.org/10.3390/plants9020233
Submission received: 27 December 2019 / Revised: 3 February 2020 / Accepted: 5 February 2020 / Published: 11 February 2020
(This article belongs to the Special Issue Genetics in Rice)

Abstract

:
Recent advances in next generation sequencing have created opportunities to directly identify genetic loci and candidate genes for abiotic stress responses in plants. With the objective of identifying candidate genes within the previously identified QTL-hotspots, the whole genomes of two divergent cultivars for salt responses, namely At 354 and Bg 352, were re-sequenced using Illumina Hiseq 2500 100PE platform and mapped to Nipponbare and R498 genomes. The sequencing results revealed approximately 2.4 million SNPs and 0.2 million InDels with reference to Nipponbare while 1.3 million and 0.07 million with reference to R498 in two parents. In total, 32,914 genes were reported across all rice chromosomes of this study. Gene mining within QTL hotspots revealed 1236 genes, out of which 106 genes were related to abiotic stress. In addition, 27 abiotic stress-related genes were identified in non-QTL regions. Altogether, 32 genes were identified as potential genes containing polymorphic non-synonymous SNPs or InDels between two parents. Out of 10 genes detected with InDels, tolerant haplotypes of Os01g0581400, Os10g0107000, Os11g0655900, Os12g0622500, and Os12g0624200 were found in the known salinity tolerant donor varieties. Our findings on different haplotypes would be useful in developing resilient rice varieties for abiotic stress by haplotype-based breeding studies.

1. Introduction

Rice, being the staple food crop of many nations, is considered as a high priority crop for research programs that focused on ensuring food security [1,2,3]. Rice is mostly cultivated under natural rain-fed systems frequently exposed to various abiotic and biotic stress conditions throughout the world. Development of improved rice varieties for abiotic stress tolerance is the most affordable strategy to increase rice production using marginal and non-arable lands. Among major abiotic stress conditions, salinity, the presence of increased levels of salts, predominantly sodium chloride, is considered the second most limiting factor for rice production next to drought [4]. In every year, nearly two million hectares of irrigated land become uncultivable due to the buildup of salts [5]. In addition, sodic soil which is accumulated with excessive sodium ions cause unfavorable conditions for agriculture by adversely affecting the soil physical properties. Thus, the interaction between soil sodicity and salinity could seriously compromise the rice growth in the field [6,7]. However, due to the genetic complexity of the trait, development of resilient varieties against salinity stress cannot be achieved by a single step strategy. Due to the polygenic nature of the trait, many Quantitative Trait Loci (QTLs) and Quantitative Trait Nucleotides (QTNs) have been reported linking either with salinity tolerance or susceptibility traits distributed throughout the genome in many rice lines [8,9,10,11,12,13].
Although rice is sensitive to salt, especially at the seedling stage and reproductive stage, vast diversity for this trait across the rice varieties offers a promising tool for improving salt tolerance in rice. Pokkali and Nona bokra are popular traditional salt-tolerant indica rice varieties that tolerate up to 80 mM NaCl at the seedling stage and serve as donors for rice salt tolerance [14]. The major strategies for improving salinity tolerance are reducing Na+ toxicity by limited Na+ net influx, Na+ compartmentalization and removal of Na+ into the apoplast to achieve a good Na+/K+ balance in the shoot under saline condition [3]. It is reported that Pokkali, demonstrates both ‘Na+ exclusion’ and ‘ion balance’ mechanisms while Nipponbare, a moderate tolerant japonica variety showed only ‘ion balance’ [14]. Besides, accumulation of compatible osmolytes for osmotic protection, antioxidant regulation and minimalizing the exposure time of cells to ionic imbalance are observed as components of salt tolerance [15,16,17]. By QTL mapping, genomic locations of such mechanisms are primarily recognized, giving an insight into the understanding of gene-level identification. Fine mapping followed by map-based cloning is the common approach that has been practicing to reveal candidate genes from QTLs [18,19]. For example, SKC1 gene that encodes HKT-type transporter is one of the salinity tolerant genes identified through dissecting Saltol QTL by map-based cloning [20]. Harnessing QTLs and QTNs of salinity tolerance from diverse rice accessions and introgression them to generate salt-tolerant varieties can be achieved by marker-assisted breeding, which is based on genomic sequences. The Next Generation Sequencing (NGS) technique has been successful in generating DNA sequences of organisms revealing genomic variations at a low cost. It is becoming more popular than the use of marker-based polymorphism techniques. There are many studies indicating how NGS facilitates rice improvement by exploration and exploitation of many functional genes that regulate agronomic traits [21,22,23,24].
Feltus et al. (2004) [25] have reported that there are 408,898 candidate DNA polymorphisms including single nucleotide polymorphisms (SNPs) and InDels distinguished between indica and japonica. These SNPs and InDels can be exploited for gene mapping, association studies and DNA marker-assisted breeding. If there is an SNP or InDel in a gene or regulatory sequence of the gene, there will be a chance to affect the function of the gene either adversely or favorably relative to the function of the gene of reference genome by creating either a missense mutation or premature termination or preventing stop signal or shifting the amino acid sequence leading to phenotypic variations. Mishra et al. (2016) [26] have reported that some of SNP haplotypes of HKT family genes were associated with salt tolerance in Indian wild rice germplasms while some other SNP haplotypes were sensitive to salt stress indicating the impact of SNP variations for the phenotype. The popular SUB1A allele of ethylene response factor-like gene that carries an SNP mutation conferring submergence tolerance in vegetative stage of rice is another evidence for the contribution of SNP mutation towards favorable agronomic traits [27]. Therefore, mining of SNPs and InDels of candidate genes is useful for detecting possible phenotypic variations which would be important in breeding programs.
The availability of whole genome information, gene expression profiles and in silico gene annotation tools have enabled physical identification of candidate genes by aligning genetic map and the putative QTLs. This approach helps to shortlist promising candidate genes of the trait by analyzing SNPs, InDels and structural variations which can later be validated by expression studies and promoter analysis. Instead of costly conventional fine mapping done with large inbred populations that need significant labor and time, QTLs and QTNs targeted annotation of the NGS derived sequences has revealed many candidate genes in various disciplines of plants [2,8,10,28,29].
Many researchers have conducted QTL mapping studies using Simple Sequence Repeat (SSR) markers, but they could not develop genetic linkage maps with more than 300 markers due to lack of polymorphism [30,31]. Therefore, SSR marker-based maps usually generate many gaps that are difficult to be used directly in candidate gene discovery studies. Currently, SNP markers have become more popular as they generate the vast number of polymorphic sites among individuals. For example, Thomson et al. (2017) [32] have reported that usually 1300–2500 SNP polymorphic markers could be generated from a bi-parental population of rice derived from either indica × indica or indica × japonica, if Cornell_6K_array_Infinium_Rice (C6AIR) chip containing about 6000 SNPs is used. Therefore, it appears that due to the availability of huge re-sequencing data, high-density SNPs-based maps have been developed [33,34]. Gimhani et al. (2016) [35] were also able to produce SNP-based highly dense and saturated molecular maps with the C6AIR chip covering 1460.81 cM of the rice genome with an average interval of 1.29 cM between marker loci using a Recombinant Inbred Line (RIL) population derived from At 354 and Bg 352. At 354 is a salinity tolerant elite rice indica variety with the pedigree of Pokkali and Bg 94-1 and Bg 352 is a salinity susceptible elite rice indica variety with the pedigree of Bg 380/Bg 367-4. Both At 354 and Bg 352 are recommended, high yielding, improved rice varieties in Sri Lanka with a relatively short growth duration of 105 days. Gimhani et al. (2016) reported 14 QTL hotspots and 11 solitary QTLs for salt tolerance flanked with SNP markers narrowing down to less than 1 Mb intervals indicating the potential of use in gene mining studies. We noted that the same regions of these QTLs were reported in other studies validating the potentiality of accommodating candidate genes for abiotic stress, mapped using other breeding populations (Supplementary Table S1). Therefore, it is worthwhile for attempting physical identification of the particular regions via NGS-based approaches instead of conventional fine mapping techniques that consume much time. Hence, as an extension of the same study, we sequenced two varieties—At 354 and Bg 352—with reference to Oryza sativa japonica group cultivar Nipponbare and Oryza sativa indica group cultivar Shuhui498 (R498) and reported revealing of candidate genes underlined by those QTL hotspots. We performed a gene ontology (GO) analysis to functionally characterize the potential candidate genes. We also outlined the variant calling procedure of the At 354 and Bg 352 genomes, the short-listing approach of the candidate genes leading to salinity tolerance and their possible allelic differences.

2. Results

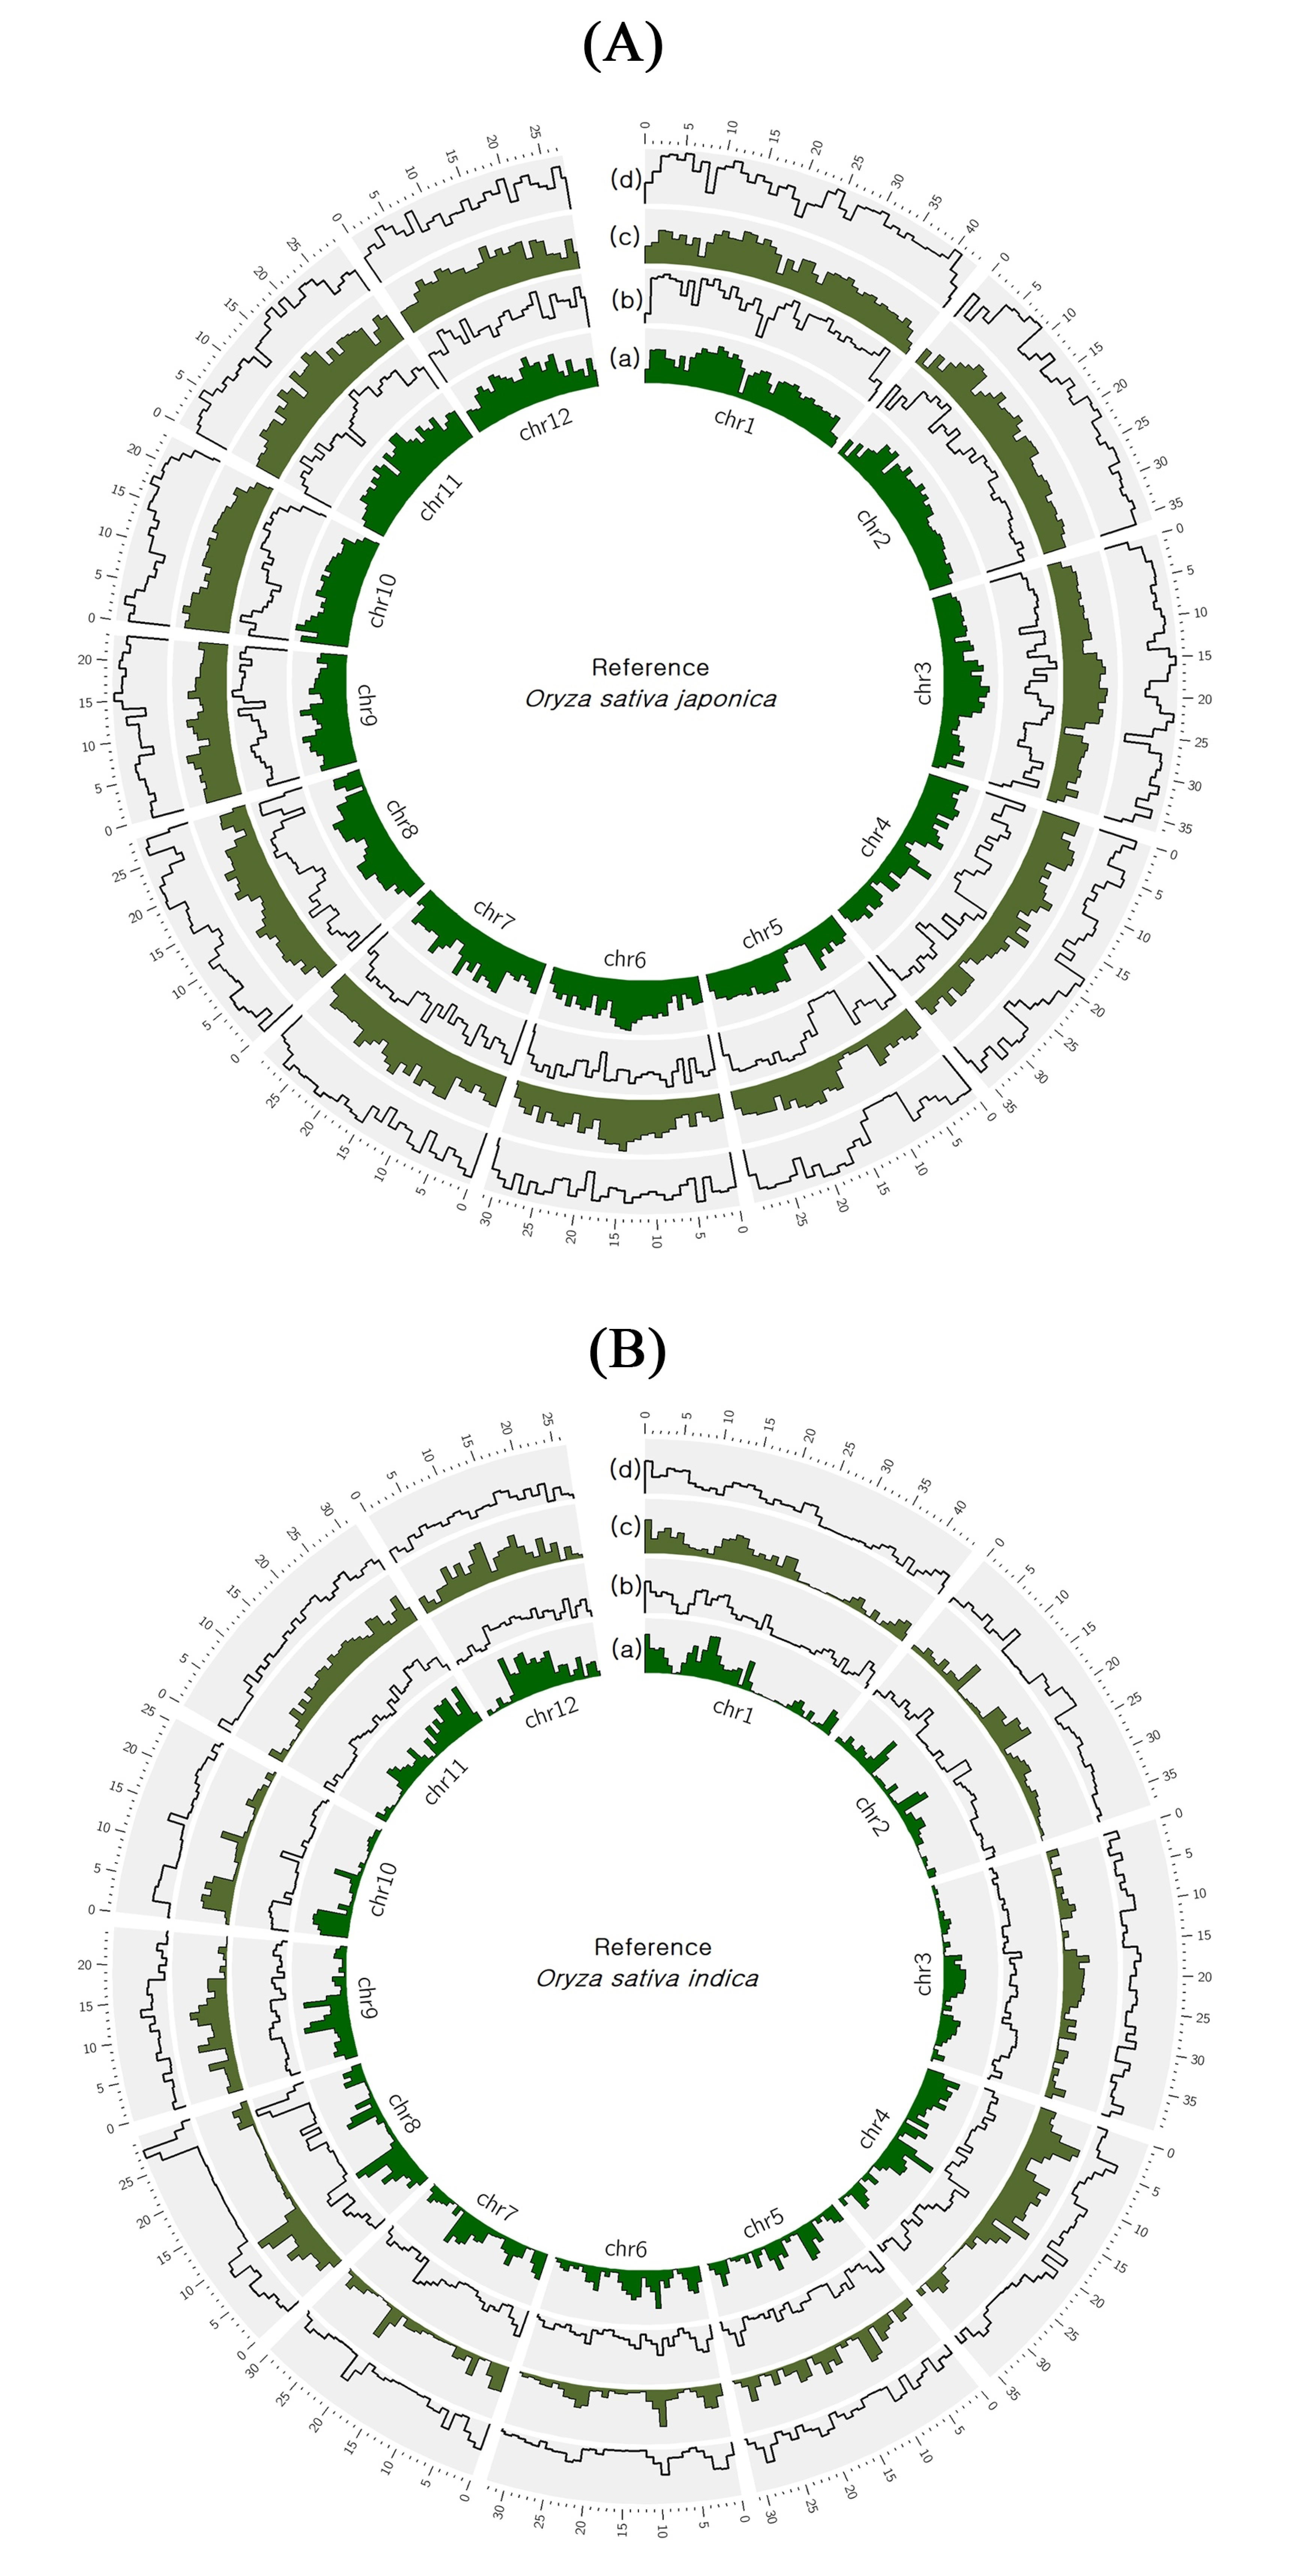
2.1. Whole Genome Sequencing and Comparison with Nipponbare and R498 Reference Genomes

Whole genome sequencing of At 354 and Bg 352 generated 11.5 and 13.5 Gb of raw data, respectively. More than 90% of the data exceeded Q30 Phred quality score for both of the varieties with mean depth coverage of 30X. The GC percentages of At 354 and Bg 352 were found to be 42.75 and 49.03 respectively. The reads of At 354 and Bg 352 were aligned to two reference genomes. Oryza sativa japonica group cultivar Nipponbare IRGSP-1.0 with 374,304,577 bp length was used as the reference genome and the mapped lengths of At 354 and Bg 352 were 349,124,521 bp (93.27%) and 348,205,846 bp (93.03%) respectively. Out of total generated reads, 108 × 106 reads of At 354 and 96 × 106 reads of Bg 352 were aligned to the Nipponbare genome with an average of 27.9X and 24.9X read depth and 94.65% and 70.76% genome wide coverage respectively (Table 1). Also, the reads were aligned to Oryza sativa indica group cultivar R498 with a length of 390,322,188 bp and more than 95% of the length of R498 genome was mapped to At 354 (374,732,599 bp) and Bg 352 (373,811,968 bp). Out of total generated reads, 110 × 106 reads of At 354 and 96 × 106 reads of Bg 352 were aligned to the R498 genome with an average of 27.3X and 24.4X read depth and 96.98% and 72.15% genome wide coverage, respectively (Table 1).

2.2. Identification of Variants in At 354 and Bg 352 Genomes

The genome-wide SNPs and InDels on At 354 and Bg 352 were examined with reference to the Nipponbare and R498 genomes. The frequency distributions of total SNPs and InDels of two varieties with respect to Nipponbare and R498 were shown in Figure 1. Identification of variants with comparison to Nipponbare genome showed that a total of 2,734,000 variants (2,478,369 SNPs and 255,631 InDels) in At 354 and a total of 2,726,469 variants (2,477,244 SNPs and 249,225 InDels) in Bg 352. With reference to R498, only 1,122,726 (1,044,783 SNPs and 77,943 InDels) and 1,107,112 (1,038,244 SNPs and 68,868 InDels) of total variants were observed in At 354 and Bg 352 respectively. The highest SNPs density was observed in chromosome 10 (776.5 and 778.4 in At 354 and Bg 352 respectively) in both varieties while the lowest was on chromosome 4 (557.9) and 5 (535.5) in At 354 and Bg 352 respectively with reference to Nipponbare. However, with reference to R498, the highest SNPs density was observed in chromosome 12 (357.8) in At 354 and chromosome 4 (421.2) in Bg 352 while the lowest SNPs density was observed in chromosome 2 (191.5) in At 354 and chromosome 7 (164.4) in Bg 352 respectively. Most of the SNP changes observed were of transition type with a Ts/Tv ratio of 2.54 in both varieties with respect to Nipponbare reference and a Ts/Tv ratio of 2.48 with respect to R498 reference genome. With regards to InDel density, the highest was observed in chromosome 2 and 3 while the lowest was in chromosome 12 and 4 in At 354 and Bg 352 respectively with reference to Nipponbare. With reference to R498, the highest InDel density was shown in chromosome 8 of both varieties while the lowest was shown in chromosome 3 and 10 of At 354 and Bg 352 respectively (Table 2).

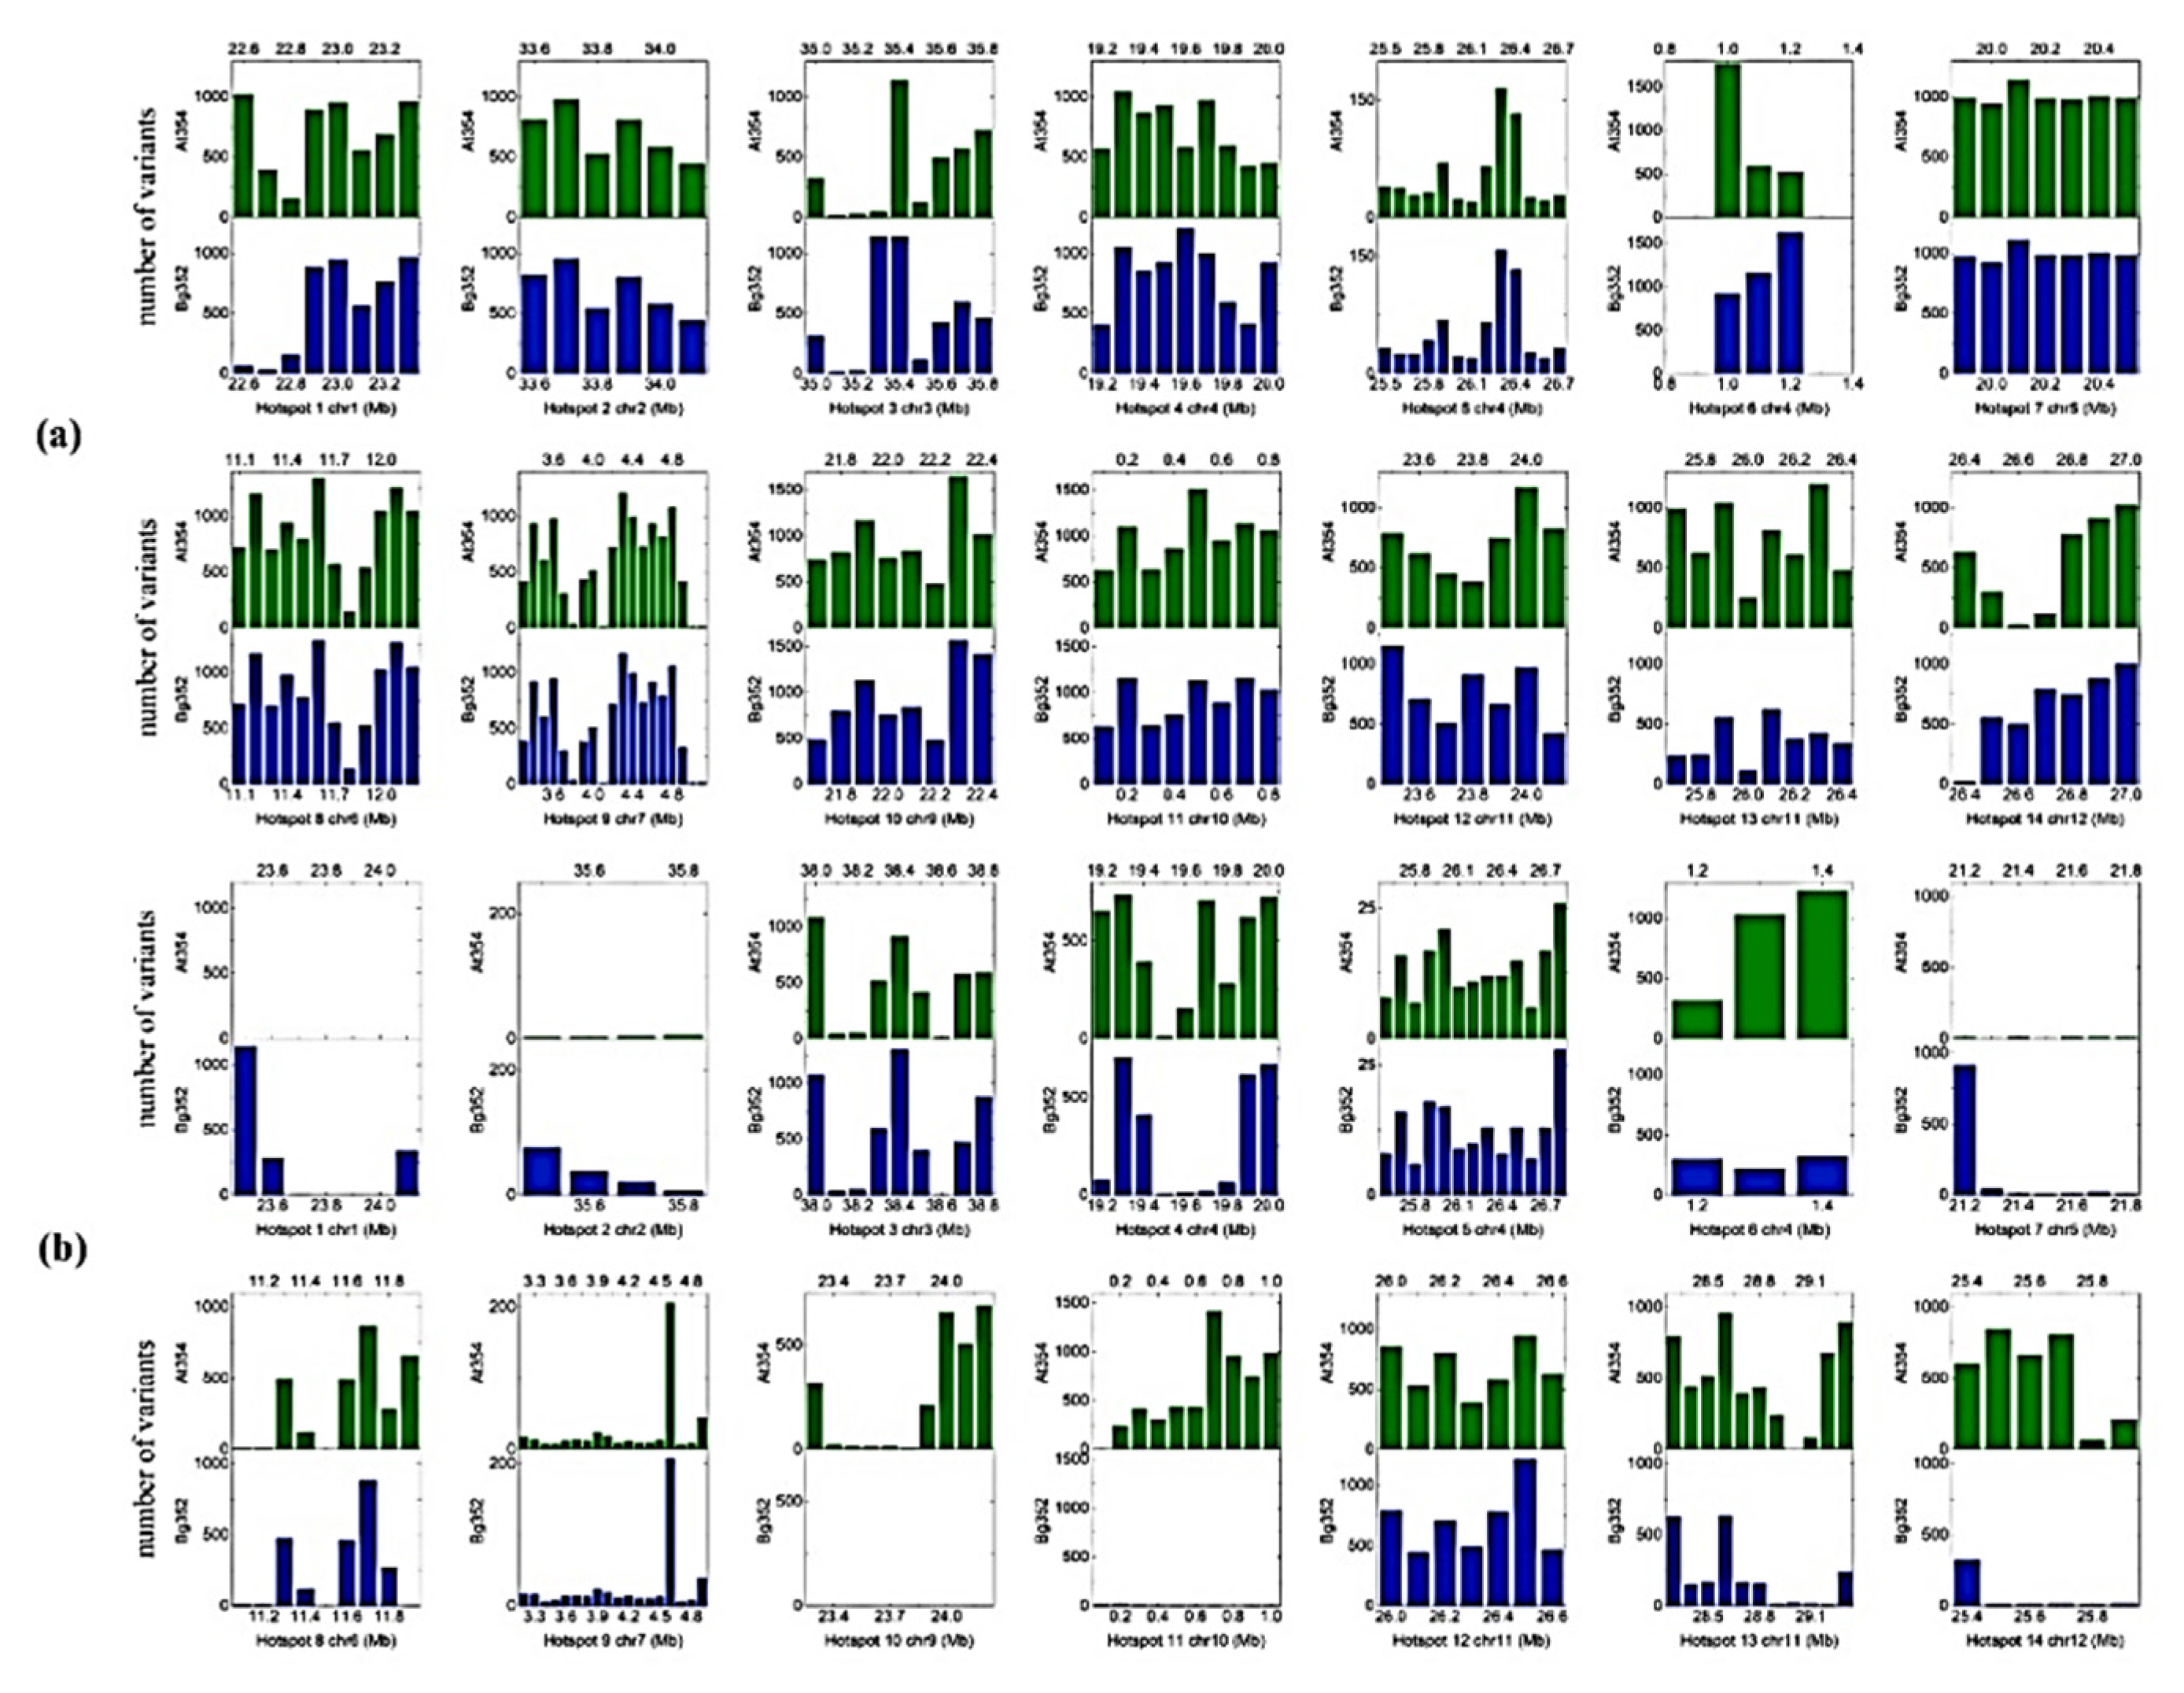
2.3. QTL-Based SNPs and InDels of Abiotic Stress-Related Genes

QTL-based screening was performed on previously identified salinity stress-related QTL hotspots [35], and we observed slight deviations (0.1 Mb to 3.0 Mb) in the corresponding locations of QTL hotspots with reference to R498 (Figure 2). As expected, a low number of total variants were observed in R498 in each and every QTL examined compared to the Nipponbare. The most abundant variants were found in QTL hotspot 9 of At 354 parent with reference to Nipponbare while the least abundant variants were found in hotspot 10 of Bg 352 parent with reference to R498 (Supplementary Table S2). We found 1236 genes within QTL hotspots and the highest number of genes (215) was found on QTL hotspot 9 while the lowest number (51) was found on QTL hotspot 11. Out of them, 106 genes were associated with abiotic stress. The highest number of stress-related genes (19) was detected within QTL hotspot 2 located on chromosome 2. The lowest number of genes were on hotspots 6 and 12 located on chromosomes 4 and 11, respectively (Supplementary Table S2). In this study, we examined genes located in non-QTL regions to minimize the exclusion of other potential salinity-related genes. Accordingly, we selected 27 genes known for their association with salinity. Therefore, altogether 133 genes were used to examine the allelic differences for salinity.
In the above 133 genes, the variants located in exons, introns, 5′ UTR and 3′ UTR regions were analyzed (Supplementary Table S3). Accordingly, Os01g0581400 which was reported as serine-threonine protein kinase-related domain-containing protein possessed 21 nucleotide variants in the 5′ UTR, 16 variants in the exons and 10 variants in the introns in At 354 comparatively to Nipponbare sequence while Bg 352 possessed only 1 nucleotide variant in 3′ UTR. Os11g0661600 (similar to peroxidase), Os11g0669100 (calmodulin binding protein-like family protein), Os11g0621825 (similar to universal stress protein) were the genes with the highest number of nucleotide variants in exon regions in both of the varieties. Os11g0621825 (a protein similar to universal stress protein) possessed 110 variants in At 354 and 129 variants in Bg 352 in the intron regions, comparatively to Nipponbare. Os04g0423400 (similar to OSIGBa0076I14.3 protein) possessed 10 and 11 nucleotide variants in At 354 and Bg 352 respectively in the 3’ UTR.

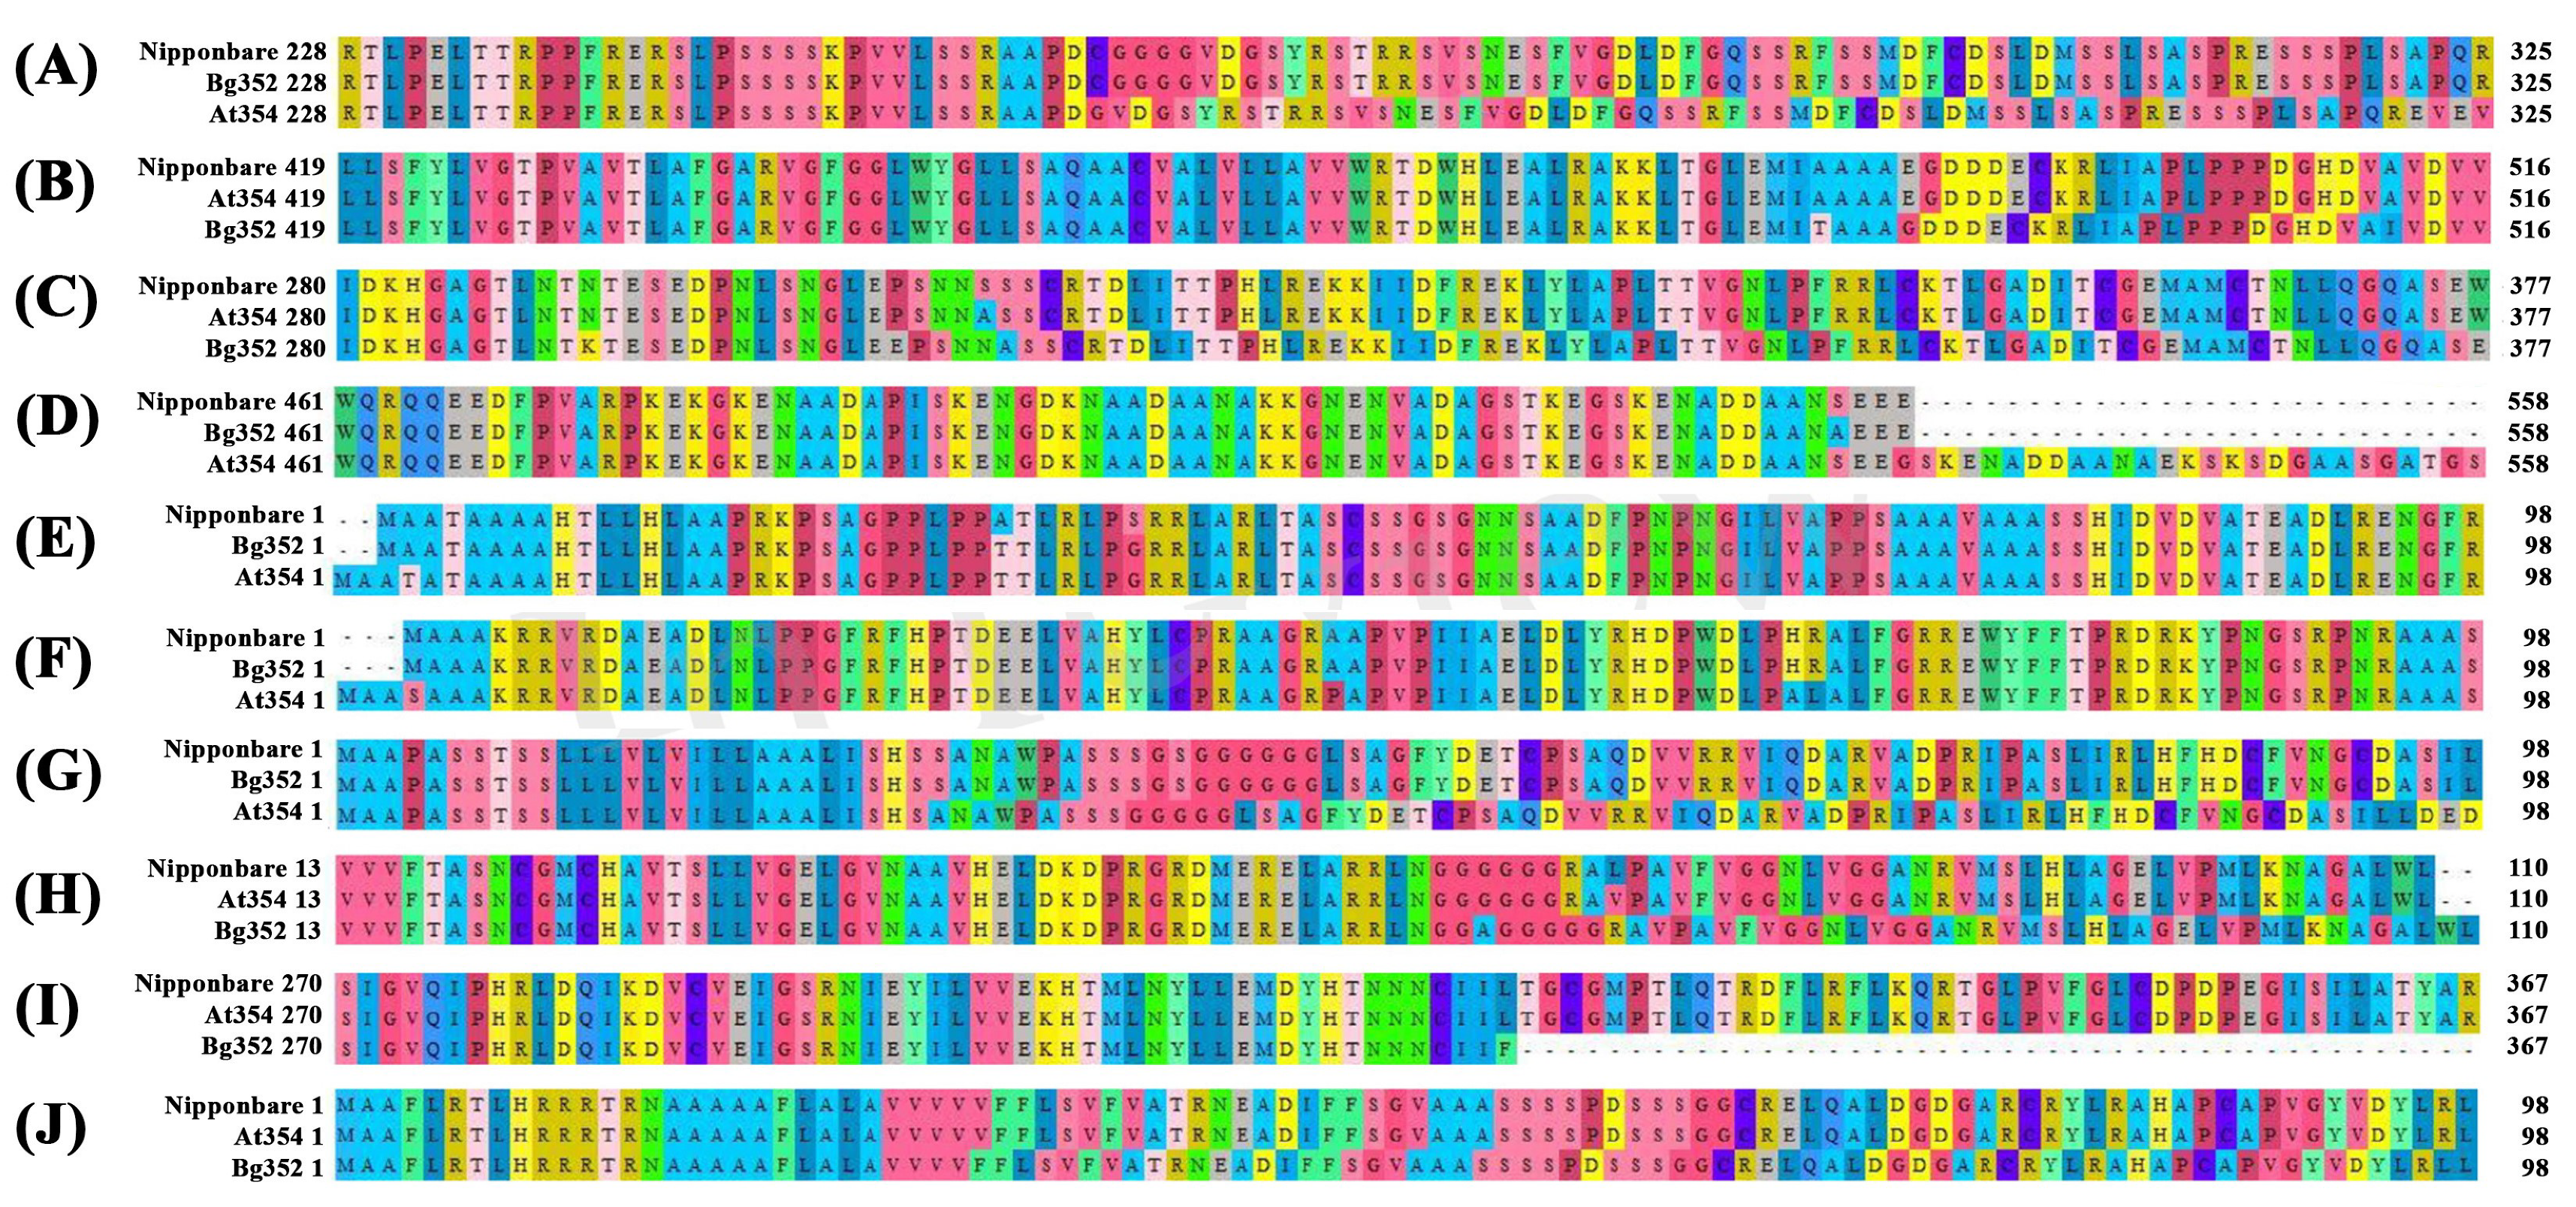
2.4. Screening Candidate Genes Based on Polymorphic Nucleotide Variants between Two Parents

This study was aiming at finding polymorphic nucleotide variants between two parents with the potential of salinity tolerance based on allelic differences. Therefore, we screened the genes that showed at least one difference in exons of the nucleotide sequence in one parent comparatively to the other parent from the above 133 gene list. As a result, we found 31 genes located within the QTL regions and three genes located outside the QTLs containing polymorphic variations in the exon region. Each one of them had either one of missense or frame shift or loss of stop codon or early gain of the start codon. Table 3 and Supplementary Table S4 shows the polymorphism type and the location of above 34 candidate genes extracted from the gene sequences of At 354 and Bg 352. Accordingly, we observed 84 variants including 72 SNPs and 12 InDels in 34 genes compared to Nipponbare reference while 73 variants including 63 SNPs and 10 InDels compared to R498 reference. Two InDel variants found in Os01g0307500 and Os04g0423400 with reference to Nipponbare were absent with reference to R498.
Os01g0581400 gene of At 354 (GenBank accession number: MK440689) was found with a 12 bp deletion and three missense mutations. In Bg 352, the gene (GenBank accession number: MK440690) encoded the full sequence with 765 amino acids while the sequence of At 354 shifted from 262 position and terminated with 761 amino acid residues due to the 12 bp deletion (Figure 3). GO analysis indicated that Os01g0581400 was responsible for protein phosphorylation in relation to stress (Supplementary Table S5, [36]).
The gene Os02g0766700 located within QTL hotspot 2 exhibited two missense mutations in Bg 352 leading to change in amino acid residues from lysine to asparagine and phenylalanine to leucine. According to GO analysis, this gene was reported to provide a regulatory function as a transcription factor in Abscisic Acid (ABA) signaling, water deprivation and salt stress (Supplementary Table S5, [37,38]. Another gene, Os02g0782500, located on the same QTL was found with one missense variant in At 354 which changed the glycine to serine.
The gene Os03g0839200 on QTL hotspot 3 associated with protein detoxification had a 3 bp deletion and a 3 bp insertion at two different locations in Bg 352 (GenBank accession number: MK440692). These two mutations caused a change in amino acid sequence from 490 position in Bg 352 and terminated with 516 amino acids. In At 354, the gene (GenBank accession number: MK440691) indicated encoding the full sequence as of Nipponbare with 516 amino acids (Figure 3). Another gene Os03g0795900, a heat stress transcription factor associated with tolerance to environmental stress [39], was found with two missense variants in At 354 sequence, changing serine into alanine and proline into serine.
In Bg 352, the gene Os04g0117600 (GenBank accession number: MK492739) had a 3 bp insertion and caused a frame shift in amino acid sequence starting from 310 position and terminated with 690 amino acids while At 354 (GenBank accession number: MK492738) showed encoding of full sequence with 689 amino acids. The gene is indicated as tRNA-dihydrouridine synthase-like gene [40]. Go analysis indicated that it could be involved in oxidation reduction biological processes.
Os05g0390500 of At 354 (GenBank accession number: MK492742) exhibited 2 bp insertion which leads to the loss of stop codon and extended the sequence up to 537 amino acid residues. The Bg 352 (GenBank accession number: MK492743) sequence of the same gene indicated encoding for 536 amino acid protein similar to Nipponbare (Figure 3). This gene was located at QTL hotspot 7 from which the salt tolerance was contributed by At 354 parent as indicated by the additive effect of the QTL (Table 3). Although Os06g0318500 was found with four missense alternative variants in Bg 352 with reference to Nipponbare, the gene was found only with three missense alternative variants with reference to R498, encoding three different amino acid residues in respective positions. GO analysis revealed that this gene functions similar to Sodium/hydrogen exchanger as reported by Panahi et al. (2013) and Reguera et al. (2014) [41,42].
Os07g0181000 which is associated with kinase activity and ion binding exhibited 6 bp insertion in At 354 (GenBank accession number: MK492744) which resulted in extended amino acid sequence with 580 amino acids while Bg 352 (GenBank accession number: MK492745) had the complete sequence coding for 578 amino acid protein. Os07g0225300 of At 354 (GenBank accession number: MK492754) showed an 8 bp insertion along with two missense variants. The 8 bp insertion has occurred just before the starting codon thereby leading for gaining of a start codon at three residues before the Nipponbare reference sequence (Figure 3).
The QTL hotspot 11 on chromosome 10 was spotted with five candidate genes in which two of them had frame shifts. In At 354, Os10g0107000 (GenBank accession number: MK492746) which is responsive to oxidative stress [43] possessed a 3 bp deletion, 3 bp insertion and a 9 bp deletion causing a frame shift in amino acid sequence starting from 28 position and terminated with 326 amino acids while Bg 352 (GenBank accession number: MK492747) encoded the full length of sequence with 329 amino acids. Os11g0621825, which codes for a protein similar to universal stress protein [44], was found with two missense mutations in Bg352. The gene Os11g0655900 which is important for cell redox homeostasis and electron transportation had a 6 bp insertion in At 354 (GenBank accession number: MK492750) causing a frame shift in its amino acid sequence starting from 65 position and terminating at 110 position. Both Bg 352 (GenBank accession number: MK492751) and Nipponabre coded for amino acid sequences with 108 amino acid residues (Table 3).
Out of three candidate genes of QTL hotspot 14 located on chromosome 12, two genes had frame shifts in Bg 352. A 2 bp insertion in Os12g0622500 of Bg 352 resulted in a 323 amino acid protein due to early gain of stop codon while At 354 had the full sequence coding for 487 amino acids. The gene Os12g0624200 was found with a 3 bp deletion in Bg 352 and the mutation caused a frame shift starting from the 30 position and terminating at 586 position while At 354 encoded as that of the Nipponbare sequence with 587 amino acids. According to GO analysis, this gene encodes an integral membrane protein that involves transport activity (Supplementary Table S5). In addition, Os01g0583100, Os01g0591000, Os02g0148100, Os03g0838400, Os03g0839000, Os03g0848400, Os04g0116600, Os04g0430800, Os05g0393800, Os05g0455500, Os09g0559800, Os10g0103800, Os10g0105400, Os10g0109600, Os11g0656000, Os11g669100 and Os12g0623500 exhibited different missense variants leading to amino acid residue changes in one parent compared to the other parent (Supplementary Table S4).

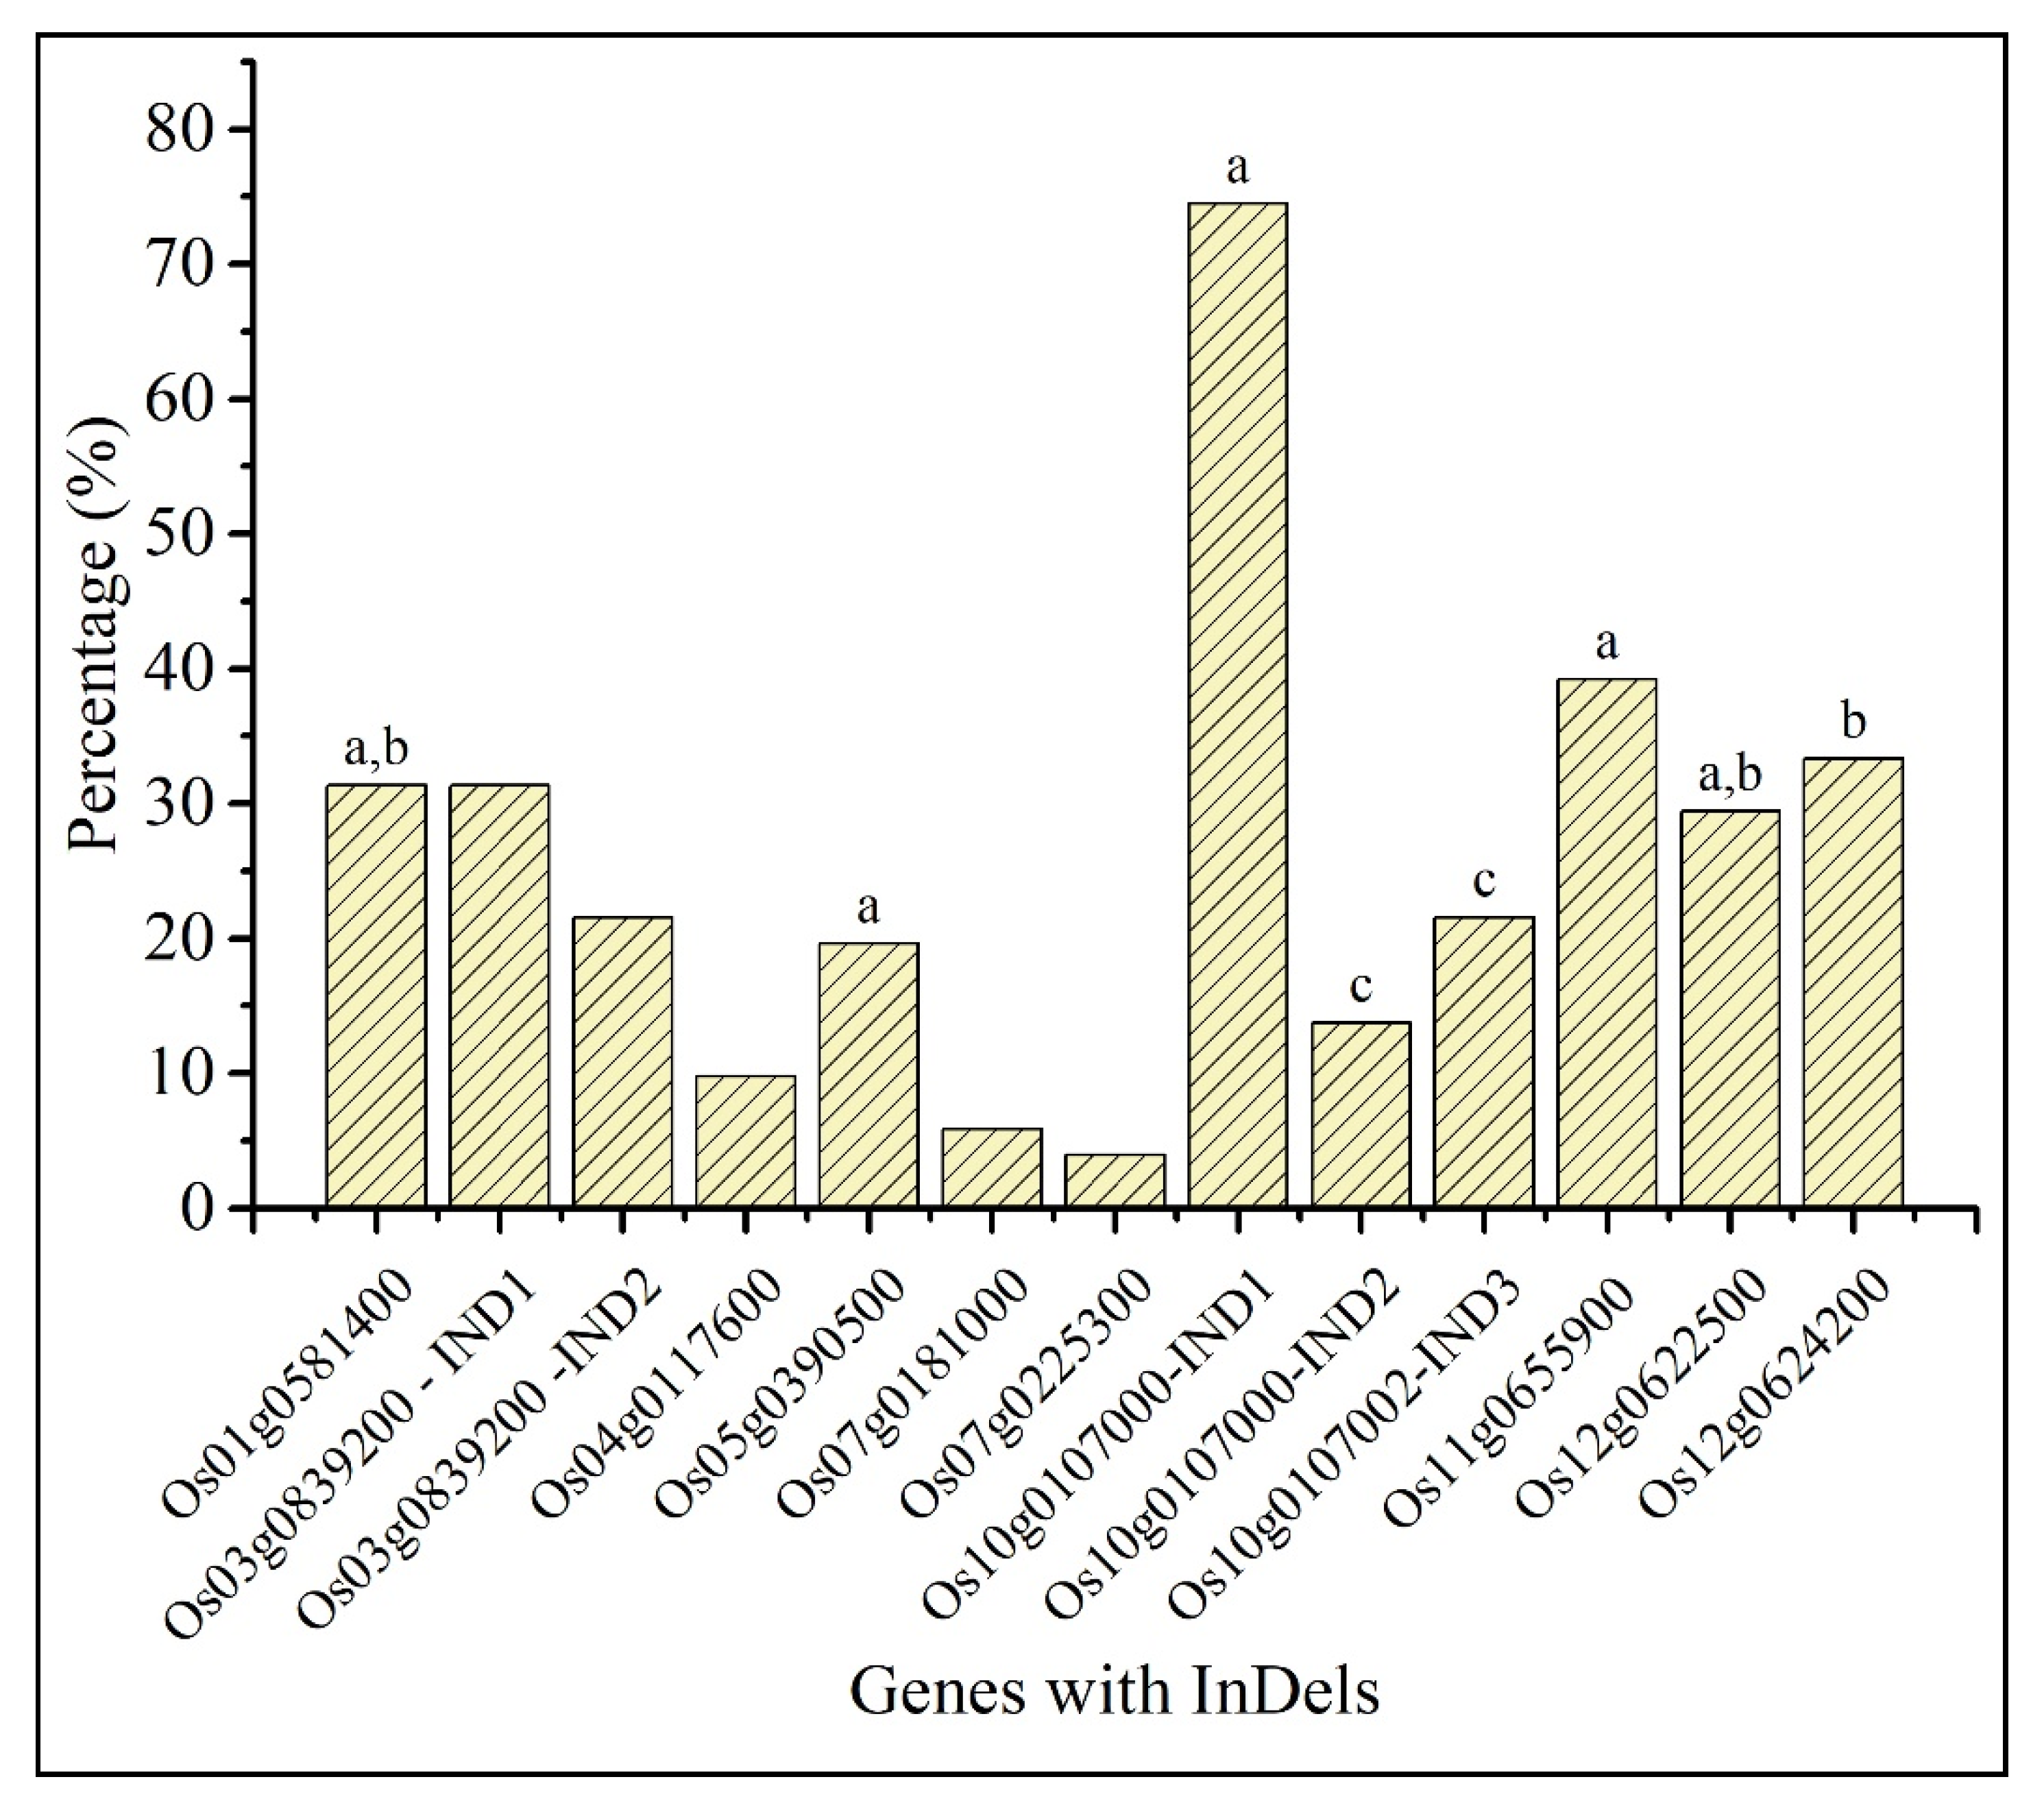
2.5. Comparative Analysis of InDels in Predicted Candidate Genes with indica Rice Lines

We compared the InDels of the predicted genes in a panel of indica rice lines and results revealed that their occurrence varied from approximately 4% to 75%. Of them, the allele of 3bp deletion in Os10g0107000 was the most abundant InDel while the allele of 9bp insertion in Os07g0225300 appeared to be a rare allele in the tested population (Figure 4, Supplementary Table S6). We noted that the 12 bp deletion of Os01g0581400 (GenBank accession number: MK440689) in At 354 was also present in other indica varieties such as Nona bokra and Pokkali (Figure 4, Supplementary Figure S1). In At 354, Os10g0107000 (GenBank accession number: MK492746) possessed a 3 bp deletion, 3 bp insertion and a 9 bp deletion causing a frame shift in amino acid sequence. The same mutations were observed in other salt-tolerant indica varieties such as FL478 and Pokkali. Os11g0655900 had a 6 bp insertion in At 354 (GenBank accession number: MK492750). Interestingly, the same mutation with 6 bp insertion was noted in Pokkali. The 2 bp insertion of Os12g0622500 in Bg 352 (GenBank accession number: MK492752) was also present in Nona bokra and Pokkali while the 3 bp deletion observed in Bg 352 allele of Os12g0624200 (GenBank accession number: MK492753) was detected in Nona bokra (Figure 4, Supplementary Figure S1). Accordingly, five genes with InDels found in this study were present in other known salt-tolerant varieties demonstrating evidence for their sequence validation.

2.6. Analysis of the Promoter Sequences of the Genes with InDels

We examined the cis-acting elements on abiotic stress, within promoter regions of candidate genes detected with Indels, to speculate their association with salinity, comparatively to At 354 and Bg 352. Supplementary Table S7 summarizes the particular cis-acting elements found within the 1000 bp 5′ upstream of each of the candidate genes. Nine types of abiotic stress-related cis-acting elements were found in this study. They are namely, ABRE, CAAT box, DPBF, GAGA, GBOX, IBOX, ROOT, SEF3, and SEF4 which belong to different transcription factor families involved in abiotic stress-related pathways. The highest number of abiotic stress-related cis regulatory elements were found in Os12g0622500 and the lowest number were found in the Os04g0117600. The Os10g0107000 gene had a comparatively notable difference in terms of the type and the number of cis-acting elements. In Bg 352, there were 30 cis-acting elements in Os10g0107000 gene while At 354 had only 24 cis-acting elements and the DPBF element was absent in At 354.

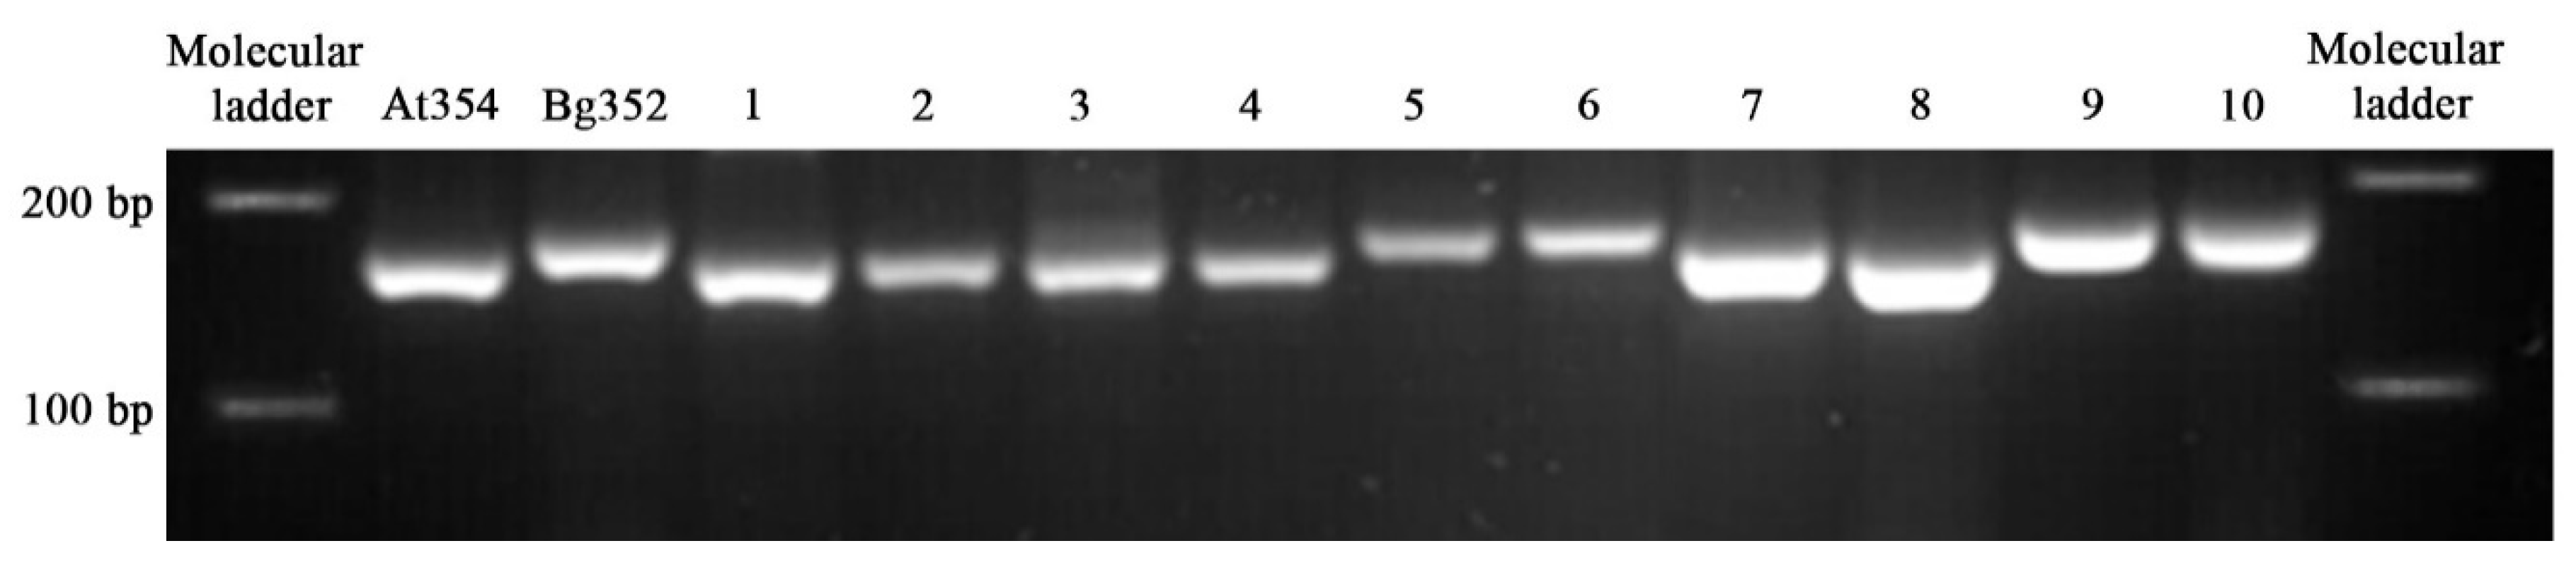
2.7. PCR-Based InDel Marker for the Detection of Genotypic Polymorphism

Although the accuracy of sequencing is proved, it is still a requirement to confirm the genotypic variations found by in silico experiments. Therefore, we selected the longest InDel present among 10 genes, which was the 12 bp deletion in At 354 of Os01g0581400 allele and designed an InDel marker (PKW) to reveal the polymorphism. The PCR product which was electrophoresed in 3% agarose showed a polymorphic banding pattern matching exactly with the corresponding genotype. Accordingly, At 354, several RILs and International Rice Research Institute (IRRI) germplasm (Pokkali-IRIS 313-8244, Kurulutudu-IRIS 313-8925, H6-IRIS 313-9472 and Puttu Nellu-IRIS 313-9969) were identified as mutated genotype possessing 12 bp deletion in Os01g0581400 (Figure 5, Supplementary Table S8). The results of this experiment have shown that prediction uncertainty of in-silico searchers could be eliminated by combining the task with wet laboratory experiment.

3. Discussion

In the present study, the whole genomes of two elite indica rice varieties, namely At 354 and Bg 352, were re-sequenced and mapped to both Oryza sativa L. cv. Nipponbare reference genome and Oryza sativa indica group cultivar R498. As Nipponbare is the current and most comprehensively curated reference genome for the Oryza sativa, our analysis was mainly conducted comparatively to Nipponbare while the data were validated using R498 indica reference. The near-complete R498 genome is an extra resource for studying genetic variations in rice belonging to indica subspecies [45]. Although the majority of reads were mapped to both reference genomes, unmapped read rates of 6% and 29% were observed for At 354 and Bg 352 respectively for Nipponbare and 3% and 27% were observed respectively for R498. The unmapped reads rate of At 354 is comparable with other indica rice varieties such as Godawee (8.35%), Swarna (11%) and IR64 (10%) [1,46,47]. Also, Subbaiyan et al. (2012) have observed an average unmapped rate of about 7.5% among 6 indica rice inbreds [48]. GC content of At 354 and Bg 352 has been 42.75% and 49.03% respectively, in line with the GC content of monocots that vary within the range of 34% to 49% usually [49]. According to the analysis of chromosome wise variations, a lower number of variants were observed in both varieties with respect to R498 than those of Nipponbare genome. Obviously, it is expected to capture a low number of variants comparatively to R498, because two parents belong to indica subspecies. The analysis of chromosome wise variations indicated that IR24, SH527 [50], Godawee [46], Swarna [47] and six elite indica rice inbreds [48] contained the highest and the lowest total number of variants on chromosome 1 and 9 respectively as that of At 354 and Bg 352 with respect to Nipponbare. However, the highest and the lowest total number of variants were observed on chromosome 4 and 10 with respect to R498. We calculated the density of occurrence of variants, in order to determine the genomic distribution of SNPs and InDels. The SNP and InDels densities of At 354 and Bg 352 were consistent with other indica rice varieties [43,44,45]. As reported by Tenaillon et al. (2001), a greater SNPs rate could be correlated with a higher level of genomic diversity [51]. In the present study, we observed the ratio of transitions to transversions as 2.54 and 2.48 respectively to Nipponbare and R498 indicating more transition SNPs than transversion SNPs showing transition bias. This incidence has been previously reported in rice genomes revealing 2.0 to 2.5 transitions to transversions ratio [46,47,48]. In order to maintain RNA stability and conserve the protein structure, transitional mutations have occurred more frequently than transversions during evolution [52].
In this study, abiotic stress-related genes located within previously identified QTL hotspots were analyzed to identify the variants in At 354 and Bg 352. Altogether, we used 14 QTL hotspots flanked less than 1 Mb intervals explaining 12.5–46.7% of phenotypic variation in salinity-related traits [35]. We could find 106 abiotic stress-related genes associated with these QTL hotspots. According to a frequency distribution analysis of genome-wide variations conducted by Jiang et al. (2017) [53], 10 highest SNPs and InDels rich regions were identified in the rice genome. Of them, three regions, chromosome 2 (33–35 Mb), 5 (19–22 Mb) and 6 (10–22 Mb) were exactly matched with the intervals of QTL hotspot 2, 4 and 8 of At 354 × Bg 352, respectively with reference to both Nipponbare and R498. This observation gives evidence to justify the polymorphic nature of the respective QTL regions, indicating the possible existence of allelic variations. Also, we detected the highest number of stress-related genes (19) on the QTL hotspot 2 indicating its potential contribution for salt responsive phenotypic variation. QTL hotspots were previously detected under phytotron conditions of the International Rice Research Institute, Philippines where all possible salinity-related QTLs might not have been expressed [35]. Therefore, in addition to the abiotic stress-related genes within the QTL hotspots, we considered 27 other abiotic stress-related genes which were involved in salt-tolerant pathways. Hence, altogether 133 genes were analyzed and polymorphic variants between At 354 and Bg 352 were observed to identify potential candidate genes. As exons are significantly important due to their function in presenting mRNA and coding the proteins, here we focused mainly on the alternative variants in exons between At 354 and Bg 352.
The SNPs are single-point mutations observed in the genomic DNA of organisms. Some of the SNPs cause the amino acid substitution in the corresponding amino acid sequence (missense mutations) of the genes while others are not (silent mutations) [54]. The missense mutations affect the protein function indirectly through effects on protein folding, stability, flexibility, and aggregation. Modification of the protein to be more flexible or rigid, compared to the respective native structure affects the protein function adversely. If a missense mutation occurred in an active site of a protein structure, it could possibly alter the biological or biochemical reactions and change the kinetics of the reaction and affect the normal protein function [54,55]. There are a number of studies that have shown the functional consequences of SNPs. Wang et al. (1997) [56] have shown that a missense mutation (adg2-1) in the ADPG Pyrophosphorylase large subunit gene either affects the stability of the ADGase large subunit protein or its assembly into holoenzyme in Arabidopsis thaliana. The S1-24 mutant in a highly conserved zinc finger domain of OsCESA7 gene in rice is due to a missense mutation, causing brittle culms, dwarfism and partial sterility. The influence of this mutation is predicted to be in affecting the interactions between different CESA subunits and OsCESA7 [57]. Tang et al. (2018) [58] have shown that a missense mutation in a plastid ribosomal protein (RPS4) in Chinese cabbage has impaired the rRNA processing and affected the ribosomal function. This information indicates that missense mutations occurred due to SNP variations in the gene sequences play an important role in affecting the gene functions in plants. Thus, in silico information on SNP variants reported in the present study, could possibly play an important role in regulating the functions of the genes under abiotic stress condition.
The candidate genes with InDels identified in the present study were compared with past research studies in order to speculate their function in relation to stress tolerance. Due to the fact that InDels of Os01g0307500 and Os04g0423400 did not appeared with reference to the R498, we did not consider them as true variants.
The gene, Os01g0581400 identified in the present study, also was reported by Chen et al. (2010) [36] indicating that it contains a juxtamembrane (JM) domain which regulates the proper function of receptor-like kinases (RLKs) by autophosphorylation. The RLKs play an important role in plant responses such as development, hormone perception, defense and response to pathogens [59,60]. Os01g0581400 had a 12 bp deletion in At 354 (GenBank accession number: MK440689) which truncated the sequence to 761 amino acids while Bg 352 (GenBank accession number: MK440690) showed coding of full sequence with 765 amino acids. This gene was found from QTL hotspot 1 and At 354 had been the respective allele donor for salt tolerance as shown by additive effect (Table 3). GO analysis also indicated that it functions as a protein kinase (GO:0004672) and its involvement in protein phosphorylation (GO:0006468) (Supplementary Table S5). It is interesting to note that At 354 allele which had 12 bp deletion leading to altered amino acid sequence was also present in Nona bokra and Pokkali which are popular salinity tolerant varieties (Supplementary Figure S1). Moreover, we could reveal the two types of alleles detected, in in silico analysis using a novel InDel marker confirming their physical presence in diverse varieties (Figure 5). Although the presence of two types of alleles of Os01g0581400 was proved in the RIL population and other diverse germplasm, we could not interpret the haplotype contribution to salt responsiveness due to genetic complexity of the trait, because none of the salt-tolerant donors has all the desirable alleles for tolerance mechanisms while a salt-susceptible line may also contain few desirable alleles, affecting for unpredictable cumulative effect. The same perception was supported by Islam et al. (2019) [61], who reported the same gene, Os01g0581400 as a salt responsive candidate gene indicating that possible activation of protein kinase domain-containing protein (LOC_Os01g39970) of the particular gene under salt stress by QTL-meta-analysis, a precise estimation technique. However, they were also unable to demonstrate the association between the genes with meta-QTL linked makers and salt tolerance due to complexity of the trait. Therefore, we suggest that the InDel marker developed from the mutation of Os01g0581400 would be useful to develop near-isogenic lines nullifying the complexity caused by other genes, to investigate the allele contribution for salt tolerance.
The Os01g0583100, potentially being another candidate gene located on the same QTL hotspot, possessed one missense mutation (Supplementary Table S4). It was reported as protein phosphatase 2C (PP2C6) family member of rice. The Os01g0583100 is regulated by ABA via ABA-responsive elements located on its promoter (GO:0048364, GO:0004722) (Supplementary Table S5) [62]. Yoshida et al. (2010) [63] have reported the function of PP2C genes in relation to water stress (GO:0009414) and drought conditions while Li et al. (2015) [64] have reported their importance in controlling root architecture and drought tolerance.
The Os01g0591000 (OsALDH2C4) and Os05g0455500 (OsALDH18B1), possessing missense mutations, located on QTL hotspot 1 and 7 respectively (Supplementary Table S4), were found belonging to rice aldehyde dehydrogenase (ALDH) protein superfamily [65]. Kotchoni et al. (2010) [65] have reported that OsALDH18B1 which is unique for rice, encodes an enzyme for proline synthesis (P5CS) (GO:0006561, GO:0004029, GO:0043878) and is important for salt stress adaptation and tolerance. Moreover, the ALDHs are capable of detoxifying the reactive aldehyde molecules which are produced under different abiotic stress conditions and maintain the redox balance in the cells [65,66].
The candidate gene Os02g0766700 (OsbZIP23) located on QTL hotspot 2, is a member of basic leucine zipper (bZIP) transcription factor family in rice, and it contains two missense variants in Bg 352 variety when compared to the At 354. Several gene expression studies have reported its sensitivity to drought, salt and osmotic stress responses [37,67]. Moreover, Xiang et al. (2008) have observed that OsbZIP23 is highly expressed in leaf tissues and its overexpression may enhance salt tolerance [38]. GO analysis also indicated its involvement in response to water deprivation (GO:0009414) and salt stress (GO:0009651).
The Os02g0782500 screened with a missense mutation, was also identified previously as an abiotic stress-responsive gene in rice and the function was categorized under small heat stress protein (sHSP) class III by Yi et al. (2013) [68]. Also, Waters et al. (2008) [69] have reported that sHSPs are expressed in other plant response stresses such as drought, salinity, UV, osmotic and oxidative stresses in addition to heat and cold responses (GO:0009408, GO:0009644, GO:0009651, GO:0042542) (Supplementary Table S5). Therefore, the polymorphism between two alleles needs to be further characterized with regards to the function under salinity.
In our study, the salinity susceptible variety, Bg 352 was found with a 3bp insertion, 3bp deletion and three missense variants in Os03g0839200 (GenBank accession number: MK440692) that shifted the frame of the amino acid from 490 to 516. In accordance with the additive effect, this mutation indicates a possible contribution to salt susceptibility. Neerja et al. (2018) [70] have conducted a research on the transporter genes and found that the Os03g0839200 has been associated with multidrug and toxic compound extrusion (MATE) efflux family protein (GO:0006855, GO:0015238, GO:0015297), which is an integral component of the membrane involving in salt toxic ion extrusion.
The gene, Os04g0117600 was found possessing a 3 bp insertion in Bg 352 (GenBank accession number: MK492739) and the mutation caused a frame shift in amino acid sequence starting from 310 position and terminated with 690 amino acids. At 354 predicted the full sequence with 689 amino acids (GenBank accession number: MK492738). It was noted that the gene was located in the telomeric region of chromosome 4. According to the GO analysis, Os04g0117600 could be involved in tRNA dihydrouridine synthesis (GO:0002943), metal ion binding (GO:0046872) and oxidation reduction processes (GO:0055114).
An InDel variation was found in Os05g0390500 in QTL hotspot 7 located at 19.8–20.5 Mb of chromosome 5. GO analysis indicated that Os05g0390500 is responsive to salt stress (GO:0009651) (Supplementary Table S5). Os06g0318500 gene found with four SNP variations, is one of the five Na+/H+ exchanger (NHX) genes present in rice (GO:0009651, GO:0015385, GO:0015386) and several studies have shown that NHX genes are capable of regulating the Na+ and/or K+ uptake under high salinity conditions faced by plants [41,42,71]. Yang et al. (2016) [72] have reported that Os07g0181000, which contained a 6 bp insertion mutation in At 354 allele (GenBank accession number: MK492744), is a photosynthesis-related gene. However, the relevance of the gene to salinity needs to be further investigated.
The Os10g0107000 on QTL hotspot 11 was found with 3 InDels including a 3 bp insertion, 9 bp and 3 bp deletions in At 354 (GenBank accession number: MK492746) and the same mutations were also observed in other salt-tolerant indica varieties, FL478 and Pokkali. Os10g0107000 which was identified as a class III peroxidase family gene (GO:0004601, GO:0006979) has been upregulated in response to cadmium stress in rice [43]. In addition, Wang et al. (2015) [73] have observed that class III peroxidase genes are differentially expressed in response to abiotic stress in maize and play a significant role in roots.
Another two genes, Os11g0655900 (OsGRX23) and Os11g0656000 (OsGRX24) belonged to CC-type Glutaredoxin (GRX) family contained an InDel and missense mutations respectively. It was reported that GRXs regulate and participate in the redox-dependent signaling pathways (GO:0045454, GO:0009055, GO:0022900) and provide protection to plants over oxidative stress while being involved in several metabolic pathways [74,75]. Moreover, Garg et al. (2010) [74] have shown that Os11g0655900 is differentially expressed in rice seedlings under different abiotic stress conditions. The Os11g0655900 gene possessed a 6 bp insertion in At 354 (GenBank accession number: MK492750) while Bg 352 (GenBank accession number: MK492751) closely aligned with Nipponbare and R498. We noted that the allele contribution for salt tolerance was by At 354 although distortion was occurred by the extension of two additional amino acids. However, reference genomes- (Nipponbare and R498)-based alignments do not indicate which could be the distorted allele, whether At 354 or the reference genomes. Sometimes the At 354 allele could encode the correct version of the amino acid sequence because it gives two additional amino acids. Also, we observed that Pokkali contained the same 6 bp insertion in the particular location indicating that prevalence of the same allele in another salt-tolerant donor variety.
We observed that Os12g0622500 gene in Bg 352 (GenBank accession number: MK492752) had a 2 bp insertion truncating the sequence to 323 amino acids due to early gain of stop codon while At 354 had the full sequence length with 487 amino acids. We observed that the same mutation was present in Nona bokra giving evidence for the prevalence in another salt-tolerant donor variety. The Os12g0624200 belonging to the Ca2+/cation antiporter superfamily (GO:0055085) was detected with a 3 bp deletion in Bg 352 (GenBank accession number: MK492753) that shifted the amino acid frame starting from 30th amino acid position with reference to the Nipponbare and R498 genomes. Also, the allele of Bg 352 truncated the sequence to 586 amino acids while At 354 encoded the full sequence with 587 amino acids. Furthermore, studies have shown that Os12g0624200 is significantly upregulated in response to salinity and dehydration conditions imposed on rice suggesting its involvement in stress tolerance [76,77].
Not only the coding sequences, but also the 5′ upstream regions including the cis-acting elements of promoter sequences usually affect the expression of the genes. Therefore, analyzing variations of the cis-acting elements gives an insight into the understanding of functional variations of genes. Hence, we analyzed the cis-acting elements of the 10 candidate genes with InDels to examine their involvement in stress-related pathways and also to speculate possible causal factors in addition to the InDel variations (Supplementary Table S7). As a whole, the analysis of cis-acting elements in the promoter regions of the candidate genes, ABRE, CAAT box, DPBF, GAGA, GBOX, IBOX, ROOT, SEF3, and SEF4 were present approximately an equal number in all genes indicating their involvement in stress-related mechanisms as reported in several studies [78,79,80,81,82,83,84].
Recent research advances have shown that environmental stresses, do not only imbalance the ionic and osmotic homeostasis in plants but also weaken photosynthesis, redox reactions, and cellular energy depletion. Therefore, plants harbor a broader, overlapping set of genes that are involved in both biotic and abiotic stress responses and developmental processes, increasing the evidence that plant signaling does not operate as independent or parallel pathways [85]. Golldack et al. (2014) [86] have proposed a model on cross-talk of ABA, gibberellic acid and jasmonate signaling plant responses to abiotic stressors such as drought and salt, linking with other pathways leading to ROS detoxification, lipid signaling and structural adaptation of membranes. Thus, the ABA-related candidate genes found in this study (Os01g0583100 and Os02g0766700) could be involved in different inter-connected networks and pathways to function against salinity stress. Similarly, bZIPs, RLKs, PP2Cs, and other candidate genes found in this study would be involved in linking abiotic stresses such as heat, cold, osmotic, oxidative and salinity stress by mediating signaling cross-talks [14,85,87,88].

4. Materials and Methods

4.1. Plant Material and DNA Extraction

At 354 and Bg 352 varieties were selected for whole genome re-sequencing in this study. The rice seeds were grown under controlled conditions and the genomic DNA was extracted from leaf tissues of 2-week-old seedlings of At 354 and Bg 352 using the CTAB method [89].

4.2. Rice Whole Genome Re-Sequencing and Variant Calling

High throughput whole genome re-sequencing was performed using Illumina’s paired-end sequencing technology on the Hiseq 2000 platform for two rice varieties. The paired-end libraries were constructed for Bg 352 and At 354 according to the manufacturer’s protocol (Illumina Inc., Hayward, CA 94545, USA). After the clonal cluster generation, the DNA was sequenced by Illumina’s sequencing by synthesis (SBS) technology. The sequencing data were converted into raw data with 101 bp size reads and obtained BAM and fastq files for further analysis. After the raw reads were gone through the quality control process, the quality-filtered reads were mapped to two reference genomes, Oryza sativa japonica group cultivar Nipponbare IRGSP-1.0 (GenBank Assembly Accession: GCA_001433935.1) and Oryza sativa indica group cultivar Shuhui498 (R498) (GenBank Assembly Accession: GCA_002151415.1) using Burrows Wheeler Alignment (BWA) program [90] with default parameters. The duplicates in the aligned reads were removed and the alignment results were merged to generate indexed BAM files. Basic statistics including GC%, read depth, coverage and Q20/Q30 were calculated using the alignment results. The mapped reads were used to detect SNPs and InDels. After removing duplicates with Sambamba and identifying variants with SAMTools, information on each variant was gathered and classified by chromosomes. The variants were further filtered using parameters i.e., variant quality score ≥100 and zygosity (homozygous). Circos software was used to visualize the frequency distribution of the SNPs and InDels on 12 rice chromosomes of At 354 and Bg 352 with respect to Nipponbare genome and R498 genome.

4.3. Variation Analysis on Abiotic Stress-Related Genes and Prediction of Candidate Genes for Salinity

The QTL hotspot regions which were previously identified by QTL mapping of At 354 × Bg 352 were queried for prospective abiotic stress-related genes in the regions [35]. In addition, known salt tolerance-related genes were also selected. Gramene and NCBI GenBank Database [91,92] were used for identifying the abiotic stress-related genes. IRGSP-1.0 annotations were used in identifying the locations of the genes within QTLs. Respective coordinates of the R498 were obtained by matching the DNA sequences of IRGSP-annotated genes with R498. The SNP and InDel variants of the genes in the QTL regions of At 354 and Bg 352 genomes were classified according to their locations such as exons, introns, 5′ and 3′ untranslated regions (UTR) with respect to the Nipponbare. The SNPs and InDels which were polymorphic between At 354 and Bg 352 in the exons were further examined in the R498 reference. The amino acid changes due to SNPs were observed based on the Short Genetic Variations database (dbSNP) of NCBI [93]. The open reading frames (ORF) for the coding sequences (CDS) of the selected genes (with InDels) were predicted by NCBI ORF finder [94].

4.4. Comparative Analysis of InDels in Predicted Candidate Genes with indica Rice Lines

The nucleotide sequences of predicted genes in a panel of 50 rice cultivars including Sri Lankan rice varieties and popular salt-tolerant donor varieties, FL 478 (CX219), Nona bokra (IRIS 313-7736) and Pokkali (IRIS 313-8244) were retrieved from Rice SNP-Seek Database [95]. The concordance of InDel variations was examined with indica rice panel.

4.5. Analysis of the Promoter Sequences of the Genes with InDels

The 1000 bp 5′ upstream region of the selected candidate genes were retrieved for At 354 and Bg 352 varieties as the promoter sequences. The plant cis-acting regulatory DNA elements of each gene were obtained from the NEW PLACE database version 30.0 [96]. Out of the total cis-acting elements, the abiotic stress-related cis-acting elements were filtered using the already available literature [97].

4.6. GO Analysis

The candidate gene sequences of At 354 and Bg 352 were annotated with Blast2GO software using the blastn algorithm and the Cloud Blast database in order to identify the molecular function, biological process and the cellular components [98].

4.7. Data Availability

The gene sequence data for this study can be found at GenBank Repository. (https://www.ncbi.nlm.nih.gov/genbank/).
The VCF files for At 354 and Bg 352 with reference to Nipponbare and R498 genomes has been archived under the following accessions of EVA. (https://www.ebi.ac.uk/ena/data/view/PRJEB35319).
Project: PRJEB35319.
Analyses: ERZ1143791, ERZ1143792, ERZ1143793, ERZ1143794, ERZ1143795, ERZ1143796, ERZ1143797, ERZ1143798, ERZ1143799, ERZ1143800.

5. Conclusions

In this study, we re-sequenced two elite indica rice varieties—At 354 (salt-tolerant) and Bg 352 (salt susceptible)—with reference to japonica cultivar Nipponbare and indica cultivar R498 and detected high genetic variations through SNPs and InDels between two parents, particularly in their chromosomes and QTL regions. We identified a narrow deviation in QTL locations between Nipponbare and R498 references, ranging from 0.1 Mb to 3 Mb. In total, 106 abiotic stress-related genes were identified in QTL regions, most of which had polymorphic nucleotide variants between two parents. Of them, 34 genes were identified for the presence of polymorphic SNPs and InDels between parents with respect to Nipponbare, but only 32 variants were confirmed with the reference material of R498. Altogether 10 genes that contained InDels leading to altered amino acid sequences were identified and their mutated sequences were able to be validated due to their presence in other indica varieties. Further studies need to be focused on the functional characterization of particular alleles by expression studies under different salinity levels and exposure times in order to elucidate the contribution of mutations on salt tolerance. The different haplotypes revealed in this study would be useful for genetic improvement of rice through haplotype-based molecular breeding.

Supplementary Materials

The following are available online at https://www.mdpi.com/2223-7747/9/2/233/s1. Supplementary Table S1. Supporting references for QTL hotspots co-located in the same chromosomal regions reported in other breeding studies. Supplementary Table S2. Variants identified in abiotic stress-related genes with reference to Nipponbare genome. Supplementary Table S3. Abiotic stress-related cis acting elements revealed by the analysis of the promoter sequences of the genes with InDels. Supplementary Table S4. Candidate genes identified based on polymorphic SNPs in exons regions of two parents. Supplementary Table S5. GO analysis of the selected candidate genes. Supplementary Table S6. Presence of InDels in the selected rice panels. Supplementary Figure S1. InDels detected in the candidate genes and their sequence validation. A. Os01g0581400 B. Os10g0107000 C. Os11g0655900 D. Os12g0622500 E. Os12g0624200. Supplementary Table S7 Abiotic stress-related Cis acting elements revealed by the analysis of the promoter sequences of the genes with InDels. Supplementary Table S8 InDel marker information.

Author Contributions

Conceptualization, N.K. and D.G.; methodology, B.A., N.K. and D.G.; formal analysis, B.A. with the cooperation of V.H., D.L. and P.S.; investigation, B.A. and D.L.; writing—original draft preparation, B.A.; writing—review and editing, N.K., D.G., V.H., D.L. and P.S.; supervision, N.K., D.G. and V.H.; funding acquisition, N.K. All authors have read and agreed to the published version of the manuscript.

Funding

This research was funded by NATIONAL RESEARCH COUNCIL, Sri Lanka, grant number NRC 16-016.

Acknowledgments

We acknowledge International Rice Research Institute, Philippines for providing SNP data via Global Rice Science scholarship 2011 program. Also, we thank Rice Research and Development Institute, Batalegoda, Sri Lanka for providing rice seeds. Moreover, we acknowledge National Science Foundation, Sri Lanka for providing a postgraduate research scholarship under NSF/SCH/2019/01.

Conflicts of Interest

The authors declare no conflict of interest.

References

  1. Jain, M.; Moharana, K.C.; Shankar, R.; Kumari, R.; Garg, R. Genomewide discovery of DNA polymorphisms in rice cultivars with contrasting drought and salinity stress response and their functional relevance. Plant Biotechnol. J. 2014, 12, 253–264. [Google Scholar] [CrossRef] [PubMed]
  2. Ramya, M.; Raveendran, M.; Subramaniyam, S.; Jagadeesan, R. In silico analysis of drought tolerant genes in rice. Int. J. 2010, 3, 36–40. [Google Scholar]
  3. Reddy, I.N.B.L.; Kim, B.K.; Yoon, I.S.; Kim, K.H.; Kwon, T.R. Salt Tolerance in Rice: Focus on Mechanisms and Approaches. Rice Sci. 2017, 24, 123–144. [Google Scholar] [CrossRef]
  4. Wang, Y.; Zhang, L.; Nafisah, A.; Zhu, L.; Xu, J.; Li, Z. Selection efficiencies for improving drought/salt tolerances and yield using introgression breeding in rice (Oryza sativa L.). Crop J. 2013, 1, 134–142. [Google Scholar] [CrossRef] [Green Version]
  5. Umali, D.L. Irrigation-Induced Salinity; The World Bank: Washington, DC, USA, 1993; ISBN 978-0-8213-2508-7. [Google Scholar]
  6. Oster, J.D.; Shainberg, I. Soil responses to sodicity and salinity: Challenges and opportunities. Aust. J. Soil Res. 2001, 39, 1219–1224. [Google Scholar] [CrossRef]
  7. Srivastava, P.K.; Gupta, M.; Pandey, A.; Pandey, V.; Singh, N.; Tewari, S.K. Effects of sodicity induced changes in soil physical properties on paddy root growth. Plant Soil Environ. 2014, 60, 165–169. [Google Scholar]
  8. De Leon, T.B.; Linscombe, S.; Subudhi, P.K. Identification and validation of QTLs for seedling salinity tolerance in introgression lines of a salt tolerant rice landrace “Pokkali”. PLoS ONE 2017, 12, e0175361. [Google Scholar] [CrossRef]
  9. Koyama, M.L.; Levesley, A.; Koebner, R.M.; Flowers, T.J.; Yeo, A.R. Quantitative trait loci for component physiological traits determining salt tolerance in rice. Plant Physiol. 2001, 125, 406–422. [Google Scholar] [CrossRef] [Green Version]
  10. Naveed, S.A.; Zhang, F.; Zhang, J.; Zheng, T.Q.; Meng, L.J.; Pang, Y.L.; Xu, J.L.; Li, Z.K. Identification of QTN and candidate genes for Salinity Tolerance at the Germination and Seedling Stages in Rice by Genome-Wide Association Analyses. Sci. Rep. 2018, 8, 1–11. [Google Scholar] [CrossRef] [Green Version]
  11. Pang, Y.; Chen, K.; Wang, X.; Wang, W.; Xu, J.; Ali, J.; Li, Z. Simultaneous Improvement and Genetic Dissection of Salt Tolerance of Rice (Oryza sativa L.) by Designed QTL Pyramiding. Front. Plant Sci. 2017, 8, 1–11. [Google Scholar] [CrossRef] [Green Version]
  12. Tiwari, S.; Sl, K.; Kumar, V.; Singh, B.; Rao, A.R.; Sv, A.M.; Rai, V.; Singh, A.K.; Singh, N.K. Mapping QTLs for Salt Tolerance in Rice (Oryza sativa L.) by Bulked Segregant Analysis of Recombinant Inbred Lines Using 50K SNP Chip. PLoS ONE 2016, 11, e0153610. [Google Scholar] [CrossRef] [PubMed] [Green Version]
  13. Wang, Z.; Chen, Z.; Cheng, J.; Lai, Y.; Wang, J.; Bao, Y.; Huang, J.; Zhang, H. QTL Analysis of Na+ and K+ Concentrations in Roots and Shoots under Different Levels of NaCl Stress in Rice (Oryza sativa L.). PLoS ONE 2012, 7, e51202. [Google Scholar] [CrossRef] [PubMed] [Green Version]
  14. Hossain, M.R.; Bassel, G.W.; Pritchard, J.; Sharma, G.P.; Ford-Lloyd, B.V. Trait Specific Expression Profiling of Salt Stress Responsive Genes in Diverse Rice Genotypes as Determined by Modified Significance Analysis of Microarrays. Front. Plant Sci. 2016, 7, 567. [Google Scholar] [CrossRef] [PubMed] [Green Version]
  15. Lima, M.; Da, G.D.S.; Lopes, N.F.; Zimmer, P.D.; Meneghello, G.E.; Ferrari, C.; Mendes, C.R. Detection of genes providing salinity-tolerance in rice. Acta Sci. Biol. Sci. 2014, 36, 79–85. [Google Scholar] [CrossRef] [Green Version]
  16. Gupta, B.; Huang, B. Mechanism of Salinity Tolerance in Plants: Physiological, Biochemical, and Molecular Characterization. Int. J. Genom. 2014, 2014, 701596. [Google Scholar] [CrossRef]
  17. Liang, W.; Ma, X.; Wan, P.; Liu, L. Plant salt-tolerance mechanism: A review. Biochem. Biophys. Res. Commun. 2018, 495, 286–291. [Google Scholar] [CrossRef]
  18. Wang, G.-L.; Song, W.; Ruan, D.; Sideris, S.; Ronald, P. The cloned gene, Xa21, confers resistance to multiple Xanthomonas oryzae pv. oryzae Isolates in transgenic plants. Mol. Plant. Microbe. Interact. 1997, 9, 850–855. [Google Scholar] [CrossRef] [Green Version]
  19. Jahan, N.; Zhang, Y.; Lv, Y.; Song, M.; Zhao, C.; Hu, H.; Cui, Y.; Wang, Z.; Yang, S.; Zhang, A.; et al. QTL analysis for rice salinity tolerance and fine mapping of a candidate locus qSL7 for shoot length under salt stress. In Plant Growth Regulation; Springer: New York, NY, USA, 2019. [Google Scholar]
  20. Thomson, M.J.; de Ocampo, M.; Egdane, J.; Rahman, M.A.; Sajise, A.G.; Adorada, D.L.; Tumimbang-Raiz, E.; Blumwald, E.; Seraj, Z.I.; Singh, R.K.; et al. Characterizing the Saltol quantitative trait locus for salinity tolerance in rice. Rice 2010, 3, 148–160. [Google Scholar] [CrossRef] [Green Version]
  21. Lim, J.-H.; Yang, H.-J.; Jung, K.-H.; Yoo, S.-C.; Paek, N.-C. Quantitative Trait Locus Mapping and Candidate Gene Analysis for Plant Architecture Traits Using Whole Genome Re-Sequencing in Rice. Mol. Cells 2014, 37, 149–160. [Google Scholar] [CrossRef] [Green Version]
  22. Matsumoto, T.; Wu, J.; Itoh, T.; Numa, H.; Antonio, B.; Sasaki, T. The Nipponbare genome and the next-generation of rice genomics research in Japan. Rice 2016, 9, 33. [Google Scholar] [CrossRef] [Green Version]
  23. Nguyen, T.D.; Moon, S.; Nguyen, V.N.T.; Gho, Y.; Chandran, A.K.N.; Soh, M.S.; Song, J.T.; An, G.; Oh, S.A.; Park, S.K.; et al. Genome-wide identification and analysis of rice genes preferentially expressed in pollen at an early developmental stage. Plant Mol. Biol. 2016, 92, 71–88. [Google Scholar] [CrossRef] [PubMed]
  24. Zhou, X.; Bai, X.; Xing, Y. A Rice Genetic Improvement Boom by Next Generation Sequencing. Curr. Issues Mol. Biol. 2018, 109–126. [Google Scholar] [CrossRef] [PubMed]
  25. Feltus, F.A.; Wan, J.; Schulze, S.R.; Estill, J.C.; Jiang, N.; Paterson, A.H. An SNP resource for rice genetics and breeding based on subspecies Indica and Japonica genome alignments. Genome Res. 2004, 14, 1812–1819. [Google Scholar] [CrossRef] [PubMed] [Green Version]
  26. Mishra, S.; Singh, B.; Panda, K.; Singh, B.P.; Singh, N.; Misra, P.; Rai, V.; Singh, N.K. Association of SNP Haplotypes of HKT Family Genes with Salt Tolerance in Indian Wild Rice Germplasm. Rice 2016, 9, 15. [Google Scholar] [CrossRef] [Green Version]
  27. Xu, K.; Xu, X.; Fukao, T.; Canlas, P.; Maghirang-Rodriguez, R.; Heuer, S.; Ismail, A.M.; Bailey-Serres, J.; Ronald, P.C.; Mackill, D.J. Sub1A is an ethylene-response-factor-like gene that confers submergence tolerance to rice. Nature 2006, 442, 705–708. [Google Scholar] [CrossRef]
  28. Lee, Y.W.; Gould, B.A.; Stinchcombe, J.R. Identifying the genes underlying quantitative traits: A rationale for the QTN programme. AoB Plants 2014, 6, 1–14. [Google Scholar] [CrossRef] [Green Version]
  29. Ma, Y.; Qin, F.; Tran, L.S.P. Contribution of genomics to gene discovery in plant abiotic stress responses. Mol. Plant 2012, 5, 1176–1178. [Google Scholar] [CrossRef]
  30. Temnykh, S.; Declerck, G.; Lukashova, A.; Lipovich, L.; Cartinhour, S.; Mccouch, S. Computational and Experimental Analysis of Microsatellites in Rice (Oryza sativa L.): Frequency, Length Variation, Transposon Associations, and Genetic Marker Potential. Genome Res. 2001, 11, 1441–1452. [Google Scholar] [CrossRef] [PubMed] [Green Version]
  31. Xing, Y.; Tan, Y.; Hua, J.; Sun, X.; Xu, C.; Zhang, Q. Characterization of the main effects, epistatic effects and their environmental interactions of QTLs on the genetic basis of yield traits in rice. Theor. Appl. Genet. 2002, 105, 248–257. [Google Scholar] [CrossRef]
  32. Thomson, M.J.; Singh, N.; Dwiyanti, M.S.; Wang, D.R.; Wright, M.H.; Perez, F.A.; Declerck, G.; Chin, J.H.; Malitic-layaoen, G.A.; Juanillas, V.M.; et al. Large-scale deployment of a rice 6 K SNP array for genetics and breeding applications. Rice 2017, 10, 40. [Google Scholar] [CrossRef] [Green Version]
  33. McCouch, S.R.; Wright, M.H.; Tung, C.-W.; Maron, L.G.; McNally, K.L.; Fitzgerald, M.; Singh, N.; DeClerck, G.; Agosto-Perez, F.; Korniliev, P.; et al. Open access resources for genome-wide association mapping in rice. Nat. Commun. 2016, 7, 10532. [Google Scholar] [CrossRef] [PubMed] [Green Version]
  34. Singh, N.; Jayaswal, P.K.; Panda, K.; Mandal, P.; Kumar, V.; Singh, B.; Mishra, S.; Singh, Y.; Singh, R.; Rai, V.; et al. Single-copy gene based 50 K SNP chip for genetic studies and molecular breeding in rice. Sci. Rep. 2015, 5, 11600. [Google Scholar] [CrossRef] [PubMed]
  35. Gimhani, D.R.; Gregorio, G.B.; Kottearachchi, N.S.; Samarasinghe, W.L.G. SNP-based discovery of salinity-tolerant QTLs in a bi-parental population of rice (Oryza sativa). Mol. Genet. Genom. 2016, 291, 2081–2099. [Google Scholar] [CrossRef] [PubMed]
  36. Chen, X.; Chern, M.; Canlas, P.E.; Jiang, C.; Ruan, D.; Cao, P.; Ronald, P.C. A conserved threonine residue in the juxtamembrane domain of the XA21 pattern recognition receptor is critical for kinase autophosphorylation and XA21-mediated immunity. J. Biol. Chem. 2010, 285, 10454–10463. [Google Scholar] [CrossRef] [Green Version]
  37. Shobbar, Z.S.; Oane, R.; Gamuyao, R.; De Palma, J.; Malboobi, M.A.; Karimzadeh, G.; Javaran, M.J.; Bennett, J. Abscisic acid regulates gene expression in cortical fiber cells and silica cells of rice shoots. New Phytol. 2008, 178, 68–79. [Google Scholar] [CrossRef]
  38. Xiang, Y.; Tang, N.; Du, H.; Ye, H.; Xiong, L. Characterization of OsbZIP23 as a Key Player of the Basic Leucine Zipper Transcription Factor Family for Conferring Abscisic Acid Sensitivity and Salinity and Drought Tolerance in Rice. Plant Physiol. 2008, 148, 1938–1952. [Google Scholar] [CrossRef] [Green Version]
  39. Wang, C.; Zhang, Q.; Shou, H. Identification and expression analysis of OsHsfs in rice. J. Zhejiang Univ. Sci. B 2009, 10, 291–300. [Google Scholar] [CrossRef] [Green Version]
  40. Wang, D.; Guo, Y.; Wu, C.; Yang, G.; Li, Y.; Zheng, C. Genome-wide analysis of CCCH zinc finger family in Arabidopsis and rice. BMC Genom. 2008, 9, 44. [Google Scholar] [CrossRef] [Green Version]
  41. Panahi, B.; Ahmadi, F.S.; Mehrjerdi, M.Z.; Moshtaghi, N. Molecular cloning and the expression of the Na+/H+antiporter in the monocot halophyte Leptochloa fusca (L.) Kunth. NJAS Wagening. J. Life Sci. 2013, 64–65, 87–93. [Google Scholar] [CrossRef] [Green Version]
  42. Reguera, M.; Bassil, E.; Blumwald, E. Intracellular NHX-Type Cation/H+ Antiporters in Plants. Mol. Plant 2014, 7, 261–263. [Google Scholar] [CrossRef] [Green Version]
  43. He, F.; Liu, Q.; Zheng, L.; Cui, Y.; Shen, Z.; Zheng, L. RNA-Seq Analysis of Rice Roots Reveals the Involvement of Post-Transcriptional Regulation in Response to Cadmium Stress. Front. Plant Sci. 2015, 6, 1136. [Google Scholar] [CrossRef] [PubMed] [Green Version]
  44. Sakai, H.; Lee, S.S.; Tanaka, T.; Numa, H.; Kim, J.; Kawahara, Y.; Wakimoto, H.; Yang, C.; Iwamoto, M.; Abe, T.; et al. Rice Annotation Project Database ( RAP-DB ): An Integrative and Interactive Database for Rice Genomics Special Focus Issue–Databases. Plant Cell Physiol 2013, 54, e6. [Google Scholar] [CrossRef]
  45. Du, H.; Yu, Y.; Ma, Y.; Gao, Q.; Cao, Y.; Chen, Z.; Ma, B.; Qi, M.; Li, Y.; Zhao, X.; et al. Sequencing and de novo assembly of a near complete indica rice genome. Nat. Commun. 2017, 8, 15324. [Google Scholar] [CrossRef] [PubMed]
  46. Singhabahu, S.; Wijesinghe, C.; Gunawardana, D.; Senarath Yapa, M.D.; Kannangara, M.; Edirisinghe, R.; Dissanayake, V.H.W. Whole Genome Sequencing and Analysis of Godawee, a Salt Tolerant Indica Rice Variety. Rice Res. Open Access 2017, 5, 1–9. [Google Scholar] [CrossRef] [Green Version]
  47. Rathinasabapathi, P.; Purushothaman, N.; Vl, R.; Parani, M. Whole genome sequencing and analysis of Swarna, a widely cultivated indica rice variety with low glycemic index. Sci. Rep. 2015, 5, 1–10. [Google Scholar] [CrossRef] [PubMed] [Green Version]
  48. Subbaiyan, G.K.; Waters, D.L.E.; Katiyar, S.K.; Sadananda, A.R.; Vaddadi, S.; Henry, R.J. Genome-wide DNA polymorphisms in elite indica rice inbreds discovered by whole-genome sequencing. Plant Biotechnol. J. 2012, 10, 623–634. [Google Scholar] [CrossRef]
  49. Šmarda, P.; Bureš, P.; Horová, L.; Leitch, I.J.; Mucina, L.; Pacini, E.; Tichý, L.; Grulich, V.; Rotreklová, O. Ecological and evolutionary significance of genomic GC content diversity in monocots. Proc. Natl. Acad. Sci. USA 2014, 111, E4096–E4102. [Google Scholar] [CrossRef] [Green Version]
  50. Li, S.; Wang, S.; Deng, Q.; Zheng, A.; Zhu, J.; Liu, H.; Wang, L.; Gao, F.; Zou, T.; Huang, B.; et al. Identification of genome-wide variations among three elite restorer lines for hybrid-rice. PLoS ONE 2012, 7, e30952. [Google Scholar] [CrossRef] [Green Version]
  51. Tenaillon, M.I.; Sawkins, M.C.; Long, A.D.; Gaut, R.L.; Doebley, J.F.; Gaut, B.S. Patterns of DNA sequence polymorphism along chromosome 1 of maize (Zea mays ssp. mays L.). Proc. Natl. Acad. Sci. USA 2001, 98, 9161–9166. [Google Scholar] [CrossRef] [Green Version]
  52. Batley, J.; Barker, G.; O’Sullivan, H.; Edwards, K.J.; Edwards, D. Mining for Single Nucleotide Polymorphisms and Insertions/Deletions in Maize Expressed Sequence Tag Data 1. Plant Physiol. 2003, 132, 84–91. [Google Scholar] [CrossRef] [Green Version]
  53. Jiang, S.; Sun, S.; Bai, L.; Ding, G.; Wang, T.; Xia, T.; Jiang, H.; Zhang, X.; Zhang, F. Resequencing and variation identification of whole genome of the japonica rice variety “Longdao24” with high yield. PLoS ONE 2017, 12, e0181037. [Google Scholar] [CrossRef] [Green Version]
  54. Zhang, Z.; Miteva, M.A.; Wang, L.; Alexov, E.; Diderot, P.; Cit, S.P. Analyzing Effects of Naturally Occurring Missense Mutations. Comput. Math. Methods Med. 2012, 2012, 805827. [Google Scholar] [CrossRef] [PubMed] [Green Version]
  55. Needham, C.J.; Bradford, J.R.; Bulpitt, A.J.; Care, M.A.; Westhead, D.R. Predicting the effect of missense mutations on protein function: Analysis with Bayesian networks. BMC Bioinform. 2006, 7, 405. [Google Scholar] [CrossRef]
  56. Wang, S.; Chu, B.; Lue, W.; Eimert, K.; Chen, J. adg2-1 represents a missense mutation in the ADPG pyrophosphorylase large subunit gene of Arabidopsis thaliana. Plant J. 1997, 11, 1121–1126. [Google Scholar] [CrossRef] [PubMed] [Green Version]
  57. Wang, D.; Qin, Y.; Fang, J.; Yuan, S.; Peng, L.; Zhao, J.; Li, X. A Missense Mutation in the Zinc Finger Domain of OsCESA7 Deleteriously Affects Cellulose Biosynthesis and Plant Growth in rice. PLoS ONE 2016, 11, e0153993. [Google Scholar] [CrossRef] [PubMed]
  58. Tang, X.; Wang, Y.; Zhang, Y.; Huang, S.; Liu, Z.; Fei, D.; Feng, H. A missense mutation of plastid RPS4 is associated with chlorophyll deficiency in Chinese cabbage (Brassica campestris). BMC Plant Biol. 2018, 18, 130. [Google Scholar] [CrossRef]
  59. Ramonell, K.M.; Goff, K.E. The Role and Regulation of Receptor-Like Kinases in Plant Defense. Gene Regul. Syst. Bio. 2007, 1, 167–175. [Google Scholar]
  60. Macdonald-Obermann, J.L.; Pike, L.J. The intracellular juxtamembrane domain of the epidermal growth factor (EGF) receptor is responsible for the allosteric regulation of EGF binding. J. Biol. Chem. 2009, 284, 13570–13576. [Google Scholar] [CrossRef] [Green Version]
  61. Islam, M.S.; Ontoy, J.; Subudhi, P.K. Meta-analysis of quantitative trait loci associated with seedling-stage salt tolerance in rice (Oryza Sativa L.). Plants 2019, 8, 33. [Google Scholar] [CrossRef] [Green Version]
  62. Xue, T.; Wang, D.; Zhang, S.; Ehlting, J.; Ni, F.; Jakab, S.; Zheng, C.; Zhong, Y. Genome-wide and expression analysis of protein phosphatase 2C in rice and Arabidopsis. BMC Genom. 2008, 9, 550. [Google Scholar] [CrossRef] [Green Version]
  63. Yoshida, T.; Fujita, Y.; Sayama, H.; Kidokoro, S.; Maruyama, K.; Mizoi, J.; Shinozaki, K.; Yamaguchi-Shinozaki, K. AREB1, AREB2, and ABF3 are master transcription factors that cooperatively regulate ABRE-dependent ABA signaling involved in drought stress tolerance and require ABA for full activation. Plant J. 2010, 61, 672–685. [Google Scholar] [CrossRef] [PubMed]
  64. Li, C.; Shen, H.; Wang, T.; Wang, X. ABA Regulates Subcellular Redistribution of OsABI-LIKE2, a Negative Regulator in ABA Signaling, to Control Root Architecture and Drought Resistance in Oryza sativa. Plant Cell Physiol. 2015, 56, 2396–2408. [Google Scholar] [CrossRef] [PubMed] [Green Version]
  65. Kotchoni, S.O.; Jimenez-Lopez, J.C.; Gao, D.; Edwards, V.; Gachomo, E.W.; Margam, V.M.; Seufferheld, M.J. Modeling-dependent protein characterization of the rice aldehyde dehydrogenase (ALDH) superfamily reveals distinct functional and structural features. PLoS ONE 2010, 5, e11516. [Google Scholar] [CrossRef] [PubMed]
  66. Hou, Q.; Bartels, D. Comparative study of the aldehyde dehydrogenase (ALDH) gene superfamily in the glycophyte Arabidopsis thaliana and Eutrema halophytes. Ann. Bot. 2015, 115, 465–479. [Google Scholar] [CrossRef] [PubMed] [Green Version]
  67. Zong, W.; Tang, N.; Yang, J.; Peng, L.; Ma, S.; Xu, Y.; Li, G.; Xiong, L. Feedback regulation of ABA signaling and biosynthesis by a bZIP transcription factor targets drought resistance related genes. Plant Physiol. 2016, 171, 00469. [Google Scholar] [CrossRef] [Green Version]
  68. Yi, S.Y.; Lee, H.Y.; Kim, H.; Lim, C.J.; Kim, W.B.; Jang, H.; Jeon, J.-S.; Kwon, S.-Y. Microarray Analysis of bacterial blight resistance 1 mutant rice infected with Xanthomonas oryzae pv. oryzae. Plant Breed. Biotechnol. 2013, 1, 354–365. [Google Scholar] [CrossRef] [Green Version]
  69. Waters, E.R.; Aevermann, B.D.; Sanders-Reed, Z. Comparative analysis of the small heat shock proteins in three angiosperm genomes identifies new subfamilies and reveals diverse evolutionary patterns. Cell Stress Chaperones 2008, 13, 127–142. [Google Scholar] [CrossRef] [Green Version]
  70. Neeraja, C.N.; Kulkarni, K.S.; Babu, P.M.; Rao, D.S.; Surekha, K.; Babu, V.R. Transporter genes identified in landraces associated with high zinc in polished rice through panicle transcriptome for biofortification. PLoS ONE 2018, 13, e0192362. [Google Scholar]
  71. Tian, N.; Wang, J.; Xu, Z.Q. Overexpression of Na+/H+ antiporter gene AtNHX1 from Arabidopsis thaliana improves the salt tolerance of kiwifruit (Actinidia deliciosa). S. Afr. J. Bot. 2011, 77, 160–169. [Google Scholar] [CrossRef] [Green Version]
  72. Yang, J.; Zhang, F.; Li, J.; Chen, J.P.; Zhang, H.M. Integrative analysis of the microRNAome and transcriptome illuminates the response of susceptible rice plants to rice stripe virus. PLoS ONE 2016, 11, e0146946. [Google Scholar] [CrossRef] [Green Version]
  73. Wang, Y.; Wang, Q.; Zhao, Y.; Han, G.; Zhu, S. Systematic analysis of maize class III peroxidase gene family reveals a conserved subfamily involved in abiotic stress response. Gene 2015, 566, 95–108. [Google Scholar] [CrossRef] [PubMed]
  74. Garg, R.; Jhanwar, S.; Tyagi, A.K.; Jain, M. Genome-wide survey and expression analysis suggest diverse roles of glutaredoxin gene family members during development and response to various stimuli in rice. DNA Res. 2010, 17, 353–367. [Google Scholar] [CrossRef] [PubMed] [Green Version]
  75. Meyer, Y.; Belin, C.; Delorme-Hinoux, V.; Reichheld, J.-P.; Riondet, C. Thioredoxin and Glutaredoxin Systems in Plants: Molecular Mechanisms, Crosstalks, and Functional Significance. Antioxid. Redox Signal. 2012, 17, 1124–1160. [Google Scholar] [CrossRef] [PubMed]
  76. Pittman, J.K.; Hirschi, K.D. Phylogenetic analysis and protein structure modelling identifies distinct Ca2+/Cation antiporters and conservation of gene family structure within Arabidopsis and rice species. Rice 2016, 9, 3. [Google Scholar] [CrossRef] [Green Version]
  77. Singh, A.K.; Kumar, R.; Tripathi, A.K.; Gupta, B.K.; Pareek, A.; Singla-Pareek, S.L. Genome-wide investigation and expression analysis of Sodium/Calcium exchanger gene family in rice and Arabidopsis. Rice 2015, 8, 21. [Google Scholar] [CrossRef] [Green Version]
  78. Yun, K.Y.; Park, M.R.; Mohanty, B.; Herath, V.; Xu, F.; Mauleon, R.; Wijaya, E.; Bajic, V.B.; Bruskiewich, R.; de los Reyes, B.G. Transcriptional regulatory network triggered by oxidative signals configures the early response mechanisms of japonica rice to chilling stress. BMC Plant Biol. 2010, 10, 16. [Google Scholar] [CrossRef] [Green Version]
  79. Kim, S.Y.; Chung, H.J.; Thomas, T. Isolation of a novel class of bZIP transcription factor that interact with ABA-responsive and embryo-specification elements in Dc3 promoter using a modified yeast one-hybrid system. Plant J. 1997, 11, 1237–1251. [Google Scholar] [CrossRef] [Green Version]
  80. Fujiwara, T.; Beachy, R.N. Tissue-specific and temporal regulation of a beta-conglycinin gene: Roles of the RY repeat and other cis-acting elements. Plant Mol. Biol. 1994, 24, 261–272. [Google Scholar] [CrossRef]
  81. Laloum, T.; Mita, D.; Gamas, P.; Niebel, A. CCAAT-box binding transcription factors in plants: Y so many? Trends Plant Sci. 2013, 18, 157–166. [Google Scholar] [CrossRef]
  82. Menkens, A.; Schinder, U.; Cashmore, A. The G-box: A ubiquitous regulatory DNA element in plants bound by the GBF family of bZIP proteins. Trends Biochem. Sci. 1995, 20, 506–516. [Google Scholar] [CrossRef]
  83. Santi, L.; Wang, Y.; Stile, M.R.; Berendzen, K.; Wanke, D.; Roig, C.; Pozzi, C.; Mu, K.; Mu, J.; Rohde, W.; et al. The GA octodinucleotide repeat binding factor BBR participates in the transcriptional regulation of the homeobox gene Bkn3. Plant J. 2003, 34, 813–826. [Google Scholar] [CrossRef] [PubMed]
  84. Vandepoele, K.; Quimbaya, M.; Casneuf, T.; De Veylder, L.; Van de Peer, Y. Unraveling Transcriptional Control in Arabidopsis Using cis-Regulatory Elements and Coexpression Networks. Bioinformatics 2009, 150, 535–546. [Google Scholar]
  85. Cooper, B.; Clarke, J.D.; Budworth, P.; Kreps, J.; Hutchison, D.; Park, S.; Guimil, S.; Dunn, M.; Luginbuhl, P.; Ellero, C.; et al. A network of rice genes associated with stress response and seed development. Proc. Natl. Acad. Sci. USA 2003, 100, 4945–4950. [Google Scholar] [CrossRef] [PubMed] [Green Version]
  86. Golldack, D.; Li, C.; Mohan, H.; Probst, N. Tolerance to drought and salt stress in plants: Unraveling the signaling networks. Front. Plant Sci. 2014, 5, 151. [Google Scholar] [CrossRef] [Green Version]
  87. Nigam, D.; Kumar, S.; Mishra, D.C.; Rai, A.; Smita, S.; Saha, A. Synergistic regulatory networks mediated by microRNAs and transcription factors under drought, heat and salt stresses in Oryza sativa spp. Gene 2015, 555, 127–139. [Google Scholar] [CrossRef] [PubMed]
  88. Szabados, L.; Savouré, A. Proline: A multifunctional amino acid. Trends Plant Sci. 2010, 15, 89–97. [Google Scholar] [CrossRef]
  89. Murray, M.G.; Thompson, W.F. Rapid isolation of high molecular weight plant DNA. Nucleic Acids Res. 1980, 8, 4321–4326. [Google Scholar] [CrossRef] [Green Version]
  90. Li, H.; Durbin, R. Fast and accurate short read alignment with Burrows—Wheeler transform. Bioinformatics 2009, 25, 1754–1760. [Google Scholar] [CrossRef] [Green Version]
  91. Gramene: A Comparative Resource for Plants. Available online: http://www.gramene.org/ (accessed on 12 October 2017).
  92. National Center for Biotechnology Information (NCBI). Available online: https://www.ncbi.nlm.nih.gov/ (accessed on 15 October 2017).
  93. NCBI Short Genetic Variations dbSNP. Available online: https://www.ncbi.nlm.nih.gov/SNP/snp_ref.cgi?locusId=4324197 (accessed on 12 November 2017).
  94. NCBI ORFfinder. Available online: https://www.ncbi.nlm.nih.gov/orffinder/ (accessed on 15 December 2018).
  95. Mansueto, L.; Fuentes, R.R.; Borja, F.N.; Detras, J.; Abriol-santos, M.; Chebotarov, D.; Sanciangco, M.; Palis, K.; Copetti, D.; Poliakov, A.; et al. Rice SNP-seek database update: New SNPs, indels, and queries. Nucleic Acids Res. 2017, 45, 1075–1081. [Google Scholar] [CrossRef]
  96. Higo, K.; Ugawa, Y.; Iwamoto, M.; Korenaga, T. Plant cis-acting regulatory DNA elements (PLACE) database: 1999. Nucleic Acids Res. 1999, 27, 297–300. [Google Scholar] [CrossRef] [Green Version]
  97. Xu, F.; Park, M.-R.; Kitazumi, A.; Herath, V.; Mohanty, B.; Yun, S.J.; de los Reyes, B.G. Cis-regulatory signatures of orthologous stress-associated bZIP transcription factors from rice, sorghum and Arabidopsis based on phylogenetic footprints. BMC Genom. 2012, 13, 497. [Google Scholar] [CrossRef] [PubMed] [Green Version]
  98. Conesa, A.; Stefan, G. Blast2GO: A Comprehensive Suite for Functional Analysis in Plant Genomics. Int. J. Plant Genom. 2008, 2008. [Google Scholar] [CrossRef] [PubMed]
Figure 1. Frequency distribution of single nucleotide polymorphisms (SNPs) and InDels in At 354 and Bg 352. (A) with reference to Nipponbare, (B) with reference to R498. (a) SNPs–At 354 (b)–InDels At 354 (c) SNPs–Bg 352 (d) InDels–Bg 352.
Plants 09 00233 g001
Figure 2. Location of 14 Quantitative Trait Loci (QTLs) on rice chromosomes and the total variants (SNPs and InDels) distribution within the QTLs in 100 kb windows. (a) with reference to Nipponbare, (b) with reference to R498.
Plants 09 00233 g002
Figure 3. Sequence alignment showing the amino acid sequence coded by putative candidate genes detected with InDel variations. (a) Os01g0581400, (b) Os03g0839200, (c) Os04g0117600, (d) Os05g0390500, (e) Os07g0181000, (f) Os07g0225300, (g) Os10g0107000, (h) Os11g0655900, (i) Os12g0622500, (j) Os12g0624200.
Plants 09 00233 g003
Figure 4. Presence of the InDels in the fifty indica rice panel. Inclusion of salt-tolerant donor varieties; Pokkali-IRIS 313-8244, Nona bokra-IRIS 313-7736 and FL478-CX219 are indicated by a, b, and c respectively.
Plants 09 00233 g004
Figure 5. InDel marker for the identification of Polymorphism in Os01g0581400. Lane (1). Pokkali-IRIS 313-8244, (2). Kurulutudu-IRIS 313-8925 (3).H6- IRIS 313-9472, (4).Puttu Nellu-IRIS 313-9969, (5).Honderawala-IRIS 313-11382, (6).Herath Banda-IRIS 313-11741, (7 to 10). RILs.3.
Plants 09 00233 g005
Table 1. Summary of sequencing statistics.
ReferenceRef Length Mapped Sites Total ReadsMapped ReadsMapped BasesMean DepthGC%Ts/Tv
Nipponbare374,304,577At 354349,124,521
(93.27%)
114,142,434108,034,211
(94.65%)
10,446,593,44327.9142.752.54
Bg 352348,205,846
(93.03%)
135,985,26896,223,079
(70.76%)
9,333,912,61124.9449.03
R498390,983,850At 354374,732,599
(95.84%)
114,127,820110,684,704
(96.98%)
10,689,439,22027.3442.752.48
Bg 352373,811,968
(95.61%)
135,973,74098,099,869
(72.15%)
9,548,473,92124.4249.03
Table 2. Occurrence and density of SNPs and InDels within the 12 chromosomes in At 354 and Bg 352 genomes after quality filtering.
At 354
ChNo of SNPsDensity (SNPs/100 kb)No of InDelsDensity (InDels /100kb)Total No of Variants
NipponbareR498NipponbareR498NipponbareR498NipponbareR498NipponbareR498
1285,179118,433659.1267.031,896770373.717.4317,075126,136
2242,40372,315674.5191.526,628510474.113.5269,03177,419
3230,91876,883634.1193.725,899513371.112.9256,81782,016
4198,076121,443557.9338.819,779677655.718.9217,855128,219
5167,93675,130560.6240.518,590470462.115.1186,52679,834
6217,31989,233695.4274.922,17954327116.7239,49894,665
7207,60379,157699.1261.420,678504669.616.7228,28184,203
8186,11991,487654.4305.419,01611,18466.937.3205,135102,671
9166,63078,222724.1315.916,56162237225.1183,19184,445
10180,21352,393776.5204.817,107485473.719.0197,32057,247
11218,52494,898753298.620,369815870.225.7238,893103,056
12177,44995,189644.5357.816,929762661.528.7194,378102,815
Bg 352
ChNo of SNPsDensity (SNPs/100kb)No of InDelsDensity (InDels /100kb)Total No of Variants
NipponbareR498NipponbareR498NipponbareR498NipponbareR498NipponbareR498
1282,510112,753652.9254.231,008756771.717.1313,518120,320
2234,21487,750651.7232.425,297595870.415.8259,51193,708
3240,77182,763661.2208.526,549541172.913.6267,32088,174
4214,856151,002605.2421.220,144756256.721.1235,000158,564
5160,43577,146535.5247.017,570469058.615.0178,00581,836
6211,33165,387676.3201.421,022417667.312.9232,35369,563
7215,71049,767726.4164.421,225344971.511.4236,93553,216
8180,10775,759633.2252.917,993847463.328.3198,10084,233
9159,50974,401693.1300.515,603645667.826.1175,11280,857
10180,63849,286778.4192.716,604313771.512.3197,24252,423
11215,175108,091741.4340.119,43662146719.6234,611114,305
12181,988104,139661.0391.516,774577460.921.7198,762109,913
Table 3. Candidate genes identified based on polymorphic InDels in exons regions of two parents.
NipponbareR498
GeneQTL Hotspots and Additive Effect aVariation TypeLocation ReferenceAt 354Bg 352Location ReferenceAt 354Bg 352Amino acid Position
Os01g058140001, At 354SNP22539348AGA23425343GGAI 20 M
SNP22539497AGA23425492GGAN 70 S
Indel22540408ACTGCGGCGGCGGCACACTGCGGCGGCGGC23426414ACACACTGCGGCGGCGGCframe shift
Os03g083920003, At 354SNP35266328AAG38332616AAGD 20 G
SNP35266337TTC38332625TTCV 23 A
SNP35267146GGA38333434GGAD 293 N
Indel38335687CGAAGCGAAGCG38335687CGAAGCGAAGCGframe shift
Indel35269310CCCCCCATC38335755CCCCCCATCframe shift
Os04g011760006, Bg 352SNP1047005CCT1342824TCTP 16 L
SNP1047150GAG1342968GAGG 64 D
SNP1048077CCT1343864TCTT 134 M
SNP1048092AAG1343879GAGN 139 S
Indel1051506AAAAAAGTA1346152AAGTAAAAAGTAframe shift
SNP1053033GCG1347696GCGS 585 T
Os05g039050007, At 354Indel18933030AGGAGGGGAGG20113492AGGGGAGGGGAGGGGframe shift
SNP18933023TTG20113527GTGS 529 A
Os07g018100009, Bg 352Indel4266957CGCCACCGCCACAGCCACCGCCAC4219095CGCCACCGCCACCGCCACframe shift
Os07g0225300 * Indel6968059TGGCGGCGTGGCGGCGTCGGCGGCGTGGCGGCG6890507TGGCGGCGTGGCGGCGTCGGCGGCGTGGCGGCGframe shift
SNP6968496GGA6890944AGAG 147 S
SNP6968832ATA6891280ATAM 259 L
SNP6968847CGC6891295CGCP 3264 A
Os10g010700011, Bg 352Indel482854GGTCGTCGGGTCGTCGTCGGGTCGTCG686457GGTCGTCGGGTCGTCGTCGGGTCGTCGframe shift
SNP483138CCT686741TCTS 179 N
SNP489170CGG686974GGGE 101 D
Indel489349CGCCGCCGGAGCCGCGCCGCGCCGCCGGAGCCG687153CGCCGCCGGAGCCGCGCCGCGCCGCCGGAGCCGframe shift
Indel489388CTGATGACTGACTGATGA687195CTGATGACTGACTGATGAframe shift
Os11g065590013, At 354Indel26270259CGCGCCGGAGCG29205256CGCGCCGGAGCGframe shift
SNP26270278CCG29205275GGGL 71 V
Os12g062250014, Bg 352SNP26579061AAG25614979GAGH 15 R
Indel26579981ATTATTATTTT25615899ATTTTATTATTTTframe shift
Os12g062420014, Bg 352Indel26669266CCGTCGTCGTCGTCGTCCCGTCGTCGTCGTCGTCCCGTCGTCGTCGTC25694767CCGTCGTCGTCGTCCCGTCGTCGTCGTCGTCCCGTCGTCGTCGTCframe shift
* Not within QTL hotspots a Allele donor was obtained from Additive effect of Gimhani et al. (2016) [35].

