Article

Influence of Semiquantitative [18F]FDG PET and Hematological Parameters on Survival in HNSCC Patients Using Neural Network Analysis

1
Department of Nuclear Medicine, Greater Poland Cancer Center, 61-866 Poznan, Poland
2
School of Dentistry and Health Science, Charles Sturt University, Wagga Wagga 2678, Australia
3
Department of Oncologic Pathology and Prophylaxis, Poznan University of Medical Sciences, 61-701 Poznan, Poland
4
Department of Tumor Pathology, Greater Poland Cancer Centre, 61-866 Poznan, Poland
5
Department of Electroradiology, Poznan University of Medical Science, 61-701 Poznan, Poland
6
2nd Radiotherapy Department, Greater Poland Cancer Center, 61-866 Poznan, Poland
7
Greater Poland Cancer Registry, Greater Poland Cancer Centre, 61-866 Poznan, Poland
8
Department of Otolaryngology and Maxillofacial Surgery, University of Zielona Gora, 65-046 Zielona Góra, Poland
9
Department of Head and Neck Surgery, Poznan University of Medical Sciences, Greater Poland Cancer Center, 61-866 Poznan, Poland
*
Author to whom correspondence should be addressed.
Pharmaceuticals 2022, 15(2), 224; https://doi.org/10.3390/ph15020224
Submission received: 23 December 2021 / Revised: 2 February 2022 / Accepted: 9 February 2022 / Published: 14 February 2022

Abstract

:
The aim of this study is to assess the influence of semiquantitative PET-derived parameters as well as hematological parameters in overall survival in HNSCC patients using neural network analysis. Retrospective analysis was performed on 106 previously untreated HNSCC patients. Several PET-derived parameters (SUVmax, SUVmean, TotalSUV, MTV, TLG, TLRmax, TLRmean, TLRTLG, and HI) for primary tumor and lymph node with highest activity were assessed. Additionally, hematological parameters (LEU, LEU%, NEU, NEU%, MON, MON%, PLT, PLT%, NRL, and LMR) were also assessed. Patients were divided according to the diagnosis into the good and bad group. The data were evaluated using an artificial neural network (Neural Analyzer version 2.9.5) and conventional statistic. Statistically significant differences in PET-derived parameters in 5-year survival rate between group of patients with worse prognosis and good prognosis were shown in primary tumor SUVmax (10.0 vs. 7.7; p = 0.040), SUVmean (5.4 vs. 4.4; p = 0.047), MTV (23.2 vs. 14.5; p = 0.010), and TLG (155.0 vs. 87.5; p = 0.05), and mean liver TLG (27.8 vs. 30.4; p = 0.031), TLRmax (3.8 vs. 2.6; p = 0.019), TLRmean (2.8 vs. 1.9; p = 0.018), and in TLRTLG (5.6 vs. 2.3; p = 0.042). From hematological parameters, only LMR showed significant differences (2.5 vs. 3.2; p = 0.009). Final neural network showed that for ages above 60, primary tumors SUVmax, TotalSUV, MTV, TLG, TLRmax, and TLRmean over (9.7, 2255, 20.6, 145, 3.6, 2.6, respectively) are associated with worse survival. Our study shows that the neural network could serve as a supplement to PET-derived parameters and is helpful in finding prognostic parameters for overall survival in HNSCC.

1. Introduction

Head and neck squamous cell carcinoma (HNSCC) originally develop from the mucosal epithelium in the oral cavity, pharynx, and larynx and is the sixth most common cancer worldwide, with 890,000 new cases and 450,000 deaths in 2018 [1]. Most oral cavity and larynx tumors are associated with alcohol and tobacco intake, while oropharynx are linked with human papilloma virus (HPV) infection [2]. Thus, the recent TNM classification mentioned the differences between HPV-positive and HPV-negative patients diagnosed with oropharyngeal cancer [3]. The 5-year survival rate for patients with localized disease is approximately 80%; around 50% in cases with lymph nodes metastases and 20% when distant metastases are diagnosed [4].
Positron emission tomography combined with computed tomography (PET/CT) is a commonly used imaging method in oncological patients. With the most widely used radiotracer 2-deoxy-2-[18F]fluoro-D-glucose ([18F]FDG), the method provides several metabolic and volumetric parameters such as standardized uptake value (SUV), metabolic tumor volume (MTV), total lesion glycolysis (TLG), and tumor-to-liver ratio (TLR), which are useful in assessing recurrence and overall survival (OS) in cancer patients including HNSCC [5,6,7].
In clinic, inflammatory markers including neutrophil-to-lymphocyte ration (NRL), platelet-to-lymphocyte ratio (PLR), monocyte-to-lymphocyte ratio (MLR), and lymphocyte-to-monocyte ratio (LMR) have been reported as prognostic factors in several solid tumors including breast cancer, colorectal cancer, lung cancer, prostate cancer, ovarian cancer, and HNSCC [8,9,10,11,12,13]. Based on these results, inflammatory response biomarkers are considered to be an additional tool for predicting outcomes in cancer patients [13,14].
Artificial Intelligence (AI) has begun to play an important role in almost all industries as well as in medical imaging. Machine learning (ML) has been used to predict subtypes of disease as it learns from the experience (medical images) and PET-based AI imaging helps to assess the clinical decision [15]. It is used in head and neck cancer for prediction of diagnosis, treatment response, overall survival, and defining gross tumor volume (GTV) [16,17].
The objective of this study is to assess the influence of PET-derived and hematological parameters on survival in head and neck squamous cell carcinoma patients using neural network analysis (Figure 1).

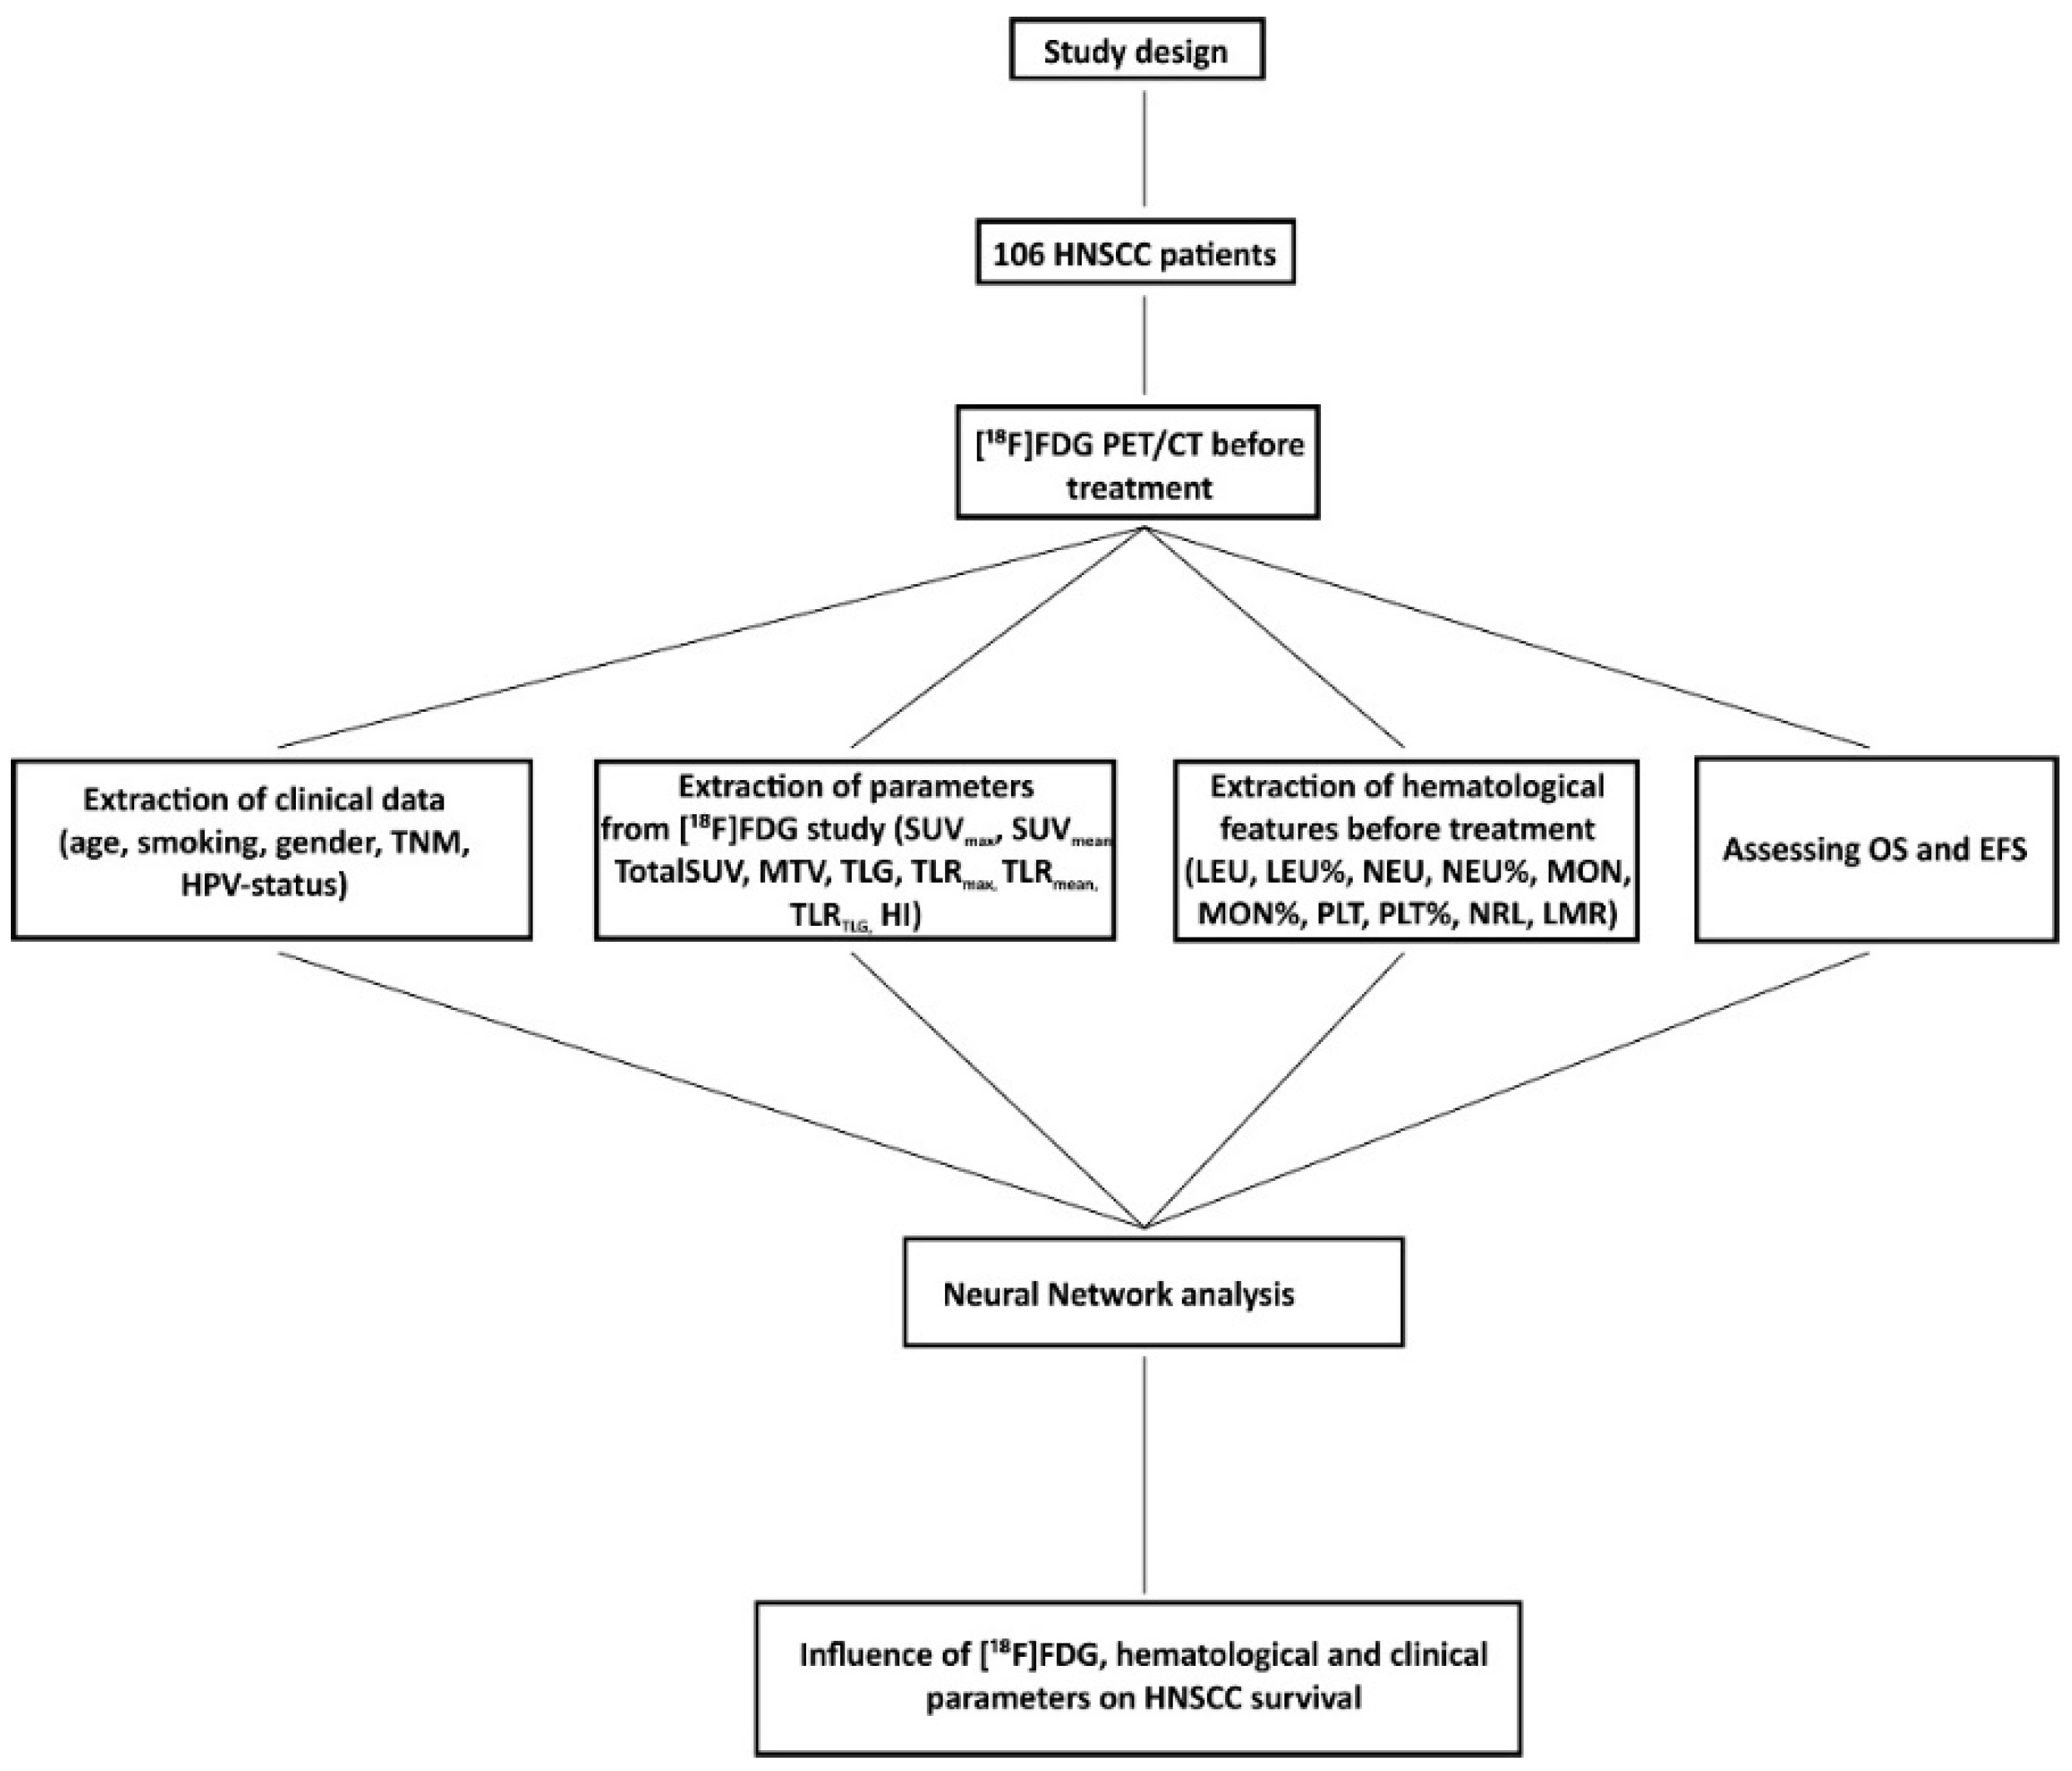
2. Materials and Methods

2.1. Patient Characteristics

A medical chart review was made and data related to age at the time of diagnosis, prior or current history of smoking, gender, TNM stage, HPV-status, and patient treatment were determined. Data obtained from the Greater Poland Cancer Registry Poznan, Poland were used to estimate the patients’ prognosis; based on these data, patients were divided into two groups: with good prognosis (they are still alive) and with worse prognosis (in whom cancer-related death was confirmed). Survival was assessed from date of primary diagnosis to death or date of the last information. Follow-up was assessed from the primary diagnosis to the date of the last information or death with mean time of 60 ± 25 months (ranged from 18–96 months). Patients were assessed during their clinical follow-ups for the first year every month, for the second year every 2 months, in the third year every three months, and every six months thereafter.

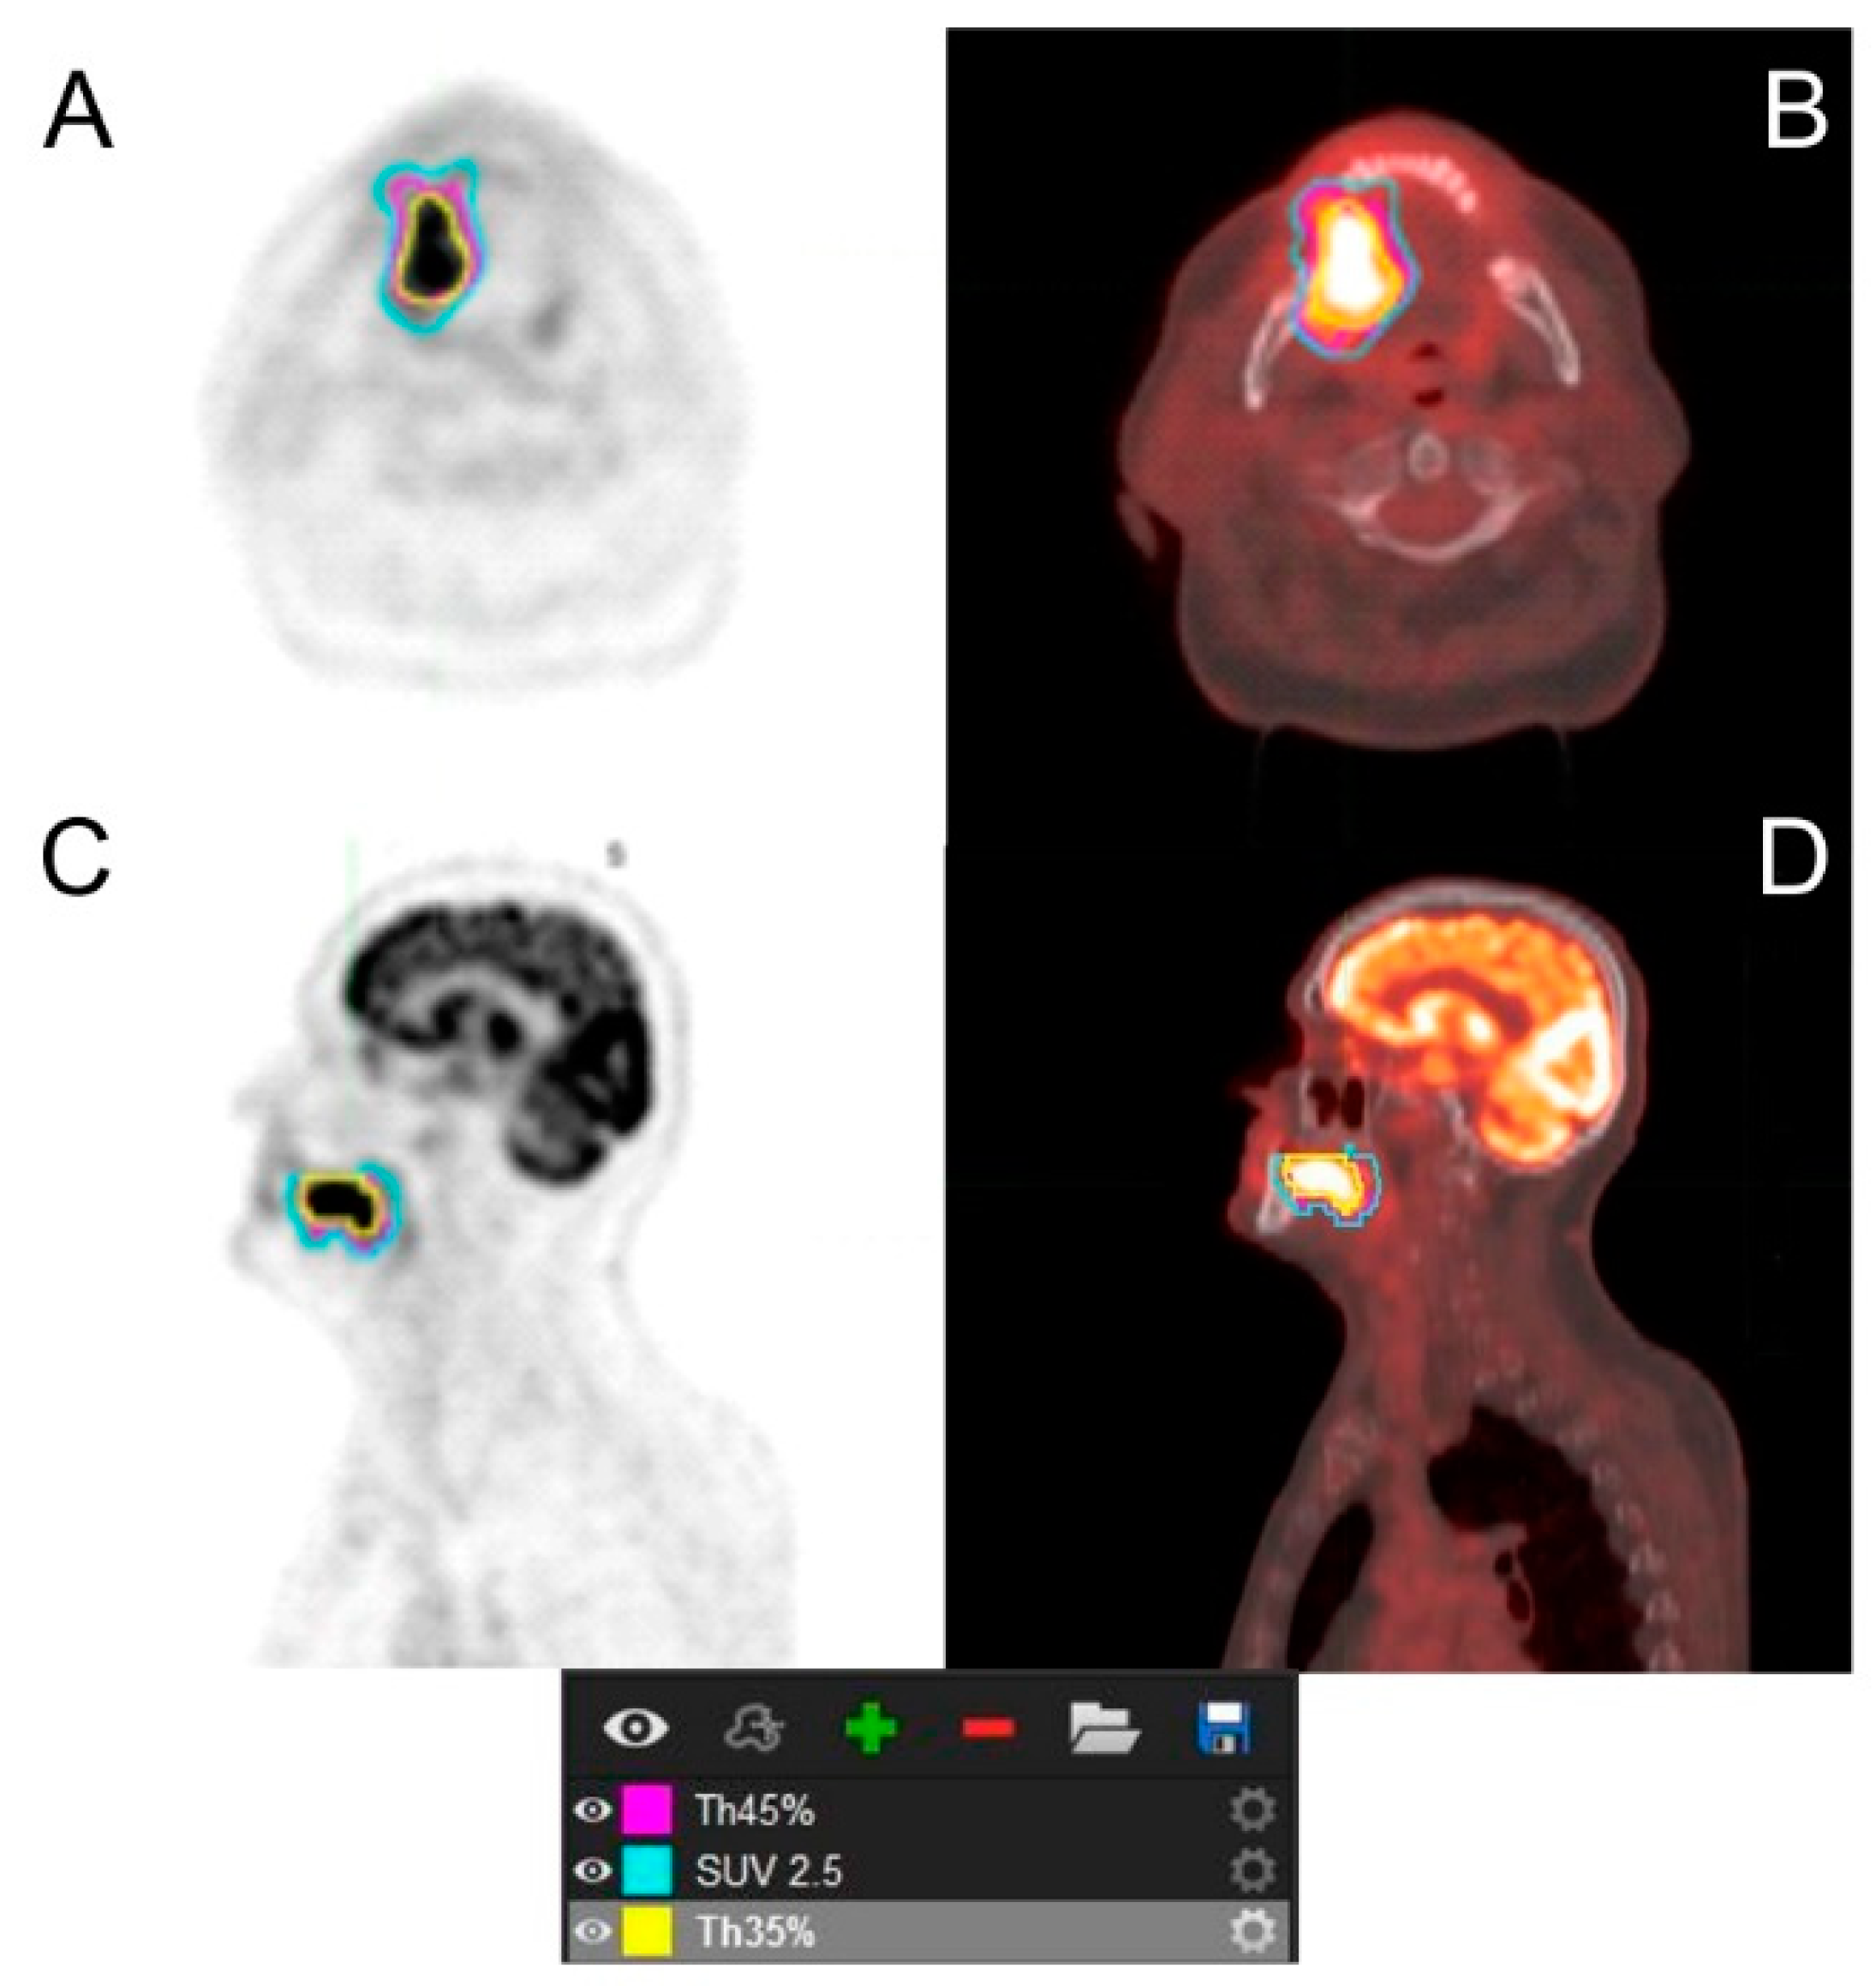
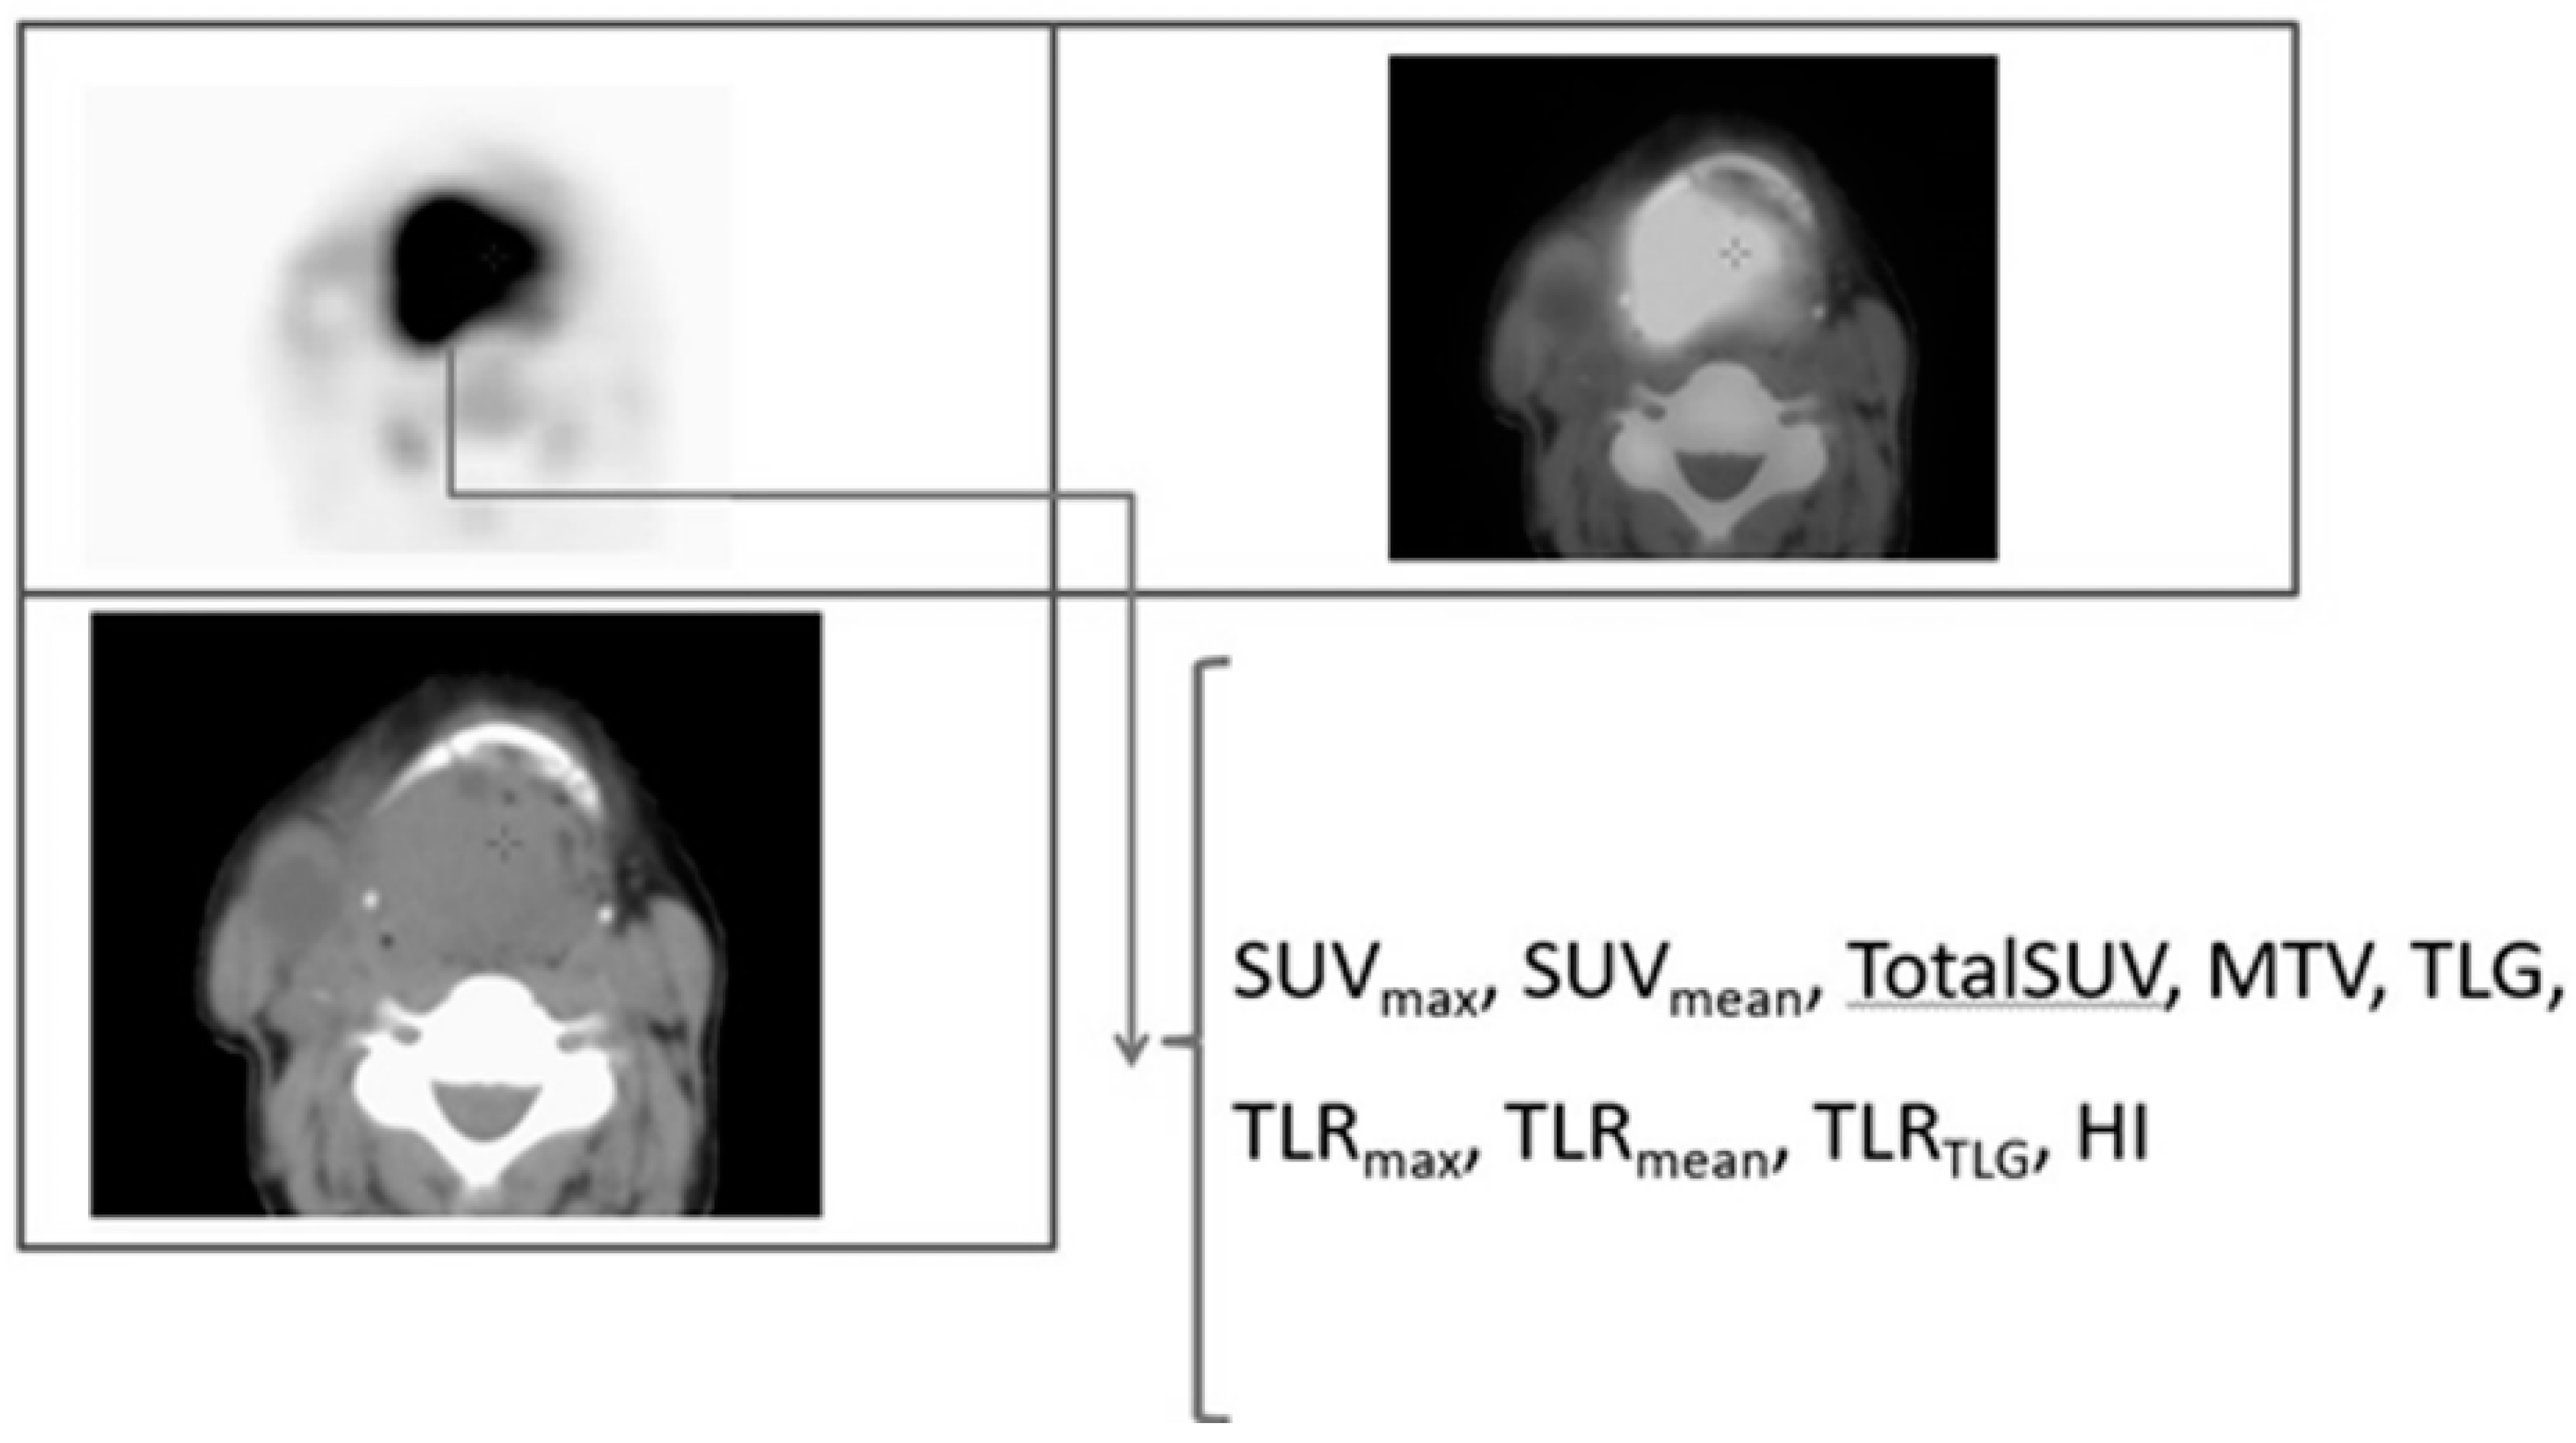
2.2. [18F]FDG PET/CT Analysis

Retrospective single-center analysis was performed on a group of histologically confirmed 106 HNSCC patients in whom a pretreatment [18F]FDG PET/CT study was performed between June 2009 and December 2019. PET scans were acquired with a Gemini TF PET/CT scanner 60–75 min p.i. 364 ± 75 MBq of [18F]FDG according to the standard EANM protocols to avoid artifacts and poor quality of images [18]. The review of fused PET/CT images and voxel measurements of the tumor were performed on a dedicated workstation in sagittal, coronal, and transverse planes. Choosing an appropriate contour method is crucial because it has an influence on the values of obtained parameters, especially SUVmean, MTV, and TLG. According to our previous study based on phantom analysis, Th35% was used as an appropriate segmentation method for tumor and lymph nodes delineation (Figure 2) [19].
Several semiquantitative PET parameters including SUVmax, SUVmean, TotalSUV, MTV, TLG, TLRmax, TLRmean, TLRTLG, and heterogeneity index (HI) for primary tumor (Figure 3) and lymph node with highest activity were assessed.
TLG was calculated as a product of the SUVmean and the MTV. The determination of liver SUV was obtained by drawing a 3D spherical ROI with a diameter of 3 cm in the normal right lobe of the liver. TLRmax was defined as the ratio of primary tumor SUVmax to individual liver SUVmax. Similar TLRmean and TLRTLG, were calculated. HI was estimated according to the following formula: HI=SUVmax/SUVmean [20]. Moreover, maximum, mean, and TLG lymph-nodes-to-tumor status (LN/T) were assessed. Statistical significance was calculated using Chi-Square analysis for nominal data and Student’s t test for continuous data. A p value less than or equal to 0.05 was considered significant.

2.3. Hematological Parameters Analysis

Hematological parameters such as absolute and percentage lymphocyte count (LEU, LEU%), absolute and percentage neutrophil count (NEU, NEU%), absolute and percentage monocyte count (MON, MON%), absolute and percentage platelet count (PLT, PLT%), neutrophil-to-lymphocyte ratio (NRL), and lymphocyte-to-monocyte ratio (LMR) were assessed within 3 days before treatment. Mean time between [18F]FDG PET/CT study and the treatment was one month (ranged from 2–5 months). Patients with the sign of infection were excluded from the analysis.

2.4. Neural Network Analysis

The data were evaluated using an artificial neural network developed using the in situ computer program previously described [21] (Neural Analyser version 2.9.5). There were 57 available input variables in 106 patients using a binary classification of better than median survival or worse than median survival. The heat map/correlation matrix identified redundant variables omitted from the neural network architecture. A 60:20:20 instances (cases) split was used for training, selection, and testing, respectively. The network architecture included 49 scaling layer inputs and 3 hidden layers of 6 nodes each, using a logistic activation function for a single probabilistic layer (binary). The weighted squared error method was used to determine the loss index and the neural parameters norm was used for the regularization method. A Quasi-Newton training method was employed using gradient information to estimate the inverse Hessian for each iteration of the algorithm (no second derivatives). The loss function associated with the training phase estimates the error associated with the data the neural network observes. The selection loss is a measure of the neural network’s agility and generalizability to new data. The initial value of the training loss was 1.198 and the final value was 0.0157 after 166 iterations. The initial value of the selection loss was 2.413 and the final value was 2.402 after 166 iterations. Detailed explanations and insights into neural network function and architecture have previously been published [22,23].

3. Results

The study included 106 patients of whom 28.3% (n = 30) were female and 77.7% (n = 76) were male. The most common tumor localization was oropharynx 48.1% (n = 51) and hypopharynx/larynx 21.7% (n = 23), followed by patients with CUP Syndrome 15.1% (n = 16) and oral cavity 14.2% (n = 15). In one patient, the tumor was localized in nasopharynx (1%). Among all patients, 70 were smokers while 36 were not. Moreover, 28 patients were HPV-positive, while the remaining 78 patients were HPV-negative. The majority of patients (n = 100) were diagnosed in M0 stage, while M1 was diagnosed in 6 patients.
Significant differences in assessed parameters based on a patient’s T stage are shown in Table 1.

3.1. Differences in [18F]FDG Parameters

Patients with N3 stage had significantly higher (p < 0.001) primary tumor MTV (48.4) and TLG (471.1) values compared with those with N1 stage (12.3 and 69.8, respectively) and N2 stage (15.5 and 80.6, respectively).
Lymph node SUVmax and SUVmean values were significantly higher (p = 0.022 and p = 0.036) in patients with N3 stage (10.6 and 5.7) compared with those with N1 (4.9 and 2.5) and N2 stages (6.4 and 3.7, respectively). Further, TLRTLG value showed significantly higher values (p = 0.002) in N3 stage compared with N1 and N2 (14.1 vs. 3.0 and 2.9, respectively).
Patients with CUP Syndrome had significantly higher (p < 0.001) values of Total SUV, MTV, TLG, and TLRTLG compared with patients with other T1–T4 stages (Table 2).
From hematological parameters, only PLT appeared to differ significantly between CUP Syndrome patients and patients with T4 stage of the primary tumor (207.3 vs. 287.3, p = 0.027).
No other statistically significant differences were shown between analyzed hematological and PET-derived parameters.

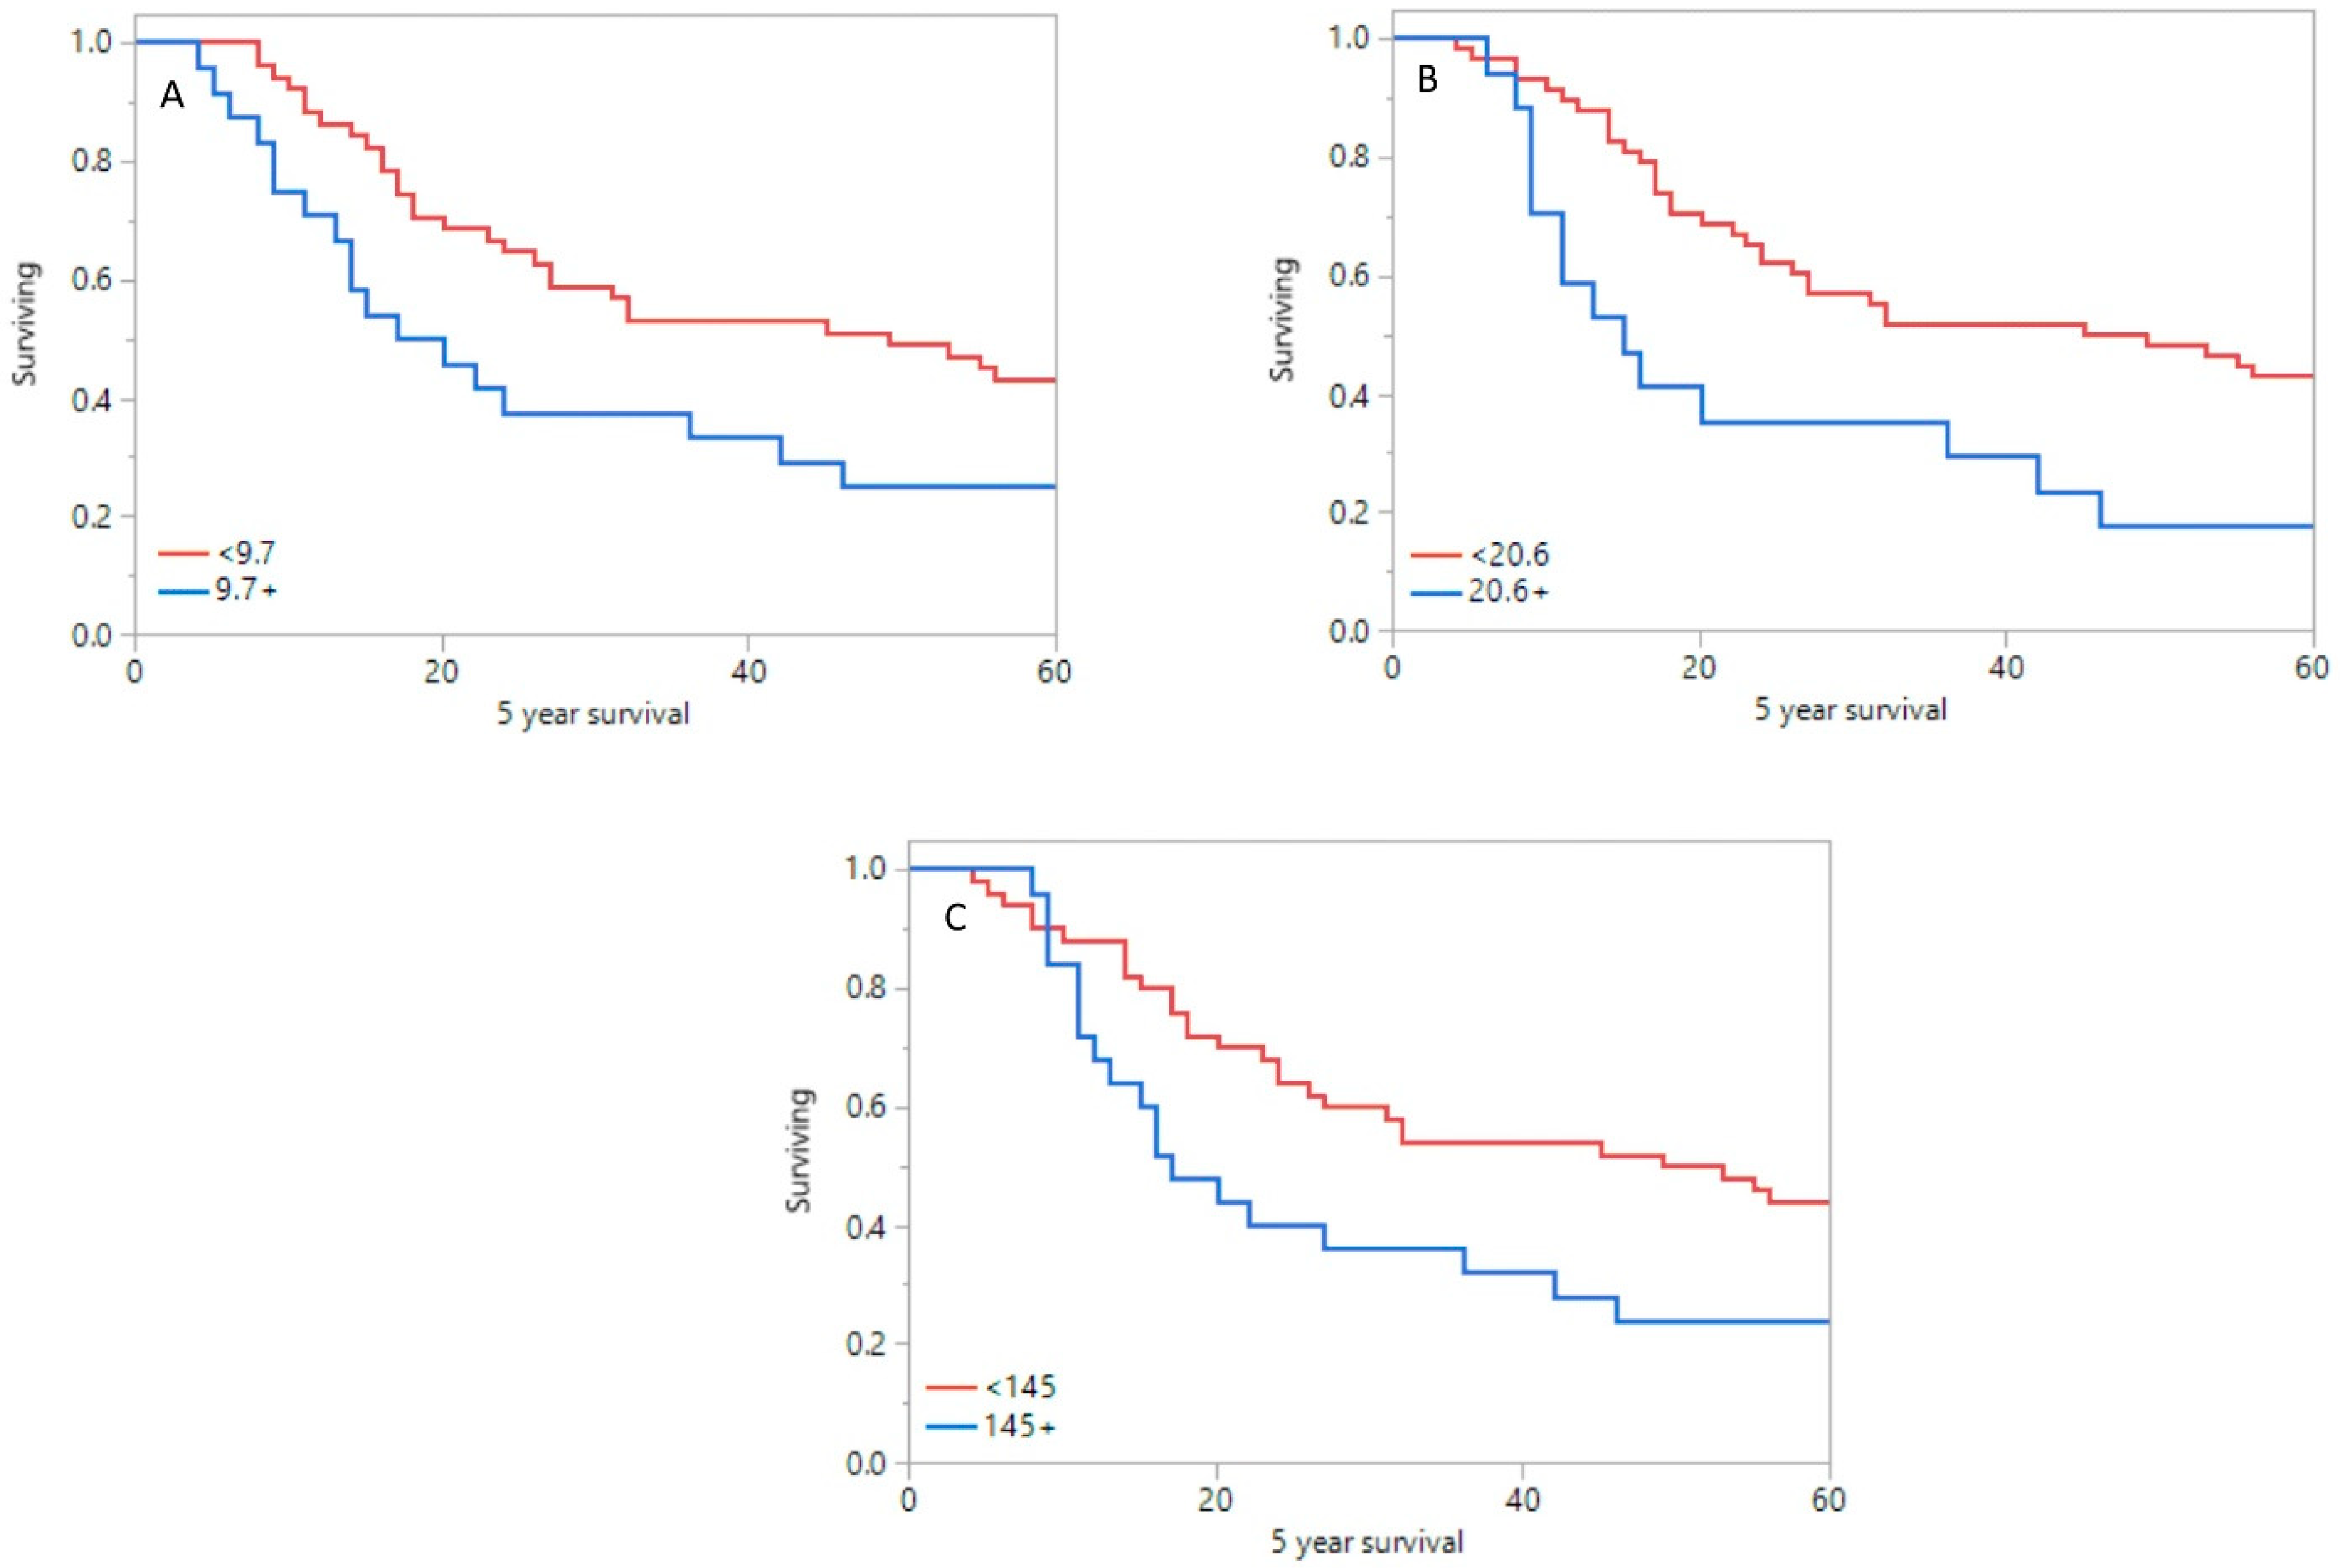
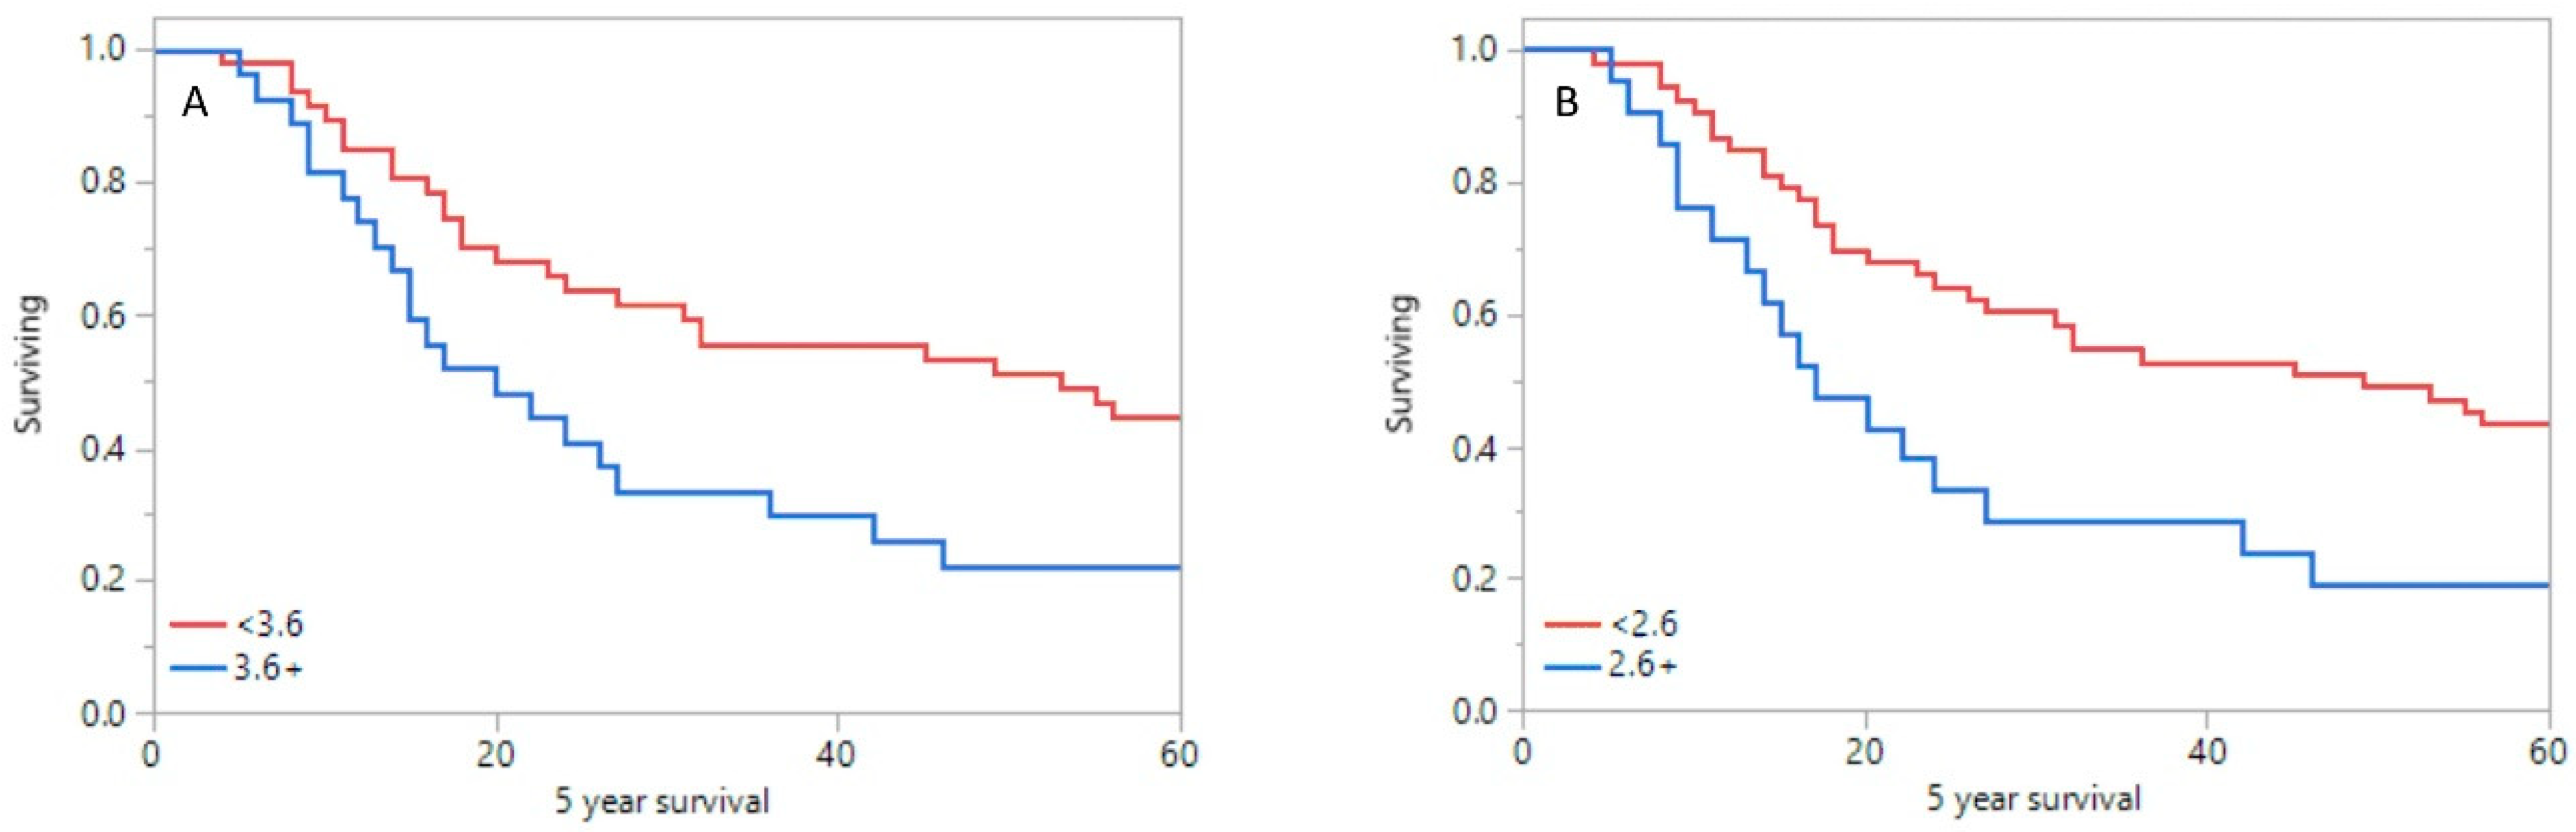
3.2. Overall Survival Analysis

Mean time for the whole group was 24 ± 18 months and 58 ± 34 months for OS and EFS, respectively. Statistically significant differences in 5-year survival rate between group of patients with worse prognosis and good prognosis were shown in primary tumor SUVmax (10.0 vs. 7.7; p = 0.040, Figure 4A), SUVmean (5.4 vs. 4.4; p = 0.047), MTV (23.2 vs. 14.5; p = 0.010, Figure 4B), and TLG (155.0 vs. 87.5; p = 0.05, Figure 4C). In lymph nodes, significant differences in 5-year survival between group with bad and good prognosis were shown in SUVmax (7.8 vs. 6.6; p = 0.006) and SUVmean values (4.2 vs. 3.74; p = 0.007).
Moreover, significant differences between patients with bad and good prognosis were shown in mean liver TLG (27.8 vs. 30.4; p = 0.031), TLRmax (3.8 vs. 2.6; p = 0.019, Figure 5A), TLRmean (2.8 vs. 1.9; p = 0.018, Figure 5B), and TLRTLG (5.6 vs. 2.3; p = 0.042).
From hematological parameters, only LMR showed significant differences in 5-year survival between patients who are dead and who are still alive (2.5 vs. 3.2; p = 0.009).
Comparing 5-year survival rate in HNSCC patients showed significant differences between smokers and nonsmokers (39.3 vs. 65.1, p = 0.006), HPV-positive and HPV-negative status (75.2 vs. 37.8, p < 0.001), and between patients with tumor in oropharynx and CUP Syndrome (57.1 vs. 21.3, p = 0.031). Moreover, patients with CUP Syndrome had a significantly worse (p = 0.001) 5-year survival rate compared with patients with T1 (21.1 vs. 89.7), T2 (21.1 vs. 47.2), T3 (21.1 vs. 42.4), and T4 (21.1 vs. 43.8) stage.

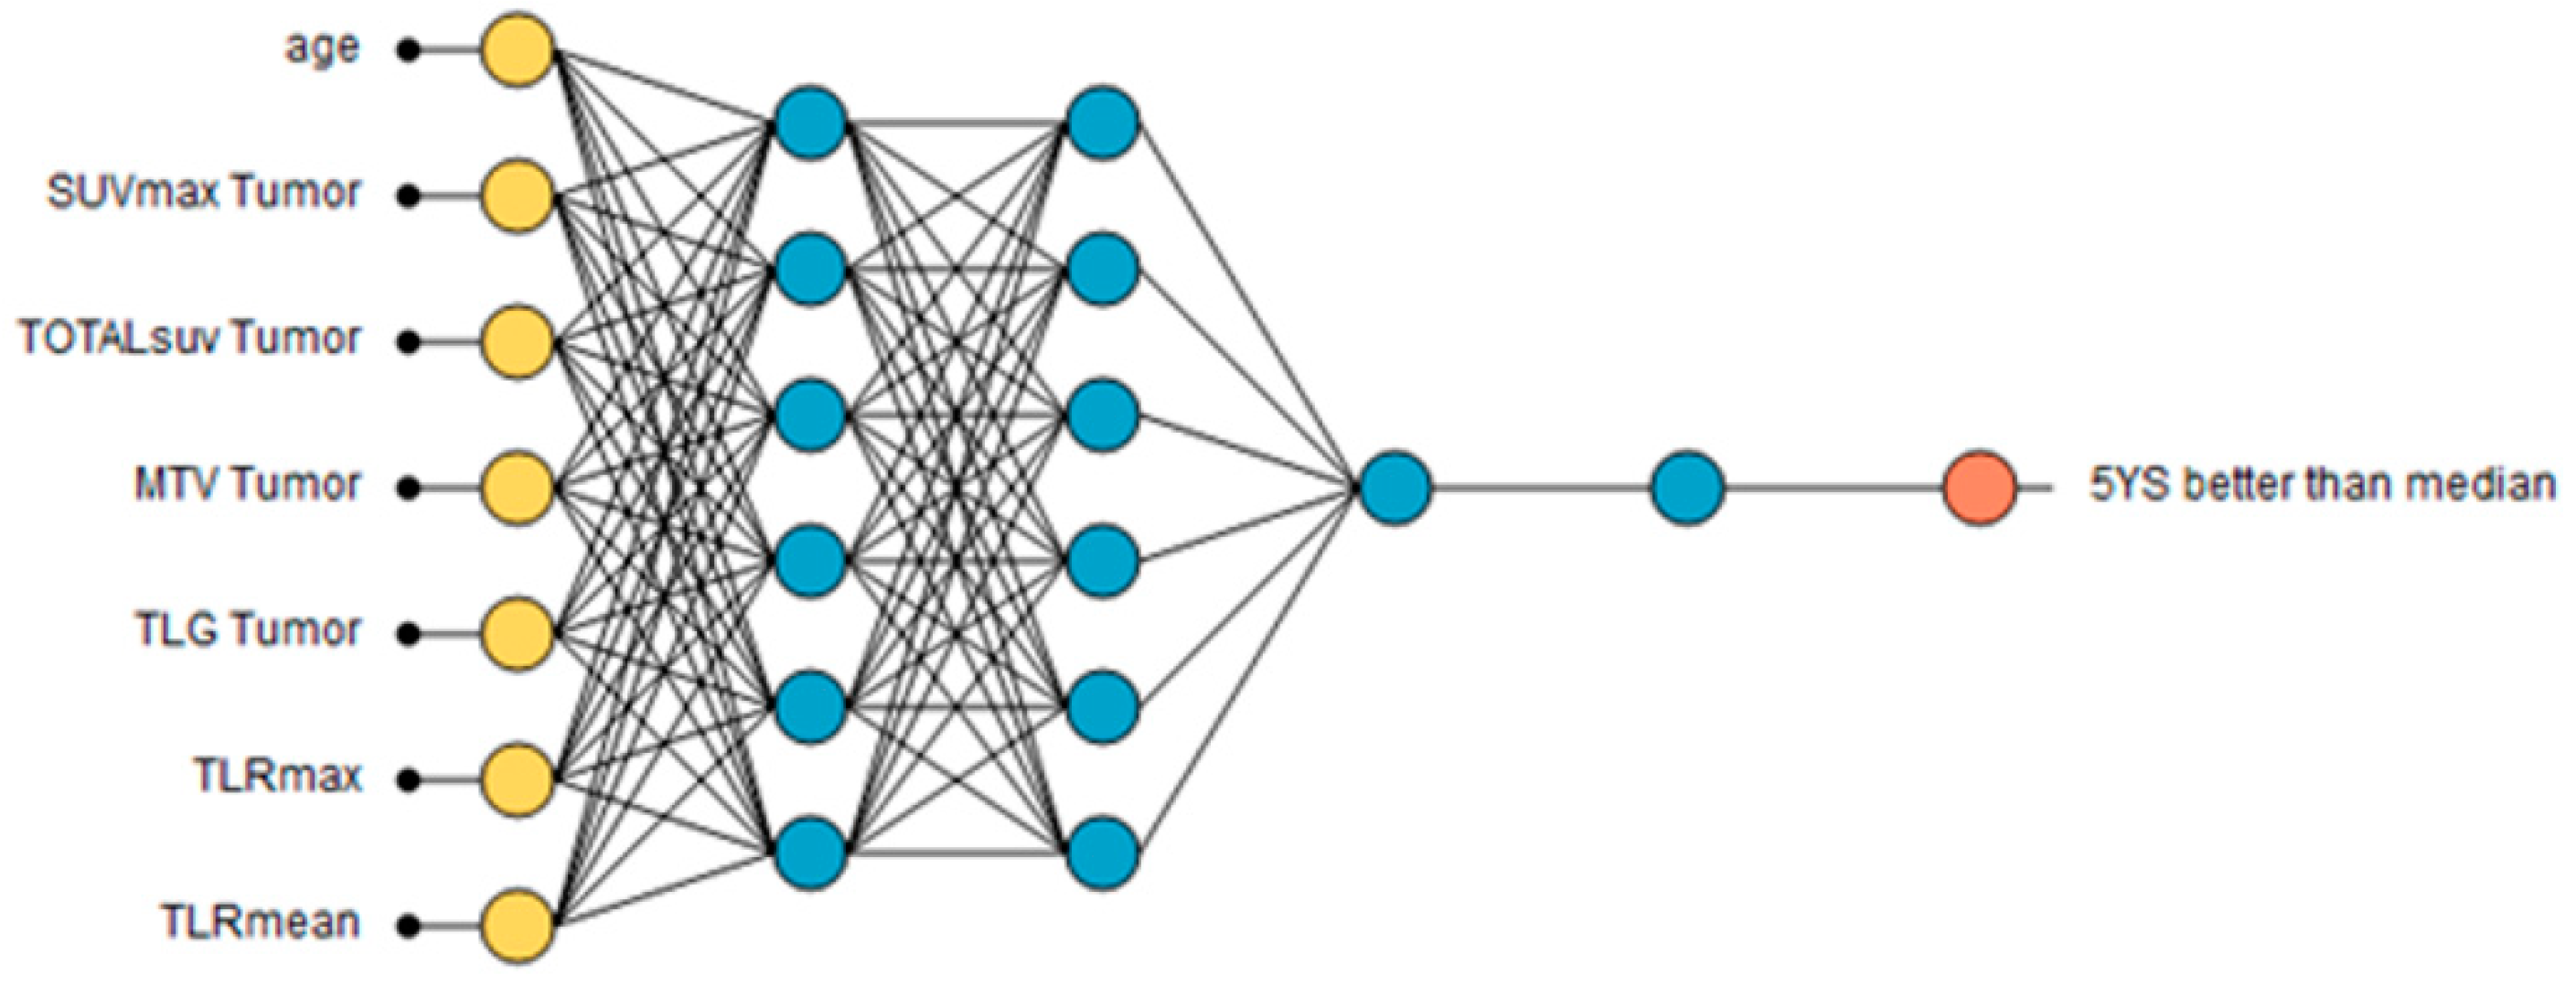
3.3. Neural Network Analysis

A growing inputs method was used to calculate the correlation for every input against each output in the data set. Beginning with the most highly correlated inputs, progressively decreasing correlated inputs were added to the network until the selection loss increased. The final architecture of the neural network reflects the optimized subset of inputs with the lowest selection loss. In this case, the selection loss and the training loss identified the optimal number of inputs to be 7 following 9 iterations. The final architecture was 7 scaling layer inputs (yellow); 3 hidden layers (blue) of 6; 6 and 1 nodes, respectively; and a single binary probabilistic layer (red) (Figure 6).
Receiver operator characteristic (ROC) analysis showed an area under the curve of 0.905 with high sensitivity of 0.889 and specificity of 0.857 for predicting greater than median survival. Classification accuracy was 0.625, precision 0.8, F1 score 0.571, Matthews correlation 0.323, and Youden index 0.302. Maximum gain score was 0.746 at 0.6 instances ratio. Lower than median survival is predicted by the following:
  • Age 60+ years;
  • SUVmax tumor over 9.7;
  • TotalSUV tumor over 2255;
  • MTV tumor over 20.6;
  • TLG tumor over 145;
  • TLRmax over 3.6;
  • TLRmean over 2.6.

4. Discussion

It has been reported that an [18F]FDG PET/CT study is a better imaging method than other diagnostic modalities in staging and assessing the recurrence in HNSCC patients [24]. Several studies reported that, in HNSCC patients, the SUVmax value is a prognostic factor of survival regardless of the tumor size, however, with no specific cut-off value ranging from 4–10 [25,26]. Querellou et al. investigated a group of 89 HNSCC patients and showed that the best cut-off of primary tumor for disease-free survival (DFS) and OS is 7 [27]. Minn et al., in a multivariate analysis, showed that baseline SUVmax of primary tumor with cut-off of 9 showed significant differences in OS in HNSCC patients. For patients with SUVmax less than 9.0, the 3-year DFS was 54% compared with 24% for patients with primary tumor SUVmax greater than 9 [28]. In our study, we confirmed these results and showed that patients with higher SUVmax (above 9.7) and SUVmean of the primary and higher SUVmax of the lymph nodes (above 7.0) showed significant differences between 5-year survival rates. Even so, SUVmax cut-off values for primary tumor varied in different studies. Paidpally et al. suggested that patients with SUVmax higher than 9 have worse OS and progression-free survival (PFS), regardless of the heterogeneity of the therapy [29], which is in accordance with our results, based on a neural network analysis. We showed that SUVmax of primary tumor greater than 9.7 is one of the parameters associated with worse survival rate.
Torizuka et al., analyzed 50 head and neck cancer patients and showed that primary tumor SUVmax correlates with T stage and N stage [30]. Scott et al., similar to our analysis, assessed SUVmax, MTV, and TLG for primary tumor and for the most active lymph node. In the univariate analysis, they showed that primary tumor SUVmean and SUVmax of the most active node and nodal TLG were significant predictors for OS in oral cavity cancer patients. Moreover, from demographic parameters, only age significantly predicts OS in these patients [31]. Contrary to others, our analysis suggests that from all assessed metabolic parameters, only SUVmax and SUVmean of the hottest lymph node showed a significant difference in N3 stage compared with other N-stages. No significant differences or correlations were found between SUVmax or SUVmean of the primary tumor and T-stage. However, in the neural network analysis, age above 60 was one of the predictors that correlated with worse prognosis.
Contrarily, other authors have suggested that MTV of the primary tumor is a prognostic imaging biomarker in several solid tumors including lung, esophageal, and ovarian cancer [32,33,34]. Abgral et al., in their study on 80 HNSCC patients, showed that MTV greater than 4.86 is an independent prognostic factor for OS and event-free survival (EFS); moreover, the authors suggested that in patients with this MTV value, more aggressive treatment or close monitoring should be included [35]. La et al. reported that a preradiation increase in MTV of 17.4 mL was significantly associated with a 1.9-fold increase in recurrence and 2.1-fold increase in death [36]. Tang et al. showed that total MTV greater than 17 correlated with 2.1-fold of progression, with 2-fold risk of death; in further analysis, it was shown that total MTV was due to tumor MTV, while nodal MTV did not show any significance in PFS or OS [37]. Similar to others, our study confirmed the abovementioned statements that a higher MTV of primary tumor is associated with worse prognosis in HNSCC patients. Additionally, neural network showed that a MTV cut-off of primary tumor greater than 20.6 correlates with 5-year survival in HNSCC.
Another volumetric parameter which is of great interest in assessing overall survival is TLG. It has been shown that this parameter demonstrates a prognostic value in lung, breast, and rectal cancer [38,39,40]. Cheng et al. assessed retrospectively [18F]FDG PET images of 60 OPSCC patients with determined HPV status. They found that HPV-positive and high primary tumor TLG (with cut-off value of 135.3) were significantly associated with OS, whereas only primary tumor TLG was an independent prognostic factor for DFS, PFS, and locoregional control [41]. Moon et al. concluded that TLG is the only significant predictor for OS in patients with SCC of the tonsil [42]. Similarly to studies mentioned above, our analysis has shown that both HPV-positive and primary tumor TLG have an influence on 5-year overall survival in HNSCC. Moreover, we have also shown that mean liver TLG and TLRTLG are significantly different between patients with good and worse prognosis.
The liver uptake is one of the most widely used reference backgrounds because of a low change in uptake time after the radiotracer injection. Elevated tumor-to-liver ratio has been reported as a predictor in various cancers including lymphoma, lung, and colorectal cancer [7,43,44]. Recently Choi et al. analyzed several PET parameters (including SUVmax, TLR, MTV, and TLG) in primary tumor and lymph nodes on OS and DFS in patients with oropharyngeal cancer [45]; however, they did not find any relationship between TLR and OS or DFS. Our results suggest that patients with higher TLGmax, TLGmean, and TLGTLR have worse OS. Moreover, based on a neural network analysis, we showed that TLGmax over 3.6 and TLRmean over 2.6 were associated with worse prognosis for patients with HNSCC.
Some studies suggest that hematological parameters have prognostic value in several cancers [46,47]. Recently, Ohashi et al. showed that [18F]FDG PET/CT study has the potential to reflect cancer-related chronic inflammation in HNSCC patients [48]. Guo et al. concluded that incorporation of NRL and SUVmax improves prediction of clinical outcome in patients with locally advanced non-small-cell lung cancer [49]. In this study, we evaluated several hematological parameters and analyzed their correlation with OS in HNSCC. Among analyzed parameters, LMR showed a significant difference in 5-year survival rate. Additionally, PLT count significantly differed between patients with CUP Syndrome and those with T4-stage of the primary tumor.
It should be mentioned that this study has some limitations. Firstly, this was a single-center and retrospective analysis on a heterogeneous (based on primary tumor localization) group of HNSCC patients. Secondly, the implemented treatment methods were not homogenous, as they were adjusted to the clinical stage of the patients. To overcome these limitations, a larger multicenter study should be performed in the future to confirm the results of our preliminary study.

5. Conclusions

Our study shows that neural network could serve as a supplement to PET-derived parameters and is helpful in finding prognostic parameters for overall survival in HNSCC. Combining clinical well-known factors such as stage of the disease, primary tumor site, and HPV status, with [18F]FDG PET-derived primary tumor parameters such as SUVmax, TotalSUV, MTV, TLG, and TLRmax, TLRmean and age over 60 can provide additional helpful information and might assist in more accurate risk stratification of HNSCC patients. Further studies with a more homogenous group of patients in terms of tumor localization are planned.

Author Contributions

Conceptualization, P.C. and E.M.; methodology, P.C., E.M., G.C. and J.P.W.; formal analysis, G.C.; investigation, P.C., G.C., J.P.W., A.K. and E.M.; writing—original draft preparation, P.C., G.C., J.P.W. and E.M.; writing—review and editing, J.K., W.C., A.M., A.K., P.G. and W.G.; supervision, J.K., W.C., A.M. and W.G.; project administration, P.C. and E.M.; P.C. and G.C. equally contributed to this study. All authors have read and agreed to the published version of the manuscript.

Funding

The study was support by Greater Poland Cancer Centre, grant No. 25/2019(229).

Institutional Review Board Statement

The study was conducted according to the guidelines of the Declaration of Helsinki and approved by the Institutional Review Board (Poznan University of Medical Science Bioethical Committee, 10 September 2019).

Informed Consent Statement

Patient consent was waived due to the retrospective nature of this study and the processing of anonymized data only.

Data Availability Statement

The data presented in this study are available on request from the corresponding author. The data are not publicly available due to legal requirements of data protection.

Conflicts of Interest

The authors declare no conflict of interest.

References

  1. Bray, F.; Ferlay, J.; Soerjomataram, I.; Siegel, R.L.; Torre, L.A.; Jemal, A. Global cancer statistics 2018: GLOBOCAN estimates of incidence and mortality worldwide for 36 cancers in 185 countries. CA Cancer J. Clin. 2018, 68, 394–424. [Google Scholar] [CrossRef] [Green Version]
  2. Johnson, D.E.; Burtness, B.; Leemans, C.R.; Lui, V.W.Y.; Bauman, J.E.; Grandis, J.R. Head and neck squamous cell carcinoma. Nat. Rev. Dis. Primers 2020, 6, 92. [Google Scholar] [CrossRef] [PubMed]
  3. Machczyński, P.; Majchrzak, E.; Niewinski, P.; Marchlewska, J.; Golusiński, W. A review of the 8th edition of the AJCC staging system for oropharyngeal cancer according to HPV status. Eur. Arch. Otorhinolaryngol. 2020, 277, 2407–2412. [Google Scholar] [CrossRef] [PubMed]
  4. Leclere, J.-C.; Delcroix, O.; Rousset, J.; Valette, G.; Robin, P.; Guezennec, C.; Le Pennec, R.; Gujral, D.M.; Abgral, M.; Ollivier, L.; et al. Integration of 18-FDG PET/CT in the Initial Work-Up to Stage Head and Neck Cancer: Prognostic Significance and Impact on Therapeutic Decision Making. Front. Med. 2020, 7, 273. [Google Scholar] [CrossRef] [PubMed]
  5. Cheng, G.; Huang, H. Prognostic Value of (18F)-Fluorodeoxyglucose PET/Computed Tomography in Non–Small-Cell Lung Cancer. PET Clin. 2018, 13, 59–72. [Google Scholar] [CrossRef]
  6. Paidpally, V.; Chirindel, A.; Chung, C.H.; Richmon, J.; Koch, W.; Quon, H.; Subramaniam, R.M. FDG volumetric parameters and survival outcomes after definitive chemoradio-therapy in patients with recurrent head and neck squamous cell carcinoma. AJR Am. J. Roentgenol. 2014, 203, W139–W145. [Google Scholar] [CrossRef] [Green Version]
  7. Huang, J.; Huang, L.; Zhou, J.; Duan, Y.; Zhang, Z.; Wang, X.; Huang, P.; Tan, S.; Yinghua, D.; Wang, J.; et al. Elevated tumor-to-liver uptake ratio (TLR) from 18F–FDG-PET/CT predicts poor prognosis in stage IIA colorectal cancer following curative resection. Eur. J. Nucl. Med. Mol. Imaging 2017, 44, 1958–1968. [Google Scholar] [CrossRef] [Green Version]
  8. Li, M.-X.; Liu, X.-M.; Zhang, X.-F.; Zhang, J.-F.; Wang, W.-L.; Zhu, Y.; Dong, J.; Cheng, J.-W.; Liu, Z.-W.; Ma, L.; et al. Prognostic role of neutrophil-to-lymphocyte ratio in colorectal cancer: A systematic review and meta-analysis. Int. J. Cancer 2013, 134, 2403–2413. [Google Scholar] [CrossRef]
  9. Chen, J.; Deng, Q.; Pan, Y.; He, B.; Ying, H.; Sun, H.; Liu, X.; Wang, S. Prognostic value of neutrophil-to-lymphocyte ratio in breast cancer. FEBS Open Bio 2015, 5, 502–507. [Google Scholar] [CrossRef] [Green Version]
  10. Ozyurek, B.A.; Ozdemirel, T.S.; Ozden, S.B.; Erdogan, Y.; Kaplan, B.; Kaplan, T. Prognostic value of the neutrophil to lymphocyte ratio (NLR) in lung cancer cases. Asian Pac. J. Cancer Prev. 2017, 18, 1417–1421. [Google Scholar]
  11. Cao, J.; Zhu, X.; Zhao, X.; Zhao, X.; Li, X.F.; Xu, R. Neutrophil-to-lymphocyte ratio predicts PSA response and prognosis in prostate cancer: A systematic review and meta-analysis. PLoS ONE 2016, 11, e015877. [Google Scholar] [CrossRef] [PubMed] [Green Version]
  12. Xiang, J.; Zhou, L.; Li, X.; Bao, W.; Chen, T.; Xi, X.; He, Y.; Wan, X. Preoperative Monocyte-to-Lymphocyte Ratio in Peripheral Blood Predicts Stages, Metastasis, and Histological Grades in Patients with Ovarian Cancer. Transl. Oncol. 2016, 10, 33–39. [Google Scholar] [CrossRef] [PubMed] [Green Version]
  13. Mascarella, M.A.; Mannard, E.; Silva, S.D.; Zeitouni, A. Neutrophil-to-lymphocyte ratio in head and neck cancer prognosis: A systematic review and meta-analysis. Head Neck 2018, 40, 1091–1100. [Google Scholar] [CrossRef]
  14. Lu, A.; Li, H.; Zheng, Y.; Tang, M.; Li, J.; Wu, H.; Zhong, W.; Gao, J.; Ou, N.; Cai, Y. Prognostic Significance of Neutrophil to Lymphocyte Ratio, Lymphocyte to Monocyte Ratio, and Platelet to Lymphocyte Ratio in Patients with Nasopharyngeal Carcinoma. BioMed Res. Int. 2017, 2017, 3047802. [Google Scholar] [CrossRef]
  15. Li, W.; Liu, H.; Cheng, F.; Li, Y.; Li, S.; Yan, J. Artificial intelligence applications for oncological positron emission tomography imaging. Eur. J. Radiol. 2020, 134, 109448. [Google Scholar] [CrossRef]
  16. Haider, S.P.; Burtness, B.; Yarbrough, W.G.; Payabvash, S. Applications of radiomics in precision diagnosis, prognostication and treatment planning of head and neck squamous cell carcinomas. Cancers Head Neck 2021, 5, 6. [Google Scholar] [CrossRef]
  17. Moe, Y.M.; Groendahl, A.R.; Tomic, O.; Dale, E.; Malinen, E.; Futsaether, C.M. Deep learning-based auto-delineation of gross tumour volumes and involved nodes in PET/CT images of head and neck cancer patients. Eur. J. Nucl. Med. Mol. Imaging 2021, 48, 2782–2792. [Google Scholar] [CrossRef]
  18. Boellaard, R.; Delgado-Bolton, R.; Oyen, W.J.G.; Giammarile, F.; Tatsch, K.; Eschner, W.; Verzijlbergen, F.J.; Barrington, S.F.; Pike, L.C.; Weber, W.A.; et al. FDG PET/CT: EANM procedure guidelines for tumour imaging: Version 2.0. Eur. J. Nucl. Med. Mol. Imaging 2015, 42, 328–354. [Google Scholar] [CrossRef]
  19. Cegła, P.; Burchardt, E.; Wierzchosławska, E.; Roszak, A.; Cholewiński, W. The effect of different segmentation methods on primary tumour metabolic volume assessed in 18F-FDG-PET/CT in patients with cervical cancer, for radiotherapy planning. Contemp. Oncol. 2019, 23, 183–186. [Google Scholar] [CrossRef]
  20. Yang, Z.; Shi, Q.; Zhang, Y.; Pan, H.; Yao, Z.; Hu, S.; Shi, W.; Zhu, B.; Zhang, Y.; Hu, C.; et al. Pretreatment (18)F-FDG uptake heterogeneity can predict survival in patients with locally ad-vanced nasopharyngeal carcinoma—A retrospective study. Radiat. Oncol. 2015, 10, 4. [Google Scholar] [CrossRef] [Green Version]
  21. Currie, G.M. Intelligent Imaging: Developing a Machine Learning Project. J. Nucl. Med. Technol. 2021, 49, 44–48. [Google Scholar] [CrossRef] [PubMed]
  22. Currie, G.; Hawk, K.E.; Rohren, E.; Vial, A.; Klein, R. Machine Learning and Deep Learning in Medical Imaging: Intelligent Imaging. J. Med. Imaging Radiat. Sci. 2019, 50, 477–487. [Google Scholar] [CrossRef] [PubMed] [Green Version]
  23. Currie, G.M. Intelligent Imaging: Anatomy of Machine Learning and Deep Learning. J. Nucl. Med. Technol. 2019, 47, 273–281. [Google Scholar] [CrossRef] [PubMed]
  24. Rohde, M.; Nielsen, A.L.; Pareek, M.; Johansen, J.; Sørensen, J.A.; Diaz, A.; Nielsen, M.K.; Christiansen, J.M.; Asmussen, J.T.; Nguyen, N.; et al. PET/CT Versus Standard Imaging for Prediction of Survival in Patients with Recurrent Head and Neck Squamous Cell Carcinoma. J. Nucl. Med. 2019, 60, 592–599. [Google Scholar] [CrossRef] [PubMed] [Green Version]
  25. Halfpenny, W.; Hain, S.F.; Biassoni, L.; Maisey, M.N.; A Sherman, J.; McGurk, M. FDG–PET. A possible prognostic factor in head and neck cancer. Br. J. Cancer 2002, 86, 512–516. [Google Scholar] [CrossRef]
  26. Allal, A.S.; Dulguerov, P.; Allaoua, M.G.; Haenggeli, C.A.; El-Ghazi, E.A.; Lehmann, W.; Slosman, D.O. Standardized uptake value of 2-[18F]fluoro-2-deoxy-D-glucose in predicting out-come in head and neck carcinomas treated by radiotherapy with or without chemotherapy. J. Clin. Oncol. 2002, 20, 1398-404. [Google Scholar] [CrossRef]
  27. Querellou, S.; Abgral, R.; Le Roux, P.-Y.; Nowak, E.; Valette, G.; Potard, G.; Le Duc-Pennec, A.; Cavarec, M.-B.; Marianovski, R.; Salaün, P. Prognostic value of fluorine-18 fluorodeoxyglucose positron-emission tomography imaging in patients with head and neck squamous cell carcinoma. Head Neck 2012, 34, 462–468. [Google Scholar] [CrossRef]
  28. Minn, H.; Lapela, M.; Klemi, P.J.; Grénman, R.; Leskinen, S.; Lindholm, P.; Bergman, J.; Eronen, E.; Haaparanta, M.; Joensuu, H. Prediction of survival with fluorine-18-fluoro-deoxyglucose and PET in head and neck cancer. J. Nucl. Med. 1997, 38, 1907–1911. [Google Scholar]
  29. Paidpally, V.; Chirindel, A.; Lam, S.; Agrawal, N.; Quon, H.; Subramaniam, R.M. FDG-PET/CT imaging biomarkers in head and neck squamous cell carcinoma. Imaging Med. 2012, 4, 633–647. [Google Scholar] [CrossRef] [Green Version]
  30. Torizuka, T.; Tanizaki, Y.; Kanno, T.; Futatsubashi, M.; Naitou, K.; Ueda, Y.; Ouchi, Y. Prognostic value of 18F-FDG PET in patients with head and neck squamous cell cancer. AJR Am. J. Roentgenol. 2009, 192, W156–W160. [Google Scholar] [CrossRef]
  31. Scott, S.; Byrd, J.K.; Figueroa, R.; Williams, H.; Chen, J.; Lee, J.; Pucar, D. 18F-fluorodeoxyglucose positron emission tomography/computed tomography in predict-ing overall survival of oral cavity squamous cell carcinoma: Ongoing controversy. World J. Nucl. Med. 2020, 17, 111–117. [Google Scholar]
  32. Zhu, D.; Ma, T.; Niu, Z.; Zheng, J.; Han, A.; Zhao, S.; Yu, J. Prognostic significance of metabolic parameters measured by (18)F-fluorodeoxyglucose positron emission tomography/computed tomography in patients with small cell lung cancer. Lung Cancer 2001, 73, 332–337. [Google Scholar] [CrossRef] [PubMed]
  33. Hyun, S.H.; Choi, J.Y.; Shim, Y.M.; Kim, K.; Lee, S.J.; Cho, Y.S.; Kim, B.T.; Lee, J.Y.; Lee, K. Prognostic value of metabolic tumor volume measured by 18F-fluorodeoxyglucose posi-tron emission tomography in patients with oesophageal carcinoma. Ann. Surg. Oncol. 2010, 17, 115–122. [Google Scholar] [CrossRef] [PubMed]
  34. Chung, H.H.; Kwon, H.W.; Kang, K.W.; Park, N.-H.; Song, Y.-S.; Chung, J.-K.; Kang, S.-B.; Kim, J.W. Prognostic Value of Preoperative Metabolic Tumor Volume and Total Lesion Glycolysis in Patients with Epithelial Ovarian Cancer. Ann. Surg. Oncol. 2012, 19, 1966–1972. [Google Scholar] [CrossRef] [PubMed]
  35. Abgral, R.; Keromnes, N.; Robin, P.; Le Roux, P.-Y.; Bourhis, D.; Palard, X.; Rousset, J.; Valette, G.; Marianowski, R.; Salaun, P.-Y. Prognostic value of volumetric parameters measured by 18F-FDG PET/CT in patients with head and neck squamous cell carcinoma. Eur. J. Nucl. Med. Mol. Imaging 2014, 41, 659–667. [Google Scholar] [CrossRef]
  36. La, T.H.; Filion, E.J.; Turnbull, B.B.; Chu, J.N.; Lee, P.; Nguyen, K.; Maxim, P.; Quon, A.; Graves, E.E.; Loo, B.W.; et al. Metabolic Tumor Volume Predicts for Recurrence and Death in Head-and-Neck Cancer. Int. J. Radiat. Oncol. Biol. Phys. 2009, 74, 1335–1341. [Google Scholar] [CrossRef] [Green Version]
  37. Tang, C.; Murphy, J.D.; Khong, B.; La, T.H.; Kong, C.; Fischbein, N.J.; Colevas, A.D.; Iagaru, A.H.; Graves, E.E.; Loo, B.W.; et al. Validation that Metabolic Tumor Volume Predicts Outcome in Head-and-Neck Cancer. Int. J. Radiat. Oncol. Biol. Phys. 2012, 83, 1514–1520. [Google Scholar] [CrossRef] [Green Version]
  38. Moon, S.H.; Sun, J.M.; Ahn, J.S.; Park, K.; Kim, B.T.; Lee, K.H.; Choi, J.Y.; Ahn, M.-J. Predictive and Prognostic Value of 18F-fluorodeoxyglucose Uptake Combined with Thymi-dylate Synthase Expression in Patients with Advanced Non-Small Cell Lung Cancer. Sci. Rep. 2019, 9, 12215. [Google Scholar] [CrossRef] [Green Version]
  39. Wen, W.; Xuan, D.; Hu, Y.; Li, X.; Liu, L.; Xu, D. Prognostic value of maximum standard uptake value, metabolic tumor volume, and total lesion glycolysis of positron emission tomography/computed tomography in patients with breast cancer: A systematic review and meta-analysis. PLoS ONE 2019, 14, e0225959. [Google Scholar] [CrossRef]
  40. Lim, Y.; Bang, J.-I.; Han, S.-W.; Paeng, J.C.; Lee, K.-H.; Kim, J.H.; Kang, G.H.; Jeong, S.-Y.; Park, K.J.; Kim, T.-Y. Total lesion glycolysis (TLG) as an imaging biomarker in metastatic colorectal cancer patients treated with regorafenib. Eur. J. Nucl. Med. Mol. Imaging 2017, 44, 757–764. [Google Scholar] [CrossRef]
  41. Cheng, N.-M.; Chang, J.T.-C.; Huang, C.-G.; Tsan, D.-L.; Ng, S.-H.; Wang, H.-M.; Liao, C.-T.; Lin, C.-Y.; Hsu, C.-L.; Yen, T.-C. Prognostic value of pretreatment (18)F-FDG PET/CT and human papillomavirus type 16 testing in locally advanced oropharyngeal squamous cell carcinoma. Eur. J. Nucl. Med. Mol. Imaging 2012, 39, 1673–1684. [Google Scholar] [CrossRef] [PubMed]
  42. Moon, S.H.; Choi, J.Y.; Lee, H.J.; Son, Y.-I.; Baek, C.-H.; Ahn, Y.C.; Park, K.; Lee, K.-H.; Kim, B.-T. Prognostic value of18F-FDG PET/CT in patients with squamous cell carcinoma of the tonsil: Comparisons of volume-based metabolic parameters. Head Neck 2013, 35, 15–22. [Google Scholar] [CrossRef] [PubMed]
  43. Park, H.L.; Yoo, I.R.; Boo, S.H.; Park, S.Y.; Park, J.K.; Sung, S.W.; Moon, S.W. Does FDG PET/CT have a role in determining adjuvant chemotherapy in surgical mar-gin-negative stage IA non-small cell lung cancer patients? J. Cancer Res. Clin. Oncol. 2019, 145, 1021–1026. [Google Scholar] [CrossRef] [PubMed]
  44. Annunziata, S.; Cuccaro, A.; Calcagni, M.L.; Hohaus, S.; Giordano, A.; Rufini, V. Interim FDG-PET/CT in Hodgkin lymphoma: The prognostic role of the ratio between target lesion and liver SUVmax (rPET). Ann. Nucl. Med. 2016, 30, 588–592. [Google Scholar] [CrossRef]
  45. Choi, K.H.; Song, J.H.; Park, E.Y.; Hong, J.H.; Yoo, I.R.; Lee, Y.S.; Kim, Y.S.; Sun, D.-I.; Kim, M.-S. Analysis of PET parameters as prognosticators of survival and tumor extent in Oro-pharyngeal Cancer treated with surgery and postoperative radiotherapy. BMC Cancer 2021, 21, 317. [Google Scholar] [CrossRef]
  46. Roxburgh, C.S.; McMillan, D.C. Role of systemic inflammatory response in predicting survival in patients with primary operable cancer. Future Oncol. 2010, 6, 149–163. [Google Scholar] [CrossRef]
  47. McMillan, D.C. Systemic inflammation, nutritional status and survival in patients with cancer. Curr. Opin. Clin. Nutr. Metab. Care 2009, 12, 223–226. [Google Scholar] [CrossRef] [Green Version]
  48. Ohashi, T.; Terasawa, K.; Aoki, M.; Akazawa, T.; Shibata, H.; Kuze, B.; Asano, T.; Kato, H.; Miyazaki, T.; Matsuo, M.; et al. The importance of FDG-PET/CT parameters for the assessment of the immune status in advanced HNSCC. Auris Nasus Larynx 2020, 47, 658–667. [Google Scholar] [CrossRef]
  49. Guo, D.; Jin, F.; Jing, W.; Li, M.; Chen, D.; Zou, B.; Yue, J.; Jiang, G.; Fu, L.; Zhu, H.; et al. Incorporation of the SUVmax Measured From FDG PET and Neutrophil-to-lymphocyte Ratio Im-proves Prediction of Clinical Outcomes in Patients with Locally Advanced Non-small-cell Lung Cancer. Clin. Lung Cancer 2019, 20, 412–419. [Google Scholar] [CrossRef]
Figure 1. Overview diagram.
Pharmaceuticals 15 00224 g001
Figure 2. An example of segmented image according to the chosen segmentation method. (A) PET images in transverse plane, (B) fused PET/CT images in transverse plane, (C) PET image in sagittal plane, (D) fused PET/CT images in sagittal plane.
Pharmaceuticals 15 00224 g002
Figure 3. [18F]FDG PET-derived assessed parameters.
Pharmaceuticals 15 00224 g003
Figure 4. Survival plot for primary tumor SUVmax (A), MTV (B), and TLG (C).
Pharmaceuticals 15 00224 g004
Figure 5. Survival plot for TLRmax (A) and TLRmean (B).
Pharmaceuticals 15 00224 g005
Figure 6. Final architecture of the neural network.
Pharmaceuticals 15 00224 g006
Table 1. Summary of data by T and N stage.
T StageTXT1T2T3T4P
Patient details
Proportion of studies (%)16 (13.5)18 (16.4)18 (16.4)19 (18.3)35 (35.6)-
Mean age (years)63.453.855.859.056.70.098
Male (%)78.676.564.768.470.30.901
Smoker (%)64.352.970.668.464.90.696
Mean packs/year13.112.817.717.116.90.871
Mean overall survival (months)14.462.718.022.625.10.003
Mean event free survival (months)31.068.662.448.566.30.156
HPV+ (%)058.847.131.610.8<0.001
Tumor localization %
Hypopharynx/larynx05.929.415.837.8<0.001
Nasopharynx00002.7
Oropharynx088.252.968.435.1
Oral cavity05.917.710.321.6
CUP1000000
Differentiation
G105.95.905.40.006
G27.158.864.768.467.6
G335.717.717.726.316.2
N staging
0012.525.026.313.90.004
1018.812.508.3
25056.356.363.275
35012.56.310.52.8
M0 stage (%)15.619.519.523.422.10.271
Treatment
Surgery0011.8000.001
Chemotherapy7.10000
RT21.4011.826.38.1
Surgery/Chemo14.35.95.900
Surgery/RT42.935.311.85.38.1
Surgery/Chemo/RT7.135.329.431.624.3
RTCH7.123.529.436.859.5
Abbreviations: HPV+—human papillomavirus positive patients; CUP—cancer of unknown primary; RT—radiotherapy; chemo—chemotherapy; RTCH—radio-chemotherapy; TX—patients with unknown primary (CUP); T1—patients with T1 stage; T2—patients with T2 stage; T3—patients with T3 stage; T4—patients with T4 stage; Pp value.
Table 2. PET parameters assessed in CUP patients and other T-stages.
ParameterCUPT1T2T3T4
TotalSUV6984.1307.5850.11396.21519.8
MTV (cm3)47.16.012.017.018.1
TLG447.020.854.486.798.7
TLRTLG13.30.72.12.63.8
Abbreviations: CUP—Cancer with Unknown Primary; T1–T4—patients with T1–T4 stage of primary tumor; MTV—metabolic tumor volume; TLG—total lesion glycolysis; TLRTLG—tumor-to-liver total lesion glycolysis ratio.
Publisher’s Note: MDPI stays neutral with regard to jurisdictional claims in published maps and institutional affiliations.

