Effects of Vitamin D Supplementation on Lipid Profile in Adults with the Metabolic Syndrome: A Systematic Review and Meta-Analysis of Randomized Controlled Trials

 ,
, 
 ,
,
Abstract
:1. Introduction
2. Materials and Methods
2.1. Review Design
2.2. Criteria for Study Inclusion
2.3. Search Strategy
2.4. Study Selection
2.5. Data Extraction
2.6. Quality Assessment
2.7. Data Synthesis
3. Results
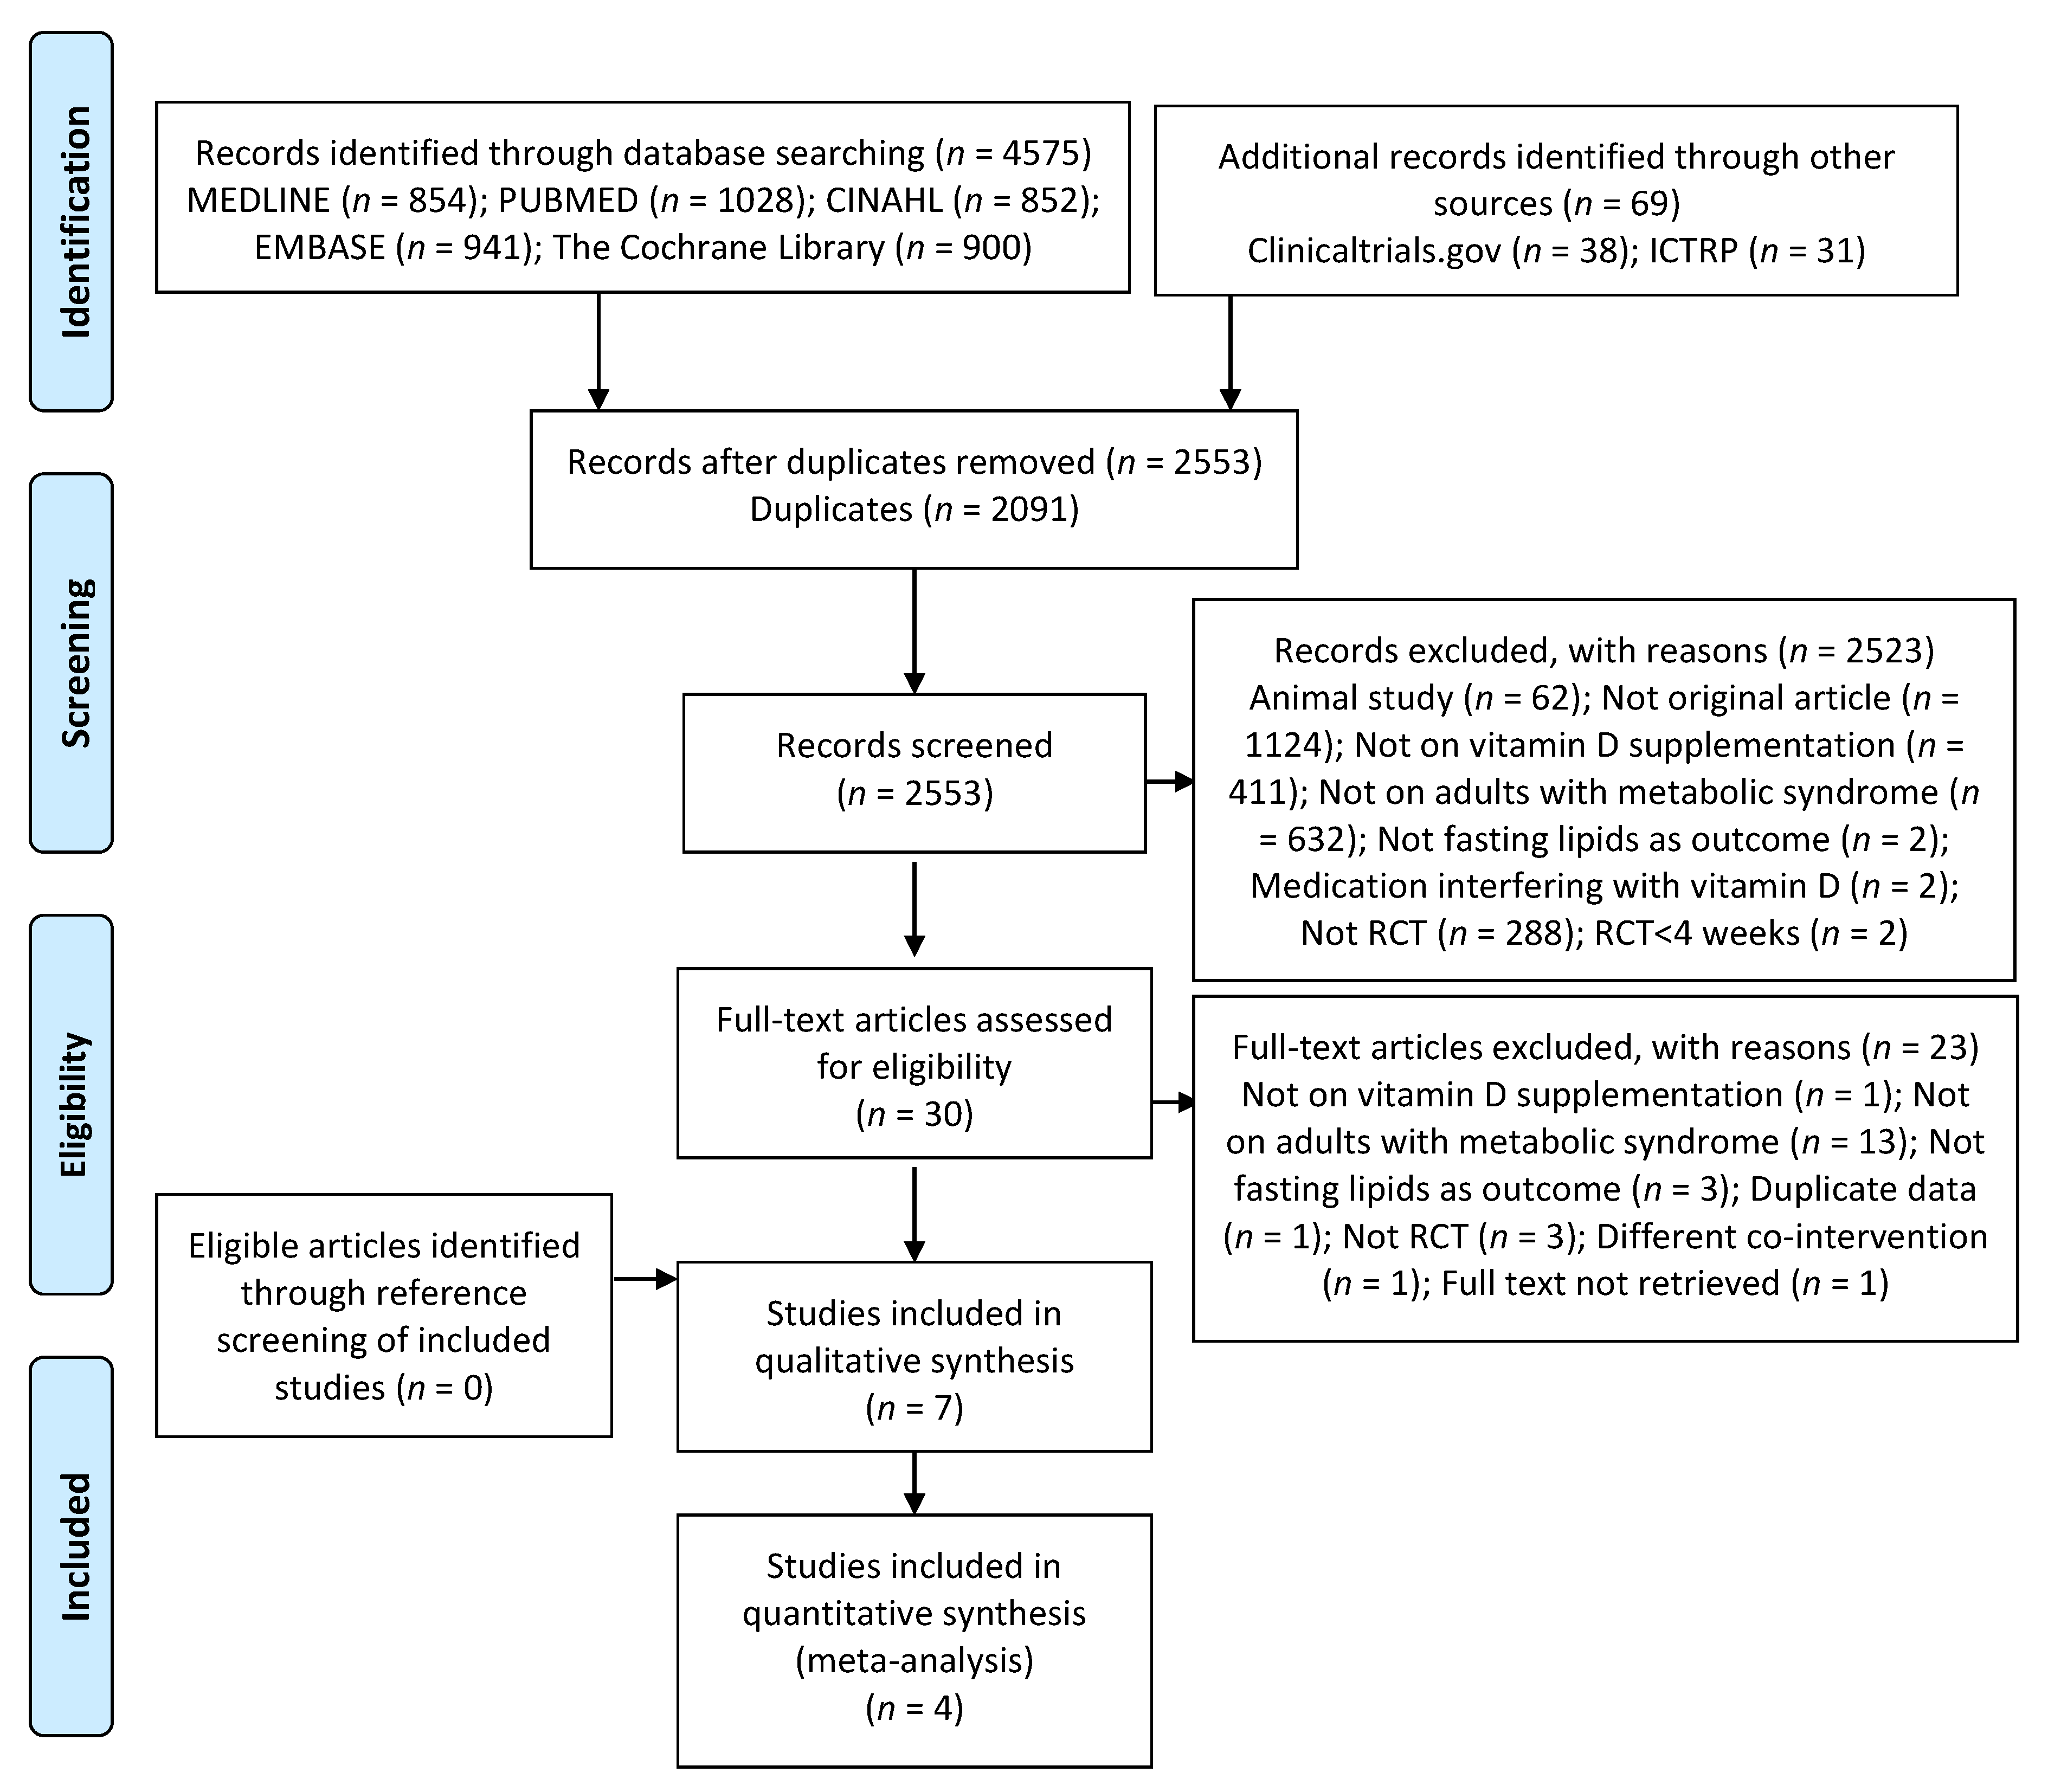
3.1. Search Results
3.2. Characteristics of Included Studies
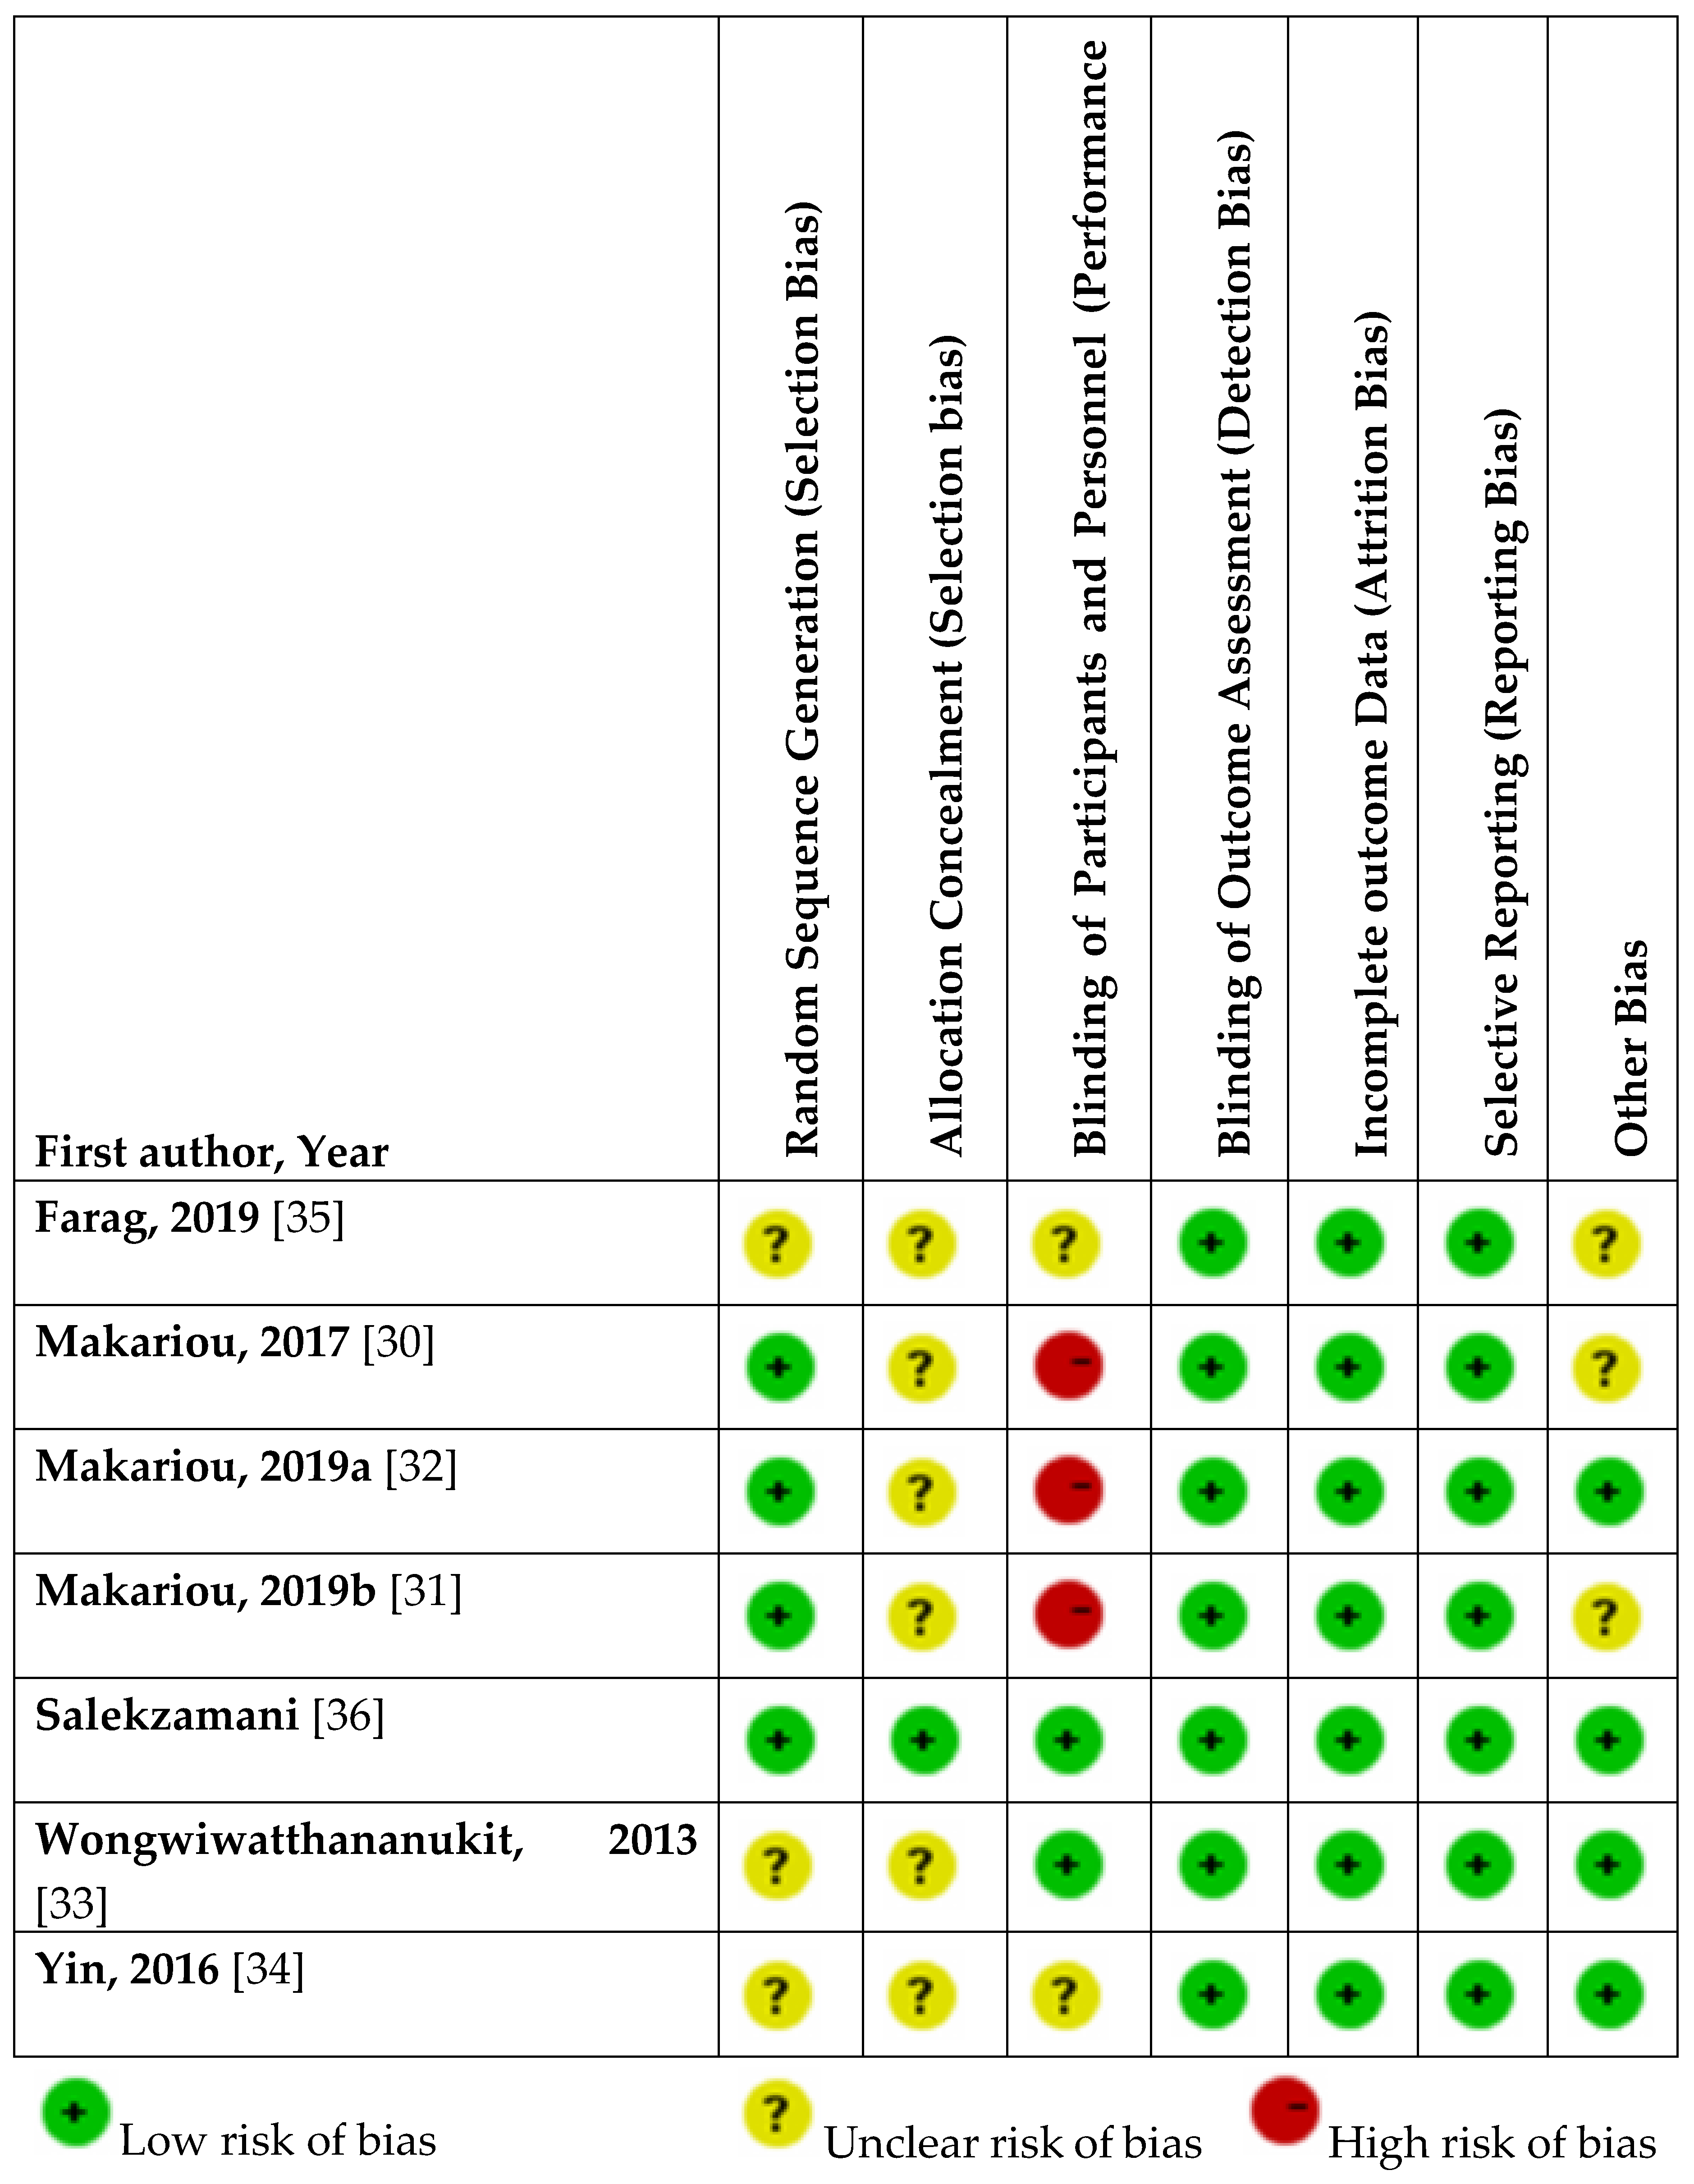
3.3. Assessment of Risk of Bias
3.4. Results of Included Studies
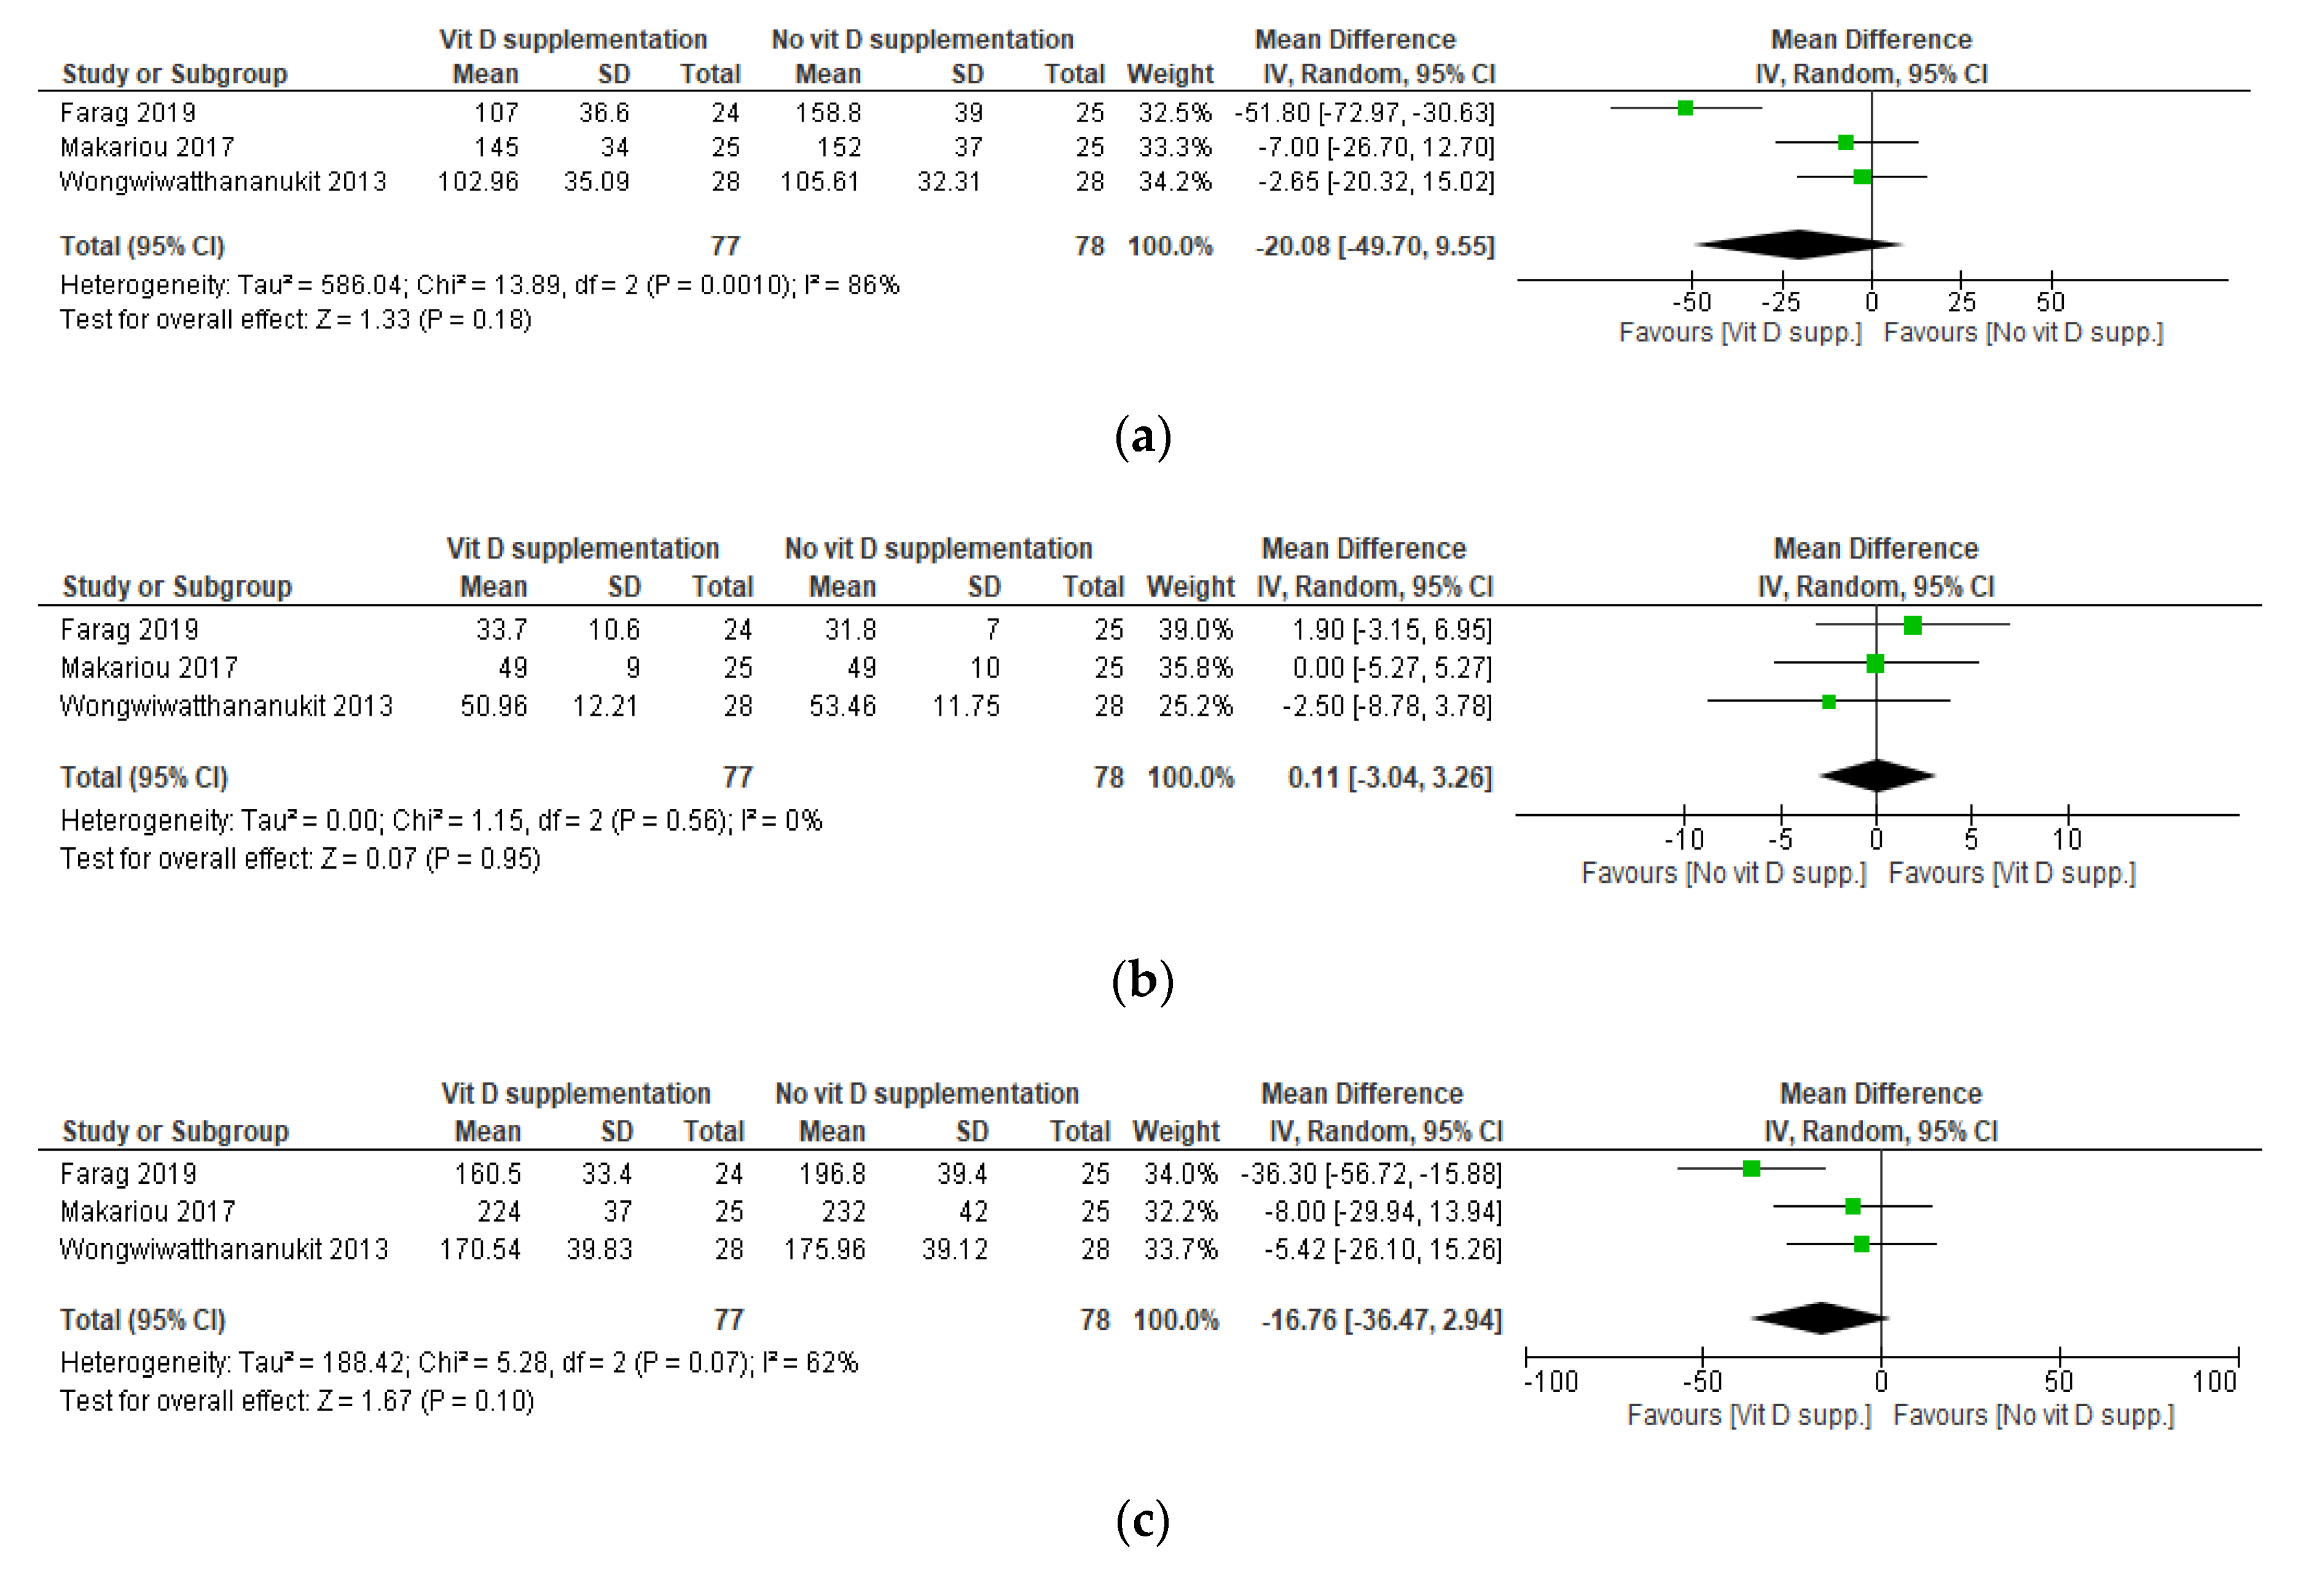
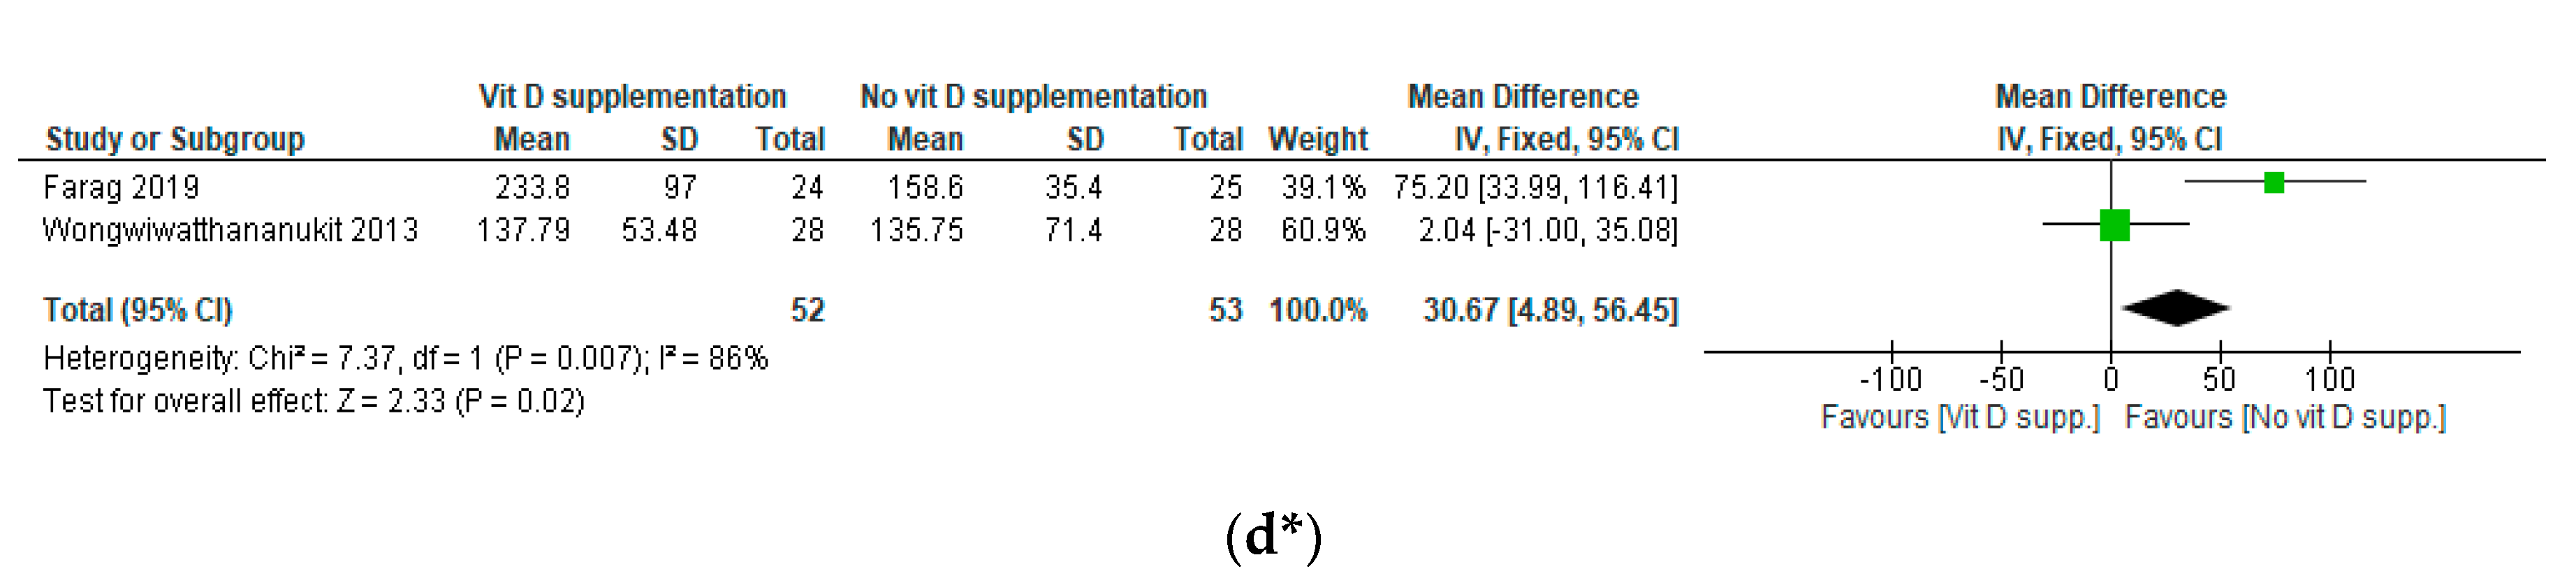
3.5. Results of the Meta-Analyses
4. Discussion
5. Strengths and Limitations
6. Conclusions
Supplementary Materials
Author Contributions
Funding
Acknowledgments
Conflicts of Interest
References
- Challa, A.S.; Makariou, S.E.; Siomou, E.C. The relation of vitamin D status with metabolic syndrome in childhood and adolescence: An update. J. Pediatr. Endocrinol. Metab. 2015, 28. [Google Scholar] [CrossRef] [PubMed]
- Ostman, C.; Smart, N.A.; Morcos, D.; Duller, A.; Ridley, W.; Jewiss, D. The effect of exercise training on clinical outcomes in patients with the metabolic syndrome: A systematic review and meta-analysis. Cardiovasc. Diabetol. 2017, 16. [Google Scholar] [CrossRef] [PubMed] [Green Version]
- Alberti, K.G.M.M.; Zimmet, P.Z. Definition, diagnosis and classification of diabetes mellitus and its complications. Part 1: Diagnosis and classification of diabetes mellitus. Provisional report of a WHO consultation. Diabet. Med. 1998, 15, 539–553. [Google Scholar] [CrossRef]
- Azhdari, M.; Karandish, M.; Mansoori, A. Metabolic benefits of curcumin supplementation in patients with metabolic syndrome: A systematic review and meta-analysis of randomized controlled trials. Phytother. Res. 2019, 33, 1289–1301. [Google Scholar] [CrossRef] [Green Version]
- Ginsberg, H.N.; MacCallum, P.R. The Obesity, Metabolic Syndrome, and Type 2 Diabetes Mellitus Pandemic: Part I. Increased Cardiovascular Disease Risk and the Importance of Atherogenic Dyslipidemia in Persons With the Metabolic Syndrome and Type 2 Diabetes Mellitus. J. Cardiometab. Syndr. 2009, 4, 113–119. [Google Scholar] [CrossRef]
- Yamaoka, K.; Tango, T. Effects of lifestyle modification on metabolic syndrome: A systematic review and meta-analysis. BMC Med. 2012, 10, 138. [Google Scholar] [CrossRef]
- Ginsberg, H.N.; MacCallum, P.R. The Obesity, Metabolic Syndrome, and Type 2 Diabetes Mellitus Pandemic: II. Therapeutic Management of Atherogenic Dyslipidemia. J. Clin. Hypertens. 2009, 11, 520–527. [Google Scholar] [CrossRef] [Green Version]
- Tenenbaum, A.; Fisman, E.Z.; Motro, M.; Adler, Y. Atherogenic dyslipidemia in metabolic syndrome and type 2 diabetes: Therapeutic options beyond statins. Cardiovasc. Diabetol. 2006, 5, 20. [Google Scholar] [CrossRef] [Green Version]
- Grundy, S.M. Hypertriglyceridemia, atherogenic dyslipidemia, and the metabolic syndrome. Am. J. Cardiol. 1998, 81, 18B–25B. [Google Scholar] [CrossRef]
- Musunuru, K. Atherogenic dyslipidemia: Cardiovascular risk and dietary intervention. Lipids 2010, 45, 907–914. [Google Scholar] [CrossRef] [PubMed] [Green Version]
- Moukayed, M.; Grant, W.B. Linking the metabolic syndrome and obesity with vitamin D status: Risks and opportunities for improving cardiometabolic health and well-being. Diabetes Metab. Syndr. Obes. Targets Ther. 2019, 12, 1437–1447. [Google Scholar] [CrossRef] [PubMed] [Green Version]
- Al-Daghri, N.M.; Al-Attas, O.; Yakout, S.; Aljohani, N.; Al-Fawaz, H.; Alokail, M.S. Dietary products consumption in relation to serum 25-hydroxyvitamin D and selenium level in Saudi children and adults. Int. J. Clin. Exp. Med. 2015, 8, 1305. [Google Scholar] [PubMed]
- Barbalho, S.M.; Tofano, R.J.; de Campos, A.L.; Rodrigues, A.S.; Quesada, K.; Bechara, M.D.; de Alvares Goulart, R.; Oshiiwa, M. Association between vitamin D status and metabolic syndrome risk factors. Diabetes Metab. Syndr. Clin. Res. Rev. 2018, 12, 501–507. [Google Scholar] [CrossRef]
- Hypponen, E.; Boucher, B.J.; Berry, D.J.; Power, C. 25-Hydroxyvitamin D, IGF-1, and Metabolic Syndrome at 45 Years of Age: A Cross-Sectional Study in the 1958 British Birth Cohort. Diabetes 2008, 57, 298–305. [Google Scholar] [CrossRef] [PubMed] [Green Version]
- Wimalawansa, S.J. Associations of vitamin D with insulin resistance, obesity, type 2 diabetes, and metabolic syndrome. J. Steroid Biochem. Mol. Biol. 2018, 175, 177–189. [Google Scholar] [CrossRef] [PubMed]
- Prasad, P.; Kochhar, A. Interplay of vitamin D and metabolic syndrome: A review. Diabetes Metab. Syndr. Clin. Res. Rev. 2016, 10, 105–112. [Google Scholar] [CrossRef]
- Parker, J.; Hashmi, O.; Dutton, D.; Mavrodaris, A.; Stranges, S.; Kandala, N.-B.; Clarke, A.; Franco, O.H. Levels of vitamin D and cardiometabolic disorders: Systematic review and meta-analysis. Maturitas 2010, 65, 225–236. [Google Scholar] [CrossRef]
- Ford, E.S.; Ajani, U.A.; McGuire, L.C.; Liu, S. Concentrations of serum vitamin D and the metabolic syndrome among US adults. Diabetes Care 2005, 28, 1228–1230. [Google Scholar] [CrossRef] [Green Version]
- Martini, L.A.; Wood, R.J. Vitamin D status and the metabolic syndrome. Nutr. Rev. 2006, 64, 479–486. [Google Scholar] [CrossRef]
- Lu, L.; Yu, Z.; Pan, A.; Hu, F.B.; Franco, O.H.; Li, H.; Li, X.; Yang, X.; Chen, Y.; Lin, X. Plasma 25-hydroxyvitamin D concentration and metabolic syndrome among middle-aged and elderly Chinese individuals. Diabetes Care 2009, 32, 1278–1283. [Google Scholar] [CrossRef] [Green Version]
- Scragg, R.; Sowers, M.; Bell, C. Serum 25-hydroxyvitamin D, diabetes, and ethnicity in the Third National Health and Nutrition Examination Survey. Diabetes Care 2004, 27, 2813–2818. [Google Scholar] [CrossRef] [PubMed] [Green Version]
- Chiu, K.C.; Chu, A.; Go, V.L.W.; Saad, M.F. Hypovitaminosis D is associated with insulin resistance and β cell dysfunction. Am. J. Clin. Nutr. 2004, 79, 820–825. [Google Scholar] [CrossRef] [PubMed] [Green Version]
- Ponda, M.P.; Dowd, K.; Finkielstein, D.; Holt, P.R.; Breslow, J.L. The short-term effects of vitamin D repletion on cholesterol: A randomized, placebo-controlled trial. Arterioscler. Thromb. Vasc. 2012, 32, 2510–2515. [Google Scholar] [CrossRef] [PubMed] [Green Version]
- Maki, K.C.; Rubin, M.R.; Wong, L.G.; McManus, J.F.; Jensen, C.D.; Lawless, A. Effects of vitamin D supplementation on 25-hydroxyvitamin D, high-density lipoprotein cholesterol, and other cardiovascular disease risk markers in subjects with elevated waist circumference. Int. J. Food. Sci. Nutr. 2011, 62, 318–327. [Google Scholar] [CrossRef]
- Moher, D.; Liberati, A.; Tetzlaff, J.; Altman, D.G. Preferred reporting items for systematic reviews and meta-analyses: The PRISMA statement. Int. J. Surg. 2010, 8, 336–341. [Google Scholar] [CrossRef] [Green Version]
- Available online: http://www.ClinicalTrials.gov (accessed on 31 July 2020).
- International Clinical Trials Registry Platform (ICTRP). Available online: https://apps.who.int/trialsearch/ (accessed on 31 July 2020).
- Cochrane Handbook for Systematic Reviews of Interventions; Higgins, J.P.; Thomas, J.; Chandler, J.; Cumpston, M.; Li, T.; Page, M.J.; Welch, V.A. (Eds.) John Wiley & Sons: New York, NY, USA, 2019. [Google Scholar]
- GRADEpro. Available online: www.gradepro.org (accessed on 20 September 2020).
- Makariou, S.E.; Elisaf, M.; Challa, A.; Tentolouris, N.; Liberopoulos, E.N. No effect of vitamin D supplementation on cardiovascular risk factors in subjects with metabolic syndrome: A pilot randomised study. Arch. Med. Sci. Atheroscler. Dis. 2017, 2, 52–60. [Google Scholar] [CrossRef]
- Makariou, S.E.; Elisaf, M.; Challa, A.; Tellis, C.C.; Tselepis, A.D.; Liberopoulos, E.N. No effect of vitamin D administration plus dietary intervention on emerging cardiovascular risk factors in patients with metabolic syndrome. J. Nutr. Intermed. Metab. 2019, 16, 100093. [Google Scholar] [CrossRef]
- Makariou, S.E.; Elisaf, M.; Challa, A.; Tellis, C.; Tselepis, A.D.; Liberopoulos, E.N. Effect of combined vitamin D administration plus dietary intervention on oxidative stress markers in patients with metabolic syndrome: A pilot randomized study. Clin. Nutr. ESPEN 2019, 29, 198–202. [Google Scholar] [CrossRef]
- Wongwiwatthananukit, S.; Sansanayudh, N.; Phetkrajaysang, N.; Krittiyanunt, S. Effects of vitamin D 2 supplementation on insulin sensitivity and metabolic parameters in metabolic syndrome patients. J. Endocrinol Investig. 2013, 36, 558–563. [Google Scholar]
- Yin, X.; Yan, L.; Lu, Y.; Jiang, Q.; Pu, Y.; Sun, Q. Correction of hypovitaminosis D does not improve metabolic syndrome risk profile in a Chinese population: A randomized controlled trial for 1 year. Asia Pac. J. Clin. Nutr. 2016, 25, 71–77. [Google Scholar]
- Farag, H.A.M.; Hosseinzadeh-Attar, M.J.; Muhammad, B.A.; Esmaillzadeh, A.; Hamid el Bilbeisi, A. Effects of vitamin D supplementation along with endurance physical activity on lipid profile in metabolic syndrome patients: A randomized controlled trial. Diabetes Metab. Syndr. Clin. Res. Rev. 2019, 13, 1093–1098. [Google Scholar] [CrossRef] [PubMed]
- Salekzamani, S.; Mehralizadeh, H.; Ghezel, A.; Salekzamani, Y.; Jafarabadi, M.A.; Bavil, A.S.; Gargari, B.P. Effect of high-dose vitamin D supplementation on cardiometabolic risk factors in subjects with metabolic syndrome: A randomized controlled double-blind clinical trial. J. Endocrinol. Investig. 2016, 39, 1303–1313. [Google Scholar] [CrossRef]
- Van Schoor, N.M.; Lips, P. Worldwide vitamin D status. Best Pract. Res. Clin. Endocrinol. Metab. 2011, 25, 671–680. [Google Scholar] [CrossRef] [PubMed]
- Mendes, M.M.; Charlton, K.; Thakur, S.; Ribeiro, H.; Lanham-New, S.A. Future perspectives in addressing the global issue of vitamin D deficiency. Proc. Nutr. Soc. 2020, 79, 246–251. [Google Scholar] [CrossRef] [PubMed]
- Grant, W.B.; Bhattoa, H.P.; Pludowski, P. Determinants of Vitamin D Deficiency from Sun Exposure. In Vitamin D; Elsevier: Amsterdam, The Netherlands, 2018; pp. 79–90. ISBN 9780128099636. [Google Scholar]
- Vimaleswaran, K.S.; Berry, D.J.; Lu, C.; Tikkanen, E.; Pilz, S.; Hiraki, L.T.; Cooper, J.D.; Dastani, Z.; Li, R.; Houston, D.K.; et al. Causal relationship between obesity and vitamin D status: Bi-directional Mendelian randomization analysis of multiple cohorts. PLoS Med. 2013, 10, e1001383. [Google Scholar] [CrossRef] [PubMed]
- Aquino, S.L.S.; Cunha, A.T.O.; Lima, J.G.; Sena-Evangelista, K.C.M.; Oliveira, A.G.; Cobucci, R.N.; Pedrosa, L.F.C. Effects of vitamin D supplementation on fasting glucose, dyslipidemia, blood pressure, and abdominal obesity among patients with metabolic syndrome: A protocol for systematic review and meta-analysis of randomized controlled trials. Syst. Rev. 2020, 9. [Google Scholar] [CrossRef] [PubMed]
- Challoumas, D. Vitamin D supplementation and lipid profile: What does the best available evidence show? Atherosclerosis 2014, 235, 130–139. [Google Scholar] [CrossRef]
- Wang, H.; Xia, N.; Yang, Y.; Peng, D.Q. Influence of vitamin D supplementation on plasma lipid profiles: A meta-analysis of randomized controlled trials. Lipids Health Dis. 2012, 11, 42. [Google Scholar] [CrossRef] [Green Version]
- Jorde, R.; Grimnes, G. Vitamin D and metabolic health with special reference to the effect of vitamin D on serum lipids. Prog. Lipid Res. 2011, 50, 303–312. [Google Scholar] [CrossRef]
- Wortsman, J.; Matsuoka, L.Y.; Chen, T.C.; Lu, Z.; Holick, M.F. Decreased bioavailability of vitamin D in obesity. Am. J. Clin. Nutr. 2000, 72, 690–693. [Google Scholar] [CrossRef]
- Mangin, M.; Sinha, R.; Fincher, K. Inflammation and vitamin D: The infection connection. Inflamm. Res. 2014, 63, 803–819. [Google Scholar] [CrossRef] [PubMed] [Green Version]
- Lugg, S.T.; Howells, P.A.; Thickett, D.R. Optimal Vitamin D Supplementation Levels for Cardiovascular Disease Protection. Dis. Markers 2015, 2015, 1–10. [Google Scholar] [CrossRef] [PubMed] [Green Version]
- Hollis, B.W.; Wagner, C.L. The Role of the Parent Compound Vitamin D with Respect to Metabolism and Function: Why Clinical Dose Intervals Can Affect Clinical Outcomes. J. Clin. Endocrinol. Metab. 2013, 98, 4619–4628. [Google Scholar] [CrossRef] [PubMed] [Green Version]
- Tabrizi, R.; Vakili, S.; Lankarani, K.; Akbari, M.; Jamilian, M.; Mahdizadeh, Z.; Mirhosseini, N.; Asemi, Z. The Effects of Vitamin D Supplementation on Markers Related to Endothelial Function Among Patients with Metabolic Syndrome and Related Disorders: A Systematic Review and Meta-Analysis of Clinical Trials. Horm. Metab. Res. 2018, 50, 587–596. [Google Scholar] [CrossRef]
- Major, G.C.; Alarie, F.; Doré, J.; Phouttama, S.; Tremblay, A. Supplementation with calcium+ vitamin D enhances the beneficial effect of weight loss on plasma lipid and lipoprotein concentrations. Am. J. Clin. Nutr. 2007, 85, 54–59. [Google Scholar]
- Ahn, J.; Yu, K.; Stolzenberg-Solomon, R.; Simon, K.C.; McCullough, M.L.; Gallicchio, L.; Jacobs, E.J.; Ascherio, A.; Helzlsouer, K.; Jacobs, K.B.; et al. Genome-wide association study of circulating vitamin D levels. Hum. Mol. Genet. 2010, 19, 2739–2745. [Google Scholar] [CrossRef]
- Wang, T.J.; Zhang, F.; Richards, J.B.; Kestenbaum, B.; Van Meurs, J.B.; Berry, D.; Kiel, D.P.; Streeten, E.A.; Ohlsson, C.; Koller, D.L.; et al. Common genetic determinants of vitamin D insufficiency: A genome-wide association study. Lancet 2010, 376, 180–188. [Google Scholar] [CrossRef] [Green Version]
- Shea, M.K.; Benjamin, E.J.; Dupuis, J.; Massaro, J.M.; Jacques, P.F.; D’Agostino, R.B., Sr.; Ordovas, J.M.; O’Donnell, C.J.; Dawson-Hughes, B.; Vasan, R.S.; et al. Genetic and non-genetic correlates of vitamins K and D. Eur. J. Clin. Nutr. 2009, 63, 458–464. [Google Scholar] [CrossRef] [Green Version]
- McGrath, J.J.; Saha, S.; Burne, T.H.; Eyles, D.W. A systematic review of the association between common single nucleotide polymorphisms and 25-hydroxyvitamin D concentrations. J. Steroid Biochem. Mol. Biol. 2010, 121, 471–477. [Google Scholar] [CrossRef]
- Rosecrans, R.; Dohnal, J.C. Seasonal vitamin D changes and the impact on health risk assessment. Clin. Biochem. 2014, 47, 670–672. [Google Scholar] [CrossRef]
- Autier, P.; Boniol, M.; Pizot, C.; Mullie, P. Vitamin D status and ill health: A systematic review. Lancet Diabetes Endocrinol. 2014, 2, 76–89. [Google Scholar] [CrossRef]
- Salekzamani, S.; Bavil, A.S.; Mehralizadeh, H.; Jafarabadi, M.A.; Ghezel, A.; Gargari, B.P. The effects of vitamin D supplementation on proatherogenic inflammatory markers and carotid intima media thickness in subjects with metabolic syndrome: A randomized double-blind placebo-controlled clinical trial. Endocrine 2017, 57, 51–59. [Google Scholar] [CrossRef]
- Chamoli, R.; Bahuguna, G.; Painuly, A.M. Miraculous Physiological activities of vitamin D and its role in human health and diseases. Sci. Cult. 2019, 85, 395–400. [Google Scholar] [CrossRef]
- Manson, J.E.; Bassuk, S.S.; Buring, J.E. VITAL Research Group. Principal results of the vitamin D and OmegA-3 TriaL (VITAL) and updated meta-analyses of relevant vitamin D trials. J. Steroid Biochem. Mol. Biol. 2020, 198, 105522. [Google Scholar] [CrossRef]
- Manousaki, D.; Mitchell, R.; Dudding, T.; Haworth, S.; Harroud, A.; Forgetta, V.; Shah, R.L.; Luan, J.A.; Langenberg, C.; Timpson, N.J.; et al. Genome-wide association study for vitamin D levels reveals 69 independent loci. Am. J. Hum. Genet. 2020, 106, 327–337. [Google Scholar] [CrossRef]


| First Author, Year | Study Design | Geographic Setting/Data Collection Time Period | Study Population | Definition of Metabolic Syndrome | Intervention | Dose, Frequency, Duration | Daily Dose Equivalent | Control | Co-Intervention | Compliance | Drop-Out |
|---|---|---|---|---|---|---|---|---|---|---|---|
| Farag, 2019 [35] | Parallel randomized placebo-controlled trial | Halabja (Kurdistan Region of Iraq)/March to May | I1: n = 24; I2: n = 21; C: n = 25 Ethnicity: NR Mean age (SD): I1: 40.54 (5.94); I2: 40.42 (5.89); C: 42.6 (5.62) %Male: I1: 33.3%; I2: 33.3%; C: 52.0% | IDF criteria | I1. Vitamin D without PA I2. Vitamin D + PA | I1: 2000 IU, Daily, 12 weeks I2: 2000 IU, Daily, 12 weeks + 30 min of endurance PA, Daily | 2000 IU | Placebo without endurance PA | None | NR | I1: 20% I2: 30% C: 16.66% |
| Makariou, 2017 [30] | Prospective, randomized, open-label, blinded end-point trial | Greece/March to September | I: n = 25; C: n = 25 Ethnicity: NR Mean age (SD): I: 52 (9); C: 51 (12) %Male: I: 60%; C: 44% | NCEP-ATP III criteria | Vitamin D3 + dietary intervention according to the NCEP-ATP III guidelines | 2000 IU, Daily, 12 weeks | 2000 IU | Dietary intervention according to NCEP-ATP III guidelines | None | Compliance with Vitamin D: NR Poor compliance with dietary instructions in both groups | 0% |
| Makariou, 2019a [32] | Prospective, randomized, open-label, blinded end-point trial | Greece/March to September | I: n = 25; C: n = 25 Ethnicity: NR Mean age (SD): I: 53 (7); C: 52 (15) %Males: I: 60%; C: 40% | NCEP-ATP III criteria | Vitamin D3 + dietary intervention according to NCEP-ATP III guidelines | 2000 IU, Daily, 12 weeks | 2000 IU | Dietary intervention according to NCEP-ATP III guidelines | None | I: 100%; poor compliance with dietary instructions C: Poor compliance with dietary instructions | 0% |
| Makariou, 2019b [31] | Prospective, randomized, open-label, blinded end-point trial | Greece/March to September | I: n = 25; C: n = 25 Ethnicity: NR Mean age (SD): I: 53 (7); C: 52 (15) %Males: I: 60%; C: 40% | NCEP-ATP III criteria | Vitamin D3 + dietary intervention according to NCEP-ATP III guidelines | 2000 IU, Daily, 12 weeks | 2000 IU | Dietary intervention according to NCEP-ATP III guidelines | None | Compliance with Vitamin D: NR Poor compliancewith dietary instructions in both groups | 0% |
| Salekzamani, 2016 [36] | Randomized placebo-controlled, double-blind parallel trial | Tabriz, Iran/October to June | I: n = 35; C: n = 36 Ethnicity: NR Mean age (SD): 40.49 (5.04) %Males: 49% (data per group: NR) | Criteria of the joint interim statement of the IDF task force on epidemiology and prevention; NHLBI; AHA; World Heart Federation; International Atherosclerosis Society; and International Association for the Study of Obesity | Vitamin D3 | 50,000 IU, Weekly, 16 weeks | 7142.85 IU | Placebo | None | 97% in both groups | I: 12.5% C: 10% |
| Wongwiwatthananukit, 2013 [33] | Prospective randomized, double-blind, double-dummy, parallel trial | Bangkok, Thailand/January to September | I1: n = 28; I2: n = 28; C: n = 28 Ethnicity: NR Mean age (SD): I1: 62.29 (10.63); I2: 63.61 (13.25); C: 65.07 (11.31) %Male: I1: 53.3%; I2: 50%; C: 50% | NCEP-ATP III criteria | I1: vitamin D2 I2: vitamin D2 | I1: 40,000 IU, Weekly, 8 weeks I2: 20,000 IU, Weekly, 8 weeks + 1 placebo capsule, Weekly, 8 weeks | I1: 5714.28 IU I2: 2857.14 IU | Placebo | None | 100% in the 3 groups | I1: 6.66% I2: 6.66% C: 6.66% |
| Yin, 2016 [34] | Randomized placebo-controlled intervention trial | Jinan, North China/November to February | I: n = 61; C: n = 62 with vitamin D deficiency (25(OH)D < 50 nmol/L) Ethnicity: Northern Chinese Mean age (SD): 49.5 (8.72) %Male: 54% (data per group: NR) | Updated NCEP-ATP III criteria for Asian Americans | Vitamin D3 | 700 IU, Daily, 1 year | 700 IU | Placebo | 600 mg elemental Calcium (CalciumCitrate), Daily | 95% in both groups | I: 3.17% C: 1.58% |
| First Author, Year | Assessment Method: Vitamin D | Assessment Method: Dyslipidemia Outcomes | Baseline 25OHD Level (nmol/L) ng/mL * 2.496 = nmol/L | Endline 25OHD Level (nmol/L) ng/mL * 2.496 = nmol/L | Baseline Dyslipidemia Outcomes HDL-C, LDL-C: mmol/L * 38.67 = mg/dL TG: mmol/L * 88.57 = mg/dL | Endline Dyslipidemia Outcomes HDL-C, LDL-C: mmol/L * 38.67 = mg/dL TG: mmol/L * 88.57 = mg/dL | Conclusion |
|---|---|---|---|---|---|---|---|
| Farag, 2019 [35] | 25(OH)D: measured by immunoassay | TC, TG: measured using enzymatic colorimetric tests HDL-C: measured after precipitation of the apolipoprotein B containing lipoproteins with phosphotungistic acid LDL-C: calculated from serum TC, TG and HDL-C based on relevant formula | Mean (SD) I1: 26.70 (6.98) I2: 25.95 (7.98) C: 30.20 (9.73) | Mean (SD) I1: 57.90 (12.23) I2: 72.38 (13.72) C: 31.44 (9.98) | TC mean (SD) (mg/dL) I1: 173.5 (60.8) I2: 194.7 (32.2) C: 185.9 (39) HDL-C mean (SD) (mg/dL) I1: 34.9 (17.3) I2: 40.9 (14.4) C: 30.04 (8.5) LDL-C mean (SD) (mg/dL) I1: 120.7 (64.4) I2: 149.6 (35.8) C: 150.4 (39.8) TG mean (SD) (mg/dL) I1: 229.3 (113.8) I2: 184.5 (98.5) C: 174.4 (43) | TC mean(SD) (mg/dL) I1: 160.5(33.4) I2: 181.7(31.3) C: 196.8(39.4) HDL-C mean (SD) (mg/dL) I1: 33.7 (10.6) I2: 39 (10) C: 31.8 (7) LDL-C mean (SD) (mg/dL) I1: 107(36.6) I2: 138.3(31.4) C: 158.8(39) TG mean (SD) (mg/dL) I1: 233.8 (97) I2: 178.1 (80.8) C: 158.6 (35.4) | At baseline, TG was significantly higher in the I1 compared with the other groups; and HDL-C was significantly higher in the I2 group compared with the other groups There were NS differences in other study parameters between groups At endline, 25(OH)D was significantly higher in the I1 and I2 group compared with the C group TC was significantly lower in the I1 group compared with the other groups LDL-C was significantly lower in the I1 group compared with the C group HDL-C was significantly higher in I2 compared with the other groups Greater significant decrease in TC and LDL-C in I2 compared with the C group There were NS differences in changes in TG and HDL-C between baseline and endline in the 3 groups |
| Makariou, 2017 [30] | 25(OH)D: measured by enzyme immunoassay | TC, TG, HDL-C: measured enzymatically LDL-C: calculated by the Friedewald equation (when TG < 350 mg/dl) ApoA1, ApoB: measured by immunonephelometry | median (min–max) I: 39.93 (7.48–87.36) C: 24.96 (9.98–117.84) | median (min–max) I: 76.37 (20.96–167.23) C: 32.44 (8.73–92.35) | TC mean (SD) (mg/dL) I: 219 (36) C: 231 (34) HDL-C mean (SD) (mg/dL) I: 48 (10) C: 50 (9) LDL-C mean (SD) (mg/dL) I: 140 (35) C: 147 (26) TG median (min–max) (mg/dL) I: 150 (56–336) C: 146 (84–339) Apo A1 mean (SD) (mg/dL) I: 136 (26) C: 143 (13) Apo B mean (SD) (mg/dL) I: 92 (25) C: 107 (16) | TC mean (SD) (mg/dL) I: 224 (37) C: 2232 (42) HDL-C mean (SD) (mg/dL) I: 49 (9) C: 49 (10) LDL-C mean (SD) (mg/dL) I: 145 (34) C: 152 (37) TG median (min-max) (mg/dL) I: 136 (46–261) C: 131 (73–307) Apo A1, ApoB: NR | At baseline, there were NS differences in study parameters between groups At endline, 25(OH)D was significantly higher in the I group compared with the C group There were NS differences in lipid parameters between groups |
| Makariou, 2019a [32] | 25(OH)D: measured by enzyme immunoassay | Oxidized-LDL: measured by a competitive enzyme-linked immunosorbent assay using a specific murine monoclonar antibody Oxidized-LDL/LDL: NR Oxidized-LDL/ApoB: NR | median (95%CI) I: 40.18 (25.70–61.90) C: 24.71 (13.72–39.18) | median (95%CI) I: 76.37 (64.14–103.58) C: 32.94 (19.96–58.65) | Oxidized LDL-C mean (SD) (95%CI) (U/L) I: 70.3 (15.2) (64.8–87.6) C: 67.2 (16.9) (59.2–79.3) Oxidized LDL-C/LDL-C mean (SD) (95%CI) (U/mg) I: 0.05 (0.01) (0.46–0.65) C: 0.06 (0.008) (0.41–0.58) Oxidized LDL-C/ApoB mean(SD) (95%CI) (U/mg) I: 0.08 (0.04) (0.70–1.08) C: 0.07 (0.008) (0.57–0.74) | Oxidized LDL-C mean(SD) (95%CI) (U/L) I: 75.9(21.2) (67.9–89.9) C: 67.3(19.3) (56.9–92.5) Oxidized LDL-C/LDL-C mean(SD) (95%CI) (U/mg) I: 0.05(0.01) (0.46–0.60) C: 0.06(0.02) (0.42–0.78) Oxidized LDL-C/ApoB mean(SD) (95%CI) (U/mg) I: 0.07(0.01) (0.69–0.82) C: 0.08(0.02) (0.66–0.91) | At baseline, Ox-LDL/ApoB (U/mg) was significantly higher in the C group compared with the I group There were NS differences in other study parameters between groups At endline, 25(OH)D was significantly higher in the I group compared with the C group There were NS differences in lipid parameters between groups |
| Makariou, 2019b [31] | 25(OH)D: measured by enzyme immunoassay | sdLDL-C: analyzed electrophoretically sdLDL proportion, mean LDL size: analyzed using the methods of the European Panel On Low-Density Lipoprotein Subclasses | median (min–max) I: 40.18 (8.23–87.60) C: 24.71 (9.98–98.84) | median (min–max) I: 76.37 (20.96–168.72) C: 32.94 (8.73–91.85) | sdLDL median (min–max) (mg/dL) I: 9.0 (0.0–40) C: 7.0 (0.0–22) sdLDL proportion mean (SD) (%) I: 5.7 (5.2) C: 3.8 (2.8) LDL size mean (SD) (nm) I: 264.8 (6.3) C: 266.5 (3.9) | sdLDL median (min-max) (mg/dL) I: 4.0 (0.0–46) C: 5.0 (2.0–25) sdLDL proportion mean (SD) (%) I: 4.5 (4.4) C: 3.3 (2.3) LDL size mean (SD) (nm) I: 266.6 (5.2) C: 267.0 (3.5) | At baseline, there were NS differences in study parameters between groups At endline, 25(OH)D was significantly higher in the I group compared with the C group There were NS difference in lipid parameters between groups |
| Salekzamani, 2016 [36] | 25(OH)D: measured by chemiluminescent immunoassay | TG, TC, LDL-C, HDL-C: measured enzymatically TG/HDL-C: NR LDL/HDL-C: NR | Mean (SD) I: 16.45 (15.50) C: 23.47 (21.34) | Mean (SD) I: 78.38 (21.71) C: 21.46 (17.74) | TC mean (SD) (mg/dL) I: 212 (42) C: 200 (39.27) HDL-C mean (SD) (mg/dL) I: 45 (8.08) C: 45 (10.08) LDL-C mean (SD) (mg/dL) I: 114 (33) C: 117 (28) TG mean (SD) (mg/dL) I: 269 (97) C: 185 (61) TG/HDL-C mean (SD) I: 6.05 (2.21) C: 4.22 (1.64) LDL-C/HDL-C mean (SD) I: 2.53 (0.69) C: 2.57 (0.54) | TC mean (SD) (mg/dL) I: 203.21 (34.63) C: 197.14 (33.57) HDL-C mean (SD) (mg/dL) I: 47 ± 6.63 C: 47 ± 8.24 LDL-C mean (SD) (mg/dL) I: 106 ± 25 C: 111 ± 29 TG mean(SD) (mg/dL) I: 242 ± 82 C: 196 ± 72 TG/HDL-C mean (SD) I: 5.20 ± 1.67 C: 4.37 ± 1.99 LDL-C/HDL-C mean (SD) I: 2.27 ± 0.53 C: 2.36 ± 0.64 | At baseline, TG and TG/HDL-C were significantly higher in the I group compared with the C group There were NS differences in other study parameters between groups At endline, 25(OH)D significantly increased in the I group and was stable in the C group TG and TG/HDL-C had a greater% change in the I compared with the C group There were NS differences in other lipid parameters between groups |
| Wongwiwatthananukit, 2013 [33] | 25(OH)D: measured by chemiluminescent immunoassay | TC, TG, HDL-C, LDL-C: NR | Mean (SD) I1: 35.66 (8.36) I2: 37.63 (7.88) C: 40.43 (7.46) | Mean (SD) I1: 75.95 (17.39) I2: 66.89 (15.89) C: 47.39 (16.74) | TC mean (SD) (mg/dL) I1: 180.36 (34.43) I2: 166.89 (20.95) C: 174.29 (38.90) HDL-C mean(SD) (mg/dL) I1: 53.18(12.46) I2: 52.36(11.86) C: 53.43(12.73) LDL-C mean(SD) (mg/dL) I1: 107.00(27.46) I2: 96.68(19.96) C: 102.50(29.51) TG mean(SD) (mg/dL) I1: 139.32(61.26) I2: 132.29(62.36) C: 129.46(59.75) | TC mean (SD) (mg/dL) I1: 182.04 (31.00) I2: 170.54 (39.83) C: 175.96 (39.12) HDL-C mean (SD) (mg/dL) I1: 52.54 (13.49) I2: 50.96 (12.21) C: 53.46 (11.75) LDL-C mean (SD) (mg/dL) I1: 110.54 (27.47) I2: 102.96 (35.09) C: 105.61 (32.31) TG mean (SD) (mg/dL) I1: 144.82 (64.07) I2: 137.79 (53.48) C: 135.75 (71.40) | At baseline, there were NS differences in study parameters between groups At endline, 25(OH)D was significantly higher in the I1 and I2 groups compared with the C group There were NS differences in lipid parameters between groups |
| Yin, 2016 [34] | 25(OH)D: measured by double antibody radioimmunoassay | TG, HDL-C: measured by enzymatic colorimetric assay LDL-C: calculated using the Friedwald equation | Mean (SD) I: 36.44 (5.44) C: 35.44 (6.36) | Mean (SD) I: 82.61 (10.90) C: 36.44 (6.98) | HDL-C mean (SD) (mg/dL) I: 41.38 (3.09) C: 38.28 (2.70) LDL-C mean (SD) (mg/dL) I: 126.06 (9.66) C: 123.74 (7.73) TG mean (SD) (mg/dL) I: 295.84 (60.23) C: 280.8 (35.43) | HDL-C mean (SD) (mg/dL) I: 42.15 (2.70) C: 40.22 (2.32) LDL-C mean (SD) (mg/dL) I: 122.97 (9.28) C: 121.42 (8.50) TG mean (SD) (mg/dL) I: 250.66 (36.31) C: 255.1 (19.48) | At baseline, there were NS differences in study parameters between groups At endline, 25(OH)D significantly increased in the I group and was stable in the C group There were NS differences in lipid parameters between groups Similar results were obtained in the obesity and non-obesity subgroups |
Publisher’s Note: MDPI stays neutral with regard to jurisdictional claims in published maps and institutional affiliations. |
© 2020 by the authors. Licensee MDPI, Basel, Switzerland. This article is an open access article distributed under the terms and conditions of the Creative Commons Attribution (CC BY) license (http://creativecommons.org/licenses/by/4.0/).
Share and Cite
AlAnouti, F.; Abboud, M.; Papandreou, D.; Mahboub, N.; Haidar, S.; Rizk, R. Effects of Vitamin D Supplementation on Lipid Profile in Adults with the Metabolic Syndrome: A Systematic Review and Meta-Analysis of Randomized Controlled Trials. Nutrients 2020, 12, 3352. https://doi.org/10.3390/nu12113352
AlAnouti F, Abboud M, Papandreou D, Mahboub N, Haidar S, Rizk R. Effects of Vitamin D Supplementation on Lipid Profile in Adults with the Metabolic Syndrome: A Systematic Review and Meta-Analysis of Randomized Controlled Trials. Nutrients. 2020; 12(11):3352. https://doi.org/10.3390/nu12113352
Chicago/Turabian StyleAlAnouti, Fatme, Myriam Abboud, Dimitrios Papandreou, Nadine Mahboub, Suzan Haidar, and Rana Rizk. 2020. "Effects of Vitamin D Supplementation on Lipid Profile in Adults with the Metabolic Syndrome: A Systematic Review and Meta-Analysis of Randomized Controlled Trials" Nutrients 12, no. 11: 3352. https://doi.org/10.3390/nu12113352