GLIM Criteria Using Hand Grip Strength Adequately Predict Six-Month Mortality in Cancer Inpatients

 ,
,
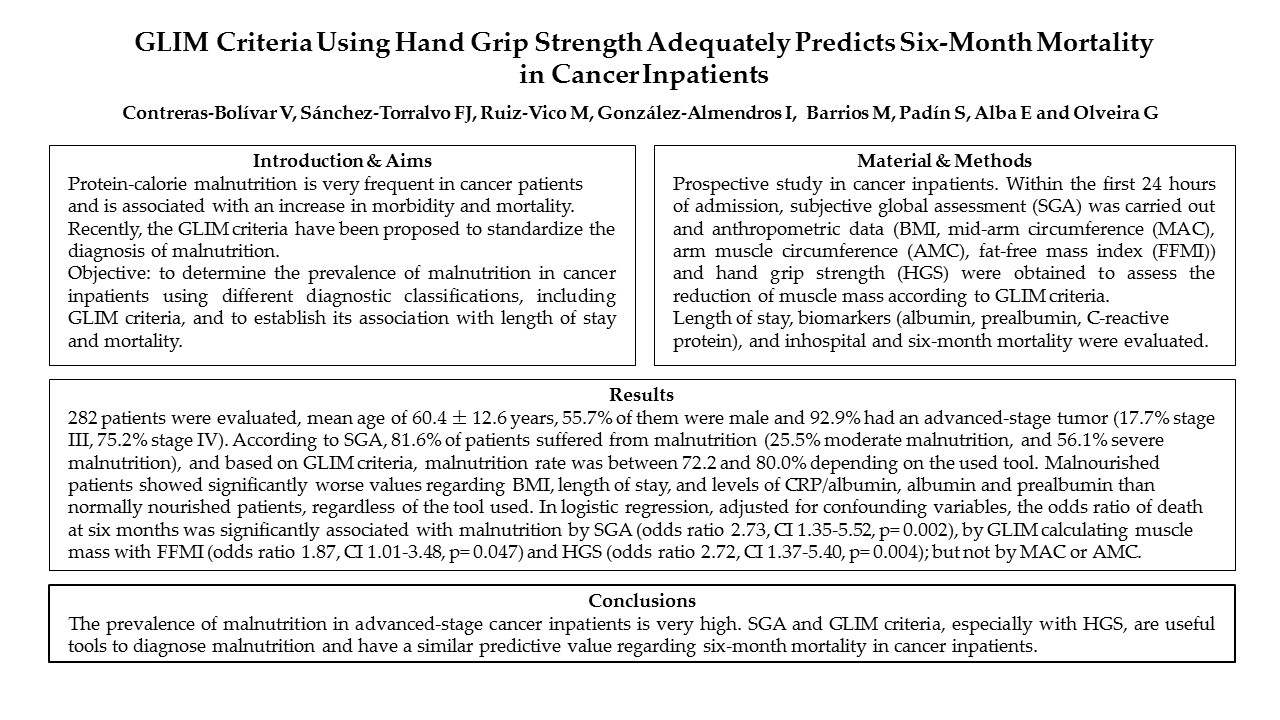
Abstract
: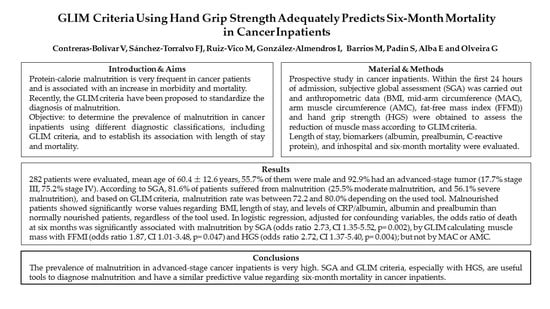
1. Introduction
2. Materials and Methods
2.1. Assessment of the Cancer Status
2.2. Assessment of the Nutritional Status
2.3. Malnutrition According to GLIM Criteria
2.3.1. Phenotypic Criteria
2.3.2. Etiologic Criteria
2.4. Data Analysis
2.5. Ethics
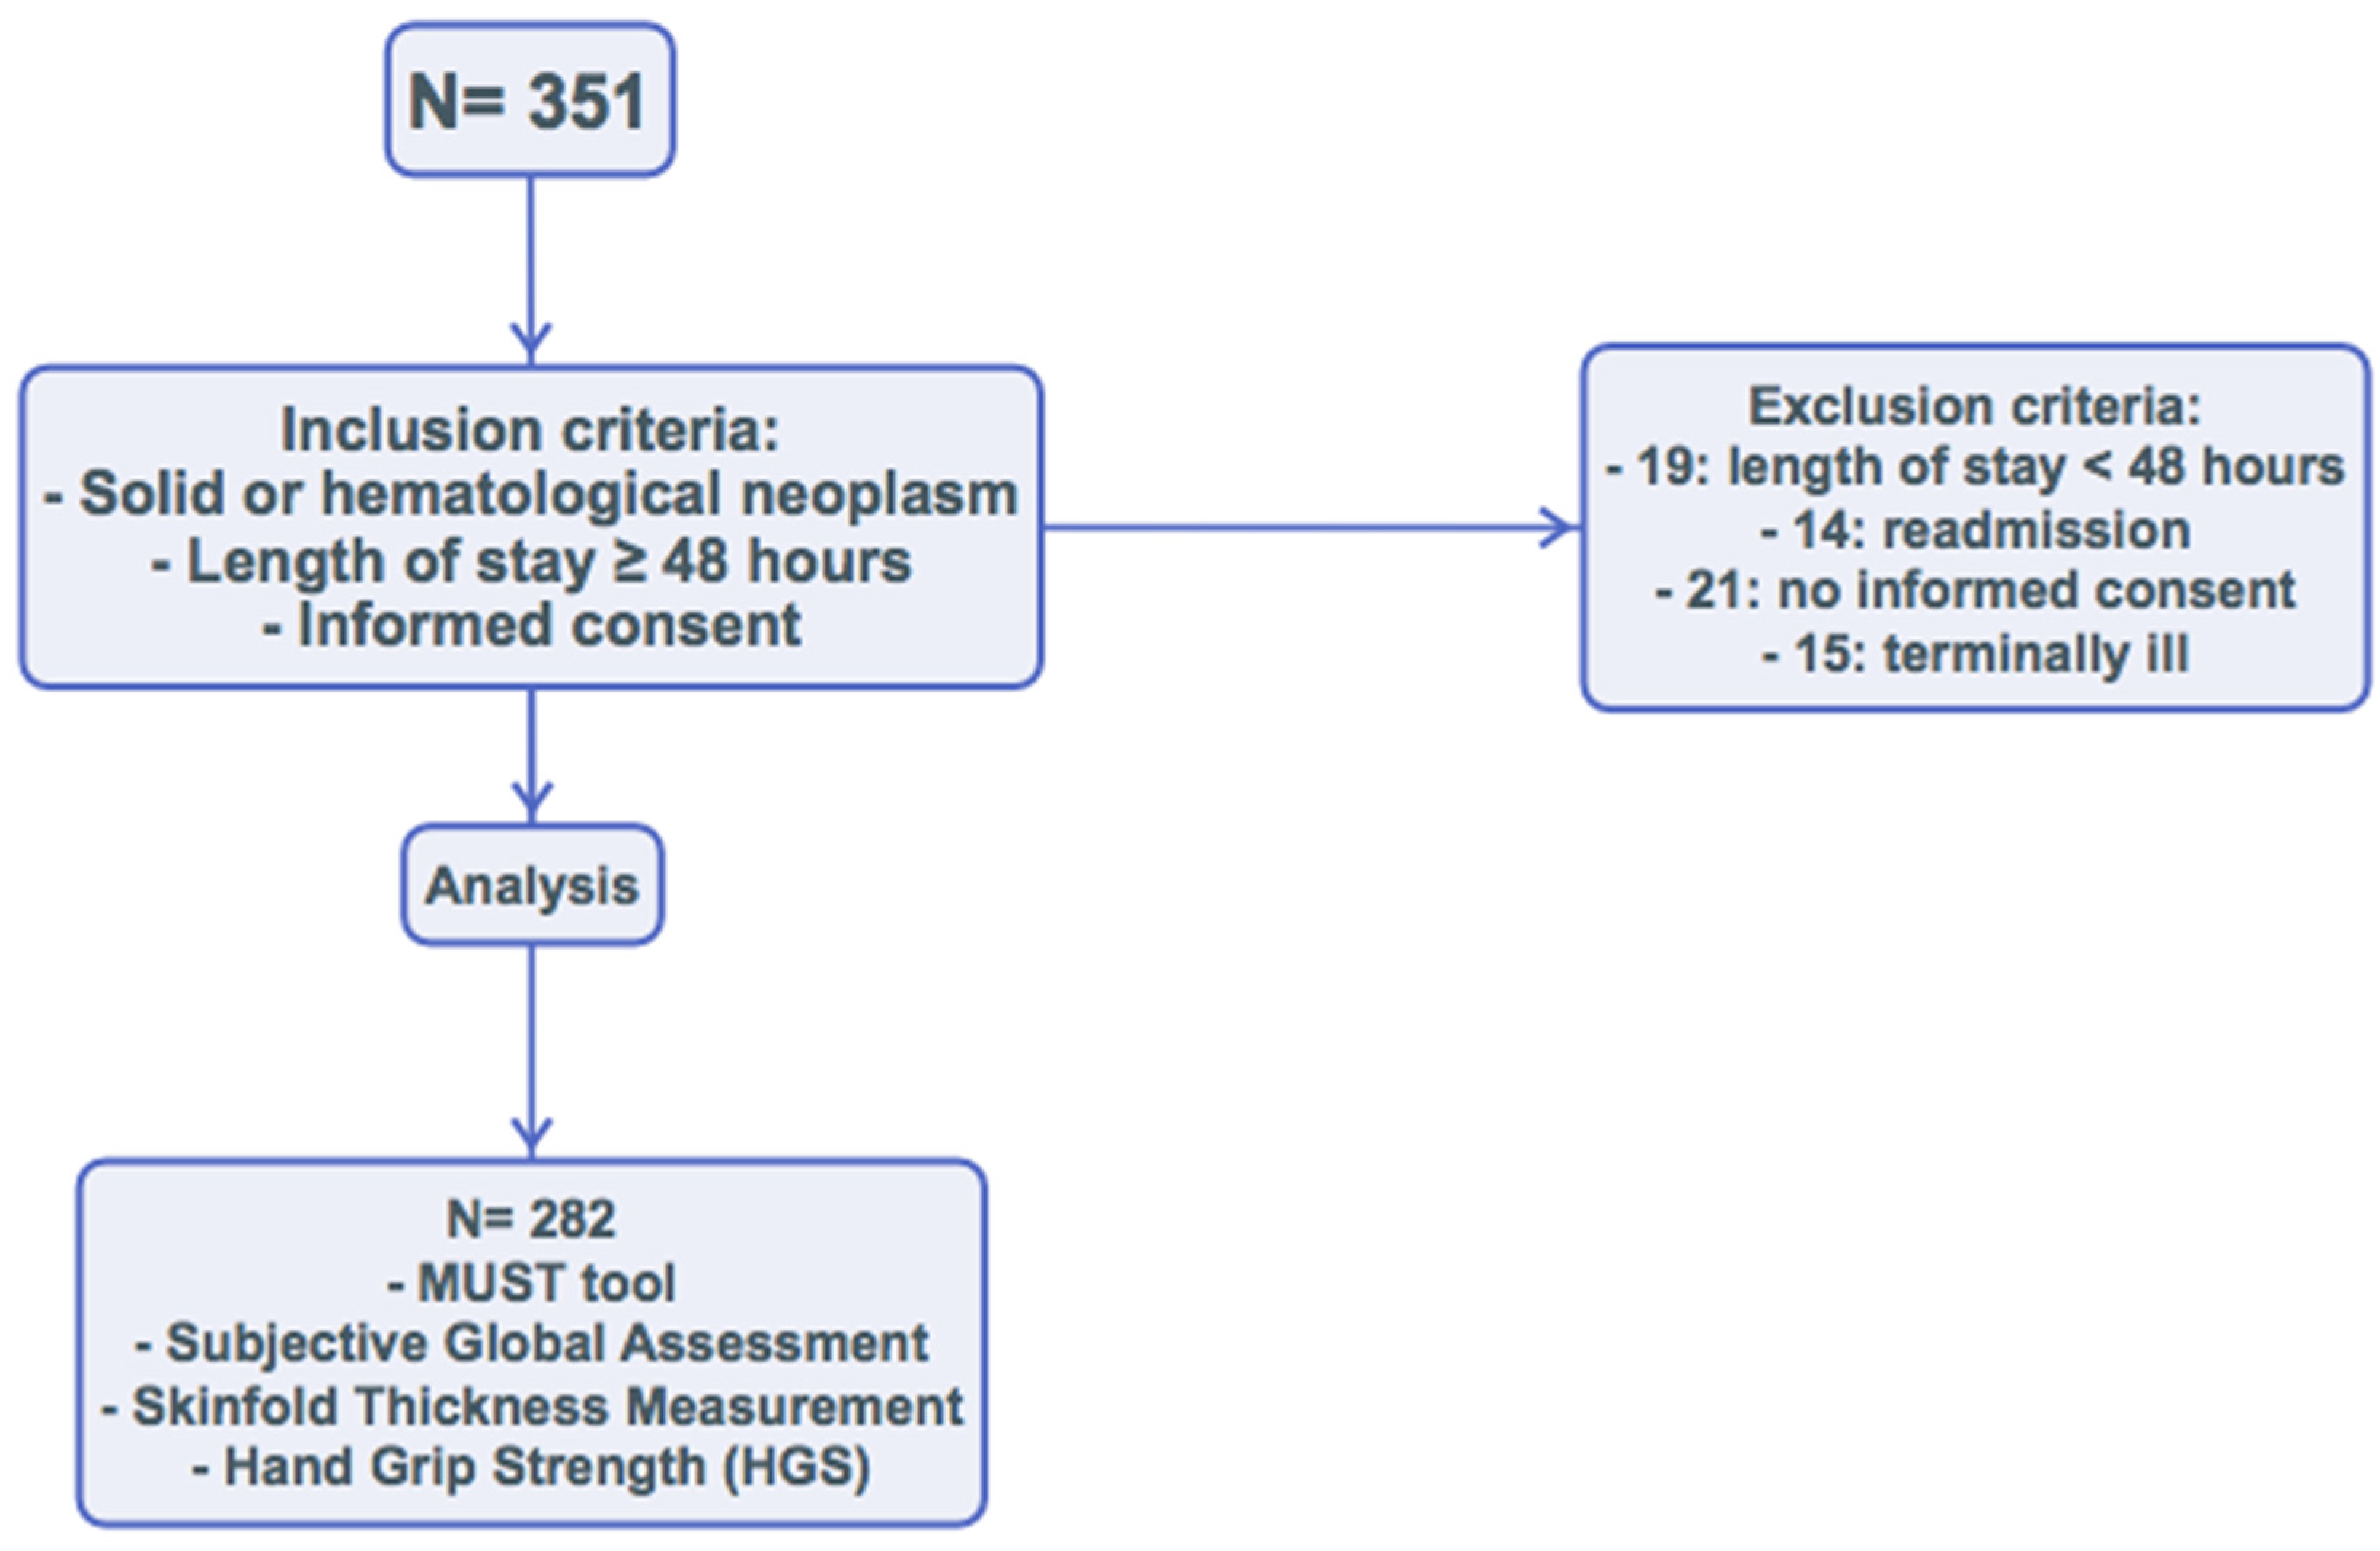
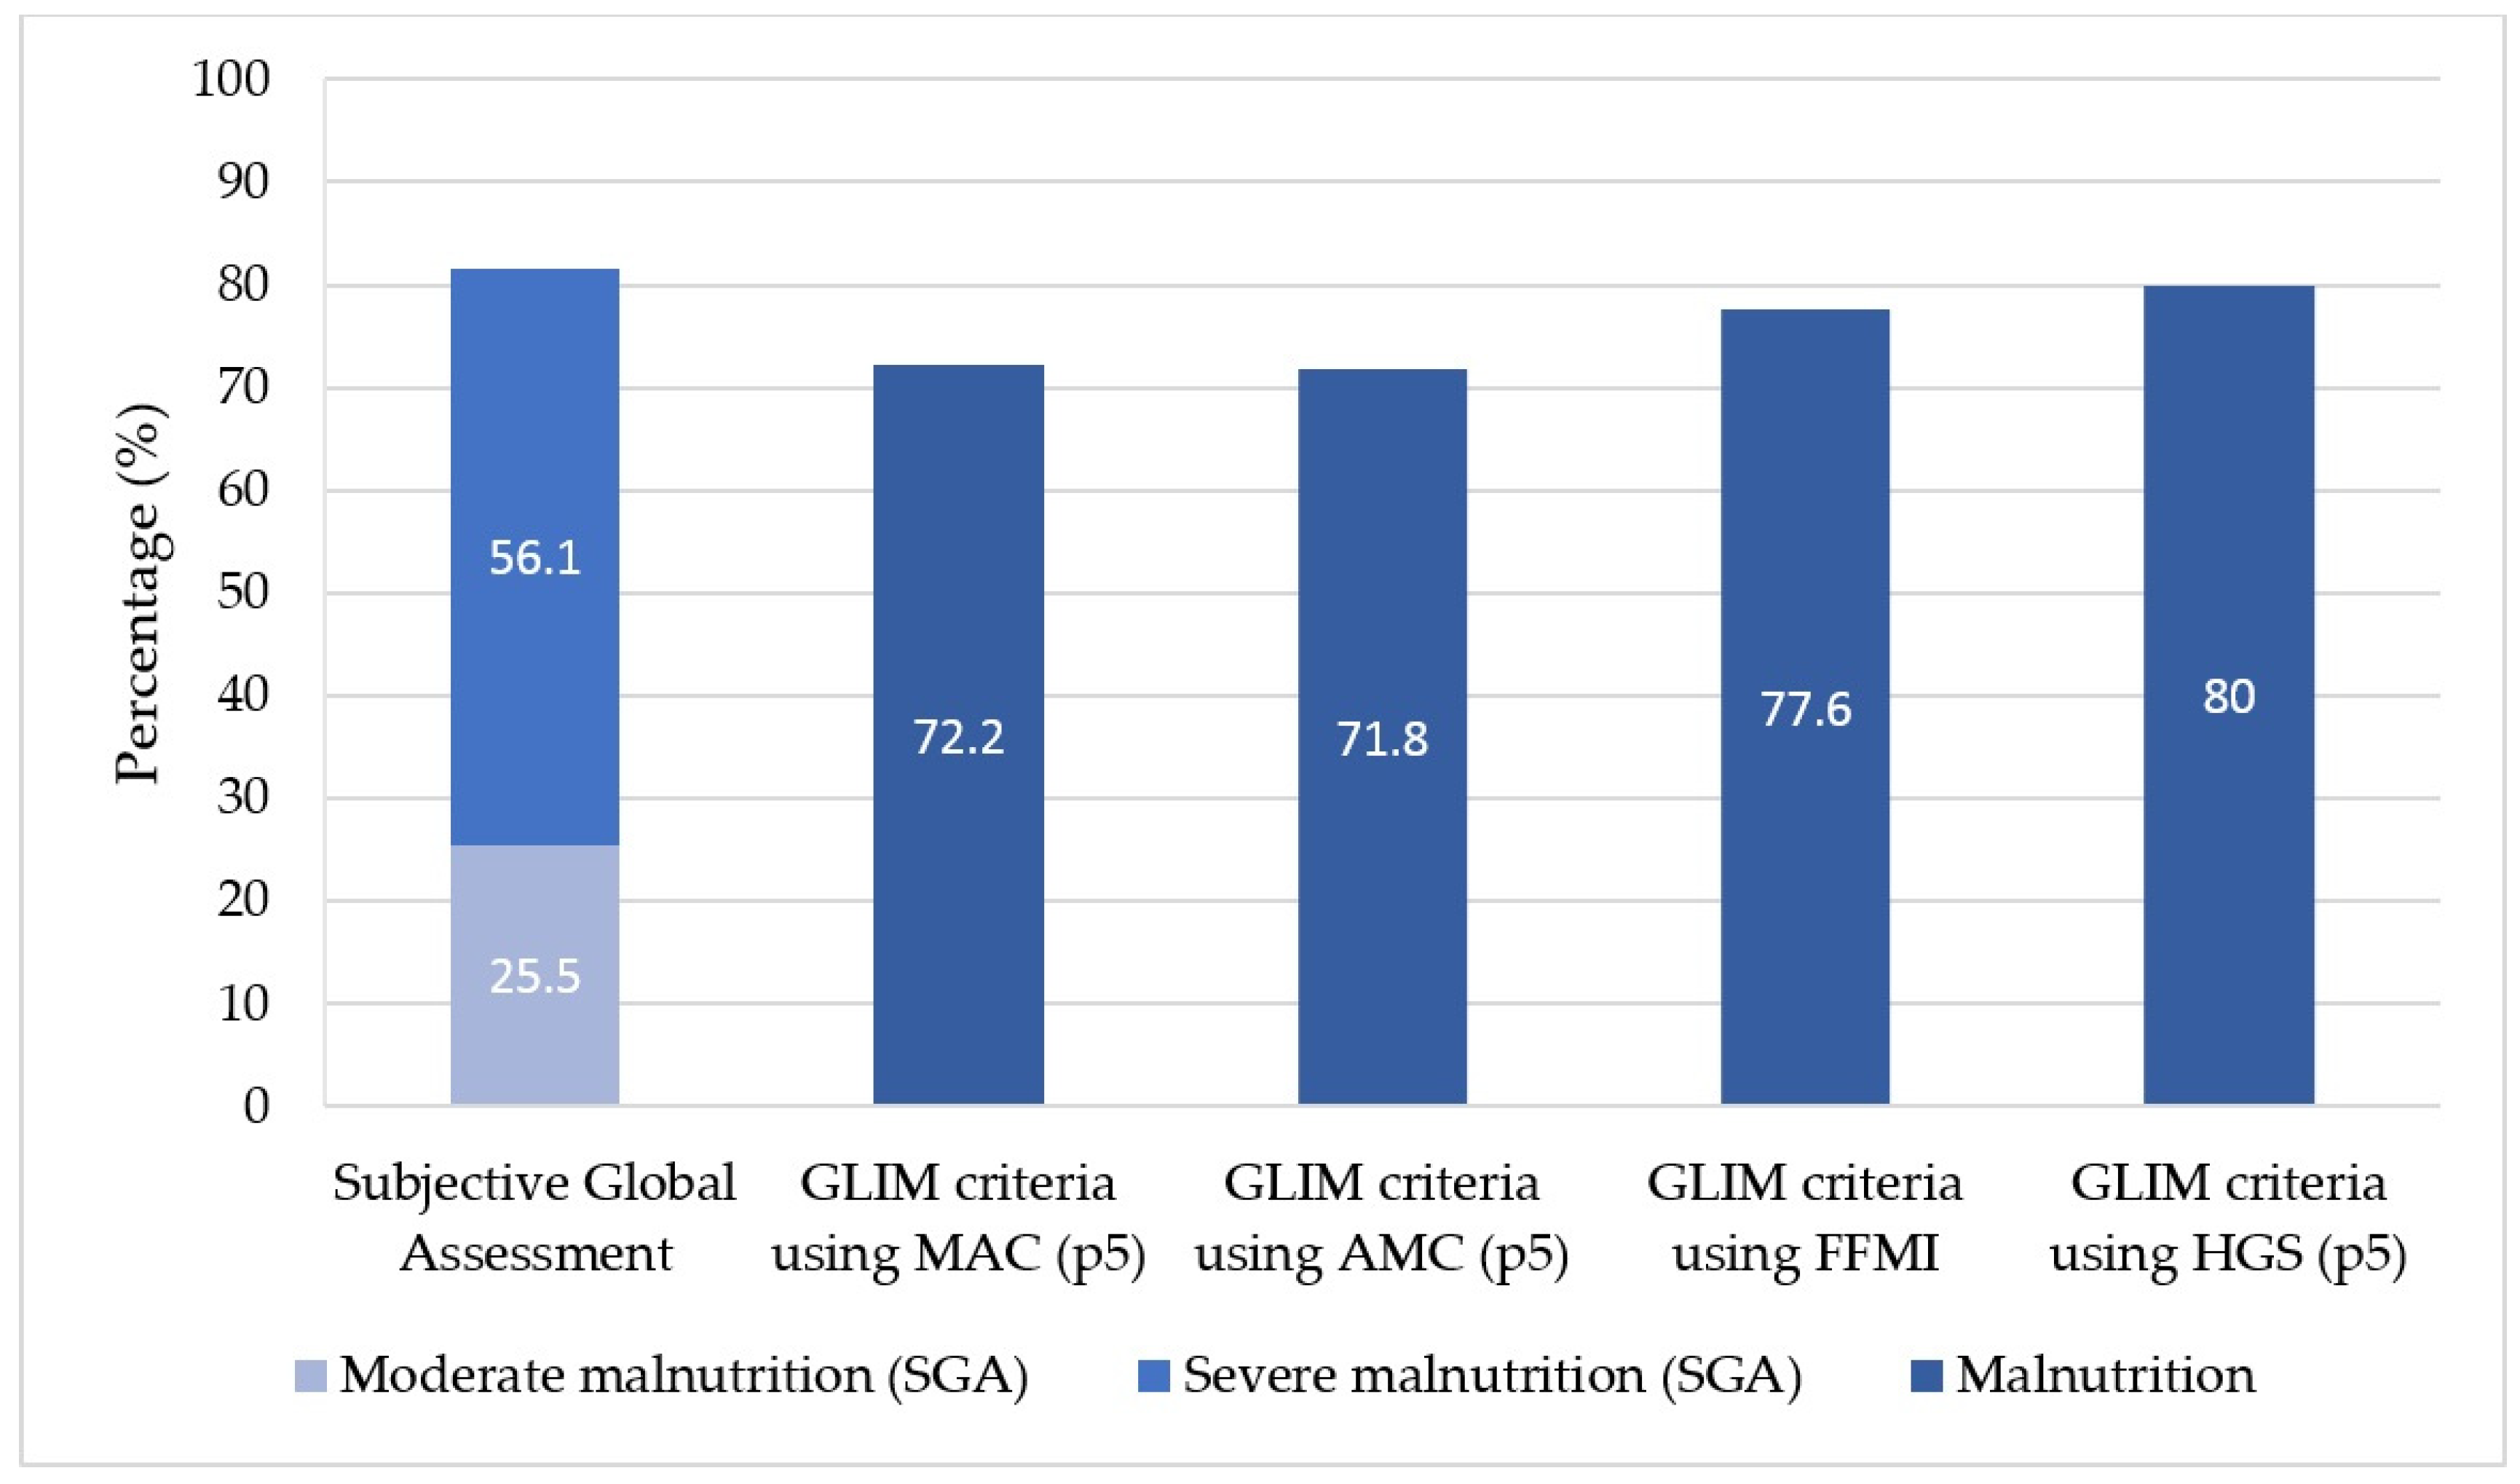
3. Results
4. Discussion
Author Contributions
Funding
Acknowledgments
Conflicts of Interest
References
- Cederholm, T.; Barazzoni, R.; Austin, P.; Ballmer, P.; Biolo, G.; Bischoff, S.C.; Compher, C.; Correia, I.; Higashiguchi, T.; Holst, M.; et al. ESPEN guidelines on definitions and terminology of clinical nutrition. Clin. Nutr. 2017, 36, 49–64. [Google Scholar] [CrossRef] [PubMed]
- White, J.V.; Guenter, P.; Jensen, G.; Malone, A.; Schofield, M. Consensus statement: Academy of Nutrition and Dietetics and American Society for Parenteral and Enteral Nutrition: Characteristics recommended for the identification and documentation of adult malnutrition (undernutrition). JPEN J. Parenter. Enter. Nutr. 2012, 36, 275–283. [Google Scholar] [CrossRef] [PubMed]
- Jensen, G.L.; Mirtallo, J.; Compher, C.; Dhaliwal, R.; Forbes, A.; Grijalba, R.F.; Hardy, G.; Kondrup, J.; Labadarios, D.; Nyulasi, I.; et al. Adult starvation and disease-related malnutrition: A proposal for etiology-based diagnosis in the clinical practice setting from the International Consensus Guideline Committee. JPEN J. Parenter. Enter. Nutr. 2010, 34, 156–159. [Google Scholar] [CrossRef] [PubMed]
- Cederholm, T.; Jensen, G.L.; Correia, M.I.T.; Gonzalez, M.C.; Fukushima, R.; Higashiguchi, T.; Baptista, G.; Barazzoni, R.; Blaauw, R.; Coats, A.J.; et al. ESPEN Endorsed Recommendation GLIM criteria for the diagnosis of malnutrition e A consensus report from the global clinical nutrition community. Clin. Nutr. 2019, 38, 1–9. [Google Scholar] [CrossRef] [PubMed]
- Arends, J.; Bachmann, P.; Baracos, V.; Barthelemy, N.; Bertz, H.; Bozzetti, F.; Fearon, K.; Hütterer, E.; Isenring, E.; Kaasa, S.; et al. ESPEN guidelines on nutrition in cancer patients. Clin. Nutr. 2016, 36, 11–48. [Google Scholar] [CrossRef] [PubMed] [Green Version]
- August, D.A.; Huhmann, M.B. ASPEN clinical guidelines: Nutrition support therapy during adult anticancer treatment and in hematopoietic cell transplantation. JPEN J. Parenter. Enter. Nutr. 2009, 33, 472–500. [Google Scholar] [CrossRef] [PubMed]
- Vanhoutte, G.; Wouters, K.; Sels, M.; Bartolomeeussen, L.; Verschueren, C.; Smits, E.; Cheung, K.J.; Aerts, P.; Baert, D.; Vandoninck, C.; et al. Cachexia in cancer: What is in the definition? BMJ Open Gastroenterol. 2016, 3, e000097. [Google Scholar] [CrossRef]
- Study Group of Hyperglycemia in Parenteral Nutrition; Nutrition Area of the Spanish Society of Endocrinology and Nutrition (SEEN). The subjective global assessment predicts in-hospital mortality better than other nutrition-related risk indexes in noncritically ill inpatients who receive total parenteral nutrition in Spain (prospective multicenter study). J. Acad. Nutr. Diet. 2013, 113, 1209–1218. [Google Scholar] [CrossRef]
- Coker, R.H.; Wolfe, R.R. Bedrest and sarcopenia. Curr. Opin. Clin. Nutr. Metab. Care 2012, 15, 7–11. [Google Scholar] [CrossRef]
- Norman, K.; Schutz, T.; Kemps, M.; Josef Lubke, H.; Lochs, H.; Pirlich, M. The Subjective Global Assessment reliably identifies malnutrition-related muscle dysfunction. Clin. Nutr. 2005, 24, 143–150. [Google Scholar] [CrossRef]
- Almeida, A.I.; Correia, M.; Camilo, M.; Ravasco, P. Nutritional risk screening in surgery: Valid, feasible, easy! Clin. Nutr. 2012, 31, 206–211. [Google Scholar] [CrossRef] [PubMed]
- Stratton, R.J.; Hackston, A.; Longmore, D.; Dixon, R.; Price, S.; Stroud, M.; King, C.; Elia, M. Malnutrition in hospital outpatients and inpatients: Prevalence, concurrent validity and ease of use of the “malnutrition universal screening tool” (‘MUST’) for adults. Br. J. Nutr. 2004, 92, 799–808. [Google Scholar] [CrossRef] [PubMed]
- Detsky, A.S.; Baker, J.P.; Johnston, N.; Whittaker, S.; Mendelson, R.A.; Jeejeebhoy, K.N. What is subjective global assessment of nutritional status? J. Parenter. Enter. Nutr. 1987, 11, 8–13. [Google Scholar] [CrossRef] [PubMed] [Green Version]
- Douglas, E.; Mcmillan, D.C. Towards a simple objective framework for the investigation and treatment of cancer cachexia: The Glasgow Prognostic Score. Cancer Treat. Rev. 2018, 40, 685–691. [Google Scholar] [CrossRef] [PubMed]
- Alaustré, A.; Rull, M.; Camps, I.; Ginesta, C.; Melus, M.R.S. Nuevas normas y consejos en la valoración n de los parámetros en nuestra población: Índice adiposo-muscular, índices ponderales y tablas de percentiles de los datos antropométricos útiles en una valoración nutricional. Med. Clin. 1988, 91, 223–236. [Google Scholar]
- Nutrición interactiva. Sociedad Española de Endocrinología y Nutrición. España. Available online: http://www.seen.es/nutricion-interactiva/index.html (accessed on 15 September 2017).
- Olveira, G. Manual de Nutricion Clinica y Dietetica, 3rd ed.; Elsevier: Amsterdam, The Netherlands, 2016. [Google Scholar]
- Siri, W.E. Body composition from fluid spaces and density: Analysis of methods. Tech. Meas. Body Compos. 1961, 61, 223–244. [Google Scholar]
- Durnin, J.V.; Womersley, J. Body fat assessed from total body density and its estimation from skinfold thickness: Measurements on 481 men and women aged from 16 to 72 years. Br. J. Nutr. 1974, 32, 77–97. [Google Scholar] [CrossRef]
- Torralvo, F.J.S.; Porras, N.; Fernández, J.A.; Torres, F.G.; Tapia, M.J.; Lima, F.; Soriguer, F.; Gonzalo, M.; Martínez, G.R.; Olveira, G. Normative reference values for hand grip dynamometry in Spain. Association with lean mass. Nutr. Hosp. 2018, 35, 98–103. [Google Scholar]
- Fearon, K.; Strasser, F.; Anker, S.D.; Bosaeus, I.; Bruera, E.; Fainsinger, R.L.; Jatoi, A.; Loprinzi, C.; MacDonald, N.; Mantovani, G.; et al. Definition and classification of cancer cachexia: An international consensus. Lancet Oncol. 2011, 12, 489–495. [Google Scholar] [CrossRef]
- Li, R.; Wu, J.; Ma, M.; Pei, J.; Song, Y.; Zhang, X.; Han, B. Comparison of PG-SGA, SGA and body-composition measurement in detecting malnutrition among newly diagnosed lung cancer patients in stage IIIB/IV and benign conditions. Med. Oncol. 2011, 28, 689–696. [Google Scholar] [CrossRef]
- Sánchez-Lara, K.; Turcott, J.G.; Juárez, E.; Guevara, P.; Núñez-Valencia, C.; Oñate-Ocaña, L.F.; Flores, D.; Arrieta, Ó. Association of nutrition parameters including bioelectrical impedance and systemic inflammatory response with quality of life and prognosis in patients with advanced non-small-cell lung cancer: A prospective study. Nutr. Cancer 2012, 64, 526–534. [Google Scholar] [CrossRef] [PubMed]
- Keith, J.N. Bedside nutrition assessment past, present, and future: A review of the Subjective Global Assessment. Nutr. Clin. Pract. 2008, 23, 410–416. [Google Scholar] [CrossRef]
- Guo, C.B.; Zhang, W.; Ma, D.Q.; Zhang, K.H.; Huang, J.Q. Hand grip strength: An indicator of nutritional state and the mix of postoperative complications in patients with oral and maxillofacial cancers. Br. J. Oral Maxillofac. Surg. 1996, 34, 325–327. [Google Scholar] [CrossRef]
- Webb, A.R.; Newman, L.A.; Taylor, M.; Keogh, J.B. Hand grip dynamometry as a predictor of postoperative complications reappraisal using age standardized grip strengths. JPEN J. Parenter. Enter. Nutr. 1989, 13, 30–33. [Google Scholar] [CrossRef] [PubMed]
- Kerr, A.; Syddall, H.E.; Cooper, C.; Turner, G.F.; Briggs, R.S.; Sayer, A.A. Does admission grip strength predict length of stay in hospitalised older patients? Age Ageing 2006, 35, 82–84. [Google Scholar] [CrossRef] [PubMed] [Green Version]
- Vecchiarino, P.; Bohannon, R.W.; Ferullo, J.; Maljanian, R. Short-term outcomes and their predictors for patients hospitalized with community-acquired pneumonia. Heart Lung 2004, 33, 301–307. [Google Scholar] [CrossRef]
- Kilgour, R.D.; Vigano, A.; Trutschnigg, B.; Lucar, E.; Borod, M.; Morais, J.A. Handgrip strength predicts survival and is associated with markers of clinical and functional outcomes in advanced cancer patients. Support. Care Cancer 2013, 21, 3261–3270. [Google Scholar] [CrossRef]
- Norman, K.; Stobäus, N.; Smoliner, C.; Zocher, D.; Scheufele, R.; Valentini, L.; Lochs, H.; Pirlich, M. Determinants of hand grip strength, knee extension strength and functional status in cancer patients. Clin. Nutr. 2010, 29, 586–591. [Google Scholar] [CrossRef]
- Bohannon, R.W. Test-Retest Reliability of Measurements of Hand-Grip Strength Obtained by Dynamometry from Older Adults: A Systematic Review of Research in the PubMed Database. J. Frailty Aging 2017, 6, 83–87. [Google Scholar] [PubMed]


| n = 282 | ||
|---|---|---|
| Age (years) | mean ± SD | 60.4 ± 12.6 |
| Sex | n (%) | |
| Men | 157 (55.7) | |
| Women | 125 (44.3) | |
| Type of admission | n (%) | |
| Scheduled | 51 (18.1) | |
| Urgent | 231 (81.9) | |
| Tumor stage | n (%) | |
| I | 7 (2.5) | |
| II | 13 (4.6) | |
| III | 50 (17.7) | |
| IV | 212 (75.2) | |
| Glasgow prognostic score | n (%) | |
| No inflammation | 13 (4.6) | |
| Inflammation | 269 (95.4) | |
| BMI (kg/m2) | mean ± SD | |
| Men | 24.7 ± 4.9 | |
| Women | 24.5 ± 5.1 | |
| Mid-arm circumference (cm) | mean ± SD | |
| Men | 26.6 ± 3.3 | |
| Women | 26.3 ± 4.3 | |
| <p5 | n (%) | 39 (14.8) |
| Arm muscle circumference (cm) | mean ± SD | |
| Men | 22.9 ± 2.7 | |
| Women | 20.5 ± 2.8 | |
| <p5 | n (%) | 24 (9.1) |
| Fat-free mass index (kg/m2) | mean ± SD | |
| Men | 17.49 ± 2.42 | |
| Women | 15.93 ± 2.48 | |
| Hand grip strength (kg) | mean ± SD | |
| Men | 26.21 ± 8.58 | |
| Women | 16.51 ± 6.70 | |
| <p5 | n (%) | 107 (37.9) |
| 6-month death | n (%) | 135 (47.9) |
| n = 282 | ||
|---|---|---|
| MUST tool | n (%) | |
| 0 points (low malnutrition risk) | 48 (17.0) | |
| 1 point (medium malnutrition risk) | 42 (14.9) | |
| 2 points or more (high malnutrition risk) | 192 (68.1) | |
| Global subjective assessment | n (%) | |
| Normally nourished | 52 (18.4) | |
| Moderate malnutrition | 72 (25.5) | |
| Severe malnutrition | 158 (56.1) | |
| BMI | ||
| Low BMI | n (%) | 58 (20.6) |
| Normal and high BMI | 224 (79.4) | |
| FFMI | n (%) | |
| Normal FFMI a | 67 (23.8) | |
| Low FFMI a | 215 (76.2) | |
| Malnutrition by GLIM criteria | n (%) | |
| Using mid-arm circumference p5 | ||
| Normally nourished | 72 (27.8) | |
| Malnutrition | 187 (72.2) | |
| Using arm muscle circumference p5 | ||
| Normally nourished | 73 (28.2) | |
| Malnutrition | 186 (71.8) | |
| Using FFMI | ||
| Normally nourished | 62 (22) | |
| Malnutrition | 215 (77.6) | |
| Using hand grip p5 | ||
| Normally nourished | 54 (20) | |
| Malnutrition | 216 (80) |
| Subjetive Global Assessment | GLIM Criteria Using Mid-Arm Circumference (p5) | GLIM Criteria Using Arm Muscle Circumference (p5) | GLIM Criteria Using Grip Strength (p5) | GLIM Criteria Using FFMI by Anthropometry | |||||||
|---|---|---|---|---|---|---|---|---|---|---|---|
| Normally Nourished (n = 52) | Moderate Malnutrition (n = 71) | Severe Malnutrition (n = 157) | Normally Nourished (n = 72) | Malnourished (n = 187) | Normally Nourished (n = 77) | Malnourished (n = 197) | Normally Nourished (n = 54) | Malnourished (n = 216) | Normally Nourished (n = 62) | Malnourished (n = 215) | |
| mean ± standard deviation | |||||||||||
| Age (years) | 57.9 ± 12.4 | 58.0 ± 14.6 | 62.3 ± 11.3 * | 58.9 ± 12.8 | 61.5 ± 11.8 | 58.6 ± 12.7 | 61.7 ± 11.8 | 57.5 ± 11.8 | 61.5 ± 12.3 * | 57.8 ± 13 | 61.5 ± 11.8 * |
| Charlson index | 4.9 ± 2.1 | 4.9 ± 2.2 | 5.8 ± 1.9 * | 5 ± 2.1 | 5.6 ± 2 * | 4.9 ± 2 | 5.6 ± 2 * | 4.7 ± 2.1 | 5.6 ± 2 * | 4.8 ± 2.1 | 5.6 ± 2 * |
| BMI (kg/m2) | 28.1 ± 3.7 | 25.4 ± 3.9 | 23.1 ± 5.1 * | 27.2 ± 3.2 | 23.7 ± 5.3 * | 27.1 ± 3.2 | 23.7 ± 5.3 * | 27.0 ± 3.4 | 23.9 ± 5.1 * | 27.8 ± 2.8 | 23.7 ± 5.1 * |
| CRP (mg/dL) | 34.5 ± 58.5 | 69.3 ± 87.5 | 81.8 ± 90.3 | 51.4 ± 75.5 | 78.4 ± 91.1 * | 50.1 ± 75.3 | 79.0 ± 91.1 * | 49.1 ± 74.7 | 76.9 ± 89.4 * | 54.4 ± 81.3 | 74.5 ± 87.7 |
| Albumin (g/dL) | 3.27 ± 0.58 | 2.81 ± 0.58 | 2.57 ± 0.59 * | 3.06 ± 0.6 | 2.64 ± 0.61 * | 3.07 ± 0.6 | 2.63 ± 0.61 * | 3.14 ± 0.56 | 2.66 ± 0.63 * | 3.05 ± 0.62 | 2.66 ± 0.62 * |
| CRP/albumin ratio | 14.1 ± 26.7 | 30.4 ± 40.1 | 42.9 ± 77.5 * | 22.1 ± 34.4 | 40.2 ± 74.7 | 21.5 ± 34.5 | 40.6 ± 74.6 | 20.0 ± 32.4 | 39.0 ± 71.1 | 23.7 ± 37 | 37.9 ± 70.6 |
| Prealbumin (mg/dL) | 24.1 ± 8.9 | 18.6 ± 8.4 | 14.9 ± 7.5 * | 21.4 ± 9.8 | 15.9 ± 7.9 * | 21.6 ± 9.7 | 15.8 ± 7.9 * | 21.6 ± 8 | 16.1 ± 8.2 * | 21.3 ± 9.9 | 16.2 ± 8 * |
| Lymphocytes (× 109) | 1.138 ± 0.654 | 1.030 ± 0.758 | 1.095 ± 0.695 | 1.099 ± 0.703 | 1.087 ± 0.709 | 1.117 ± 0.712 | 1.080 ± 0.705 | 1.091 ± 0.729 | 1.093 ± 0.707 | 1.107 ± 0.647 | 1.085 ± 0.72 |
| Length of stay (days) | 8.2 ± 9.8 | 8.1 ± 8.4 | 12.1 ± 8.1 * | 8.6 ± 9.4 | 11.1 ± 7.9 * | 8.5 ± 9.3 | 11.2 ± 7.9 * | 7.7 ± 9.1 | 11.1 ± 8.1 * | 8.4 ± 10 | 11.0 ± 7.7 * |
| n (%) | |||||||||||
| In-hospital death | 0 (0%) | 3 (4.2%) | 26 (16.6%) * | 3 (4.2%) | 22 (11.8%) | 3 (3.9%) | 22 (11.2%) | 1 (1.9%) | 25 (11.6%) * | 2 (3.2%) | 25 (11.6%) * |
| 6-month death | 16 (30.8%) | 30 (42.2%) | 88 (56.1%) * | 27 (37.5%) | 95 (50.8%) | 29 (37.7%) | 97 (49.2%) | 16 (29.6%) | 112 (51.9%) * | 22 (35.5%) | 111 (51.6%) * |
| New admission (6-month) | 15 (28.8%) | 35 (49.3%) | 64 (40.8%) | 26 (36.1%) | 80 (42.8%) | 28 (36.4%) | 85 (46.1%) | 17 (31.5%) | 91 (42.1%) | 23 (37.1%) | 90 (41.9%) |
| Crude | Adjusted | |||||||
|---|---|---|---|---|---|---|---|---|
| Odds Ratio | 95% CI | p-Value | Odds Ratio | 95% CI | p-Value | |||
| Lower | Upper | Lower | Upper | |||||
| Subjective global assessment | ||||||||
| normally nourished vs. moderate malnutrition | 1.65 | 0.78 | 3.5 | 0.328 | 1.48 | 0.67 | 3.26 | 0.24 |
| Normally nourished vs. severe malnutrition | 2.87 | 1.47 | 5.6 | 0.002 | 2.73 | 1.35 | 5.52 | 0.002 |
| Normally nourished vs. malnutrition (2 groups) | 2.41 | 1.27 | 4.6 | 0.007 | 2.23 | 1.14 | 4.38 | 0.009 |
| Malnutrition according GLIM using mid-arm circumference (p5) | 1.72 | 0.99 | 3.01 | 0.056 | 1.73 | 0.96 | 3.13 | 0.068 |
| Malnutrition according GLIM using arm muscle circumference (p5) | 1.61 | 0.937 | 2.75 | 0.085 | 1.73 | 0.97 | 3.1 | 0.064 |
| Malnutrition according GLIM using FFMI | 1.94 | 1.08 | 3.48 | 0.026 | 1.87 | 1.01 | 3.48 | 0.047 |
| Malnutrition according GLIM using hand grip strength (p5) | 2.56 | 1.35 | 4.86 | 0.004 | 2.72 | 1.37 | 5.4 | 0.004 |
© 2019 by the authors. Licensee MDPI, Basel, Switzerland. This article is an open access article distributed under the terms and conditions of the Creative Commons Attribution (CC BY) license (http://creativecommons.org/licenses/by/4.0/).
Share and Cite
Contreras-Bolívar, V.; Sánchez-Torralvo, F.J.; Ruiz-Vico, M.; González-Almendros, I.; Barrios, M.; Padín, S.; Alba, E.; Olveira, G. GLIM Criteria Using Hand Grip Strength Adequately Predict Six-Month Mortality in Cancer Inpatients. Nutrients 2019, 11, 2043. https://doi.org/10.3390/nu11092043
Contreras-Bolívar V, Sánchez-Torralvo FJ, Ruiz-Vico M, González-Almendros I, Barrios M, Padín S, Alba E, Olveira G. GLIM Criteria Using Hand Grip Strength Adequately Predict Six-Month Mortality in Cancer Inpatients. Nutrients. 2019; 11(9):2043. https://doi.org/10.3390/nu11092043
Chicago/Turabian StyleContreras-Bolívar, Victoria, Francisco José Sánchez-Torralvo, María Ruiz-Vico, Inmaculada González-Almendros, Manuel Barrios, Susana Padín, Emilio Alba, and Gabriel Olveira. 2019. "GLIM Criteria Using Hand Grip Strength Adequately Predict Six-Month Mortality in Cancer Inpatients" Nutrients 11, no. 9: 2043. https://doi.org/10.3390/nu11092043