Article

Effect of Docosahexaenoic Acid on Ca2+ Signaling Pathways in Cerulein-Treated Pancreatic Acinar Cells, Determined by RNA-Sequencing Analysis

Department of Food and Nutrition, Brain Korea 21 PLUS Project, College of Human Ecology, Yonsei University, Seoul 03722, Korea
*
Author to whom correspondence should be addressed.
These authors contributed equally to this work.
Nutrients 2019, 11(7), 1445; https://doi.org/10.3390/nu11071445
Submission received: 30 April 2019 / Revised: 6 June 2019 / Accepted: 24 June 2019 / Published: 26 June 2019

Abstract

:
Intracellular Ca2+ homeostasis is commonly disrupted in acute pancreatitis. Sustained Ca2+ release from internal stores in pancreatic acinar cells (PACs), mediated by inositol triphosphate receptor (IP3R) and the ryanodine receptor (RyR), plays a key role in the initiation and propagation of acute pancreatitis. Pancreatitis induced by cerulein, an analogue of cholecystokinin, causes premature activation of digestive enzymes and enhanced accumulation of cytokines and Ca2+ in the pancreas and, as such, it is a good model of acute pancreatitis. High concentrations of the omega-3 fatty acid docosahexaenoic acid (DHA) inhibit inflammatory signaling pathways and cytokine expression in PACs treated with cerulein. In the present study, we determined the effect of DHA on key regulators of Ca2+ signaling in cerulein-treated pancreatic acinar AR42 J cells. The results of RNA-Sequencing (RNA-Seq) analysis showed that cerulein up-regulates the expression of IP3R1 and RyR2 genes, and that pretreatment with DHA blocks these effects. The results of real-time PCR confirmed that DHA inhibits cerulein-induced IP3R1 and RyR2 gene expression, and demonstrated that DHA pre-treatment decreases the expression of the Relb gene, which encodes a component of the nuclear factor kappa-light-chain-enhancer of activated B cells (NF-κB) transcriptional activator complex, and the c-fos gene, which encodes a component of activator protein-1 (AP-1) transcriptional activator complex. Taken together, DHA inhibits mRNA expression of IP3R1, RyR2, Relb, and c-fos, which is related to Ca2+ network in cerulein-stimulated PACs.

1. Introduction

Acute pancreatitis is an inflammatory disease that results in organ dysfunction. This disease is caused by abnormal activation and release of digestive enzymes and it is characterized by increased cytokine release and oxidative stress [1]. Elevated levels of inflammatory cytokines and free radical products are commonly observed in animal models of acute pancreatitis as well as in individuals inflicted by the disease [2,3]. It has been previously proposed that the excessive rise in the intracellular Ca2+ concentration ([Ca2+]i) observed in pancreatic acinar cells (PACs), the functional units of the exocrine pancreas, triggers the onset of acute pancreatitis [4]. The disruption of calcium signaling in PACs that occurs during acute pancreatitis is well characterized [5,6].
The gastrointestinal peptide cholecystokinin (CCK) causes the release of pancreatic digestive enzymes and the growth of the normal pancreas. However, an abnormally high level of plasma CCK has been reported to occur in patients with chronic pancreatitis [7] and acute pancreatitis [8]. When cholecystokinin (CCK) binds to the CCK receptor, which is a G protein-coupled receptor, heterotrimeric G proteins are activated. Consequently, phospholipase C is activated to generate inositol triphosphate (IP3) and diacylglycerol (DAG), which in turn mediate release of Ca2+ from intracellular stores and activation of protein kinase C (PKC) [9]. Ca2+ oscillation, generated by the IP3-IP3 receptor (IP3R) and the Ca2+-dependent activation of PKC, activates Ca2+-relevant signals in PACs [10].
Calcium homeostasis in PACs is achieved through coordination of Ca2+ release from internal stores, Ca2+ entry, and Ca2+ extrusion. IP3R and the ryanodine receptor (RyR) are the major calcium release channels, whereas the transient receptor potential 3 (TRPC3) channel and the stromal interaction molecules (STIM)1-Orai1 complex are calcium release-activated calcium channels (CRAC channels) responsible for Ca2+ entry into cells. The Ca2+-ATPase pump is responsible for calcium clearance [11].
Several studies have highlighted the importance of IP3R and RyR-mediated Ca2+ release in the pathophysiology of acute pancreatitis [12,13,14]. IP3Rs and RyRs are sensitive to ROS because they possess reactive cysteine residues that are prone to oxidation. Oxidation of cysteine thiol groups on IP3s and RyRs stimulates the activity of Ca2+ release channels, thereby inducing Ca2+ release from internal stores [15]. Prolonged Ca2+ release promotes a sustained elevation of [Ca2+]i through activation of CRAC channels, a process known as store-operated Ca2+ entry. Sustained global elevation of [Ca2+]i eventually results in zymogen activation, inflammatory injury, and acinar cell death [14,16].
The pancreatic acinar cell is a highly specialized structure developed for synthesis, storage, and secretion of digestive enzymes. The acinar cell is tightly polarized. Its apical pole is densely packed with zymogen granules that secrete digestive enzymes by exocytosis [17]. Since IP3R is located in the apical region of the acinar cells, the IP3-IP3R-induced Ca2+ oscillation mediates the start of the Ca2+ wave at the apical trigger zone [18]. RyR is diffusely distributed in the basolateral region and is responsible for the early zymogen activation that occurs in the basal compartment [19]. RyR, first identified in the sarcoplasmic reticulum (SR), provokes calcium-induced calcium release, thereby propagating the Ca2+ wave [20]. Thus, the general Ca2+ signal starts at the trigger zone via IP3R-mediated Ca2+ release, and the basolateral activation of RyR, which propagates the Ca2+ wave through the Ca2+-induced Ca2+ release mechanism [21].
Cerulein, a CCK analog, induces pancreatitis, which is widely used as an experimental model of acute pancreatitis. Cerulein, at supramaximal doses, induces dysregulation of digestive enzymes, death of acinar cells, and infiltration of inflammatory cells into the rat pancreas [22]. It has been shown that intracellular Ca2+ oscillation mediates activation of inflammatory transcription factors and cytokine production [23]. Rapid mobilization of Ca2+ from the internal stores is a prominent feature of the inflammatory response associated with several diseases [24]. Studies with experimental models of inflammatory pathology showed that blocking Ca2+ signaling significantly attenuates activation of nuclear factor kappa-light-chain-enhancer of activated B cells (NF-κB) and mitogen-activated protein kinase (MAPK) signaling, as well as pro-inflammatory cytokine production [25,26]. One such study showed that ultrafine particles induce NF-κB and activator protein-1 (AP-1) activation, as well as cytokine expression in macrophages, by modulating intracellular calcium [27]. Thus, intracellular Ca2+ oscillation may mediate activation of inflammatory transcription factors and cytokine production in cerulein-stimulated PACs.
Previous investigations revealed that docosahexaenoic acid (DHA) exhibits anti-oxidative and anti-inflammatory properties in various disease models [28]. We have reported that DHA activated peroxisome proliferator-activated receptor γ (PPARγ) and induced catalase to reduce ROS-mediated expression of cytokines in PACs [29]. Cerulein activated the reduced nicotinamide adenine dinucleotide phosphate (NADPH) oxidase and produced cellular ROS, which was suppressed by DHA treatment in PACs [30,31]. Because high levels of CCK lead to high concentrations of intracellular Ca2+, DHA inhibition of ROS production might be mediated through its impact on intracellular Ca2+.
DHA has also been shown to be effective in alleviating inflammation, as it suppresses inflammatory signaling mediators and reduces cytokine production. DHA inhibits expression of genes encoding NF-κB and its downstream signaling partners cyclooxygenase-2 (COX-2), interleukin (IL)-6, and IL-1β [32,33]. In cerulein-induced acute pancreatitis, DHA suppresses IL-1β and IL-6 gene expression by inhibiting AP-1 activation [34].
Therefore, we hypothesize that DHA inhibits Ca2+ signaling and its related signaling pathways in cerulein-stimulated rat pancreatic acinar AR42J cells. To identify the regulators involved in cerulein-mediated changes in Ca2+ signaling, and to examine the effect of DHA treatment on cerulein-induced alterations in Ca2+ signaling and related pathways, we carried out RNA-Sequencing (RNA-Seq) analysis on the AR42J cells.

2. Materials and Methods

2.1. Cell Line and Treatments

Rat pancreatic acinar AR42J cells (CRL 1492) were obtained from the American Type Culture Collection (Manassas, VA, USA) and cultured in Dulbecco’s modified Eagle’s medium (Sigma, St. Louis, MO, USA) supplemented with 10% FBS (Gibco-BRL, Grand Island, NY, USA), 100 U/mL penicillin, and 100 μg/mL streptomycin.
DHA was dissolved in ethanol (0.5 M solution) (Sigma, St. Louis, MO, USA) and cerulein was dissolved in PBS containing 0.1% BSA (10−4 M) [29]. AR42J cells (1 × 10⁵/mL) were treated with a vehicle 0.5 M ethanol (designated as ‘none’) or DHA (50 μM) dissolved in 0.5 M ethanol (designated as ‘DHA’) for 6 h. For cerulein treatment, the cells were pretreated with 0.5 M ethanol (designated as ‘cerulein’) or DHA (50 μM) dissolved in 0.5 M ethanol for 2 h and then stimulated with cerulein (10⁸ M) (designated as ‘cerulein + DHA’) for 4 h. The indicated dose and incubation time of DHA were chosen based on our previous study reporting anti-oxidative and anti-inflammatory effects of DHA on cerulein-stimulated AR42J cells [29]. Further, 50 μM of DHA alone used in the present study had no effect on cell response such as cytokine expression and inflammatory signaling in AR42J cells [29] and cell viability in pancreatic cancer PANC-1 cells for 24 h culture [35].

2.2. Preparation of Total RNA Extracts and Library Construction

Total RNA was extracted from cells harvested from culture dishes using TRI reagent (Molecular Research Center, Cincinnati, OH, USA) and then purified using the RNeasy MinElute Cleanup Kit (Quiagen, Valencia, CA, USA) according to the manufacturer’s instructions. The quality of the total isolated RNA was determined by measuring the concentration of total RNA in the extracts from three replicates, using NanoQuant Infinite M200 instrument (Tecan, Männedorf, Switzerland). The total RNA from each sample was pooled for RNA-Seq library construction using TruSeq RNA Sample Prep Kit (Illumina, San Diego, CA, USA). Briefly, cDNA libraries were prepared by purification from 1 μg total RNA, random fragmentation, and reverse transcription.

2.3. RNA-Sequencing and Bioinformatics Analysis

The total RNA library was subjected to transcriptome sequencing. The sequencing was carried out with Macrogen (www.macrogen.co.kr; Seoul, Korea). CLRNASeqTM software (Chunlab, www.chunlab.com; Seoul, Korea) was used for the initial data processing. Raw RNA-Seq reads were trimmed with a quality cutoff of Q30 and the gene expressions were quantified using Cufflinks (https://omictools.com/cufflinks-tool). The RNA-Seq data were normalized by using the relative log expression (RLE) value.
Changes in gene expression of the cells with neither DHA treatment nor cerulein stimulation (treated with 0.5 M ethanol vehicle only) (none), those treated with cerulein, those with DHA treatment alone, and those pretreated with DHA and treated with cerulein (cerulein + DHA) were compared. Differential gene expression analysis was performed using the RNA-Seq analysis module of the CLRNASeq software, with a cutoff set at gene expression of >100 and p-value of <0.05. Transcripts with fold change of >1.5 were included as differentially expressed genes (DEGs). After identifying the DEGs, gene ontology (GO) analysis was performed using the DAVID bioinformatics program (https://david.ncifcrf.gov) for gene identification and annotation. The annotation results were categorized under biological process, molecular function, and cellular function. To identify the functional groups and molecular pathways associated with the observed DEGs, the RNA-Seq data were further analyzed using the Kyoto Encyclopedia of Genes and Genomes (KEGG) database (www.genome.jp).

2.4. Validation of RNA-Seq Profiles by Real-time Polymerase Chain Reaction (PCR)

Real-time PCR was performed to validate the results generated by the RNA-Seq analysis. Candidate genes were selected in relation to the functional pathway of interest. Total RNA was isolated by using TRI reagent (Molecular Research Center, Inc., Cincinnati, OH, USA). The total RNA was converted to cDNA by treatment with a random hexamer and MuLV reverse transcriptase (Promega, Madison, WI, USA) at 23 °C for 10 min, 37 °C for 60 min, and 95 °C for 5 min. The cDNA was used for real-time PCR with primers specific for rat. The sequences of the primers used are 5’- GAATCAGTGAGTTACTGGGCATGG -3’ (forward) and 5’- CTGGTCTCTGAGTTCTCCAAAAGC-3’(reverse) for RyR2, 5’-TCCCTGGTCAGCAGTGACTC-3’(forward) and 5’-CTCATTTGCTTAGGCTGGCT-3’(reverse) for IP3R1, 5’-AGCGAAAGCGGGGACTGC-3’(forward) and 5’-GATGGTGGGAGGAACAGG-3’(reverse) for Relb, and 5’-GTAGAGCAGCTATCTCCTGA-3’ (forward) 5’-AACGCAGACTTCTCGTCTTC-3’(reverse) for c-fos, and 5’-ACCAACTGGGACGATATGGAG-3’(forward) and 5’-GTCAGGATCTTCATGAGGTAGTC-3’(reverse) for β-actin. For PCR amplification, the cDNA was amplified by 35 repeat cycles with denaturation at 95 °C for 30 s, annealing at 51 °C–55 °C for 30 s, and extension at 72 °C for 30 s. During the first cycle, the 95 °C step was extended to 3 min. The β-actin gene was amplified in the same reaction to serve as the reference gene.

2.5. Statistical Analysis

Statistical analysis was performed using the edgeR test and the one-way ANOVA technique. The results were expressed as the mean ± S.E. of three independent experiments. A p-value of 0.05 or less was considered statistically significant.

3. Results

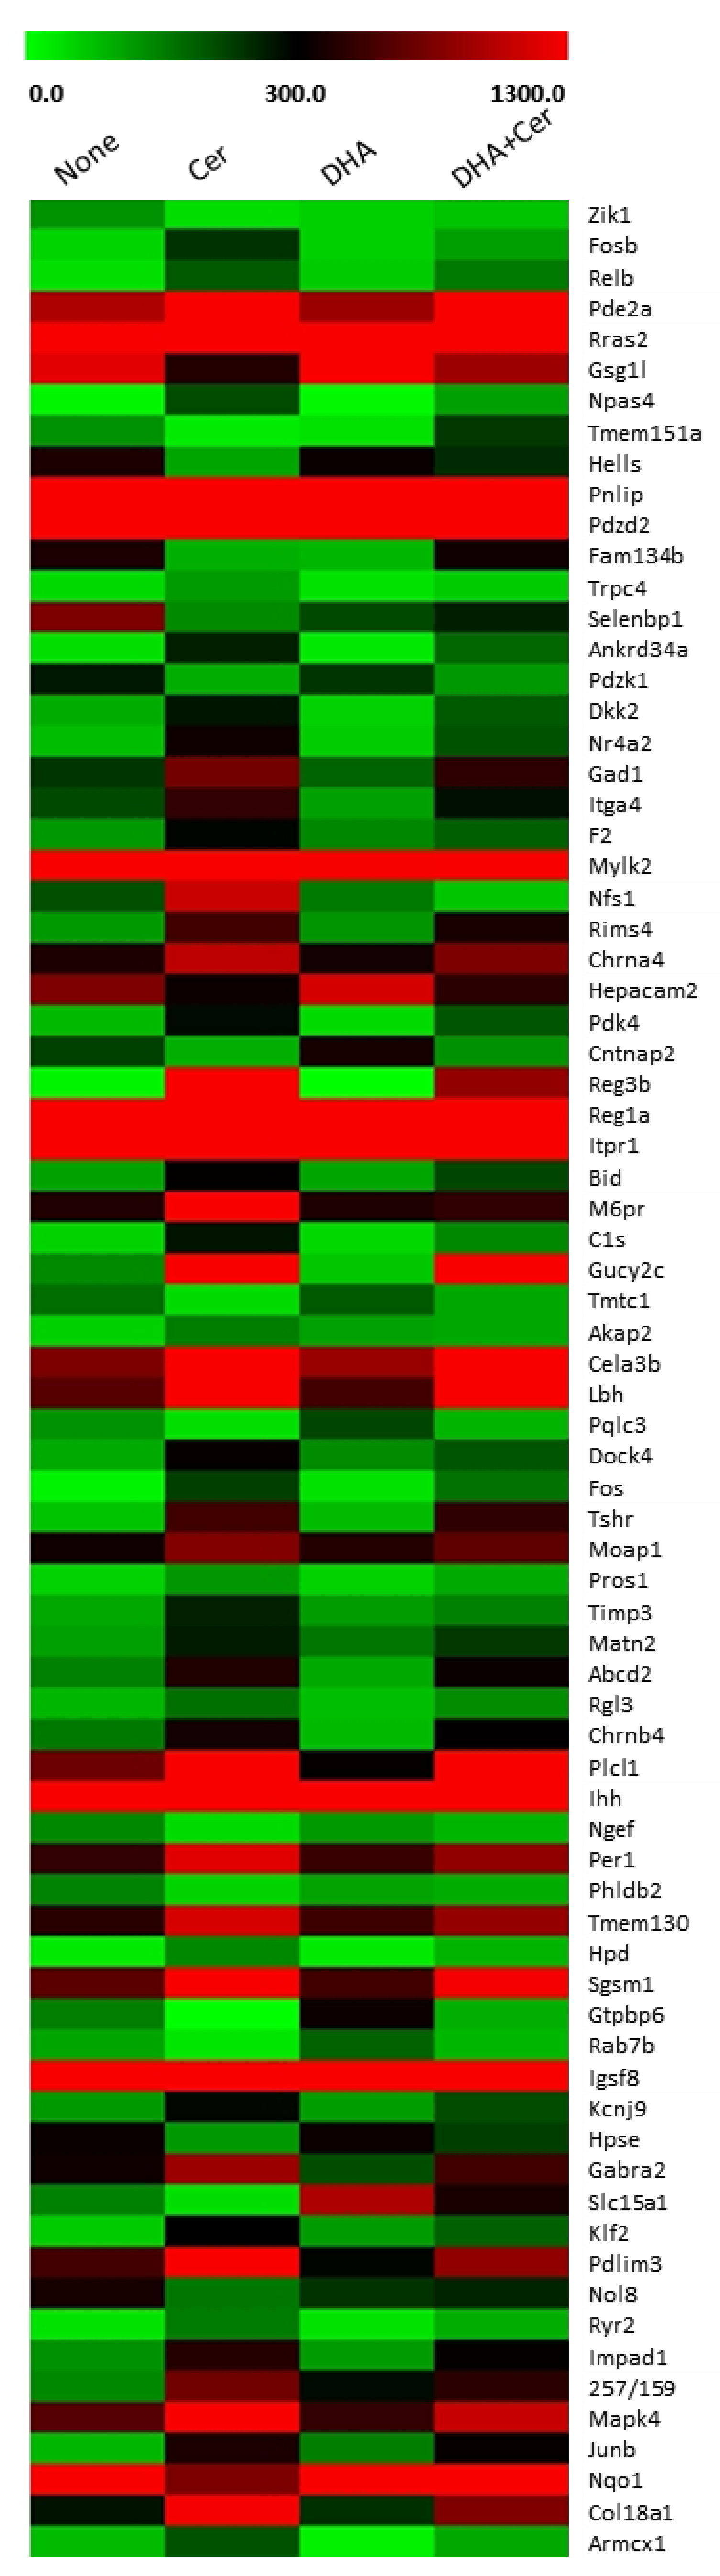
3.1. DHA Inhibits Cerulein-Induced Changes in the Transcriptomic Profile of AR42J Cells

In order to identify substances modulated by cerulein and to examine the effect of DHA on cerulein-induced transcriptomic alterations, RNA-Seq analysis was performed. RNA-Seq analysis identified 339 genes with differential expression between non-stimulated and cerulein-stimulated cells, 181 genes differentially expressed between vehicle-treated and DHA-treated cells, and 116 differentially expressed genes between cerulein-stimulated cells and DHA-treated and cerulein-stimulated cells. Among these genes, 76 genes showed significant differential expression between non-stimulated, cerulein-stimulated, and DHA-treated and cerulein-stimulated cells, with gene expression levels of >100, fold changes of >1.5, and p values of <0.05. The heatmap of the filtered DEGs is shown in Figure 1. Out of the significant DEGs, four genes showed differential expression following DHA treatment compared to non-treated cells: Pqlc3 known as a protein coding gene, Gtpbp6 whose function is not yet known, Slc15a1 required for transport of peptides across membranes, and an antioxidant enzyme gene NQO1.
Genes whose expressions were significantly increased by cerulein were chosen for further computational analysis. The list of DEGs that were up-regulated 1.5-fold or more by treatment with cerulein, and down-regulated 1.5-fold or more by pretreatment with DHA followed by treatment with cerulein is given in Table 1. DHA alone without cerulein stimulation had no significant effect on the expression of the listed genes shown in Table 1.

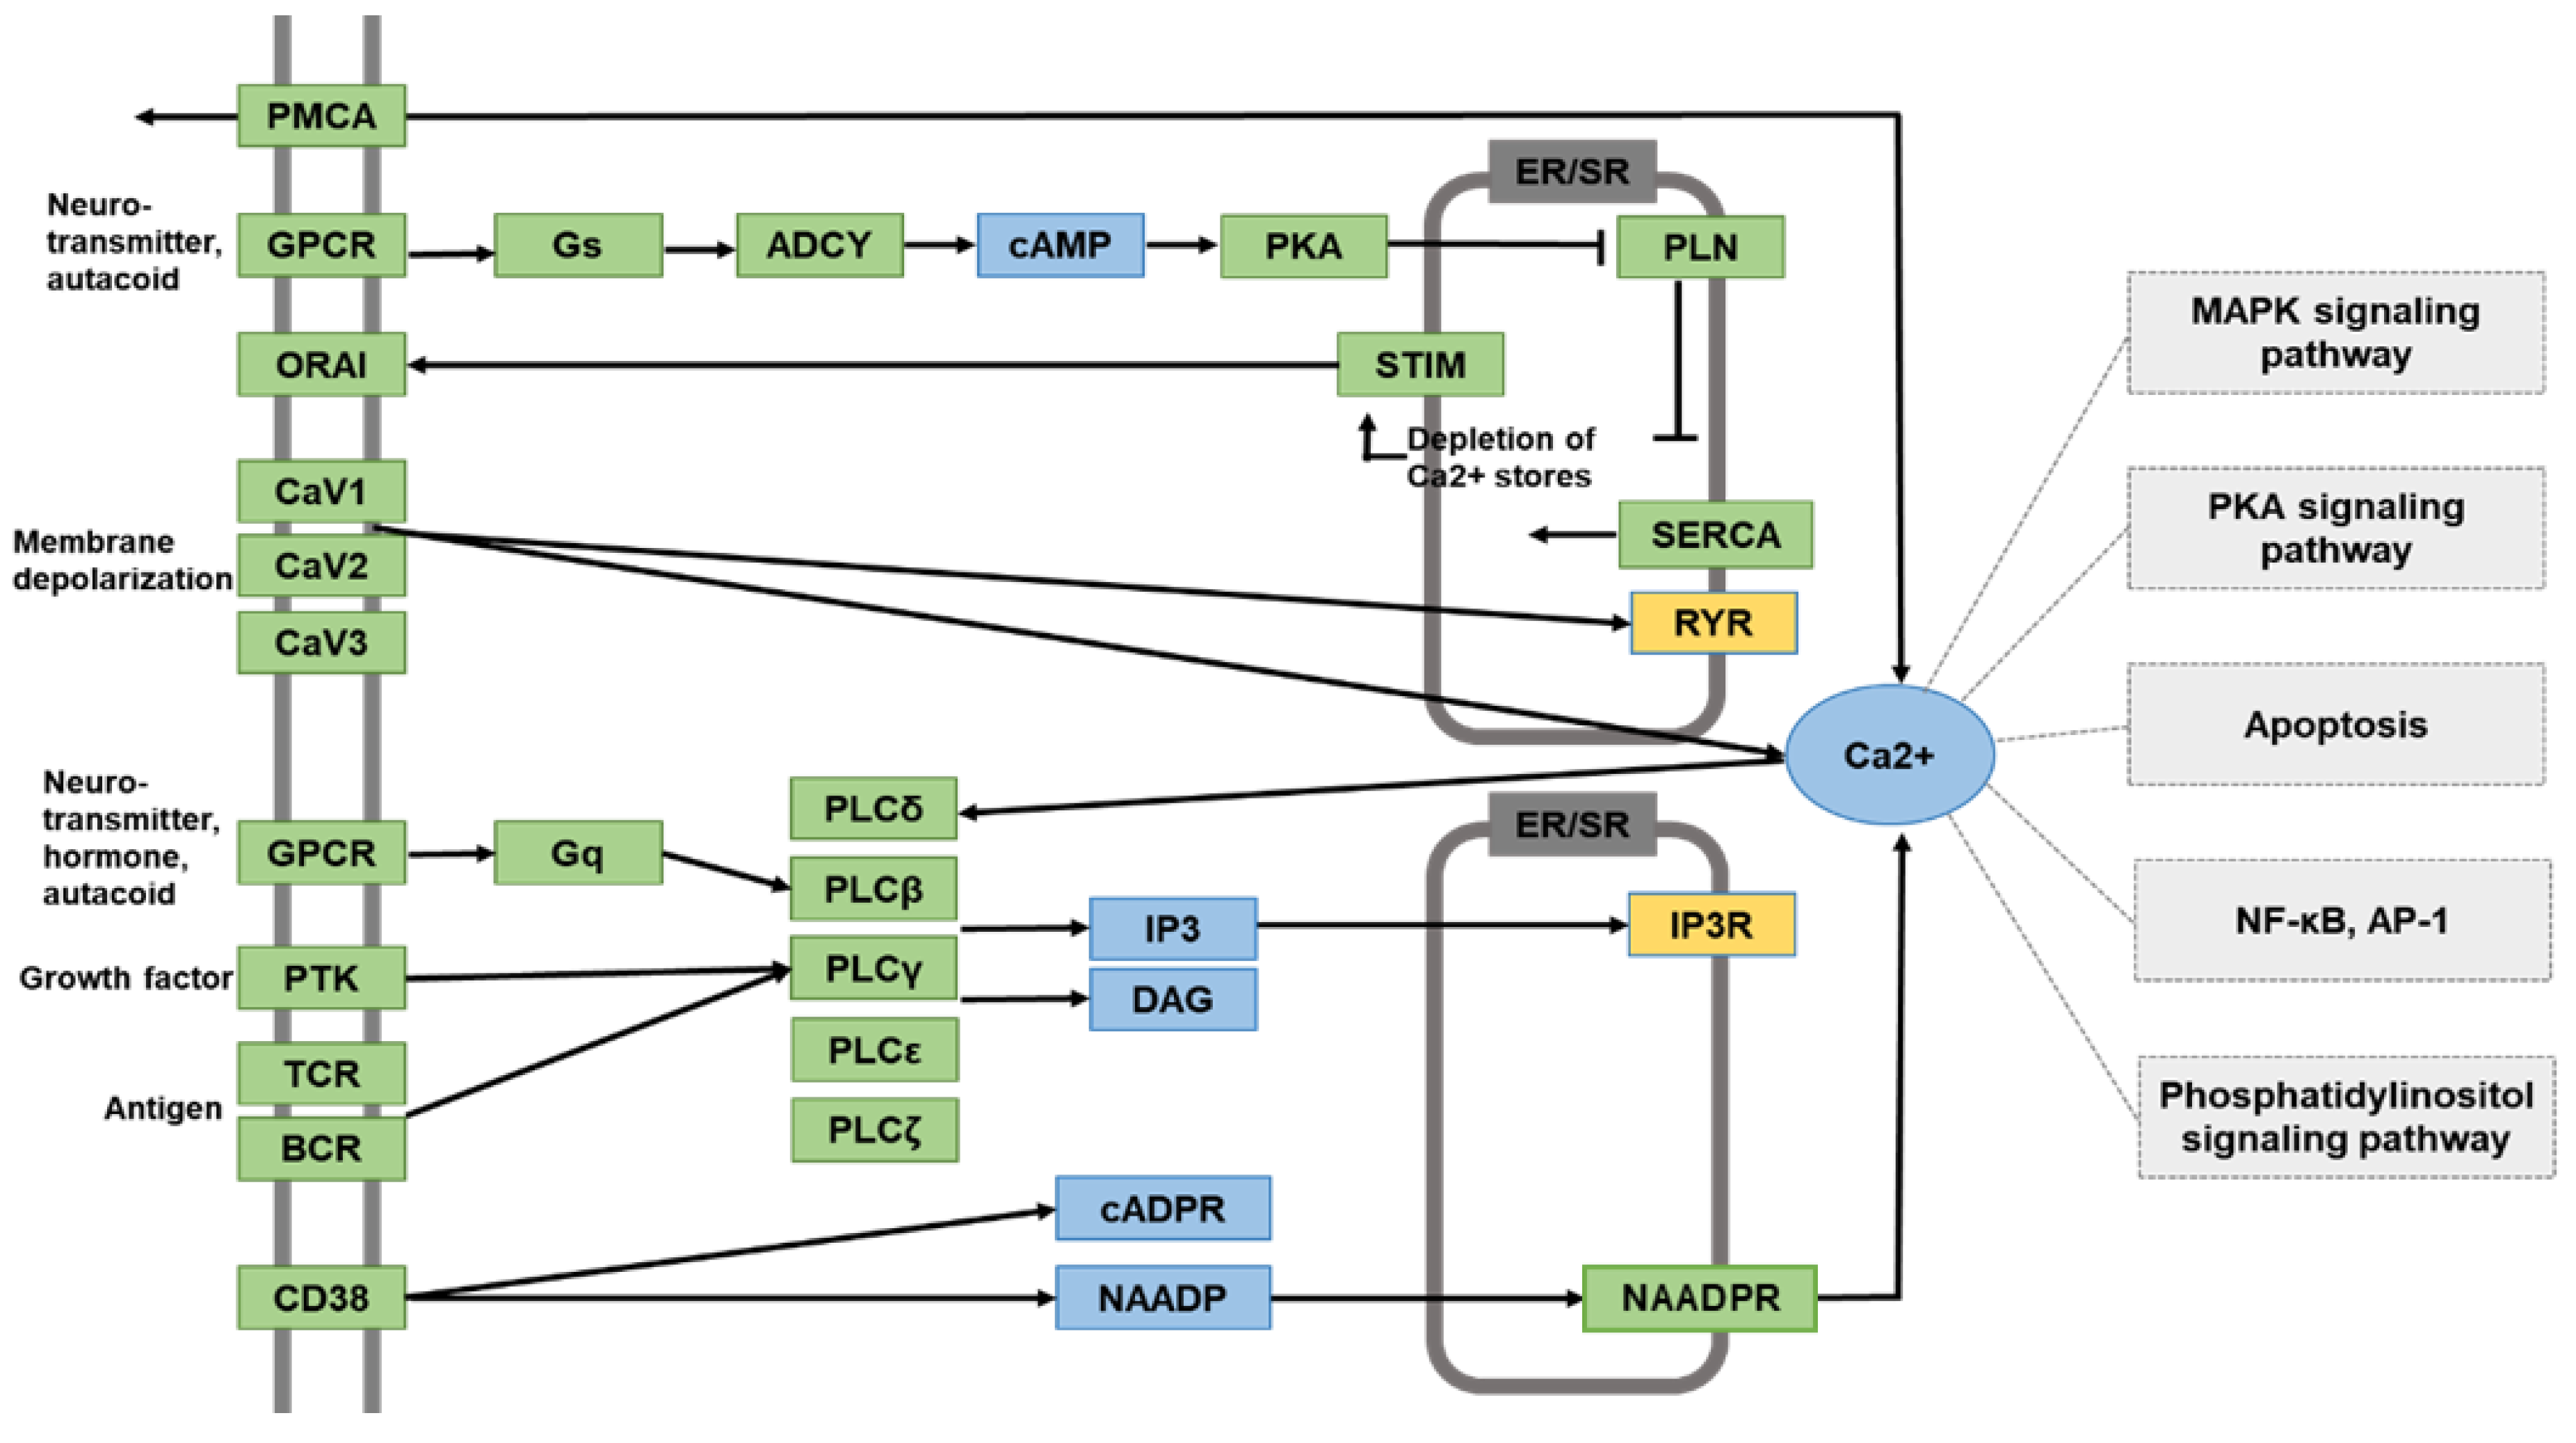
3.2. DHA Suppresses Cerulein-Induced Alteration in the Calcium Signaling Pathway, Determined by Functional Annotation and Pathway Analysis of DEGs

The DEGs listed in Table 1 were used as inputs to perform GO term analysis within the DAVID bioinformatics tool suite. The annotation results were categorized under biological process, molecular function, and cellular function. Gene annotation analysis revealed that the DEGs in the cells treated with cerulein are mostly annotated ‘biological process’ among the three GO categories. The common GO terms were metabolic pathways, oxytocin signaling pathway, pancreatic secretion, regulation of actin cytoskeleton, MAPK signaling pathway, cAMP signaling pathway, calcium signaling pathway, and apoptosis. The functions of the impacted pathways and the names of the key pathway genes are listed in Table 2.
Next, KEGG pathway analysis was performed to identify the physiological pathways in AR42J cells treated with cerulein. DEGs listed in Table 1, whose expression level was increased by cerulein but decreased by DHA, were assessed. Among these, we focused on Ca2+ signaling pathway. The expression of the respective genes encoding the calcium signaling mediators RyR2 and IP3R1 gene expression was notably up-regulated in cells treated with cerulein, but down-regulated in cells pre-treated with DHA prior to exposure to cerulein. KEGG pathway analysis revealed that the effect of DHA on cerulein-stimulated PACs may involve alteration of several signaling pathways that are downstream of calcium release from the ER, such as the MAPK pathway, protein kinase A (PKA) pathway, nuclear factor kappa-light-chain-enhancer of activated B cells (NF-κB) pathway, and AP-1 pathway (Figure 2). Mylk2 is involved in Ca2+ signaling pathway according to the KEGG Mapper, but it has its main role in vascular contraction that is different from pancreatic acinar cell function. Thus, some genes including Myk2, whose functions are unrelated to pancreatic function, were not included in Figure 2.

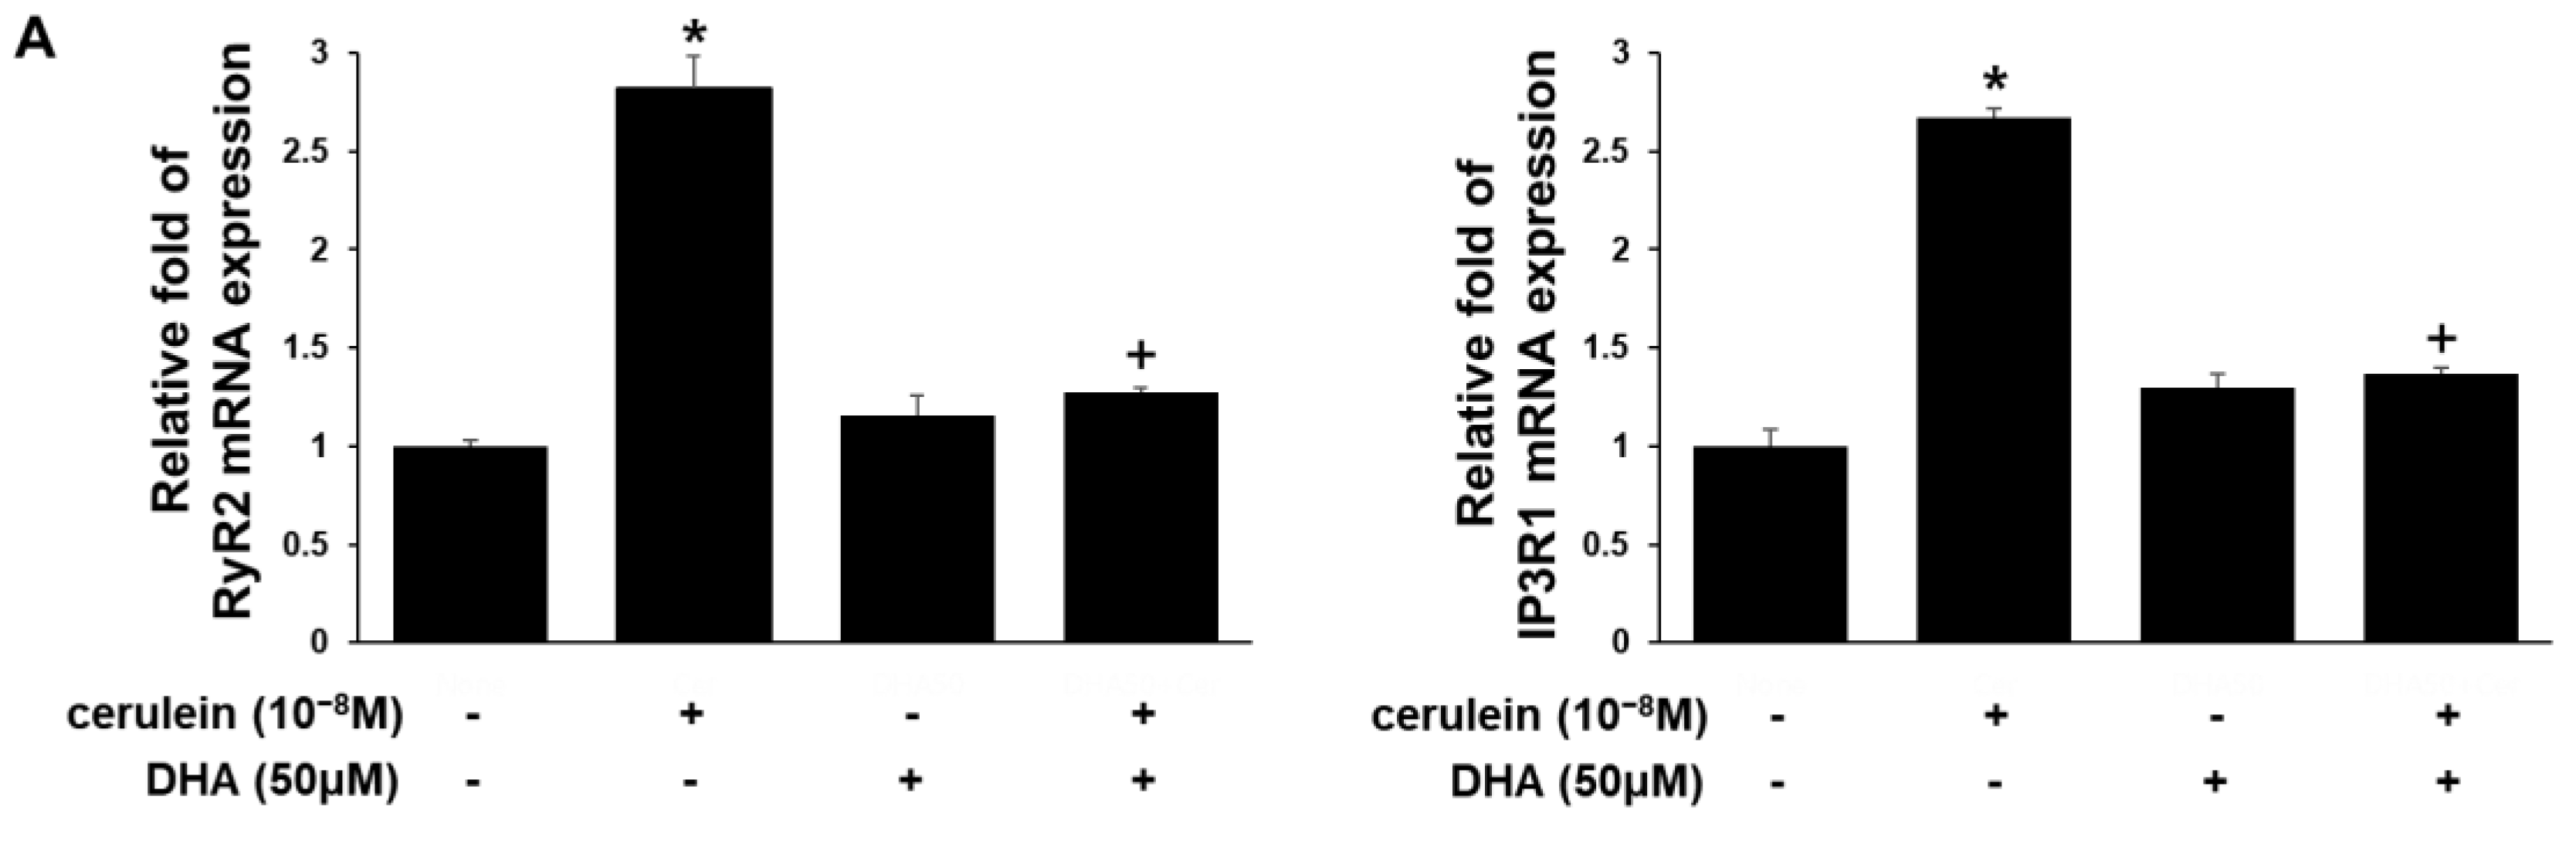
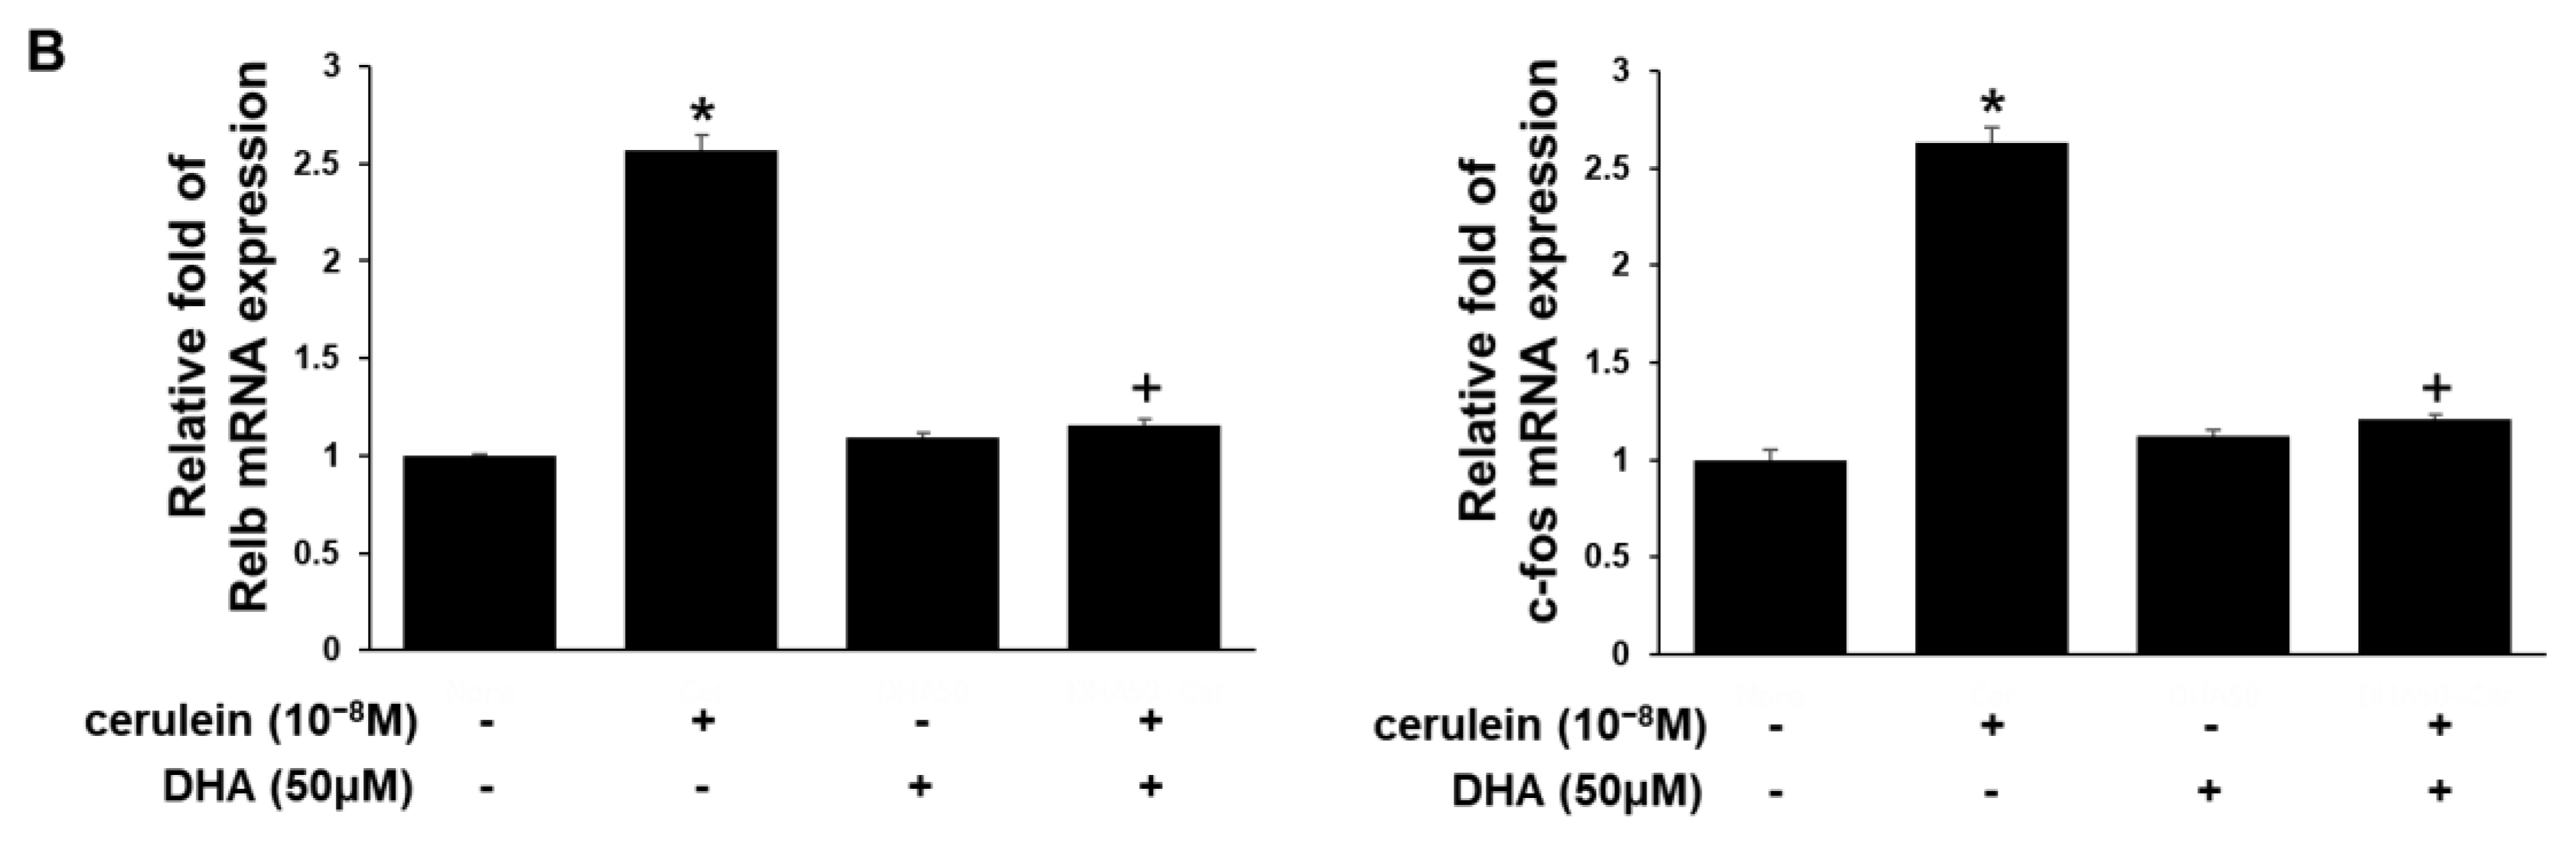
3.3. DHA Inhibits Expression of RyR2, IP3RI, Relb, and c-fos Genes in Cerulein-Treated AR42J Cells, Determined by Real-Time PCR

In order to validate the inhibitory effect of DHA on the cerulein-induced alterations identified by RNA-Seq analysis, several candidate genes were selected from those assigned to the calcium signaling pathway and subjected to real-time PCR confirmation. The results are in agreement with the RNA-Seq results. Cerulein induced expression of the genes RyR2 and IP3R1 by up to 3-fold, which was suppressed by pretreatment of DHA (Figure 3A). Cerulein increased expression of the Relb gene, a member of the NF-κB gene family, and c-fos gene, which encodes a component of the AP-1 complex (Figure 3B). DHA inhibited cerulein-induced expression of the Relb and c-fos genes (Figure 3B). DHA treatment alone did not affect mRNA expression of RyR2, IP3R1, RelB, and c-fos in PACs (Figure 3).

4. Discussion

Acute pancreatitis occurs upon autodigestion of the pancreas by digestive enzymes and the induction of the inflammatory response. Disturbances in calcium homeostasis is fundamental to the pathophysiology of acute pancreatitis [36,37]. Calcium homeostasis mediators IP3Rs and RyRs have long been implicated in acute pancreatitis. Inhibitors of IP3Rs and RyRs have proven to be effective in reducing zymogen activation, acinar cell death, and proinflammatory cytokine generation in experimental acute pancreatitis [38,39]. IP3Rs and RyRs trigger the initial release of Ca2+ from internal stores such as the ER, and supraphysiological stimulation results in a persistent increase in Ca2+ release. This leads to depletion of the internal Ca2+ stores, which in turn activates the CRAC channels.
Compared to other types, PACs are relatively ineffective in maintaining low intracellular Ca2+ extrusion and are especially mal-equipped for [Ca2+]i clearance [36,40]. In the absence of voltage-gated Ca2+ channels, calcium signaling primarily depends on internal Ca2+ stores [41]. Therefore, PACs are particularly vulnerable to the elevation in intracellular Ca2+ spikes.
In the present study, RNA-Seq analysis of cerulein-treated AR42J cells suggests that cerulein may increase the level of intracellular calcium by up-regulating genes encoding the calcium release-mediating channels, IP3R1 and RYR2. Pretreatment of cells with DHA decreases the expression of the IP3R1 and RYR2 genes up-regulated by cerulein. Therefore, DHA may normalize the cerulein-induced abnormal Ca2+ wave in AR42J cells. Functional analysis of molecular pathways suggests that cerulein, via transcriptional regulation of Ca2+ release channels, may modulate signaling regulators related to the MAPK, NF-κB, and AP-1 pathways, which may be suppressed by DHA in PACs.
Experimental validation using real time-PCR confirmed the effect of DHA in reducing cerulein-induced increased expression of the IP3R1 and RYR2 genes. The results obtained from real time-PCR analysis also demonstrate that cerulein increases expression of genes encoding the transcription factors NF-κB and AP-1, and that DHA reduces cerulein-induced expression of the Relb gene, which encodes a component of the NF-κB complex, and the c-fos gene, which encodes a component of the AP-1 complex.
Several studies have suggested that a link exists between the prolonged increase in [Ca2+]i and up-regulation of the genes encoding NF-κB and AP-1. Elevated [Ca2+]i and Ca2+-dependent activation of PKC may stimulate activation of AP-1 and NF-κB. The causal association of NF-κB activation and Ca2+ signaling is well known [42]. Stimulation with high-dose cerulein activates NF-κB in the pancreatic acini via increased [Ca2+]i and activation of PKC [43]. Calcium blockers and chelators abrogate cerulein-induced NF-κB activation and IκB degradation in PACs [44].
Abnormal Ca2+ signaling is also indicated to be relevant to AP-1 activation [45]. Carbachol, a secretagogue similar to CCK, increases expression of the genes c-fos and c-jun, which encode AP-1. The increased expression is mediated by changes in [Ca2+]i, calmodulin, PKC, and MAPK [46]. Ramnath et al. [47] demonstrated that the rise in [Ca2+]i and Ca2+-dependent activation of PKC mediates AP-1 activation and subsequent chemokine production in substance P-induced experimental acute pancreatitis. Chelating cytosolic calcium, inhibition of PLC, and inhibition of Ca2+-dependent PKC each block substance P-induced [Ca2+]i elevation, activation of AP-1, and chemokine production in PACs.
DHA has been suggested to positively modulate Ca2+ signaling in the ER [48]. Begum et al. [49] revealed that DHA inhibits excess Ca2+ release from the ER and further represses store-operated Ca2+ overload in astrocytes, specifically by blocking IP3R. In cardiac myocytes, DHA significantly suppresses the Ca2+ spark from SR, and inhibited RyR activity [50,51].
DHA treatment also appears to be effective in suppressing inflammatory mediators. DHA decreases production of pro-inflammatory cytokines, such as TNF-α, IL-6, and IL-1β, by inhibiting phosphorylation of NF-κB subunit p65 in bovine mammary epithelial [52] and cardiac cells [53]. In ischemic rats, DHA decreases the level of pro-inflammatory cytokines and chemokines, and inhibits phosphorylation of c-jun and AP-1 DNA binding activity [54].
As shown in Table 2, c-fos is involved in cAMP signaling and MAPK signaling, while Relb is relevant to MAPK signaling. c-Fos gene contains a Ca2+/cAMP response element (Ca2+/CRE), and its expression and post-translational modification is, in part, affected by Ca2+ and cAMP level [55]. The elevation of cAMP further enhances expression of c-fos in cardiac myocytes [56] and myeloid leukemia cells [57]. c-Fos also possesses a serum response element (SRE), and MAPK activation induces c-fos expression via SRE [58,59]. Moreover, Relb is a member of the NF-κB family, which demands synergistic activation of MAPK signaling pathways for symptomatic and pathologic inflammatory response [60,61]. Therefore, cerulein-induced increase in c-fos and Relb may be related to activation of cAMP-PKA pathway, MAPK pathway, NF-κB, and AP-1 as shown in Figure 2. Thus, the inhibitory effect of DHA on Ca2+ signaling may also be associated with suppression of PKA, MAPK, NF-κB, and AP-1 pathways. Further studies should be performed to assess the effects of DHA on PKA, MAPK, NF-κB, and AP-1 pathways in cerulein-stimulated PACs.
The main findings of this study are that DHA inhibits mRNA expression of IP3R1, RyR2, Relb, and c-fos, which is related to Ca2+ signaling in cerulein-stimulated PACs. Further studies should be performed exploring whether DHA affects RyR, IP3R, Relb, and c-FOS at post-transcriptional level and their functional roles involving the calcium network to determine the effect of DHA on cerulein-induced acute pancreatitis.

5. Conclusions

DHA inhibits mRNA expression of IP3R1 and RyR2 which are upregulated in cerulein-stimulated PACs. Cerulein increases expression of the Relb gene, a member of the NF-κB gene family, and c-fos gene, a component of the AP-1 complex. DHA inhibits cerulein-induced expression of the Relb and c-fos genes in PACs. Since IP3R1, RyR2, Relb, and c-fos are involved in Ca2+ network, DHA may inhibit Ca2+ signaling by suppressing key regulators in cerulein-treated PACs.

Author Contributions

S.H.K. performed the research and wrote the paper. Y.P. performed the research. J.W.L. contributed analytical tools. H.K. designed the research, analyzed the data, and edited the paper. All authors approved the manuscript in its current form.

Funding

This study was supported partly by a Brain Korea 21 PLUS Project, College of Human Ecology, Yonsei University, Seoul 03722, Republic of Korea.

Conflicts of Interest

The authors declare no conflict of interest.

References

  1. Bhatia, M.; Wong, F.L.; Cao, Y.; Lau, H.Y.; Huang, J.; Puneet, P.; Chevali, L. Pathophysiology of acute pancreatitis. Pancreatology 2005, 5, 132–144. [Google Scholar] [CrossRef] [PubMed]
  2. Frossard, J.L.; Hadengue, A.; Pastor, C.M. New serum markers for the detection of severe acute pancreatitis in humans. Am. J. Respir. Crit. Care Med. 2001, 164, 162–170. [Google Scholar] [CrossRef] [PubMed]
  3. Armstrong, J.A.; Cash, N.; Soares, P.M.; Souza, M.H.; Sutton, R.; Criddle, D.N. Oxidative stress in acute pancreatitis: Lost in translation? Free Radic. Res. 2013, 47, 917–933. [Google Scholar] [CrossRef] [PubMed]
  4. Ward, J.B.; Jenkins, S.A.; Sutton, R.; Petersen, O.H. Is an elevated concentration of acinar cytosolic free ionised calcium the trigger for acute pancreatitis? Lancet 1995, 346, 1016–1019. [Google Scholar] [CrossRef]
  5. Ward, J.B.; Sutton, R.; Jenkins, S.A.; Petersen, O.H. Progressive disruption of acinar cell calcium signaling is an early feature of cerulein-induced pancreatitis in mice. Gastroenterology 1996, 111, 481–491. [Google Scholar] [CrossRef] [PubMed]
  6. Kruger, B.; Albrecht, E.; Lerch, M.M. The role of intracellular calcium signaling in premature protease activation and the onset of pancreatitis. Am. J. Pathol. 2000, 157, 43–50. [Google Scholar] [CrossRef]
  7. Ederle, A.; Vantini, I.; Harvey, R.F.; Cavallini, G.; Piubello, W.; Benini, L.; Scuro, L.A. Fasting serum cholecystokinin immunoreactivity in chronic relapsing pancreatitis. Ric. Clin. Lab. 1978, 8, 199–206. [Google Scholar]
  8. Shirohara, H.; Otsuki, M. Plasma cholecystokinin levels in acute pancreatitis. Pancreas 1997, 14, 249–254. [Google Scholar] [CrossRef]
  9. Atozaki, T.; Williams, J.A. Multiple sources of 1, 2-diacylglycerol in isolated rat pancreatic acini stimulated by cholecystokinin. Involvement of phosphatidylinositol bisphosphate and phosphatidylcholine hydrolysis. J. Biol. Chem. 1989, 264, 14729–14734. [Google Scholar]
  10. Trimble, E.R.; Bruzzone, R.; Meehan, C.J.; Biden, T.J. Rapid increases in inositol 1, 4, 5-trisphosphate, inositol 1, 3, 4, 5-tetrakisphosphate and cytosolic free Ca2+ in agonist-stimulated pancreatic acini of the rat. Effect of carbachol, caerulein and secretin. Biochem. J. 1987, 242, 289–292. [Google Scholar] [CrossRef]
  11. Pérez, S.; Pereda, J.; Sabater, L.; Sastre, J. Redox signaling in acute pancreatitis. Redox Biol. 2015, 5, 1–14. [Google Scholar] [CrossRef] [PubMed] [Green Version]
  12. Voronina, S.; Longbottom, R.; Sutton, R.; Petersen, O.H.; Tepikin, A. Bile acids induce calcium signals in mouse pancreatic acinar cells: Implications for bile-induced pancreatic pathology. J. Physiol. 2002, 540, 49–55. [Google Scholar] [CrossRef] [PubMed]
  13. Gerasimenko, J.V.; Lur, G.; Sherwood, M.W.; Ebisui, E.; Tepikin, A.V.; Mikoshiba, K.; Gersimenko, O.V.; Petersen, O.H. Pancreatic protease activation by alcohol metabolite depends on Ca2+ release via acid store IP3 receptors. Proc. Natl. Acad. Sci. USA 2009, 106, 10758–10763. [Google Scholar] [CrossRef]
  14. Orabi, A.I.; Shah, A.U.; Ahmad, M.U.; Choo-Wing, R.; Parness, J.; Jain, D.; Bhandari, V.; Husain, S.Z. Dantrolene mitigates caerulein-induced pancreatitis in vivo in mice. Am. J. Physiol. Gastrointest. Liver Physiol. 2010, 299, G196–G204. [Google Scholar] [CrossRef] [Green Version]
  15. Booth, D.M.; Mukherjee, R.; Sutton, R.; Criddle, D.N. Calcium and reactive oxygen species in acute pancreatitis: Friend or foe? Antioxid. Redox Signaling 2011, 15, 2683–2698. [Google Scholar] [CrossRef] [PubMed]
  16. Gerasimenko, J.V.; Gryshchenko, O.; Ferdek, P.E.; Stapleton, E.; Hébert, T.O.; Bychkova, S.; Peng, S.; Begg, M.; Gerasimenko, O.V.; Petersen, O.H. Ca2+ release-activated Ca2+ channel blockade as a potential tool in antipancreatitis therapy. Proc. Natl. Acad. Sci. USA 2013, 110, 13186–13191. [Google Scholar] [CrossRef] [PubMed]
  17. Husain, S.; Thrower, E. Molecular and cellular regulation of pancreatic acinar cell Function. Curr. Opin. Gastroenterol. 2009, 25, 466–471. [Google Scholar] [CrossRef] [PubMed]
  18. Nathanson, M.H.; Fallon, M.B.; Padfield, P.J.; Maranto, A.R. Localization of the type 3 inositol 1, 4, 5-trisphosphate receptor in the Ca2+ wave trigger zone of pancreatic acinar cells. J. Biol. Chem. 1994, 269, 4693–4696. [Google Scholar]
  19. Hofbauer, B.; Saluja, A.K.; Lerch, M.M.; Bhagat, L.; Bhatia, M.; Lee, H.S.; Steer, M.L. Intra-acinar cell activation of trypsinogen during caerulein-induced pancreatitis in rats. Am. J. Physiol. Gastrointest. Liver Physiol. 1998, 275, G352–G362. [Google Scholar] [CrossRef]
  20. Nathanson, M.H.; Padfield, P.J.; O’Sullivan, A.J.; Burgstahler, A.D.; Jamieson, J.D. Mechanism of Ca2+ wave propagation in pancreatic acinar cells. J. Biol. Chem. 1992, 267, 18118–18121. [Google Scholar]
  21. Leite, M.F.; Burgstahler, A.D.; Nathanson, M.H. Ca2+ waves require sequential activation of inositol trisphosphate receptors and ryanodine receptors in pancreatic acini. Gastroenterology 2002, 122, 415–427. [Google Scholar] [CrossRef] [PubMed]
  22. Lerch, M.M.; Adler, G. Experiemental animal models of acute pancreatitis. Int. J. Pancreatol. 1994, 15, 159–170. [Google Scholar] [PubMed]
  23. Dolmetsch, R.E.; Xu, K.; Lewis, R.S. Calcium oscillations increase the efficiency and specificity of gene expression. Nature 1998, 392, 933–936. [Google Scholar] [CrossRef] [PubMed]
  24. Manalo, R.V.; Medina, P.M. The endoplasmic reticulum stress response in disease pathogenesis and pathophysiology. Egypt J. Med. Hum. Genet. 2018, 19, 59–68. [Google Scholar] [CrossRef]
  25. Ratner, A.J.; Bryan, R.; Weber, A.; Nguyen, S.; Barnes, D.; Pitt, A.; Gelber, S.; Cheung, A.; Prince, A. Cystic fibrosis pathogens activate Ca2+-dependent mitogen-activated protein kinase signaling pathways in airway epithelial cells. J. Biol. Chem. 2001, 276, 19267–19275. [Google Scholar] [CrossRef] [PubMed]
  26. Liang, H.; Chen, A.; Lai, X.; Liu, J.; Wu, J.; Kang, Y.; Wang, X.; Shao, L. Neuroinflammation is induced by tongue-instilled ZnO nanoparticles via the Ca 2+-dependent NF-κB and MAPK pathways. Part. Fibre Toxicol. 2018, 15, 39. [Google Scholar] [CrossRef]
  27. Brown, D.M.; Donaldson, K.; Borm, P.J.; Schins, R.P.; Dehnhardt, M.; Gilmour, P.; Jimenez, L.A.; Stone, V. Calcium and ROS-mediated activation of transcription factors and TNF-α cytokine gene expression in macrophages exposed to ultrafine particles. Am. J. Physiol. Lung Cell Mol. Physiol. 2004, 286, L344–L353. [Google Scholar] [CrossRef]
  28. Calder, P.C. n-3 Polyunsaturated fatty acids, inflammation, and inflammatory diseases. Am. J. Clin. Nutr. 2006, 83, 1505S–1519S. [Google Scholar] [CrossRef]
  29. Song, E.A.; Lim, J.W.; Kim, H. Docosahexaenoic acid inhibits IL-6 expression via PPARγ-mediated expression of catalase in cerulein-stimulated pancreatic acinar cells. Int. J. Biochem. Cell Biol. 2017, 88, 60–68. [Google Scholar] [CrossRef]
  30. Ju, K.D.; Lim, J.W.; Kim, K.H.; Kim, H. Potential role of NADPH oxidase-mediated activation of Jak2/Stat3 and mitogen-activated protein kinases and expression of TGF-β1 in the pathophysiology of acute pancreatitis. Inflamm. Res. 2011, 60, 791–800. [Google Scholar] [CrossRef]
  31. Yu, J.H.; Lim, J.W.; Kim, H.; Kim, K.H. NADPH oxidase mediates interleukin-6 expression in cerulein-stimulated pancreatic acinar cells. Int. J. Biochem. Cell Biol. 2005, 37, 1458–1469. [Google Scholar] [CrossRef] [PubMed]
  32. Lee, S.; Kim, H.J.; Chang, K.C.; Baek, J.C.; Park, J.K.; Shin, J.K.; Choi, W.J.; Lee, J.H.; Paik, W.Y. DHA and EPA down-regulate COX-2 expression through suppression of NF-κB activity in LPS-treated human umbilical vein endothelial cells. Korean J. Physiol. Pharmacol. 2009, 13, 301–307. [Google Scholar] [CrossRef] [PubMed]
  33. Choi, E.Y.; Jin, J.Y.; Choi, J.I.; Choi, I.S.; Kim, S.J. DHA suppresses Prevotella intermedia lipopolysaccharide-induced production of proinflammatory mediators in murine macrophages. Br. J. Nutr. 2014, 111, 1221–1230. [Google Scholar] [CrossRef] [PubMed]
  34. Park, K.S.; Lim, J.W.; Kim, H. Inhibitory mechanism of omega-3 fatty acids in pancreatic inflammation and apoptosis. Ann. N. Y. Acad. Sci. 2009, 1171, 421–427. [Google Scholar] [CrossRef] [PubMed]
  35. Park, M.; Lim, J.W.; Kim, H. Docoxahexaenoic acid induces apoptosis of pancreatic cancer cells by suppressing activation of STAT3 and NF-κB. Nutrients 2018, 10, E1621. [Google Scholar] [CrossRef] [PubMed]
  36. Criddle, D.N. Reactive oxygen species, Ca2+ stores and acute pancreatitis; a step closer to therapy? Cell Calcium 2016, 60, 180–189. [Google Scholar] [CrossRef] [Green Version]
  37. Brookes, P.S.; Yoon, Y.; Robotham, J.L.; Anders, M.W.; Sheu, S.S. Calcium, ATP, and ROS: A mitochondrial love-hate triangle. Am. J. Physiol. Cell Physiol. 2004, 287, C817–C833. [Google Scholar] [CrossRef]
  38. Gerasimenko, J.V.; Peng, S.; Tsugorka, T.; Gerasimenko, O.V. Ca2+ signalling underlying pancreatitis. Cell Calcium. 2018, 70, 95–101. [Google Scholar] [CrossRef]
  39. Gerasimenko, J.V.; Flowerdew, S.E.; Voronina, S.G.; Sukhomlin, T.K.; Tepikin, A.V.; Petersen, O.H.; Gerasimenko, O.V. Bile acids induce Ca2+ release from both the endoplasmic reticulum and acidic intracellular calcium stores through activation of inositol trisphosphate receptors and ryanodine receptors. J. Biol. Chem. 2006, 281, 40154–40163. [Google Scholar] [CrossRef]
  40. Gerasimenko, J.V.; Gerasimenko, O.V.; Petersen, O.H. The role of Ca2+ in the pathophysiology of pancreatitis. J. Physiol. 2014, 592, 269–280. [Google Scholar] [CrossRef]
  41. Straub, S.V.; Giovannucci, D.R.; Yule, D.I. Calcium wave propagation in pancreatic acinar cells: Functional interaction of inositol 1, 4, 5-trisphosphate receptors, ryanodine receptors, and mitochondria. J. Gen. Physiol. 2000, 116, 547–560. [Google Scholar] [CrossRef] [PubMed]
  42. Han, B.; Logsdon, C.D. CCK stimulates mob-1 expression and NF-κB activation via protein kinase C and intracellular Ca2+. Am. J. Physiol. Cell Physiol. 2000, 278, C344–C351. [Google Scholar] [CrossRef] [PubMed]
  43. Tando, Y.; Algul, H.; Wagner, M.; Weidenbach, H.; Adler, G.; Schmid, R.M. Caerulein-induced NF-κB/Rel activation requires both Ca2+ and protein kinase C as messengers. Am. J. Physiol. Gastrointest. Liver Physiol. 1999, 277, G678–G686. [Google Scholar] [CrossRef] [PubMed]
  44. Hietaranta, A.J.; Singh, V.P.; Bhagat, L.; Van Acker, G.J.; Song, A.M.; Mykoniatis, A.; Steer, M.L.; Saluja, A.K. Water immersion stress prevents caerulein-induced pancreatic acinar cell NF-κB activation by attenuating caerulein-induced intracellular Ca2+ changes. J. Biol. Chem. 2001, 276, 18742–18747. [Google Scholar] [CrossRef] [PubMed]
  45. Orlichenko, L.S.; Behari, J.; Yeh, T.H.; Liu, S.; Stolz, D.B.; Saluja, A.K.; Singh, V.P. Transcriptional regulation of CXC-ELR chemokines KC and MIP-2 in mouse pancreatic acini. Am. J. Physiol. Heart Circ. Physiol. 2010, 299, G867–G876. [Google Scholar] [CrossRef] [PubMed] [Green Version]
  46. Turner, D.J.; Cowles, R.A.; Segura, B.J.; Mulholland, M.W. Cholinergic stimulation of rat acinar cells increases c-fos and c-jun expression via a mitogen-activated protein kinase-dependent pathway. J. Gastrointest. Surg. 2001, 5, 661–672. [Google Scholar] [CrossRef]
  47. Ramnath, R.D.; Sun, J.; Bhatia, M. Role of calcium in substance P-induced chemokine synthesis in mouse pancreatic acinar cells. Br. J. Pharmacol. 2008, 154, 1339–1348. [Google Scholar] [CrossRef] [Green Version]
  48. Begum, G.; Harvey, L.; Dixon, C.E.; Sun, D. ER stress and effects of DHA as an ER stress inhibitor. Transl. Stroke Res. 2013, 4, 635–642. [Google Scholar] [CrossRef]
  49. Begum, G.; Kintner, D.; Liu, Y.; Cramer, S.W.; Sun, D. DHA inhibits ER Ca2+ release and ER stress in astrocytes following in vitro ischemia. J. Neurochem. 2012, 120, 622–630. [Google Scholar] [CrossRef]
  50. Rodrigo, G.C.; Dhanapala, S.; Macknight, A.D.C. Effects of eicosapentaenoic acid on the contraction of intact, and spontaneous contraction of chemically permeabilized mammalian ventricular myocytes. J. Mol. Cell. Cardiol. 1999, 31, 733–743. [Google Scholar] [CrossRef]
  51. Honen, B.N.; Saint, D.A.; Laver, D.R. Suppression of calcium sparks in rat ventricular myocytes and direct inhibition of sheep cardiac RyR channels by EPA, DHA and oleic acid. J. Membr. Biol. 2003, 196, 95–103. [Google Scholar] [CrossRef] [PubMed]
  52. He, X.; Liu, W.; Shi, M.; Yang, Z.; Zhang, X.; Gong, P. Docosahexaenoic acid attenuates LPS-stimulated inflammatory response by regulating the PPARγ/NF-κB pathways in primary bovine mammary epithelial cells. Res. Vet. Sci. 2017, 112, 7–12. [Google Scholar] [CrossRef] [PubMed]
  53. Wang, Z.Q.; Chen, M.T.; Zhang, R.; Zhang, Y.; Li, W.; Li, Y.G. Docosahexaenoic acid attenuates doxorubicin-induced cytotoxicity and inflammation by suppressing NF-κB/iNOS/NO signaling pathway activation in H9C2 cardiac cells. J. Cardiovasc. Pharmacol. 2016, 67, 283–289. [Google Scholar] [CrossRef] [PubMed]
  54. Chang, C.Y.; Kuan, Y.H.; Li, J.R.; Chen, W.Y.; Ou, Y.C.; Pan, H.C.; Lia, S.L.; Raung, S.L.; Chang, C.J.; Chen, C.J. Docosahexaenoic acid reduces cellular inflammatory response following permanent focal cerebral ischemia in rats. J. Nutr. Biochem. 2013, 24, 2127–2137. [Google Scholar] [CrossRef] [PubMed]
  55. Sheng, M.; Greenberg, M.E. The regulation and function of c-fos and other immediate early genes in the nervous system. Neuron 1990, 4, 477–485. [Google Scholar] [CrossRef]
  56. Sadoshima, J.; Izumo, S. Signal transduction pathways of angiotensin II--induced c-fos gene expression in cardiac myocytes in vitro. Roles of phospholipid-derived second messengers. Circ. Res. 1993, 73, 424–438. [Google Scholar] [CrossRef] [PubMed]
  57. Serkkola, E.; Hurme, M. Synergism between protein-kinase C and cAMP-dependent pathways in the expression of the interleukin-1β gene is mediated via the activator-protein-1 (AP-1) enhancer activity. Eur. J. Biochem. 1993, 213, 243–249. [Google Scholar] [CrossRef] [PubMed]
  58. Silvers, A.L.; Bachelor, M.A.; Bowden, G.T. The role of JNK and p38 MAPK activities in UVA-induced signaling pathways leading to AP-1 activation and c-Fos expression. Neoplasia 2003, 5, 319–329. [Google Scholar] [CrossRef]
  59. Cavigelli, M.; Dolfi, F.; Claret, F.X.; Karin, M. Induction of c-fos expression through JNK-mediated TCF/Elk-1 phosphorylation. EMBO J. 1995, 14, 5957–5964. [Google Scholar] [CrossRef]
  60. Guma, M.; Stepniak, D.; Shaked, H.; Spehlmann, M.E.; Shenouda, S.; Cheroutre, H.; Vincente-Suarez, I.; Eckmann, L.; Kagnoff, M.F.; Karin, M. Constitutive intestinal NF-κB does not trigger destructive inflammation unless accompanied by MAPK activation. J. Exp. Med. 2001, 208, 1889–1900. [Google Scholar] [CrossRef]
  61. Jakkampudi, A.; Jangala, R.; Reddy, B.R.; Mitnala, S.; Reddy, D.N.; Talukdar, R. NF-κB in acute pancreatitis: Mechanisms and therapeutic potential. Pancreatology 2016, 16, 477–488. [Google Scholar] [CrossRef] [PubMed]
Figure 1. Heatmap of differentially expressed genes (DEGs) that are significantly altered by cerulein treatment, or by pretreatment with docosahexaenoic acid (DHA) followed by cerulein treatment. AR42J cells were treated with a vehicle (designated as ‘none’) or DHA (50 μM) dissolved in vehicle (designated as ‘DHA’) for 6 h. For cerulein treatment, the cells were pretreated with a vehicle (designated as ‘cerulein’) or DHA (50 μM) dissolved in vehicle for 2 h and then stimulated with cerulein (10⁸ M) (designated as ‘cerulein + DHA’) for 4 h. Vehicle is 0.5 M ethanol. Heatmap was drawn based on normalized read counts represented as FPKM (fragment per kilobase of transcript per million mapped reads).
Nutrients 11 01445 g001
Figure 2. A schematic of the Ca2+ signaling network derived from Kyoto Encyclopedia of Genes and Genomes (KEGG). The filtered DEGs identified by the RNA-Seq analysis are colored in yellow boxes (ryanodine receptor (RYR), inositol triphosphate receptor (IP3R)). The molecular pathways associated with Ca2+ signaling are colored in light grey boxes (mitogen-activated protein kinase (MAPK), protein kinase A (PKA), Apoptosis, nuclear factor kappa-light-chain-enhancer of activated B cells (NF-κB), activator protein-1 (AP-1), phosphatidylinositol signaling pathways). The molecules in blue are second messengers in signaling transduction pathways.
Nutrients 11 01445 g002
Figure 3. A chart of mRNA expression levels of the RyR2, IP3R1 (A), Relb, and c-fos (B) in AR42J cells. AR42J cells were treated with a vehicle or DHA (50 μM) dissolved in vehicle for 6 h. For cerulein treatment, the cells were pretreated with a vehicle or DHA (50 μM) dissolved in vehicle for 2 h and then stimulated with cerulein (10⁸ M) for 4 h. Vehicle is 0.5 M ethanol. The mRNA levels were determined by real-time PCR analysis and normalized to the expression of the β-actin gene. *p < 0.05 vs. cells without treatment (cerulein-, DHA - ); +p < 0.05 vs. cells with cerulein treatment alone (cerulein +, DHA -). mRNA expression of the cells without treatment (cerulin-, DHA - ) was set at 1. Relative fold of each group was compared to that of the cells without treatment (cerulin-, DHA - ).
Nutrients 11 01445 g003aNutrients 11 01445 g003b
Table 1. Genes whose expressions were changed by treatment of cerulein or DHA or by pretreatment with DHA followed by cerulein treatment.
Gene NameNone
Mapped Read 1
Cerulein
Mapped Read 1
DHA
Mapped Read 1
Cerulein+DHA
Mapped Read 1
Fosb4924255113
Relb3819462156
Pde2a99721439191402
Rras22058436918373879
Npas4102107112
Pnlip3165980428216068
Pdzd2351244755
Trpc4441173262
Ankrd34a3826126178
Dkk29727553194
Nr4a27736360204
Gad1237763182483
Itga4214500112280
F2121293140188
Mylk21651445712932648
Nfs1205110915667
Rims4118567125401
Chrna44141059381803
Pdk48128743198
Reg3b1228732892
Reg1a11,04826,879910412,476
Itpr12398617826564547
Bid109317105213
M6pr4211352426485
C1s5127645139
Gucy2c1382830651420
Akap254151110102
Cela3b81055739153610
Lbh65220705721366
Dock499331135198
Fos1422634164
Tshr7055680496
Moap1372832444684
Pros15412252100
Timp3102260116146
Matn2111268159234
Abcd2146436101346
Rgl38416876133
Chrnb415738281312
Plcl173814573321357
Ihh302010,80615116831
Per1146436101346
Tmem1304651162550899
Hpd241392488
Sgsm166617065601286
Igsf82961966938297782
Kcnj9119290115209
Gabra2361922209558
Klf261302117185
Pdlim35741796294886
RyR2321543296
Impad1129447117326
Egr1138752286478
Mapk464517505081098
Junb321543296
Col18a12771286243818
Armcx18020317102
AR42J cells were treated with a vehicle (designated as ‘none’) or DHA (50 μM) dissolved in vehicle (designated as ‘DHA’) for 6 h. For cerulein treatment, the cells were pretreated with a vehicle (designated as ‘cerulein’) or DHA (50 μM) dissolved in vehicle for 2 h and then stimulated with cerulein (10⁸ M) (designated as ‘cerulein + DHA’) for 4 h. Vehicle is 0.5 M ethanol. 1 Raw reads of 200–400 bp fragments from each sample library were obtained and aligned to reference genome transcripts. The mapped read counts were normalized by RLE value to quantify relative abundance of each gene.
Table 2. A list of the functions and key genes of the corresponding physiological pathways impacted by cerulein in AR42J cells.
Metabolic PathwaysGad1, Hpd, Hpse, Impad1, Nfs1, Pnlip
Neuroactive ligand-receptor interactionChrna4, Chrnb4, F2, Gabra2, Tshr
Oxytocin signaling pathwayFos, Itpr1, Kcnj9, Mylk2, Ryr2
Apelin signaling pathwayItpr1, Klf2, Mylk2, Rras2, Ryr2
Proteoglycans in cancerHpse, Ihh, Itpr1, Rras2, Timp3
Pancreatic secretionCela3b, Itpr1, Pnlip, Ryr2
Regulation of actin cytoskeletonF2, Itga4, Mylk2, Rras2
cAMP signaling pathwayFos, Rras2, Ryr2, Tshr
MAPK signaling pathwayFos, Nr4a1, Relb, Rras2
Calcium signaling pathwayItpr1, Mylk2, Ryr2
cGMP-PKG signaling pathwayItpr1, Mylk2, Pde2a
ApoptosisBid, Fos, Itpr1
AutophagyItpr1, Rab7b, Rras2
cAMP, cyclic adenosine monophosphate; MAPK, mitogen-activated protein kinase; cGMP-PKG; cyclic guanosine monophosphate-protein kinase G.

