Associations of Lifestyle Behaviour and Healthy Ageing in Five Latin American and the Caribbean Countries—A 10/66 Population-Based Cohort Study

 ,
,
Abstract
:1. Introduction
2. Materials and Methods
2.1. Study Population
2.2. Baseline Measures
2.3. Outcome Assessment
3. Results
4. Discussion
Strengths and Limitations
5. Conclusions
Supplementary Materials
Author Contributions
Funding
Acknowledgments
Conflicts of Interest
References
- United Nations. World Population Ageing 2015; United Nations, Department of Economic and Social Affairs, Population Division: New York, NY, USA, 2015. [Google Scholar]
- Kralj, C.; Daskalopoulou, C.; Rodríguez-Artalejo, F.; García-Esquinas, E.; Cosco, T.D.; Prince, M.; Prina, A.M. Healthy Ageing: A Systematic Review of Risk Factors; ATHLOS Consortium: London, UK, 2018. [Google Scholar]
- GBD 2013 DALYs and HALE Collaborators; Murray, C.J.; Barber, R.M.; Foreman, K.J.; Abbasoglu Ozgoren, A.; Abd-Allah, F.; Abera, S.F.; Aboyans, V.; Abraham, J.P.; Abubakar, I. Global, regional, and national disability-adjusted life years (DALYs) for 306 diseases and injuries and healthy life expectancy (HALE) for 188 countries, 1990–2013: Quantifying the epidemiological transition. Lancet 2015, 386, 2145–2191. [Google Scholar] [CrossRef]
- Prina, A.M. Ageing, resilience and depression: Adding life to years as well as years to life. Epidemiol. Psychiatr. Sci. 2017, 26, 571–573. [Google Scholar] [CrossRef] [PubMed]
- Lowsky, D.J.; Olshansky, S.J.; Bhattacharya, J.; Goldman, D.P. Heterogeneity in Healthy Aging. J. Gerontol. Ser. A Boil. Sci. Med. Sci. 2014, 69, 640–649. [Google Scholar] [CrossRef] [PubMed]
- Depp, C.A.; Jeste, D.V. Definitions and predictors of successful aging: A comprehensive review of larger quantitative studies. Am. J. Geriatr. Psychiatry Off. J. Am. Assoc. Geriatr. Psychiatry 2006, 14, 6–20. [Google Scholar] [CrossRef] [PubMed]
- Cosco, T.D.; Prina, A.M.; Perales, J.; Stephan, B.C.; Brayne, C. Operational definitions of successful aging: A systematic review. Int. Psychogeriatr. 2014, 26, 373–381. [Google Scholar] [CrossRef] [PubMed]
- World Health Organization. World Report on Ageing and Health; World Health Organization: Geneva, Switzerland, 2015. [Google Scholar]
- Sabia, S.; Singh-Manoux, A.; Hagger-Johnson, G.; Cambois, E.; Brunner, E.J.; Kivimaki, M. Influence of individual and combined healthy behaviours on successful aging. CMAJ 2012, 184, 1985–1992. [Google Scholar] [CrossRef] [PubMed] [Green Version]
- Stenholm, S.; Head, J.; Kivimaki, M.; Kawachi, I.; Aalto, V.; Zins, M.; Goldberg, M.; Zaninotto, P.; Magnuson Hanson, L.; Westerlund, H.; et al. Smoking, physical inactivity and obesity as predictors of healthy and disease-free life expectancy between ages 50 and 75: A multicohort study. Int. J. Epidemiol. 2016, 45, 1260–1270. [Google Scholar] [CrossRef] [PubMed]
- Knoops, K.T.; de Groot, L.C.; Kromhout, D.; Perrin, A.E.; Moreiras-Varela, O.; Menotti, A.; van Staveren, W.A. Mediterranean diet, lifestyle factors, and 10-year mortality in elderly European men and women: The HALE project. JAMA 2004, 292, 1433–1439. [Google Scholar] [CrossRef] [PubMed]
- Kvaavik, E.; Batty, G.D.; Ursin, G.; Huxley, R.; Gale, C.R. Influence of individual and combined health behaviors on total and cause-specific mortality in men and women: The United Kingdom health and lifestyle survey. Arch. Intern. Med. 2010, 170, 711–718. [Google Scholar] [CrossRef] [PubMed]
- Sabia, S.; Nabi, H.; Kivimaki, M.; Shipley, M.J.; Marmot, M.G.; Singh-Manoux, A. Health behaviors from early to late midlife as predictors of cognitive function: The Whitehall II study. Am. J. Epidemiol. 2009, 170, 428–437. [Google Scholar] [CrossRef] [PubMed]
- Daskalopoulou, C.; Stubbs, B.; Kralj, C.; Koukounari, A.; Prince, M.; Prina, A.M. Physical activity and healthy ageing: A systematic review and meta-analysis of longitudinal cohort studies. Ageing Res. Rev. 2017, 38, 6–17. [Google Scholar] [CrossRef] [PubMed]
- Daskalopoulou, C.; Stubbs, B.; Kralj, C.; Koukounari, A.; Prince, M.; Prina, A.M. Associations of smoking and alcohol consumption with healthy ageing: A systematic review and meta-analysis of longitudinal studies. BMJ Open 2018, 8, e019540. [Google Scholar] [CrossRef] [PubMed]
- World Health Organization. Ageing and Health. 2015. Available online: http://www.who.int/mediacentre/factsheets/fs404/en/ (accessed on 16 March 2018).
- Institute for Health Metrics and Evaluation. Global Burden of Disease (GBD) Data. 2016. Available online: http://ghdx.healthdata.org/gbd-results-tool (accessed on 30 August 2018).
- Institute for Health Metrics and Evaluation; Human Development Network; The World Bank. The Global Burden of Disease: Generating Evidence, Guiding Policy—Latin America and Caribbean Regional Edition; IHME: Seattle, WA, USA, 2013. [Google Scholar]
- Prince, M.; Ferri, C.P.; Acosta, D.; Albanese, E.; Arizaga, R.; Dewey, M.; Gavrilova, S.I.; Guerra, M.; Huang, Y.; Jacob, K.S.; et al. The protocols for the 10/66 dementia research group population-based research programme. BMC Public Health 2007, 7, 165. [Google Scholar] [CrossRef] [PubMed]
- Prina, A.M.; Acosta, D.; Acosta, I.; Guerra, M.; Huang, Y.; Jotheeswaran, A.T.; Jimenez-Velazquez, I.Z.; Liu, Z.; Llibre Rodriguez, J.J.; Salas, A.; et al. Cohort Profile: The 10/66 study. Int. J. Epidemiol. 2017, 46, 406–406i. [Google Scholar] [CrossRef] [PubMed]
- Royal College of Physicians. Alcohol Guidelines; Authority of the House of Commons; House of Commons Science and Technology Committee: London, UK, 2011. [Google Scholar]
- Brown, T.A. Confirmatory Factor Analysis for Applied Research, 2nd ed.; The Guilford Press: New York, NY, USA, 2015. [Google Scholar]
- Reise, S.P. Invited Paper: The Rediscovery of Bifactor Measurement Models. Multivar. Behav. Res. 2012, 47, 667–696. [Google Scholar] [CrossRef] [PubMed]
- Hair, J.F.; Black, W.C.; Babin, B.J.; Anderson, R.E. Multivariate Data Analysis, 7th ed.; Pearson: New York, NY, USA, 2010. [Google Scholar]
- Rodriguez, A.; Reise, S.P.; Haviland, M.G. Evaluating bifactor models: Calculating and interpreting statistical indices. Psychol. Methods 2016, 21, 137–150. [Google Scholar] [CrossRef] [PubMed]
- Muthén, L.K.; Muthén, B.O. Mplus User’s Guide, 7th ed.; Muthén & Muthén: Los Angeles, CA, USA, 1998–2015. [Google Scholar]
- Higgins, J.P.; Thompson, S.G.; Deeks, J.J.; Altman, D.G. Measuring inconsistency in meta-analyses. BMJ 2003, 327, 557–560. [Google Scholar] [CrossRef] [PubMed] [Green Version]
- Deeks, J.J.; Higgins, J.P.T.; Altman, D.G. Analysing data and undertaking meta-analyses. In Cochrane Handbook for Systematic Reviews of Interventions; Higgins, J.P.T., Green, S., Eds.; Version 5.1.0; The Cochrane Collaboration, 2011; Available online: www.handbook.cochrane.org (accessed on 22 October 2018).
- National Academies of Sciences, Engineering, Medicine. Strengthening the Scientific Foundation for Policymaking to Meet the Challenges of Aging in Latin America and the Caribbean: Summary of a Workshop. Committee for the Workshop on Strengthening the Scientific Foundation, Caribbean. In Committee on Population, Division of Behavioral and Social Sciences and Education; Kinsella, K., Steering, R., Eds.; The National Academies Press: Washington, DC, USA, 2015. [Google Scholar]
- Ford, E.S.; Zhao, G.; Tsai, J.; Li, C. Low-risk lifestyle behaviors and all-cause mortality: Findings from the National Health and Nutrition Examination Survey III Mortality Study. Am. J. Public Health 2011, 101, 1922–1929. [Google Scholar] [CrossRef] [PubMed]
- Reimers, C.D.; Knapp, G.; Reimers, A.K. Does physical activity increase life expectancy? A review of the literature. J. Aging Res. 2012, 2012, 243958. [Google Scholar] [CrossRef] [PubMed]
- Reiner, M.; Niermann, C.; Jekauc, D.; Woll, A. Long-term health benefits of physical activity--a systematic review of longitudinal studies. BMC Public Health 2013, 13, 813. [Google Scholar] [CrossRef] [PubMed]
- Radak, Z.; Hart, N.; Sarga, L.; Koltai, E.; Atalay, M.; Ohno, H.; Boldogh, I. Exercise plays a preventive role against Alzheimer’s disease. J. Alzheimer’s Dis. 2010, 20, 777–783. [Google Scholar] [CrossRef] [PubMed]
- Woods, J.A.; Wilund, K.R.; Martin, S.A.; Kistler, B.M. Exercise, Inflammation and Aging. Aging Dis. 2012, 3, 130–140. [Google Scholar] [PubMed]
- Hodge, A.M.; O’Dea, K.; English, D.R.; Giles, G.G.; Flicker, L. Dietary patterns as predictors of successful ageing. J. Nutr. Health Aging 2014, 18, 221–227. [Google Scholar] [CrossRef] [PubMed]
- Kiefte-de Jong, J.C.; Mathers, J.C.; Franco, O.H. Nutrition and healthy ageing: The key ingredients. Proc. Nutr. Soc. 2014, 73, 249–259. [Google Scholar] [CrossRef] [PubMed]
- Sofi, F.; Abbate, R.; Gensini, G.F.; Casini, A. Accruing evidence on benefits of adherence to the Mediterranean diet on health: An updated systematic review and meta-analysis. Am. J. Clin. Nutr. 2010, 92, 1189–1196. [Google Scholar] [CrossRef] [PubMed]
- Slavin, J.L.; Lloyd, B. Health Benefits of Fruits and Vegetables. Adv. Nutr. 2012, 3, 506–516. [Google Scholar] [CrossRef] [PubMed] [Green Version]
- Liu, R.H. Health benefits of fruit and vegetables are from additive and synergistic combinations of phytochemicals. Am. J. Clin. Nutr. 2003, 78 (Suppl. 3), 517s–520s. [Google Scholar] [CrossRef] [PubMed]
- Leitzmann, C. Characteristics and Health Benefits of Phytochemicals. Complement. Med. Res. 2016, 23, 69–74. [Google Scholar] [CrossRef] [PubMed]
- Griswold, M.G.; Fullman, N.; Hawley, C.; Arian, N.; Zimsen, S.R.M.; Tymeson, H.D.; Venkateswaran, V.; Tapp, A.D.; Forouzanfar, M.H.; Salama, J.S.; et al. Alcohol use and burden for 195 countries and territories, 1990–2016, a systematic analysis for the Global Burden of Disease Study 2016. Lancet 2018, 392, 1015–1035. [Google Scholar] [CrossRef]
- Chen, L.Y.; Hardy, C.L. Alcohol Consumption and Health Status in Older Adults:A Longitudinal Analysis. J. Aging Health 2009, 21, 824–847. [Google Scholar] [CrossRef] [PubMed]
- Hu, Y.; Pikhart, H.; Malyutina, S.; Pajak, A.; Kubinova, R.; Nikitin, Y.; Peasey, A.; Marmot, M.; Bobak, M. Alcohol consumption and physical functioning among middle-aged and older adults in Central and Eastern Europe: Results from the HAPIEE study. Age Ageing 2015, 44, 84–89. [Google Scholar] [CrossRef] [PubMed]
- Stockwell, T.; Greer, A.; Fillmore, K.; Chikritzhs, T.; Zeisser, C. How good is the science? BMJ 2012, 344, e2294. [Google Scholar] [CrossRef] [PubMed]
- Hernan, M.A.; Alonso, A.; Logroscino, G. Cigarette smoking and dementia: Potential selection bias in the elderly. Epidemiology 2008, 19, 448–450. [Google Scholar] [CrossRef] [PubMed]
- Divo, M.J.; Martinez, C.H.; Mannino, D.M. Ageing and the epidemiology of multimorbidity. Eur. Respir. J. 2014, 44, 1055–1068. [Google Scholar] [CrossRef] [PubMed] [Green Version]
- Kim, J.I.; Kim, G. Factors affecting the survival probability of becoming a centenarian for those aged 70, based on the human mortality database: Income, health expenditure, telephone, and sanitation. BMC Geriatr. 2014, 14, 113. [Google Scholar] [CrossRef] [PubMed]
- Lu, W.; Pikhart, H.; Sacker, A. Domains and Measurements of Healthy Aging in Epidemiological Studies: A Review. Gerontologist 2018, gny029. [Google Scholar] [CrossRef] [PubMed]
- Kuh, D.; Richards, M.; Cooper, R.; Hardy, R.; Ben-Shlomo, Y. Life course epidemiology, ageing research, and maturing cohort studies: A dynamic combination for understanding healthy ageing. In A Life Course Approach to Healthy Ageing; Oxford University Press: Oxford, UK, 2014. [Google Scholar]


| Country | Cuba | Dominican Republic | Mexico | Peru | Puerto Rico | |||||
|---|---|---|---|---|---|---|---|---|---|---|
| Characteristic | Healthy Ageing (n = 494) | Normal Ageing (n = 1513) | Healthy Ageing (n = 234) | Normal Ageing (n = 963) | Healthy Ageing (n = 153) | Normal Ageing (n = 1309) | Healthy Ageing (n = 579) | Normal Ageing (n = 732) | Healthy Ageing (n = 188) | Normal Ageing (n = 1077) |
| Age (mean, SD) | 70.9 ± 4.61 | 74.87 ± 6.65 † | 70.89 ± 5.17 | 74.7 ± 6.97 † | 69.9 ± 4.00 | 74.2 ± 6.35 † | 71.1 ± 5.20 | 76.7 ± 7.21 † | 72.0 ± 4.56 | 75.7 ± 6.65 † |
| Gender-Female | 291 (58.9%) | 1041 (68.8%) † | 140 (60.1%) | 689 (71.6%) † | 99 (64.7%) | 845 (64.6%) | 343 (59.2%) | 474 (64.8%) † | 141 (75.0%) | 728 (67.8%) |
| Education Level-above primary | 440 (89.4%) | 1099 (72.7%) † | 101 (43.2%) | 259 (27.1%) † | 87 (57.2%) | 355 (27.1%) † | 493 (86.2%) | 559 (77.0%) † | 164 (87.2%) | 846 (78.9%) † |
| Never smoking | 244 (49.6%) | 589 (56.9%) † | 124 (53.0%) | 523 (54.4%) | 91 (59.5%) | 913 (69.7%) † | 471 (81.8%) | 625 (85.9%) † | 150 (79.8%) | 789 (73.5%) |
| Moderate alcohol consumption | 53 (10.9%) | 140 (9.4%) | 19 (8.3%) | 52 (5.4%) | 30 (19.7%) | 225 (17.3%) | 21 (3.7%) | 30 (4.2%) | 21 (11.2%) | 92 (8.6%) |
| Physical activity (very or fairly) | 425 (86.6%) | 1047 (69.4%) † | 188 (80.7%) | 626 (65.3%) † | 133 (86.9%) | 841 (64.6%) † | 471 (81.6%) | 462 (63.6%) † | 176 (93.6%) | 722 (67.3%) † |
| Fruits/vegetable consumption (≥3 servings in the last 3 days) | 409 (83.1%) | 1130 (74.8%) † | 138 (59.0%) | 460 (48.7%) † | 116 (76.3%) | 931 (71.5%) | 477 (83.1%) | 593 (82.4%) | 156 (83.0%) | 807 (75.3%) † |
| Healthy Ageing * Adjusted OR † (95% CI) | ||||
|---|---|---|---|---|
| Country/Lifestyle Behaviour | Physical Activity (Very or Fairly vs. Not Very or Never) | Smoking (Never vs. Former or Current) | Drinking Behaviour (Moderate Drinking vs. Never or Heavy Drinking) | Fruits/Vegetables Consumption (≥3 Servings in the Last Three Days vs. <3) |
| Cuba | 2.56 (1.93–3.41) | 0.97 (0.77–1.24) | 0.83 (0.57–1.20) | 1.41 (1.06–1.87) |
| Dominican Republic | 2.11 (1.46–3.04) | 1.03 (0.75–1.40) | 1.21 (0.68–2.17) | 1.35 (0.99–1.83) |
| Mexico | 2.98 (1.81–4.93) | 0.58 (0.37–0.90) | 1.09 (0.66–1.81) | 1.11 (0.73–1.68) |
| Peru | 2.32 (1.75–3.08) | 0.90 (0.62–1.30) | 0.70 (0.34–1.44) | 0.92 (0.66–1.29) |
| Puerto Rico | 6.30 (3.43–11.56) | 1.30 (0.85–1.97) | 1.80 (1.02–3.17) | 1.44 (0.94–2.21) |
| Pooled Effect | 2.59 (2.20–3.03) | 0.95 (0.82–1.10) | 1.04 (0.82–1.30) | 1.24 (1.06–1.44) |
| I2; p-value | 61.3%; 0.035 | 44.7%; 0.124 | 38.0%; 0.168 | 16.6%; 0.309 |
| Survival * Adjusted OR † (95% CI) | ||||
| Cuba | 2.29 (1.86–2.82) | 1.16 (0.92–1.45) | 1.04 (0.74–1.46) | 1.15 (0.92–1.44) |
| Dominican Republic | 1.82 (1.43–2.30) | 1.18 (0.93–1.50) | 1.36 (0.78–2.37) | 0.94 (0.75–1.19) |
| Mexico | 2.08 (1.50–2.86) | 0.94 (0.61–1.44) | 1.16 (0.74–1.80) | 1.17 (0.84–1.64) |
| Peru | 2.75 (1.90–3.63) | 1.20 (0.70–2.04) | 0.72 (0.33–1.60) | 1.06 (0.66–1.73) |
| Puerto Rico | 2.71 (2.02–3.63) | 1.34 (0.95–1.89) | 1.24 (0.73–2.09) | 1.45 (1.08–1.96) |
| Pooled Effect | 2.23 (1.98–2.52) | 1.17 (1.02–1.34) | 1.11 (0.90–1.37) | 1.13 (0.99–1.28) |
| I2; p-value | 34.4%; 0.192 | 0.0%; 0.807 | 0.0%; 0.737 | 21.9%; 0.275 |
| Country | Healthy Ageing * | |||
|---|---|---|---|---|
| Adjusted OR † (95% CI) | ||||
| Number of Healthy Behaviours Compared to Zero or One | ||||
| Two | Three | Four | Two-Four | |
| Cuba | 1.67 (1.23–2.29) | 2.12 (1.54–2.92) | 1.74 (0.77–3.96) | 1.86 (1.39–2.49) |
| Dominican Republic | 1.64 (1.16–2.32) | 1.98 (1.32–2.96) | 2.48 (0.78–7.86) | 1.77 (1.28–2.43) |
| Mexico | 1.29 (0.74–2.24) | 1.31 (0.74–2.33) | 2.75 (1.04–7.26) | 1.35 (0.80–2.29) |
| Peru | 0.98 (0.64–1.51) | 1.64 (1.08–2.49) | 1.14 (0.21–6.22) | 1.31 (0.88–1.96) |
| Puerto Rico | 1.63 (0.84–3.17) | 4.21 (2.25–7.87) | 4.93 (1.77–13.71) | 2.92 (1.60–5.36) |
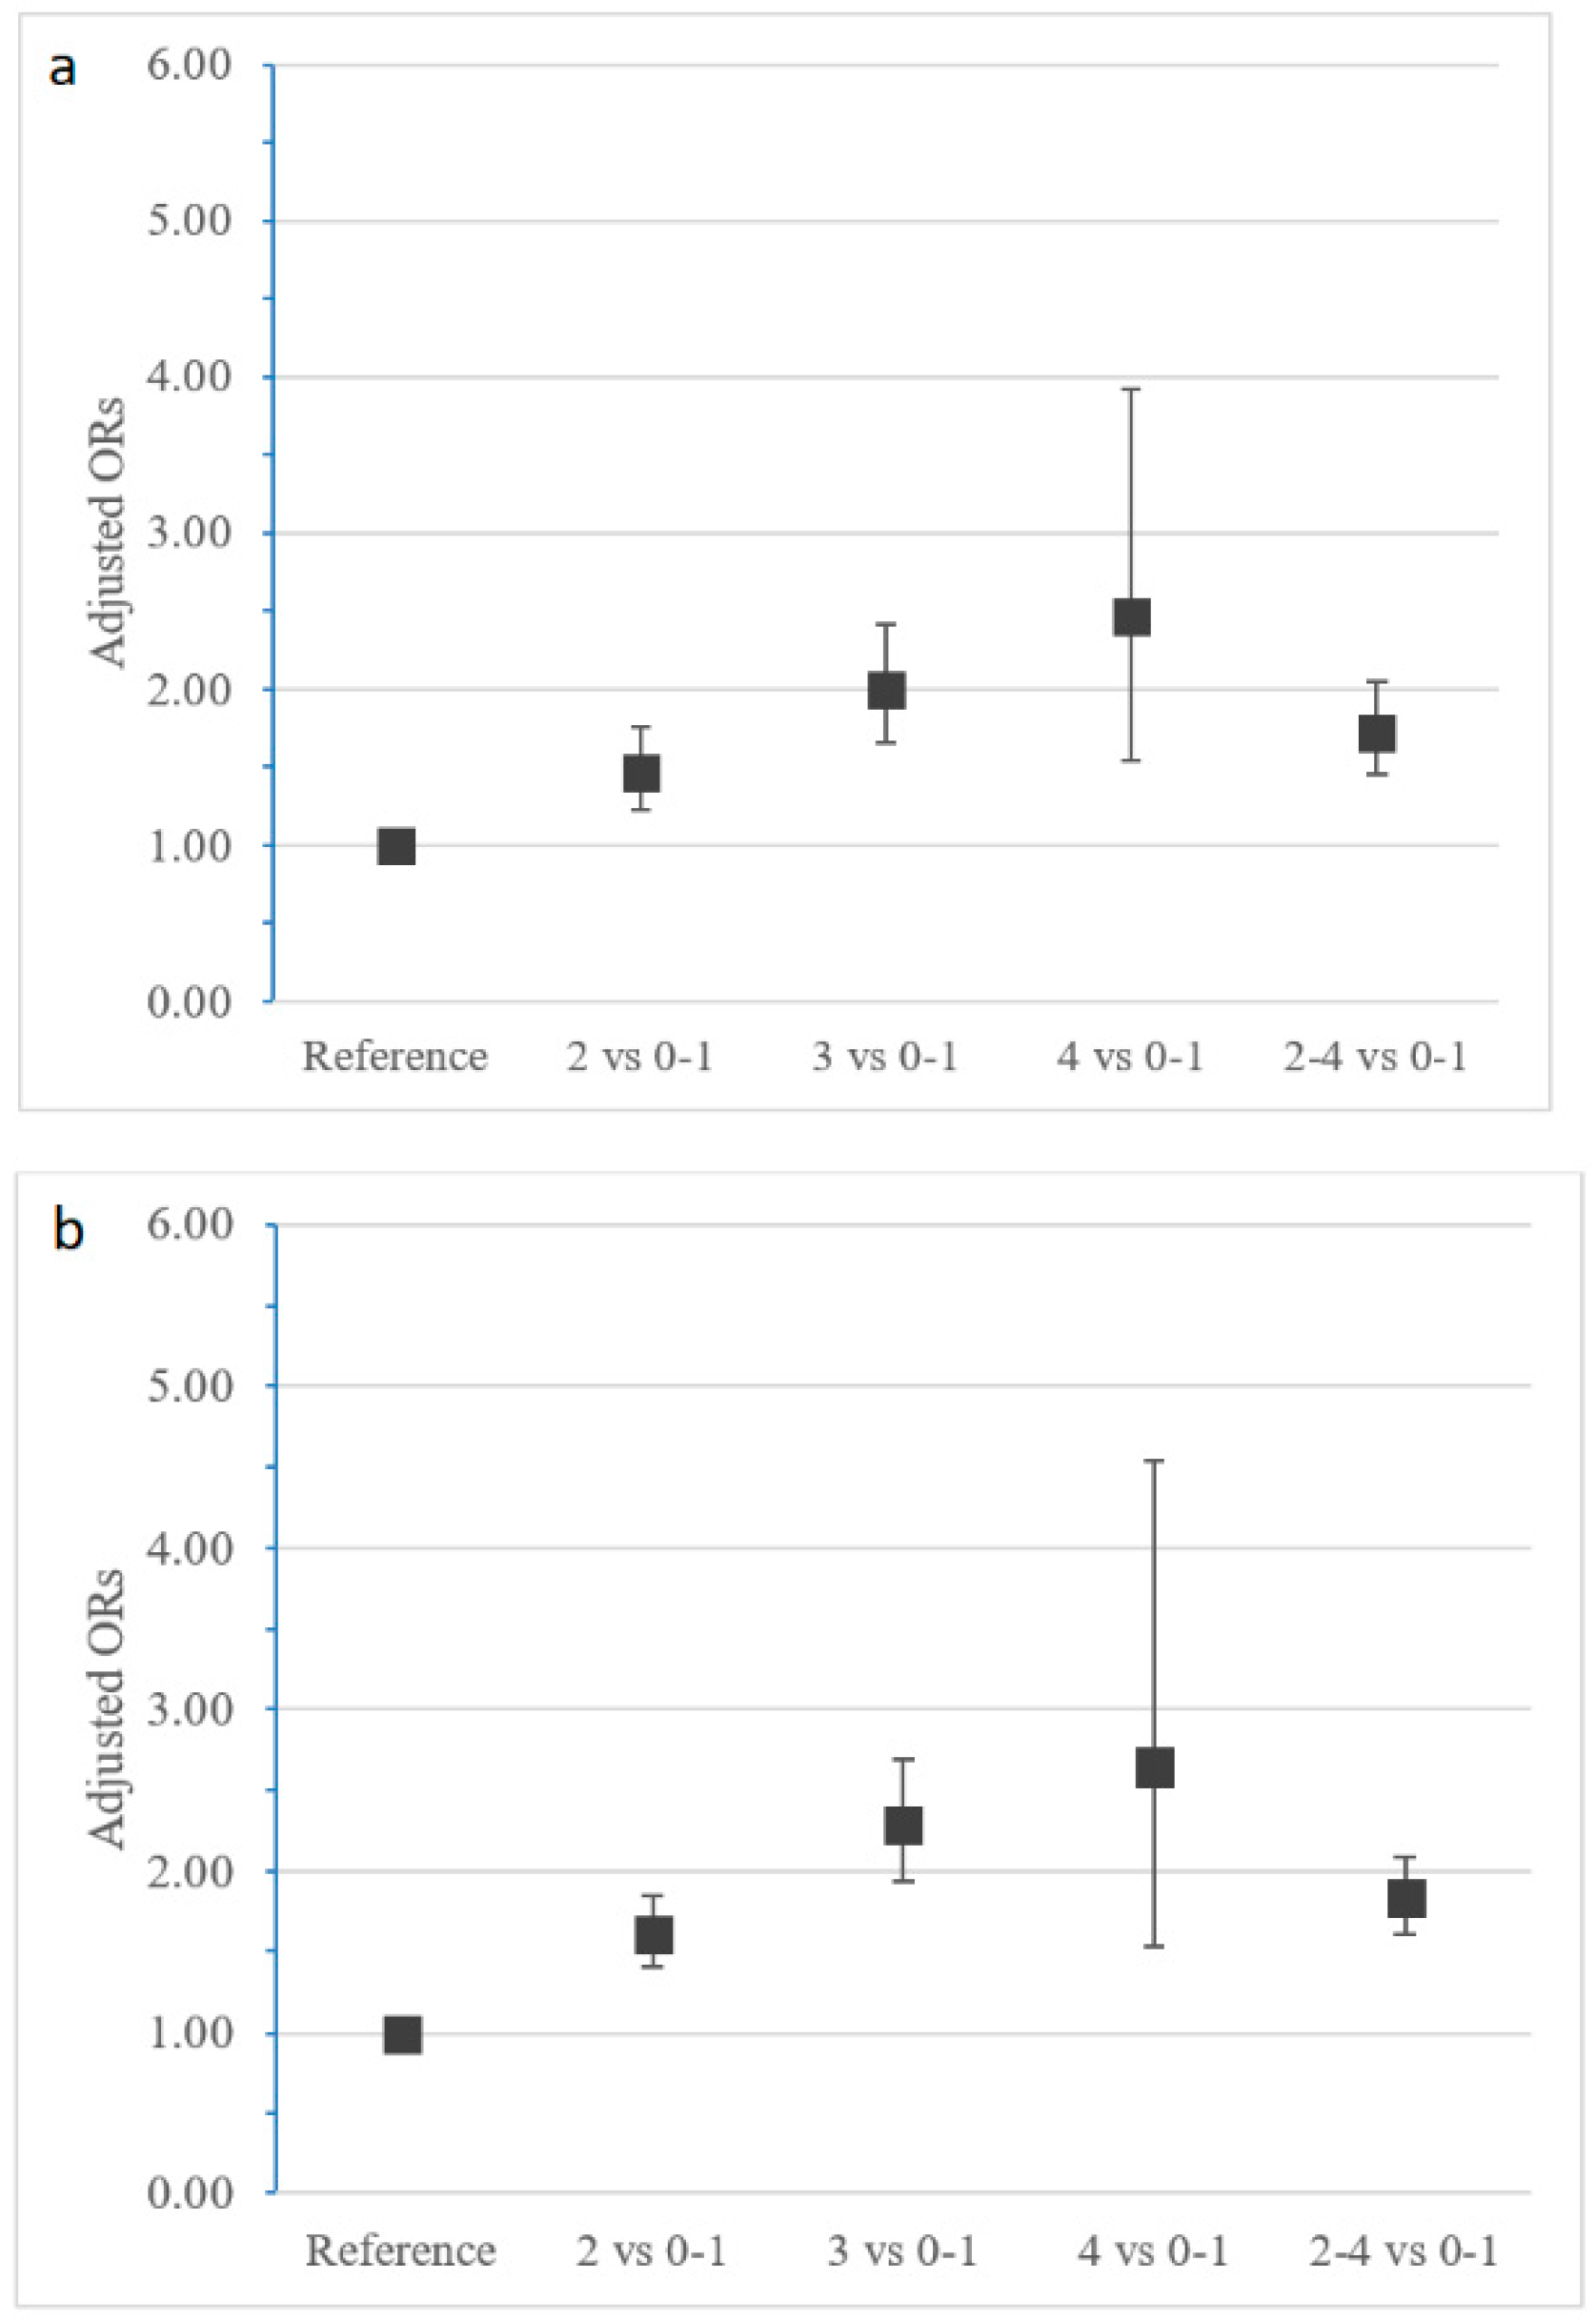
| Pooled Effect | 1.46 (1.22–1.76) | 2.00 (1.65–2.42) | 2.46 (1.54–3.92) | 1.72 (1.45–2.05) |
| I2; p-value | 16.0%; 0.313 | 53.0%; 0.074 | 0.0%; 0.509 | 31.5%; 0.211 |
| Survival * | ||||
| Adjusted OR † (95% CI) | ||||
| Cuba | 1.57 (1.24–2.00) | 2.17 (1.66–2.85) | 3.53 (1.21–10.28) | 1.80 (1.44–2.24) |
| Dominican Republic | 1.45 (1.13–1.88) | 1.71 (1.22–2.40) | 1.80 (0.48–6.72) | 1.53 (1.21–1.93) |
| Mexico | 1.79 (1.24–2.60) | 2.19 (1.42–3.36) | 2.13 (0.79–5.68) | 1.94 (1.37–2.75) |
| Peru | 1.52 (0.90–2.55) | 2.91 (1.66–5.12) | 1.80 (0.26–12.22) | 2.02 (1.22–3.34) |
| Puerto Rico | 1.84 (1.33–2.54) | 3.44 (2.34–5.05) | 4.11 (1.18–14.28) | 2.35 (1.73–3.18) |
| Pooled Effect | 1.60 (1.40–1.84) | 2.29 (1.94–2.69) | 2.64 (1.53–4.54) | 1.83 (1.61–2.08) |
| I2; p-value | 0.0%; 0.790 | 50.3%; 0.090 | 0.0%; 0.840 | 22.0%; 0.274 |
© 2018 by the authors. Licensee MDPI, Basel, Switzerland. This article is an open access article distributed under the terms and conditions of the Creative Commons Attribution (CC BY) license (http://creativecommons.org/licenses/by/4.0/).
Share and Cite
Daskalopoulou, C.; Koukounari, A.; Ayuso-Mateos, J.L.; Prince, M.; Prina, A.M. Associations of Lifestyle Behaviour and Healthy Ageing in Five Latin American and the Caribbean Countries—A 10/66 Population-Based Cohort Study. Nutrients 2018, 10, 1593. https://doi.org/10.3390/nu10111593
Daskalopoulou C, Koukounari A, Ayuso-Mateos JL, Prince M, Prina AM. Associations of Lifestyle Behaviour and Healthy Ageing in Five Latin American and the Caribbean Countries—A 10/66 Population-Based Cohort Study. Nutrients. 2018; 10(11):1593. https://doi.org/10.3390/nu10111593
Chicago/Turabian StyleDaskalopoulou, Christina, Artemis Koukounari, José Luis Ayuso-Mateos, Martin Prince, and A. Matthew Prina. 2018. "Associations of Lifestyle Behaviour and Healthy Ageing in Five Latin American and the Caribbean Countries—A 10/66 Population-Based Cohort Study" Nutrients 10, no. 11: 1593. https://doi.org/10.3390/nu10111593